WEBIST 2014 - Description
438
-
Upload
khangminh22 -
Category
Documents
-
view
0 -
download
0
Transcript of WEBIST 2014 - Description


WEBIST 2014Proceedings of the
10th International Conference onWeb Information Systems and Technologies
Volume 2
Barcelona, Spain
3 - 5 April, 2014
Sponsored byINSTICC – Institute for Systems and Technologies of Information, Control
and Communication
Technically Sponsored byERCIS – European Research Center for Information Systems

Copyright © 2014 SCITEPRESS – Science and Technology PublicationsAll rights reserved
Edited by Valérie Monfort and Karl-Heinz Krempels
Printed in Portugal
ISBN: 978-989-758-024-6
Depósito Legal: 372333/14
http://www.webist.org
BRIEF CONTENTS
INVITED SPEAKERS . . . . . . . . . . . . . . . . . . . . . . . . . . . . . . . . . . . . . . . . . . . . . . . . . . . . . . . . . . . . . . . . . IV
SPECIAL SESSION CHAIR . . . . . . . . . . . . . . . . . . . . . . . . . . . . . . . . . . . . . . . . . . . . . . . . . . . . . . . . . . . . IV
ORGANIZING AND STEERING COMMITTEES . . . . . . . . . . . . . . . . . . . . . . . . . . . . . . . . . . . . . . . . . . . V
PROGRAM COMMITTEE . . . . . . . . . . . . . . . . . . . . . . . . . . . . . . . . . . . . . . . . . . . . . . . . . . . . . . . . . . . . . . VI
AUXILIARY REVIEWERS . . . . . . . . . . . . . . . . . . . . . . . . . . . . . . . . . . . . . . . . . . . . . . . . . . . . . . . . . . . . . . X
SPECIAL SESSION PROGRAM COMMITTEE . . . . . . . . . . . . . . . . . . . . . . . . . . . . . . . . . . . . . . . . . . . . . X
SELECTED PAPERS BOOK . . . . . . . . . . . . . . . . . . . . . . . . . . . . . . . . . . . . . . . . . . . . . . . . . . . . . . . . . . . . . X
FOREWORD . . . . . . . . . . . . . . . . . . . . . . . . . . . . . . . . . . . . . . . . . . . . . . . . . . . . . . . . . . . . . . . . . . . . . . . . XIII
CONTENTS . . . . . . . . . . . . . . . . . . . . . . . . . . . . . . . . . . . . . . . . . . . . . . . . . . . . . . . . . . . . . . . . . . . . . . . . . XV
III

INVITED SPEAKERS
Steven Willmott
3scale
Spain
Fabien Gandon
INRIA
France
Andreas Pfeiffer
Hubject GmbH - joint venture of BMW Group, Bosch, Daimler, EnBW, RWE & Siemens
Germany
Zakaria Maamar
Zayed University
U.A.E.
SPECIAL SESSION CHAIR
SPECIAL SESSION ON BUSINESS APPS
Tim A. Majchrzak, University of Münster, Germany
IV

ORGANIZING AND STEERING COMMITTEES
CONFERENCE CHAIR
Valérie Monfort, Université de Paris1 Panthéon Sorbonne, France
PROGRAM CHAIR
Karl-Heinz Krempels, RWTH Aachen University, Germany
PROCEEDINGS PRODUCTION
Marina Carvalho, INSTICC, Portugal
Helder Coelhas, INSTICC, Portugal
Bruno Encarnação, INSTICC, Portugal
Ana Guerreiro, INSTICC, Portugal
Andreia Moita, INSTICC, Portugal
Raquel Pedrosa, INSTICC, Portugal
Vitor Pedrosa, INSTICC, Portugal
Cláudia Pinto, INSTICC, Portugal
Sara Santiago, INSTICC, Portugal
Fábio Santos, INSTICC, Portugal
José Varela, INSTICC, Portugal
CD-ROM PRODUCTION
Pedro Varela, INSTICC, Portugal
GRAPHICS PRODUCTION AND WEBDESIGNER
André Lista, INSTICC, Portugal
Mara Silva, INSTICC, Portugal
SECRETARIAT
Carla Mota, INSTICC, Portugal
WEBMASTER
Susana Ribeiro, INSTICC, Portugal
V

PROGRAM COMMITTEE
Jose Luis Herrero Agustin, University ofExtremadura, Spain
Mugurel Ionut Andreica , Polytechnic Universityof Bucharest, Romania
Guglielmo de Angelis, CNR - IASI, Italy
Margherita Antona , Foundation for Research andTechnology - Hellas (FORTH), Greece
Valeria De Antonellis, University of Brescia, Italy
Liliana Ardissono, Universita’ Di Torino, Italy
Giuliano Armano , University of Cagliari, Italy
Ismailcem Budak Arpinar , University of Georgia,U.S.A.
Elarbi Badidi , United Arab Emirates University,U.A.E.
Andrea Ballatore, University College Dublin,Ireland
David Bell, Brunel University, U.K.
Orlando Belo, University of Minho, Portugal
Werner Beuschel, CRADL Lab, Germany
Christoph Bussler, VoxeoLabs, Inc., U.S.A.
Maria Claudia Buzzi , CNR, Italy
Elena Calude, Massey University, Institute ofNatural and Mathematical Sciences, New Zealand
Pasquina Campanella, University of Bari "AldoMoro", Italy
Cinzia Cappiello, Politecnico di Milano, Italy
Sven Casteleyn, Universitat Jaume I, Spain
Federica Cena, University of Torino, Italy
Weiqin Chen, University of Bergen, Norway
Dickson Chiu, Dickson Computer Systems, HongKong
Chin-Wan Chung, Korea Advanced Institute ofScience and Technology (KAIST), Korea, Republicof
Christophe Claramunt, Naval Academy ResearchInstitute, France
Mihaela Cocea, University of Portsmouth, U.K.
Martine De Cock, Ghent University, Belgium
Christine Collet, Grenoble Institute of Technology,France
Marco Comuzzi, City University London, U.K.
Isabelle Comyn-Wattiau, Cnam & Essec, France
Anna Corazza, University of Naples "Federico II",Italy
Daniel Cunliffe, University of South Wales, U.K.
Florian Daniel, University of Trento, Italy
Mats Daniels, Uppsala University, Sweden
Mark M. Davydov , Independent Consultant,U.S.A.
Steven Demurjian, University of Connecticut,U.S.A.
Enrico Denti, Alma Mater Studiorum - Universitàdi Bologna, Italy
Stefan Dessloch, Kaiserslautern University ofTechnology, Germany
Oscar Díaz, University of Basque Country, Spain
Josep Domingo-Ferrer, Universitat Rovira iVirgili, Spain
Atilla Elci , Aksaray University, Turkey
Vadim Ermolayev, Zaporozhye NationalUniversity, Ukraine
Larbi Esmahi , Athabasca University, Canada
Davide Eynard, University of Lugano, Switzerland
Alexander Felfernig, Technische Universität Graz,Austria
Anna Fensel, STI Innsbruck, University ofInnsbruck, Austria
Miriam Fernandez, The Open University, U.K.
Joao Carlos Amaro Ferreira, ISEL, Portugal
Josep-Lluis Ferrer-Gomila, Balearic IslandsUniversity, Spain
Karla Donato Fook, IFMA - Instituto Federalde Educação Ciência e Tecnologia do Maranhão,Brazil
Geoffrey Charles Fox, Indiana University, U.S.A.
VI

PROGRAM COMMITTEE (CONT.)
Pasi Fränti, Speech and Image Processing Unit,University of Eastern Finland, Finland
Britta Fuchs, FH Aachen, Germany
Giovanni Fulantelli , Italian National ResearchCouncil, Italy
Ombretta Gaggi, Università di Padova, Italy
John Garofalakis, University of Patras, Greece
Panagiotis Germanakos, University of Cyprus,Cyprus
Massimiliano Giacomin, Università degli Studi diBrescia, Italy
José Antonio Gil, Universitat Politècnica deValència, Spain
Anna Goy, University of Torino, Italy
Thomas Greene, M.I.T., U.S.A.
Ratvinder Grewal, Laurentian University, Canada
Begoña Gros, University of Barcelona, Spain
William Grosky , University of Michigan -Dearborn, U.S.A.
Angela Guercio, Kent State University, U.S.A.
Francesco Guerra, University of Modena andReggio Emilia, Italy
Miguel Guinalíu , Universidad de Zaragoza, Spain
Shanmugasundaram Hariharan, TRPEngineering College, India
Ioannis Hatzilygeroudis, University of Patras,Greece
Stylianos Hatzipanagos, King’s College London,U.K.
A. Henten, Aalborg University, Denmark
Emilio Insfran , Universitat Politècnica deValència, Spain
Ivan Ivanov, SUNY Empire State College, U.S.A.
Kai Jakobs, RWTH Aachen University, Germany
Dietmar Jannach, Technical University ofDortmund, Germany
Monique Janneck, Luebeck University of AppliedSciences, Germany
Ivan Jelinek, Czech Technical University inPrague, Czech Republic
Yuh-Jzer Joung, National Taiwan University,Taiwan
Carlos Juiz, Universitat de les Illes Balears, Spain
Katerina Kabassi, Tei of the Ionian Islands, Greece
Georgia Kapitsaki, University of Cyprus, Cyprus
George Karabatis, Umbc, U.S.A.
Sokratis Katsikas, University of Piraeus, Greece
Natalya Keberle, Zaporozhye National University,Ukraine
Matthias Klusch, Deutsches Forschungszentrumfür Künstliche Intelligenz, Germany
In-Young Ko , Korea Advanced Institute of Scienceand Technology, Korea, Republic of
Waldemar W. Koczkodaj, Laurentian University,Canada
Hiroshi Koide , Kyushu Institute of Technology,Japan
Fotis Kokkoras, TEI of Thessaly, Greece
Agnes Koschmider, KIT - U, Germany
Karl-Heinz Krempels , RWTH Aachen University,Germany
Tsvi Kuflik , The University of Haifa, Israel
Peep Kungas, University of Tartu, Estonia
Daniel Lemire, TELUQ, Canada
Stefania Leone, ETH Zürich, U.S.A.
Kin Fun Li , University of Victoria, Canada
Weigang Li, University of Brasilia, Brazil
Xitong Li , MIT Sloan School of Management,U.S.A.
Dongxi Liu , CSIRO, Australia
Xiaozhong Liu, Indiana University, U.S.A.
Xumin Liu , Rochester Institute of Technology,U.S.A.
Ying Liu , Cardiff University, U.K.
VII

PROGRAM COMMITTEE (CONT.)
Leszek Maciaszek, Wroclaw University ofEconomics, Poland and Macquarie University,Sydney, Australia
Cristiano Maciel, Universidade Federal de MatoGrosso, Brazil
Michael Mackay, Liverpool John MooresUniversity, U.K.
Tim A. Majchrzak , University of Münster,Germany
Dwight Makaroff , University of Saskatchewan,Canada
Massimo Marchiori , University of Padua, Italy
Kazutaka Maruyama, Meisei University, Japan
Michael Melliar-Smith , University of California,U.S.A.
Tarek Melliti , University of Evry, France
Ingo Melzer, Daimler AG, Germany
Emilia Mendes, Blekinge Institute of Technology,Sweden
Panagiotis Metaxas, Wellesley College, U.S.A.
Abdelkrim Meziane, CERIST Alger, Algeria
Tommi Mikkonen , Institute of Software Systems,Tampere University of Technology, Finland
Valérie Monfort , Université de Paris1 PanthéonSorbonne, France
Louise Moser, University of California, SantaBarbara, U.S.A.
Tomasz Muldner, Acadia University, Canada
Stavros Nikolopoulos, University of Ioannina,Greece
Vit Novacek, Digital Enterprise Research Institute,Nuig, Ireland
Jeff Z. Pan, University of Aberdeen, U.K.
Laura Papaleo, Province of Genova, Italy
Kyparisia Papanikolaou, ASPETE, Greece
Marcin Paprzycki , Polish Academy of Sciences,Poland
Eric Pardede, La Trobe University, Australia
Kalpdrum Passi, Laurentian University, Canada
Viviana Patti , University of Torino, Italy
David Paul, The University of Newcastle, Australia
Toon De Pessemier, Ghent University - iMinds,Belgium
Alfonso Pierantonio, University of L’Aquila, Italy
Luis Ferreira Pires, University of Twente, TheNetherlands
Pierluigi Plebani, Politecnico Di Milano, Italy
Jim Prentzas, Democritus University of Thrace,Greece
Birgit Pröll , Johannes Kepler University Linz,Austria
Dana Al Qudah, University of Warwick, U.K.
Werner Retschitzegger, Johannes KeplerUniversity, Austria
Thomas Risse, L3S Research Center, Germany
Thomas Ritz, FH Aachen, Germany
Davide Rossi, University of Bologna, Italy
Gustavo Rossi, Lifia, Argentina
Davide Di Ruscio, University of L’Aquila, Italy
Maytham Safar, Kuwait University, Kuwait
Aziz Salah, Université du Québec à Montréal,Canada
Yacine Sam, University Tours, France
Comai Sara, Politecnico di Milano, Italy
Anthony Savidis, Institute of Computer Science,FORTH, Greece
Bernhard Schandl, Gnowsis.com, Austria
Claudio Schifanella, Università degli Studi diTorino, Italy
Harald Schöning, Software AG, Germany
Hamida Seba, University Lyon 1, France
Jochen Seitz, Technische Universität Ilmenau,Germany
Marianna Sigala, University of the Aegean, Greece
VIII

PROGRAM COMMITTEE (CONT.)
Marten van Sinderen, University of Twente, TheNetherlands
Richard Soley, Object Management Group, Inc.,U.S.A.
Anna Stavrianou, Xerox Research Centre Europe,France
Nenad Stojanovic, FZI at the University ofKarlsruhe, Germany
Hussein Suleman, University of Cape Town, SouthAfrica
Christoph Terwelp, RWTH Aachen University,Germany
Dirk Thissen, RWTH Aachen University, Germany
Thanassis Tiropanis, University of Southampton,U.K.
Giovanni Toffetti , IBM Research Lab Haifa, Israel
Riccardo Torlone, Università Roma Tre, Italy
Guy Tremblay, Universite du Quebec a Montreal,Canada
Th. Tsiatsos, Department of Informatics, AristotleUniversity of Thessaloniki, Greece
George Tsihrintzis, University of Piraeus, Greece
Athina Vakali , Aristotle University, Greece
Geert Vanderhulst, Alcatel-Lucent Bell Labs,Belgium
Jari Veijalainen , University of Jyvaskyla, Finland
Maria Esther Vidal , Universidad Simon Bolivar,Venezuela
Maria Virvou , University of Piraeus, Greece
Petri Vuorimaa , Aalto University, Finland
Mohd Helmy Abd Wahab, Universiti Tun HusseinOnn Malaysia, Malaysia
Fan Wang, Microsoft, U.S.A.
Jason Whalley, Strathclyde University, U.K.
Bebo White, Stanford University, U.S.A.
Maarten Wijnants , Hasselt University, Belgium
Manuel Wimmer , Technische Universität Wien,Austria
Marco Winckler , University Paul Sabatier(Toulouse 3), France
Viacheslav Wolfengagen, Institute JurInfoR,Russian Federation
Bin Xu , Tsinghua University, China
Guandong Xu, University of Technology Sydney,Australia
Amal Zouaq, Royal Military College of Canada,Canada
IX

AUXILIARY REVIEWERS
Alberto De La Rosa Algarin, University ofConnecticut, U.S.A.
Markus C. Beutel, RWTH Aachen University,Germany
Matteo Ciman, University of Padua, Italy
José Cordeiro, Polytechnic Institute of Setúbal /INSTICC, Portugal
Javier Espinosa, LAFMIA lab, France
Golnoosh Farnadi, Ghent University, TheNetherlands
Sevket Gökay, RWTH Aachen University,Germany
Beatriz Gomez, University of the Balearic Islands,Spain
Nuno Pina Gonçalves, EST-Setúbal / IPS, Portugal
Wolfgang Kluth , RWTH Aachen University,Germany
Fangfang Li, AAi, Australia
José António Sena Pereira, IPS - ESTSetúbal,Portugal
Laura Po, University of Modena and ReggioEmilia, Italy
Michael Rogger, STI, Austria
Christian Samsel, RWTH Aachen University,Germany
Alexander Semenov, University of Jyvaskyla,NRU ITMO, Finland
Xin Wang, University of Southampton, U.K.
Stefan Wueller, RWTH Aachen, Germany
X

SPECIAL SESSION PROGRAM COMMITTEE
SPECIAL SESSION ON BUSINESS APPS
Henning Heitkötter, University of Münster,Germany
Adrian Holzer, Ecole Polytechnique Fédérale deLausanne (EPFL), Switzerland
Tim A. Majchrzak, University of Münster,Germany
Laura Po, University of Modena and ReggioEmilia, Italy
Mohammad Tafiqur Rahman, Royal Institute ofTechnology (KTH), Sweden
Davide Rossi, University of Bologna, Italy
Johannes Schobel, Ulm University, Germany
Virpi Kristiina Tuunainen, Aalto UniversitySchool of Business, Finland
SELECTED PAPERS BOOK
A number of selected papers presented at WEBIST 2014 will be published by Springer-Verlag in a LNBIPSeries book. This selection will be done by the Conference Chair and Program Chair, among the papers actuallypresented at the conference, based on a rigorous review by the WEBIST 2014 Program Committee members.
XI


FOREWORD
This book contains the proceedings of the 10th International Conference on Web Informa-tion Systems and Technologies (WEBIST 2014) which was organized and sponsored by theInstitute for Systems and Technologies of Information, Control and Communication (INS-TICC). The conference was technically sponsored by the European Research Center forInformation System (ERCIS).
The purpose of this Conference was to bring together researchers, engineers and practitionersinterested in technological advances and business applications of web-based informationsystems. WEBIST had five main topic areas, covering different aspects of Web InformationSystems, including “Internet Technology”, “Web Interfaces and Applications”, “Society, e-Business, e-Government”, “Web Intelligence” and “Mobile Information Systems”. We believethe proceedings here published demonstrate new and innovative solutions, and highlighttechnical problems in each field that are challenging and worthwhile.
The conference was also complemented with one special session, namely the Special Sessionon Business Apps - BA 2014 (chaired by Tim A. Majchrzak ).
WEBIST 2014 received 153 paper submissions from 49 countries in all continents. A double-blind review process was enforced, with the help of 214 experts from the internationalprogram committee, all of them with a Ph.D. in one of the main conference topic areas.From these paper submissions only 23 papers were selected to be published and presentedas full papers, i.e. completed work (12 pages in proceedings / 30’ oral presentations) and41 additional papers, describing work-in-progress as short papers for 20’ oral presentation.Furthermore 35 short papers will be also presented as posters. The full-paper acceptanceratio was 15,03%, and the total oral paper acceptance ratio was 41,83%. These ratios denotea high level of quality, which we intend to maintain or reinforce in the next edition of thisconference.
The high quality of the WEBIST 2014 programme is enhanced by four keynote lectures,delivered by experts in their fields, including (alphabetically): Andreas Pfeiffer (HubjectGmbH - joint venture of BMW Group, Bosch, Daimler, EnBW, RWE & Siemens, Germany),Fabien Gandon (INRIA, France), Steven Willmott (3scale, Spain) and Zakaria Maamar(Zayed University, United Arab Emirates).
Besides the proceedings edited by SCITEPRESS, a post-conference book will be compiledwith extended versions of the conference´s best papers, and published by Springer-Verlag.Appropriate indexing has been arranged for the proceedings of WEBIST 2014 includingThomson Reuters Conference Proceedings Citation Index, INSPEC, DBLP, EI and Scopus.Furthermore, all presented papers will be available at the SCITEPRESS digital library.
The best contributions to the conference and the best student submissions were distinguishedwith awards based on the best combined marks of paper reviewing, as assessed by the
XIII

Program Committee, and the quality of the presentation, as assessed by session chairs atthe conference venue.
In conjunction with a set of related conferences, namely SMARTGREENS and CLOSER,WEBIST had a new kind of session, named The European Project Space (EPS). The EPSaimed to provide insights into the research projects that are currently going on in Europewithin the fields of web-based information systems, Cloud Computing and Smart Gridsand Green IT Systems. This initiative intended to facilitate opportunities for knowledgeand technology sharing, and establish the basis for future collaboration networks involvingcurrent project partners and interested conference delegates.
Building an interesting and successful program for the conference required the dedicatedeffort of many people. Firstly, we must thank the authors, whose research and developmentefforts are recorded here. Secondly, we thank the members of the program committee andadditional reviewers for their diligence and expert reviewing. We also wish to include herea word of appreciation for the excellent organization provided by the conference secretariat,from INSTICC, which has smoothly and efficiently prepared the most appropriate environ-ment for a productive meeting and scientific networking. Last but not least, we thank theinvited speakers for their invaluable contribution and for taking the time to synthesize anddeliver their talks.
Valérie MonfortUniversité de Paris1 Panthéon Sorbonne, France
Karl-Heinz KrempelsRWTH Aachen University, Germany
XIV

CONTENTS
INVITED SPEAKERS
KEYNOTE SPEAKERS
Software is Eating the World, APIs are Eating Software
Steven WillmottIS-5
Typed Graphs and Linked Data - Modelling and Analyzing Social-semantic Web Data
Fabien GandonIS-7
Accelerating the Electric Mobility Market Through New Services and an Efficient Market Mode
Andreas PfeifferIS-11
Enterprise 2.0 - Research Challenges and Opportunities
Zakaria MaamarIS-13
WEB INTERFACES AND APPLICATIONS
FULL PAPERS
The One Hand Wonder - A Framework for Enhancing One-handed Website Operation on
Touchscreen Smartphones
Karsten Seipp and Kate Devlin5
Contextinator - Project-based Management of Personal Information on the Web
Ankit Ahuja, Ben Hanrahan and Manuel A. Pérez-Quiñones14
SHORT PAPERS
SafeMash - A Platform for Safety Mashup Composition
Carlo Marcelo Revoredo da Silva, Ricardo Batista Rodrigues, Rafael Roque de Souza andVinicius Cardoso Garcia
27
GeoSPARQL Query Tool - A Geospatial Semantic Web Visual Query Tool
Ralph Grove, James Wilson, Dave Kolas and Nancy Wiegand33
SIWAM: Using Social Data to Semantically Assess the Difficulties in Mountain Activities
Javier Rincón Borobia, Carlos Bobed, Angel Luis Garrido andEduardo Mena41
Using Healthcare Planning Features to Drive Scientific Workflows on the Web
Bruno S. C. M. Vilar, André Santanchè and Claudia Bauzer Medeiros49
Linked Data Strategy to Achieve Interoperability in Higher Education
Guillermo García Juanes, Alioth Rodríguez Barrios, José Luis Roda García, Laura Gutiérrez Medina,Rita Díaz Adán and Pedro González Yanes
57
Interdependent Components for the Development of Accessible XUL Applications for Screen
Reader Users
Xabier Valencia, Myriam Arrue, Halena Rojas-Valduciel andLourdes Moreno65
Hypermodal - Dynamic Media Synchronization and Coordination between WebRTC Browsers
Li Li, Wen Chen, Zhe Wang and Wu Chou74
XV

Integrating Adaptation and HCI Concepts to Support Usability in User Interfaces - A Rule-based
Approach
Luisa Fernanda Barrera, Angela Carrillo-Ramos, Leonardo Florez-Valencia, Jaime Pavlich-Mariscal andNadia Alejandra Mejia-Molina
82
Tactive, a Framework for Cross Platform Development of Tabletop Applications
Ombretta Gaggi and Marco Regazzo91
On Metrics for Measuring Fragmentation of Federation over SPARQL Endpoints
Nur Aini Rakhmawati, Marcel Karnstedt, Michael Hausenblasand Stefan Decker99
Development Process and Evaluation Methods for Adaptive Hypermedia
Martin Balík and Ivan Jelínek107
CAPTCHA and Accessibility - Is This the Best We Can Do?
Lourdes Moreno, María González and Paloma Martínez115
Fuzzy-Ontology-Enrichment-based Framework for Semantic Search
Hajer Baazaoui-Zghal and Henda Ben Ghezala123
A Semantic-based Data Service for Oil and Gas Engineering
Lina Jia, Changjun Hu, Yang Li, Xin Liu, Xin Cheng, Jianjun Zhang and Junfeng Shi131
Cloud Space - Web-based Smart Space with Management UI
Anna-Liisa Mattila, Kari Systä, Jari-Pekka Voutilainen and Tommi Mikkonen137
Sequential Model of User Browsing on Websites - Three Activities Defined: Scanning, Interaction
and Reading
Aneta Bartuskova and Ondrej Krejcar143
Automated Usability Testing for Mobile Applications
Wolfgang Kluth, Karl-Heinz Krempels and Christian Samsel149
WEB INTELLIGENCE
FULL PAPERS
The GENIE Project - A Semantic Pipeline for Automatic Document Categorisation
Angel L. Garrido, Maria G. Buey, Sandra Escudero, Alvaro Peiro, Sergio Ilarri and Eduardo Mena161
Comparing Topic Models for a Movie Recommendation System
Sonia Bergamaschi, Laura Po and Serena Sorrentino172
Product Feature Taxonomy Learning based on User Reviews
Nan Tian, Yue Xu, Yuefeng Li, Ahmad Abdel-Hafez and Audun Josang184
Automatic Web Page Classification Using Visual Content
António Videira and Nuno Goncalves193
User Semantic Model for Dependent Attributes to Enhance Collaborative Filtering
Sonia Ben Ticha, Azim Roussanaly, Anne Boyer and Khaled Bsaïes205
SHORT PAPERS
Extracting Multi-item Sequential Patterns by Wap-tree Based Approach
Kezban Dilek Onal and Pinar Karagoz215
XVI
Improving Opinion-based Entity Ranking
Christos Makris and Panagiotis Panagopoulos223
Handling Weighted Sequences Employing Inverted Files and Suffix Trees
Klev Diamanti, Andreas Kanavos, Christos Makris and Thodoris Tokis231
XML Approximate Semantic Query based on Ontology
Yunkai Zhu, Chunhong Zhang and Yang Ji239
Finding Domain Experts in Microblogs
Shao Xianlei, Zhang Chunhong and Ji Yang247
Comparison between LSA-LDA-Lexical Chains
Costin Chiru, Traian Rebedea and Silvia Ciotec255
Prediction of Human Personality Traits From Annotation Activities
Nizar Omheni, Omar Mazhoud, Anis Kalboussi and Ahmed HadjKacem263
Towards Automatic Building of Learning Pathways
Patrick Siehndel, Ricardo Kawase, Bernardo Pereira Nunes and Eelco Herder270
A Survey on Challenges and Methods in News Recommendation
Özlem Özgöbek, Jon Atle Gulla and R. Cenk Erdur278
Combining Learning-to-Rank with Clustering
Efstathios Lempesis and Christos Makris286
Automated Identification of Web Queries using Search Type Patterns
Alaa Mohasseb, Maged El-Sayed and Khaled Mahar295
A Domain Independent Double Layered Approach to Keyphrase Generation
Dario De Nart and Carlo Tasso305
A Methodology to Measure the Semantic Similarity between Words based on the Formal Concept
Analysis
Yewon Jeong, Yiyeon Yoon, Dongkyu Jeon, Youngsang Cho and Wooju Kim313
A Recommendation System for Specifying and Achieving S.M.A.R.T. Goals
Romain Bardiau, Magali Seguran, Aline Senart and Ana Maria Tuta Osman322
An Self-configuration Architecture for Web-API of Internet of Things
Eric Bernardes Chagas Barros and Admilson de Ribamar L. Ribeiro328
A Comparison of Three Pre-processing Methods for Improving Main Content Extraction from
Hyperlink Rich Web Documents
Moheb Ghorbani, Hadi Mohammadzadeh and Abdolreza Nazemi335
Detection of Semantic Relationships between Terms with a New Statistical Method
Nesrine Ksentini, Mohamed Tmar and Faïez Gargouri340
An Approach to Detect Polarity Variation Rules for Sentiment Analysis
Pierluca Sangiorgi, Agnese Augello and Giovanni Pilato344
A General Evaluation Framework for Adaptive Focused Crawlers
Fabio Gasparetti, Alessandro Micarelli and Giuseppe Sansonetti350
A Domotic Ecosystem Driven by a Networked Intelligence
Luca Ferrari, Matteo Gioia, Gian Luca Galliani and Bruno Apolloni359
XVII

SPECIAL SESSION ON BUSINESS APPS
FULL PAPERS
Towards Process-driven Mobile Data Collection Applications - Requirements, Challenges, Lessons
Learned
Johannes Schobel, Marc Schickler, Rüdiger Pryss, Fabian Maier and Manfred Reichert371
Location-based Mobile Augmented Reality Applications - Challenges, Examples, Lessons Learned
Philip Geiger, Marc Schickler, Rüdiger Pryss, Johannes Schobel and Manfred Reichert383
SHORT PAPER
Alternative Communication System for Emergency Situations
I. Santos-González, A. Rivero-García, P. Caballero-Gil and C. Hernández-Goya397
AUTHOR INDEX 403
XVIII

INVITED SPEAKERS


KEYNOTE SPEAKERS


Software is Eating the World, APIs are Eating Software
Steven Willmott 3scale, Spain
Abstract: Software is becoming increasingly critical in many industries - from optimizing processes and information sharing, to powerful data analysis and embedded controllers. At the same time however, this software is becoming ever more componentzied and inter-connected. Using core web technologies such as HTTP, XML, JSON and others, Web APIs are becoming the glue that weaves together these multiplying software components. This talk covers how software can often dramatic and change the fortunes of companies in a sector as well as how APIs and related Web Information technologies are part of this big transition.
BRIEF BIOGRAPHY
Steven was previously the research director of one of the leading European research groups in Europe on distributed systems and Artificial Intelligence at the Universitat Politècnica de Catalunya in Barcelona, Spain. He brings 10 years of technical experience in Web Services, Semantic Web, network technology and the management of large-scale international R&D teams.
IS-5

Typed Graphs and Linked Data Modelling and Analyzing Social-semantic Web Data
Fabien Gandon INRIA, Univ. Nice Sophia Antipolis, CNRS, I3s, UMR 7271, 06900 Sophia Antipolis, France
Keywords: Semantic Web, Social Web, Typed Graphs, Knowledge Representation, Ontologies.
Abstract: This extended abstract summarizes the subject of an invited talk at WebIST 2014 that introduces methods, models and algorithms studied by the Wimmics research lab to bridge formal semantics and social semantics on the Web.
1 HYBRID WEB COMMUNITIES
The Web is now a virtual place where users and software interact in hybrid communities. These large scale interactions create many problems in particular the one of reconciling formal semantics of computer science (e.g. logics, ontologies, typing systems, etc.) on which the Web architecture is built, with soft semantics of people (e.g. posts, tags, status, etc.) on which the Web content is built.
The Wimmics research lab studies methods, models and algorithms to bridge formal semantics and social semantics on the Web. The name of the lab stands for “web-instrumented man-machine interactions, communities, and semantics” and we address this problem focusing on the characterization of typed graphs formalisms to model and capture these different pieces of knowledge and hybrid operators to process them jointly.
The approaches we introduce rely on graph-oriented knowledge representation, reasoning and operationalization to model and support actors, actions and interactions in web-based epistemic communities. The research results are applied to support and foster interactions in online communities and manage their resources.
This extended abstract introduces: the need to combine different kinds of graph-based representations (section 2), the importance of having a multidisciplinary approach (section 3); and the interest of relying on typed-graph knowledge representations. The last section provides a number of references.
2 FORMAL-SOCIAL SEMANTICS
The initial graph of linked pages of the Web has been joined by a growing number of other graphs: social networks, workflows, navigation trails, automatas of distributed services, linked open data clouds, etc. And these graphs interact in all sorts of ways influencing the life-cycle of each other.
Not only do we need means to represent and analyse each kind of graphs, we also need the means to combine them and to perform multi-criteria analysis on their combination.
We propose to address this problem by focusing on the characterization of (a) typed graphs formalisms to model and capture these different pieces of knowledge with their links and (b) hybrid operators to process them jointly. We especially consider the problems that occur in such structures when we blend formal stable semantic models and socially emergent and evolving semantics.
3 MULTIDISCIPLINARY MODEL
Our research follows two main directions combining two complementary types of contributions: First research direction: to propose
multidisciplinary approach to analyse and model the many aspects of these intertwined information systems, their communities of users and their interactions;
Second research direction: to propose formalizations of the previous models and reasoning algorithms on these models
IS-7
providing new analysis tools and indicators, and supporting new functionalities and better management.
In a nutshell, the first research direction looks at models of systems, users, communities and interactions while the second research direction considers formalisms and algorithms to represent them and reason on their representations.
In the short term we intend to survey, extend, formalize and provide reasoning means over models representing systems, resources, users and social links in the context of social semantic web applications.
In the longer term we intend to extend these models (e.g. dynamic aspects), unify their formalisms (dynamic typed graphs) and propose mixed operations (e.g. metrical and logical reasoning) and algorithms to scale them (e.g. random walks) to support the analysis of epistemic communities’ structures, resources and dynamics.
Ultimately our goal is to provide better collective applications on the web of data and the semantic web with two sides to the problem: (1) improve access and use of the linked data for epistemic communities and at the same time (2) use typed graph formalisms to represent the web resources, users and communities and reason on them to support their management.
4 TYPED GRAPHS
The work presented in this invited talk reports on models and algorithms to bridge formal semantics and social semantics by formalizing and reasoning heterogeneous semantic graphs.
The models we design include: users, their profiles, their requirements, their activities and their contexts; social links, social structures, social exchanges and processes; conceptual models including ontologies, thesauri, and folksonomies. Whenever possible these models are formalized and published according to standardized web formalisms and may motivate research and suggestions on extending these standards. The main goal here is to improve the understanding the systems have of the communities, resources and activities of their users. We focus on formalizing the models as unified typed graphs in order for software to exploit them jointly in their processing while still being able to use the specificities of each one of them. The schemas and datasets are published as linked data following the web architecture principles and W3C standards.
The algorithms we designed include: typed graphs indexing, reasoning and searching; hybrid processing merging logical inferences, rules and metrical inferences; approximation and propagation algorithms; distributed querying and reasoning. We propose algorithms (in particular graph-based reasoning) and approaches (in particular knowledge-based approaches) to process the mixed representations we obtain. We are especially interested in allowing cross-enrichment between them and in exploiting the life cycle and specificities of each one to foster the life-cycles of the others. These algorithms are published, implemented and distributed as part of a generic open source platform and library called Corese/KGram.
REFERENCES
Wimmics web site, 2014, http://wimmics.inria.fr/ Marie, N., Ribiere, M., Gandon, F., Rodio, F., 2013.
Discovery Hub: on-the-fly linked data exploratory search, I-Semantics.
Villata, S., Costabello, L., Gandon, F., Faron-Zucker, C., Buffa, M., 2013, Social Semantic Network-based Access Control, Security and Privacy Preserving in Social Networks, Lecture Notes in Social Networks, Springer
Cojan, J., Cabrio, E., Gandon, F., 2013. Filling the Gaps Among DBpedia Multilingual Chapters for Question Answering, ACM Web Science Conference
Buffa, M., Ereteo, G., Limpens, F., Gandon, F., 2013. Folksonomies and Social Network Analysis in a social Semantic Web, 39th International Conf. on Current Trends in Theory and Practice of Computer Science.
Corby, O., Gaignard, A., Faron-Zucker, C., Montagnat, J., 2012. KGRAM Versatile Data Graphs Querying and Inference Engine, Proc. IEEE/WIC/ACM International Conference on Web Intelligence
Corby, O., Faron-Zucker, C., 2010. The KGRAM Abstract Machine for Knowledge Graph Querying, IEEE/WIC/ACM International Conference.
Erétéo, G., Buffa, M., Gandon, F., Corby, O., 2009. Analysis of a Real Online Social Network using Semantic Web Frameworks. International Semantic Web Conference, ISWC'09.
Monnin, A., Limpens, F., Gandon, F., Laniado, D., 2010. Speech acts meets tagging: NiceTag ontology, AIS SigPrag International Pragmatic Web Conference Track, I-Semantics.
Basse, A., Gandon, F., Mirbel, I., Lo, M., 2010. Frequent Graph Pattern to Advertise the Content of RDF Triple Stores on the Web, Web Science Conference
WEBIST�2014�-�International�Conference�on�Web�Information�Systems�and�Technologies
IS-8

BRIEF BIOGRAPHY
Fabien Gandon is Senior Research Scientist and HDR in Informatics and Computer Science at INRIA and he is the Leader of the Wimmics team at the Sophia-Antipolis Research Center. He is also a member of the World-Wide Web Consortium (W3C) where he participates in several standardization groups. His professional interests include: Web, Semantic Web, Social Web, Ontologies, Knowledge Engineering and Modelling, Mobility, Privacy, Context-Awareness, Semantic Social Network/ Semantic Analysis of Social Network, Intraweb. He previously worked for the Mobile Commerce Laboratory of Carnegie Mellon in Pittsburgh.
Typed�Graphs�and�Linked�Data�-�Modelling�and�Analyzing�Social-semantic�Web�Data
IS-9


Accelerating the Electric Mobility Market Through New Services and an Efficient Market Mode
Andreas Pfeiffer Hubject GmbH - joint venture of BMW Group, Bosch, Daimler, EnBW, RWE & Siemens, Germany
Abstract: How to connect different providers of electric mobility services and ensure an efficient design? An eRoaming platform as well as the contractual and technical framework required to implement this concept throughout Europe have already been developed by the Berlin-based joint venture Hubject. In addition an open interface protocol, the “Open InterCharge Protocol” (OICP), has been defined and can be accessed online by market participants for free since March 2013. Hubject GmbH is a joint venture formed by the BMW Group, Bosch, Daimler, EnBW, RWE and Siemens based in Berlin. The company was formed in 2012 and operates a cross-industry business and IT platform connecting infrastructure, service and mobility providers throughout Europe.
BRIEF BIOGRAPHY
Andreas Pfeiffer studied Business Administration at the RWTH Aachen University after training to become an information technology consultant. Upon successful completion of the degree, he worked as an organisational developer for an IT service provider. In 2007, he moved to Energieversorgungs- und Verkehrsgesellschaft mbH Aachen (E.V.A.) where he worked as a corporate developer. He managed the topic “electric mobility” for the Energieversorgungs- und Verkehrsgesellschaft mbH Aachen (E.V.A.) from 2008 to 2011 and was Managing Director of smartlab Innovationsgesellschaft mbH in Aachen from 2010 to 2012. Andreas Pfeiffer is Managing Director of Hubject GmbH, a joint venture of BMW Group, Bosch, Daimler, EnBW, RWE and Siemens based in Berlin, since August 2012.
IS-11


Enterprise 2.0 Research Challenges and Opportunities
Zakaria Maamar Zayed University, Dubai, United Arab Emirates
EXTENDED ABSTRACT
Today’s enterprises are caught in the middle of a major financial crisis that is undermining their profit and growth and even jeopardizing their survival. To respond to this crisis, enterprises have launched different initiatives to improve their business processes and align their strategies with market needs, for example. Regular enterprise applications implement structured business processes in which the steps to perform are well defined. While this is beneficial for enterprises, there is little room for creativity in performing such processes without triggering a complex re-thinking process. Usually this process takes time to implement and analyze its effects, which is sometimes late and inefficient due to business constant changes. Several decisions are to be made on the fly and could tap into the large volume of data that Web 2.0 (social) applications (e.g., social networks, blogs, and wikis) generate.
Social applications rely on users’ ability and willingness to interact, share, and recommend. However the richness and complexity of information in these applications pose challenges for enterprises on how to capture and structure this information for future use while preserving user privacy and information sensitivity. The social ”fever” has caught every single activity of people’s daily life ranging from sharing live experiences online to seeking feedback on any matter like what to wear for a special occasion. A report encourages enterprises to allow their employees to embrace social applications in order to establish and foster contacts with their colleagues, customers, and suppliers (B. Peter and R. Reeves. Network Citizens: Power and Responsibility at Work, Demos, 29 October 2008, www.demos.co.uk/publications/networkcitizens). This should impact in a positive way productivity, business development, and collegiality as long as these applications are used in a controlled way.
This presentation offers a research roadmap on the challenges and opportunities that Enterprise 2.0
(aka Social Enterprise) has to deal with and tap into, respectively. Contrary to traditional enterprises with a top-down command flow and bottom-up feedback flow, these flows in Enterprise 2.0 cross all levels and in all directions bringing all people together for the development of creative and innovative products and services. McAfee was the first to introduce the term Enterprise 2.0 as the use of emergent social software platforms within or between companies and their partners or customers (A. P. McAfee, Enterprise 2.0: The Dawn of Emergent Collaboration, MIT Sloan Management Review, 47(3), 2006). Enterprise social software should work hand-in-hand with regular business processes to ensure Enterprise 2.0 success (BLUEKIWI, The State of Social Business 2013: The Maturing of Social Media into Social, Business, blueKiwi report, 2013): ”Enterprise 2.0 only works if it is part of a business process. It’s great to work in new ways, but it’s not enough. To make it real, it has to be very practical”. Enterprise 2.0 should develop techniques and guidelines that would allow weaving social relationships (e.g., collegiality, fairness, and trustworthiness) into their operation. This should lead into a new form of business processes in the enterprise that reinforce the fact that employees establish and maintain social networks of contacts, rely on some privileged contacts when needed, and form with other peers strong and long lasting social collaborative groups. In today’s economies, an enterprise’s ability to sustain its growth and competitiveness depends on how well it manages from a social perspective its communications with stakeholders that are customers, suppliers, competitors, and partners (Y. Badr and Z. Maamar. Can Enterprises Capitalize on Their Social Networks? Cutter IT Journal, Special Issue on Measuring the Success of Social Networks in the Enterprise, 22(10), October 2009).
IS-13

BRIEF BIOGRAPHY
Zakaria Maamar is a Professor and Assistant Dean in the College of Information Technology at Zayed University in Dubai, United Arab Emirates. His research interests are primarily related to service-oriented computing, social computing, and system interoperability. Dr. Maamar graduated for his M.Sc. and Ph.D. in Computer Sciences from Laval University in Canada in 1995 and 1998, respectively. Related Experiences: Organizer of several workshops in the past Quan Z. Sheng, Aikaterini Mitrokotsa, Sherali Zeadally, Zakaria Maamar (Eds.): RFID Technology-Concepts, Applications, Challenges, Proceedings of the 4th International Workshop, IWRT 2010, In conjunction with ICEIS 2010, Funchal, Madeira, Portugal, June 2010. SciTePress 2010, ISBN 978-989-8425-11-9 Soraya Kouadri Mostéfaoui, Zakaria Maamar, George M. Giaglis (Eds.): Ubiquitous Computing, Proceedings of the 3rd International Workshop on Ubiquitous Computing, IWUC 2006, In conjunction with ICEIS 2006, Paphos, Cyprus, May 2006. INSTICC Press 2006, ISBN 978-972-8865-51-1
WEBIST�2014�-�International�Conference�on�Web�Information�Systems�and�Technologies
IS-14

WEB INTERFACES AND APPLICATIONS


FULL PAPERS


The One Hand WonderA Framework for Enhancing One-handed Website Operation on Touchscreen
Smartphones
Karsten Seipp and Kate DevlinDepartment of Computing, Goldsmiths College, University of London, Lewisham Way, SE14 6NW, London, U.K.
fk.seipp, [email protected]
Keywords: One-handed Operation, Mobile, Web, Wheel Menu, Interface Adaptation, CSS3, JavaScript, HTML.
Abstract: Operating a website with one hand on a touchscreen mobile phone remains a challenging task: solutions toadapt websites for mobile users do not address the ergonomic peculiarities of one-handed operation. Wepresent the design and evaluation of the One Hand Wonder (OHW) – an easily-adaptable cross-platformJavaScript framework to support one-handed website navigation on touchscreen smartphones. It enhancesusability without the need to redesign the existing website or to overwrite any CSS styles. User testing andquantitative evaluation confirm learnability and efficiency with clear advantages over non-enhanced browsing,and a discussion of the OHW’s versatility is given.
1 INTRODUCTION
The majority of smartphones sold today use mod-ern operating systems such as Android and iOS,both of which have a powerful and largely standard-compliant browser paired with a touchscreen inter-face. Numerous websites already automatically adapttheir layout and handling to the constraints of the ac-cess device to provide an adequate user experience,using web technologies such as JavaScript, CSS3 me-dia queries or server-sided device detection.
With the help of established adaptation techniquesfor websites on mobile devices (W3C, 2008; ASA,2007) as well as responsive themes (Envato, 2013),device-independent websites are becoming the norm.In addition, further approaches exist to adapt web-sites to mobile device constraints, although these areeither proprietary (Akmin, 2012), dependent on aproxy server (Gupta et al., 2007) or bound to a spe-cific browser (Mobotap, 2012; Yu and Miller, 2011).These result in an adapted and improved display on arange of mobile devices, but not in an adapted inter-action model for thumb-based use.
For non-adapted pages, built-in actions such aspinching and tapping to zoom can improve matters.However, none of these account for the one-handedoperation of the phone, which has been identified asa preferred mode of operation by many users (Karl-son and Bederson, 2006). The limited mobility andreach of the thumb represent completely different
challenges to the designer regarding the layout andoperation of the website; simply crafting it to ensurea correct display of the page elements does not suf-fice.
While some browsers (Mobotap, 2012) offer im-provements for one-handed operation as part of theirinterface (using simple gestures, for example), we ex-plore whether one-handed operation can be reliablyimproved regardless of the browser or plugin used.We do this by improving the display and control of el-ements operated via direct touch, without the need forgestures. As devices and browsers become increas-ingly powerful, the question arises as to whether suchimprovements can be made directly at runtime in thebrowser, and how efficient and usable these improve-ments are in comparison to non-enhanced websites.In this paper we present a JavaScript-based frame-work which we have named the One Hand Wonder(OHW). The OHW prototype provides an on-demandthumb-based interaction model for all interactive ele-ments on a web page, facilitating operation and navi-gation across a wide range of websites. It gives quickaccess to the most common functions and elementsand augments the interaction model of the browserand the standard HTML elements of a web page withadditional one-handed UI features that can easily betoggled on and off. These augmentations are tem-porary and do not change the design of the website.The OHW is built using solely client-side technolo-gies and is implemented by simply embedding the
5
code into the the web page. Initial user testing to-gether with informal feedback during a demo sessionhas confirmed acceptance and learnability. However,in this paper we assess more closely the usability, per-formance and practical implications of this approachand thus focus on:
1. Description of design and functionality of theframework and its interface.
2. Head-to-head comparison of the OHW’s perfor-mance against normal, non-enhanced operation.
3. Discussion of its suitability for different types ofwebsites based on its implementation into popularsites.
4. Overall discussion of the OHW as a tool for one-handed website operation on touchscreen smart-phones.
2 PREVIOUS RESEARCH
When designing thumb-friendly interfaces, Wob-brock et al. (Wobbrock et al., 2008) suggest sup-porting and evoking horizontal thumb movements asmuch as possible, as vertical movements were foundto be overly challenging. On this basis they sug-gest a horizontal layout of interactive elements onthe screen to accommodate the economic peculiari-ties of the thumb and improve usability. Katre (Ka-tre, 2010) shows that a curved arrangement of ele-ments on a touchscreen is perceived as comfortableand easy, as it supports a more natural circular motionof the thumb. An application of this is found in inter-faces such as ArchMenu (Huot and Lecolinet, 2007)or ThumbMenu, where the user moves their thumbover an arch of elements placed in the bottom rightcorner of the screen.
Other researchers have explored the use of con-centric menus such as the Wavelet menu (Franconeet al., 2010) and SAM (Bonnet and Appert, 2011) toenhance thumb-based interaction, similar to the firstgeneration Apple iPod. In the case of the Waveletmenu, research has shown that this approach with itsconsistent interaction model is easy to learn and ef-ficient to use. Lu and Li (Lu and Li, 2011) presentGesture Avatar where the user can highlight a GUI el-ement on screen to gain better control of it via an en-larged avatar. While this is an innovative way of im-proving one-handed device operation, it requires theuser to draw their interface first, depends on a pro-prietary application and cannot be customised by thewebmaster.
In terms of general adaptation of websites for mo-bile devices, one approach is web page segmenta-
tion (Hattori et al., 2007; Gupta et al., 2007), usinga proxy server to re-render the page into new logicalunits which are subsequently served to the device. Aproprietary solution is the Read4Me browser (Yu andMiller, 2011) where the browser offers to optimise thepage for mobile display via a proxy-server that thenserves it to the user. Bandelloni et al. suggest a differ-ent system (Bandelloni et al., 2005) where the devel-oper creates an abstract XML-based description of thelayout and a proxy server renders the information forthe respective access device. In addition to these tech-niques, various services, themes and frameworks existto adapt websites for mobile devices and CSS3 mediaqueries offer a flexible approach for display adapta-tion.
While existing approaches are all concerned withthe display of a website on mobile devices, the OHWaddresses a so-far neglected aspect: the specific sup-port of one-handed operation of the web page. Byimplementing the OHW into a website, improvementsare made to the operation – rather than the presenta-tion – of the site, as this remains problematic even onwell-adapted sites when operating it with one hand.Most importantly, the enhancement is done at runtimeand on the client, can be fully configured by the web-master and is dependent only on the browser itself andthe user, who can choose to switch the enhancementson or off at any time.
3 METHODOLOGY
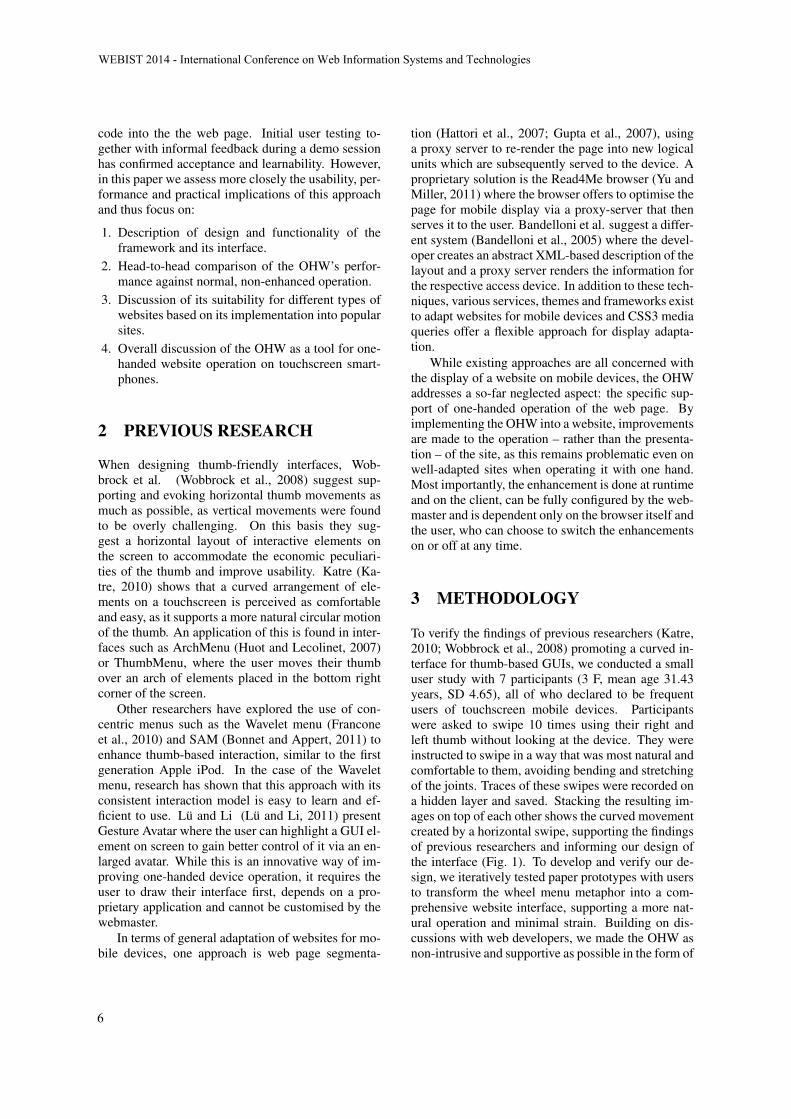
To verify the findings of previous researchers (Katre,2010; Wobbrock et al., 2008) promoting a curved in-terface for thumb-based GUIs, we conducted a smalluser study with 7 participants (3 F, mean age 31.43years, SD 4.65), all of who declared to be frequentusers of touchscreen mobile devices. Participantswere asked to swipe 10 times using their right andleft thumb without looking at the device. They wereinstructed to swipe in a way that was most natural andcomfortable to them, avoiding bending and stretchingof the joints. Traces of these swipes were recorded ona hidden layer and saved. Stacking the resulting im-ages on top of each other shows the curved movementcreated by a horizontal swipe, supporting the findingsof previous researchers and informing our design ofthe interface (Fig. 1). To develop and verify our de-sign, we iteratively tested paper prototypes with usersto transform the wheel menu metaphor into a com-prehensive website interface, supporting a more nat-ural operation and minimal strain. Building on dis-cussions with web developers, we made the OHW asnon-intrusive and supportive as possible in the form of
WEBIST�2014�-�International�Conference�on�Web�Information�Systems�and�Technologies
6
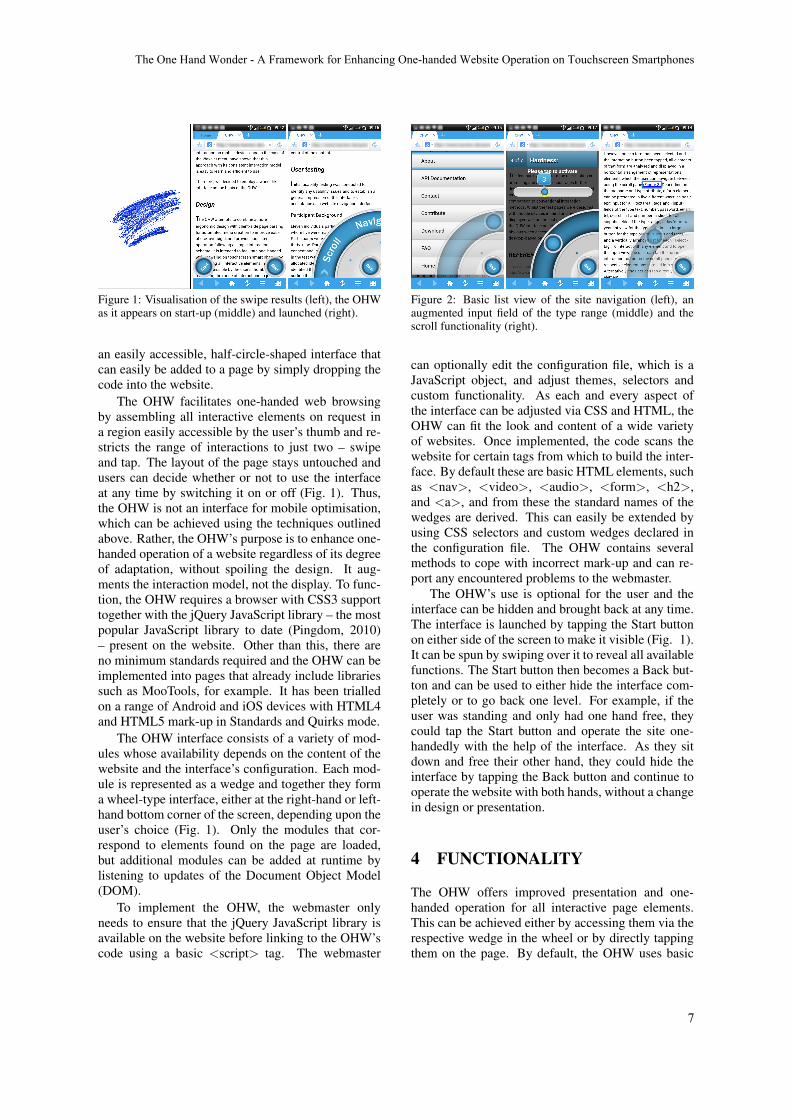
Figure 1: Visualisation of the swipe results (left), the OHWas it appears on start-up (middle) and launched (right).
an easily accessible, half-circle-shaped interface thatcan easily be added to a page by simply dropping thecode into the website.
The OHW facilitates one-handed web browsingby assembling all interactive elements on request ina region easily accessible by the user’s thumb and re-stricts the range of interactions to just two – swipeand tap. The layout of the page stays untouched andusers can decide whether or not to use the interfaceat any time by switching it on or off (Fig. 1). Thus,the OHW is not an interface for mobile optimisation,which can be achieved using the techniques outlinedabove. Rather, the OHW’s purpose is to enhance one-handed operation of a website regardless of its degreeof adaptation, without spoiling the design. It aug-ments the interaction model, not the display. To func-tion, the OHW requires a browser with CSS3 supporttogether with the jQuery JavaScript library – the mostpopular JavaScript library to date (Pingdom, 2010)– present on the website. Other than this, there areno minimum standards required and the OHW can beimplemented into pages that already include librariessuch as MooTools, for example. It has been trialledon a range of Android and iOS devices with HTML4and HTML5 mark-up in Standards and Quirks mode.
The OHW interface consists of a variety of mod-ules whose availability depends on the content of thewebsite and the interface’s configuration. Each mod-ule is represented as a wedge and together they forma wheel-type interface, either at the right-hand or left-hand bottom corner of the screen, depending upon theuser’s choice (Fig. 1). Only the modules that cor-respond to elements found on the page are loaded,but additional modules can be added at runtime bylistening to updates of the Document Object Model(DOM).
To implement the OHW, the webmaster onlyneeds to ensure that the jQuery JavaScript library isavailable on the website before linking to the OHW’scode using a basic <script> tag. The webmaster
Figure 2: Basic list view of the site navigation (left), anaugmented input field of the type range (middle) and thescroll functionality (right).
can optionally edit the configuration file, which is aJavaScript object, and adjust themes, selectors andcustom functionality. As each and every aspect ofthe interface can be adjusted via CSS and HTML, theOHW can fit the look and content of a wide varietyof websites. Once implemented, the code scans thewebsite for certain tags from which to build the inter-face. By default these are basic HTML elements, suchas <nav>, <video>, <audio>, <form>, <h2>,and <a>, and from these the standard names of thewedges are derived. This can easily be extended byusing CSS selectors and custom wedges declared inthe configuration file. The OHW contains severalmethods to cope with incorrect mark-up and can re-port any encountered problems to the webmaster.
The OHW’s use is optional for the user and theinterface can be hidden and brought back at any time.The interface is launched by tapping the Start buttonon either side of the screen to make it visible (Fig. 1).It can be spun by swiping over it to reveal all availablefunctions. The Start button then becomes a Back but-ton and can be used to either hide the interface com-pletely or to go back one level. For example, if theuser was standing and only had one hand free, theycould tap the Start button and operate the site one-handedly with the help of the interface. As they sitdown and free their other hand, they could hide theinterface by tapping the Back button and continue tooperate the website with both hands, without a changein design or presentation.
4 FUNCTIONALITY
The OHW offers improved presentation and one-handed operation for all interactive page elements.This can be achieved either by accessing them via therespective wedge in the wheel or by directly tappingthem on the page. By default, the OHW uses basic
The�One�Hand�Wonder�-�A�Framework�for�Enhancing�One-handed�Website�Operation�on�Touchscreen�Smartphones
7
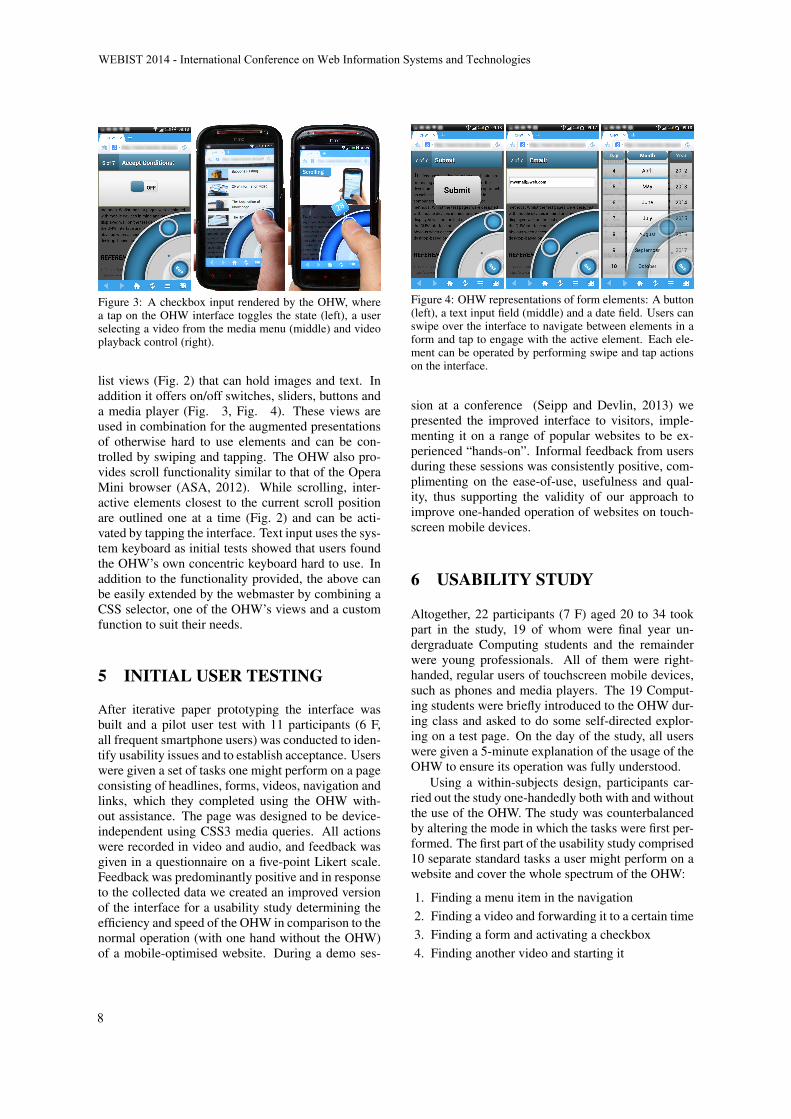
Figure 3: A checkbox input rendered by the OHW, wherea tap on the OHW interface toggles the state (left), a userselecting a video from the media menu (middle) and videoplayback control (right).
list views (Fig. 2) that can hold images and text. Inaddition it offers on/off switches, sliders, buttons anda media player (Fig. 3, Fig. 4). These views areused in combination for the augmented presentationsof otherwise hard to use elements and can be con-trolled by swiping and tapping. The OHW also pro-vides scroll functionality similar to that of the OperaMini browser (ASA, 2012). While scrolling, inter-active elements closest to the current scroll positionare outlined one at a time (Fig. 2) and can be acti-vated by tapping the interface. Text input uses the sys-tem keyboard as initial tests showed that users foundthe OHW’s own concentric keyboard hard to use. Inaddition to the functionality provided, the above canbe easily extended by the webmaster by combining aCSS selector, one of the OHW’s views and a customfunction to suit their needs.
5 INITIAL USER TESTING
After iterative paper prototyping the interface wasbuilt and a pilot user test with 11 participants (6 F,all frequent smartphone users) was conducted to iden-tify usability issues and to establish acceptance. Userswere given a set of tasks one might perform on a pageconsisting of headlines, forms, videos, navigation andlinks, which they completed using the OHW with-out assistance. The page was designed to be device-independent using CSS3 media queries. All actionswere recorded in video and audio, and feedback wasgiven in a questionnaire on a five-point Likert scale.Feedback was predominantly positive and in responseto the collected data we created an improved versionof the interface for a usability study determining theefficiency and speed of the OHW in comparison to thenormal operation (with one hand without the OHW)of a mobile-optimised website. During a demo ses-
Figure 4: OHW representations of form elements: A button(left), a text input field (middle) and a date field. Users canswipe over the interface to navigate between elements in aform and tap to engage with the active element. Each ele-ment can be operated by performing swipe and tap actionson the interface.
sion at a conference (Seipp and Devlin, 2013) wepresented the improved interface to visitors, imple-menting it on a range of popular websites to be ex-perienced “hands-on”. Informal feedback from usersduring these sessions was consistently positive, com-plimenting on the ease-of-use, usefulness and qual-ity, thus supporting the validity of our approach toimprove one-handed operation of websites on touch-screen mobile devices.
6 USABILITY STUDY
Altogether, 22 participants (7 F) aged 20 to 34 tookpart in the study, 19 of whom were final year un-dergraduate Computing students and the remainderwere young professionals. All of them were right-handed, regular users of touchscreen mobile devices,such as phones and media players. The 19 Comput-ing students were briefly introduced to the OHW dur-ing class and asked to do some self-directed explor-ing on a test page. On the day of the study, all userswere given a 5-minute explanation of the usage of theOHW to ensure its operation was fully understood.
Using a within-subjects design, participants car-ried out the study one-handedly both with and withoutthe use of the OHW. The study was counterbalancedby altering the mode in which the tasks were first per-formed. The first part of the usability study comprised10 separate standard tasks a user might perform on awebsite and cover the whole spectrum of the OHW:
1. Finding a menu item in the navigation2. Finding a video and forwarding it to a certain time3. Finding a form and activating a checkbox4. Finding another video and starting it
WEBIST�2014�-�International�Conference�on�Web�Information�Systems�and�Technologies
8
5. Finding a form and filling in a date6. Finding a link in the body text7. Finding a form and filling in a range value8. Finding a headline9. Finding a form and pressing a button
10. Scrolling and clicking on a link
The study featured a website presenting the OHW.It was coded in HTML5 and CSS3 and contained apage navigation (<nav>), headlines (<h1>, <h2>,<h3>), a form with various elements of input types(“text”, “range”, “datetime”, “submit”, “checkbox”),paragraphs of text (<p>), three video files with posterimages (<video>), links (<a>), images (<img>) aswell as various <div> elements for the layout. Theseelements are very common and can be consideredas representative for many websites. CSS3 mediaqueries and relative measures were used to make thewebsite’s presentation device-independent. To con-duct the study we used a HTC Sensation XE with An-droid 4.03 and the Maxthon Mobile Browser.
Tasks were performed directly on the website andwere preceded by an instruction screen. Each taskcommenced from the top of the page. The numberof interactions and time needed to accomplish thetask were recorded using JavaScript. Recording be-gan when users pressed OK on the instruction screenand stopped when a task was completed. For exam-ple, recording was only stopped once the target linkwas clicked or a certain value was entered into a field.
While the above is well-suited for determining ef-ficiency on discrete tasks, it is less suitable for pre-dicting the OHW’s “real-life” performance on a pagecontaining any number of these elements, where spa-tial proximity could affect performance. To addressthis we also measured the performance in 10 addi-tional, consecutive tasks (1c to 10c), mimicking a setof coherent actions. After each part of this use case,recording was paused to show the instructions for thenext part, but the current state of the website (scrollposition, opened menus etc.) remained unchanged:
1c. Navigating to a headline in the text2c. Scrolling and clicking on a link3c. Finding a menu item in the navigation4c. Finding a video and forwarding it to a certain time5c. Navigating to another headline in the text6c. Finding a link in the body text by scrolling7c. Finding a form and entering a word into a text
field8c. Activating a checkbox in the same form9c. Filling in a date in the same form
10c. Pressing a button in the same form
7 RESULTS
The data was evaluated using a Wilcoxon signed-ranktest. Due to the varying, skewed results and smallsample size we chose a series of non-parametric testsover the ANOVA. As tasks were not comparable intheir results because of their different nature, theyhad to be treated as separate. Comparison of theone-handed task performance of users with the OHWagainst the normal, non-enhanced way draws a clearpicture of the benefits the OHW offers to one-handedwebsite operation. The effect of the OHW on effi-ciency can be derived from the median number ofinteractions required to perform a task (Table 1) aswell as from the time needed to complete it (Table 2).Note: The values of the use case (shown in the tablesas C) are based on the time and interactions neededto complete the whole use case, consisting of the 10additional parts 1c to 10c, forming one large task.
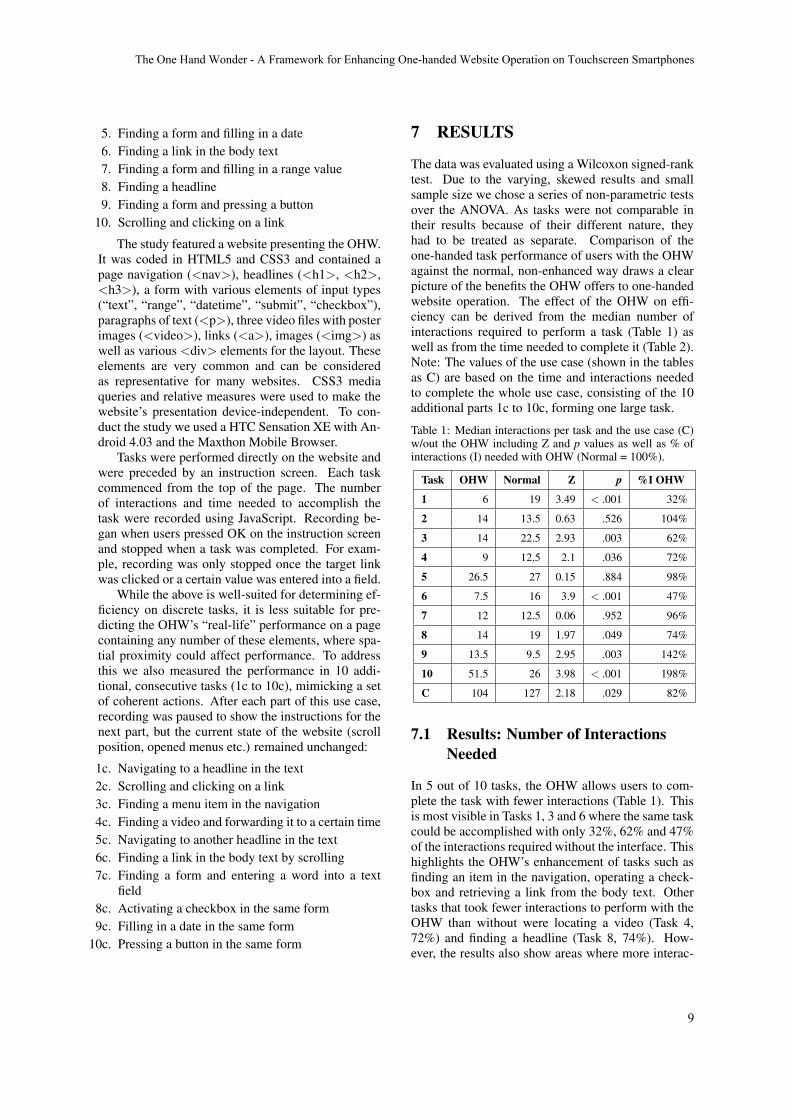
Table 1: Median interactions per task and the use case (C)w/out the OHW including Z and p values as well as % ofinteractions (I) needed with OHW (Normal = 100%).
Task OHW Normal Z p %I OHW
1 6 19 3.49 < .001 32%
2 14 13.5 0.63 .526 104%
3 14 22.5 2.93 .003 62%
4 9 12.5 2.1 .036 72%
5 26.5 27 0.15 .884 98%
6 7.5 16 3.9 < .001 47%
7 12 12.5 0.06 .952 96%
8 14 19 1.97 .049 74%
9 13.5 9.5 2.95 .003 142%
10 51.5 26 3.98 < .001 198%
C 104 127 2.18 .029 82%
7.1 Results: Number of InteractionsNeeded
In 5 out of 10 tasks, the OHW allows users to com-plete the task with fewer interactions (Table 1). Thisis most visible in Tasks 1, 3 and 6 where the same taskcould be accomplished with only 32%, 62% and 47%of the interactions required without the interface. Thishighlights the OHW’s enhancement of tasks such asfinding an item in the navigation, operating a check-box and retrieving a link from the body text. Othertasks that took fewer interactions to perform with theOHW than without were locating a video (Task 4,72%) and finding a headline (Task 8, 74%). How-ever, the results also show areas where more interac-
The�One�Hand�Wonder�-�A�Framework�for�Enhancing�One-handed�Website�Operation�on�Touchscreen�Smartphones
9
tions are required with the OHW than without. Thisincludes finding and pressing a submit button (Task9, 142%) and lengthy scrolling to find a link (Task 10,198%).
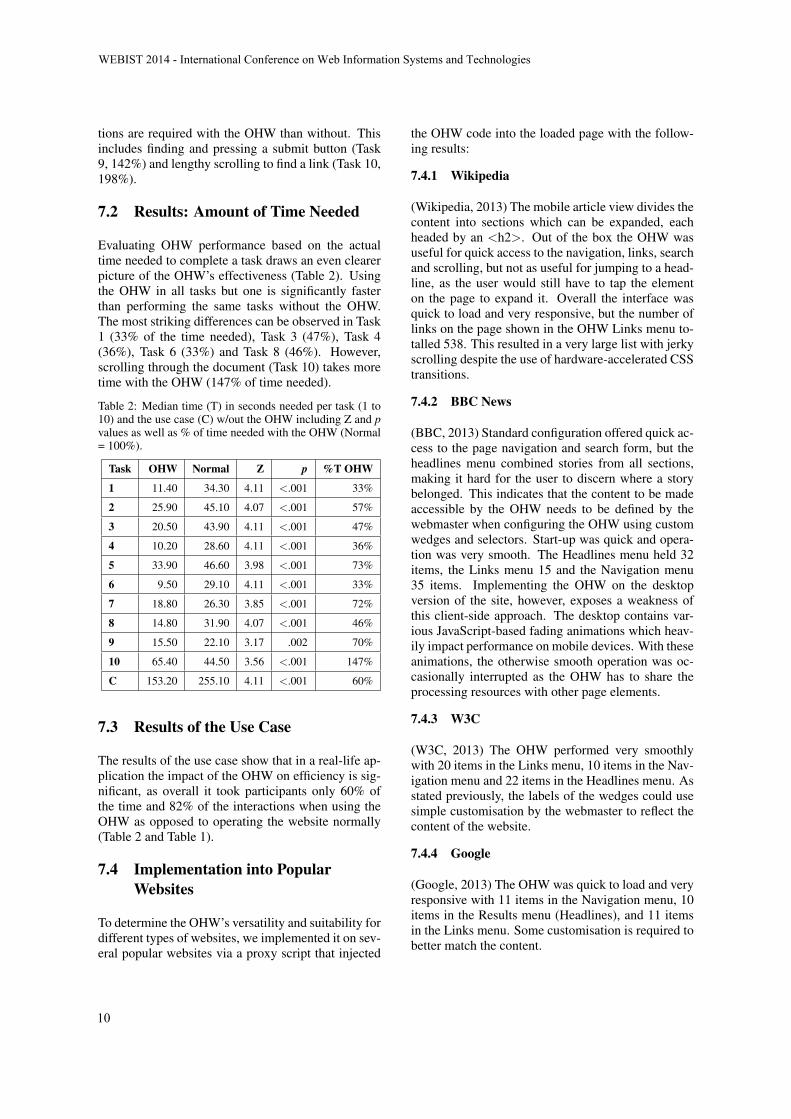
7.2 Results: Amount of Time Needed
Evaluating OHW performance based on the actualtime needed to complete a task draws an even clearerpicture of the OHW’s effectiveness (Table 2). Usingthe OHW in all tasks but one is significantly fasterthan performing the same tasks without the OHW.The most striking differences can be observed in Task1 (33% of the time needed), Task 3 (47%), Task 4(36%), Task 6 (33%) and Task 8 (46%). However,scrolling through the document (Task 10) takes moretime with the OHW (147% of time needed).
Table 2: Median time (T) in seconds needed per task (1 to10) and the use case (C) w/out the OHW including Z and pvalues as well as % of time needed with the OHW (Normal= 100%).
Task OHW Normal Z p %T OHW
1 11.40 34.30 4.11 <.001 33%
2 25.90 45.10 4.07 <.001 57%
3 20.50 43.90 4.11 <.001 47%
4 10.20 28.60 4.11 <.001 36%
5 33.90 46.60 3.98 <.001 73%
6 9.50 29.10 4.11 <.001 33%
7 18.80 26.30 3.85 <.001 72%
8 14.80 31.90 4.07 <.001 46%
9 15.50 22.10 3.17 .002 70%
10 65.40 44.50 3.56 <.001 147%
C 153.20 255.10 4.11 <.001 60%
7.3 Results of the Use Case
The results of the use case show that in a real-life ap-plication the impact of the OHW on efficiency is sig-nificant, as overall it took participants only 60% ofthe time and 82% of the interactions when using theOHW as opposed to operating the website normally(Table 2 and Table 1).
7.4 Implementation into PopularWebsites
To determine the OHW’s versatility and suitability fordifferent types of websites, we implemented it on sev-eral popular websites via a proxy script that injected
the OHW code into the loaded page with the follow-ing results:
7.4.1 Wikipedia
(Wikipedia, 2013) The mobile article view divides thecontent into sections which can be expanded, eachheaded by an <h2>. Out of the box the OHW wasuseful for quick access to the navigation, links, searchand scrolling, but not as useful for jumping to a head-line, as the user would still have to tap the elementon the page to expand it. Overall the interface wasquick to load and very responsive, but the number oflinks on the page shown in the OHW Links menu to-talled 538. This resulted in a very large list with jerkyscrolling despite the use of hardware-accelerated CSStransitions.
7.4.2 BBC News
(BBC, 2013) Standard configuration offered quick ac-cess to the page navigation and search form, but theheadlines menu combined stories from all sections,making it hard for the user to discern where a storybelonged. This indicates that the content to be madeaccessible by the OHW needs to be defined by thewebmaster when configuring the OHW using customwedges and selectors. Start-up was quick and opera-tion was very smooth. The Headlines menu held 32items, the Links menu 15 and the Navigation menu35 items. Implementing the OHW on the desktopversion of the site, however, exposes a weakness ofthis client-side approach. The desktop contains var-ious JavaScript-based fading animations which heav-ily impact performance on mobile devices. With theseanimations, the otherwise smooth operation was oc-casionally interrupted as the OHW has to share theprocessing resources with other page elements.
7.4.3 W3C
(W3C, 2013) The OHW performed very smoothlywith 20 items in the Links menu, 10 items in the Nav-igation menu and 22 items in the Headlines menu. Asstated previously, the labels of the wedges could usesimple customisation by the webmaster to reflect thecontent of the website.
7.4.4 Google
(Google, 2013) The OHW was quick to load and veryresponsive with 11 items in the Navigation menu, 10items in the Results menu (Headlines), and 11 itemsin the Links menu. Some customisation is required tobetter match the content.
WEBIST�2014�-�International�Conference�on�Web�Information�Systems�and�Technologies
10

7.4.5 WordPress Blog
(WordPress, 2013) The OHW performed smoothlywith 6 items in the Navigation menu, 16 items in theLinks menu and 12 items in the Posts menu (Head-lines), but again the wedges could be renamed to rep-resent the content meaningfully.
7.4.6 YouTube
(YouTube, 2013) Smooth performance with a ba-sic configuration showing 4 items in the Navigationmenu, 9 items in the Videos (Headlines) menu and 6items in the Links menu. Unfortunately, videos couldnot be played back within the OHW as these wereserved as 3gp files. The OHW can only play backfiles which are natively supported by the browser.
7.4.7 Flickr
We were unable to receive the mobile version of thesite (Flickr, 2013) using our proxy script, despitemanually altering the header information of the re-quest to mimic a mobile device. Attempts to mirrorparts of the site locally did not allow sufficiently ac-curate reconstruction of the mobile view either.
7.5 General Performance
Performance of the OHW (Table 3) was tested inthe standard browser with varying amounts of con-tent on an HTC Sensation XE with Android 4.03 andan iPhone 3GS with iOS 6.1. First, we measured thestart-up time of the interface on each device on thewebsites discussed in the previous section. Then wemeasured the time it took each device to create a listview with varying amounts of items after tapping awedge in the wheel. For this we chose the Word-Press blog (WordPress, 2013) as a base and injectedadditional elements into the DOM when fetching thepage using the proxy script. All measurements wereperformed three times on each device with a clearedbrowser cache.
8 DISCUSSION
First we discuss usability and efficiency from a userperspective. Next we discuss the performance of theframework to determine the boundaries in which itcan be deployed.
Table 3: Mean time in seconds needed by the HTC Sensa-tion XE (S. XE) and iPhone 3GS (3GS) to create a list view(Fig. 1, right) after tapping a wedge in the wheel. Secondpart shows mean start-up time (SU) when implemented ona website.
Task S. XE 3GS
List view, 30 items 1.1 0.6
List view, 60 items 1.5 0.7
List view, 120 items 1.9 0.7
List view, 480 items 2.4 0.6
SU Wikipedia 1.4 0.9
SU BBC News 2.3 1.4
SU W3C 0.3 0.8
SU Google 0.3 1.0
SU WordPress 1.5 1.4
SU YouTube 0.9 0.9
8.1 Usability and Efficiency
When operating a website with only one hand, theOHW presents a clear advantage over the normal,non-enhanced mode of operation. In the majorityof cases, using the OHW requires less interaction tocomplete a task and in 90% of the examined cases,a task is completed significantly faster when usingthe OHW. However, the results also highlight a weakpoint of the OHW. When the user has to scroll a largesection of the page, the performance of the OHW issignificantly weaker than the normal mode of opera-tion (147% of time needed). It shows that scrollingwith one hand is already very efficient and that theOHW’s approach cannot compete with the existingsolution, but needs improvement. This has since beenaddressed by combining native scrolling and OHWscrolling so that the user can scroll the website asusual, but can make more precise selections by mov-ing their thumb over the interface at the same time.
8.2 Versatility
Implementation into different types of websites high-lights the pros and cons of our approach. Customisa-tion of the OHW is easy: the webmaster can quicklyadapt the text of the wedges to reflect website contentusing the supplied templates. Custom functionality isachieved by using the OHW’s plugin model to accom-modate a website’s own set of interactions, such asthe accordion-like blocks on Wikipedia (Wikipedia,2013) with custom callback functions. Thus config-ured, the OHW is suited to pages with categorised
The�One�Hand�Wonder�-�A�Framework�for�Enhancing�One-handed�Website�Operation�on�Touchscreen�Smartphones
11

Figure 5: The OHW on a Nexus 7 in horizontal orientation.
text and images that stretch over many screens andwould otherwise need scrolling to access, as found onnews websites, wikis, forums, blogs and search en-gines. Benefits for all types of websites include quickaccess and operation of forms, navigation, and con-trol of audio or video items if supported natively bythe browser.
The OHW performs well on mobile-adapted pagesif the content per menu is not excessive. Operationis smooth even with 120 items to be displayed andscrolled. Beyond that the list scrolling performancedecreases on the HTC Sensation XE with the amountof data to be presented, whereas it stays the same onthe iPhone 3GS with up to 480 list items. While thisdecrease is likely to only happen in rare cases on mo-bile websites – as observed in our Wikipedia test – itis more likely to occur on desktop-oriented pages dueto the larger page load and other resource-depletingprocesses. Therefore the webmaster has to be con-siderate when implementing the OHW: a site loadedwith badly coded animations that already strugglesbeing displayed on a mobile device will not neces-sarily be improved by the OHW. This highlights themain problem of using an integrated client-side ap-proach: the interface has to share the resources withthe content of the website, which can directly influ-ence performance. Luckily, this is in the hands of thewebmaster implementing the OHW and thus straight-forward to address. However, it also shows that theOHW is not a magical one-size-fits-all solution formaking any website easier to interact with when oper-ating the device with one hand. What it does, though,is significantly improve operation and efficiency onalready mobile-adapted websites (Table 2) togetherwith a short start-up time and high responsiveness(Table 3).
9 CONCLUSION
Our research shows that applying the wheel-menumetaphor as the basis for thumb-based website in-teraction and offering a curved input control basedon solely swipe and tap for all interactive elementsclearly improves one-handed website operation andallows users to complete their goals more quickly andcomfortably as they do not have to loosen their gripon the device when trying to reach elements outsidethe arc of their thumb. Given the demand for a sim-ple, one-handed way to access websites on a mobiledevice (Karlson and Bederson, 2006), the OHW isa practical and highly effective solution from both aweb developer and end-user perspective, if the tech-nical requirements are met. The OHW promotes afree and inclusive way of improving user experienceon the mobile web for modern touchscreen smart-phone users and supports openness and flexibility.The use of standard web technologies allows it to eas-ily adapt to new challenges and ensures its longevityand ease-of-use for the webmaster. Future work willaddress performance optimisations for the operationof large lists and the development of a SVG andcore JavaScript implementation. We plan to evaluatethe OHW’s applicability as an interface for HTML5-based smartphone apps and the development of an ex-tended plugin model to allow more advanced customfunctionality. As it stands, the OHW is a promisingapproach for enhancing one-handed web browsing ona wide range of mobile touchscreen devices (Fig. 5).
REFERENCES
Akmin (2012). Build your own mobile website ... in min-utes. http://www.mobisitegalore.com/index.html.
ASA, O. S. (2007). Making small devices lookgreat. http://dev.opera.com/articles/view/making-small-devices-look-great.
ASA, O. S. (2012). http://www.opera.com/mobile/specs.Bandelloni, R., Mori, G., and Paterno, F. (2005). Dynamic
generation of web migratory interfaces. In Proc. Mo-bile HCI 2005, pages 83–90, New York, NY, USA.ACM.
BBC (2013). BBC news. http://m.bbc.co.uk/news.Bonnet, D. and Appert, C. (2011). Sam: the swiss army
menu. In Proc. IHM 2011, pages 5:1–5:4, New York,NY, USA. ACM.
Envato (2013). Signum mobile — html5 & css3 andiwebapp. http://themeforest.net/item/signum-mobile-html5-css3-and-iwebapp/1614712.
Flickr (2013). Flickr. http://m.flickr.com.Francone, J., Bailly, G., Lecolinet, E., Mandran, N., and Ni-
gay, L. (2010). Wavelet menus on handheld devices:
WEBIST�2014�-�International�Conference�on�Web�Information�Systems�and�Technologies
12
stacking metaphor for novice mode and eyes-free se-lection for expert mode. In Proc. AVI 2010, AVI ’10,pages 173–180, New York, NY, USA. ACM.
Google (2013). Google search results.https://www.google.co.uk/search?q=something.
Gupta, A., Kumar, A., Mayank, Tripathi, V. N., andTapaswi, S. (2007). Mobile web: web manipulationfor small displays using multi-level hierarchy pagesegmentation. In Proc. MC07 4th Mobility Confer-ence, pages 599–606. ACM.
Hattori, G., Hoashi, K., Matsumoto, K., and Sugaya, F.(2007). Robust web page segmentation for mobile ter-minal using content-distances and page layout infor-mation. In Proc. WWW 2007, pages 361–370. ACM.
Huot, S. and Lecolinet, E. (2007). Archmenu et thumb-menu: controler son dispositif mobile ”sur le pouce”.In Proc. IHM 2007, pages 107–110, New York, NY,USA. ACM.
Karlson, A. K. and Bederson, B. B. (2006). Studies in one-handed mobile design: Habit, desire and agility. Tech-nical report, Computer Science Dept., Uni. of Mary-land.
Katre, D. (2010). One-handed thumb use on smart phonesby semi-literate and illiterate users in india. In HWID:Usability in Social, Cultural and Organizational Con-texts, volume 316, pages 189–208. Springer Boston.
Lu, H. and Li, Y. (2011). Gesture avatar: a technique for op-erating mobile user interfaces using gestures. In Proc.CHI 2011, pages 207–216. ACM.
Mobotap (2012). Dolphin browser. http://dolphin-browser.com/.
Pingdom (2010). jQuerys triumphant march to suc-cess. http://royal.pingdom.com/2010/03/26/jquery-triumphant-march-to-success/.
Seipp, K. and Devlin, K. (2013). Enhancing one-handedwebsite operation on touchscreen mobile phones. InCHI ’13 Extended Abstracts on Human Factors inComputing Systems, CHI EA ’13, pages 3123–3126,New York, NY, USA. ACM.
W3C (2008). Mobile web best practices 1.0.http://www.w3.org/TR/mobile-bp/.
W3C (2013). W3C. http://www.w3.org.Wikipedia (2013). Deusdedit of Canterbury.
http://en.m.wikipedia.org/wiki/Deusdedit of Canterbury.Wobbrock, J. O., Myers, B. A., and Aung, H. H. (2008).
The performance of hand postures in front- and back-of-device interaction for mobile computing. Int. J.Hum.-Comput. Stud., 66(12):857–875.
WordPress (2013). Just another wordpress weblog.http://en.blog.wordpress.com/.
YouTube (2013). Youtube mobile.http://www.youtube.com/results?client=mv-google&q=sublime.
Yu, C.-H. and Miller, R. C. (2011). Enhancing mobilebrowsing and reading. In Ext. Abstracts Proc. CHI2011, pages 1783–1788. ACM.
The�One�Hand�Wonder�-�A�Framework�for�Enhancing�One-handed�Website�Operation�on�Touchscreen�Smartphones
13
Contextinator - Project-based Management of Personal Informationon the Web
Ankit Ahuja, Ben Hanrahan and Manuel A. Perez-QuinonesDepartment of Computer Science, Virginia Tech, Blacksburg, VA U.S.A.
fahuja.ankit, [email protected], [email protected]
Keywords: Information Fragmentation, Personal Information Management, Tool Integration, Web-based systems.
Abstract: The web browser is a central workspace for knowledge workers, where they use cloud-based applications toaccess their information. While this solution fits nicely within our diverse ecosystem of devices, it may reintro-duce and proliferate faults of the desktop, particularly information fragmentation. Information fragmentationis an increasingly important issue on the cloud as information is typically silo-ed within different applications.This results in users replicating storage and organization due to the lack of a unifying structure. As cloudapplications become more rich, the need to investigate whether these faults of the past are still problematicbecomes more important. To probe this question we created Contextinator, a tool for the web browser thatassists in coordinating data for projects. Contextinator enables knowledge workers to manage cloud-based in-formation and project artifacts in a centralized place, providing a unifying structure. In this paper, we discussthe design of our system, and the results of our mixed-method evaluation. Our findings contribute insight intothe need for, and appropriateness of, projects as unifying structures for the web. Our results point to two typesof projects we call ‘preparatory’ and ‘opportunistic’ based on when and why users create them.
1 INTRODUCTION
The web browser has emerged as a central workspacefor knowledge workers. This cloud-based approachcomplements our diverse ecosystem of devices asmost of the application data resides in a device ag-nostic remote storage. This trend is further strength-ened as mobile devices and web applications begin tomatch the functionality of desktop applications.
However, this remote storage comes at a cost,as data on the cloud is typically accessed throughparticular applications or services (e.g., Dropbox forfiles, Evernote for notes, Gmail for email). Theseapplications create silos of data that are not alwaysinter-operable with each other. These silos do notshare a unifying structure and proliferate informa-tion fragmentation, a problem previously identifiedby the Personal Information Management (PIM) com-munity (Karger and Jones, 2006). The siloing of databetween different applications prevents the user fromcreating more salient groupings based on their realworld relationships with the data.
Information fragmentation in this context hasmany undesired consequences. First, data is stored inseparate applications and often only available througheach particular application (e.g., an Evernote note-
book is not available in Gmail). Second, user-definedgroupings are done in ad-hoc ways particularly if datafor the group is scattered over different applications.For example, it is typical to find a Dropbox folder, aGmail label/folder, and an Evernote noteboook for aparticular project but these three individual items arestored in different applications and there is no easyway for users to group them under a user-meaningfulname, like “home repair project.” Instead users end upduplicating organizational hierarchies between tools(Boardman and Sasse, 2004; Boardman et al., 2003).
This cloud-based information fragmentation leadsto another problem. Users work on the web havingmany windows or tabs open to access these online ser-vice. This in turn exacerbates the problem by requir-ing more management of windows, tabs, and book-marks. Suspending and resuming work on a project,something we know is typical of today’s knowledgeworkers (Czerwinski et al., 2004), is made more diffi-cult by these disconnected tabs and windows.
We built Contextinator as a way to study theseproblems. Contextinator is a tool that enables usersto group their web sessions and cloud based artifactsinto projects. Contextinator was built with compati-bility in mind and is compatible with the majority ofexisting web-based tools.
14
In this paper, we present the related work in the ar-eas of interest, ground our design decisions in previ-ous research, present the results of our mixed-methodevaluation, and close with implications for future sys-tems. We not only find evidence that users need a wayto group activities, but that the project metaphor is toorestrictive. We have also gained insight into the com-plex way knowledge workers contextualize and thinkabout their work.
2 RELATED WORK
Several areas of research are related to this work:Information Fragmentation, Task Management, Ac-tivity Based Computing, Multitasking, and WindowManagement. As such, we review the research foreach of these areas and provide insight into how theyshaped the design of Contextinator.
2.1 Information Fragmentation
Information fragmentation occurs when our personalinformation is scattered over different devices, stor-age systems, and online tools. Typically each ofthese have its own organizational structure and itis up to users to integrate information across thesesystems. Information fragmentation is considered a‘pervasive problem in personal information manage-ment’ (Karger and Jones, 2006).
The siloing of information by applications is nota new problem unique to the cloud. In previous stud-ies users were found to use several methods to creategroupings in spite of these silos. These methods in-clude: using multiple folder hierarchies to organizedocuments related to projects (Jones et al., 2005); us-ing a special folder (or tag) in an email client to holdmessages related to a project (Gonzalez and Mark,2004); or using virtual spaces to separate windows ofdifferent projects (Henderson and Card, 1986).
A drawback with this ad-hoc approach is thatusers end up maintaining duplicate organizational hi-erarchies between tools, which are difficult to main-tain. Boardman et al. (Boardman and Sasse, 2004;Boardman et al., 2003) studied users’ PIM orga-nization strategies across different tools and iden-tified some of the problems caused by informationfragmentation. Including: compartmentalization ofdata between distinct tools; difficulty in coordinat-ing across different tools; and inconsistencies be-tween equivalent functionality. To solve the secondproblem, Boardman et al. created a prototype to mir-ror folder structures between different PIM tools and
users found the sharing categories between tools intu-itive and compelling.
Bergman et al. (Bergman et al., 2006) framed theproblem as project fragmentation, where informationwas fragmented into different collections without re-lation to the common activity uniting them. Their so-lution was to use a single hierarchy to store all filesof different formats under the same folder. Similarly,Jones et al. (Jones and Anderson, 2011) suggestedthe development of a common structure that could beshared and manipulated by any number of tools.
Integrating information collections in the cloud isalso being pursued in the commercial and open sourcetool space. However, most of these tools assist usersin accessing information, and do not endeavor to cre-ate any structural link between them. For example,Cloudmagic1 creates a unified search box to accessinformation across tools. Attachments.me2 enablesaccess to Dropbox files for creating attachments inGmail. Neither application allows users to ‘group’multiple open windows or tabs, the user is still left tomanage those.
2.2 Task Management
Another area of research related to our work is TaskManagement, as knowledge workers typically have alist of pending actions for each project. Bellotti etal. (Bellotti et al., 2004) studied task management toinform the design of a task list manager. In their work,they suggested that a task manager should support in-formal priority lists, to ensure near-term executionof priority actions. Furthermore, tasks within eachproject can help knowledge workers prioritize andmaintain their attention over different projects (Bel-lotti et al., 2004; Gonzalez and Mark, 2004). Taskscan also act as good reminders when they appear inthe way and always visible in the working space (Bel-lotti and Smith, 2000; Bellotti et al., 2004; Gonzalezand Mark, 2004).
2.3 Quick Capture
Knowledge workers often capture information andtasks while working and using different tools.Bergman (Bergman et al., 2003) suggested that cap-turing the context of an information item during inter-action assists the user to recall the information whenit is later engaged with. Jones et al. (Jones et al.,2008) implemented quick capture as part of the per-sonal project planner, where users could create richtext project plans and reference documents, email
1https://cloudmagic.com2https://attachments.me
Contextinator�-�Project-based�Management�of�Personal�Information�on�the�Web
15
messages, web pages, etc. Hanrahan et al. (Hanra-han et al., 2011) added a quick capture ability withinthe email client to move information to wikis whereusers could drag and drop content into a shared wikispace. Quick capture also exists as a feature inmany commercial Getting Things Done (Allen, 2002)tools, such as OmniFocus3, Things4, and Remem-berTheMilk5.
2.4 Multitasking and Interruptions
One of the typical characteristics of today’s knowl-edge workers is that they are routinely interrupted,as a result workers are constantly multitasking andswitching projects.
Czerwinski et al. (Czerwinski et al., 2004) per-formed a diary study with knowledge workers to char-acterize how they interleave multiple tasks amidstinterruptions. They found that knowledge workersswitch tasks a significant number of times, with anaverage of 50 shifts over the week. The projects thatwere returned to were more complex, significantlylengthier in duration, and were rated more difficultthan shorter-term projects.
Gonzalez and Mark (Gonzalez and Mark, 2004;Mark et al., 2005) also found that knowledge work ishighly fragmented, where workers spend an averageof three minutes on a task and an average of 12 min-utes on a project. They found several ways in whichworkers manage their information to handle constantswitching, including aggregating a project’s differenttypes of information into a single artifact.
2.5 Activity Based Computing
Research in activity-based computing explores howto find a better mapping of real life projects to com-puting systems. Gonzalez and Mark (Gonzalez andMark, 2004; Mark et al., 2005) introduced the con-cept of working spheres to explain how knowledgeworkers conceptualize and organize their basic unitsof work. Voida et al. (Voida and Mynatt, 2009) cre-ated an activity-based system where they linked orga-nization of application windows and documents of aproject by associating files saved on the desktop of avirtual space with the currently active project.
2.6 Window Management
Rooms (Henderson and Card, 1986) introduced theconcept of virtual spaces, which is now a part of win-
3https://www.omnigroup.com/omnifocus4http://culturedcode.com/things/5http://www.rememberthemilk.com
dow management systems of modern operating sys-tems. Better management of space and sessions hasalso been explored for the web browser. Rajaman-ickam et al. (Rajamanickam et al., 2010) created atask-focused web browser, where web pages weregrouped into tasks. Morris et al. (Morris et al., 2008)created SearchBar, a tool that stored users’ searchquery and browsing histories, to support task resump-tion across multiple sessions.
Multitasking Bar (Wang and Chang, 2010) incor-porated the task concept into the browser providinga browser bar with a tab for each project. Jhaveriand Raiha (Jhaveri and Raiha, 2005) created a pro-totype tool called Session Highlights to aid cross-session task continuation. Mozilla Firefox now hasthe concept of Tab Groups, to group together similartabs under a single label.
For web-based information systems, managementof tabs and windows is a necessity. Suspending andresuming a task is problematic as it often requires ei-ther saving or reopening several independent pagesfrom different websites.
3 DESIGN
Based on the state of the art for the various researchdomains, we designed our tool with the followingprinciples in mind:
� knowledge workers organize information intoprojects (Gonzalez and Mark, 2004; Mark et al.,2005);
� tools like email crosscut projects (Jones and An-derson, 2011);
� information is fragmented across different appli-cations (Bergman et al., 2006; Boardman andSasse, 2004);
� there are structures replicated in collec-tions (Boardman et al., 2003); and
� users need an easy way to capture and restorethe state of projects (Czerwinski et al., 2004;Gonzalez and Mark, 2004; Mark et al., 2005)
A full description of the tool and the implementa-tion details is available online at (Ahuja, 2013)6.
3.1 Projects
A project in Contextinator is a collection of thebrowser tabs opened in the same window, as well
6MS Thesis available at http://vtechworks.lib.vt.edu/handle/10919/23120
WEBIST�2014�-�International�Conference�on�Web�Information�Systems�and�Technologies
16

Figure 1: Project Home Page.
as a series of tasks (todo items), bookmarks, people(emails), and a series of links to external applications.Each project has a Project Homepage (see Figure 1)where project artifacts can be managed, for examplethe user can manage tasks, tabs, bookmarks, and linksto external applications.
When a project is first started it begins as an emptybrowser window by creating the ‘File > New Win-dow’ command from Chrome. Any tabs that areadded to this window, either by adding through the‘File > New Tab’ or just opened via user control (e.g.with a pop up menu using the Open Link in New Tab)are automatically captured as part of a project. Aproject state is saved automatically and does not re-quire the user to provide a name.
Switching between projects is done by activatinga different browser window. Contextinator saves thestate of all windows, including all of the tabs openedand allows the user to switch between them. If auser closes a window, Contextinator can open it againrestoring all of the tabs that were part of the project.
Users are able to see a preview of all their cur-rently open projects and switch between them us-ing either the Quick Switcher page (see Figure 2).Quick Switcher is similar to the approach taken inGionarta (Voida et al., 2008). As projects are just reg-ular Chrome windows, users can also use any actionfrom the operating system’s default window manager,such as minimizing a window or using Mission Con-trol on OS X.
Task resumption is enabled through the combina-tion of these features, in that we preserve the state ofa project whenever it is closed and reinstate the previ-ous state whenever the project is opened again.
Global Overview
Each project also has pending tasks and relatedemails. Contextinator provides access to these ineach project’s home view. We also provide a globaloverview of all the user’s todo and email (see Fig-ure 3) organized by projects. In the global overviewwindow, users are able to see any unread email,
Figure 2: The Quick Switcher showing two projects.
Figure 3: Global overview showing the tasks across allprojects. This screenshot shows three projects with two ofthem collapsed.
work with any tasks, and directly switch to a specificproject homepage.
3.2 Information Views
As users often have accounts in multiple systemswhere they store different collections of data andnew or different services are frequently emerging, wefound the need to have an easy way to incorporate newservices into our tool. For example, a label in Gmailmight be related to a notebook in Evernote and afolder in Dropbox. To support the grouping of data inthese independent collections, we allow each projectto have an information view for each of these externalservices. We accomplish this with Information views,which provide a way to organize related informationacross different tools under a single project to reduceinformation fragmentation.
An information view is a unique URL that pointsto an internal location in an online collection. For ex-ample, a direct link to a folder in Dropbox produces,after user authentication, a view to that folder in Drop-box. The direct link eliminates the need for navigat-ing to the folder within the Dropbox collection.
Contextinator stores links to external services andcalls them ‘information views.’ Currently the soft-ware supports five external services, but there is nospecialized code for these. In general, any online ser-vice that has a unique URL to an internal location can
Contextinator�-�Project-based�Management�of�Personal�Information�on�the�Web
17

be easily incorporated into a Contextinator project.In addition, if users visit the application (e.g.,
Dropbox) directly in the web browser while havinga Contextinator project open, they are automaticallyredirected to the project’s information view eliminat-ing redundant navigation across tools (Bergman et al.,2006; Boardman et al., 2003).
A special case of this approach is the informationview for email, as email plays a significant role inproject management (Bellotti and Smith, 2000; Bel-lotti et al., 2004; Gonzalez and Mark, 2004). In orderto provide a way to integrate email with projects inContextinator, we display a filtered view of the emailinbox. The filter shows only unread messages fromthe people that are part of the project and allows theuser to quickly follow an ongoing email conversationwithout switching context to another program (emailin this case). In addition, we also provide a direct linkto particular Gmail tag or folder.
4 METHOD
Evaluating personal information tools and practicespresents several challenges. PIM is by definition per-sonal (Kelly and Teevan, 2007). The strategies thatusers follow tend to be very personal and specific tothe attributes of their own collections. Thus it is verydifficult to create a series of reference tests that canbe natural to all users. Controlled lab setting do notaccurately reflect the reality of the use of the technol-ogy in PIM settings. Several alternatives have beenproposed, from using diary studies (Czerwinski et al.,2004; Teevan et al., 2004), in-vivo research methodswhere researchers observe users with their own infor-mation, as well as deploying a tool and collect datafrom its use, as done by Whittaker et al. (Whittakeret al., 2011).
To study Contextinator, we employed a methodsimilar to Whittaker et al. (Whittaker et al., 2011)where they investigated email usage by deploying aprogram within an organization and collecting dataon its use. In our work, we deployed Contextinator intwo stages: first, we deployed the tool to a set of testusers where we logged usage and later interviewedthem; and second, we deployed Contextinator (with-out logging) in the Chrome Web Store where anybodycould download it and install it. Several months later,we surveyed all users. This study was approved bythe University IRB (#13-008). This combination ofevaluation methods gives us a access to data reflect-ing a variety of users experiences and behaviors. Wedescribe our research methods in stages.
4.1 First Stage: Limited Deployment
For our first stage, we recruited participants throughlocal listservs used by computer science graduate stu-dents and faculty. We also announced the experimentin an undergraduate class where they were offered ex-tra credit for participation. The invitation contained aURL7 where participants could download and installthe tool. The website also included several videos ex-plaining the use of the tool. Upon installing the tool,participants were required to agree to an online con-sent form.
During this stage of the evaluation we logged in-formation about user interactions and recorded themajority of user actions with the tool (e.g. creating anew project, switching to a project, closing a project,creating a new task, flagging a task, marking a task ascompleted, creating a new bookmark, opening email,etc.). Each log item included the time stamp and rel-evant information about the event (e.g. the project ortask name). We also conducted a semi-structured in-terview where we asked broad questions and followedup with specific questions about different areas of thetool (projects, tasks, information fragmentation, andtool usability).
Stage one provided us with detailed and rich datain regards to the use of the tool. At the same time, weinterviewed a few heavy users to learn how they madeuse of the tool. Of the 30 participants that installedour tool, roughly one third of these were undergrad-uate students and the rest were graduate students. Ofthese 30 participants 15 of them used the tool a sig-nificant amount, the remaining 15 only created one ortwo projects named ‘testing’ or ‘something.’ As such,we decided to not use the data of the later group inour analyses. In the group of 15 active participantswe identified 7 heavy users that created three or moreprojects. We interviewed 4 of our 30 participants, outof which 3 (U1, U2, U3) said they considered them-selves to be heavy users of the tool and 1 (U4) thatsaid they did not use the tool very much.
4.2 Second Stage: Broader Deployment
After our first evaluation we released Contextinatorin the Chrome Web Store for free. At the time ofthis writing, over 3000 users have installed Contexti-nator and there are 20 comments in the Chrome WebStore for Contextinator. The project is also availableon GitHub where it has 48 ‘stargazers’, 9 ‘watchers’,and has been forked 7 times.
In addition, we presented a survey to users of thetool upon their next activation of the software. The
7http://contextinator.cs.vt.edu
WEBIST�2014�-�International�Conference�on�Web�Information�Systems�and�Technologies
18

survey was to gather feedback and to clarify ideasgathered on Stage 1. In particular, we wanted to geta better sense of what users of the tool thought of thenotion of ‘projects’. It is worth noting that these usersare not affiliated with our institution nor connectedto our research group. Only those users older than18 years old were surveyed, a restriction of our localIRB.
Stage two provided us with a much broader popu-lation and allowed us to gather information from realusers of the tool. As of this writing, of the 20 com-ments on the Chrome Web Store, 14 are positive, 5are negative, and 1 is neutral. Five of the messagesare bug reports and 9 are requests for new features.Each of the messages with requests had more than onerequested feature.
Overall, our evaluation provided a rich and var-ied collection of data. We have more than 3000 usersthat explored our tool, very rich user logs of about7 users, interviews with 4 users, have more than 30survey responses, and about 60 people that have ei-ther commented or followed our project in the twoonline repositories (Chrome Web Store and Github).The next section presents the results and our analysisof the evaluation.
5 RESULTS
5.1 Project Appropriation
In our analysis of how our participants and usersmade use of the project metaphor we found two in-teresting aspects. First, the scope of projects var-ied widely, both between and within users’ projects.Second, users thought quite differently about what aproject was, again, both between and within users’projects. These different scopes and appropriationsof the project metaphor point to our naive assumptionthat ‘projects’ is the proper and complete metaphorfor managing work.
First, we see the different scope, or granularity,of projects in the number created by the participantsof the first stage (x = 4:5, Figure 4). When we askedusers in our second phase how many projects they cur-rently had in Contextinator, they reported an averageof 8.59 projects (s= 7:13). Of the 18 responses in oursecond stage, the maximum number of projects was28, the variability in the number of projects amongthe users is illustrated by the high standard deviationin relation to the mean.
The different scopes that were used is more clearlyillustrated in the names that participants in our firstphase chose for their projects. Some projects are
0
1
2
3
4
1 2 3 4 5 6 7 8 9
Projects created
Num
ber o
f Use
rs
Figure 4: Distribution of number of projects created byusers in Contextinator (stage 1).
clearly bounded as a specific task addressed, e.g.“Crypto project” and “German HW.” While there areother projects that, while also bounded, provide agrouping and represent an activity that will containmultiple projects (at least as we envisioned them), ex-amples include “Algorithms” or “CS 3744”. There areeven more broad projects that center around interestssuch as “Gardening,” as well as, projects that are evenmore general, e.g. “Life” or “General.” Examples ofproject names are shown below.� Individual Projects: “Crypto project” “3114
Project 3”, “Tax Returns” and “German HW”
� Groups of Projects: “Algorithms”, “Usability”,“CS 3744”.
� Ongoing Activities: “Gardening”, “Web Develop-ment”, and “Shopping”.
� Catch All: “Life” and “General”Probing further into how participants and users
thought about a project gives further insight into theinadequacies of the project metaphor. During our in-terviews the confusion over the definition of a projectwas clear. Not surprisingly, the most confused partici-pant identified themselves as not using the tool much.
When I was first using it, the title project. . . itmade me feel like it should be like a schoolproject or a research project [. . . ] It definitelythrew me initially (Participant U4).A user from the Chrome Web Store, explained
that they thought of projects as contexts instead ofprojects:
I’d rather call it context. A context can be aproject I am working on, a research topic or anotherwise combined series of tabs. For exam-ple: Everything related to geocaching, travel-ling. Some contexts only exist for the durationof the ‘project’, some I keep indefinitely.
Contextinator�-�Project-based�Management�of�Personal�Information�on�the�Web
19
A second user from the Chrome Web Store con-veyed a similar sense on their view of a project.
A set of related tabs that I need open at thesame time – this means I might have multipleContextinator projects for different stages ofthe same Project.Both of these users consider projects not as a re-
lated set of work items, but more as a contextual cap-ture of their current goals. Those goals might be im-mediate or longer term. The ‘projects’ in these twoexamples, are a more expansive view of organizinginformation. This sentiment was echoed by a partic-ipant in our test group where they also replaced theproject metaphor with their own more flexible organi-zation.
I have pretty broad categories. I have a Gen-eral that I just throw stuff in. I have Web De-velopment, so any time I am looking up stuffon stack overflow. I have Shopping, for differ-ent stuff I am shopping for. . . (Participant U2).Another participant thought of projects more as
lists of things to do. Yet another participant simplycreated projects for all his classes, enabling him toenter a context in his browser as he entered the corre-sponding physical context of the classroom:
The first thing I did was make a project foreach class I am in. So, when i am in class, Ican just open that project and have all the tabs.Esp. for Dr. XX’s class, there is like Moodle,Piazza, etc. (Participant U1).However, regardless of what projects were to the
user, nearly all of our participants found the ability tocapture and resume the state of a window useful. Thisis illustrated by an additional appropriation of projectsas a “bookmark for an entire window.”
I think of them as a bookmark for an entirewindow. In Chrome if you have a bunch oftabs open, and if I want to come back to all ofthem at once, bookmark it, make it a project(Participant U1).Another participant found that projects enabled
improved tab organization, and they began groupingtheir browser activity in a way that they had not pre-viously.
I would have 50 tabs open in my one window.This really helps to have 10 or less in five win-dows. It is really nice (Participant U2).
5.2 Project Transitions
In designing our system we also imagined that ourusers would purposefully initiate clean transitions be-tween projects (a context switch). However, in our
analysis we found that there was a somewhat clearseparation between users that purposefully switchedprojects and users that found themselves in a project.
In our interviews (stage one), three of the partic-ipants said that they did not use the tool to decidewhich project to work on, but it still made it easierto work on multiple projects at once. These partic-ipants switched projects in an emergent way, that isthey found they needed to switch to or create a differ-ent project once they already had a few tabs open.
A lot of the times I would just open a bunch ofnew tabs, and not necessarily look for an ex-isting project first[. . . ] So right now I am notin a project. And then I start googling some-thing, and I have five tabs open. And then Irealize, actually this should really go into theVTS project. . . (Participant U1).
We asked users from the Chrome Web store:“Why (or when) do your create a project?” The 18responses can be grouped into two categories. Thefirst group (10 responses) created projects before theystarted working on said ‘project.’ This group had anotion of project that was related to a goal, as if plan-ning for work to be done ahead. The second group (8responses), however, used projects as a way to capturework done so far but not yet completed. This groupused projects as a way to suspend work to be resumedlater. The goal of the project was not particularly im-portant in the creation of the project itself.
5.3 Project Planning
In the first stage of our evaluation, 12 participants cre-ated at least one task. Overall, they created an averageof 5.9 tasks (s = 9:3). They compeleted 3.2 tasks onan average (s = 6:7). Participants rarely used flag-ging. On an average, each participant flagged 0.8tasks (s = 1:9). Participants quick captured (addeda URL or note to a task) 2.8 tasks on an average(s = 4:5).
We saw roughly two approaches to project plan-ning that mirrored the motivations cited by users forcreating projects. The first, is a more preparatory ap-proach (Whittaker et al., 2011), where the user createstasks ahead of time and completes them over a longerperiod of time. An example of this is a user creat-ing a new project, quickly followed by the creation ofseveral new tasks, and in a later session marks themas completed. This approach mirrored the users thatcreated projects before they began working on thatproject.
The second approach was more opportunistic,where a user creates new tasks as and when required,marking them as completed in the near future (usually
WEBIST�2014�-�International�Conference�on�Web�Information�Systems�and�Technologies
20

in the same session). Here, the user does not have aspecific planning phase of their session and insteadplans and captures in situ. This approach mirrors thegroup of users that used projects to capture work thathas not been completed yet.
5.4 Usage
We also asked users “Which of the following fea-tures are indispensable for your use of Contextina-tor?” Only one participant selected the ‘Task man-ager’, 5 selected ‘Save and reopen projects’ and 13selected ‘Browser tab management.’ Clearly the sup-port of managing the windows/tabs in the browser isthe most used feature in our tool.
The last four questions were a likert-scale ques-tions about their agreement/disagreement with fac-tual statements. The results are presented below.The choices were (with score values in parenthesis):Strongly Agree (1), Agree (2), Neither Agree nor Dis-agree (3), Disagree (4), and Strongly Disagree (5).
“With Contextinator, I am able to work on mul-tiple projects simultaneously.” Average 2.00 (Agree)and standard deviation of 0.7.
“With Contextinator, switching projects makes melost, so I avoid switching unless it is absolutely neces-sary.” Average of 3.5 (close to neutral) and standarddeviation of 0.9.
“With Contextinator, suspending or closing aproject is easy because I don’t have to worry aboutlosing data.” Average of 1.89 (Agree) and standarddeviation of 1.0.
“With Contextinator, resuming a project is easy asI am able to quickly gather where I left off.” Averageof 1.89 (Agree) and standard deviation of 0.6.
Based on these results, it is clear that the supportfor grouping related items, suspending and resumingwork are the most salient features of Contextinator.
6 DISCUSSION
In this paper, we have presented the design and evalu-ation of Contextinator, a system built to assist peoplein managing their personal information stored in thecloud. The design of Contextinator focused on pro-viding users support in three areas. First, it allowedusers to have their web related project information inone place (including emails, bookmarks, todos, peo-ple in a project, etc.). Second, it provided a wayto group and manage windows and tabs as a singleproject. Finally, the tool provided a way to capture,save, and reopen a project. While there is support
for all of these features, our several rounds of evalua-tion only found strong evidence in favor of the third,the management of opening/closing projects. This weconsider the “killer feature” of Contextinator. Thiswas verified in our multi-method evaluation as it wasroutinely mentioned in our several rounds of evalua-tion and confirmed by the online comments and thesurvey to the current users.
The management of multiple tabs in a ‘project’proved to be very valuable. Most users found thisidea so compelling that they ranked the managementof context switching within our tool the most valuablefeature. Being able to organize their activity with tabsand being able to stop and resume work seems to suc-cessfully address the fragmentation that naturally oc-curs on the web as users access multiple websites forinformation.
We realize that we failed to address informationfragmentation as it relates to users’ social circle. Sev-eral users wanted to be able to access the context in-formation from another computer 8. Participant U4(in stage one) used two computers (desktop and a lap-top) interchangeably, and wanted to be able to linkthem and have the same projects at both places.
In addition, two participants wanted to be able toshare their projects with groups of people, and be ableto accomplish tasks in a project together with theircollaborators. Clearly the information fragmentationis not just across information silos and devices, butalso across collaborators.
Thus, we can say that we solved the informationfragmentation that we set about to study only par-tially. The project management features were clearlywell received and might account for the broad use ofthe tool in the Chrome Web Store. Users liked beingable to group tabs as a single unit and being able tosave that group and reopened it later. The other set offeatures (e.g., integration of information with email,task and bookmarks) not only did not seem to getmuch comments, we found little evidence that usersused it.
6.1 Implications for Future Work
With our study we also gained insights into other ar-eas that might allow future researchers and develop-ers to better address the problems we explored. Wewould like focus on two of them here. First is theidea of what a user considers a ‘project.’ The secondis how ‘information views’ address information frag-mentation.
8This feature is now part of the tool
Contextinator�-�Project-based�Management�of�Personal�Information�on�the�Web
21

6.1.1 What is a project?
First, we provide some insight onto what users con-sider a ‘project.’ People have vastly different con-cepts as to what a ‘project’ is and designs of similartools should provide for this variability. A system thatseeks to improve support for knowledge work shouldbe able to blend in with this existing ecosystem oftools.
There is a wide variability of what users call aproject. Typically we consider a project as a set of re-lated activities with a particular goal in mind. But wefound that users have a much broader definition. Insome cases, users considered several ‘projects’ as allpart of the same task at hand, thus requiring multipleactive projects at once. In those cases, one or more ofthe projects were really collection of resources thatwere reused in similar tasks(e.g., having a projectwith reference websites for web development).
In addition, we have identified two types of‘projects’ based on why and when users create them.‘Preparatory’ projects are projects that allow users toorganize their work, including creating tasks to beperformed later in time. These projects are often cre-ated a priori of the work to be done. The second typeof project, ‘opportunistic,’ are projects that emergefrom work that is being done. These projects mightor might not have a specific goal, and instead emergefrom users’ work. Opportunistic projects seem to ben-efit from capturing the context of work for suspensionand resumption of work.
6.1.2 Information Views
The second lesson learned is how ‘information views’addresses the problem of information fragmentation.In our tool, we had three ways to integrate informa-tion.
The first and most simple form for informationviews to address information fragmentation is todevelop a program that actually supports multiplesources of information all into one service. We didthis for the collection of todos, bookmarks, and peo-ple. All of the information for those three categorieswere collected by our tool and stored locally in ourtool. The problem with this approach is one of adop-tion. In our data, we found that most users did notuse this feature. In the use logs that we captured, wefound that most users did not even configure this fea-ture.
The second approach, exemplified by our presen-tation of email in the project page, is to show enoughinformation from an external source without requiringgoing to other websites. This is the example used inthe web today of ‘content embedding.’ Google Maps,
for example, allows users and developers to embed amap view in other sites. Instead of having a link andrequiring navigation to another site/tool, the informa-tion is presented in place with some minor restric-tions. Our tool did this by presenting unread emailsin the context of a project. This approach requires ex-ternal services to provide access to their data via someAPI or protocol (e.g., IMAP access to email).
The last one and the one that holds the mostpromise is to make use of direct links to outside repos-itories thus providing in different tabs direct access torelated information. Our tool captured a direct linkin each project to an external service (e.g., a link to afolder in Dropbox). These links are then presented asshort-cuts in the project home page. But more inter-esting, within the context of the project, clicking ona generic top level to an external service is automati-cally redirected to the internal location for the project.The only requirement to integrate external tools withContextinator is to provide unique URLs to its inter-nal data.
These three approaches to building integrated in-formation views allow us to at least begin to addressthe information fragmentation that occurs on the web.A tool like Contextinator has the potential to create(or re-create) the context lost amid information frag-mentation in today’s web-based tools.
REFERENCES
Ahuja, A. (2013). Contextinator: Recreating the contextlost amid information fragmentation on the web. Mas-ters thesis, Department of Computer Science, VirginiaTech.
Allen, D. (2002). Getting Things Done: The Art of Stress-Free Productivity. Penguin Books.
Bellotti, V., Dalal, B., Good, N., Flynn, P., Bobrow, D. G.,and Ducheneaut, N. (2004). What a to-do: studiesof task management towards the design of a personaltask list manager. In Proc. CHI ’04, pages 735–742,New York, NY, USA. ACM.
Bellotti, V. and Smith, I. (2000). Informing the design of aninformation management system with iterative field-work. In Proc. DIS ’00, pages 227–237, New York,NY, USA. ACM.
Bergman, O., Bergman, O., Beyth-marom, R., and Nach-mias, R. (2003). The user-subjective approach topersonal information management systems. Journalof the American Society for Information Science andTechnology, 54:872–878.
Bergman, O., Beyth-Marom, R., and Nachmias, R. (2006).The project fragmentation problem in personal infor-mation management. In Proc. CHI ’06, pages 271–274, New York, NY, USA. ACM.
Boardman, R., Boardman, R., Spence, R., and Sasse, M. A.(2003). Too many hierarchies? the daily struggle for
WEBIST�2014�-�International�Conference�on�Web�Information�Systems�and�Technologies
22

control of the workspace. Proc. CHI ’96, pages 406–412.
Boardman, R. and Sasse, M. A. (2004). ”stuff goes into thecomputer and doesn’t come out”: a cross-tool study ofpersonal information management. In Proc CHI ’04,pages 583–590, New York, NY, USA. ACM.
Czerwinski, M., Horvitz, E., and Wilhite, S. (2004). A diarystudy of task switching and interruptions. In Proc.CHI ’04, pages 175–182. ACM.
Gonzalez, V. M. and Mark, G. (2004). ”constant, constant,multi-tasking craziness”: managing multiple workingspheres. In Proc. CHI ’04, pages 113–120, New York,NY, USA. ACM.
Hanrahan, B., Bouchard, G., Convertino, G., Weksteen, T.,Kong, N., Archambeau, C., and Chi, E. H. (2011).Mail2wiki: low-cost sharing and early curation fromemail to wikis. In Proc. C&T 2013, pages 98–107,New York, NY, USA. ACM.
Henderson, Jr., D. A. and Card, S. (1986). Rooms: the useof multiple virtual workspaces to reduce space con-tention in a window-based graphical user interface.ACM Trans. Graph., 5(3):211–243.
Jhaveri, N. and Raiha, K.-J. (2005). The advantages of across-session web workspace. In Proc. CHI EA ’05,pages 1949–1952, New York, NY, USA. ACM.
Jones, W. and Anderson, K. M. (2011). Many views,many modes, many tools ... one structure: Towardsa non-disruptive integration of personal information.In Proc. Hypertext 2011, pages 113–122, New York,NY, USA. ACM.
Jones, W., Klasnja, P., Civan, A., and Adcock, M. L. (2008).The personal project planner: planning to organizepersonal information. In Proc. CHI 2008, pages 681–684, New York, NY, USA. ACM.
Jones, W., Phuwanartnurak, A. J., Gill, R., and Bruce, H.(2005). Don’t take my folders away!: organizing per-sonal information to get ghings done. In Proc. CHI EA’05, pages 1505–1508, New York, NY, USA. ACM.
Karger, D. R. and Jones, W. (2006). Data unification inpersonal information management. Commun. ACM,49(1):77–82.
Kelly, D. and Teevan, J. (2007). Personal Information Man-agement, chapter Understanding What Works: Evalu-ating PIM Tools, pages 190–204. University of Wash-ington Press.
Mark, G., Gonzalez, V. M., and Harris, J. (2005). Notask left behind?: examining the nature of fragmentedwork. In Proc. CHI ’05, pages 321–330, New York,NY, USA. ACM.
Morris, D., Ringel Morris, M., and Venolia, G. (2008).Searchbar: a search-centric web history for task re-sumption and information re-finding. In Proc. CHI’08, pages 1207–1216, New York, NY, USA. ACM.
Rajamanickam, M. R., MacKenzie, R., Lam, B., and Su, T.(2010). A task-focused approach to support sharingand interruption recovery in web browsers. In Proc.CHI EA ’10, pages 4345–4350, New York, NY, USA.ACM.
Teevan, J., Alvarado, C., Ackerman, M. S., and Karger,D. R. (2004). The perfect search engine is not enough:
A study of orienteering behavior in directed search.In Proceedings of the SIGCHI Conference on HumanFactors in Computing Systems, CHI ’04, pages 415–422, New York, NY, USA. ACM.
Voida, S. and Mynatt, E. D. (2009). It feels better thanfiling: everyday work experiences in an activity-basedcomputing system. In Proc. CHI ’09, pages 259–268,New York, NY, USA. ACM.
Voida, S., Mynatt, E. D., and Edwards, W. K. (2008). Re-framing the desktop interface around the activities ofknowledge work. In Proc. UIST ’08, pages 211–220,New York, NY, USA. ACM.
Wang, Q. and Chang, H. (2010). Multitasking bar: pro-totype and evaluation of introducing the task conceptinto a browser. In Proc. CHI ’10, pages 103–112, NewYork, NY, USA. ACM.
Whittaker, S., Matthews, T., Cerruti, J., Badenes, H., andTang, J. (2011). Am i wasting my time organizingemail?: a study of email refinding. In Proc. CHI ’11,pages 3449–3458, New York, NY, USA. ACM.
Contextinator�-�Project-based�Management�of�Personal�Information�on�the�Web
23


SHORT PAPERS


SafeMash A Platform for Safety Mashup Composition
Carlo Marcelo Revoredo da Silva, Ricardo Batista Rodrigues, Rafael Roque de Souza and Vinicius Cardoso Garcia
Informatics Center, CIn, Federal University of Pernambuco, UFPE, Av. Jornalista Aníbal Fernandes, s/n, Cidade Universitária, Recife, Brazil {cmrs, rbr, rss4, vcg}@cin.ufpe.br
Keywords: Web Mashups, Security Policies, Information Flow.
Abstract: This article describes the SafeMash project, a platform that provides an environment for the construction, safe consumption and standardized of Mashups. The platform proposal is to offer functionalities focused in security aspects regarding the integration between web applications, the users and third parties APIs. Which is based in one specification to build an standardized Mashup. Those resources are based in security approaches specified by organizations such as OWASP and OpenMashup Alliance.
1 INTRODUCTION
With the advent of the Web 2.0, the content produced and published was no longer for only reading: now the users interact sharing information on sites and services that make the data available, making the web programmable, allowing that computers and humans work on a cooperative way (Governor et al., 2009).
In this context, arises the Mashups, applications able to combine existing functionalities, data and interfaces in order to reach a more complex goal. The data from heterogeneous sources are integrated, normally available through Web Services. The result of the integration of all service invocations may, for example, be presented in a site with usability resources, through technologies such as the Extensible Markup Language (XML) and Asynchronous Javascript and XML (Ajax) (Bozzon et al., 2009).
On the other hand, one of the obstacles is the lack of standardization, besides; problems related with security must also be highlighted. According to (Allen, 2001), we may relate Information Security with the protection of the set of information aimed to one organization or user, based in characteristics of Confidentiality, Integrity and Availability (CIA), being applied to all aspects of information and data protection.
Also according to (Allen, 2001), a Security
Policy represents a set of controls established and that must not be violated, in order to minimize vulnerabilities in APIs, preventing them from being exploited by attacks such as the Cross Site Script (XSS), which is defined as the possibility of malicious users to inject scripts in the client side, with huge consequences, such as for example changes on the graphic interface of the application, compromising the integrity of the content displayed (OWASP: XSS, 2013).
According to a group of researchers from the University of California at Berkeley, the lack of standardization of APIs is among the ten biggest obstacles to the adoption of Cloud Computing solutions (CN) (Armbrust et al., 2009).
Each Content Provider implements the API in its own way, causing problems of standardization and divergence between the security offered and desired. With this, the interfaces present with heterogeneity, which hinders the insertion of a Security Policy efficiently, making your users feel afraid to enter their information, to the extent that the data traffic are becoming increasingly valuable.
This article has the goal to describe a platform called SafeMash, presented as an architectural model that may be applied in any domain that wishes to execute Mashup compositions. The proposal is to make available an environment for three main objectives: (i) sanitize input and output data between parties involved at Mashup consumption, (ii) where users can build Mashup with standard specification,
27
and (iii) analyse the compliance of security policies intended by Mashup services.
This work is presented with the following structure: in the section 2, security questions in a standard Mashup environment are described; in the section 3 the proposal of our methodology is presented, and parcial result of an objective of our proposal. Finally, in the section 4 final conclusions and future goals are described.
2 MASHUP ECOSYSTEM AND SECURITY ISSUES
The work is focused in the communication flow between Mashups and other parties involved. For a better understanding of the problem, this information flow will be described, in this section, being represented as an ecosystem. And finally, the goal is to research some relevant aspects about information security in those scenarios.
2.1 The Mashup Ecosystem
The goal of Mashups is to collect several data through one or more APIs, which are inherent to third party services, known as Content Providers (CP). Those data will be transformed in a combined content, which will be presented as an answer to the Mashup Consumer (MC) requisition. As an example scenario, the MC may be a web application that requires content through a specification made available by the Mashup site and waits, as an answer, a graphic, functional component, adaptable to its graphic interface.
Therefore, being able to interact with user and application, this kind of component is called a Widget (Wilson et al., 2012). In Figure 1, a workflow of a Mashup ecosystem is illustrated, where the application makes a requisition and receives, as the answer, a Widget.
2.1.1 The Consumer
For a better understanding, consider that the web application in the example is a webmail, that has in its first page a widget that presents itself to the user as a calendar, coming from an external service called MashCalendar, which is used by the user to manage its appointments.
The webmail makes available a section where the user configures the widget, informing its access credentials to the MashCalendar service. After confirming the sending of information, the user is
redirected for the main page. It is in this moment that the webmail starts its role as a Mashup consumer.
2.1.2 The Intermediate
Following the flow, the webmail will communicate through a specification based interface (Mashup specification), previously agreed by the managers of the MashCalendar service and will demand the calendar for the Mashup application of the MashCalendar, which will make requisitions with one or more CP distributed in the web.
For each CP, it will be an obligation of the Mashup application, that is, of MashCalendar managers, the implementation of the communication with each CP respective API.
2.1.3 The Third-Party
Each CP will answer its requisition with a given data. For example, the application Mashup will demand information of national or regional holidays, maps describing the location and transit on the user displacement to each scheduled meeting, among other information. Because of that, the Mashup site will combine those answers, generating this way the content that the webmail application waits as an answer, which will result the calendar with the appointments scheduled by the user.
2.2 Security Issues
Based in this example is possible to consider some worrying aspects in relation to Security. The first is when the user gives to the webmail his MashCalendar credentials, which will need to make available for the webmail a specification that allows reliability and integrity of the information that will flow.
An important aspect is related to the answer that will be generated by MashCalendar, the webmail must be sure that it will not bring information and behaviors that might harm the user. Such as XSS or other attacks such as: Cross Site Request Forgery (CSRF), which consists in inserting malicious requisitions in a browser session opened by the user, allowing it to be stolen, and in that way compromising its credential confidentiality (OWASP: CSRF, 2013). Another potential attack vector for environments with graphical user interface is an attack known as clickjacking, is when an attacker uses multiple transparent or opaque layers that overlap one form to trick the user had the intention of clicking a link or button that is overlaid
WEBIST�2014�-�International�Conference�on�Web�Information�Systems�and�Technologies
28
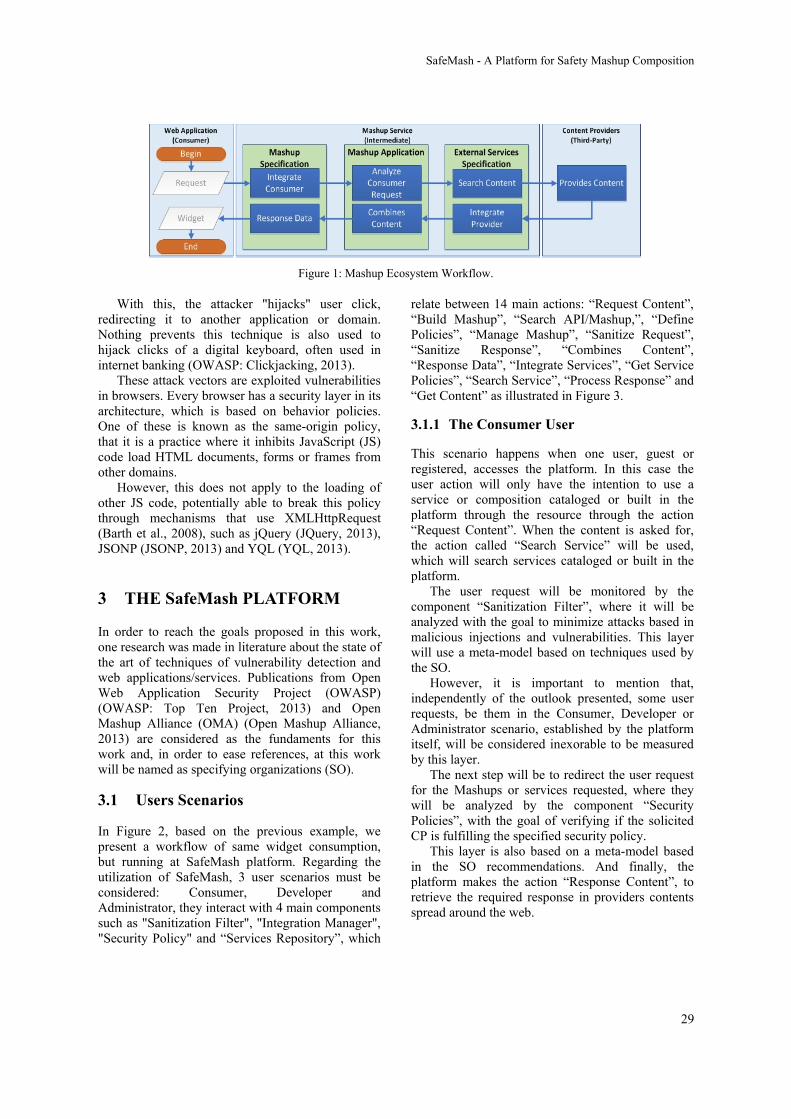
Figure 1: Mashup Ecosystem Workflow.
With this, the attacker "hijacks" user click, redirecting it to another application or domain. Nothing prevents this technique is also used to hijack clicks of a digital keyboard, often used in internet banking (OWASP: Clickjacking, 2013).
These attack vectors are exploited vulnerabilities in browsers. Every browser has a security layer in its architecture, which is based on behavior policies. One of these is known as the same-origin policy, that it is a practice where it inhibits JavaScript (JS) code load HTML documents, forms or frames from other domains.
However, this does not apply to the loading of other JS code, potentially able to break this policy through mechanisms that use XMLHttpRequest (Barth et al., 2008), such as jQuery (JQuery, 2013), JSONP (JSONP, 2013) and YQL (YQL, 2013).
3 THE SafeMash PLATFORM
In order to reach the goals proposed in this work, one research was made in literature about the state of the art of techniques of vulnerability detection and web applications/services. Publications from Open Web Application Security Project (OWASP) (OWASP: Top Ten Project, 2013) and Open Mashup Alliance (OMA) (Open Mashup Alliance, 2013) are considered as the fundaments for this work and, in order to ease references, at this work will be named as specifying organizations (SO).
3.1 Users Scenarios
In Figure 2, based on the previous example, we present a workflow of same widget consumption, but running at SafeMash platform. Regarding the utilization of SafeMash, 3 user scenarios must be considered: Consumer, Developer and Administrator, they interact with 4 main components such as "Sanitization Filter", "Integration Manager", "Security Policy" and “Services Repository”, which
relate between 14 main actions: “Request Content”, “Build Mashup”, “Search API/Mashup,”, “Define Policies”, “Manage Mashup”, “Sanitize Request”, “Sanitize Response”, “Combines Content”, “Response Data”, “Integrate Services”, “Get Service Policies”, “Search Service”, “Process Response” and “Get Content” as illustrated in Figure 3.
3.1.1 The Consumer User
This scenario happens when one user, guest or registered, accesses the platform. In this case the user action will only have the intention to use a service or composition cataloged or built in the platform through the resource through the action “Request Content”. When the content is asked for, the action called “Search Service” will be used, which will search services cataloged or built in the platform.
The user request will be monitored by the component “Sanitization Filter”, where it will be analyzed with the goal to minimize attacks based in malicious injections and vulnerabilities. This layer will use a meta-model based on techniques used by the SO.
However, it is important to mention that, independently of the outlook presented, some user requests, be them in the Consumer, Developer or Administrator scenario, established by the platform itself, will be considered inexorable to be measured by this layer.
The next step will be to redirect the user request for the Mashups or services requested, where they will be analyzed by the component “Security Policies”, with the goal of verifying if the solicited CP is fulfilling the specified security policy.
This layer is also based on a meta-model based in the SO recommendations. And finally, the platform makes the action “Response Content”, to retrieve the required response in providers contents spread around the web.
SafeMash�-�A�Platform�for�Safety�Mashup�Composition
29

Figure 2: Mashup Ecosystem Workflow at SafeMash Platform.
Figure 3: The main components and actions of SafeMash Architecture.
3.1.2 The Developer User
This scenario happens when the platform is accessed by a registered user that wishes to create a Mashup. Available to the user is a control panel that offers basically three actions:
The first action allows the user to build its Mashup, where it is possible to insert syntaxes through the action named “Build Mashup”, making use of the component “Integration Manager”, with syntaxes according the specification Enterprise Markup Mashup Language (EMML), created by the OMA, based in XML, with the intention to make the creation of Mashups more homogeneous.
The second action allows the user to search for available CPs through the action “Search API/Mashup”, where the user may perform a semantic filtering and search for contents, catalogued in the component “Services Repository”, that it wishes to use to compose its Mashup. These are then interpreted into action “Integrate Services”.
In this stage, it is also possible to make restrictions in which the user will specify which security resources might be considered. From this, the platform will use the component “Security Policy” in order to filter by Mashups or APIs that fulfill the specified resources. The third action allows the user to attribute a set of policies in its own Mashups, through the action “Define Policies”. In this context, it will specify all security resources applied to its composition. This information will later be analyzed and tested by the platform administrators.
3.1.3 The Administrator User
An administrator is a user with privileges to perform an analysis through the action “Manage Mashup” in each composition created by a Mashup developer. From that analysis, the proposed composition will be released or not to the public, through the component “Security Policies”.
This practice will contribute to other users, that in the future will consume, to have knowledge about
WEBIST�2014�-�International�Conference�on�Web�Information�Systems�and�Technologies
30
which security aspects are being considered by it, thus characterizing the environment of continuous security and standardization control.
3.2 Proposal Goals
In this section, we present some practices applied on the platform, which are directed to reach 3 desired goals by our proposal.
3.2.1 Sanitize Input/Output Flow
As a practical approach, we use a development release of our component "Sanitization Filter", in order to observe the impacts to be considered when it is inserted in real environments.
We develop a simple mashup that consumes a service through the Yahoo! Weather API (Yahoo! Weather, 2013), with parameter WOEID assuming the value 26802884 (City of Recife), where our component, through action "Sanitize Response," do a read from a byte array that represents the content as response.
Upon receiving this response, called the Mashup our component that makes a filter removing possible threats in response, for example, XSS, CSRF and Clickjacking techniques as described in Table 1, and Table 2 is an example of XSS attack using one of the techniques mentioned above.
Table 1: Some techniques applied to detect vulnerabilities.
Threat Behavior
XSS
Malicious JS codes and tags; suspect code at JSON
data blocks; HTML and URI encodeds; Inadequate
uses of eval() or JSON.parse() functions;
Clickjacking Malicious embed JS;
Overlap suspect elements
CSRF HTTP headers suspects; Tags IMG with suspect values in “src” attribute.
Table 2: An example of XSS attack using HTML/HEX encoding.
<script& #x3E;alert
('XSS')& #x3B;</scri
pt>
3.2.2 Standardize Composition
The Platform users have at their disposal a set of tools, such as drag and drop elements, a declarative
language, besides a wizard composition, which will be responsible for any abstract complexity in the development of a Mashup, through action "integrate Services ", and consumption, through action" Combines Content ".
All content of the presentation layer will be transformed into EMML, bringing an oblique language between the control layer and presentation platform. The component "Specification Notation" will be responsible for performing validations syntax and operations EMML conversions in the code, resulting in a more specific language for the domain logic platform.
3.2.3 Promote Security Policies
The users themselves will describe what type of security practices should engage external services, such as the developer can define, through action "Define Policies" which a particular content of your Mashup can only be consumed from external service to perform the traffic content through https, or Customer may request, through the action "Get service Policies", the content at issue must be from an external service that has a well-structured policy which is committed to ensuring privacy in data traffic.
All these settings users will be managed by the component "Security Policy", and will be periodically evaluated by the Administrators of the platform, through the action "Manage Mashup".
4 CONCLUSIONS
In this article we present an environment ecosystem Mashups, describing benefits and purposes, as well as their weaknesses regarding security issues and the lack of standardization in these environments.
As proposal, we present a platform with the objective of minimizing the obstacles addressed. Currently, the proposal is in the implementation stage of its main components and documentation of architectural decisions.
As future works, the intention is to present the main non-functional requirements that must be fulfilled by the platform, in order to define the main functionalities. For the formal documentation the intention is to have Use Case Diagrams, which according to (Fowler, 2003), describe functionalities through diagrams with Unified Modeling Language (UML) notation, and that has the objective to elaborate a documentation describing functionalities in a graphic and intuitive way.
SafeMash�-�A�Platform�for�Safety�Mashup�Composition
31
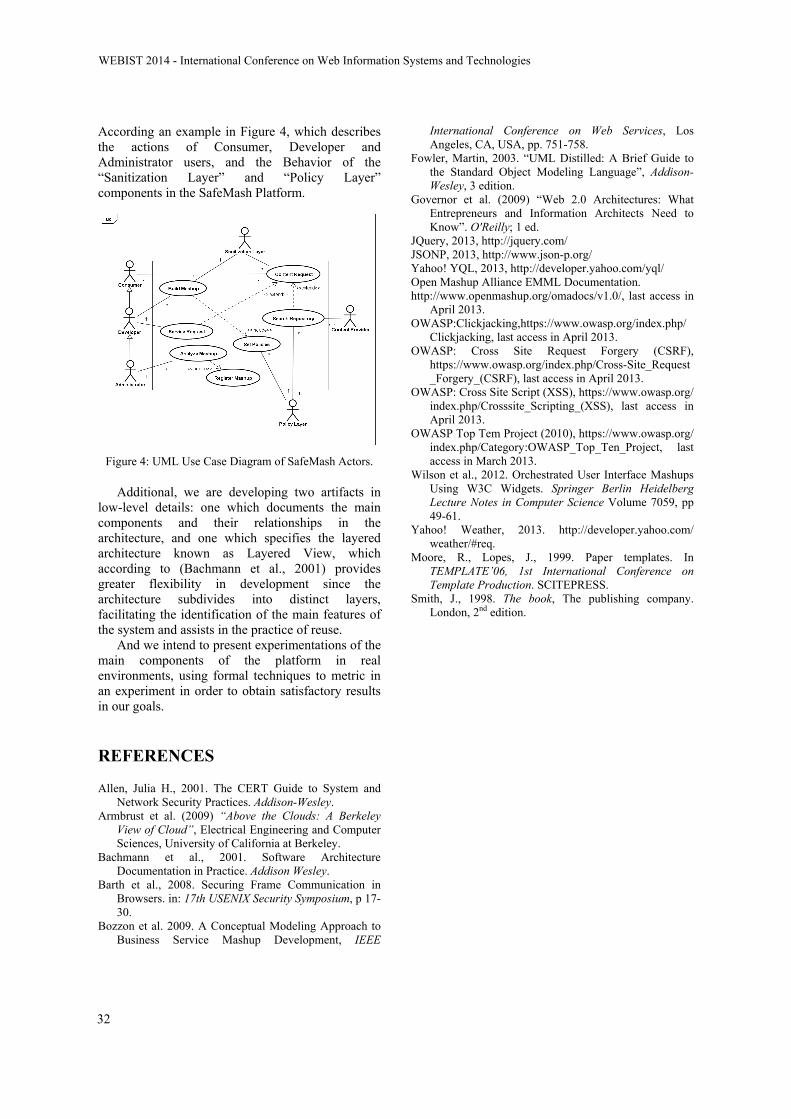
According an example in Figure 4, which describes the actions of Consumer, Developer and Administrator users, and the Behavior of the “Sanitization Layer” and “Policy Layer” components in the SafeMash Platform.
Figure 4: UML Use Case Diagram of SafeMash Actors.
Additional, we are developing two artifacts in low-level details: one which documents the main components and their relationships in the architecture, and one which specifies the layered architecture known as Layered View, which according to (Bachmann et al., 2001) provides greater flexibility in development since the architecture subdivides into distinct layers, facilitating the identification of the main features of the system and assists in the practice of reuse.
And we intend to present experimentations of the main components of the platform in real environments, using formal techniques to metric in an experiment in order to obtain satisfactory results in our goals.
REFERENCES
Allen, Julia H., 2001. The CERT Guide to System and Network Security Practices. Addison-Wesley.
Armbrust et al. (2009) “Above the Clouds: A Berkeley View of Cloud”, Electrical Engineering and Computer Sciences, University of California at Berkeley.
Bachmann et al., 2001. Software Architecture Documentation in Practice. Addison Wesley.
Barth et al., 2008. Securing Frame Communication in Browsers. in: 17th USENIX Security Symposium, p 17-30.
Bozzon et al. 2009. A Conceptual Modeling Approach to Business Service Mashup Development, IEEE
International Conference on Web Services, Los Angeles, CA, USA, pp. 751-758.
Fowler, Martin, 2003. “UML Distilled: A Brief Guide to the Standard Object Modeling Language”, Addison-Wesley, 3 edition.
Governor et al. (2009) “Web 2.0 Architectures: What Entrepreneurs and Information Architects Need to Know”. O'Reilly; 1 ed.
JQuery, 2013, http://jquery.com/ JSONP, 2013, http://www.json-p.org/ Yahoo! YQL, 2013, http://developer.yahoo.com/yql/ Open Mashup Alliance EMML Documentation. http://www.openmashup.org/omadocs/v1.0/, last access in
April 2013. OWASP:Clickjacking,https://www.owasp.org/index.php/
Clickjacking, last access in April 2013. OWASP: Cross Site Request Forgery (CSRF),
https://www.owasp.org/index.php/Cross-Site_Request _Forgery_(CSRF), last access in April 2013.
OWASP: Cross Site Script (XSS), https://www.owasp.org/ index.php/Crosssite_Scripting_(XSS), last access in April 2013.
OWASP Top Tem Project (2010), https://www.owasp.org/ index.php/Category:OWASP_Top_Ten_Project, last access in March 2013.
Wilson et al., 2012. Orchestrated User Interface Mashups Using W3C Widgets. Springer Berlin Heidelberg Lecture Notes in Computer Science Volume 7059, pp 49-61.
Yahoo! Weather, 2013. http://developer.yahoo.com/ weather/#req.
Moore, R., Lopes, J., 1999. Paper templates. In TEMPLATE’06, 1st International Conference on Template Production. SCITEPRESS.
Smith, J., 1998. The book, The publishing company. London, 2nd edition.
WEBIST�2014�-�International�Conference�on�Web�Information�Systems�and�Technologies
32

GeoSPARQL Query Tool A Geospatial Semantic Web Visual Query Tool
Ralph Grove1, James Wilson2, Dave Kolas3 and Nancy Wiegand4 1Department of Computer Science, James Madison University, Harrisonburg, Virginia, U.S.A.
2Department of Integrated Science and Technology, James Madison University, Harrisonburg, Virginia, U.S.A. 3Raytheon BBN Technologies, Columbia, Maryland, U.S.A.
4Space Science and Engineering Center, University of Wisconsin, Madison, Wisconsin, U.S.A. [email protected], [email protected], [email protected], [email protected]
Keywords: Semantic Web, Geographic Information Systems, GeoSPARQL, SPARQL, RDF.
Abstract: As geospatial data are becoming more widely used through mobile devices and location sensitive applications, the potential value of linked open geospatial data in particular has grown, and a foundation is being developed for the Semantic Geospatial Web. Protocols such as GeoSPARQL and stSPARQL extend SPARQL in order to take advantage of spatial relationships inherent in geospatial data. This paper presents GeoQuery, a graphical geospatial query tool that is based on Semantic Web technologies. GeoQuery presents a map-based user interface to geospatial search functions and geospatial operators. Rather than using a proprietary geospatial database, GeoQuery enables queries against any GeoSPARQL endpoint by translating queries expressed via its graphical user interface into GeoSPARQL queries, allowing geographic information scientists and other Web users to query linked data without knowing GeoSPARQL syntax.
1 INTRODUCTION
The Semantic Web has the potential to greatly increase the usability of publicly available data by allowing access to open data sets in linked format over the Web. W3C standards such as RDF (Manola 2004) and SPARQL (Prud’hommeaux, 2008) enable standard access to data stored in triple stores that are accessible over the Web at SPARQL endpoints. The Linked Open Data (Bizer, 2009) movement adds best practices for publishing data in order to maximize availability and usability.
As geospatial data are becoming more widely used through mobile devices and location sensitive applications, the potential value of linked open geospatial data in particular has grown, and a foundation is being developed for the Semantic Geospatial Web (Egenhofer, 2002). Protocols such as GeoSPARQL (Perry, 2010) and stSPARQL (Kyzirakos, 2012) extend SPARQL, the standard RDF Semantic Web query language, in order to take advantage of spatial relationships inherent in geospatial data.
In this paper we present the GeoSPARQL Query
Tool (GeoQuery)1, a graphical geospatial query tool that is based on Semantic Web technologies. GeoQuery translates queries expressed through its graphical user interface into GeoSPARQL queries, which can then be executed against any GeoSPARQL endpoint. With GeoQuery, geographic information scientists can query linked data and see map output without knowing GeoSPARQL syntax.
1.1 Motivation
The availability of linked open geospatial data and the Semantic Web will offer the potential for enhancing the value of geospatial data to the user in several ways.
Data Search and Discovery: Semantic Web protocols could be used to dynamically discover and examine geospatial datasets over the Web, so that newly created or revised datasets will be of immediate value. The geospatial features of GeoSPARQL could also allow spatial operations to be incorporated into queries over metadata contained in catalogs of available open data during
___________________________________________________________________________________
1 http://geoquery.cs.jmu.edu
33
a search. Integration of Data Sets: SPARQL provides the
ability to integrate data services within queries, so that a user can perform logical queries of data from multiple servers without regard to the details of accessing multiple datasets and their respective formats. One query, for example, might perform spatial operations on data obtained from an open map service, a public repository, and a corporate data store.
Potential Applications of Semantic Web Technologies: Beyond direct geospatial queries (e.g., show me what public buildings exist with the bounds of this city), techniques associated with the Semantic Web such as ontological reasoning and machine intelligence offer the potential for smarter user interfaces that can anticipate queries and integrate geospatial reasoning into emerging technologies such as automated vehicles and location aware phones.
The last ten years have seen tremendous growth in the development and utilization of the Internet in Geographic Information Systems (GIS). This growth is taking place in standard desktop software that is able to access geospatial data, maps, and geoprocessing services through the Internet, as well as web-based frontends to these same Internet based resources.
Currently, geospatial data are just starting to be represented in RDF (e.g., Varanka, 2012, and work by the Ordnance Survey), and the full potential of geospatial data available over the Web has yet to be realized. Open standards such as those developed by the Open Geospatial Consortium (OGC)2 have played an important role in facilitating these developments. Most of these developments have been an evolution of existing GIS technologies, with only minor explorations into semantic technologies. The most successful developments have been in simplifying the access to distributed environments, allowing non-specialists to take advantage of mapping on the Internet. The small forays into geospatial semantics on the Internet have mostly been useable only by experts.
Conventional GIS allow users to explore, via a graphical user interface, datasets that are stored in proprietary or specialized data storage formats. Now, with linked data in RDF, the data representation format is open and standard. The GeoSPARQL query language is a new standard with which anyone can pose queries to data over a
___________________________________________________________________________________
2 http://www.opengeospatial.org/
provided web-based endpoint. However, SPARQL and GeoSPARQL queries are not easy to write correctly without training. Prior attempts to overcome the difficulty of learning SPARQL include, for example, a visual SPARQL editor (Collustra, 2013). It might also be possible to approach this problem through a natural language interface to GeoSPARQL queries. However, natural language processing remains a difficult, not completely solved problem.
GeoQuery is a first step towards developing a universal query tool for the Geospatial Semantic Web. GeoQuery demonstrates that it is feasible to execute geospatial queries based upon the Semantic Web infrastructure using a graphical user interface. This ability is of value to geospatial professionals who need access to the data but are not trained in Semantic Web technologies. Because GeoSPARQL queries are viewable in GeoQuery, users can also learn about the GeoSPARQL language.
2 RELATED WORK
The Ordnance Survey in Great Britain pioneered Semantic Web work for geospatial data, including the use of linked data (e.g., The Linked Data Web, 2013) and the building of geospatial ontologies (e.g., Denaux et al., 2011). The Ordnance Survey held the first Terra Cognita geospatial workshop at the 2006 International Semantic Web Conference (ISWC) to add spatial data to the Semantic Web. The Spatial Ontology Community of Practice (SOCoP), along with others, have continued the series with the fifth one (Terra Cognita, 2012) being held with ISWC 2012.
In the United States, the Geological Survey (USGS) is doing work on linked data and ontologies (Geospatial Semantics and Ontology, 2013), including a recent workshop (Varanka, 2012). The USGS has translated some of The National Map data into RDF format. Transferring spatial data into RDF is a new area that the authors are also working on. Meanwhile, to handle nonspatial RDF data, leading database companies, such as Oracle and DB2, have added RDF storage and processing to their relational database systems e.g., (Das et al., 2004, Ma et al., 2008). Because query processing of geospatial data in RDF is still new, Garbis et al. (2013) recently developed a benchmark to judge the performance of several RDF stores for geospatial querying. The database community is also interested in temporal aspects of the Semantic Web, and a bibliography has
WEBIST�2014�-�International�Conference�on�Web�Information�Systems�and�Technologies
34
been compiled that also includes spatial references (Grandi, 2012).
Koubarakis et al. (2012) delineate areas of research for linked geospatial data, of which one area is user interfaces. They pose questions as to whether user interfaces should be based on natural language or be graphical, what high level APIs would ease rapid development, and whether interfaces could be built using existing platforms such as Google Maps, Bing Maps, or OpenStreetMap. In our work, we developed a graphical interface and used OpenStreetMap and Web Map Service for map display.
Our work uses the GeoSPARQL model as an extension to SPARQL. There is another spatial extension to SPARQL, stSPARQL, which is implemented in Strabon (Kyzirakos, 2012). Strabon extends Sesame, which has the ability to have PostGIS as a backend DBMS and spatial query processor. stSPARQL and GeoSPARQL do not overlap perfectly in functionality: stSPARQL includes aggregate functions and update capabilities (without which stSPARQL is a subset of GeoSPARQL), while GeoSPARQL includes an ontology and allows for topological relations as triples. A query language in addition to SPARQL and stSPARQL that incorporates spatial considerations is SPOTL (SPO + Time and Location) in the YAGO2 project (Hoffart et al., 2012). Time and location of facts are represented through reification.
3 SEMANTIC WEB TECHNOLOGIES FOR GEOSPATIAL DATA
Most early efforts to add geospatial data to the Semantic Web focused on very simple geospatial data, i.e., points represented by latitude and longitude. The W3C Geo ontology is popular for representing such points. Though this is sufficient for many domains and use cases, more complicated geospatial domains require the ability to use multiple coordinate systems and to store polygons and other shapes. This led to development of GeoSPARQL and its support in Parliament (see section 3.2).
3.1 GeoSPARQL
GeoSPARQL provides a unifying vocabulary for geospatial data on the Semantic Web. GeoSPARQL has two key parts: a small ontology for representing
geospatial entities, and a set of query functions for processing relationships between the geospatial entities. The ontology is derived from well-used and well-understood concepts from the OGC and uses much of the same terminology as other OGC standards. The ontology is intentionally small so that it can be easily understood and easily attached to an appropriate domain ontology.
There are two key classes in the GeoSPARQL ontology: Feature and Geometry. A Feature is simply any entity (physical or abstract) with some spatial location. This could be a park, airport, monument, restaurant, etc. A Geometry is any geometric shape, such as a point, polygon, or line, and is used as a representation of a feature’s spatial location. A third class, SpatialObject, is a superclass of both Feature and Geometry.
A Feature has only one primary property, hasGeometry. This property links the Feature to a Geometry that represents where it is in space. A Feature can have multiple Geometries, in which case it may specify one of these as the defaultGeometry to be used for spatial reasoning.
A Geometry has a number of properties, but the most important ones are those that relate the Geometry to a concrete spatial representation. These are asWKT and asGML, depending on whether the representation is in Well Known Text (WKT) (Open Geospatial Consortium, 2011) or Geography Markup Language (GML)3 respectively. The properties point to an RDF literal with a data type of wktLiteral or gmlLiteral. Within these literals are the points that delineate the geometry: for example, the corners of a polygon.
The general usage of this ontology is to attach it to the ontology of the domain. If a domain ontology includes classes with relevant geospatial locations, those classes are declared subclasses of Feature. In this way they inherit the hasGeometry property and its link to the Geometry class.
The query functions in GeoSPARQL are used to relate the Features and Geometries to one another. The functions include binary topological relationships, set combinations of Geometries (ex. union, intersection), and other calculations such as distance. When possible, GeoSPARQL provides multiple sets of terminology for these functions. For example, the topological relations can be expressed in the terminology of the 9-intersection model (Egenhofer, 1990), RCC-8 (Randell, 1992), or OGC Simple Features (Open Geospatial Consortium, 2011). While implementations of GeoSPARQL do ___________________________________________________________________________________
3 http://www.opengeospatial.org/standards/gml
GeoSPARQL�Query�Tool�-�A�Geospatial�Semantic�Web�Visual�Query�Tool
35

not have to support all of these vocabularies, it is expected that most will. The binary Boolean topological relations can be expressed as either functions in a FILTER clause or as triples between SpatialObjects.
The following is an example of a GeoSPARQL query, which looks for monuments within parks, where both classes are subclasses of Feature. For more detailed examples see the GeoSPARQL specification (Perry, 2010) or (Battle, 2012). (The prefix “geo:” in this example refers to www.opengis.net/ont/geosparql, while the prefix “ex:” refers to an arbitrary example domain.)
SELECT ?m ?p WHERE{ ?m a ex:Monument ; geo:hasGeometry ?mgeo . ?p a ex:Park ; geo:hasGeometry ?pgeo . ?mgeo geo:within ?pgeo . }
3.2 Parliament
Parliament4 is an open-source RDF triple store (Figure 1). The outer layers are based on the open-source RDF toolkit Jena5, which connects to a novel indexing scheme for RDF triples (Kolas 2009). Parliament provides a SPARQL endpoint for storing and querying RDF triples.
Figure 1: Parliament Architecture.
As the importance of the Geospatial Semantic Web grew, Parliament added spatial and temporal indexing. Initially this was a purely in-memory index designed as a proof of concept. It used OWL-Time6 and an ontology based on GeoRSS7 as the vocabularies for indexing. More recently the indices ___________________________________________________________________________________
4 http://parliament.semwebcentral.org/ 5 http://jena.apache.org/ 6 http://www.w3.org/TR/owl-time/ 7 http://www.georss.org
were updated to be persistent. The spatial index can use either an R-tree implementation or an external instance of Postgres. The temporal index uses Berkeley DB. The result is the ability to store and query spatial and temporal RDF efficiently. As the GeoSPARQL standard matured, Parliament was updated to include support for the standard.
4 GeoQuery
GeoQuery is being developed to provide GIS professionals an easy way to explore geospatial semantics in a familiar mapping interface, and to provide the ability to see how the semantics queries are actually built and executed.
The user interface is similar to many web-based mapping sites, where the user can turn layers on and off, and navigate around the map by panning and zooming. The interface also includes the ability to execute two separate queries using pick lists and text boxes, and to perform spatial operations on the results of the two queries. The onscreen areas for performing these operations have separate colors, and the results for each operation are displayed on the map with the same color to make it easy to identify the results for each operation.
Because one of the design goals of GeoQuery was to help explain GeoSPARQL, the full text of each GeoSPARQL query is saved and all of the query text can be viewed at any time.
The GeoSPARQL endpoint we are using for development is an instance of Parliament that has been populated with vector data extracted from the USGS National Map8. The data was extracted using the boundaries of the Shenandoah River (Virginia, USA) watershed, and was converted from an ESRI Personal Geodatabase to .N3 files using a custom tool developed by the USGS9.
4.1 Design and Operation
Development of GeoQuery began by establishing a set of six general use cases that were gathered by examining example queries from literature. Development followed a prototyping process, the starting point for which was a tool for visualizing GeoSPARQL query results developed by the USGS. The ultimate user interface was developed with the ___________________________________________________________________________________
8 See “Prodxucts and Services” at http://nationalmap.gov/index.html
9 USGS NationalMap2RDF conversion tool: http://cegis.usgs.gov/ontology_userguide.html
WEBIST�2014�-�International�Conference�on�Web�Information�Systems�and�Technologies
36
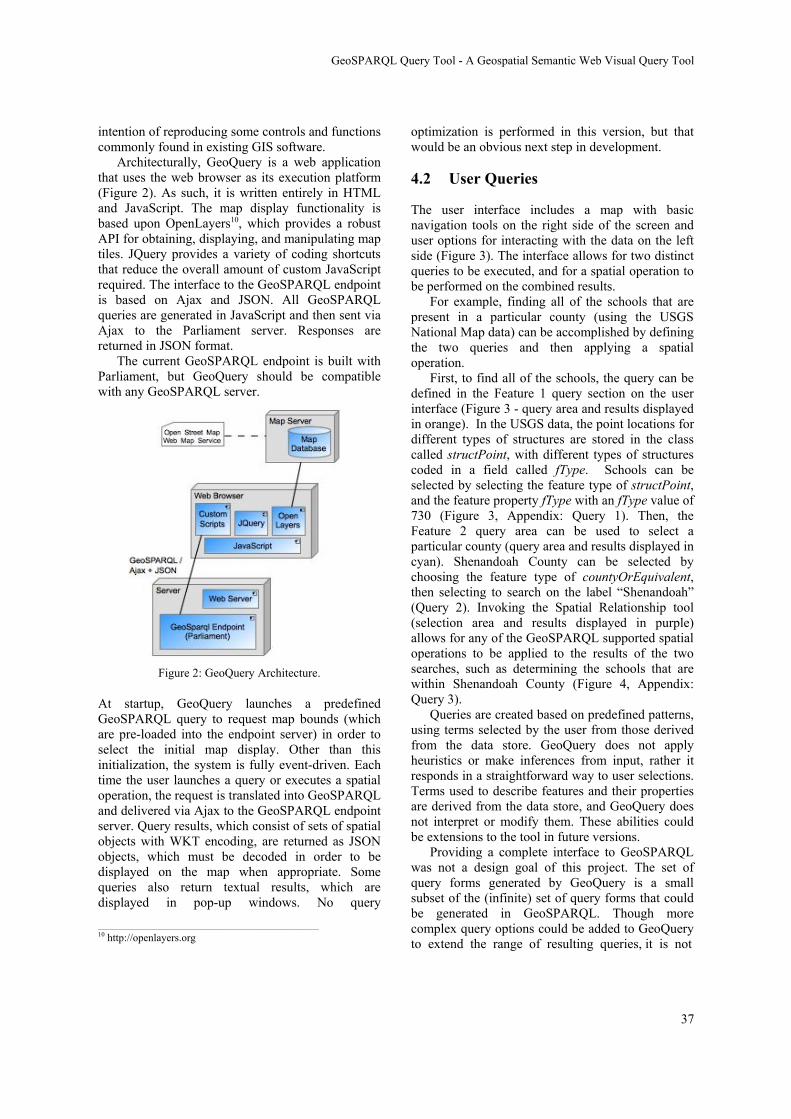
intention of reproducing some controls and functions commonly found in existing GIS software.
Architecturally, GeoQuery is a web application that uses the web browser as its execution platform (Figure 2). As such, it is written entirely in HTML and JavaScript. The map display functionality is based upon OpenLayers10, which provides a robust API for obtaining, displaying, and manipulating map tiles. JQuery provides a variety of coding shortcuts that reduce the overall amount of custom JavaScript required. The interface to the GeoSPARQL endpoint is based on Ajax and JSON. All GeoSPARQL queries are generated in JavaScript and then sent via Ajax to the Parliament server. Responses are returned in JSON format.
The current GeoSPARQL endpoint is built with Parliament, but GeoQuery should be compatible with any GeoSPARQL server.
Figure 2: GeoQuery Architecture.
At startup, GeoQuery launches a predefined GeoSPARQL query to request map bounds (which are pre-loaded into the endpoint server) in order to select the initial map display. Other than this initialization, the system is fully event-driven. Each time the user launches a query or executes a spatial operation, the request is translated into GeoSPARQL and delivered via Ajax to the GeoSPARQL endpoint server. Query results, which consist of sets of spatial objects with WKT encoding, are returned as JSON objects, which must be decoded in order to be displayed on the map when appropriate. Some queries also return textual results, which are displayed in pop-up windows. No query
___________________________________________________________________________________
10 http://openlayers.org
optimization is performed in this version, but that would be an obvious next step in development.
4.2 User Queries
The user interface includes a map with basic navigation tools on the right side of the screen and user options for interacting with the data on the left side (Figure 3). The interface allows for two distinct queries to be executed, and for a spatial operation to be performed on the combined results.
For example, finding all of the schools that are present in a particular county (using the USGS National Map data) can be accomplished by defining the two queries and then applying a spatial operation.
First, to find all of the schools, the query can be defined in the Feature 1 query section on the user interface (Figure 3 - query area and results displayed in orange). In the USGS data, the point locations for different types of structures are stored in the class called structPoint, with different types of structures coded in a field called fType. Schools can be selected by selecting the feature type of structPoint, and the feature property fType with an fType value of 730 (Figure 3, Appendix: Query 1). Then, the Feature 2 query area can be used to select a particular county (query area and results displayed in cyan). Shenandoah County can be selected by choosing the feature type of countyOrEquivalent, then selecting to search on the label “Shenandoah” (Query 2). Invoking the Spatial Relationship tool (selection area and results displayed in purple) allows for any of the GeoSPARQL supported spatial operations to be applied to the results of the two searches, such as determining the schools that are within Shenandoah County (Figure 4, Appendix: Query 3).
Queries are created based on predefined patterns, using terms selected by the user from those derived from the data store. GeoQuery does not apply heuristics or make inferences from input, rather it responds in a straightforward way to user selections. Terms used to describe features and their properties are derived from the data store, and GeoQuery does not interpret or modify them. These abilities could be extensions to the tool in future versions.
Providing a complete interface to GeoSPARQL was not a design goal of this project. The set of query forms generated by GeoQuery is a small subset of the (infinite) set of query forms that could be generated in GeoSPARQL. Though more complex query options could be added to GeoQuery to extend the range of resulting queries, it is not
GeoSPARQL�Query�Tool�-�A�Geospatial�Semantic�Web�Visual�Query�Tool
37

Figure 3: Schools.
Figure 4: Schools within Shenandoah County.
clear that completeness could be gained without exposing the user to elements of GeoSPARQL syntactic structure, which is counter to the design goals. Instead, we have provided an interface to support commonly used types of queries.
5 CONCLUSIONS
This work illustrates how a geospatial query tool can be successfully implemented based on Semantic
WEBIST�2014�-�International�Conference�on�Web�Information�Systems�and�Technologies
38

Web technologies such as RDF, SPARQL, and GeoSPARQL. Users can effectively query an RDF geospatial database over the Web, execute spatial operators on the results, and then visualize the results on a map in a familiar format, without knowing a formal query language. This is a first step towards bringing the value of the Semantic Web and open data to geospatial data and users. GeoQuery is an integral step in provided needed query access to the Geospatial Semantic Web.
The current GeoQuery tool is an initial proof of concept. The tool could be improved by replacing USGS National Map URIs and codes with more user-understandable synonyms. We used RDF data directly from The National Map and did not re-code it to be understandable by the general user. This is a limitation of using data directly converted to RDF, but adding definitions or links to ontologies is beyond the scope of this project. The innovation of our work is to take a new paradigm (RDF and GeoSPARQL) and make the data and querying accessible to any Web user using a graphical interface.
Testing to improve the tool could include formal user testing, testing of the tool against other SPARQL endpoints, testing with multiple endpoints simultaneously, and comparing its use against conventional tools. Additional extensions of the tool could include query optimization, the addition of more complex query forms through additional user interface options, and automatic clustering of results. We are also working on methods to automate converting general spatial data to RDF to make more spatial data accessible and to further test the tool.
ACKNOWLEDGEMENTS
A This work was partially supported by the National Science Foundation’s Office of Cyberinfrastructure (OCI), INTEROP Grant No. 0955816.
Early versions of GeoQuery were based in part on a prototype query tool developed by USGS
REFERENCES
Battle, R., Kolas, D., 2012. Enabling the Geospatial Semantic Web with Parliament and GeoSPARQL, Semantic Web Journal 3(4): 355-370.
Bizer, C., Heath, T., and Berners-Lee, T., 2009. Linked Data – The Story So Far, International Journal on Semantic Web and Information Systems, Special Issue on Linked Data, 5:1–22.
Collustra, 2013. (Online). Available: http://tw.rpi.edu/ web/event/TWeD/2013/Fall/Collustra (30 Sep 2013).
Das, S., Chong, E. I., Eadon, G., Srinivasan, J., 2004. Supporting Ontology-based Semantic Matching in RDBMS, Proceedings of the 30th VLDB Conference, Toronto, Canada, pp. 1054-1065, 2004.
Denaux, R., Dolbear, C., Hart, G., Dimitrova, V., and Cohn, A., 2011. Supporting Domain Experts to Construct Conceptual ontologies: A Holistic Approach, Web Semantics: Science, Services and Agents on the World Wide Web, 9 (2011), pp. 113-127.
Egenhofer, M. J., and Herring, J. R., 1990. Categorizing binary topological relations between regions, lines, and points in geographic databases. Technical report, Department of Surveying Engineering, University of Maine.
Egenhofer, M. J., 2002. Toward the semantic geospatial web, Proceedings of the ACM GIS02, pp. 1-4.
Garbis, G., Kyzirakos, K., and Koubarakis, M., 2013. Geographica: A Benchmark for Geospatial RDF Stores, accepted at the 2013 International Semantic Web Conference.
Geospatial Semantics and Ontology, 2013. Center for Excellence in Geospatial Science, [Online], Available: http://cegis.usgs.gov/ontology.html [15 Sep 2013].
Grandi, F., 2012. Introducing an Annotated Bibliography on Temporal and Evolution Aspects in the Semantic Web, SIGMOD Record, December 2012 (Vol. 41, No. 4), pp. 18-21, Available: http://www-db.deis.unibo.it/~fgrandi/TWbib/TSWbib.html (15 Sep 2013).
Hoffart, J., Suchanek, F. M., Berberich, K., and Weikum, G., 2012. YAGO2: A Spatially and Temporally Enhanced Knowledge Base from Wikipedia (preprint), (Online), Available: http://www.mpi-inf.mpg.de/yago-naga/yago/publications/aij.pdf (29 Sep 2013).
Kolas, D., 2009. Supporting Spatial Semantics with SPARQL, Transactions in GIS, Vol. 12, Issue s1, pp. 5-18, December 2008.
Koubarakis, M., Karpathiotakis, M., Kyzirakos, K., Nikolaou, C, and Sioutis, M., 2012. Data Models and Query Languages for Linked Geospatial Data, Reasoning Web 2012, LNCS 7487, T. Eiter and T. Krennwallner (Eds.) pp. 220-328, 2012.
Kyzirakos, K., Karpathiotakis, M., and Koubarakis, M., 2012. Strabon: A Semantic Geospatial DBMS, Proceedings of the 11th International Semantic Web Conference (ISWC 2012), Boston, USA, November 11th-15th.
The Linked Data Web, (Online), Available: http://www.ordnancesurvey.co.uk/education-research/research/linked-data-web.html (16 Sep 2013).
Ma, L., Wang, C., Lu, J., Cao, F., Pan, Y., Yu, Y., 2008. Effective and Efficient Semantic Web Data Management over DB2, Proceedings of the 2008 ACM SIGMOD International Conference on Management of Data, pp. 1183-1194.
Manola, F., Miller, E. (Ed.s), 2004. RDF Primer, (Online), Available: http://www.w3.org/TR/rdf-primer (25 Dec 2013).
GeoSPARQL�Query�Tool�-�A�Geospatial�Semantic�Web�Visual�Query�Tool
39

Open Geospatial Consortium, 2011. OpenGIS Implementation Standard for Geographic information - Simple feature access - Part 1: Common architecture, (Online), Available: http://www.opengeospatial.org/ standards/sfa (25 Dec 2013).
Perry, M., Herring, J. (Eds.), 2010. OGC GeoSPARQL - A Geographic Query Language for RDF Data, Open Geospatial Consortium, (Online), Available: http://www.opengis.net/doc/IS/geosparql/1.0 (16 Sep 2013).
Prud’hommeaux, E. ,Seaborne, A. (Eds.), 2008. SPARQL Query Language for RDF, (Online), Available: http://www.w3.org/TR/rdf-sparql-query (25 Dec 2013).
Randell, D. A., Cui, Z., and Cohn, A. G., 1992. A spatial logic based on regions and connection. In Proceedings of the 3rd International Conference on Knowledge Representation and Reasoning.
Terra Cognita, 2012. (Online), Available: http://iswc2012.semanticweb.org/workshops/TerraCognita.html (15 Sep 2013).
Varanka, D. (Ed.), 2012. Introduction to Geospatial Semantics and Technology Workshop Handbook, 2012 University Consortium for Geographic Information Science Symposium, (Online), Available: http://pubs.usgs.gov/of/2012/1109/ (15 Sep 2013).
APPENDIX
Query 1: select structPoint with fType=730 PREFIX rdf: <http://www.w3.org/1999/02/22-rdf-syntax-ns#> PREFIX rdfs: <http://www.w3.org/2000/01/rdf-schema#> SELECT DISTINCT ?feature ?label WHERE { # Select features of the specified type: ?feature rdf:type <http://cegis.usgs.gov/rdf/struct/structPoint> . ?feature rdfs:label ?label . # Filter features by property: ?feature <http://cegis.usgs.gov/rdf/struct/fType> ?obj . FILTER( regex(str(?obj), "730", "i" ) ) . # Eliminate the group of features ending in "/None" FILTER(! regex(str(?feature), "/None$", "i" ) ) . } ………..Not showing individual queries to obtain geometry and map the features….
Query 2: Select & draw Shenandoah from countyOrEquivalent PREFIX rdf: <http://www.w3.org/1999/02/22-rdf-syntax-ns#> PREFIX rdfs: <http://www.w3.org/2000/01/rdf-schema#> SELECT DISTINCT ?feature ?label WHERE { # Select features of the specified type: ?feature rdf:type <http://cegis.usgs.gov/rdf/gu/countyOrEquivalent> . ?feature rdfs:label ?label . # Filter features by property: ?feature <http://www.w3.org/2000/01/rdf-schema#label> ?obj . FILTER( regex(str(?obj), "Shenandoah", "i" ) ) . # Eliminate the group of features ending in "/None" FILTER(! regex(str(?feature), "/None$", "i" ) ) .
} PREFIX geo: <http://www.opengis.net/ont/geosparql#> SELECT ?wkt WHERE { <http://cegis.usgs.gov/rdf/gu/Features/1673918> geo:hasGeometry ?g . ?g geo:asWKT ?wkt . }
Query 3: Schools within Shenandoah County PREFIX geo: <http://www.opengis.net/ont/geosparql#> PREFIX geof: <http://www.opengis.net/def/function/geosparql/> PREFIX rdf: <http://www.w3.org/1999/02/22-rdf-syntax-ns#> PREFIX rdfs: <http://www.w3.org/2000/01/rdf-schema#> PREFIX units: <http://www.opengis.net/def/uom/OGC/1.0/> SELECT DISTINCT ?feature ?label WHERE { # Feature 1: # Select features of the specified type: ?feature rdf:type <http://cegis.usgs.gov/rdf/struct/structPoint> . ?feature rdfs:label ?label . # Filter features by property: ?feature <http://cegis.usgs.gov/rdf/struct/fType> ?obj1 . FILTER( regex(str(?obj1), "730", "i" ) ) . # Eliminate the group of features ending in "/None" FILTER(! regex(str(?feature), "/None$", "i" ) ) . ?feature geo:hasGeometry ?g1 . ?g1 geo:asWKT ?wkt1 . # Feature 2: # Select features of the specified type: ?feature2 rdf:type <http://cegis.usgs.gov/rdf/gu/countyOrEquivalent> . # Filter features by property: ?feature2 <http://www.w3.org/2000/01/rdf-schema#label> ?obj2 . FILTER( regex(str(?obj2), "Shenandoah", "i" ) ) . # Eliminate the group of features ending in "/None" FILTER(! regex(str(?feature2), "/None$", "i" ) ) . ?feature2 geo:hasGeometry ?g2 . ?g2 geo:asWKT ?wkt2 . # spatial relationship FILTER (geof:sfWithin(?wkt1, ?wkt2)) . } (Note: Some of the queries contain a filter term intended to eliminate features ending in “/None”. These are features that have incomplete definitions, an anomaly of the test dataset that was used.)
WEBIST�2014�-�International�Conference�on�Web�Information�Systems�and�Technologies
40

SIWAM: Using Social Data to Semantically Assess the Difficulties inMountain Activities
Javier Rincon Borobia, Carlos Bobed, Angel Luis Garrido and Eduardo MenaIIS Deparment, University of Zaragoza, Zaragoza, Spain
[email protected],{cbobed, garrido, emena}@unizar.es
Keywords: Semantic Web, Information Extraction, Ontologies, SocialNetwork.
Abstract: In the last few years, the amount of people moving to the mountains to do several activities such as hiking,climbing or mountaineering, is steadily increasing. Not surprisingly, this has come along with a raise in theamount of accidents, which are mainly due to the inexperience of the people, and the lack of information andproper planning. Although one could expect to find appropriate updated information about this issue on theInternet, most of the information related to mountain activities is stored in personal blogs, or in Web sitesthat are not exploiting the possibilities that the SemanticWeb and the Social Web offer regarding contentgeneration and information processing.In this paper, we present SIWAM, a semantic framework oriented to share and evaluate the difficulties ofmountain activities. It provides a thematic social networkfront-end to enable users to share their descriptionsabout their own experiences. Using text mining techniques on these descriptions, it extracts relevant factsabout these experiences, which are used to evaluate the difficulty of the particular activity. The evaluationis done according to a well-established standard for evaluating the difficulty of mountain activities (MIDE),which is modeled in the system using ontologies.
1 INTRODUCTION
Mountain activities comprise a set of sports that areamongst the most practiced in the world. The amountof people practising them is increasing year by yearall around the world (Global Industry Analyst, Inc.,2012; Jenkins, 2013). This steady increment of prac-titioners along with the fact that mountain activitiesare considered extreme sports make the security be animportant and recurring matter of study. There are re-search areas (specially medical ones) (Chamarro andFernandez-Castro, 2009), and organizations, such asthe International Mountaineering and Climbing Fed-eration, which are specially concerned about moun-tain accidents (UIAA Mountaineering Commission,2004). However, in spite of all the efforts, the amountof accidents is, not surprisingly, increasing as moreand more people move to the mountains. From theyearly reports of the rescue groups in Spain (Min-isterio del Interior, 2012), we can point out that themain problems regarding accidents are the inexperi-ence of the people, and the lack of information andproper planning.
While mountain guide books can be a source of in-formation about the tracks and the environment where
the activity is held, it seems pretty safe to assume that,as the main cause of accidents is lack of information,people are not using them to plan their activity (wheneven they plan it). Instead, in these times, people go tothe Internet to look for information as fast as possible,regardless the possible security implications. In thecase of mountain activities, this information is mainlyavailable as descriptions of the different experiencesin text format (e.g., blog entries).
However, trusting these on-line descriptions mightbe a double-edged sword: On the one hand, theymight be really useful as they hold information aboutthe activity; but, on the other hand, they are describingunique experiences whose setup and conditions mightnot be applicable to other situations. A climbing routemight have many variations, shortcuts, forks, etc.,within the same path. In a mountain environment, aslight detour might turn an easy track into a challeng-ing one. Besides, the weather conditions also affectstrongly to the mismatch between the descriptions andthe track difficulties. As an example, in high moun-tain, the orientation is mainly guided by milestonesthat may be covered by snow during winter season.
Moreover, the level of expertise of the person de-scribing the activity might lead to dangerous biases,
41
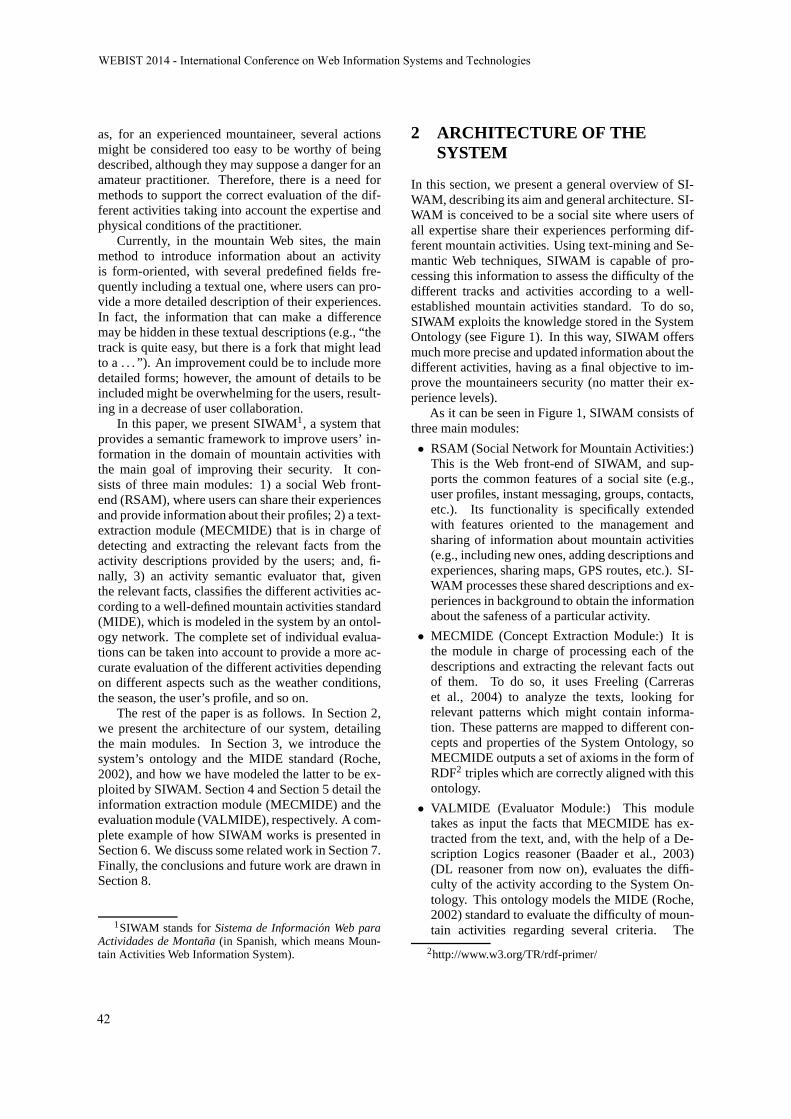
as, for an experienced mountaineer, several actionsmight be considered too easy to be worthy of beingdescribed, although they may suppose a danger for anamateur practitioner. Therefore, there is a need formethods to support the correct evaluation of the dif-ferent activities taking into account the expertise andphysical conditions of the practitioner.
Currently, in the mountain Web sites, the mainmethod to introduce information about an activityis form-oriented, with several predefined fields fre-quently including a textual one, where users can pro-vide a more detailed description of their experiences.In fact, the information that can make a differencemay be hidden in these textual descriptions (e.g., “thetrack is quite easy, but there is a fork that might leadto a . . . ”). An improvement could be to include moredetailed forms; however, the amount of details to beincluded might be overwhelming for the users, result-ing in a decrease of user collaboration.
In this paper, we present SIWAM1, a system thatprovides a semantic framework to improve users’ in-formation in the domain of mountain activities withthe main goal of improving their security. It con-sists of three main modules: 1) a social Web front-end (RSAM), where users can share their experiencesand provide information about their profiles; 2) a text-extraction module (MECMIDE) that is in charge ofdetecting and extracting the relevant facts from theactivity descriptions provided by the users; and, fi-nally, 3) an activity semantic evaluator that, giventhe relevant facts, classifies the different activities ac-cording to a well-defined mountain activities standard(MIDE), which is modeled in the system by an ontol-ogy network. The complete set of individual evalua-tions can be taken into account to provide a more ac-curate evaluation of the different activities dependingon different aspects such as the weather conditions,the season, the user’s profile, and so on.
The rest of the paper is as follows. In Section 2,we present the architecture of our system, detailingthe main modules. In Section 3, we introduce thesystem’s ontology and the MIDE standard (Roche,2002), and how we have modeled the latter to be ex-ploited by SIWAM. Section 4 and Section 5 detail theinformation extraction module (MECMIDE) and theevaluation module (VALMIDE), respectively. A com-plete example of how SIWAM works is presented inSection 6. We discuss some related work in Section 7.Finally, the conclusions and future work are drawn inSection 8.
1SIWAM stands forSistema de Informacion Web paraActividades de Montana(in Spanish, which means Moun-tain Activities Web Information System).
2 ARCHITECTURE OF THESYSTEM
In this section, we present a general overview of SI-WAM, describing its aim and general architecture. SI-WAM is conceived to be a social site where users ofall expertise share their experiences performing dif-ferent mountain activities. Using text-mining and Se-mantic Web techniques, SIWAM is capable of pro-cessing this information to assess the difficulty of thedifferent tracks and activities according to a well-established mountain activities standard. To do so,SIWAM exploits the knowledge stored in the SystemOntology (see Figure 1). In this way, SIWAM offersmuch more precise and updated information about thedifferent activities, having as a final objective to im-prove the mountaineers security (no matter their ex-perience levels).
As it can be seen in Figure 1, SIWAM consists ofthree main modules:
• RSAM (Social Network for Mountain Activities:)This is the Web front-end of SIWAM, and sup-ports the common features of a social site (e.g.,user profiles, instant messaging, groups, contacts,etc.). Its functionality is specifically extendedwith features oriented to the management andsharing of information about mountain activities(e.g., including new ones, adding descriptions andexperiences, sharing maps, GPS routes, etc.). SI-WAM processes these shared descriptions and ex-periences in background to obtain the informationabout the safeness of a particular activity.
• MECMIDE (Concept Extraction Module:) It isthe module in charge of processing each of thedescriptions and extracting the relevant facts outof them. To do so, it uses Freeling (Carreraset al., 2004) to analyze the texts, looking forrelevant patterns which might contain informa-tion. These patterns are mapped to different con-cepts and properties of the System Ontology, soMECMIDE outputs a set of axioms in the form ofRDF2 triples which are correctly aligned with thisontology.
• VALMIDE (Evaluator Module:) This moduletakes as input the facts that MECMIDE has ex-tracted from the text, and, with the help of a De-scription Logics reasoner (Baader et al., 2003)(DL reasoner from now on), evaluates the diffi-culty of the activity according to the System On-tology. This ontology models the MIDE (Roche,2002) standard to evaluate the difficulty of moun-tain activities regarding several criteria. The
2http://www.w3.org/TR/rdf-primer/
WEBIST�2014�-�International�Conference�on�Web�Information�Systems�and�Technologies
42

SIWAM
RSAM
VALMIDE
Activities MECMIDE
DLReasoner
Facts
Social Network
ActivitiesManagement
ApplicationsAdditional
User
Search,others, ...
InsertingActivity
SocialActivity Description
Difficulty Assessment
Activities DB
SystemOntology
Figure 1: Architecture of SIWAM.
global evaluation of a particular activity is ob-tained combining the single evaluations of all thepeople that have done it. Considering all thedescriptions makes the evaluation more robustagainst omitted information.
In the following, we will focus on the semantic partof SIWAM. First, we present how we have modeledthe MIDE evaluation standard in the System Ontol-ogy. Then, we overview how MECMIDE extracts theinformation from the texts using the vocabulary de-fined in the used ontology. Finally, we explain howthis knowledge is used by VALMIDE to assess thedifficulty of a particular activity.
3 SYSTEM ONTOLOGY
The System Ontology stores all the informationneeded to perform the evaluation of the different ac-tivities. Following the directives given in NeONMethodology (Suarez-Figueroa, 2012), we have builtan ontology network to make it possible to follow amodular development. In Figure 2, we can see theinner structure of this ontology:
Criteria ModuleMIDE Path
Criteria Module
GCDE Module
....
System Ontology
Other EvaluationModules
MIDE Environment
Figure 2: Inner structure of the ontology used by SIWAM.
• The Global Criteria Excursions Definition(GCDE) ontology module integrates the differentmodules that model different evaluation criteria,and stores information about how they must beused to evaluate an activity. In particular, for eachof the activity types that SIWAM handles, GCDEstores the evaluation modules that are applicableto it and the methods to be used to do so. Thisenables the system to react automatically to theaddition of new evaluation modules and methods.
Currently, it only contains the description of onemethod of evaluation, which is the one applied tothe MIDE evaluations (we will see it later in Sec-tion 5); however, it is interesting to specify its rolein the system as it provides our system with a flex-ible method to add/remove evaluation modules.
• For each evaluation criteria to be used, there is anontology module that models it in the system. Inparticular, we have selected the MIDE criteria forSIWAM, as it is a well-established standard formountain activities evaluation.
The motivation for using ontologies to model thedifferent evaluation criteria is two-fold: On the onehand, so far, there has not been not any initiative tomodel the domain of mountain activities and providea shared vocabulary; on the other hand, using ontolo-gies provides us with a logical framework to performthe activity evaluation in a more tractable and man-ageable way than using pure rule systems, as we willsee in Section 5. Moreover, the use of an ontologi-cal model as a base for the text information extractionhas been successfully applied in many works suchas (Garrido et al., 2012; Vogrincic and Bosnic, 2011;Garrido et al., 2013; Kara et al., 2012).
Thus, in the rest of the section, we focus on howwe have modeled the evaluation criteria knowledge inthis ontology. To do so, we firstly overview the MIDE
SIWAM:�Using�Social�Data�to�Semantically�Assess�the�Difficulties�in�Mountain�Activities
43

standard, and then we detail how we have captured itsinformation in the appropriate ontology module.
3.1 MIDE Evaluation Standard
The MIDE standard (Roche, 2002) is focused on theevaluation of mountain tracks. To do so, MIDE pro-poses to tag a particular excursion (experiencesusingthe SIWAM terminology) with two different kinds ofinformation: 1) information about the track (name,type, accumulated height difference, etc.) and theconditions of the actual activity performing (hour,season, weather conditions, etc.); and 2) evaluationinformation, which provides difficulty values rangedin 1 – 5 for different aspects of the track, namelyEn-vironment, Path, Journey, andPhysical Effort.
Most of the first kind of information can be cap-tured using simple forms (e.g., times, height differ-ences, distances, etc.). For the second type of infor-mation, MIDE provides guidelines to evaluate eachof those values. While the Physical Effort can beobtained using different formulae, the rest of values(Environment, Path and Journey) are assessed usinga set of criteria that might or might not be present inthe track. Then, depending on the number of crite-ria the activity fulfils, it is assigned a difficulty valuefrom 1 to 5 for that particular aspect.
Capturing these criteria using formularies is morecomplicated. They would require complex forms,which would be long and time-consuming to fill, atask that not all the users are prone to do. Fortu-nately, this is the kind of information that is usuallycomprised in the textual descriptions of the user’s ac-tivities. Thus, the first step to perform an automaticevaluation of the track is to model these criteria tobe used by SIWAM. In the following subsection, wepresent our approach to do this task.
3.2 Modeling MIDE with Ontologies
The development of the ontology modules that modelthe MIDE evaluation criteria was carried out in twowell differentiated stages:
1. Modeling the mountain domain: The objective ofthis first stage was to obtain and organize the el-ements (concepts and properties) within the do-main of the mountain activities. We did not aimat modeling the whole domain at once, but in-crementally, taking each of the MIDE evaluationcriteria as the competence questions (Gruningerand Fox, 1994) for each iteration. This way, wecould assure that we had modeled all the elementsneeded to model the MIDE knowledge.
2. Modeling the criteria: In the case of MIDE, theevaluation is performed by checking whether aparticular activity fulfils or not an specific (andcomplex) condition. From an ontological point ofview, this is equivalent to say that the activity be-longs to a particular type of activities defined bythis condition. Thus, we useddefined conceptstomodel them. In Description Logics (Baader et al.,2003), the underlying formalism of OWL3, a de-fined concept provides a complete definition ofits members, that is, it establishesnecessary andsufficientconditions for an instance to belong toit. This kind of definitions enables DL reason-ers to classify the instances according to them. Inthe following section, we will see how VALMIDEmodule takes advantage of this issue.
Moreover, we added also the information abouthow many criteria the activities must fulfil to be as-signed each of the 1 – 5 values. We modeled this in-formation also as definitions, but they do not affectto the reasoning process. They are just consulted byVALMIDE to obtain the mapping between the num-ber of criteria and the final value.
We now present two different examples to illus-trate how these definitions comprise the knowledgeabout the criteria. We focus on the subdomain of theEnvironment module, this is, criteria about the harsh-ness of the environment:
• Criteria “crossing a place farther than 1 hour(walking time) from a inhabited place” is modeledas a new concept whose definition is
(actionPerformed some CrossRemoteArea3H)
along with the following definitions
CrossRemoteArea3H equivalentTo(Crossand (actionPerformedIn some RemoteArea3H))
RemoteArea3H equivalentTo(SingularElementand (distantFrom some InhabitedPlace)and (isWalkingDistance some integer[>=3]))
• Criteria “high probability of temperatures un-der 0◦C ” and “high probability of temperaturesunder 10◦C” are modeled respectively as
(hasMinTemperature some integer[<0])
and
(hasMinTemperature some integer[<-10])
3http://www.w3.org/TR/owl-primer/
WEBIST�2014�-�International�Conference�on�Web�Information�Systems�and�Technologies
44

These definitions enable VALMIDE to classify thetexts with the help of a DL reasoner. In the followingsection, we present the MECMIDE module, that en-ables SIWAM to obtain the facts to be classified outfrom the text.
4 MECMIDE MODULE
The MECMIDE module is in charge of extracting therelevant information out from the descriptions pro-vided by the users. It works as follows: For each factor concept in the System Ontology that we want to beable to detect, MECMIDE has a list of search patternsthat are to be looked up in the texts. For instance, theconcept “Use hands on step” has a list of patterns suchas “utilize hand”, “use hand”, “require hand use”, etc.That list contains the lemmatized form of each wordused. The patterns do not include articles, conjunc-tions, prepositions, or other words that lack of intrin-sic semantic value.
To enrich the pattern-search analysis, MECMIDEincludes two additional advanced semantic features:
• The processing window: MECMIDE searcheseach of the words composing the patterns inan area defined according to a given number ofwords. This feature enables MECMIDE to de-tect a pattern in the text regardless the word order.This is useful because sentences can hold differentstructures with the same words4.
• The use of synonyms: Instead of looking justfor the exact words of each pattern, MECMIDEconsiders also their synonyms. For example theword “way” has the same meaning as “traverse”,“track”, “trail”, “path”, “route”, or “itinerary”.The use of synonyms is solved using a lexicaldatabase, like WordNet (Miller, 1995), which al-lows MECMIDE to transform the words that in-tegrate each pattern insynsets, i.e., the canonicalform of its meaning. Then, the search is carriedout using these synset, which broadens the vocab-ulary coverage of the patterns.
In many cases, it is not sufficient that a single pat-tern is recognized to deduce that the text is relatedto a particular concept. So, on top of these text pat-terns, MECMIDE uses a set of rules to decide if wecan actually associate a text with a fact or concept inthe VALMIDE concept (e.g., the need of a minimumnumber of patterns to deduce whether a particular de-scription is related to an ontology concept). Thus, the
4This structure richness is very typical when processingSpanish texts.
process followed by MECMIDE to process each textis composed by three steps:
1. Lemmatization of the texts: Freeling (Carreraset al., 2004) is used as a tagger and lemmatizer, tofilter stop words and to obtain the lemma of eachword of the text, respectively.
2. Looking for patterns: To do this, the words thatform the patterns are converted intosynsetsto im-prove the quality of searches. For example, “dan-gerous way” is equivalent to “slippery path”. Inour current implementation, we have chosen Eu-roWordNet (Vossen, 1998) as our lexical databasebecause our prototype is in Spanish.
3. Applying the rules: The set of rules is evaluated tosee whether the text must be linked to a concept,i.e., whether a fact can be derived from the text.
The result of this analysis is a set of concepts andfacts that are associated to the text. In the followingsection, we present how this set of facts is used byVALMIDE to evaluate the activity according to theknowledge stored in the System Ontology.
5 VALMIDE MODULE
As we have seen in Section 3, the ontology usedby SIWAM is an ontology network composed bytwo levels: One with information about the evalua-tion methods used for each evaluation criteria (GCDEModule), and the other with the actual knowledgeneeded to perform the actual evaluation (criteria mod-ules). VALMIDE uses this information to performthe evaluation of each single activity. This processis composed by the following steps:
1. Deciding the evaluation modules: When it re-ceives the description text along with the extractedfacts, VALMIDE consults the GCDE module tosee which evaluation modules are applicable tothe type of activity that is being described.
2. Obtaining the evaluation methods: GCDE con-tains information about the specific method to beused for each evaluation module. VALMIDE con-sults it to know how to handle an specific module.This way, we can attach evaluation modules andmethods in a flexible and decoupled manner.
3. Evaluating the activity description: For each mod-ule, VALMIDE asserts the facts in a copy of theevaluation module and classifies it. The classifi-cation and inferring capabilities of DL reasonersenable VALMIDE to make it explicit knowledgethat otherwise would remain implicit. This infor-mation is used to calculate the actual evaluation.
SIWAM:�Using�Social�Data�to�Semantically�Assess�the�Difficulties�in�Mountain�Activities
45

4. Combining evaluations: Depending on the eval-uation module, VALMIDE can consider whetherto just evaluate the activity as a single one, orto combine previous evaluations to achieve anagreed evaluation. The information of the methodto use is stored in the GCDE module.
Regarding the MIDE Modules, we have developedan evaluation method based on the activity descrip-tion classifications. As we have explained in Sec-tion 3, each MIDE criteria is modeled as a definedconcept. The MIDE evaluation method obtains theagreed number of criteria fulfilled using the follow-ing formulae:
MIDE value(Ainstance) =|Crit |
∑i=1
f ul f il (crit i)
with
f ul f il (crit i ) =
1 i f
|Desc|∑
k=1crit i (desck)
|Desc| >CT
0 otherwise
whereAinstanceis the activity we are evaluating,Critis the set of criteria to be evaluated (the set of con-cept definitions),Descis the set of individual descrip-tions forAinstance,CT is a confidence threshold in 0..1,andcrit i(desck) is a function that evaluates whether adescription is an instance of a particular criteria (thisfunction is evaluated with the help of the DL reasoner,and returns 1 if the belonging relationship is entailed).
The above method counts how many of the criteriathe activity fulfils by asking the DL reasoner whetherthe activity description belongs to each of the criteriadefinition concepts. Then, the MIDE information foreach particular activity (the evaluation of each of itsdescriptions) is combined to establish whether a par-ticular criterion is met. This is done by calculatingwhether it is present in the descriptions in a percent-age above a particular confidence threshold. Finally,SIWAM translates the agreed number of criteria intothe MIDE final value (ranged in 1 – 5 values) by con-sulting the information also stored in the module.
In the following section, we present two excerptsof an actual description to illustrate each of the stepsthat our system takes to process the information fromtext to the actual evaluation.
6 COMPLETE EXAMPLE
Although our system is in its early stages of imple-mentation, we have already carried out some conceptproofs that support the approach. In particular, wehave used descriptions that correspond to real experi-ences of four different mountain ascensions located in
the Pyrenees, a range of mountains that forms a nat-ural border between France and Spain. The originaltexts are in Spanish, but we have translated the inter-esting excerpts used in this section to illustrate howSIWAM works.
In the ascension to the Petit Vignemale (3032 m),one of the mountaineers wrote:
“... It took us a little more than 3 hours toreach the Refuge of Oulettes de Gaube, whichwas closed (we already knew it). This refugeis located at a height of 2151 m., in an isolatedhigh mountain place, ...
... The temperature at such height is -18◦C,with a 20 km/h wind, ...”
From these excerpts (ex1), MECMIDE extractsthe following facts:
• From the subject of the description (is given byRSAM):
ex1 isA Hike
• From the location excerpt:
refugeOulettesGaube isA InhabitedPlace
zone2 isA SingularElementzone2 distantFrom refugeOulettesGaubezone2 isWalkingTime 3
crossZone2 isA CrosscrossZone2 actionPerformedIn zone2
ex1 actionPerformed crossZone2
wherezone2is the area which the mountaineerswere traversing, andcrossZone2is the action oftraversing it.
• From the temperature excerpt:
ex1 hasMinTemperature -18
The instances created in the extraction are relatedto the activity instance, as MECMIDE assumes that atext contains the description of a single activity. Thus,VALMIDE asserts these axioms in the Environmentmodule, and, with the help of a DL reasoner, infers thefollowing (recall the definitions for the criteria pre-sented in Section 3):
• From the location axioms:
1. zone2 is a RemoteZone3H as it fulfils that isa SingularElement and is distant an Inhabited-Place (refugeOulettesGaube), and is at a walk-ing distance of more than 3 hours.
2. crossZone2 is a CrossRemoteZone3H as it is aCross action performed in a RemoteZone3H.
WEBIST�2014�-�International�Conference�on�Web�Information�Systems�and�Technologies
46

3. ex1 is an instance of the concept definition as-sociated to the MIDE criterion of crossing a re-mote area at 3 hours (walking distance) as it hasan action that is a CrossRemoteZone3H.
• From the temperature axioms:
1. ex1 is an instance of the concept definition as-sociated to the criterion about temperatures be-low -10◦C.
2. ex1 is also an instance of the concept definitionassociated to the criterion about temperaturesbelow 0◦C.
VALMIDE thus calculates the final evaluationcounting the criteria that ex1 is instance of5. Notehow ex1 is added two points in the MIDE criteria dueto its temperature as it fulfils two different criteria (be-low 0◦C and below 10◦C). This is coherent with theway the MIDE standard evaluates the activity.
7 RELATED WORK
The spread and presence of mountain activities the-matic sites on the Web have been quite low comparedto other fields. To the best of our knowledge, there isno such an approach as ours in any of the current Websites about mountain activities.
Regarding the System Ontology, we have notfound any other ontology modeling the domain ofmountain activities. The closest works are relatedto the tourism domain (Fodor and Werthner, 2005;Prantner et al., 2007; Barta et al., 2009; Mouhimet al., 2011), although they have different aims as oursas they are mainly oriented to model the tourism do-main within the context of the e-commerce. Anyway,we have considered all of them to capture the vocab-ulary of our ontology.
The most related works to SIWAM can be foundin the Information Extraction (IE) field. In particular,according to (Wimalasuriya and D., 2010), SIWAMcan be classified as an Ontology-Based InformationExtraction (OBIE) system, which is extended with thereasoning capabilities of VALMIDE module. In thiscontext, there are several approaches oriented to auto-matic content annotation (Cimiano et al., 2004; Buite-laar et al., 2008). PANKOW (Cimiano et al., 2004)processes Web pages looking for instances of a givenontology, thus automatically annotating the Web pagewith metadata about its content. SOBA (Buitelaaret al., 2008) is oriented to obtain structured informa-tion out from semi-structured resources (populate a
5In this example, we are considering just one descriptionso the formulae in the previous section is reduced just tocount the criteria concepts whichex1belongs to.
knowledge base). However, these systems aim onlyat annotation and fact extraction, while SIWAM usesthis extracted information to perform the evaluationof the different activities exploiting the model in theontology and the DL reasoner classifying capabilities.
Without leaving the Information Extraction field,it is worthy mentioning several approaches (Wu et al.,2008; Cimiano and Volker, 2005) that have as itsmain goal to construct the ontology that is behind theprocessed information. For example, Kylin (Wu et al.,2008) uses extraction techniques against Wikipedia’sarticles to obtain a structured schema out from them.It uses also WordNet along withmachine learningtechniques to obtain the final ontology. However, con-structing the ontology is not the objective of SIWAM.SIWAM exploits the domain model to detect impor-tant facts in the extraction stage, and then, the modelis used to evaluate different aspects of each of the in-put activities (via their descriptions).
8 CONCLUSIONS AND FUTUREWORK
In this paper, we have presented SIWAM, a completeframework to share information about mountain ac-tivities. Apart from its social network features, SI-WAM extracts and infers new information from thedescriptions provided by the users to help assessingthe difficulties of the different activities. This is doneto improve the information for the practitioners in or-der to reduce the risks in the mountains. Moreover,to the best of our knowledge, we have developed thefirst ontology aimed at modeling mountain activities6,and at modeling a standard evaluation method such asMIDE. Our system has the following features:
• It uses the descriptions provided by the users toextract relevant facts aligned to an ontology. Thisis a source of information which was almost un-exploited in the mountain domain.
• It uses the extracted information to evaluate theagreed difficulty of each activity with the help ofa DL reasoner. To do so, it exploits the inferringcapabilities of the reasoner, along with the evalu-ation criteria definitions.
• It is completely ontology guided: the adoption ofa modular evaluation method makes it possibleto extend SIWAM with different evaluation stan-dards in a flexible and efficient way.
6We cannot make it available by the time we are writingthe paper due to several project restrictions.
SIWAM:�Using�Social�Data�to�Semantically�Assess�the�Difficulties�in�Mountain�Activities
47

Currently, the prototype is under development, al-though the preliminary results are very promising. Asfuture work, apart from testing the user behaviour, wewant to extend the modeled activities and include fur-ther evaluation methods taken from the field of rec-ommender systems.
ACKNOWLEDGEMENTS
This research work has been supported by the CICYTproject TIN2010-21387-C02-02 and DGA-FSE.
REFERENCES
Baader, F., Calvanese, D., McGuinness, D., Nardi, D., andPastel-Scheneider, P. (2003).The Description LogicHandbook. Theory, Implementation and Applications.Cambridge University Press.
Barta, R., Feilmayr, C., Proll, B., Grun, C., and Werthner,H. (2009). Covering the semantic space of tourism:An approach based on modularized ontologies. InProc. of the 1st Workshop on Context, Information andOntologies (CIAO’09), Heraklion (Greece), pages 1–8. ACM.
Buitelaar, P., Cimiano, P., Frank, A., Hartung, M., andRacioppa, S. (2008). Ontology-based informationextraction and integration from heterogeneous datasources. International Journal of Human-ComputerStudies, 66(11):759–788.
Carreras, X., Chao, I., Padro, L., and Padro, M. (2004).FreeLing: An open-source suite of language analyz-ers. InProc. of the 4th Intl. Conf. on Language Re-sources and Evaluation (LREC’04), pages 239–242.European Language Resources Association.
Chamarro, A. and Fernandez-Castro, J. (2009). The per-ception of causes of accidents in mountain sports: Astudy based on the experiences of victims.AccidentAnalysis & Prevention, 41(1):197–201.
Cimiano, P., Handschuh, S., and Staab, S. (2004). Towardsthe self-annotating web. InProc. of the 13th Intl. Conf.on World Wide Web (WWW’04), New York (NY, USA),pages 462–471. ACM.
Cimiano, P. and Volker, J. (2005). Text2Onto: A frame-work for ontology learning and data-driven changediscovery. In Proc. of the 10th Intl. Conf. onNatural Language Processing and Information Sys-tems (NLDB’05), Alicante (Spain), pages 227–238.Springer Verlag.
Fodor, O. and Werthner, H. (2005). Harmonise: A step to-ward an interoperable e-tourism marketplace.Interna-tional Journal of Electronic Commerce, 9(2):11–39.
Garrido, A. L., Buey, M. G., Ilarri, S., and Mena, E.(2013). GEO-NASS: A semantic tagging experiencefrom geographical data on the media. InProc. of the17th East-European Conf. on Advances in Databasesand Information Systems (ADBIS’13), Genoa (Italy),pages 56–69. Springer Verlag.
Garrido, A. L., Gomez, O., Ilarri, S., and Mena, E. (2012).An experience developing a semantic annotation sys-tem in a media group. InProc. of the 17th Intl. Conf.on Natural Language Processing to Information Sys-tems (NLDB’12), Groningen (The Netherlands), pages333–338. Springer Verlag.
Global Industry Analyst, Inc. (2012). Extreme sports: Aglobal industry outlook.
Gruninger, M. and Fox, M. S. (1994). The role of com-petency questions in enterprise engineering. InProc.of the IFIP WG5.7 Workshop on Benchmarking - The-ory and Practice, Tronheim (Norway), pages 22–31.Springer.
Jenkins, M. (2013). Maxed out on Everest.National Geo-graphic, 32(6):94–113.
Kara, S., Alan,O., Sabuncu, O., Akpınar, S., Cicekli, N. K.,and Alpaslan, F. N. (2012). An ontology-based re-trieval system using semantic indexing.InformationSystems, 37(4):294–305.
Miller, G. A. (1995). WordNet: A lexical database for En-glish. Communications of the ACM, 38(11):39–41.
Ministerio del Interior (2012). Anuario es-tadıstico del Ministerio del Interior.http://www.interior.gob.es/file/62/62261/62261.pdf,accessed September 13, 2013.
Mouhim, S., Aoufi, A. E., Cherkaoui, C. E., Douzi, H., andMammas, D. (2011). A knowledge management ap-proach based on ontologies: The case of tourism.In-ternational Journal of Computer Science & EmergingTechnologies, 2(6):362–369.
Prantner, K., Ding, Y., Luger, M., Yan, Z., and Herzog, C.(2007). Tourism ontology and semantic managementsystem: State-of-the-arts analysis. InProc. of IADISIntl. Conf. WWW/Internet 2007, Vila Real (Portugal),pages 111–115. IADIS Press.
Roche, A. P. (2002).MIDE: Metodo de Informacion deExcursiones. Federacion Aragonesa de Montanismo.http://www.montanasegura.com/MIDE/manualMIDE.pdf, accessed September 13, 2013.
Suarez-Figueroa, M. C. (2012).NeOn Methodology forBuilding Ontology Networks: Specification, Schedul-ing and Reuse. IOS Press.
UIAA Mountaineering Commission (2004).To Bolt or notto Be.
Vogrincic, S. and Bosnic, Z. (2011). Ontology-based multi-label classification of economic articles.ComputerScience and Information Systems, 8(1):101–119.
Vossen, P. (1998).EuroWordNet: a multilingual databasewith lexical semantic networks. Kluwer AcademicBoston.
Wimalasuriya, D. C. and D., D. (2010). Ontology-based in-formation extraction: An introduction and a survey ofcurrent approaches.Journal of Information Science,36(3):306–323.
Wu, F., Hoffmann, R., and Weld, D. S. (2008). Informationextraction from Wikipedia: Moving down the longtail. In Proc. of the 14th ACM Intl. Conf. on Knowl-edge Discovery and Data Mining (SIGKDD’08), LasVegas (NV, USA), pages 731–739. ACM.
WEBIST�2014�-�International�Conference�on�Web�Information�Systems�and�Technologies
48
Using Healthcare Planning Features to Drive Scientific Workflowson the Web
Bruno S. C. M. Vilar, Andre Santanche and Claudia Bauzer MedeirosIC - UNICAMP, 13083-852, Campinas, SP, Brazil
{bvilar, santanche, cmbm}@ic.unicamp.br
Keywords: Scientific Workflows, Context-Adaptation, Task-Network Model, Healthcare.
Abstract: Automated healthcare planning (care-flow) systems are usually designed to afford the dynamicity of healthenvironments, in which changes occur constantly as a patient’s treatment progresses. This dynamic adaptationmechanism is based on blocks of activities, triggered and combined according to contextual data, producing aplan, which emerges from the interaction between these blocks and the context. However, tools that implementcare-flow systems are still incipient, missing support for features like extensibility, collaboration and traceabil-ity of procedures. On the other hand, these features can be found in workflow systems that are widely used ina variety of environments (in business and scientific domains), with consolidated standards and technologies.However, workflow systems are not well suited to address the dynamicity of healthcare environments. In thispaper we argue that care-flow and workflow systems have complementary characteristics and we present asoftware architecture that incorporates the emergent and context-driven approach of care-flow systems intoworkflow systems. We present a prototypical implementation validating the key concepts of our proposal,which uses an ontology representation of workflows combined with an ontology and SWRL rules.
1 INTRODUCTION
The growth in the number of patients of a hospitalbrings the challenge of managing appointments, ad-missions and surgical interventions. There is the needto increase the efficiency and flexibility to manage as-sociated data. The use of computational resources toaddress this challenge implies on more technical re-quirements. The possibility of using data available onthe Web has added a new dimension to this problem,with additional heterogeneity factors.
Some researchers (Unertl et al., 2009), in the con-text of chronic disease care, identified requirementsthat should be fulfilled by systems to be applied to thehealth domain, among which we single out: (i) Sup-port for the shared needs and behaviors in care; (ii)Allow customization for disease-specific needs and tosupport the needs of different types of users; (iii) Ex-plore new approaches for information input into theEHR (Electronic Health Record) as well as transfer,efficiently, data from medical devices into them.
Care-flow is at the core of healthcare manage-ment, involving directly or indirectly the requirementspresented by (Unertl et al., 2009). As a consequence,one natural approach to start to deal with the prob-lem has been to use Computer-Interpretable Guide-
lines (CIGs). Informally, a CIG is a specification insome kind of computer interpretable language that de-fines the flow of steps to be taken in each situationmet by a health professional. Those guidelines man-age the care-flow, customize needs and details for pa-tient treatment and deal with data gathered, clinicalguidelines, while preserves the rationale of healthcareprofessionals. Though CIGs are suitable for guidingthe care-flow, from the perspective of the planning ofthe paths chosen, the tools that implement a CIG ap-proach are still incipient, missing support to extensi-bility, reuse and share of content, collaboration amongprofessionals and traceability.
Even though it is possible to define guidelines for“blocks of actions”, the whole process involved in thehealthcare of a given patient is driven by the context,which is captured during the process itself. In a typ-ical scenario, data from given care-flow step will de-fine the next steps to be followed. The flow of ac-tions emerge from the interaction between availableblocks and the context. Therefore, one of the mostsuccessful approaches for CIG is the Task-NetworkModel (TNM) (Peleg et al., 2003), which mimics thiscontext-driven evolution. The process starts by a seedblock of actions, which is unfolded according to con-text data collected during its execution.
49

Scientific workflows, on the other hand, are con-cerned with the planning and flow of tasks, but associ-ated to scientific experiments and general tasks. Theyhave been developed for years and tested on areassuch as Astronomy, Biology, Gravitational Physicsand Earthquake Science (Bharathi et al., 2008). Asa result, those tools have consolidated mechanisms todeal with large amounts of data, collaboration, exten-sibility of their resources, and association with exter-nal sources of data, tools and algorithms. In general,Scientific Workflow Management Systems (SWfMS)manage experiments’ provenance, keeping detailedand meaningful records of data involved on experi-ments and processes that affect the data. Provenanceis fundamental for scientific processes because it pro-vides important documentation that is key to preservethe data, to determine data quality and authorship, andto reproduce as well as validate the results of suchprocesses (Davidson and Freire, 2008).
Workflow execution has been adopted where re-sources are distributed on the Web, helping the coor-dination and monitoring of processes. They are beingincreasingly used to create complex Web applicationsby Web service composition or by providing a thinclient, accessible through a browser, to conduct largescale processes and experiments (Wei Tan, 2013). Inorder to enhance their applicability, research effortsare concerned with providing workflow mechanismswith more flexibility, including in the healthcare sce-nario such as (Dang et al., 2008), or (Schick et al.,2012). Even though there are mechanisms that canbe used to pre-define exceptions and alternative pathsalong workflows, they were not designed to dynami-cally evolve the workflow specification driven by thecontext, e.g., unfolding blocks of actions according tocontextual data collected during a process execution.
Compared to CIG systems, workflow systemshave been widely adopted and have consolidated stan-dards and tools. In order to exploit the advantages ofworkflow systems in the health context, this work pro-poses to incorporate into workflows the dynamic andcontext-driven approach followed by care-flow sys-tems. This is based on our experience (Vilar et al.,2013) that shows that the effort to do this is less com-plex than the process to adapt CIG systems so thatthey can acquire the features that are causing scien-tific workflows to become widely adopted. This pa-per analyses the features that confer high flexibilityto CIGs – mainly those based on the TNM due to itsemergent behavior – and presents our initial approachto bring them to a SWfMS.
2 CLINICAL PRACTICEGUIDELINES ANDTASK-NETWORK MODELS
Clinical Practical Guidelines (CPGs) are writtenguidelines that describe the evidence-based proce-dures to be followed during diagnosis, treatment, andclinical decision making for a specific disease. Theirtextual format can be easily diffused, but not easilyused in daily work (Panzarasa and Stefanelli, 2006),because of a multitude of forms and specialized vo-cabulary. Moreover, they depend heavily on the ex-pertise of health professionals.
An approach to solve these problems is thedissemination of guidelines’ content in machine-interpretable representations, which are more suit-able for use in individual clinical decision support(Panzarasa and Stefanelli, 2006). This approach hasled to the creation of Computer-Interpretable Guide-lines (CIGs), which implement guidelines in ac-tive computer-based decision support systems. CIGsadopt models to represent the content to support de-cisions. Some examples of such models are Task-Network Models (TNMs), Medical Logic Modules(MLMs) and Augmented Decision Tables (ADTs).
Figure 1: Example of CIG structure for a Controlled Venti-lation plan.
(Gooch and Roudsari, 2011) identified 8 knowl-edge models implemented, related to clinical deci-sions, concluding that TNM was the most commonlyadopted. The authors characterize TNM in two ways:general and formal. General TNMs are “flowchartsor process maps without formal semantics”. For-mal TNMs are “guideline-based clinical tasks – ac-
WEBIST�2014�-�International�Conference�on�Web�Information�Systems�and�Technologies
50

tions, decisions, queries – that unfold over time, witha formal syntax and semantics”. According to (Pe-leg et al., 2003), TNMs succeed over alternative ap-proaches, such as MLMs and ADTs, because they donot provide full support for conceptualizing a multi-step guideline that unfolds over time. Consideringthose aspects, in this work we focus on TNMs.
Figure 1 shows a usual structure of a TNM. Asthe ‘Legend’ (top right) shows, the basic componentis a plan and it represents a procedure to be appliedto some case. In each box, a rectangle with a label isthe name of the plan. The top plan – labeled Ventila-tion– is the starting (seed) plan. The following plans(below) are sub-plans that can be triggered by the up-per plan according to rules. To decide whether a planshould be applied or not, there are CharacterizationCriteria that define conditions to be analyzed in orderto match the patient case to the diagnosis. Anotheraspect that can be used to determine if the plan is suit-able to the case is the Expected Outcomes. The flowof actions and conditions appear whithin the Proce-dures box. Whenever a plan is recognized as a wayto achieve the same result desired by the healthcareprofessional, the plan will be triggered.
A triggered plan will follow the Procedures thatare recommended to be applied to the patient. Therepetition of those internal procedures is guided ac-cording to the Repetition specification associated tothe plan. Also, it is possible to associate Abort Cri-teria to interrupt the plan when a specific situationis achieved. A plan can trigger potential sub-plans,allowing to modularize and reuse plans that alreadyencapsulate needed practices. The fact that the re-sults can be unexpected, and consequently the sub-plans will be selected during the execution, producesan emergent behavior in the flow of activities. Sev-eral potential flows, constrained by rules, will dynam-ically shape one flow on-the-fly during the execution,interacting with contextual values. This work cap-tures this rule-based and context-driven emergent be-havior and adapts it to workflows.
To explain the characteristics of TNMs we use thesame scenario that Aigner and Miksch (Aigner andMiksch, 2006) adopt to validate the CareVis platform:Infants Respiratory Distress Syndrome (I-RDS). AsMiksch (Miksch et al., 1998) explains, “after I-RDSis diagnosed, a plan dealing with limited monitoringpossibilities is activated, called initial-phase. Thenfollows, depending on the severity of the disease,three different kinds of plans, controlled-ventilation,permissive-hypercapnia, or crisis-management. Onlyone plan at a time can be activated, however the or-der of execution and the activation frequency of thethree different plans are depending on the severity of
the disease”.The scenario is shown on Figure 1. The plan exe-
cution order is read as top-down, left to right. Dashedlines from a plan represent alternative sub-plans thatare used according to the conditions. To representthe internal Procedures , we use the same represen-tation as CareVis: flow-charts. An internal procedureis described as a flow of CareVis ‘single-steps’. Eachsingle-step is either a variable assignment, a if-then-else construct (hexagon), an ask element (rectangle).
The Ventilation plan is activated when the charac-terization criteria FiO2>40 and PIP=20 is satisfied.The plan and all sub-plans are aborted if the conditionFiO2>90 or PIP>25 or PCO2>100 is achieved. AsVentilation plan does not have internal procedures, theInitial plan is executed, following the sequential or-der specified. The Initial plan just has a set of internalprocedures, such as ask weight and state of the patientand define variable values according to the state value(healthy, slightly ill, ill and very ill).
3 WORKFLOWS
A workflow is defined as the movement of tasksthrough a work process describing how tasks arestructured, who performs them, the resources neededand their relative order (Dallien et al., 2008). On acomputational context, a workflow specification canbe seen as an abstraction that allows the structuredcomposition of programs as a sequence of activitiesaiming a desired result (Ogasawara et al., 2009).
Business and science are the two main drivingforces behind the development of Workflow Manage-ment Systems (WfMSs). According to Sonntag etal. (Sonntag et al., 2010), business workflows arefocused on the control of the flow, adopt agreed-upon communication standards, in order to facili-tate interoperation between different software sys-tems and companies, and commonly are concernedabout fault handling, transactions, or quality of ser-vice features. Scientific workflows, on the other hand,are focused on data transformation, commonly mayinvolve computation-intensive tasks, and are con-cerned with the specification of explicit data flow, theexact reproducibility of workflows, or processing ofdata streams.
The Workflow Management Coalition (WfMC)is one important participant of those driving forcesbehind WfMSs development. Because of its in-volvement on the earlier stage of the creation ofworkflows, it defines the workflow componentsunder the business perspective. In this work we usethe WfMC definitions, relaxing them to a broader
Using�Healthcare�Planning�Features�to�Drive�Scientific�Workflows�on�the�Web
51

perspective that also covers scientific workflows(WfMC, 1999). Here we differentiate between aworkflow specification and its instantiation (an actualexecution). Moreover, we use the term ‘task’ asa synonym for ‘activity’ (where an activity is “adescription of a piece of work that forms one logicalstep of a process” (WfMC, 1999). We likewisedistinguish Process definition from Process/ActivityInstance.
In order to help compare workflow and TNM ap-proaches, we re-engineered the Controlled Ventilationplan of Section 2 using part of the graphical notationof flow-charts used on TNMs, but following a repre-sentation similar to that adopted by the Taverna (Hullet al., 2006) workflow system – see Figure 2.
The ‘legend’ (top right) shows the basic notion ofstructure of a process. The top rectangle with a text isthe name of the process. The second one is the repe-tition criteria, which allows to define criteria to repeatthe process and an interval for each repetition. LikeTNMs, workflows may contain internal procedures,specified program code or instructions, that allows toperform activities. For instance, processes ‘HandlePCO2’ contains repetition criteria and embeds codethat is repeated according to the criteria.
An important distinction between TNMs andworkflows is the access to the variable values. Whileon TNM each value may act as a global variable,which can be accessed from anywhere in a plan, onworkflows the values should be explicitly passed foreach process through a port. Input ports receive thevalues of a process, while outport ports contains theresult of a process. Of course, processes can read andwrite from a common storage, but this approach re-duces the generality of processes.
To exemplify the use of a workflow, consideragain the Controlled Ventilation plan, now executedas a workflow depicted in Figure 2. To determinewhether the Ventilation process should be executed,the Ventilation Activation Condition process is intro-duced. If the condition FiO2=40 and PIP=20 is sat-isfied, the result is passed to the Pass Output port,which indicates that the Ventilation process should beperformed. If the condition is not satisfied, the resultis passed to Fail Output port, finishing the executionof the workflow. Ports thus enable conditioning thepath according to the obtained result.
Considering that the Ventilation Activation Condi-tion process generated a Pass Output value, the Venti-lation process receives an input value and passes it toits internal processes. As well as on Figure 1, Initialand Controlled Ventilation are sequentially executed.This execution is explicitly defined by the fact that the
Figure 2: Controlled Ventilation plan re-engineered by usas a workflow structure.
Initial Output port is connected to the Controlled Ven-tilation Input port. While the Initial process uses itsinternal script to obtain the values of weight and state,Controlled Ventilation has sub-processes that are per-formed on any order. In fact, differently from TNMs,those sub-processes can be executed at the same time.The split-join, represented by a circle before and afterthe processes, indicates that any process (among Han-dle tcSaO2 low, Handle PCO2 and Handle tcSaO2high) can be executed. The split-join allows to exe-cute different processes and then combines the resultsso that can be passed to another process or port.
If we proceed mapping a TNM specification to aworkflow, the alternatives in each stage will grow ex-ponentially. This effect shows the limits of trying todirectly map a TNM specification in a classic work-flow specification. Our proposal addresses this prob-lem. It blends the TNM rule-based context-drivenmechanism in a workflow system, providing an equiv-alent TNM ability of adapting itself according to thecontext.
4 DATA-DRIVEN VSPROCESS-DRIVENAPPROACHES
In order to summarize some of the main distinctionsbetween the Workflow and TNM approaches is: sci-entific workflows are process driven and TNMs aredata driven. Thus, bringing TNM characteristics intoscientific workflows will make the latter both data andprocess driven.
WEBIST�2014�-�International�Conference�on�Web�Information�Systems�and�Technologies
52

TNMs are built to reduce the complexity to dealwith large amounts of content that must be interpretedand to guide the use of procedures that are recom-mended to achieve some state. Because a patient maychange his/her condition unexpectedly, TNMs allowto activate or deactivate content (guides and proce-dures) to treat the current state of the patient. Allguides and procedures are pre-specified according tothe recommendations of medical councils and well es-tablished procedures.
Scientific workflows are focused on processinghigh amounts of data. Usually there are two com-mon situations: (i) a scientist wants to represent andautomate a well known/consolidated experiment andexecute it with different data (parameters) with noneor few changes during the execution; (ii) the scientistwants to create an experiment to test a new hypothe-sis, so (s)he starts to build a workflow including andchanging processes and parameters after different ex-ecutions to analyze the results.
The difference between both approaches can beobservable on the basic component of each one.TNMs have plans that associate content, proceduresand other plans. Also, there are criteria that must besatisfied to activate the plan; such criteria allow se-lecting a plan over all other possible situations thatmay occur. Scientific workflows have processes thatcan be associated to others to create the flow of dataand transform/process it. The data that is passed fromone process to another can lead to different paths, butcommonly the possible number of paths and changesare not as high as on TNMs. When a new situation oc-curs and there is a need to incorporate a new process,the scientist changes the workflow – e.g., choosingfrom a repository of processes, including an externaltool or creating a new process.
Another factor is that, to deal with all resourcesinvolved, it is necessary to provide tools to visualizeand filter information, as well as be aware of the ori-gin and the involvement of resource with respect tothe data. A key issue is to maintain provenance in-formation on data and procedures – e.g., what kind ofdata was used where, how and by whom. Here, work-flow systems already provide some sort of traceabilitymechanism.
In this paper we focus on the main features re-quired to achieve a data-driven workflow: changingworkflow tasks to adapt them to a situation. Our ap-proach is presented next.
5 TOWARDS MAKINGSCIENTIFIC WORKFLOWSDATA-DRIVEN
As presented in previous sections, a key factor toproduce workflows able to adapt to the high dy-namic health environments is the rule-based TNMapproach, which triggers modules according to con-text values, producing an emergent behavior. Differ-ent from TNM specifications, which start from a seedand expands the flow, a workflow has a predefinedstarting flow. Therefore, we translated the mechanismof unfolding new activities on-the-fly according rules(TNM) to a mechanism of adapting the existing work-flow on-the-fly according to rules (our approach).
In order to fully support dynamic workflowchanges according to context, and give more flexibil-ity to workflow execution, we decided to adopt rea-soning capabilities and combine them with domainsemantics. The solution found was to (a) use on-tologies as the basis for workflow and concept rep-resentation, and (b) create adaptation rules to repre-sent experts’ knowlege. An adaptation rule character-izes a situation (cause) and defines the change (conse-quence) that should be performed to workflow so thatit can be adapted to the context.
Given that there exist distinct workflow represen-tations and formats (according to the WfMS adopted),the overall dynamic adaptation cycle can be describedas follows. The workflow execution on the Web ismonitored at each activity.Every new workflow stateis mapped to an ontology instance, to which reason-ing is applied, resulting in a new ontology instance(containing recommended modifications to that state).This new instance is transformed back to the work-flow representation of the WfMS adopted, which isshown back to the user on the Web interface, to bevalidated or modified.
The architecture of our work is presented in Figure3, where CRec (Context Record) is the linearized rep-resentation of an ontology, representing a workflowstate. The main components are the following. A Sci-entific Workflow Management System (SWfMS)used to create and execute workflows, through aWeb Interface, extended to incorporate the adaptationmechanism. A Context-Aware Extension, respon-sible for monitoring workflow execution and identi-fying the events that occur during that execution. ASemantic Mapper that is responsible for translatinga workflow to a CRec and vice-versa, allowing theContext-Aware Extension to update the original work-flow on SWfMS. An Ontology that specifies the mainclasses used to represent workflow activities and theirparameters. Also, there are additional classes used to
Using�Healthcare�Planning�Features�to�Drive�Scientific�Workflows�on�the�Web
53

complement activity information (such as activationstatus) and associated content (for instance, patientdata). A CRec (resp. CRec’) is a Context Recordthat is an ontology instance that represents the currentstate of a workflow and all information regarding thepatient under care. A set of Adaptation Rules (AR),written in SWRL, that will be used with an Ontologyand a CRec to identify the changes recommended tothe current situation. A Context Adaptation Engine(CAEng) that uses an Ontology Reasoner to processthe AR combined to an Ontology and a CRec. Thereasoning updates CRec to guide the adaptations thatshould be made on workflow.
The architecture enables dynamic adaptation ofworkflows to a context as follows. A SWfMS is ac-cessed through a Web Interface (Figure 3, interaction1). A workflow is assigned to be executed on theSWfMS (on interaction 2) and the SWfMS loads it(interaction 3) and updates the Web Interface (inter-action 4). A user requests the SWfMS to start theexecuting workflow (interactions 5 and 6). When anactivity is performed, the Context-Aware Extensioncaptures the workflow state (interaction 7) and passesit to the Semantic Mapper (interaction 8). Next, theSemantic Mapper uses the workflow state to createan ontology instance that represents it (interaction 9)– CRec. The CAEng combines AR, Ontology, andCRec to identify the adaptations recommended to theworkflow and apply them to CRec, creating a newversion of it (CRec’. The Semantic Mapper receivesCRec’(interaction 10) and maps its data to the work-flow representation, passing it back to the Context-Aware Extension (interaction 11). The workflow onthe SWfMS is updated by the Context-Aware Exten-sion according to the new workflow (interaction 12).The SWfMS updates the Web Interface (interaction13). Finally, the user sees the adapted version of theworkflow (interaction 14).
Our architecture may be used on different sce-narios and on different SWfMS, but its componentscreated must be changed according to the scenario(e.g., rules and ontology customization) and platformadopted (e.g., Semantic Mapper).
6 INSTANTIATION ON THE WEB
We applied the principles behind our architecture tothe context of nursing care to attest the flexibility ofexecution of the workflows. The tasks used to con-struct the ontology and the rules were based on thePROCEnf system (Peres et al., 2009), developed andadopted by the hospital of the University Sao Paulo.PROCEnf is also in process of adoption at the our
Figure 3: Architecture for context-based workflow adapta-tion.
University Hospital1. Like most such systems, PRO-CEnf is heavily centered on offering health profes-sionals sets of forms to fill.
We chose PROCEnf among other reasons, be-cause we can reuse its components. Moreover, givenour need to validate our implementation with actualusers, this choice offers to the nursing staff of our Uni-versity Hospital a set of forms and vocabulary they arefamiliar with.
Based on PROCEnf and on the work described in(Doenges and Moorhouse, 2008), we described theflow of a patient’s admission and monitoring processin a hospital. In a general way, the process includesan iterative step which is started by an anamnesis in-terrogation, which is an assessment phase to evaluatethe patients’ conditions. Next, there is the analysisof recorded data to diagnose the problem and to iden-tify expected outcomes (prognosis). Based on thoseexpected outcomes, health interventions are plannedand applied. To identify whether the outcomes wereachieved or not, the intervention results are analyzedand the amamnsesis records are updated. If the treat-ment achieves the expected outcomes, the patient canbe released. Otherwise, a new iteration occurs.
To model PROCEnf forms as workflow activities,we created an ontology. In our current stage of re-search, we have about 30 activity classes involvedwith the diagnosis phase. Those classes are directlyrelated to the PROCEnf system. As can be seen on
1The hospital complex of the University of Camp-inas alone receives about 500,000 appointments, with over43,000 admissions and 34,000 surgical interventions peryear.
WEBIST�2014�-�International�Conference�on�Web�Information�Systems�and�Technologies
54
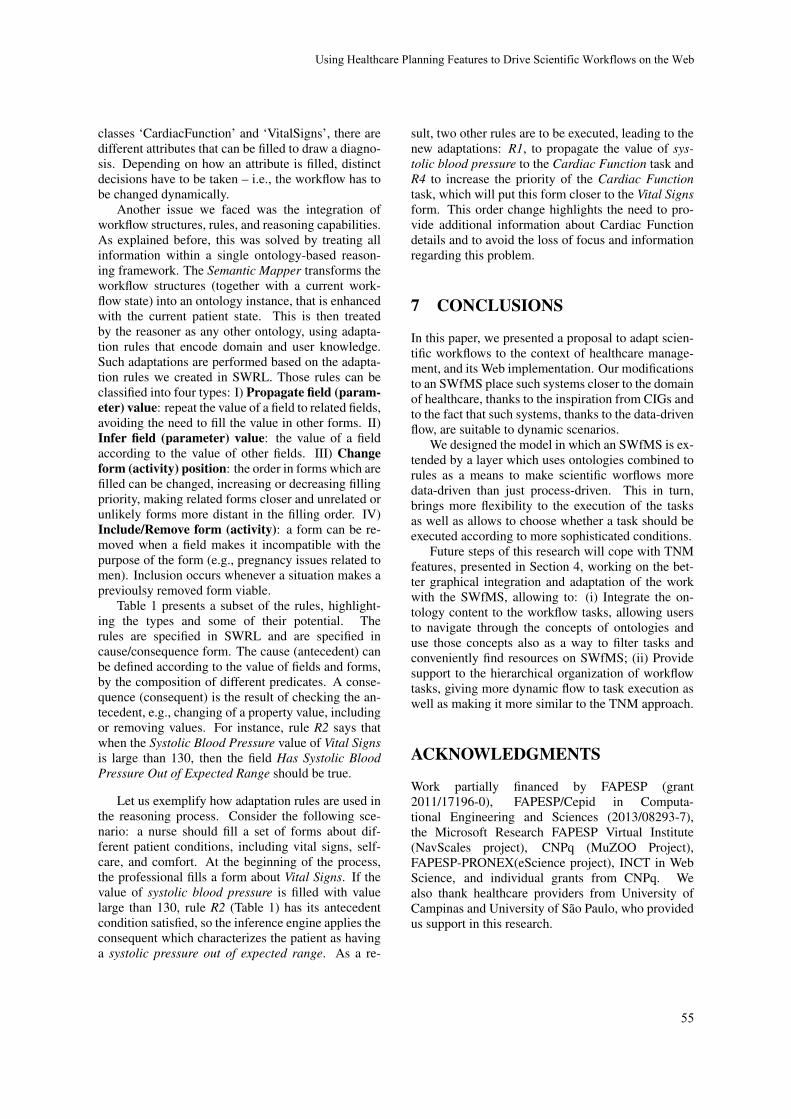
classes ‘CardiacFunction’ and ‘VitalSigns’, there aredifferent attributes that can be filled to draw a diagno-sis. Depending on how an attribute is filled, distinctdecisions have to be taken – i.e., the workflow has tobe changed dynamically.
Another issue we faced was the integration ofworkflow structures, rules, and reasoning capabilities.As explained before, this was solved by treating allinformation within a single ontology-based reason-ing framework. The Semantic Mapper transforms theworkflow structures (together with a current work-flow state) into an ontology instance, that is enhancedwith the current patient state. This is then treatedby the reasoner as any other ontology, using adapta-tion rules that encode domain and user knowledge.Such adaptations are performed based on the adapta-tion rules we created in SWRL. Those rules can beclassified into four types: I) Propagate field (param-eter) value: repeat the value of a field to related fields,avoiding the need to fill the value in other forms. II)Infer field (parameter) value: the value of a fieldaccording to the value of other fields. III) Changeform (activity) position: the order in forms which arefilled can be changed, increasing or decreasing fillingpriority, making related forms closer and unrelated orunlikely forms more distant in the filling order. IV)Include/Remove form (activity): a form can be re-moved when a field makes it incompatible with thepurpose of the form (e.g., pregnancy issues related tomen). Inclusion occurs whenever a situation makes aprevioulsy removed form viable.
Table 1 presents a subset of the rules, highlight-ing the types and some of their potential. Therules are specified in SWRL and are specified incause/consequence form. The cause (antecedent) canbe defined according to the value of fields and forms,by the composition of different predicates. A conse-quence (consequent) is the result of checking the an-tecedent, e.g., changing of a property value, includingor removing values. For instance, rule R2 says thatwhen the Systolic Blood Pressure value of Vital Signsis large than 130, then the field Has Systolic BloodPressure Out of Expected Range should be true.
Let us exemplify how adaptation rules are used inthe reasoning process. Consider the following sce-nario: a nurse should fill a set of forms about dif-ferent patient conditions, including vital signs, self-care, and comfort. At the beginning of the process,the professional fills a form about Vital Signs. If thevalue of systolic blood pressure is filled with valuelarge than 130, rule R2 (Table 1) has its antecedentcondition satisfied, so the inference engine applies theconsequent which characterizes the patient as havinga systolic pressure out of expected range. As a re-
sult, two other rules are to be executed, leading to thenew adaptations: R1, to propagate the value of sys-tolic blood pressure to the Cardiac Function task andR4 to increase the priority of the Cardiac Functiontask, which will put this form closer to the Vital Signsform. This order change highlights the need to pro-vide additional information about Cardiac Functiondetails and to avoid the loss of focus and informationregarding this problem.
7 CONCLUSIONS
In this paper, we presented a proposal to adapt scien-tific workflows to the context of healthcare manage-ment, and its Web implementation. Our modificationsto an SWfMS place such systems closer to the domainof healthcare, thanks to the inspiration from CIGs andto the fact that such systems, thanks to the data-drivenflow, are suitable to dynamic scenarios.
We designed the model in which an SWfMS is ex-tended by a layer which uses ontologies combined torules as a means to make scientific worflows moredata-driven than just process-driven. This in turn,brings more flexibility to the execution of the tasksas well as allows to choose whether a task should beexecuted according to more sophisticated conditions.
Future steps of this research will cope with TNMfeatures, presented in Section 4, working on the bet-ter graphical integration and adaptation of the workwith the SWfMS, allowing to: (i) Integrate the on-tology content to the workflow tasks, allowing usersto navigate through the concepts of ontologies anduse those concepts also as a way to filter tasks andconveniently find resources on SWfMS; (ii) Providesupport to the hierarchical organization of workflowtasks, giving more dynamic flow to task execution aswell as making it more similar to the TNM approach.
ACKNOWLEDGMENTS
Work partially financed by FAPESP (grant2011/17196-0), FAPESP/Cepid in Computa-tional Engineering and Sciences (2013/08293-7),the Microsoft Research FAPESP Virtual Institute(NavScales project), CNPq (MuZOO Project),FAPESP-PRONEX(eScience project), INCT in WebScience, and individual grants from CNPq. Wealso thank healthcare providers from University ofCampinas and University of Sao Paulo, who providedus support in this research.
Using�Healthcare�Planning�Features�to�Drive�Scientific�Workflows�on�the�Web
55

Table 1: Adaptation Rules.
Rule Antecedent Consequent TypeR1 CardiacFunction(?cf), VitalSigns(?vs), systolicBloodPressure(?vs, ?x) systolicBloodPressure(?cf, ?x) Propagate ValueR2 VitalSigns(?vs), systolicBloodPressure(?vs, ?x), float[>= 130.0f](?x) hasSystolicPressureOut-
OfExpectedRange(?vs, true)Infer Value
R3 VitalSigns(?vs), isActive(?vs, true), hasSystolicPressureOutOfExpectedRange(?vs, false), CardiacFunc-tion(?cf)
position(?cf, 99) Decrease Priority
R4 VitalSigns(?vs), hasSystolicPressureOutOfExpectedRange(?vs, true), isActive(?vs, true), CardiacFunc-tion(?cf), position(?vs, ?po)
position(?cf, ?po) Increase Priority
R5 ValuesAndBeliefs(?va), Evaluation(?e), hasPatient(?e, ?p), isActive(?e, true), hasAge(?p, ?age), inte-ger[<= 12](?age)
isRemoved(?va, true) Remove
R6 ValuesAndBeliefs(?va), Evaluation(?e), hasPatient(?e, ?p), isActive(?e, true), hasAge(?p, ?age), inte-ger[>12](?age), isRemoved(?va, true)
isRemoved(?va, false) Include
REFERENCES
Aigner, W. and Miksch, S. (2006). Carevis: Integratedvisualization of computerized protocols and tempo-ral patient data. Artificial Intelligence in Medicine,37(3):203–218.
Bharathi, S., Chervenak, A., Deelman, E., Mehta, G., Su,M.-H., and Vahi, K. (2008). Characterization of sci-entific workflows. 2008 Third Workshop on Workflowsin Support of Large-Scale Science, pages 1–10.
Dallien, J., MacCaull, W., and Tien, A. (2008). Initial workin the design and development of verifiable workflowmanagement systems and some applications to healthcare. In Proceedings of the 2008 5th InternationalWorkshop on Model-based Methodologies for Perva-sive and Embedded Software, MOMPES ’08, pages78–91, Washington, DC, USA. IEEE Computer Soci-ety.
Dang, J., Hedayati, A., Hampel, K., and Toklu, C. (2008).An ontological knowledge framework for adaptivemedical workflow. Journal of biomedical informatics,41(5):829–36.
Davidson, S. and Freire, J. (2008). Provenance and sci-entific workflows: challenges and opportunities. InSIGMOD Conf., pages 1345–1350. Citeseer.
Doenges, M. and Moorhouse, M. (2008). Application ofnursing process and nursing diagnosis: an interactivetext for diagnostic reasoning. G - Reference, Informa-tion and Interdisciplinary Subjects Series. F.A. Davis.
Gooch, P. and Roudsari, A. (2011). Computerization ofworkflows, guidelines, and care pathways: a review ofimplementation challenges for process-oriented healthinformation systems. Journal of the American Medi-cal Informatics Association : JAMIA, 18(6):738–48.
Hull, D., Wolstencroft, K., Stevens, R., Goble, C., Pocock,M. R., Li, P., and Oinn, T. (2006). Taverna: a tool forbuilding and running workflows of services. Nucleicacids research, 34(-):W729–32.
Miksch, S., Kosara, R., Shahar, Y., and Johnson, P. D.(1998). AsbruView: Visualization of Time-Oriented,Skeletal Plans. pages 11–18.
Ogasawara, E., Paulino, C., Murta, L., Werner, C., and Mat-toso, M. (2009). Experiment line: Software reuse inscientific workflows. In Winslett, M., editor, Scientificand Statistical Database Management, volume 5566of Lecture Notes in Computer Science, pages 264–272. Springer Berlin Heidelberg.
Panzarasa, S. and Stefanelli, M. (2006). Workflow manage-ment systems for guideline implementation. Neuro-logical sciences : official journal of the Italian Neu-rological Society and of the Italian Society of ClinicalNeurophysiology, 27 Suppl 3:S245–9.
Peleg, M., Tu, S., Bury, J., Ciccarese, P., Fox, J., Greenes,R. A., Miksch, S., Quaglini, S., Seyfang, A., Short-liffe, E. H., Stefanelli, M., and et al. (2003). Compar-ing computer-interpretable guideline models: A case-study approach. JAMIA, 10:2003.
Peres, H. H. C., Cruz, D. D. A. L. M. D., Lima, A. F. C.,Gaidzinski, R. R., Ortiz, D. C. F., Trindade, M. M. E.,Tsukamoto, R., and Conceicao, N. B. (2009). Desen-volvimento de Sistema Eletronico de DocumentacaoClınica de Enfermagem estruturado em diagnosticos,resultados e intervencoes. Revista da Escola de En-fermagem da USP, 43(spe2):1149–1155.
Schick, S., Meyer, H., Bandt, M., and Heuer, A. (2012). En-abling yawl to handle dynamic operating room man-agement. In Daniel, F., Barkaoui, K., and Dustdar,S., editors, Business Process Management Workshops(2), volume 100 of Lecture Notes in Business Infor-mation Processing, pages 249–260. Springer.
Sonntag, M., Karastoyanova, D., and Deelman, E. (2010).Bridging the gap between business and scientificworkflows: Humans in the loop of scientific work-flows. In e-Science (e-Science), 2010 IEEE Sixth In-ternational Conference on, pages 206–213.
Unertl, K. M., Weinger, M. B., Johnson, K. B., and Lorenzi,N. M. (2009). Describing and modeling workflowand information flow in chronic disease care. Jour-nal of the American Medical Informatics Association: JAMIA, 16(6):826–36.
Vilar, B. S. C. M., Medeiros, C. B., and Santanche, A.(2013). Towards adapting scientific workflow systemsto healthcare planning. In HEALTHINF - Interna-tional Conference on Health Informatics.
Wei Tan, M. Z. (2013). Business and Scientific Workflows:A Web Service-Oriented Approach. Wiley.
WfMC (1999). Terminology and Glossary Document Num-ber WFMC-TC-1011 - Issue 3.0. Technical report,Workflow Management Coalition.
WEBIST�2014�-�International�Conference�on�Web�Information�Systems�and�Technologies
56

Linked Data Strategy to Achieve Interoperability in Higher Education
Guillermo García Juanes, Alioth Rodríguez Barrios, José Luis Roda García, Laura Gutiérrez Medina, Rita Díaz Adán and Pedro González Yanes
School of Computer Science, University of La Laguna, San Cristóbal de La Laguna, Spain [email protected], [email protected], [email protected], {lgutmed, ritadiazadan}@gmail.com,
Keywords: Linked Data, Open Data, Interoperability, High Education.
Abstract: An important challenge in centres of higher education is the use of Linked Data strategy to connect currently existing multiple information systems. These information systems are usually independent from one another, and the ability to obtain information by connecting different sources of data involves, in most cases, unacceptable costs and effort. In this work, we have developed a platform based on Linked Data that permits the interoperability of different sources of data, both internal as well as external. This interoperability is achieved by 1) the use of higher education ontologies, and 2) the use of a process that begins with the analysis of the data sources to be connected, followed by mapping of the closest ontologies, and ends with the generation and publication of data in valid formats for Linked Data. The final product permits stakeholders inside and outside the university to be able to make queries of two or more datasets in different information systems at the same time.
1 INTRODUCTION
The term Open Data concerns offering to society the data collected by public institutions, which, when handled by third-parties, can be of great value for the development of applications, reports, etc. The principal objective of the Open Data strategy is to offer transparency, participation and collaboration in the publishing of information, in standard formats, open and interoperable, facilitating its access and permitting its re-use (Office, 2012). This is nothing more than data that belong to public administration being used, by individuals or companies, with or without commercial ends, provided that use does not constitute public administration activity. There are many institutions that currently publish open data in different formats (Fundación CTIC, 2013) (Bauer and Kaltenböck, 2012).
The objective of Linked Data is to give meaning to connections that are found in different datasets so that machines can obtain more relevant information making use of techniques from the Semantic Web (Berners-Lee, 2006).
The relationship between Open Data and Linked Data was proposed by Tim Berners-Lee who
suggested a way of measuring the degree of quality of data published from an Open Data portal, where, if those data were to be published using Linked Data principles, the highest degree that a portal may achieve would be obtained (Berners-Lee, 2006).
The data interoperatibility is achieved through the followig of the Linked Data principles. These vocabularies must cover a wide range of concepts related to the university´s system. From the institution, the departments, the teachers, including the courses, programmes and study material, credits, theory classes, practical classes and laboratory classes, etc., a vocabulary must cover all these aspects to be able to be linked and make full use of the Linked Data strategy.
In this work we present a prototype that was developed at the University of La Laguna (ULL), where various different groups played a part: the Planning and Analysis Office, the ULL Information Technology Service, and the Taro Research Group. The project concerns the demonstration of how Linked Open Data offers a range of benefits for the procurement of information that are not achieved through other conventional methods. The higher education system comprises multiple information systems, some of which are quite complex. This
57
paper is, therefore, concerned with the application of Linked Data strategy, methods and techniques to some of these university systems.
2 RELATED WORK
The development of a platform such as the one intended requires a prior state-of-the-art study, with particular emphasis in the area of ontologies that may be re-used with those that are going to model concepts within the scope of higher education.
In the search for ontologies closer to our problem, we made use of semantic search engines such as Watson1 or Swoogle2 apart from search engines for key words or known repositories like Linked Open Vocabularies (LOV)3.
There is a great set of ontologies related to the field of education, but we limited our search for ontologies to those that could be adapted as far as possible to our case. They were also evaluated for their quality based on whether they were structured, well documented and in current use by other organizations.
From this analysis, candidate ontologies were obtained for re-use in our system. The most relevant ones, related to universities, were Academic Institution Internal Structure Ontology (AIISO)4, Teaching Core Vocabulary Specification (TEACH)5 and The Bowlogna Ontology6. AIISO describes the organizational structure of the university very simply, showing the hierarchy and relationships between different agencies. In that regard, it provides classes for modelling: teaching staff, subjects, departments, centres, etc. The TEACH and Bowlogna ontologies describe the part more related to teaching, that is, they try to represent the relationship between a program, the subjects that comprise it, the teaching workload and responsibilities of teachers for each of the subjects. Bowlogna is a more special case, representing the organization of the university following the Bologna Plan currently being implemented by European universities (Demartini et al., 2013).
All things considered, a university is still an organization, aside from the academic element, which can be modelled with organizations
1 http://watson.kmi.open.ac.uk/WatsonWUI/ 2 http://swoogle.umbc.edu/ 3 http://lov.okfn.org/dataset/lov/ 4 http://vocab.org/aiiso/schema 5 http://linkedscience.org/teach/ns/# 6 http://diuf.unifr.ch/main/xi/bowlogna
ontologies like W3C’s The Organization Ontology7 or Buildings and Rooms Vocabulary8. Finally, we intend to define the situation for premises and staff, and CTIC’s Vocabulary of Localizations9 or vCard Ontology10 can be used for that, providing a series of classes with which to model addresses, municipalities, provinces, etc. These ontologies are very important as in many cases they are standard and widely used, as their use is not limited to a specific field.
Another important action was to take examples of the strategies established by other universities as a step towards the publication of Linked Data. They usually follow a basic scheme, re-using as far as possible existing ontologies, and if these do not cover all of the necessary concepts, the ontology itself is created or extended from an existing one. This can be seen in the Open Data sections of the University of Oxford11, the University of Southampton12 and the Open University13, that usually have an Open Data portal from which you can consult information modelled in different forms (navigation, queries, etc.). These portals are usually based on RDF software, Virtuoso being the most popular, although there are other tools such as Pubby 14, Fuseki15 or D2R16.
The general situation is that when choosing ontologies that adapt themselves more to universities, there is consensus for the use of several of those named above, but none ever achieves a complete representation of the information, which is why it is necessary to create another to be able to link it with the other ontologies.
To achieve the publication of data, the ontologies must be published in such a way that they are dereferenceable and well documented, permitting the rest of the world to re-use them, thus achieving interconnections and future inferences of information (W3C, 2008) (Heath and Bizer, 2011).
In our case, we do not enter into the creation of ontologies in depth, as that was not one of the principal objectives that we wished to demonstrate, but rather interoperability between systems that
7 http://www.w3.org/TR/vocab-org/ 8 http://vocab.deri.ie/rooms 9 http://purl.org/ctic/infraestructuras/localizacion 10 http://www.w3.org/TR/vcard-rdf/ 11 https://data.ox.ac.uk/ 12 http://data.southampton.ac.uk/ 13 http://data.open.ac.uk/ 14 http://wifo5-03.informatik.uni-mannheim.de/pubby/ 15 http://jena.apache.org/documentation/serving_data/ 16 http://d2rq.org/
WEBIST�2014�-�International�Conference�on�Web�Information�Systems�and�Technologies
58
implement Linked Data as a procedure prior to publication of data, bringing it into a real context.
3 MOTIVATION AND GOALS
The University of La Laguna is a large-scale public higher education institution. It currently involves more than 26,000 people including students, teachers and administration staff, distributed between 25 centres, 60 departments and other areas. There are also close links with private entities (companies, foundations and institutes) and public institutions such as the local island administration Cabildo de Tenerife, City Councils and the Government of the Canary Islands.
The organizational structure is decentralized, and many functions are delegated to each of the departments, centres and services. This fact has a special relevance to this work, as we have had to study the functions of the principal organizational units in depth. Each unit works almost independently, each one takes responsibility for handling administrative processes that have been delegated to them, collecting and maintaining the information necessary to operate (accounting, academic administration, libraries, ITC centres, etc.).
With respect to this work, there are many information systems that offer support to the university as a whole. Financial Management and Academic Management are among the main ones that are found. The first system takes care of the management of the administration staff and the teaching staff; while the second is concerned with the enrolment processes and everything related to teaching. Both aggregate a large quantity of data and are more or less controlled forming a fairly homogenous architecture. They use the same group of software development technologies, the same database management system, and, most relevant, they are under the responsibility of the same IT department. Although there is a certain homogeneity between these systems, extracting information across both systems continues to be a complex and costly task.
Apart from larger, older systems, there are smaller, independent systems, of great value to the institution. These have appeared over time according to the needs of services or departments. Examples of these systems are: the research service, the directories of the institution´s staff, quality control, diaries and events, etc. These are usually controlled by different areas and each one can have different
software. It is at this point that this work begins to have
meaning. There are many cases where management, statistical or other similar information is requested from other institutions within the university itself. Most of these systems work independently from one another, and when it is necessary to consult information from two or more sources, it is necessary to establish connections between the different systems. Due to the complexity and internal structure of each system, staff have to make a particularly strenuous effort to obtain the data.
The main motivation to work in this environment and to offer a practical solution to these problems based on Linked Data is, on the one hand, the existence of the real problem of access to different sources of data, and on the other, that the university´s staff is quite able to accept new proposals and finally, the existence of a real and concrete problem with which to apply Linked Data methods and techniques (for the re-use of ontologies, generation of RDF links, publication of data and consumption of published data).
The key challenge is to offer the university a solution for offering information obtained from a variety of sources, without modifying the current systems, as many are legacy systems and are so assimilated within the institution that a change to them could cause chaos. This is the solution that we present below.
4 LINKED DATA PROCESS
The process of linking data from the different information systems has followed an iterative and incremental methodology (Suárez de Figueroa Baonza, 2010). This process has allowed us to obtain valuable results from the first iterations and refine them continuously. As a consequence, the Linked Data process is provided with the necessary flexibility to tackle the changes related to the requirements in any phase of the process.
The working methodology comprises six differentiated phases inspired by methodologies commonly used for the publication of Linked Data (Poveda-Villalón, 2012); (Corcho et al., 2013); (Fernández-López, 1997); (Atemezing et al., 2012) and adapted to the needs of the particular working environment. These phases are divided between: specification of data to be published, data modelling, generation of data in RDF, publication, linking and exploitation.
Given the peculiarities of linking data in our
Linked�Data�Strategy�to�Achieve�Interoperability�in�Higher�Education
59
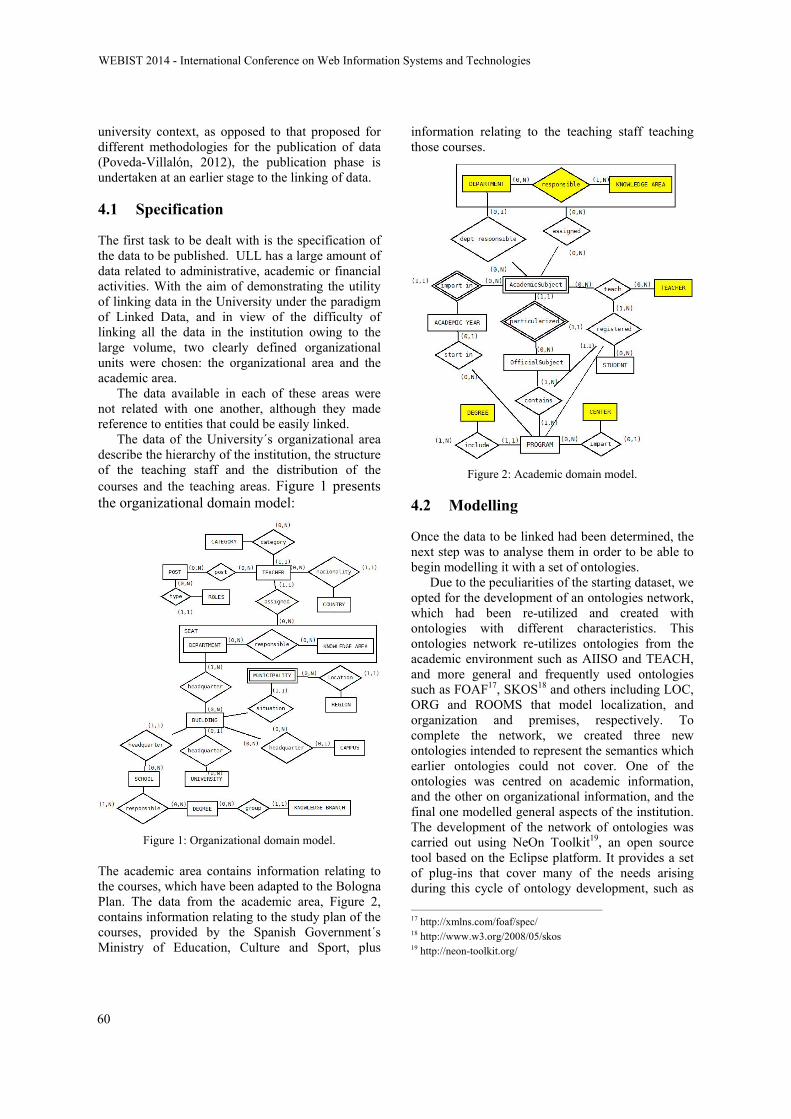
university context, as opposed to that proposed for different methodologies for the publication of data (Poveda-Villalón, 2012), the publication phase is undertaken at an earlier stage to the linking of data.
4.1 Specification
The first task to be dealt with is the specification of the data to be published. ULL has a large amount of data related to administrative, academic or financial activities. With the aim of demonstrating the utility of linking data in the University under the paradigm of Linked Data, and in view of the difficulty of linking all the data in the institution owing to the large volume, two clearly defined organizational units were chosen: the organizational area and the academic area.
The data available in each of these areas were not related with one another, although they made reference to entities that could be easily linked.
The data of the University´s organizational area describe the hierarchy of the institution, the structure of the teaching staff and the distribution of the courses and the teaching areas. Figure 1 presents the organizational domain model:
Figure 1: Organizational domain model.
The academic area contains information relating to the courses, which have been adapted to the Bologna Plan. The data from the academic area, Figure 2, contains information relating to the study plan of the courses, provided by the Spanish Government´s Ministry of Education, Culture and Sport, plus
information relating to the teaching staff teaching those courses.
Figure 2: Academic domain model.
4.2 Modelling
Once the data to be linked had been determined, the next step was to analyse them in order to be able to begin modelling it with a set of ontologies.
Due to the peculiarities of the starting dataset, we opted for the development of an ontologies network, which had been re-utilized and created with ontologies with different characteristics. This ontologies network re-utilizes ontologies from the academic environment such as AIISO and TEACH, and more general and frequently used ontologies such as FOAF17, SKOS18 and others including LOC, ORG and ROOMS that model localization, and organization and premises, respectively. To complete the network, we created three new ontologies intended to represent the semantics which earlier ontologies could not cover. One of the ontologies was centred on academic information, and the other on organizational information, and the final one modelled general aspects of the institution. The development of the network of ontologies was carried out using NeOn Toolkit19, an open source tool based on the Eclipse platform. It provides a set of plug-ins that cover many of the needs arising during this cycle of ontology development, such as
17 http://xmlns.com/foaf/spec/ 18 http://www.w3.org/2008/05/skos 19 http://neon-toolkit.org/
WEBIST�2014�-�International�Conference�on�Web�Information�Systems�and�Technologies
60
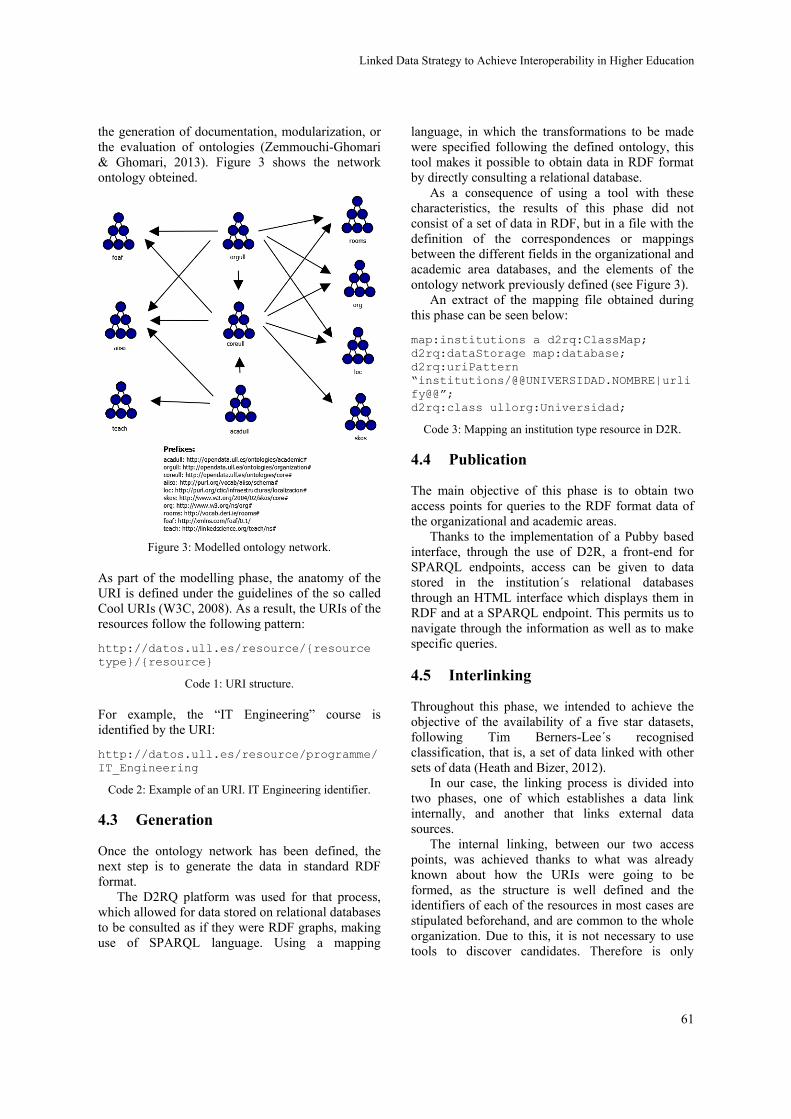
the generation of documentation, modularization, or the evaluation of ontologies (Zemmouchi-Ghomari & Ghomari, 2013). Figure 3 shows the network ontology obteined.
Figure 3: Modelled ontology network.
As part of the modelling phase, the anatomy of the URI is defined under the guidelines of the so called Cool URIs (W3C, 2008). As a result, the URIs of the resources follow the following pattern: http://datos.ull.es/resource/{resource type}/{resource}
Code 1: URI structure.
For example, the “IT Engineering” course is identified by the URI: http://datos.ull.es/resource/programme/IT_Engineering
Code 2: Example of an URI. IT Engineering identifier.
4.3 Generation
Once the ontology network has been defined, the next step is to generate the data in standard RDF format.
The D2RQ platform was used for that process, which allowed for data stored on relational databases to be consulted as if they were RDF graphs, making use of SPARQL language. Using a mapping
language, in which the transformations to be made were specified following the defined ontology, this tool makes it possible to obtain data in RDF format by directly consulting a relational database.
As a consequence of using a tool with these characteristics, the results of this phase did not consist of a set of data in RDF, but in a file with the definition of the correspondences or mappings between the different fields in the organizational and academic area databases, and the elements of the ontology network previously defined (see Figure 3).
An extract of the mapping file obtained during this phase can be seen below: map:institutions a d2rq:ClassMap; d2rq:dataStorage map:database; d2rq:uriPattern “institutions/@@UNIVERSIDAD.NOMBRE|urlify@@”; d2rq:class ullorg:Universidad;
Code 3: Mapping an institution type resource in D2R.
4.4 Publication
The main objective of this phase is to obtain two access points for queries to the RDF format data of the organizational and academic areas.
Thanks to the implementation of a Pubby based interface, through the use of D2R, a front-end for SPARQL endpoints, access can be given to data stored in the institution´s relational databases through an HTML interface which displays them in RDF and at a SPARQL endpoint. This permits us to navigate through the information as well as to make specific queries.
4.5 Interlinking
Throughout this phase, we intended to achieve the objective of the availability of a five star datasets, following Tim Berners-Lee´s recognised classification, that is, a set of data linked with other sets of data (Heath and Bizer, 2012).
In our case, the linking process is divided into two phases, one of which establishes a data link internally, and another that links external data sources.
The internal linking, between our two access points, was achieved thanks to what was already known about how the URIs were going to be formed, as the structure is well defined and the identifiers of each of the resources in most cases are stipulated beforehand, and are common to the whole organization. Due to this, it is not necessary to use tools to discover candidates. Therefore is only
Linked�Data�Strategy�to�Achieve�Interoperability�in�Higher�Education
61
necessary that each system can be able to obtain the identifiers from the other system to create the URIs. In order to do this, the systems retrieve them from the other source using a SQL script. This process is only needed when new resource appears and not each time that a query is done.
If this information was not held, it would be necessary to make public the same resources in both domains (to duplicate the occurrences) and then to use linking tools, with owl:sameAs properties, to indicate that they are the same resource.
The external linking is possible when external data sources exist. For that, we undertook an analysis, and due to the scarcity of reliable sources, we limited ourselves to linking with dbpedia.org and linkeddata.es.
This link entails a process in which candidate links have to be found, and we intended to automate it as far as possible, using a Silk tool20 and Link Specification Language (LSL) configurations. Once the tool was implemented, results that corresponded with the external resources that could be linked to our data were generated. These links were added to the database LINKED table in the following form: http://opendata.ull.es/resource/{resourceid} owl:sameAs http://{external resource}
Code 4: Structure of sameAs statement.
This table is like a repository or cache where all the links that are found are stored and managed, containing: the URI of the internal resource, the URI of the external resource and the property that links them. In this way we are able to make links not only using owl:sameAs but also other useful properties, as well as management fields for configuration issues. This table also allow us to determine if a link is valid, if has been manually blocked, the date that the link was discovered, etc.
Once the links are added, the information is republished automatically with the external links. This is thanks to the added dynamic property in the D2R map that takes care of reviewing the linked table and showing the properties that exist there: d2rq:belongsToClassMap map:CLASSTOLINK; d2rq:dynamicProperty "@@linked.propiedad@@"; d2rq:uriColumn "linked.objeto"; .
Code 5: Mapping sameAs statement in D2R.
20 http://wifo5-03.informatik.uni-mannheim.de/bizer/silk/
4.6 Exploitation
When addressing this phase, we started from the two SPARQL access points available for the consultation of data from the University´s organizational and academic areas.
The objective of this phase was the availability of a single point of access to the platform that would permit federated queries on the two groups of data. To achieve that objective, a Fuseki server was deployed, allowing serve data in RDF format using HTTP. This service offers data to users through a RESTful API and an enriched SPARQL endpoint, from which so called SPARQL++ queries may be made (Polleres et al., 2007). With this service, complex queries can be made using proprietary databases or external endpoints. Previously, these types of queries were only possible using scripts and by the acquisition of data from sources outside the organization.
Here is an example of a complex query making use of two data sources: PREFIX coreull: < … > PREFIX orgull: < … > PREFIX acaull: < … > SELECT ?NameDept (COUNT(?planning) as ?numberPlanning) WHERE { SERVICE <http://orgull/sparql> { ?teacher orgull:miembro ?dept . ?dept coreull:nombre ?NameDept . } SERVICE <http://acadull/sparql> { ?planning acaull:tieneProfesor ?teacher . } } GROUP BY ?NameDept ORDER BY ?NameDept .
Code 6: Query example: “How many subjects does each department teach?”
5 FINAL PRODUCT
The project finally developed is presented in Figure 4. We reproduced the complete system on a development server simulating the real system used at ULL. As it can be seen in the figure, we have two independent information systems: Academic and Organizational Management. Both systems reside in different databases supported by MySQL. An architecture based on D2R was developed above each of the two current systems for the mapping of the relational database to RDF files. Each system physically resides in a different server and has,
WEBIST�2014�-�International�Conference�on�Web�Information�Systems�and�Technologies
62

therefore, a separate portal for each environment. Each D2RQ server had an SPARQL endpoint
added and a web interface (Pubby-type) where corresponding information could be obtained.
A supervised process to discover and update external links was added using the Silk tool. More over, Fuseki service was also added as a junction for the whole system, enabling SPARQL++ queries.
Figure 4: Architecture diagram.
Finally, it was possible to obtain an open data publication portal based on web semantics, meeting Linked Data requirements. Users will be able to use it to consult University information as well for making queries at several SPARQL points (so called SPARQL Endpoints) that may be linked to the published data. An example of this would be making a query such as “Distribution of students by province and their geo-localization to be shown on a map”, represented in SPARQL as: PREFIX coreull: <http://orgull/ontologies/core#> PREFIX orgull: <http://orgull/ontologies/organization# PREFIX acaull: <http://orgull/ontologies/academic#> PREFIX georss: <http://www.georss.org/georss/> SELECT ?Region (COUNT(?student) as ?numberStudents) ?geoloc WHERE {
SERVICE < http://acadull/sparql > { ?student a acaull:Alumno; coreull:provincia ?reg . } SERVICE < http://orgull/sparql > { ?reg coreull:nombre ?Region ; owl:sameAs ?linked . } SERVICE < http://dbpedia.org/sparql > { ?linked georss:point ?geoloc . }
} GROUP BY ?Region .
Code 7: Query with external data sources. Recount of students and their geolocalization.
The final platform enables users with simple SPARQL queries to make cross-queries of data from different sources that were previously inaccessible or of very complex interoperability. The end users, both inside and outside the University, have available a tool based on Linked Data to obtain the information they need. If case of need, it would be possible to add a user interface to make its use more user-friendly.
6 CONCLUSIONS
In this work, we have developed a genuine platform based on the Linked Data strategy in which universities may publish data and link with internal and external sources. The interlinking of the different university data sources will permit greater interoperability and can achieve new knowledge from this relationship.
To deploy our prototype in the university production servers, it is necessary to consider two important aspects: the integration costs of our platform with the university systems and also the university staff training in linked data. We firmly believe that both aspects can be addressed as we have the necessary technical expertise.
Whit this project, the institution has a tool to make complex queries, which hitherto existing systems could only handle with great effort. Moreover, the same tool could be offered to other local, island, and regional institutions in such a way that they could make queries directly, rather than through a service request to university personnel.
The ontologies most related to higher education have been revised, and improvements have been proposed to cover concepts not covered by existing ontologies. The network of ontologies used in this work covers ten ontologies, of which only three have been newly created.
Finally, as a summary of the work undertaken, we would stress that effective analysis of the initial data produces a lower number of errors in the re-use and definition of ontologies. We would also indicate that the process of creation of ontologies was based on the basic terms needed to demonstrate the viability of the project. We will continue to research several concepts that are beginning to be requested, in more depth, once the first version of the platform has been validated. With respect to the technological platform, a viability study will have to be undertaken to compare the effort required to incorporate triple store systems like Virtuoso, etc.
Linked�Data�Strategy�to�Achieve�Interoperability�in�Higher�Education
63

We should not forget that any new system for the organization would also implicate the commitment of human resources and materials for its development and future maintenance.
ACKNOWLEDGEMENTS
We would like to thanks to Andrés Palenzuela from the Planning and Analysis Office of University of La Laguna in the Canary Islands. His interest and support has made this Project viable.
REFERENCIAS
Atemezing, G., Corcho, O., Garijo, D., Mora, J., Poveda-Villalón, M., Rozas, P., Villazón-Terrazas, B. (2012). Transforming meteorological data into linked data. En Semantic Web. IOS Press.
Bauer, F., & Kaltenböck, M. (2012). Linked Open Data: The Essentials A Quick Start Guide for Decision Makers.
Berners-Lee, T. (2006). Linked Data. Recuperado el 11 de 10 de 2013, de http://www.w3.org/DesignIssues/ LinkedData.html
Corcho, O., Fernández-Lopez, M., & Gómez-Perez, A. (2003). Methodologies, tools and languages for building. Where is their meeting point? En Data & Knowledge Engineering (págs. 41–64). Elsevier.
Demartini, G., Enchev, I., Gapany, J., & Cudré-Mauroux, P. (2013). The Bowlogna Ontology: Fostering Open Curricula and Agile Knowledge Bases for Europe’s Higher Education Landscape. Semantic Web – Interoperability, Usability, Applicability, 4(1), 115.
Fernández-López, M. y.-P. (1997). METHONTOLOGY: From Ontological Art Towards Ontological Engineering. AAAI-97 Spring Symposium Series, (págs. 24-26). Stanford University, EEUU.
Fundación CTIC. (2013). Public Dataset Catalogs Faceted Browser. Recuperado el 11 de 10 de 2013, de http://datos.fundacionctic.org/sandbox/catalog/faceted/
Heath, T., & Bizer, C. (2011). Linked Data: Evolving the Web into a Global Data Space (First ed.). Morgan & Claypool.
Office, C. (2012). Open Data White Paper: Unleashing the Potential. TSO (The Stationery Office).
Polleres, A., Scharffe, F., & Schindlauer, R. (2007). SPARQL++ for Mapping Between RDF Vocabularies. En On the Move to Meaningful Internet Systems 2007: CoopIS, DOA, ODBASE, GADA, and IS (págs. 878-896). Springer Berlin Heidelberg.
Poveda-Villalón, M. (2012). A Reuse-Based Lightweight
Method for Developing Linked Data Ontologies and Vocabularies. En The Semantic Web: Research and Applications (págs. 833-837). Springer Berlin Heidelberg.
Suárez de Figueroa Baonza, M. d. (2010). NeOn Methodology for Building Ontology. M.C. Doctoral Thesis. Universidad Politécnica de Madrid.
W3C. (2008). Best Practice Recipes for Publishing RDF Vocabularies. Recuperado el 11 de 10 de 2013, de http://www.w3.org/TR/swbp-vocab-pub/
W3C. (2008). Cool URIs for the Semantic Web. Recuperado el 11 de 10 de 2013, de http://www.w3.org/TR/cooluris/
Zemmouchi-Ghomari, L., & Ghomari, A. R. (2013). Process of Building Reference Ontology for Higher Education. World Congress on Engineering 2013, III, 1595-1600.
WEBIST�2014�-�International�Conference�on�Web�Information�Systems�and�Technologies
64

Interdependent Components for the Development of Accessible XUL Applications for Screen Reader Users
Xabier Valencia1, Myriam Arrue1, Halena Rojas-Valduciel2 and Lourdes Moreno2 1EGOKITUZ: Laboratory of HCI for Special Needs, University of the Basque Country (UPV/EHU),
Informatika Fakultatea 20018, Donostia, Spain 2Computer Science deparment, Universidad Carlos III de Madrid, 28911, Leganés, Spain {xabier.valencia, myriam.arrue}@ehu.es, [email protected], [email protected]
Keywords: Accessibility, User Testing, Expert Review, XUL, Mozilla Firefox Browser, Screen Reader.
Abstract: Web applications based on XUL technology have reached great development. This technology enables developers to easily create extensions and add-ons of Mozilla Firefox browser. It is essential to keep in mind accessibility in the development of such applications in order to not discriminate user groups. In this sense, standards and good practices have to be considered. Furthermore, User-Centred Design and Inclusive Design approaches should be followed as they involve users with disabilities in the development process. This paper presents an analysis of XUL accessibility guidelines created by Mozilla Foundation. An accessible XUL application has been designed and developed based on the guidelines. User testing has been conducted by two blind users revealing several important accessibility barriers. In addition, an expert review process was carried on by a blind accessibility consultant. They all used JAWS screen reader. The results obtained show that the existing guidelines conformance is not enough for ensuring accessibility of the application. There are other factors dependent on assistive technologies and user agent that have to be considered in the development of accessible XUL applications.
1 INTRODUCTION
The use of Internet has experienced a vertiginous growth in the last few years. Users access the Web employing diverse devices, modalities and technologies. Due to this diversity, inclusion approaches are necessary in order to provide full accessibility to Web contents and avoid the exclusion of some user groups.
Users with disabilities are the most affected by accessibility barriers on the Web. They access the Web using assistive technologies, for example, a screen reader that relates content in audio to the visually impaired. It is essential to develop accessible web applications to ensure appropriate assistive technology support.
Currently, research work regarding web browser functionality augmentation is gaining attention. Some examples of Mozilla Firefox add-ons are (Greasmonky, 2012), (Stylish, 2013) and (Turn off the Lights, 2013).
These augmented functionalities could be utilized by all users only if accessibility aspects are considered in their development process. Thus, a
comprehensive inclusive design paradigm for augmented browser functionalities should integrate User-Centred Design (UCD) methods and Inclusive Design approaches in addition to accessibility guidelines compliance (Lawton, 2007) (Newell, 2000).
The interest of “design for all” paradigm is rapidly increasing in the community and several efforts have been made in this way. In fact, there are several organizations concerned with web accessibility. They develop and maintain support resources for complying with accessibility standards such as guidelines. This is the the case of Mozilla Foundation (XUL, 2013b). In addition, it provides extension mechanisms to augment browser functionality and develop application add-ons for Mozilla Firefox through one specific technology such as XUL (XUL, 2013a).
The objective of this paper is to analyse the appropriateness of the set of accessibility guidelines defined for XUL technology. For achieving this objective, an accessible add-on for augmenting Mozilla Firefox browser functionalities has been developed. In the development process, a
65

comprehensive inclusive design paradigm has been applied, including UCD approach and user testing. User testing was performed by two screen reader users. Several accessibility barriers were observed in the testing which were later on evaluated by an expert screen reader user who works as an accessibility consultant. As a result, a review of the XUL accessibility guidelines and conclusions of the development process carried on are presented.
2 OVERVIEW
2.1 XUL
XUL (XML User Interface Language) is a XML based language to create User Interfaces (UIs), in the Mozilla platform. The main goal of the language is to allow easy development of cross-platform add-on applications which run on any Mozilla integrated platform.
It separates the program logic from the user interface components, facilitating the work of the designers and programmers. This approach is also applied in languages like (QML, 2013) or (XAML, 2013).
XUL is based on existing standards such as XML, HTML, CSS, DOM and Javascript. In addition, the Cross-Platform Component Object Model (XPCOM) technology can be applied (XPCOM, 2013) when operating system functionalities are required.
2.2 Related Work
In the development processes, technological, human and legislative aspects must be considered in order to manage accessibility issues. Consequently, related work from numerous disciplines should be taken into account. In the standardization field, the W3C ought to be highlighted along with the Web Accessibility Initiative (WAI) (WAI, 2013). The Web Content Accessibility Guidelines (WCAG) 2.0 (WCAG 2.0, 2008) is one of the most important components, and is viewed as the official standard.
The ISO 9241-210:2010 standard provides a framework for following and incorporating a UCD approach into a particular context of accessibility. Following methods that integrate usability and accessibility in products design processes will ensure that users with and without disabilities could be able to access. This is the distinguishing characteristic that User Sensitive Inclusive Design (Abascal et al., 2007) has; the user with disabilities
is in mind. This work is focused on carrying out user testing technique in order to validate the accessibility included in a web application.
Several works related to XUL and accessibility has been found in the literature. These research works are related to developments of browser extensions for Mozilla Firefox. All of them are oriented to people with disabilities (Mirri et al., 2011) (Hanson et al., 2005).
Nevertheless, very few articles have been found that directly address the question of how to model accessibility according to the WCAG (Moreno et al, 2013), (Martin et al, 2010). An interesting attempt meriting particular mention is the Dante approach integrating the Web Authoring for Accessibility (WAfA) ontology (Yesilada et al, 2004) (Harper and Yesilada, 2007) for the visually impaired into WSDM (Plessers et al, 2005).
2.3 XUL Accessibility Guidelines
XUL language is based on web standards so its accessibility guidelines do not differ too much from previously published web accessibility guidelines.
The XUL accessibility guidelines are divided in six different sections: Keyboard Access, Assistive Information, Display, Human Computer Interaction, Media and Custom Widgets (XUL, 2013b). Each of one has a set of checkpoints to verify. For instance, the guideline Keyboard Access defines eight checkpoints that should be considered: one related to tab order, another one to keyboard shortcuts and so on.
All the guidelines and the related checkpoints can be seen as an accessibility checklist to be considered in order to evaluate the accessibility of a developed add-on application. The XUL accessibility guidelines document states a pass/fail statement to each checkpoint which could be applied in order to elaborate a checklist easy to verify by developers at design time. Table 1 presents the checklist for evaluating XUL accessibility guidelines.
3 EXPERIMENTAL DESIGN
3.1 Object of Study
The object of study is to analyse the appropriateness of XUL Accessibility Guidelines for the development of accessible XUL-based applications.
WEBIST�2014�-�International�Conference�on�Web�Information�Systems�and�Technologies
66
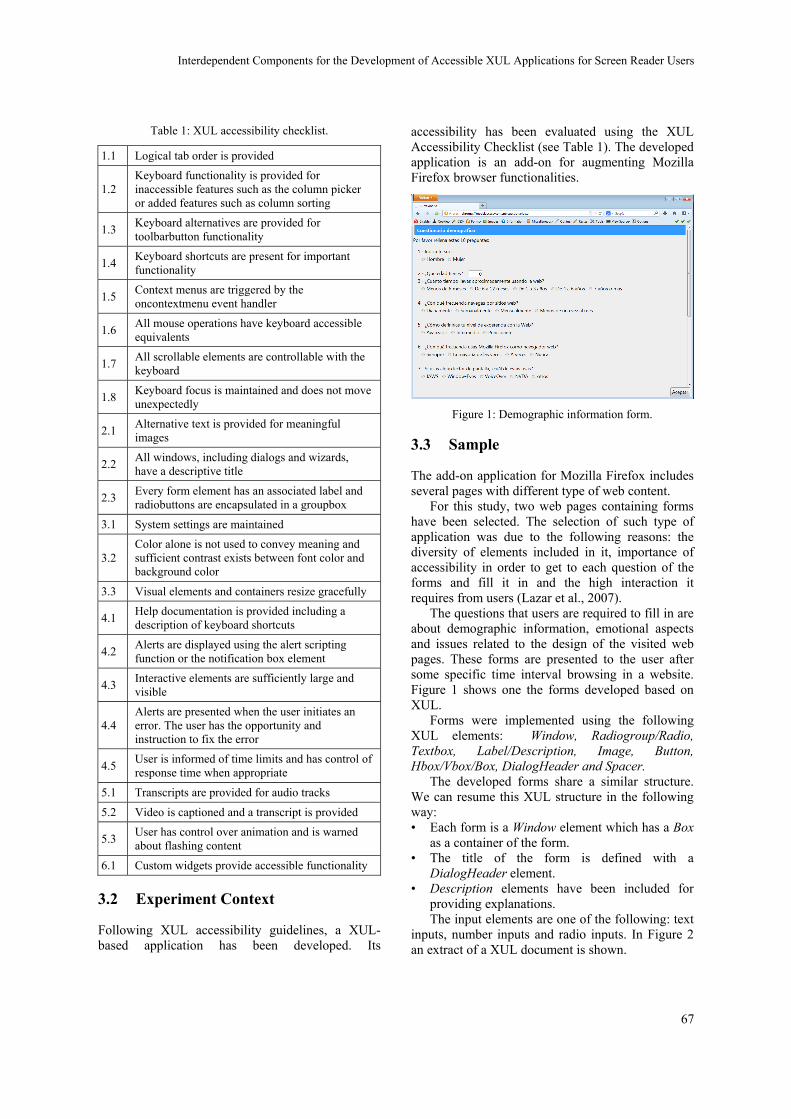
Table 1: XUL accessibility checklist.
1.1 Logical tab order is provided
1.2 Keyboard functionality is provided for inaccessible features such as the column picker or added features such as column sorting
1.3 Keyboard alternatives are provided for toolbarbutton functionality
1.4 Keyboard shortcuts are present for important functionality
1.5 Context menus are triggered by the oncontextmenu event handler
1.6 All mouse operations have keyboard accessible equivalents
1.7 All scrollable elements are controllable with the keyboard
1.8 Keyboard focus is maintained and does not move unexpectedly
2.1 Alternative text is provided for meaningful images
2.2 All windows, including dialogs and wizards, have a descriptive title
2.3 Every form element has an associated label and radiobuttons are encapsulated in a groupbox
3.1 System settings are maintained
3.2 Color alone is not used to convey meaning and sufficient contrast exists between font color and background color
3.3 Visual elements and containers resize gracefully
4.1 Help documentation is provided including a description of keyboard shortcuts
4.2 Alerts are displayed using the alert scripting function or the notification box element
4.3 Interactive elements are sufficiently large and visible
4.4 Alerts are presented when the user initiates an error. The user has the opportunity and instruction to fix the error
4.5 User is informed of time limits and has control of response time when appropriate
5.1 Transcripts are provided for audio tracks
5.2 Video is captioned and a transcript is provided
5.3 User has control over animation and is warned about flashing content
6.1 Custom widgets provide accessible functionality
3.2 Experiment Context
Following XUL accessibility guidelines, a XUL-based application has been developed. Its
accessibility has been evaluated using the XUL Accessibility Checklist (see Table 1). The developed application is an add-on for augmenting Mozilla Firefox browser functionalities.
Figure 1: Demographic information form.
3.3 Sample
The add-on application for Mozilla Firefox includes several pages with different type of web content.
For this study, two web pages containing forms have been selected. The selection of such type of application was due to the following reasons: the diversity of elements included in it, importance of accessibility in order to get to each question of the forms and fill it in and the high interaction it requires from users (Lazar et al., 2007).
The questions that users are required to fill in are about demographic information, emotional aspects and issues related to the design of the visited web pages. These forms are presented to the user after some specific time interval browsing in a website. Figure 1 shows one the forms developed based on XUL.
Forms were implemented using the following XUL elements: Window, Radiogroup/Radio, Textbox, Label/Description, Image, Button, Hbox/Vbox/Box, DialogHeader and Spacer.
The developed forms share a similar structure. We can resume this XUL structure in the following way: • Each form is a Window element which has a Box
as a container of the form. • The title of the form is defined with a
DialogHeader element. • Description elements have been included for
providing explanations. The input elements are one of the following: text
inputs, number inputs and radio inputs. In Figure 2 an extract of a XUL document is shown.
Interdependent�Components�for�the�Development�of�Accessible�XUL�Applications�for�Screen�Reader�Users
67

As it can be appreciated in Figure 2, a label has been attached to the radiogroup through the control attribute. This mechanism ensures that assistive technologies would adequately present the form to the user.
Figure 2: XUL extract for demographic information form.
The other input elements have been implemented similarly, ensuring that all title values are unique and that all labels were attached to the corresponding input element
The implemented application was verified by developers using the checklist presented in Table 1. Not all the checkpoints are relevant to the developed application as some of them are considered content not usually present in common forms. The results obtained in this initial evaluation are presented in Table 2.
All checkpoints in the checklist were fulfilled with the exception of item 4.1, the help function. It was decided not to include this function in this preliminary version. However, for upcoming development iterations, the help function will be incorporated. In conclusion, we would not expect interaction problems with the application as almost checkpoints were fulfilled. Therefore, accessibility of the application was ensured.
3.4 Participants
Two screen reader users with more than 6 years of expertise browsing the web were recruited for the user testing: a woman (User 1) and a man (User 2) whose ages were 30 and 40 respectively. User 1 considered herself as an intermediate Web browser user whereas User 2 considered himself as an advanced user.
They both use JAWS, but one of them (User 1) uses it infrequently as she prefers to use VoiceOver screen reader on Mac OS operating system. User 2 uses Windows and JAWS, but he does not usually use Firefox. Even though, both are Mozilla Firefox sporadic users.
The experimental sessions were carried out in the same lab. They were asked to bring their laptop so they used JAWS configured with their personal
preferences. The platform used was similar for both users: Windows operating system (User 1 used Windows XP and User 2 used Windows 7), JAWS 12 and Mozilla Firefox 22. Users were encouraged to report any barrier they detect when interacting with the XUL application. The sessions were recorded with a camera located behind the user in order to obtain information about the interaction. The interviews were taped with a voice recorder.
Table 2: The XUL accessibility checklist applied.
1.1 The tab order works correctly 1.4 Buttons have shortcuts
1.6 All actions are accessible from keyboard and mouse
1.7 The scroll can be done with the keyboard 1.8 The focus works as expected
2.1 The images have no alt text since are targeted to other users and it has nothing meaningful for blind
2.2 All windows have different titles 2.3 Labels are connected with their input element 3.1 Elements size has been set using “em” units
3.2 Elements colour have not meaning and the fonts and background has enough contrast
3.3 Flex elements has been used to avoid unexpected UI behaviours.
4.1 It is not provided in this draft version
4.2 Alerts are displayed using the alert scripting function
4.3 Form is clearly differentiated 4.4 Uncompleted form or errors are advised
In addition, an expert evaluation was performed by an expert screen reader user who has been working as ICT accessibility consultant at least for the last five years. All the evaluation was carried on at her usual working setting, and reported her findings by email.
3.5 Procedure
First, the XUL application was installed on users’ laptop. Then, all users were asked to perform two tasks. The first one consisted on freely navigate during five minutes in a concrete website (www.discapnet.com). Then, the application presented the first form to complete. The questions in this form were related to their navigation experience. The second task consisted on a search task on the same website with a limited time interval of ten minutes. Finally, the application presented the second form containing questions related to demographic data.
WEBIST�2014�-�International�Conference�on�Web�Information�Systems�and�Technologies
68
4 RESULTS
4.1 User Testing
4.1.1 User 1
This user experienced several barriers when filling in the forms developed with XUL. The barriers reported by the user are the following. Besides, related XUL guidelines are indicated in each case: Barrier 1.1: She was unable to know which answer
option was checked in the multiple-choice type questions. This occurred when the user wanted to verify that the selected answer was the correct one. She navigated with the virtual cursor of JAWS and it read the labels correctly. However, it only read the value of the option and informed that it was not checked even if it really was checked. Therefore, we had to tell her which option was selected in order to ensure that it was the desired one. (Related guideline: 2.3)
Barrier 1.2: She experienced navigation problems. Surprisingly, when she filled in a multiple-choice question, JAWS focus was moved to the first question of the form. Then, she had to navigate to the next question from the beginning of the form. This happened even though the program focus was at the correct position. (Related guidelines: 1.1, 1.8)
Barrier 1.3: JAWS shortcuts navigation feature did not work properly. Due to the difficulties she was having, she tried to navigate through the form using the JAWS shortcuts, like for instance, forms or headings shortcuts but it did not worked as expected. (Related guideline: 2.3)
Barrier 1.4: Problems for clicking on a button. She was unable to find the button to continue. The button was located at the end of the form and was accessible using tab or arrows. However, JAWS did not correctly detect this element. (Related guideline: 2.3)
4.1.2 User 2
This user experienced similar problems reported by User 1 except of Barrier 1.3 (he did not try this mode of navigation). In addition, he reported other barriers: Barrier 2.1: Problems with text input questions.
JAWS was unable to detect a text area element even if the focus was on one. Sometimes, he reported listening a label that was not the correct one. (Related guideline: 2.3)
Barrier 2.2: Alert messages were not adequately
presented. JAWS detected the alert windows but not the containing text. Therefore, he only could hear the default sound of the alert and “OK” button but he missed the alert message. (Related guideline: 4.2)
Barrier 2.3: Problems with numeric type inputs. Firefox adds special controls for this type of inputs. These controls are for entering the numeric value using two small buttons inside the element, one of them for increasing the value and the other for reducing it. These controls entered into conflict with his navigation controls. They are activated with keyboard arrows which were the navigation mode used by this user. Consequently, he was unable to correctly enter his age. (Related guidelines: 1.6, 2.3)
Barrier 2.4: JAWS read not existing options in the UI. He reported us that JAWS sometimes read text elements that were not in the UI. (Related guideline: 2.3)
4.1.3 Discussion of Results
The user testing carried on indicates that there are quite accessibility barriers in the developed XUL application, even if accessibility guidelines have been considered.
Some of the detected barriers are high impact ones as users could not complete the tasks without any assistance, for instance, barrier 1.4 (Problems for clicking on a button) experienced by both users. This barrier is related to activating the submit button of the forms. Users could not get to these buttons so they could not complete the tasks on their own. These types of barriers are accessibility problems, which should be documented in the accessibility guidelines. In the group of accessibility barriers should be also included the following ones: Barrier 1.1, Barrier 2.1, Barrier 2.2 and Barrier 2.3.
Other group of barriers detected in the user testing were of moderate impact, as they do not compromise the accessibility of the application. However, they make the application less usable and users can be disappointed inducing negatively in their accessibility perception. These barriers should be erased as well for ensuring a satisfactory user interaction. For instance, Barrier 1.3 (JAWS shortcuts navigation feature did not work properly) user has other alternatives of navigation with the screen reader so this problem does not compromise the correct completion of tasks. Even though, the inexistence of this barrier makes the application more usable and user experience could be more satisfactory. In the group of usability barriers should
Interdependent�Components�for�the�Development�of�Accessible�XUL�Applications�for�Screen�Reader�Users
69

be also included the following ones: Barrier 1.2 and Barrier 2.4.
The detected barriers influenced negatively in the user satisfaction when interacting with the XUL application and they both needed around 15 minutes to fill in each form. Considering that each form consisted of ten short questions the time spent is not acceptable.
There are remarkable differences between the results obtained by each user. User 1 detected only two high impact barriers (Barrier 1.1 and Barrier 1.4) whereas User 2 experienced more barriers of this type (Barrier 1.1, Barrier 1.4, Barrier 2.1, Barrier 2.2 and Barrier 2.3). They both used the same version of the screen reader but the navigation strategies applied can differ a lot from user to user. In addition, our opinion is that User 1 is a more experienced user. Our observation in the experimental sessions revealed that User 1 has a wide range of knowledge about functionalities of screen readers. This observation differs from the perception of their own expertise as User 1 defines herself as an intermediate user and User 2 as an advanced one.
All in all, accessibility guidelines should consider all potential barriers independently of assistive technology version used, navigation strategies applied and user expertise level.
4.1.4 Improvements to XUL Guidelines
As can be seen most of the barriers are related to those guidelines regarding form elements, like the guideline 2.3 or the keyboard related issues 1.1 or 1.8.
Tagging labels with the corresponding control seems to be not enough. It is essential to correctly identify all questions and provide mechanisms in order to alert user and assistive technology about the existence of a list of questions or choices. Adding a new XUL element to tag the whole form would allow assistive technologies to handle better the information and also ensure the correct behaviour of the screen reader cursor.
Orientation of screen reader users would considerably improve by applying a simple good practice: informing at the beginning of the form about the total number of questions in it and numbering each question.
Regarding the keyboard, the added controls and shortcuts could create conflicts with browser controls or shortcuts as well as with assistive technologies controls. In this sense, information about the shortcuts available in the most used
assistive technologies would be helpful. This would allow a better and more efficient navigation to the user and would avoid unexpected technology behaviour.
Finally, for the alert message issues, instead of using the standard alert element, the “notificationbox” should be used. In our preliminary tests, this element seemed to work better with JAWS. However, it may cause inconveniences to other type of users such as those using magnifiers. Another alternative solution could be to apply alert functions on the active window. This issue requires more investigation to carry on.
4.2 Expert Evaluation
Due to the distinct results obtained by the users and in order to obtain a factual knowledge of the situation; a review process was conducted by an expert blind screen reader user. She is a consultant on ICT accessibility.
She was asked to conduct a test with different versions of JAWS, Firefox and operating systems. A summary of the testing can be found in Table 3. Results of the testing show the strong dependency that XUL accessibility features have with the user agent, the operating system and version of the screen reader. For instance, checkpoint 2.2 “All windows have different titles” only can be correctly detected if the user interacts with the application on a Windows 7, JAWS 13 and Firefox 23 platform. The fulfilment of checkpoint 2.2 is not so essential for user interaction (the user could complete a task even if the title of windows are not correctly presented). However, the same platform is required for checkpoint 2.3 “Labels are connected with their input element”. This checkpoint is essential if the user is supposed to access and fill in questions presented in a form.
The expert noted that Firefox generates inaccessible HTML elements for the application interface. Therefore, JAWS does not correctly read them to the user. This is due to the way JavaScript implements and interprets the DOM. Visually, the element appears in the interface, but it is as if the element was non-existent in the DOM. The screen reader just ignores it.
In conclusion, the latest version of Firefox and JAWS (at least versions JAWS 13 and Firefox 23) seems to be the best combination for using the developed XUL application. Nevertheless, it is unusual that users have the latest versions of screen readers. The same occurs with browsers. Most of screen reader users use outdated browser versions
WEBIST�2014�-�International�Conference�on�Web�Information�Systems�and�Technologies
70

since the cursor mode of JAWS does not work with the latest versions. Sometimes this mode is necessary in order to access user interface elements that cannot be read as usually.
Table 3: Correspondence of XUL accessibility checklist with the expert review results.
1.1 Only in Firefox 23. 1.4 Better using Firefox 23 1.6 Only using Firefox 23 1.7 Only using Firefox 23 1.8 JAWS 13 and Firefox 23
2.1 When running the extension on Windows 7, using Firefox 23
2.2 Windows 7, JAWS 13 and Firefox 23 2.3 Only using JAWS 13 and Firefox 23 3.1 Good feature for low vision using a magnifier 3.2 Good feature for low vision 3.3 Better using Firefox 23 and JAWS 13, JAWS 14 4.1 - 4.2 Better using Firefox 23 4.3 When refreshing the virtual buffer of JAWS,
refresh the page or when the form is being read automatically
4.4 Only using Firefox 23 JAWS 13 and Windows 7
Some suggestions for improving the current version of the developed XUL application were indicated by the expert: The text for the questions should be defined as a
header element. The multiple-choice questions should define the
possible answers as a list element. Users should be provided by an input text element
for introducing the answer. This suggestion would increase the form response time, therefore it would be less efficient and usable. However, it would be accessible for screen reader users.
Implementing these suggestions would overcome some of the most significant problems that users will have probably to face to. Mainly when they do not use the latest versions of browser and screen reader.
5 LESSONS LEARNED
From the results obtained in user testing and expert evaluation, it is clear that there are extremely important accessibility barriers in the developed XUL application. The user testing can bring up problems that have not been detected previously.
Findings reported in section 4 also highlight the importance of testing applications with different versions of Firefox and screen reader. There are too
many differences between versions and possible combinations. Each combination has its strengths and weaknesses. Using the latest versions of each one seems to be the best solution. Even though, many people do not update their software, principally, due to the price of these updates. But sometimes there are some functionalities that the user is used to, that he cannot leave behind. For these reasons, it is crucial to ensure that the developed applications can be used in the wider range of versions as possible.
User agent developers should consider the accessibility barriers detected in this work. Universal access to existing augmented browser applications can be guaranteed only if inclusion design paradigms are adequately defined and applied.
In the mean time, a transitory solution could be to transform the application into a browser XUL element to display the forms coded in HTML inside the XUL code. As HTML accessibility issues have been more analysed and considered in the last decades. A great amount of documentation, tools and methods exist for making accessible HTML code. It would avoid the creation of the keyboard scripts, because the keyboard behaviour would work as expected and also reduces the workload. But the main advantage is that it would make possible a higher compatibility between different Firefox versions and screen readers.
Anyway, XUL accessibility guidelines should be reviewed in order to update issues regarding keyboard navigation, assistive technologies compatibility, forms elements tagging, etc. Not only to ensure that all elements are accessible but guarantee also the HTML-like behaviour so users do not get confused or disoriented during the interaction.
6 CONCLUSIONS
Web access to all users should be ensured, including people with disabilities who use assistive technology to access ICTs. Many organizations are concerned about this issue, and they work towards accessibility compliance. This is the case of the Mozilla Foundation that provides accessibility guidelines to apply when developers use their technologies like XUL.
This paper presents a study of XUL and its accessibility guidelines. We have developed an application for augmenting browser functionalities in XUL. The development process considered UCD approach with the aim of creating an accessible
Interdependent�Components�for�the�Development�of�Accessible�XUL�Applications�for�Screen�Reader�Users
71
application with form content type. User testing with 2 legally blind users was carried on in addition to accessibility guidelines conformance evaluation. The developed application seemed to be accessible according to XUL accessibility guidelines. However, the results gathered in the user testing indicated important accessibility barriers. Some of the detected barriers make the application not operable for screen reader users.
An expert evaluation has also been considered in this paper. A screen reader user with more than five years of experience as a consultant on ICT accessibility has conducted the review. The results reveal a strong dependence between platform used (versions of user agent, operating system and screen reader) and the accessibility barriers experienced by users.
The findings of this paper should be considered in next versions of XUL accessibility guidelines. Some of them could be included as guidelines whereas others could be considered as best practices.
This research was oriented to screen reader users and XUL applications containing forms. In the near future, there is a need of performing evaluation studies with more content type, other groups of users and other assistive technologies. Therefore, future work will be motivated to the evaluation and improvement of other XUL accessibility checkpoints not considered in this work. This research work will lead to ensure universal access to Mozilla Firefox add-on applications.
ACKNOWLEDGEMENTS
The authors gratefully acknowledge the support of the Spanish Ministry of Science and Innovation through Project ModelAccess (TIN2010-15549) and the MULTIMEDICA project (TIN2010-20644-C03-01).
EGOKITUZ is supported by the Department of Education, Universities and Research of the Basque Government (Eusko Jaurlaritza/Gobierno Vasco) through Grant# IT-395-10.
REFERENCES
Abascal, J and Azevedo, L. Fundamentals of Inclusive HCI. Design. (2007) Universal Access in Human Computer Interaction, 4th International Conference on Universal Access in Human-Computer Interaction, UAHCI 2007, Held as Part of HCI International 2007, Beijing, China, July 22-27.
Greasmonky (2012) http://wiki.greasespot.net/Main_ Page.
Hanson, V. L., Brezin, J., Crayne, S., Keates, S., Kjeldsen, R., Richards, J. T., Swart, C., & Trewin, S. (2005). Improving Web accessibility through an enhanced open-source browser. IBM Systems Journal, 44 (3), 573 - 588.
Hanson V. L., Richards. J. T., and Swart. C., (2008) Browser augmentation, Harper S. and Yesilada Y, Web Accessibility, Springer London, pp. 215-229.
Harper, S. and Yesilada, Y., (2007). Web Authoring for Accessibility (WAfA). Web Semantics: Science, Services and Agents on the World Wide Web. 5, 3, pp. 175-179.
Lawton S, H. (2007) Just Ask: Integrating Accessibility Throughout Design. Madison,: ET\Lawton, available at www.uiAccess.com/justask/
Lazar J, Allen A, Kleinman J, Malarkey C. (2007) What Frustrates Screen Reader Users on the Web: A Study of 100 Blind Users, International Journal of human-computer interaction, Taylor & Francis, 22 (3), pp. 247-269.
Martín, A, Rossi, G, Cechich, A and Gordillo, S. (2010) Engineering Accessible Web Applications. An Aspect-Oriented Approach. World Wide Web, Springer US 13 (4), pp. 419-440,
Mirri, S, Salomoni, P, and Prandi, C. 2011. Augment browsing and standard profiling for enhancing web accessibility. In Proceedings of the International Cross-Disciplinary Conference on Web Accessibility. ACM, New York, NY, USA, Article 5 , 10 pages.
Moreno L, Valverde F, Martínez P, Pastor O, (2013). Supporting accessibility in Web engineering methods: a methodological approach, January, 2013, Journal of Web Engineering , RINTON PRESS, INC, ISSN: 12 (3&4), pp. 1540-9589.
Newell, A.F.; Gregor, P. (2000) User Sensitive Inclusive Design: in search of a new paradigm. Proceedings on the 2000 conference on Universal Usability, pp. 39-44.
Plessers P, Casteleyn S, Yesilada Y, De Troyer O, Stevens R, Harper S, and Goble C (2005) Accessibility: A Web Engineering Approach. In Proceedings of the 14th International Conference on World Wide Web (WWW ’05) ACM, New York, NY, USA, pp. 353-362.
QML (2013) http://qt-project.org/doc/qt-5.0/qtquick/ qtquick-applicationdevelopers.html.
Stylish http://userstyles.org/ Turn off the Lights (2013) http://www.stefanvd.net/
project/turnoffthelights.htm. WAI (2013) http://www.w3.org/WAI/ WCAG 2.0 (2008). http://www.w3.org/TR/WCAG20/ XAML (2013) http://msdn.microsoft.com/en-us/
library/ms752059.aspx. XPCOM (2013) https://developer.mozilla.org/en-US/
docs/XPCOM. XUL (2013a) https://developer.mozilla.org/en-US/
docs/XUL. XUL Accessibility Guidelines (2013b)
https://developer.mozilla.org/en-US /docs/ XUL_ accessibility_guidelines.
WEBIST�2014�-�International�Conference�on�Web�Information�Systems�and�Technologies
72

Yesilada,Y., Harper, S., Goble, C. and Stevens. (2004) R. Dante annotation and transformation of web pages for visually impaired users. In The Thirteenth International World Wide Web Conference. ACM, New York, NY, USA, pp. 490-491.
Interdependent�Components�for�the�Development�of�Accessible�XUL�Applications�for�Screen�Reader�Users
73
Hypermodal Dynamic Media Synchronization and Coordination between WebRTC Browsers
Li Li1, Wen Chen2, Zhe Wang3 and Wu Chou1 1Shannon Lab, Huawei Technologies, Bridgewater, New Jersey, U.S.A. 2Contractor, Global Infotech Corporation, Kearny, New Jersey, U.S.A.
3CS Dept., Rutgers University, Piscataway, New Jersey, U.S.A. {li.nj.li, wu.chou}@huawei.com, [email protected], [email protected]
Keywords: Temporal Linkage, Synchronization Tree, RDF, Media Fragments URI, WebRTC, REST API.
Abstract: This paper describes a Web based real-time collaboration system, Hypermodal, based on the concept of temporal linkage between resources. The system allows the users to construct, manipulate and exchange temporal linkages organized as synchronization trees. The temporal linkage is defined by RDF <sync> predicate based on a novel use of Media Fragments URI and permits on-the-fly tree updates while the resources in the tree are playing. We propose RDF <mirror> predicate and a new protocol to correlate and initialize distributed synchronization trees without requiring clock synchronization. Moreover, we develop a new REST API optimized for efficient tree updates and navigations based on super nodes. The preliminary test results on a prototype system show the approach is feasible and promising.
1 INTRODUCTION
The true power of the Web is to organize distributed information in an unconstrained way through hypertext (Berners-Lee, 2000). With the vast amount of multimedia resources on the Web and the advent of WebRTC, there is an acute need to be able to link these real-time multimedia resources in an accurate and meaningful way.
The continuous nature of multimedia resources makes it insufficient to link them the way we link discrete documents or images. What we need is a new type of temporal linkage that can link intervals, regions or objects within multimedia resources. The application domains of such technology are wide open. We can link a person in a video stream to his home page so that the conference participants can find more about him without asking. When discussing a trip to Barcelona Spain, we can link the conversation to a Google map, a Wikipedia page, and a public transportation page about the city. Users of MOOCS websites can link part of an online video lecture to relevant segments of another video during a live discussion such that students can learn the same concepts from different professors. The agents that link the resources can also be machine programs, such as Speech Recognition, Machine Translation, or Face Tracking and Detection
engines. For example, a moderator can schedule conference topics and a topic search engine can link resources relevant to the topics on time into the conference.
Temporal linkages can even link discrete resources without a temporal dimension, by treating them as continuous resources whose content does not change in small time scale. They can also link abstract resources that have a temporal dimension but no intrinsic content, such as a session. This generalization gives us the ability to temporarily link any types of resources in anywhere in a uniform way.
This paper describes a real-time collaboration system Hypermodal based on the concept of temporal linkage. The system allows the users to construct, manipulate and exchange temporal linkages in a meaningful way in real-time. Our goal is to create a mutual feedback loop between the system and the Web: any Web resources can be linked to the system and the links created by the system become part of the Web. To achieve this goal, we use as many standards as possible such that the components processing the temporal linkages can be developed independently but fully interoperate. Under this guideline, we address the following research issues in this paper.
If not constrained, the temporal linkages can
74

form an arbitrary directed graph which is difficult to manage for both users and machines. To solve this problem, we propose RDF <sync> predicate to define a generic temporal linkage based on a novel use of W3C Media Fragments URI standard (Troncy, 2012), such that we can construct synchronization trees, instead of directed graphs, to represent temporal linkages.
During a collaboration session, the synchronization trees are not static but are constructed incrementally and may change at any time when the resources in the tree are playing. To support on-the-fly updates, we develop a mechanism to play individual <sync> linkages without interrupting the resources in play.
In our system, whenever a user modifies a synchronization tree, the modification may propagate to other remote trees so all users have the same view. However, WebRTC Web browsers assign different URIs to the same multimedia resource, making it impossible to exchange <sync> linkages between synchronization trees that share the same resource. To address this problem, we propose RDF <mirror> predicate and a new protocol to correlate and initialize distributed synchronization trees without requiring clock synchronization between browsers and servers.
The components in our system need a protocol to communicate their updates to the synchronization trees. However, current RDF query and update languages are not designed for efficient updates to synchronization trees. To address this problem, we develop a novel REST API to navigate and update synchronization trees based on the concept of super node.
The rest of this paper is organized as follows. Section 2 surveys the related work. Section 3 defines the synchronization tree based on the <sync> and <mirror> relations. Section 4 describes how to initialize synchronization trees using WebRTC call control protocol. Section 5 introduces the REST API for managing the synchronization. Section 6 describes our prototype implementation and experimental results, and we conclude the paper with Section 7.
2 RELATED WORK
The approach described in this paper is different from the screen/application sharing offered by many Web conference systems. In screen sharing, shared content is read-only to all users except the owner, whereas in our approach, shared resources are
interactive to all users. Screen sharing requires more network bandwidth to send the encoded video than the REST API to coordinate distributed synchronization trees. For example, Skype (Skype, 2013) requires at least 128 kbits/s for screen sharing, whereas we estimate the bandwidth required by our REST API is lower than 5 kbits/s. Furthermore, screen sharing creates a loophole for the Same Origin Policy (Rescorla, 2013), whereas our approach enforces this policy.
WebRTC (Bergkvist, 2013) is an ongoing joint effort between W3C and IETF to develop Web (JavaScript) and Internet (codec and protocol) standards to enable P2P real-time communication between Web browsers without any external plug-ins. Several open source Web browsers, including Chrome (WebRTC Chrome) and Firefox (WebRTC Firefox), already support some WebRTC functions and demonstrate certain degree of interoperability.
SMIL (Bulterman, 2008) is a XML dialect to express temporal synchronization between multimedia resources. However, SMIL does not support dynamic media synchronization. Once a SMIL document begins to play, we cannot modify the document to add new media or change the synchronization relations between existing media.
Nixon (Nixon, 2013) describes a research agenda for Linked Media, inspired by the Linked Data initiative, where the main approach is to link multimedia based on the conceptual relations between the fragments of the multimedia. Li et al (Li, 2012) describes Synote, a system to interlink multimedia fragments based on RDF and Media Fragments URI. Oehme et al (Oehme, 2013) describes a system to link a video to Web resources and overlay the resources on top of the video. Mozilla Popcorn Maker (Popcorn Maker) is an open source JavaScript library that allows a user to create multimedia presentations by layering Web information, e.g. Google map or Wikipedia page, at different intervals and regions of an online video.
However, all these approaches are for single user presentations or based on ad-hoc languages, not for multi-user and on-the-fly resource synchronization based on temporal linkage.
3 SYNCHRONIZATION TREE
Figure 1 illustrates the smallest Hypermodal system with two Web browsers connected by a Web server, where the synchronization trees are stored in the browsers and the <mirror> linkages are stored on the server.
Hypermodal�-�Dynamic�Media�Synchronization�and�Coordination�between�WebRTC�Browsers
75

Figure 1: Basic Hypermodal system architecture.
A synchronization tree consists of nodes that define the intervals of resources based on Media Fragments URI, and edges that define temporal linkages between the nodes based on our RDF <sync> predicate, as illustrated in Figure 2, where the nodes are rendered as horizontal lines, whose lengths indicate the intervals, and the edges as vertical arrows whose positions indicate synchronization points. Both trees are rooted at the same session resource identified by URI0. The <mirror> linkages that link the same resources shared between the trees are rendered as the curved arrows.
Figure 2: Correlations between tree A (top) and tree B (bottom).
Synchronization tree does not constrain the resources in any way as long as they can be identified by Media Fragments URI. For example,
we can even synchronize two different intervals of the same video. If we treat the unique resources, not the intervals of the resources, as nodes, they can form a directed graph linked by the <sync> linkage. However, a tree is a more accurate representation of <sync> linkages, because different intervals of the same resource can be updated independently as distinct resources. For instance in Figure 2, the same Wikipedia page (URI6) occurs as two nodes in two <sync> linkages (A4 and A7). When one linkage is changed, the other one is not affected. But if the page is changed, it will be reflected on both linkages.
Synchronization trees are constructed dynamically when the resources in the tree are playing: 1) new edges can be added anywhere by inserting RDF <sync> triples (edges); 2) the intervals and synchronization points of a resource can be changed by modifying the Media Fragments URI (nodes). This process is detailed in Sections 4 and 5.
3.1 The <Sync> Predicate
We propose <sync> RDF predicate whose subject and object are Media Fragments URIs. If xs,xe,ys,ye are nonnegative integers that denote the start and end time of a resource in second, then the canonical triple:
<URI_X#t=xs,xe> <sync> <URI_Y#t=ys,ye> instructs the user agent to play the interval [sy,ey) of resource URI_Y within the interval [sx,ex) of resource URI_X. For example, the following triple:
<A_URI1#t=50> <sync> <URI5#t=30,120>
plays the interval [30, 120) of resource URI5 when resource A_URI1 reaches the 50th second and before it ends.
The <sync> linkage assigns different meanings to Media Fragments URI based its role in a <sync> triple: the subject interval [xs,xe) defines synchronization points on URI_X, not a new resource extracted from URI_X, whereas the object interval [ys,ye) defines a new resource extracted from URI_Y. This is why we can simultaneously attach many resources to intervals of URI_X while URI_X is playing, but at the same time maintain the tree structure by breaking URI_Y into independent portions.
The canonical <sync> triple requires the user agents to know the absolute play time of resources. This is difficult in distributed system when the machine clocks are not synchronized. To address this problem, we introduce two extensions to Media Fragments URI: relative delay and event
Web Server <mirror> triples
Translation
Page A Tree A <sync>
Page B Tree B <sync>
Browser A Web RTC
Browser B Web RTC
Web
RTP media
REST API REST API
WEBIST�2014�-�International�Conference�on�Web�Information�Systems�and�Technologies
76
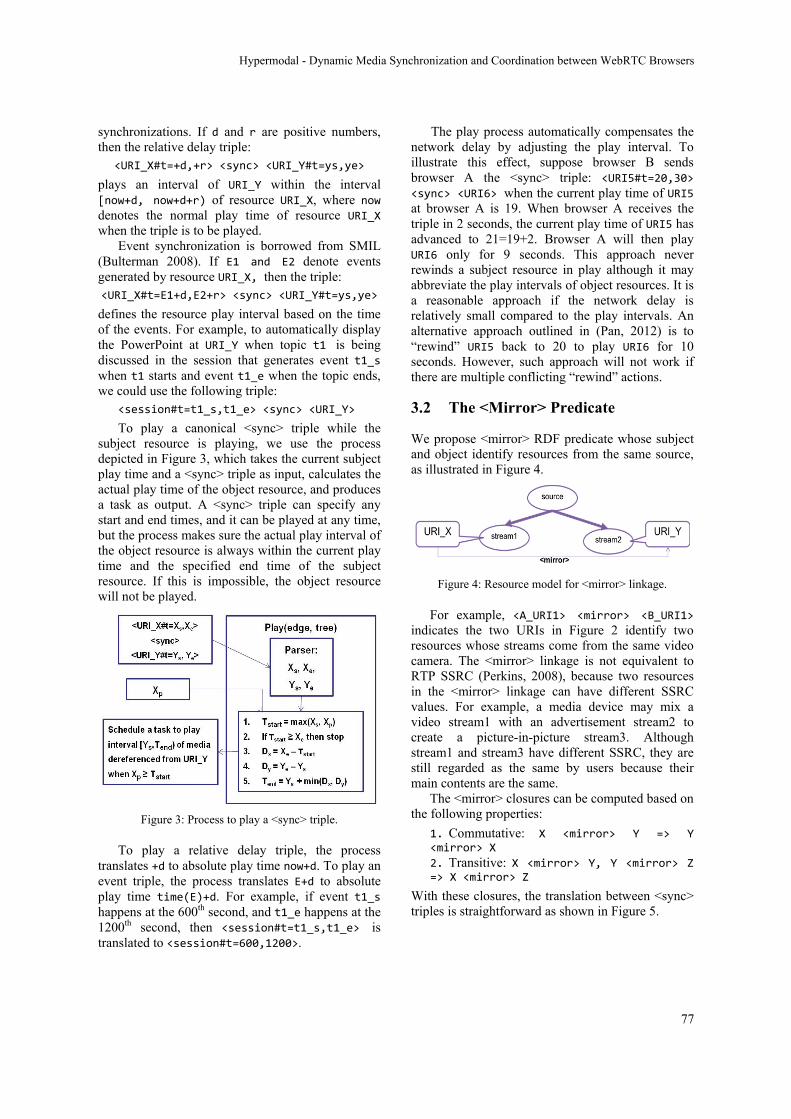
synchronizations. If d and r are positive numbers, then the relative delay triple:
<URI_X#t=+d,+r> <sync> <URI_Y#t=ys,ye>
plays an interval of URI_Y within the interval [now+d, now+d+r) of resource URI_X, where now denotes the normal play time of resource URI_X when the triple is to be played.
Event synchronization is borrowed from SMIL (Bulterman 2008). If E1 and E2 denote events generated by resource URI_X, then the triple: <URI_X#t=E1+d,E2+r> <sync> <URI_Y#t=ys,ye>
defines the resource play interval based on the time of the events. For example, to automatically display the PowerPoint at URI_Y when topic t1 is being discussed in the session that generates event t1_s when t1 starts and event t1_e when the topic ends, we could use the following triple:
<session#t=t1_s,t1_e> <sync> <URI_Y>
To play a canonical <sync> triple while the subject resource is playing, we use the process depicted in Figure 3, which takes the current subject play time and a <sync> triple as input, calculates the actual play time of the object resource, and produces a task as output. A <sync> triple can specify any start and end times, and it can be played at any time, but the process makes sure the actual play interval of the object resource is always within the current play time and the specified end time of the subject resource. If this is impossible, the object resource will not be played.
Figure 3: Process to play a <sync> triple.
To play a relative delay triple, the process translates +d to absolute play time now+d. To play an event triple, the process translates E+d to absolute play time time(E)+d. For example, if event t1_s happens at the 600th second, and t1_e happens at the 1200th second, then <session#t=t1_s,t1_e> is translated to <session#t=600,1200>.
The play process automatically compensates the network delay by adjusting the play interval. To illustrate this effect, suppose browser B sends browser A the <sync> triple: <URI5#t=20,30>
<sync> <URI6> when the current play time of URI5 at browser A is 19. When browser A receives the triple in 2 seconds, the current play time of URI5 has advanced to 21=19+2. Browser A will then play URI6 only for 9 seconds. This approach never rewinds a subject resource in play although it may abbreviate the play intervals of object resources. It is a reasonable approach if the network delay is relatively small compared to the play intervals. An alternative approach outlined in (Pan, 2012) is to “rewind” URI5 back to 20 to play URI6 for 10 seconds. However, such approach will not work if there are multiple conflicting “rewind” actions.
3.2 The <Mirror> Predicate
We propose <mirror> RDF predicate whose subject and object identify resources from the same source, as illustrated in Figure 4.
Figure 4: Resource model for <mirror> linkage.
For example, <A_URI1> <mirror> <B_URI1> indicates the two URIs in Figure 2 identify two resources whose streams come from the same video camera. The <mirror> linkage is not equivalent to RTP SSRC (Perkins, 2008), because two resources in the <mirror> linkage can have different SSRC values. For example, a media device may mix a video stream1 with an advertisement stream2 to create a picture-in-picture stream3. Although stream1 and stream3 have different SSRC, they are still regarded as the same by users because their main contents are the same.
The <mirror> closures can be computed based on the following properties:
1. Commutative: X <mirror> Y => Y <mirror> X
2. Transitive: X <mirror> Y, Y <mirror> Z => X <mirror> Z
With these closures, the translation between <sync> triples is straightforward as shown in Figure 5.
Hypermodal�-�Dynamic�Media�Synchronization�and�Coordination�between�WebRTC�Browsers
77

Figure 5: translation based on <mirror> closures.
4 TREE INITIALIZATION
When a user joins a collaboration session, the synchronization tree is initialized automatically by the system with the session and whatever media streams the user chooses to send and receive. To avoid performance overhead, the best approach is to embed the tree initialization protocol within the regular session establishment protocol. Figure 6 illustrates this technique using WebRTC offer/answer protocol (Rosenberg, 2002) with two additional messages ack and ok. The server sends the browsers the session URI and play time in regular answer (t1 at step 6) and ack (t2 at step 8) messages so that browsers can attach local media resources to the session at the correct time. The browsers send the server the correlation relations in ack (step 7) and ok (step 11) messages so that the server can derive the <mirror> relations between local URIs from the correlations. The correlation is established from media stream identifier (msid) maintained by WebRTC API.
When a browser wants to attach a resource to the session, it must know the current session time. However, the session time is maintained by the server clock, whose rate is unknown to the browser. One solution is to synchronize the clocks of the browsers and the server. But this requires additional protocol stack (e.g. NTP), which is often not available on the browsers and servers. This paper proposes two alternative approaches without requiring any dedicated time synchronization protocol.
In the server-based approach, the browsers use relative delay URI and let the server to figure out the session play time. For example, browser A can send <URI0#t=+0> <sync> <A_URI1> to the server, which calculates the session play time tx by: tx=now–d(S,X) according to the current session
time now and the network delay d(S,X)≥0 between the browser and the server. The advantage of this approach is that the browser does not need to know the session time maintained by the server. The constraint is that the server needs to store the synchronization trees for the browsers.
Figure 6: Tree initialization and correlation process.
In the client-based approach, each browser estimates the current session play time using its own clock. When a browser first receives the session time t0 at its local time t1, it records these numbers. When it sends a <sync> triple at time t2≥t1, it estimates the current session time tx by: tx=t0+t2‐t1 and uses tx in the <sync> triple. The advantage of this approach is that server does have to store the synchronization trees. The disadvantage is that the estimated session time may be inaccurate when the client clock differs from the server clock.
5 SYNCHRONIZATION TREE REST API
In our system, users can frequently add <sync> triples, update the triples, or delete a triple. Users may also navigate and explore synchronization trees. Different user agents may accept different formats of a synchronization tree, e.g. XML, JSON or RDF Turtle (Manola, 2007). Servers and user agents need to cache and store the trees at different locations and formats. These use cases led us to choose REST API to encapsulate the synchronization trees.
There are several approaches (Gearon, 2013, Sesame REST API, Berners-Lee 2001, Tummarello 2007) to update RDF graphs using REST API (ref).
WEBIST�2014�-�International�Conference�on�Web�Information�Systems�and�Technologies
78
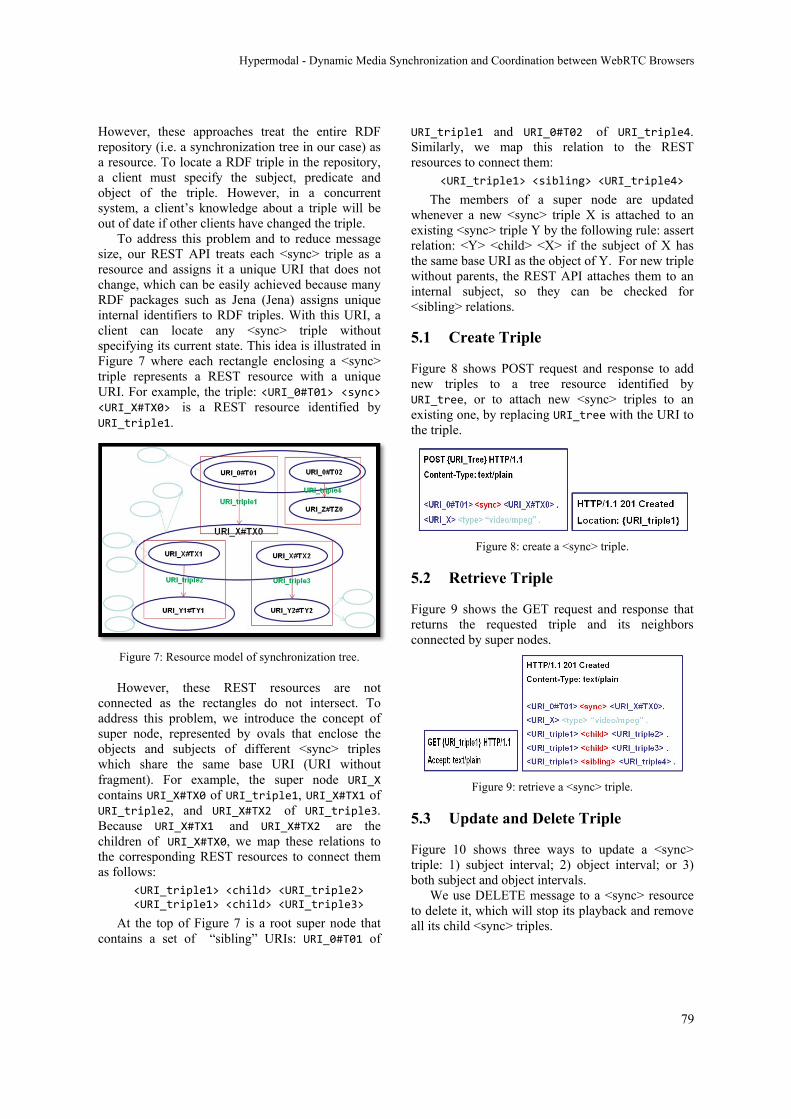
However, these approaches treat the entire RDF repository (i.e. a synchronization tree in our case) as a resource. To locate a RDF triple in the repository, a client must specify the subject, predicate and object of the triple. However, in a concurrent system, a client’s knowledge about a triple will be out of date if other clients have changed the triple.
To address this problem and to reduce message size, our REST API treats each <sync> triple as a resource and assigns it a unique URI that does not change, which can be easily achieved because many RDF packages such as Jena (Jena) assigns unique internal identifiers to RDF triples. With this URI, a client can locate any <sync> triple without specifying its current state. This idea is illustrated in Figure 7 where each rectangle enclosing a <sync> triple represents a REST resource with a unique URI. For example, the triple: <URI_0#T01> <sync> <URI_X#TX0> is a REST resource identified by URI_triple1.
Figure 7: Resource model of synchronization tree.
However, these REST resources are not connected as the rectangles do not intersect. To address this problem, we introduce the concept of super node, represented by ovals that enclose the objects and subjects of different <sync> triples which share the same base URI (URI without fragment). For example, the super node URI_X contains URI_X#TX0 of URI_triple1, URI_X#TX1 of URI_triple2, and URI_X#TX2 of URI_triple3. Because URI_X#TX1 and URI_X#TX2 are the children of URI_X#TX0, we map these relations to the corresponding REST resources to connect them as follows:
<URI_triple1> <child> <URI_triple2> <URI_triple1> <child> <URI_triple3>
At the top of Figure 7 is a root super node that contains a set of “sibling” URIs: URI_0#T01 of
URI_triple1 and URI_0#T02 of URI_triple4. Similarly, we map this relation to the REST resources to connect them:
<URI_triple1> <sibling> <URI_triple4>
The members of a super node are updated whenever a new <sync> triple X is attached to an existing <sync> triple Y by the following rule: assert relation: <Y> <child> <X> if the subject of X has the same base URI as the object of Y. For new triple without parents, the REST API attaches them to an internal subject, so they can be checked for <sibling> relations.
5.1 Create Triple
Figure 8 shows POST request and response to add new triples to a tree resource identified by URI_tree, or to attach new <sync> triples to an existing one, by replacing URI_tree with the URI to the triple.
Figure 8: create a <sync> triple.
5.2 Retrieve Triple
Figure 9 shows the GET request and response that returns the requested triple and its neighbors connected by super nodes.
Figure 9: retrieve a <sync> triple.
5.3 Update and Delete Triple
Figure 10 shows three ways to update a <sync> triple: 1) subject interval; 2) object interval; or 3) both subject and object intervals.
We use DELETE message to a <sync> resource to delete it, which will stop its playback and remove all its child <sync> triples.
Hypermodal�-�Dynamic�Media�Synchronization�and�Coordination�between�WebRTC�Browsers
79
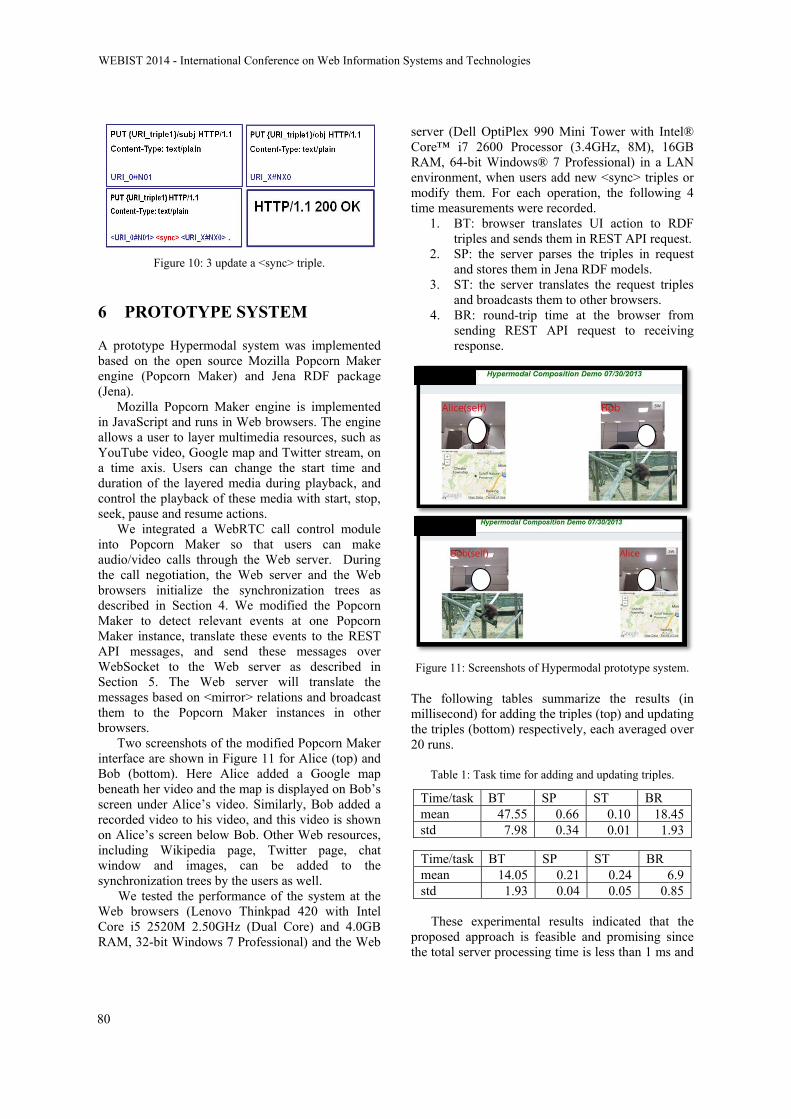
Figure 10: 3 update a <sync> triple.
6 PROTOTYPE SYSTEM
A prototype Hypermodal system was implemented based on the open source Mozilla Popcorn Maker engine (Popcorn Maker) and Jena RDF package (Jena).
Mozilla Popcorn Maker engine is implemented in JavaScript and runs in Web browsers. The engine allows a user to layer multimedia resources, such as YouTube video, Google map and Twitter stream, on a time axis. Users can change the start time and duration of the layered media during playback, and control the playback of these media with start, stop, seek, pause and resume actions.
We integrated a WebRTC call control module into Popcorn Maker so that users can make audio/video calls through the Web server. During the call negotiation, the Web server and the Web browsers initialize the synchronization trees as described in Section 4. We modified the Popcorn Maker to detect relevant events at one Popcorn Maker instance, translate these events to the REST API messages, and send these messages over WebSocket to the Web server as described in Section 5. The Web server will translate the messages based on <mirror> relations and broadcast them to the Popcorn Maker instances in other browsers.
Two screenshots of the modified Popcorn Maker interface are shown in Figure 11 for Alice (top) and Bob (bottom). Here Alice added a Google map beneath her video and the map is displayed on Bob’s screen under Alice’s video. Similarly, Bob added a recorded video to his video, and this video is shown on Alice’s screen below Bob. Other Web resources, including Wikipedia page, Twitter page, chat window and images, can be added to the synchronization trees by the users as well.
We tested the performance of the system at the Web browsers (Lenovo Thinkpad 420 with Intel Core i5 2520M 2.50GHz (Dual Core) and 4.0GB RAM, 32-bit Windows 7 Professional) and the Web
server (Dell OptiPlex 990 Mini Tower with Intel® Core™ i7 2600 Processor (3.4GHz, 8M), 16GB RAM, 64-bit Windows® 7 Professional) in a LAN environment, when users add new <sync> triples or modify them. For each operation, the following 4 time measurements were recorded.
1. BT: browser translates UI action to RDF triples and sends them in REST API request.
2. SP: the server parses the triples in request and stores them in Jena RDF models.
3. ST: the server translates the request triples and broadcasts them to other browsers.
4. BR: round-trip time at the browser from sending REST API request to receiving response.
Figure 11: Screenshots of Hypermodal prototype system.
The following tables summarize the results (in millisecond) for adding the triples (top) and updating the triples (bottom) respectively, each averaged over 20 runs.
Table 1: Task time for adding and updating triples.
Time/task BT SP ST BR mean 47.55 0.66 0.10 18.45std 7.98 0.34 0.01 1.93
Time/task BT SP ST BR mean 14.05 0.21 0.24 6.9std 1.93 0.04 0.05 0.85
These experimental results indicated that the proposed approach is feasible and promising since the total server processing time is less than 1 ms and
WEBIST�2014�-�International�Conference�on�Web�Information�Systems�and�Technologies
80
the total round-trip delay at browsers is 66 ms for adding triples and 21 ms for updating triples.
7 CONCLUSIONS
The contributions of this paper are summarized as follows. 1. A synchronization tree model based on
temporal linkage defined by RDF <sync> predicate to allow dynamic modifications to the tree while the resources in the tree are playing.
2. A RDF <mirror> predicate and a new protocol to correlate and initialize distributed synchronization trees so that updates to one tree can be correctly translated to another tree without clock synchronization.
3. A novel REST API to support efficient updates on synchronization trees by treating <sync> triples as REST resources and connect them through super nodes.
For future work, we plan to extend the temporal linkage to spatial regions and objects in resources, study multimedia resource cache mechanisms for efficient constructions of synchronization trees, and security mechanisms to prevent unauthorized and malicious updates to synchronization trees, and apply the described Hypermodal system to more complex real-time collaboration applications.
REFERENCES
Bergkvist, A. et al (ed): WebRTC 1.0: Real-time Communication Between Browsers, W3C Editor's Draft 30 August 2013, http://dev.w3.org/2011/ webrtc/editor/webrtc.html, Last Access: October 10, 2013.
Berners-Lee, T.: Weaving the Web, Harper, 2000. Berners-Lee, T. et al: Delta: an ontology for the
distribution of differences between RDF graphs, 2001, http://www.w3.org/DesignIssues/Diff, Last Access: October 10, 2013.
Bulterman D. et al (ed): Synchronized Multimedia Integration Language (SMIL 3.0), W3C Recommendation 01 December 2008, http:// www.w3.org/TR/SMIL3/, Last Access: October 10, 2013.
Gearon, P. et al (ed): SPARQL 1.1 Update, W3C Recommendation 21 March 2013, http://www.w3. org/TR/sparql11-update/, Last Access: October 10, 2013.
Jena: http://jena.apache.org/, Last Access: October 10, 2013.
Li, Y. et al: Synote: Weaving Media Fragments and Linked Data, LDOW2012, April 16, 2012, Lyon, France, http://events.linkeddata.org/ldow2012/papers/ ldow2012-paper-01.pdf, Last Access: October 10, 2013.
Manola, F. et al (ed): RDF Primer — Turtle version, http://www.w3.org/2007/02/turtle/primer/, Last Access: October 10, 2013.
Nixon, L. J. B.: The Importance of Linked Media to the Future Web, WWW 2013 Companion, May 13–17, 2013, Rio de Janeiro, Brazil, http://www2013. wwwconference.org/companion/p455.pdf, Last Access: October 10, 2013.
Oehme, P. et al: The Chrooma+ Approach to Enrich Video Content using HTML5, WWW 2013 Companion, May 13–17, 2013, Rio de Janeiro, Brazil. pages 479-480.
Pan, J., Li, L., Chou, W.: Real-Time Collaborative Video Watching on Mobile Devices with REST Services, 2012 Third FTRA International Conference on Mobile, Ubiquitous, and Intelligent Computing, pages 29-34, Vancouver, Canada, June 26-28, 2012.
Perkins, P.: RTP, Audio and Video for the Internet, Addison-Wesley, 2008.
Popcorn Maker: https://popcorn.webmaker.org/, Last Access: October 10, 2013.
Rescorla, E.: Notes on security for browser-based screen/application sharing, March 11, 2013, http:// lists.w3.org/Archives/Public/public-webrtc/2013Mar/ 0024.html, Last Access: October 10, 2013.
Rosenberg, J. et al: RFC3264: An Offer/Answer Model with the Session Description Protocol (SDP), June 2002, http://www.ietf.org/rfc/rfc3264.txt, Last Access: October 10, 2013.
Sesame REST API: http://openrdf.callimachus.net/ sesame/2.7/docs/users.docbook?view, Last Access: October 10, 2013.
Skype: https://support.skype.com/en/faq/FA1417/how-much-bandwidth-does-skype-need, Last Access: October 10, 2013.
Troncy, R. et al (ed): Media Fragments URI 1.0 (basic), W3C Recommendation 25 September 2012, http://www.w3.org/TR/media-frags/, Last Access: October 10, 2013.
Tummarello, G. et al: RDFSync: efficient remote synchronization of RDF models, The Semantic Web, Lecture Notes in Computer Science, Volume 4825. ISBN 978-3-540-76297-3. Springer-Verlag Berlin Heidelberg, 2007, p. 537, http://iswc2007. semanticweb.org/papers/533.pdf, Last Access: October 10, 2013.
WebRTC Chrome: http://www.webrtc.org/chrome, Last Access: October 10, 2013.
WebRTC Firefox: http://www.webrtc.org/firefox, Last Access: October 10, 2013.
Hypermodal�-�Dynamic�Media�Synchronization�and�Coordination�between�WebRTC�Browsers
81

Integrating Adaptation and HCI Concepts to Support Usability in User Interfaces
A Rule-based Approach
Luisa Fernanda Barrera, Angela Carrillo-Ramos, Leonardo Florez-Valencia, Jaime Pavlich-Mariscal and Nadia Alejandra Mejia-Molina
Departamento de Ingeniería de Sistemas, Pontificia Universidad Javeriana, Bogotá, Colombia {luisa.barrera, angela.carrilo, florez-l, jpavlich, nadia.mejia}@javeriana.edu.co
Keywords: User Interfaces, Adaptation, Usability, HCI.
Abstract: A common problem in information systems development is to provide support for adaptation, to automatically adjust their services to different users and contexts. User Interfaces (UI) are required to adapt to those contexts and to satisfy specific criteria and standards to guarantee usability. Several methods have been created to ensure a degree of usability in UI. However, these methods focus mainly in the design stage of the development process. The benefits of these methods may be lost during execution time, since they do not address the necessity to dynamically adapt the interfaces both to context and users. To address this issue it is necessary to integrate User Interface Design with Adaptation, to ensure that UI usability is preserved at the execution time, for different users and contexts. This paper proposes the framework Tukuchiy, a rule-based system that dynamically generates Adaptative User Interfaces, based in HCI precepts. This guarantees their usability during execution time, while taking into account user preferences and context. This paper focused in the rule-based system of Tukuchiy. That rule system includes usability criteria commonly used for web pages, which were mapped to a desktop application.
1 INTRODUCTION
When users interact through a computational system, they do it through a User Interface (UI). An adequate user interface design has become a very important aspect in software development (Stone et al., 2005). This problem is studied by two areas: HCI and Adaptation. Human-Computer Interaction (HCI) is a discipline that utilizes ideas from Psychology, Ergonomics, and other disciplines, to improve usability of user interfaces and provide better interaction between users and systems. Adaptation considers the heterogeneity of users and the context in which they utilize computers and requires that UI could be easily adapted to perform various tasks.
User interface design in HCI is commonly performed at the design stage in software development, but some usability characteristics defined at the design stage are lost during execution time. Adaptation, however, does not prescribe ways to improve usability of information systems. To address this issue, previous work of the authors proposed Runa-Kamachiy (Barrera et al., 2013a), a
model to integrate HCI and Adaptation concepts, to improve the interaction between user and Adaptative systems, and improve usability. To validate the Runa-Kamachiy model, a framework, called Tukuchiy (Barrera et al., 2013c) was created. Tukuchiy realizes Runa-Kamachiy as an infrastructure to generate dynamic user interfaces. Two prototypes were created to validate the model in two application areas: Idukay (Barrera et al., 2013c) for education and Midiku for clinic radiology.
This paper describes a rule-based system utilized by Tukuchiy to dynamically adapt user interfaces, and the way Adaptation concepts can be utilized to improve usability of user interfaces.
The remainder of this paper is organized as follows. Section 2 explains basic concepts required to understand Tukuchiy. Section 3 reviews related work. Section 4 describes Tukuchiy and the way it addresses the Nielsen criteria. Section 5 details Tukuchiy's rule-based system for UI generation and its application in the Midiku prototype. Section 6 describes the validation of the prototype. Section 7 concludes and describes future work.
82

2 BACKGROUND
This section describes background concepts required to understand Tukuchiy.
First HCI concept that we use is the “Five User Interface Laws”. Hale et al. (Hale, 2011) indicate that there are five laws that every user interface designer should know and apply: i) Fitts Law (Guiard and Beaudouin-Lafon, 2004); ii) Miller Law (Miller, 1956); iii) Steering Law (Accot and Zhai, 2001); iv) Hicks Law (Seow, 2005); v) Practice Law, (Roessingh and Hilburn, 2000).
The second HCI concept is “Nielsen's Usability Heuristics. Nielsen proposes ten heuristics to design user interfaces (Nielsen, 1994). They are as follows: i) System state visibility; ii) Coincide real world and system; iii) User control and freedom; iv) Consistency and Standards; v) Error prevention; vi) Recognizing instead of remembering; vii) Flexibility and efficiency; viii) Static and minimalistic design; ix) Help the user to recognize, diagnose and recover from errors; x) Help and Documentation, documentation should be easy to search, focus in user task.
In adition, Tukuchiy utilizes two main Adaptation concepts: User, and Context Profiles. User profiles represent tastes, necessities, and preferences of each user in a system, and can be used to adjust the services provided by the system, according to individual user aspects. Context profiles represent the user environment, characteristics that may affect the system's usability. Particularly, Tukuchiy takes into account the time of the day to adjust UI illumination. This adjustment is based in the Berry criteria (Berry, 2013), which indicates the way to manage brightness to ensure that user interface colors are comfortable for the user and would not reduce his/her perception capabilities.
3 RELATED WORK
Related Work Table 1 shows a comparison between related work about UI usability and UI generation, based in our work in (Barrera et al., 2013c) and (L. F. Barrera et al., 2013a). Columns are the related works. Rows are the criteria to evaluate each work. The columns 1-6 are as follows: 1(Moussa et al., 2000); 2 (Criado et al., 2010); 3 (Zimmermann et al., 2013); 4 (Namgoong et al., 2006); 5 (Akoumianakis and Stephanidis, 1997); 6 (England et al., 2009).
The criteria used in Table 1 were chosen to highlight the deficiencies with respect to interfaces
usability.The evaluation comprises both HCI and Adaptation. Most works do not focus on improving usability. Although most take into account user profile and his/her context, they do not take into account HCI standards. These works do not take into account that interfaces change during execution time and that it is necessary to avoid losing standards given during design time.
Table 1: Related Work Comparison.
Criterion 1 2 3 4 5 6Takes into account usability criteria during Execution (E) time or Design (D) time.
D E-D D D D E
UI let the user recognize, diagnose, and recover from errors
- - + - - +
UI include help and documentation + - - - + - Keeps consistency between the real world and the system
+ + - + + -
Adapts to different types of users - + - - - + Takes into account user context aspects - + + + - - Uses HCI techniques + - - - + +
Utilizes a rule-based system to generate UI
- - - - + -
4 TUKUCHIY
Tukuchiy ("Tukuchiy" is a Quechua word that means "To Transform") is a framework based on the Runa-Kamachiy model (L. F. Barrera et al., 2013a), to generate dynamic user interfaces, adjusted to specific user characteristics, context, and presentation preferences.
Figure 1: Tukuchiy Base Interface.
Tukuchiy keeps some usability standards at execution time, so that UI usability can be kept across the entire life cycle of the system (Figure 1). The Figure 1 shows some of the usability rules in Tukuchiy.
The description of Tukuchiy's component and
Integrating�Adaptation�and�HCI�Concepts�to�Support�Usability�in�User�Interfaces�-�A�Rule-based�Approach
83

Table 2: Usability Criteria and Heuristics.
Usability Criterion
Heuristic
Learning User control and freedom. Recognize instead of Remembering.
Error prevention
Help the user to recognize, diagnose, and recover from errors. Help and Documentation.
Memorization Consistency and Standards. Help and Documentation.
Efficiency Flexibility and Efficiency. Satisfaction System state visibility. Efficacy Static and minimalistic design.
conceptual integration can be found in (Barrera et al., 2013b). This section focuses in explaining the way Tukuchiy adapts usability concepts in web pages to desktop applications. Table 2 shows the usability criteria addressed by this research and the heuristics utilized to address them.
4.1 Learning
Learning is related to the capacity of the software to let users learn to use its components (Carvajal and Saab, 2010). Tukuchiy uses Practice Law (Section 2.1) to provide different types of help, with various levels of detail, depending on the user expertise. If the user is new, help is more detailed (see Figure 2a). As the user gains more experience utilizing the system, help is reduced (Figure 2b).
(a) Novice (b) Expert
Figure 2: Learning in Tukuchiy.
4.2 Error Prevention
An error-tolerant interface is designed to assist the user in recovering from errors (Carvajal and Saab, 2010). Tukuchiy utilizes tooltips with more or less information, according to the user experience level. Users with less experience received more detailed tooltips, while users with more experience received tooltips with less detail.
Additionally interface buttons are associated to intentionality and a color that represents that intentionality. Figure 12 shows the color palette utilized when one wants to change the color to the "close" button. Since this button is associated to a "danger" intentionality, blue and green colors, which represent "harmony", are not present in the palette.
4.3 Memorization
The memorization aspect enables users to easily remember how to interact with that system, after a period without using it (Nielsen, 1995). To address the memorization aspect, this research utilized the Miller Law (section 2.1). Tukuchiy groups buttons according to functionality based in this Miller rule (see Figure 3). Changes performed by the user in design (personalization) of the UI persist across sessions.
Figure 3: Memorization in Tukuchiy.
4.4. Efficiency
Efficiency is associated to the amount of effort required by the user to achieve a specific goal in his/her interactions with the system (Carvajal and Saab, 2010). Tukuchiy enlarges buttons (see Figure 8), based in the Fitts Law. In addition, it reduces in the amount of colors in palettes. These two strategies reduce the user efforts to accomplish a task or to personalize the interface.
4.5 Efficacy
According to ISO 9131-11, efficacy is the degree in which planned activities are performed and the planned results are achieved. In other words, can users do what they need in a precise manner?
The use of tooltips and Fitts Law to enlarge UI elements, seeks to improve the precision of the performed tasks. In addition, color transformation assists people with color blindness to properly identify colors and avoid mistakes. As seen in Figure 6, for people with Protanopy (red color blindness), Tukuchiy changes the color palette, discarding red colors, so that the user may distinguish a broader range of colors.
4.6 Satisfaction
Satisfaction is the perception of pleasantness and positive attitude towards the utilization of a product. That perception is reflected in the physical and emotional actions of the user when utilizing the system (Carvajal and Saab, 2010). The system does not directly address this criterion. However, we sought to indirectly satisfy the user by integrating all
WEBIST�2014�-�International�Conference�on�Web�Information�Systems�and�Technologies
84
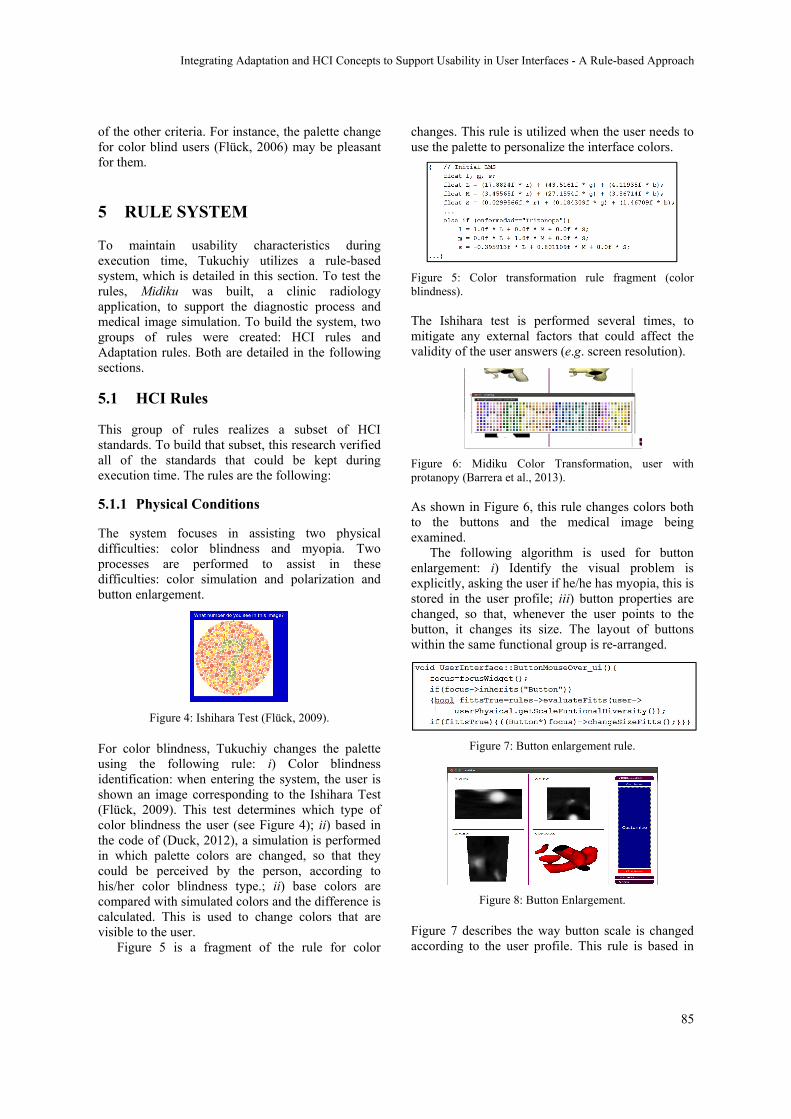
of the other criteria. For instance, the palette change for color blind users (Flück, 2006) may be pleasant for them.
5 RULE SYSTEM
To maintain usability characteristics during execution time, Tukuchiy utilizes a rule-based system, which is detailed in this section. To test the rules, Midiku was built, a clinic radiology application, to support the diagnostic process and medical image simulation. To build the system, two groups of rules were created: HCI rules and Adaptation rules. Both are detailed in the following sections.
5.1 HCI Rules
This group of rules realizes a subset of HCI standards. To build that subset, this research verified all of the standards that could be kept during execution time. The rules are the following:
5.1.1 Physical Conditions
The system focuses in assisting two physical difficulties: color blindness and myopia. Two processes are performed to assist in these difficulties: color simulation and polarization and button enlargement.
Figure 4: Ishihara Test (Flück, 2009).
For color blindness, Tukuchiy changes the palette using the following rule: i) Color blindness identification: when entering the system, the user is shown an image corresponding to the Ishihara Test (Flück, 2009). This test determines which type of color blindness the user (see Figure 4); ii) based in the code of (Duck, 2012), a simulation is performed in which palette colors are changed, so that they could be perceived by the person, according to his/her color blindness type.; ii) base colors are compared with simulated colors and the difference is calculated. This is used to change colors that are visible to the user.
Figure 5 is a fragment of the rule for color
changes. This rule is utilized when the user needs to use the palette to personalize the interface colors.
Figure 5: Color transformation rule fragment (color blindness).
The Ishihara test is performed several times, to mitigate any external factors that could affect the validity of the user answers (e.g. screen resolution).
Figure 6: Midiku Color Transformation, user with protanopy (Barrera et al., 2013).
As shown in Figure 6, this rule changes colors both to the buttons and the medical image being examined.
The following algorithm is used for button enlargement: i) Identify the visual problem is explicitly, asking the user if he/he has myopia, this is stored in the user profile; iii) button properties are changed, so that, whenever the user points to the button, it changes its size. The layout of buttons within the same functional group is re-arranged.
Figure 7: Button enlargement rule.
Figure 8: Button Enlargement.
Figure 7 describes the way button scale is changed according to the user profile. This rule is based in
Integrating�Adaptation�and�HCI�Concepts�to�Support�Usability�in�User�Interfaces�-�A�Rule-based�Approach
85
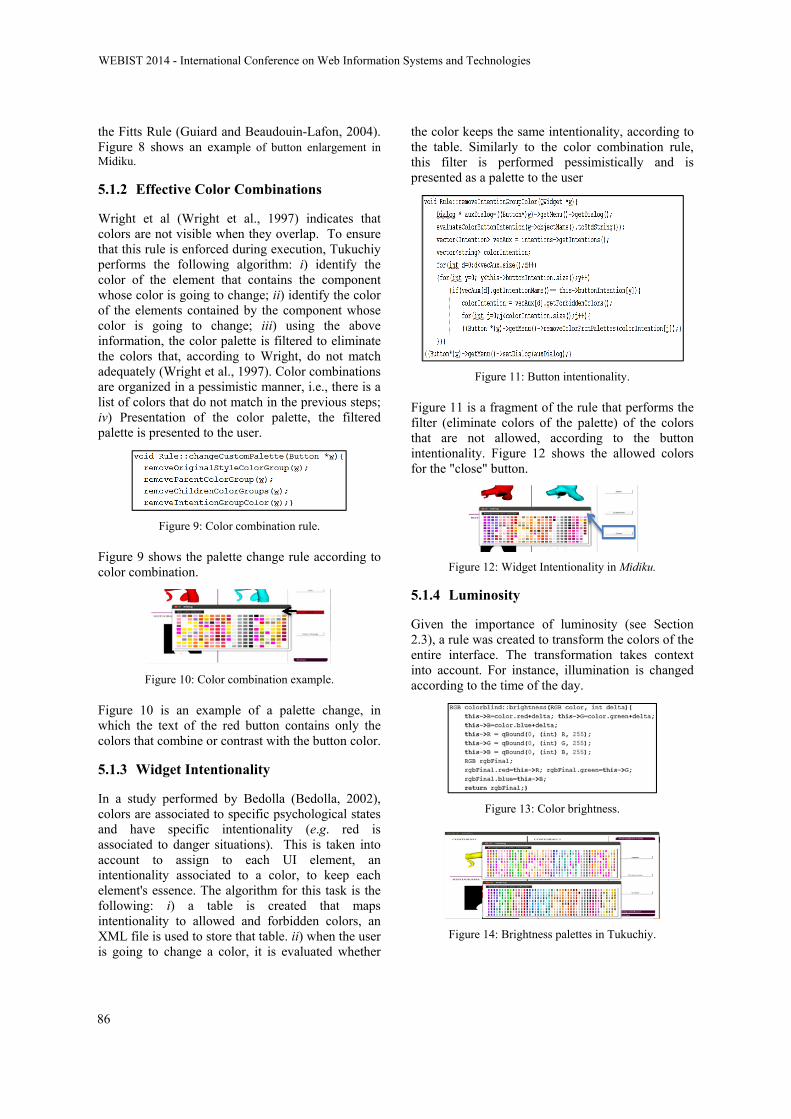
the Fitts Rule (Guiard and Beaudouin-Lafon, 2004). Figure 8 shows an example of button enlargement in Midiku.
5.1.2 Effective Color Combinations
Wright et al (Wright et al., 1997) indicates that colors are not visible when they overlap. To ensure that this rule is enforced during execution, Tukuchiy performs the following algorithm: i) identify the color of the element that contains the component whose color is going to change; ii) identify the color of the elements contained by the component whose color is going to change; iii) using the above information, the color palette is filtered to eliminate the colors that, according to Wright, do not match adequately (Wright et al., 1997). Color combinations are organized in a pessimistic manner, i.e., there is a list of colors that do not match in the previous steps; iv) Presentation of the color palette, the filtered palette is presented to the user.
Figure 9: Color combination rule.
Figure 9 shows the palette change rule according to color combination.
Figure 10: Color combination example.
Figure 10 is an example of a palette change, in which the text of the red button contains only the colors that combine or contrast with the button color.
5.1.3 Widget Intentionality
In a study performed by Bedolla (Bedolla, 2002), colors are associated to specific psychological states and have specific intentionality (e.g. red is associated to danger situations). This is taken into account to assign to each UI element, an intentionality associated to a color, to keep each element's essence. The algorithm for this task is the following: i) a table is created that maps intentionality to allowed and forbidden colors, an XML file is used to store that table. ii) when the user is going to change a color, it is evaluated whether
the color keeps the same intentionality, according to the table. Similarly to the color combination rule, this filter is performed pessimistically and is presented as a palette to the user
Figure 11: Button intentionality.
Figure 11 is a fragment of the rule that performs the filter (eliminate colors of the palette) of the colors that are not allowed, according to the button intentionality. Figure 12 shows the allowed colors for the "close" button.
Figure 12: Widget Intentionality in Midiku.
5.1.4 Luminosity
Given the importance of luminosity (see Section 2.3), a rule was created to transform the colors of the entire interface. The transformation takes context into account. For instance, illumination is changed according to the time of the day.
Figure 13: Color brightness.
Figure 14: Brightness palettes in Tukuchiy.
WEBIST�2014�-�International�Conference�on�Web�Information�Systems�and�Technologies
86

Figure 13 and Figure 14 is an example of the way illumination is updated according to context. This rule does not perform changes while the system is being utilized, to avoid being too intrusive for the user.
5.2 Adaptation Rules
This section shows the Adaptation rules that complement the dynamic generation of interfaces, based in user characteristics and context.
5.2.1 Help
Tukuchiy filters information during the system startup to evaluate the user experience level and language preferences. This rule process is as follows: i) the user profile has an attribute that indicates the amount of time the user utilizes the system, which determines the experience level of the user; ii) when starting the system, the user chooses his/her language of preference; iii) from the information in i) and ii), the system changes the names in its UI elements according to the chosen language. Tooltips are automatically changed according to the experience level. Currently, the system has two tooltips that are more detailed for novice users than for expert users.
Figure 15: Use level about use level.
Figure 15 illustrates the help rule. Each help has an XML file that associates UI elements with different tooltips and names.
5.2.2 Color Preferences
Each user may have different preferences about colors to display each UI element. To realize this in the preferences, a rule was created that organizes the color palette, to show the UI according to the tastes of the user.
This rule is utilized as follows: i) each time a user selects a color, a counter is updated, which is
used by the system to find out which the degree of color preference; ii) based in the degree of color preference, the color palette is reorganized from most preferred colors to least preferred colors.
Figure 16: Color preferences rule.
Figure 16 is a code fragment that denotes the way the palette is organized according to the user preferences. Figure 17 shows the palette that result from applying the above rule. In this example, the preferred color is green.
Figure 17: Color preferences in Midiku.
6 PILOT TEST
The authors are currently developing a functional prototype called Midiku. Since this is a work in progress, its initial assessment has only been performed over the design of Midiku’s User Interface. This design includes functionality given by Tukuchiy (see Section 4).
6.1 Evaluation Process
To evaluate the usability of Midiku’s interfaces, Mock-ups (Soegaard, 2004) were utilized. Mockups are a digital demonstration of the way the UI will look like in the final system. Mockups were shown to three physicians of the San Ignacio Hospital in Bogotá, Colombia. One of them is an expert radiologist with several years of experience, who is not proficient with current computing technologies. The other two are physicians who are specializing in radiology and have high proficiency utilizing current computing technologies. The three physicians
Integrating�Adaptation�and�HCI�Concepts�to�Support�Usability�in�User�Interfaces�-�A�Rule-based�Approach
87
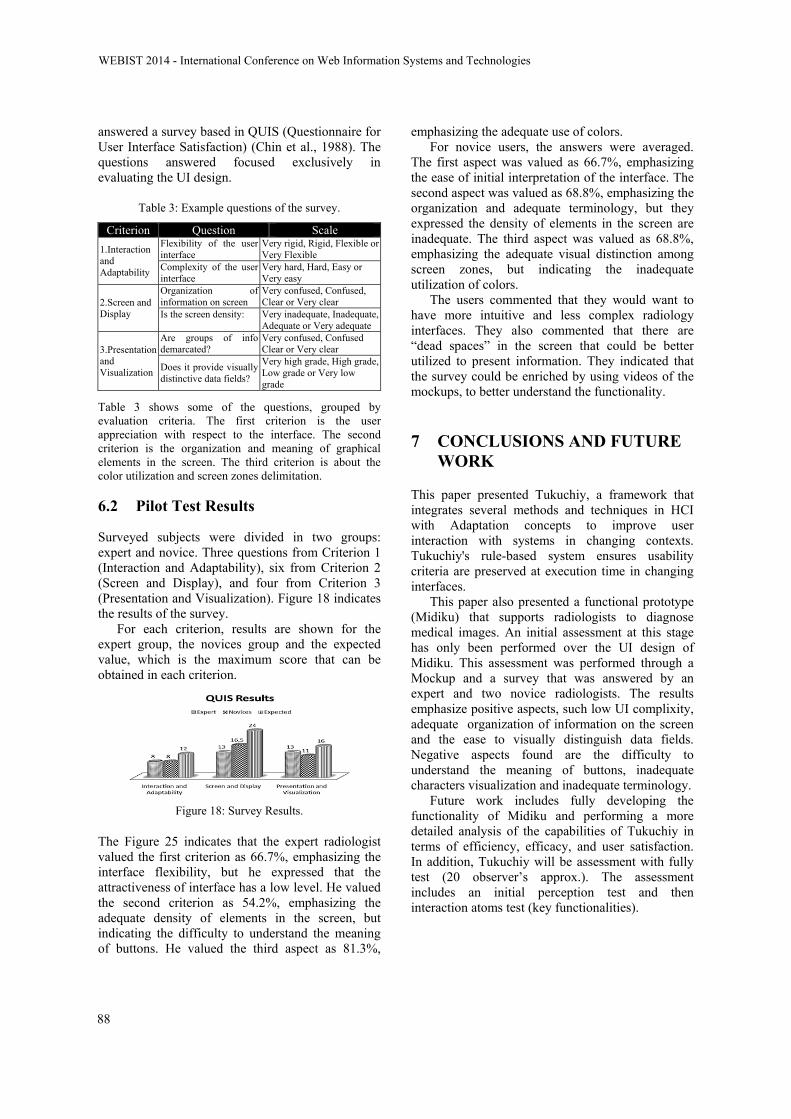
answered a survey based in QUIS (Questionnaire for User Interface Satisfaction) (Chin et al., 1988). The questions answered focused exclusively in evaluating the UI design.
Table 3: Example questions of the survey.
Criterion Question Scale
1.Interaction and Adaptability
Flexibility of the user interface
Very rigid, Rigid, Flexible or Very Flexible
Complexity of the user interface
Very hard, Hard, Easy or Very easy
2.Screen and Display
Organization of information on screen
Very confused, Confused, Clear or Very clear
Is the screen density:
Very inadequate, Inadequate, Adequate or Very adequate
3.Presentation and Visualization
Are groups of info demarcated?
Very confused, Confused Clear or Very clear
Does it provide visually distinctive data fields?
Very high grade, High grade, Low grade or Very low grade
Table 3 shows some of the questions, grouped by evaluation criteria. The first criterion is the user appreciation with respect to the interface. The second criterion is the organization and meaning of graphical elements in the screen. The third criterion is about the color utilization and screen zones delimitation.
6.2 Pilot Test Results
Surveyed subjects were divided in two groups: expert and novice. Three questions from Criterion 1 (Interaction and Adaptability), six from Criterion 2 (Screen and Display), and four from Criterion 3 (Presentation and Visualization). Figure 18 indicates the results of the survey.
For each criterion, results are shown for the expert group, the novices group and the expected value, which is the maximum score that can be obtained in each criterion.
Figure 18: Survey Results.
The Figure 25 indicates that the expert radiologist valued the first criterion as 66.7%, emphasizing the interface flexibility, but he expressed that the attractiveness of interface has a low level. He valued the second criterion as 54.2%, emphasizing the adequate density of elements in the screen, but indicating the difficulty to understand the meaning of buttons. He valued the third aspect as 81.3%,
emphasizing the adequate use of colors. For novice users, the answers were averaged.
The first aspect was valued as 66.7%, emphasizing the ease of initial interpretation of the interface. The second aspect was valued as 68.8%, emphasizing the organization and adequate terminology, but they expressed the density of elements in the screen are inadequate. The third aspect was valued as 68.8%, emphasizing the adequate visual distinction among screen zones, but indicating the inadequate utilization of colors.
The users commented that they would want to have more intuitive and less complex radiology interfaces. They also commented that there are “dead spaces” in the screen that could be better utilized to present information. They indicated that the survey could be enriched by using videos of the mockups, to better understand the functionality.
7 CONCLUSIONS AND FUTURE WORK
This paper presented Tukuchiy, a framework that integrates several methods and techniques in HCI with Adaptation concepts to improve user interaction with systems in changing contexts. Tukuchiy's rule-based system ensures usability criteria are preserved at execution time in changing interfaces.
This paper also presented a functional prototype (Midiku) that supports radiologists to diagnose medical images. An initial assessment at this stage has only been performed over the UI design of Midiku. This assessment was performed through a Mockup and a survey that was answered by an expert and two novice radiologists. The results emphasize positive aspects, such low UI complixity, adequate organization of information on the screen and the ease to visually distinguish data fields. Negative aspects found are the difficulty to understand the meaning of buttons, inadequate characters visualization and inadequate terminology.
Future work includes fully developing the functionality of Midiku and performing a more detailed analysis of the capabilities of Tukuchiy in terms of efficiency, efficacy, and user satisfaction. In addition, Tukuchiy will be assessment with fully test (20 observer’s approx.). The assessment includes an initial perception test and then interaction atoms test (key functionalities).
WEBIST�2014�-�International�Conference�on�Web�Information�Systems�and�Technologies
88
ACKNOWLEGEMENTS
The authors want to acknowledge the Systems Engineering Department and the Systems Engineering and Computing Master’s program of the Pontificia Universidad Javeriana, for supporting the development of Runa-Kamachiy, Tukuchiy and Midiku. The authors also thank Luis Felipe Uriza and his team of resident physicians of the San Ignacio Hospital, for their collaboration in the initial evaluation of Midiku.
REFERENCES
Accot, J., Zhai, S., 2001. Scale effects in steering law tasks, in: Proceedings of the SIGCHI Conference on Human Factors in Computing Systems, CHI ’01. ACM, New York, NY, USA, pp. 1–8.
Akoumianakis, D., Stephanidis, C., 1997. Supporting user-adapted interface design: The USE-IT system. Interacting with Computers, No 3, Vol 9, pp. 73–104.
Barrera, L., Mejia-Molina, N., Carrillo-Ramos, A., Flórez-Valencia, L., 2013. Tukuchiy - Color Palettes. URL http://s24.postimg.org/xf3eqh4px/paletas.png. (8.20.13).
Barrera, L. F., Carrillo-Ramos, A., Flórez-Valencia, L., Pavlich-Mariscal, J. A., 2013a. Runa-Kamachiy: Conceptual Integration Model Between HCI and Adaptation Oriented to User Interface Usability. DYNA -Rev. Fac. Minas Univ. Nac. Colomb. Sede Medellin En Revisión, 10.
Barrera, L. F., Mejia-Molina, N. A., Carrillo-Ramos, A., Flórez-Valencia, L., Pavlich-Mariscal, J., 2013b. . UMUAI - USER Model. USER-Adapt. Interact. J. Pers. Res. En Revisión, 40.
Barrera, L. F., Mejia-Molina, N.A., Carrillo-Ramos, A.C., Flórez-Valencia, L., 2013c. Tukuchiy-Idukay: Generación Dinámica de Interfaces en Contextos Educativos. Presented at the Congreso Internacional de Ambientes Virtuales de Aprendizaje Adaptativos y Accesibles, San Juan, Argentina, p. 10.
Bedolla, D., 2002. Diseño sensorial, las nuevas pautas para la innovación, especialización y personalización del producto. Universitat Politècnica de Catalunya. Dept de Projectes d’Enginyeria, Barcelona, España.
Berry, C., 2013. Guide to procedures of the N.C. Occupational Safety and Health Review Commission, 2nd ed. Raleigh, North Carolina, USA.
Carvajal, M., Saab, J., 2010. Fundamentos conceptuales de las Directrices de Usabilidad de Gobierno en línea., Gobierno en Linea. Ministerio de Tecnologías de la Información y Comunicaciones, Bogotá, Colombia.
Chin, J. P., Diehl, V.A., Norman, K. L., 1988. Development of an instrument measuring user satisfaction of the human-computer interface, in: Proceedings of the Conference on Human Factors in Computing Systems, CHI ’88. ACM, New York, USA,
pp. 213–218. Criado, J., Vicente-chicote, C., Padilla, N., Iribarne, L.,
2010. A Model-Driven Approach to Graphical User Interface Runtime Adaptation. Presented at the 5th Workshop on [email protected] at the ACM/IEEE 13th International Conference on Model Driven Engineering Languages and Systems (MODELS 2010), Oslo, Norway, pp. 49–59.
Duck, D., 2012. DALTONISM: Making Games Color Blind Friendly SebbyLive - My Life My Proj. URL http://www.sebbylive.com/2011/08/03/ daltonism-making-games-color-blind-friendly.
England, D., Randles, M., Taleb-Bendiab, A., 2009. Runtime user interface design and adaptation, in: Proceedings of the 23rd British HCI Group Annual Conference on People and Computers: Celebrating People and Technology, BCS-HCI ’09. British Computer Society, Swinton, UK, UK, pp. 463–470.
Flück, D., 2006. Color Blind Essentials. Colblindor, Zürich, Switzerland.
Flück, D., 2009. Ishihara Color Test. Color Blind. URL http://www.colour-blindness.com/en/colour-blindness-tests/ishihara-colour-test-plates/
Guiard, Y., Beaudouin-Lafon, M., 2004. Fitts law 50 years later: applications and contributions from human–computer interaction. International Journal of Human-Computer Studies, No 6, Vol 61, pp. 747–750.
Hale, K., 2011. 5 Interface Laws Every Software Designer Should Know (WWW Document). URL https://speakerdeck.com/roundedbygravity/5-interface-laws-every-software-designer-should-know (accessed 7.25.13).
Miller, G.A., 1956. The magical number seven, plus or minus two: some limits on our capacity for processing info. Psychological Review, No 2, Vol 63, pp. 81–97.
Moussa, F., Kolski, C., Riahi, M., 2000. A model based approach to semi-automated user interface generation for process control interactive applications. Interacting with Computers, No 3, Vol 12, pp. 245–279.
Namgoong, H., Sohn, J.-C., Cho, Y.-J., Chung, Y.K., 2006. An Adaptive User Interface in Smart Environment exploiting Semantic Descriptions, in: 2006 IEEE Tenth International Symposium on Consumer Electronics, 2006. ISCE ’06. Presented at the 2006 IEEE Tenth International Symposium on Consumer Electronics, 2006. ISCE ’06, IEEE, pp. 1–6.
Nielsen, J., 1994. Enhancing the explanatory power of usability heuristics, in: Proceedings of the SIGCHI Conference on Human Factors in Computing Systems, CHI ’94. ACM, New York, NY, USA, pp. 152–158.
Nielsen, J., 1995. Usability 101: Introduction to Usability (WWW Document). Jakob Nielsens Website. URL http://www.useit.com/alertbox/20030825.html (5.14.12).
Roessingh, J. J. M., Hilburn, B. G., 2000. The Power Law of Practice in Adaptive Training Applications, 1st ed. Nationaal Lucht- en Ruimtevaartlaboratorium, Amsterdam, Netherlands.
Seow, S. C., 2005. Information theoretic models of HCI: a comparison of the Hick-Hyman law and Fitts' law. Human Computing Interaction, #3, V20, pp. 315–352.
Integrating�Adaptation�and�HCI�Concepts�to�Support�Usability�in�User�Interfaces�-�A�Rule-based�Approach
89

Soegaard, M., 2004. Mock-ups (WWW Document). Interact. Des. Found. URL www.interaction-design.org/encyclopedia/mock-ups.html (accessed 10.15.13).
Stone, D., Jarrett, C., Woodroffe, M., Minocha, S., 2005. User Interface Design and Evaluation, 1st Edition. ed. Morgan Kaufmann Series in Interactive Technologies, San Francisco, USA.
Wright, P., Mosser-Wooley, D., Wooley, B., 1997. Techniques and Tools for using color in computer interface design. Crossroads ACM Student Magazine, No 3, Vol 3, pp. 3–6.
Zimmermann, G., Jordan, J. B., Thakur, P., Gohil, Y., 2013. GenURC: generation platform for personal and context-driven user interfaces, in: Proce. of the 10th International Cross-Disciplinary Conference on Web Accessibility, W4A ’13, New York, USA, pp. 6:1–6:4.
WEBIST�2014�-�International�Conference�on�Web�Information�Systems�and�Technologies
90

Tactive, a Framework for Cross Platform Development of TabletopApplications
Ombretta Gaggi1 and Marco Regazzo2
1Department of Mathematics, University of Padua, via Trieste, 63, Padova, Italy2Anyt1me S.r.L., via Siemens 19, Bolzano, Italy
[email protected], [email protected]
Keywords: Tabletop Applications, Touch Interfaces, Webkit Engine.
Abstract: The number and types of applications developed for multi-touch tabletops are dramatically increased in the lastyears, mainly due to the fact that interactive tabletops allow a more natural interaction with the user throughtheir multi-touch interfaces. Despite many applications share a big set of common features, e.g., gesturesrecognition, interface orientation, etc., almost all applications implement their home made software solutions.In this paper we present Tactive, a software layer for fast development of portable applications for multi-touchinteractive tabletops. Tactive allows to abstract from hardware and software equipment and to embed a webapplication into a application for multi-touch surfaces. Our framework supports up to five fingers gesturesrecognition and communication between different windows, and allows to save more than 60% of developingtime.
1 INTRODUCTION
In the last few years, the market of multi-touch ta-bles is experiencing a situation very similar to whathappens in the mobile applications market. Thenumber of developed applications is dramatically in-creased, interactive tabletop surfaces are used to im-prove learning activities (Rick et al., 2011), insidemuseums (Geller, 2006), where the diversity of visi-tors create a natural laboratory for testing this kind ofinterface, to help the management of emergency (Qinet al., 2012), and in many other collaborative activi-ties like, e. g., photoware (Pedrosa et al., 2013), etc.Consequently, also the the number of hardware solu-tions increased, each one requiring a particular SDK,programming language, etc.
Like smartphones, interactive tabletops allow amore natural interaction with the user through theirmulti-touch interfaces (Forlines et al., 2007) and, un-like mobile devices, they allow the interaction of morethan one user at the same time. Tabletops promotecollaboration and social experiences, and can act as ameeting point.
The possibility to interact with multiple user atthe same time requires an important set of new fea-tures for the user interface: e. g. the user are placedaround the table, therefore they need different orien-tations of the interaction widgets, they can collaborate
using the same space and objects or can compete forthem. Therefore all applications developed for thiskind of interface have to face a common set of prob-lems, e. g., the recognition and management of par-ticular gestures and the orientation of the interactivewidgets. Despite these common features, almost allthe applications implement all these features startingfrom scratch, since no software solution exists.
In this paper we present our tabletops solution,which can be applied to different size of surface(42” or more) and can work upon different operat-ing system. We have developed a software layerwhich is able to abstract from hardware and soft-ware constraints of the device in which it is installed(screen size, operating system, etc) and allows thedeveloper to easily manage common features of theuser interface discussed above. Our solution providea Javascript API which allows a developer to buildan entire tabletop application only using web tech-nologies, in particular HTML5, CSS3 and Javascript,without the need to know anything about the underly-ing hardware and software.
Moreover, our solution allows a very easy reuse ofweb applications already developed for non touch in-terfaces, and personalization of the final application.
Finally, we provide our multi-touch tabletop witha strong interior design (see Figure 1) on its shape andmaterials while most of the hardware available on the
91

Figure 1: Our tabletop solution was designed by an expertinterior architect.
market is little more than a “big iPad mounted on fourlegs”.
The paper is organized as follows: Section 2 dis-cusses the related works and the need for a frame-work for the development of portable multi-touch ap-plications. Section 3 presents Tactive, a software layerwhich provides a set of features and gestures to speedup the design process of multi-touch interactive ap-plications. A set of success stories about applicationsdeveloped with the framework is discussed in Section4. Finally, we conclude in Section 5.
2 RELATED WORKS ANDBACKGROUND
There are a lot of applications for interactive table-tops and surfaces described in literature. Correia etal (Correia et al., 2010) described an application formuseum setting. A tabletop is used to enhance userexperience presenting semantic information about allthe artworks of the exhibition. The authors realized atabletop setup based on the Frustrated Total InternalReflection system. More than one user can interactwith the tabletop at the same time in a collaborativeway. The user interface is an ad-hoc application, buildfrom scratch with the help of some open framework.
uEmergency (Qin et al., 2012) is a emergencymanagement system based on a very large multi-touch surface. The users can collaborate in a veryintuitive way around a table which displays availableinformation on the ongoing emergency. It allows peo-ple to carry out face-to-face communication based ona horizontal map. Users can also analyzed real-timesituation with fingers or digital pens. A study showsthat the use of interactive surfaces improves efficiencyin decision making and collaboration for coping withan emergency.
Pedrosa et al, used tabletops to explore homevideos and photos (Pedrosa et al., 2013). A set of 24users evaluates an application which displays photos
and videos on a horizontal touch surface to allow sto-rytelling and random exploration. The authors showthat, among collaborative tools also personal spaceswithin the tabletop were useful for allowing indepen-dent navigation.
The application described so far have many com-mon features: they are highly visual systems, mainlycontrolled by touches and some common gesturesperformed on the surface of the system, e. g., brows-ing a collection of items, selecting a particular item,accessing a documents, and so on. All these applica-tions can interact with several users at the same time,and each user requires a different orientation of theinterface, according to his/her position. Despite manycommon requirements, the developers of all these ap-plications need to implement the majority of thesefeatures from scratch and the available frameworksprovide only very low level features.
As a general remark, designer of multi-touch ap-plications do not have a reference model to model userinterface and interaction, but often rely on best prac-tice and intuition rather than on a systematic devel-opment process (Wigdor et al., 2009). For this rea-son, many works in literature address the problem ofdesigning user interface for interactive surfaces (An-thony et al., 2012; Hesselmann et al., 2011; Luytenet al., 2010; Nielsen et al., 2004; Seto et al., 2012;Urakami, 2012).
Urakami (Urakami, 2012) has shown that the userchoice of gestures was affected by the size of the ma-nipulated object, expertise, and nature of the com-mand (direct manipulation of objects vs. assessmentof abstract functions), therefore it is essential to in-volve the user in the development of gesture vocab-ularies. The same approach is followed by Hessel-mann et al, that proposed an iterative process of fivesteps tailored to the development of interactive table-tops and surfaces applications, called SCiVA, SurfaceComputing for Interactive Visual Applications. Thekey idea of SCiVA is to strongly involve the user inthe design process to improve the usability of the fi-nal product (Hesselmann et al., 2011).
Luyten et al, try to reach a consensus on a setof design patterns that aid in the engineering ofmulti-touch interfaces and transcend the differencesin available platforms (Luyten et al., 2010). Seto etal, investigate the problem of how to manage menusdisplacement in multi-user surfaces(Seto et al., 2012).In particular they focus on the discoverability of sys-tem menus on digital tabletops designed for publicsettings. This study presents a set of design recom-mendations to improve menu accessibility: e. g., dis-cernible and recognizable interface elements, such asbuttons, supported by the use of animation, can effec-
WEBIST�2014�-�International�Conference�on�Web�Information�Systems�and�Technologies
92
tively attract and guide the discovery of menus.This analysis of the literature shows that some
steps toward the definition of design patterns forthe development of interactive multi-touch interfaceshave been done, but there are not already built off-the-shelf components to create these interfaces, buteach application build from scratch its user interface.Native frameworks, like Microsoft Surface 2.0 SDKand Runtime (Microsoft, 2013a), Windows Presenta-tion Foundation + Native Touch recognition by Mi-crosoft Windows 8 (Microsoft, 2013b) and Smart Ta-ble SDK (SMART Technologies, 2013), help to de-velop multi-touch applications but require a particularhardware/software configuration.
Our goal is the creation of a software layer,portable on each operating system and hardware solu-tion, which provides this set of features and gesturesto speed up the design process of multi-touch inter-active applications by avoiding to re-invent the wheeleach time (Gaggi and Regazzo, 2013).
Other solutions exist which addresses a similarproblem. Glassomium (Toffanin, 2013) is a projectbased on web technologies which aims to port webapplications to multi-touch surface. Even if the keyidea is quite the same, it allows for rotations, scal-ing and dragging even through an unstable beta andit is not able to identify gestures which involve thewhole hand, Glassomium can be considered a win-dows manager, which allows to recognize the usergestures and to manage them, but it does not im-plements cross-windows communication, therefore, itlacks of a proper mechanism to change the user expe-rience on the base of the interaction of other users. Tothe best of our knowledge this feature is implementedonly by our solution.
GestureWorks (Ideum, 2013) and Arena (Un-edged, 2013) are frameworks which provide genericand cross platform functionalities, like gesturesrecognition, to develop touch applications, but theyare not able to manage more than one application be-ing launched at the same time or multiple applicationenclosed in different windows.
3 DESCRIPTION OF THEFRAMEWORK
In this section we discuss the design issue and the im-plementation details of the developed software layer,called Tactive. Tactive is a framework, which allowsto speed up the development of applications for multi-touch surfaces. This goal is reached since:� Tactive provides a way to encapsulate web appli-
cations into widgets suitable for multi-touch sur-
faces, therefore already developed web applica-tions can be easily adapted to multi-touch inter-active surfaces;
� Tactive allows to abstract from hw/sw details: anentire application can be developed using webtechnologies, therefore we do not ask the devel-oper to know any particular language or tech-nology bound to the particular hw/sw equipment,he or she only needs to know how to use theJavascript API provided by our framework;
� applications developed with Tactive are able toadapt themselves to different size of the surface(Tactive helps to realize the so-called fluid appli-cations) and
� Tactive provides a set of features common tomulti-touch applications like windows disposi-tion, gestures recognition and interface orienta-tion.
3.1 System Architecture
The architecture of our system is depicted in Figure2. Tactive is organized in two levels. The lowerone, called the O.S. Layer guarantees the indepen-dence from the underlying hardware: it contains theoperating system (MS Windows 7, MS Windows 8and Linux are supported), and a set of protocol andlibraries to manage touch gestures if the chosen oper-ating system does not support them natively. The Ap-plication Layer manages the applications, their win-dows and the interaction between the applications andthe user or between different applications.
Tactive clearly separates the contents, displayedto the users, from the interaction widgets and thesoftware components used to display the contents.For this reason, the architecture of our frameworkcontains a content manager, called Application Con-tainer, which manages how to display the contents,and a windows manager.
The Application Container allows the division be-tween contents and interaction widget using Web-Views, i. e., components that display web pages. AWebView allows to embed HTML pages inside an ap-plication. This component uses the WebKit renderingengine to display web pages inside a window of theapplication, and includes methods to navigate forwardand backward through a history, to zoom in and out,to perform text searches, etc.
The Application Container is the underlying com-ponent that encapsulate all the functionalities neededto interact with the user and with other componentswithin the table, i. e., the Touch Manager that al-lows gestures management and recognition, and the
Tactive,�a�Framework�for�Cross�Platform�Development�of�Tabletop�Applications
93

Figure 2: Architecture of the developed software layer forTactive.
Window/Widget Manager that provides the stack ofvisible objects (see Figure 2). It is also responsible tocollect and enumerate application specific contents (e.g., images, videos, web pages or multimedia items)that are stored as web pages and rendered through theWebView.
The frameworks supports both on-line and off-linecontent/pages but usually the second option (a localweb server) is preferred to let the application worksand displays contents even in absence of an Internetconnection.
Widgets for the visualization of media items likevideos and images have been implemented using We-bViews. Tactive has been designed to be extendible:an expert developer may create a new componentextending the widget component (or one of its sub-classes), automatically taking advantage of all the fea-tures already implemented and described above1.
Using our framework, content can be created by aweb developer (that designs the structure) and updateby a content editor.
The mechanism of WebViews is used to developedhybrid applications for mobile devices, i. e., appli-cations based on the HTML5 languages which arewrapped with a webkit engine and rendered as na-tive mobile applications. PhoneGap (Apache Soft-ware Foundation, 2013), also known as Apache Cor-dova, is a framework for cross-platform mobile de-
1We must note here that the framework development isalmost complete, therefore, even if Tactive is extendible, itis very difficult that a developer of applications needs toimplement a new type of widget.
velopment which create hybrid applications. Our ap-proach is very similar: the idea is to take advantage ofthe portability of web technologies to develop porta-bility of applications for multi-touch interactive sur-faces.
Using a WebView, the developer only need tospecify which is the web page to render. Thereforecontents has to be enclosed into web pages to be dis-played to users. At this point, our framework allowsthe visualization of contents into a window on thetabletop.
Contents can be arranged (and personalized, e. g.using a particular layout) using the CSS standard lan-guage like what happens for web sites. But the pro-vided interaction is very poor, since the user can touchthe interface, but the touch is interpreted like a move-ment of a mouse pointer. No gestures like pinch, ro-tation or drag are supported, but only tap and doubletap.
Since people do not use their hand and fingers likea mouse pointer, we need the Touch Manager compo-nent to manages concurrent touches and gestures ofmany users. This software component manages porta-bility of touches and gestures recognition and imple-ments the TUIO protocol (Kaltenbrunner et al., 2013)which allows the transmission of an abstract descrip-tion of interactive surfaces, including touch eventsand tangible object states. This protocol encodes con-trol data from a tracker application (e.g. based oncomputer vision) and sends it to any client applica-tion that is capable to decode the protocol. Techni-cally TUIO is based on Open Sound Control (OSC) -an emerging standard for interactive environments notonly limited to musical instrument control - and canbe therefore easily implemented on any platform thatsupports OSC.
The recognition of the gestures is managed ex-tending qTUIO (Belleh and Blankenburgs, 2013), alibrary which implements a TUIO listener on a localUDP socket and forwards the events into the internalevent system of Qt. qTUIO is able to recognize ges-tures, e. g., dragging of an object, made with one fin-ger, two fingers are allowed only for the zoom in andout management. Since the user usually move win-dows and objects with the whole hand, qTUIO is onlya first step through the realization of a portable soft-ware for the complete management of multi-touch in-teraction. For this reason, the Touch Manager extendsthis library to recognize and manage also gestureswhich involves more than one finger, e. g., multi-touch pan and pinch, scroll, drag and rotation usingup to five fingers.
Since Tactive allows to launch more than one ap-plications at the same time, another problem arise,
WEBIST�2014�-�International�Conference�on�Web�Information�Systems�and�Technologies
94

i. e., the management of application audio. In fact,if many applications use contemporary the audio in-terface, the result can be a big uproar, and it couldbe very difficult for the users to understand the au-dio messages. Consider, as an example, the case inwhich two users play contemporary two demonstra-tive videos, what happens is that the audio messagesare overlapped and none of the users is able to easilyfollow the video. The situation is even worse whendealing with more users.
For this reason, Tactive implements the compo-nent called Audio Manager, which is able to man-age contemporary audio. Audio messages are clas-sify by the content editor according to their nature,i. e. soundtrack or spoken comment. More sound-tracks can plays together, two spoken comments can-not, so one of the two audio (and video if it is theaudio comment of a video) is suspended till the endof the first one. To decide which audio is paused, theAudio Manager allows to define priority classes, oruse a first-in, first-served policy if no priority was de-fined by the content editor.
3.2 Communication between DifferentWindows
An important component of our architecture is theWindows Manager. Given the dimension of the table-top, concurrent interactions by more than one usersis an important issue to consider. As an example, theusers can compete for space on the surface. For thesereason, when a new window is opened (even by a newuser or not), this operation can require the resize of allthe other windows already present on the table. Oth-erwise, actions from a particular user may affect thebehavior of the windows of other users. To allow theeasily implementation of applications with this kindof features, Tactive implements a windows managerand communication protocol between windows pro-vided by the Message Dispatcher.
Let us consider as example, an application with amap, e. g., a map of a city with the list of its muse-ums, or a map of an exhibition with the position ofthe stands. The map can be rendered with HTML5on a WebView (see Figure 3). If the user touches amuseum or a stand the application opens a new win-dow, with the web site of (or a page dedicated to)the museum/stand, and the user can interact with thiswindow, resize it, or move across the table. If theuser touches the “go to the map” button on the newwindows, the initial window with the map is movedover the current window of the user. Figure 3 shows ascreenshot from an application developed for a localfair.
Figure 3: Screenshot from an application developed for alocal exhibition.
To implement this behavior, a communicationprotocol between windows has been developed. Thecommunication protocol allows the developer tochange the content or the behavior of a window on thebase of the behavior, or user interaction with, anotherwindows. Each WebView communicates with the soft-ware layer Tactive, which acts as a windows man-ager. We need a windows manager instead of a sim-ple communication protocol between windows, wid-gets or WebViews because only the windows managerknows how many windows are currently open in thesurface, where they are, and how they are interactingwith the user, each window knows only the informa-tion about itself, and nothing about the other. More-over, the use of a windows manager allows an easyrecover from the failure of a single window, since themanager records a set of information for each windowand is able to stop, suspend or restart it.
Tactive implements the windows management us-ing the C++ language to address performance issues.Moreover, it offers to developers of multi-touch ap-plication a Javascript API to manage events triggeredby Tactive inside their web applications which useour framework to work on multi-touch interactive sur-faces. The Javascript API allows to enlarge, resize,minimize, close or move a window, in response to auser interaction, also on other windows.
Moreover, using this API, it is possible to senda message to a widget active on another windowthrough the Message Dispatcher. Consider as ex-ample an advergame: the user gains coins to playwith a slot machine, answering to a questionnaire.When he/she completes the questionnaire, the win-dow with the questions sends a message to the slotmachine, enabling the user to play. This communi-cation between windows is enabled by the JavascriptAPI, which is used to compose the message and trig-ger the event through the Message Dispatcher to the
Tactive,�a�Framework�for�Cross�Platform�Development�of�Tabletop�Applications
95
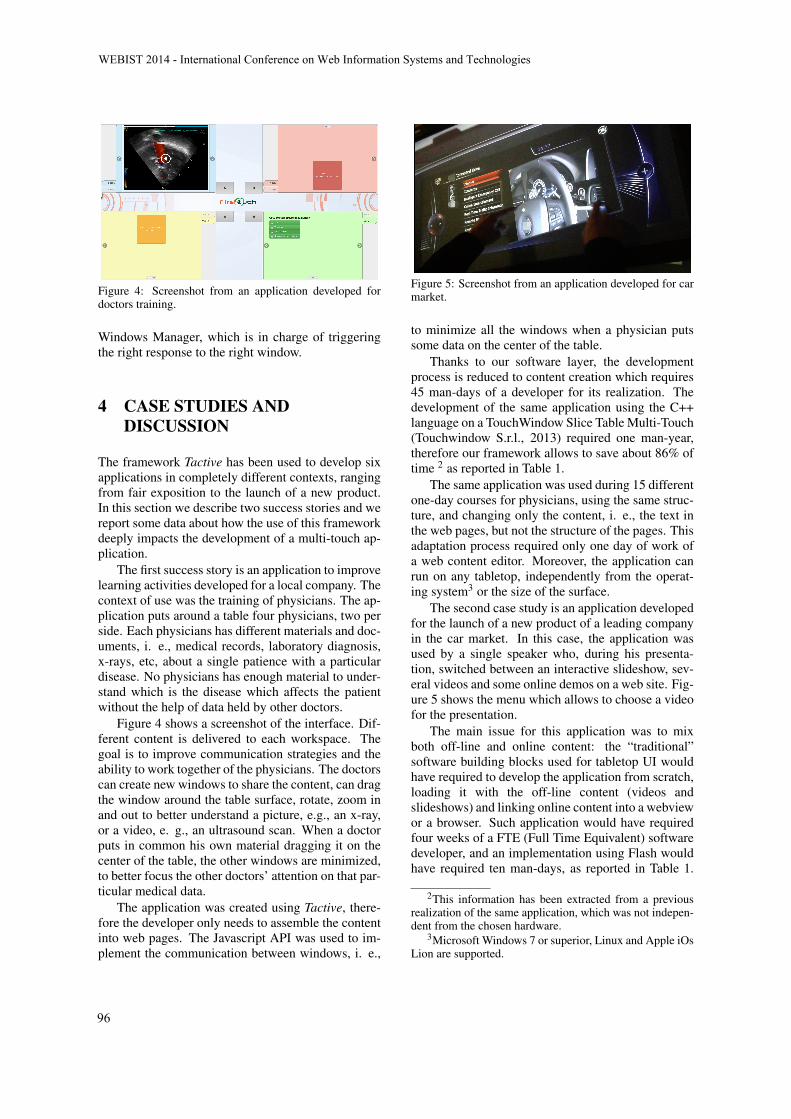
Figure 4: Screenshot from an application developed fordoctors training.
Windows Manager, which is in charge of triggeringthe right response to the right window.
4 CASE STUDIES ANDDISCUSSION
The framework Tactive has been used to develop sixapplications in completely different contexts, rangingfrom fair exposition to the launch of a new product.In this section we describe two success stories and wereport some data about how the use of this frameworkdeeply impacts the development of a multi-touch ap-plication.
The first success story is an application to improvelearning activities developed for a local company. Thecontext of use was the training of physicians. The ap-plication puts around a table four physicians, two perside. Each physicians has different materials and doc-uments, i. e., medical records, laboratory diagnosis,x-rays, etc, about a single patience with a particulardisease. No physicians has enough material to under-stand which is the disease which affects the patientwithout the help of data held by other doctors.
Figure 4 shows a screenshot of the interface. Dif-ferent content is delivered to each workspace. Thegoal is to improve communication strategies and theability to work together of the physicians. The doctorscan create new windows to share the content, can dragthe window around the table surface, rotate, zoom inand out to better understand a picture, e.g., an x-ray,or a video, e. g., an ultrasound scan. When a doctorputs in common his own material dragging it on thecenter of the table, the other windows are minimized,to better focus the other doctors’ attention on that par-ticular medical data.
The application was created using Tactive, there-fore the developer only needs to assemble the contentinto web pages. The Javascript API was used to im-plement the communication between windows, i. e.,
Figure 5: Screenshot from an application developed for carmarket.
to minimize all the windows when a physician putssome data on the center of the table.
Thanks to our software layer, the developmentprocess is reduced to content creation which requires45 man-days of a developer for its realization. Thedevelopment of the same application using the C++language on a TouchWindow Slice Table Multi-Touch(Touchwindow S.r.l., 2013) required one man-year,therefore our framework allows to save about 86% oftime 2 as reported in Table 1.
The same application was used during 15 differentone-day courses for physicians, using the same struc-ture, and changing only the content, i. e., the text inthe web pages, but not the structure of the pages. Thisadaptation process required only one day of work ofa web content editor. Moreover, the application canrun on any tabletop, independently from the operat-ing system3 or the size of the surface.
The second case study is an application developedfor the launch of a new product of a leading companyin the car market. In this case, the application wasused by a single speaker who, during his presenta-tion, switched between an interactive slideshow, sev-eral videos and some online demos on a web site. Fig-ure 5 shows the menu which allows to choose a videofor the presentation.
The main issue for this application was to mixboth off-line and online content: the “traditional”software building blocks used for tabletop UI wouldhave required to develop the application from scratch,loading it with the off-line content (videos andslideshows) and linking online content into a webviewor a browser. Such application would have requiredfour weeks of a FTE (Full Time Equivalent) softwaredeveloper, and an implementation using Flash wouldhave required ten man-days, as reported in Table 1.
2This information has been extracted from a previousrealization of the same application, which was not indepen-dent from the chosen hardware.
3Microsoft Windows 7 or superior, Linux and Apple iOsLion are supported.
WEBIST�2014�-�International�Conference�on�Web�Information�Systems�and�Technologies
96
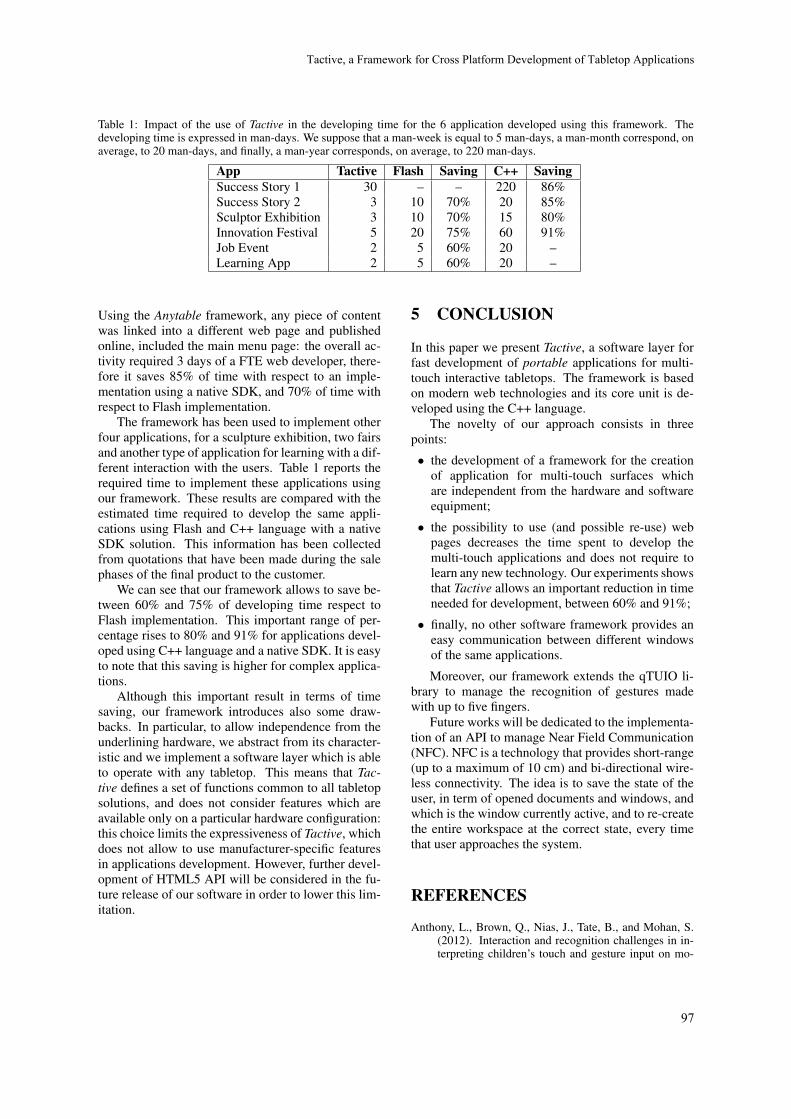
Table 1: Impact of the use of Tactive in the developing time for the 6 application developed using this framework. Thedeveloping time is expressed in man-days. We suppose that a man-week is equal to 5 man-days, a man-month correspond, onaverage, to 20 man-days, and finally, a man-year corresponds, on average, to 220 man-days.
App Tactive Flash Saving C++ SavingSuccess Story 1 30 – – 220 86%Success Story 2 3 10 70% 20 85%Sculptor Exhibition 3 10 70% 15 80%Innovation Festival 5 20 75% 60 91%Job Event 2 5 60% 20 –Learning App 2 5 60% 20 –
Using the Anytable framework, any piece of contentwas linked into a different web page and publishedonline, included the main menu page: the overall ac-tivity required 3 days of a FTE web developer, there-fore it saves 85% of time with respect to an imple-mentation using a native SDK, and 70% of time withrespect to Flash implementation.
The framework has been used to implement otherfour applications, for a sculpture exhibition, two fairsand another type of application for learning with a dif-ferent interaction with the users. Table 1 reports therequired time to implement these applications usingour framework. These results are compared with theestimated time required to develop the same appli-cations using Flash and C++ language with a nativeSDK solution. This information has been collectedfrom quotations that have been made during the salephases of the final product to the customer.
We can see that our framework allows to save be-tween 60% and 75% of developing time respect toFlash implementation. This important range of per-centage rises to 80% and 91% for applications devel-oped using C++ language and a native SDK. It is easyto note that this saving is higher for complex applica-tions.
Although this important result in terms of timesaving, our framework introduces also some draw-backs. In particular, to allow independence from theunderlining hardware, we abstract from its character-istic and we implement a software layer which is ableto operate with any tabletop. This means that Tac-tive defines a set of functions common to all tabletopsolutions, and does not consider features which areavailable only on a particular hardware configuration:this choice limits the expressiveness of Tactive, whichdoes not allow to use manufacturer-specific featuresin applications development. However, further devel-opment of HTML5 API will be considered in the fu-ture release of our software in order to lower this lim-itation.
5 CONCLUSION
In this paper we present Tactive, a software layer forfast development of portable applications for multi-touch interactive tabletops. The framework is basedon modern web technologies and its core unit is de-veloped using the C++ language.
The novelty of our approach consists in threepoints:
� the development of a framework for the creationof application for multi-touch surfaces whichare independent from the hardware and softwareequipment;
� the possibility to use (and possible re-use) webpages decreases the time spent to develop themulti-touch applications and does not require tolearn any new technology. Our experiments showsthat Tactive allows an important reduction in timeneeded for development, between 60% and 91%;
� finally, no other software framework provides aneasy communication between different windowsof the same applications.
Moreover, our framework extends the qTUIO li-brary to manage the recognition of gestures madewith up to five fingers.
Future works will be dedicated to the implementa-tion of an API to manage Near Field Communication(NFC). NFC is a technology that provides short-range(up to a maximum of 10 cm) and bi-directional wire-less connectivity. The idea is to save the state of theuser, in term of opened documents and windows, andwhich is the window currently active, and to re-createthe entire workspace at the correct state, every timethat user approaches the system.
REFERENCES
Anthony, L., Brown, Q., Nias, J., Tate, B., and Mohan, S.(2012). Interaction and recognition challenges in in-terpreting children’s touch and gesture input on mo-
Tactive,�a�Framework�for�Cross�Platform�Development�of�Tabletop�Applications
97

bile devices. In Proceedings of the 2012 ACM inter-national conference on Interactive tabletops and sur-faces, ITS ’12, pages 225–234.
Apache Software Foundation (2013). Phonegap, http://phonegap.com/.
Belleh, W. and Blankenburgs, M. (2013). qTUIO Library.http://qtuio.sirbabyface.net/.
Correia, N., Mota, T., Nobrega, R., Silva, L., and Almeida,A. (2010). A multi-touch tabletop for robust mul-timedia interaction in museums. In ACM Interna-tional Conference on Interactive Tabletops and Sur-faces, ITS ’10, pages 117–120.
Forlines, C., Wigdor, D., Shen, C., and Balakrishnan, R.(2007). Direct-touch vs. mouse input for tabletopdisplays. In Proceedings of the SIGCHI Conferenceon Human Factors in Computing Systems, CHI ’07,pages 647–656.
Gaggi, O. and Regazzo, M. (2013). An environment for fastdevelopment of tabletop applications. In Proceedingsof the 2013 ACM International Conference on Interac-tive Tabletops and Surfaces, ITS ’13, pages 413–416.
Geller, T. (2006). Interactive tabletop exhibits in museumsand galleries. IEEE Comput. Graph. Appl., 26(5):6–11.
Hesselmann, T., Boll, S., and Heuten, W. (2011). Sciva:designing applications for surface computers. In Pro-ceedings of the 3rd ACM SIGCHI Symposium on En-gineering interactive computing systems, EICS ’11,pages 191–196.
Ideum (2013). Gestureworks Core. http://gestureworks.com/pages/core-home.
Kaltenbrunner, M., Bovermann, T., Bencina, R., andCostanza, E. (2013). TUIO Framework. http://www.tuio.org/.
Luyten, K., Vanacken, D., Weiss, M., Borchers, J., Izadi,S., and Wigdor, D. (2010). Engineering patterns formulti-touch interfaces. In Proceedings of the 2ndACM SIGCHI symposium on Engineering interactivecomputing systems, EICS ’10, pages 365–366.
Microsoft (2013a). Surface 2.0 SDK. http://msdn.microsoft.com/en-us/library/ff 727815.aspx.
Microsoft (2013b). Walkthrough: Creating Your FirstTouch Application. http://msdn.microsoft.com/en-us/library/ee649090.aspx.
Nielsen, M., Strring, M., Moeslund, T., and Granum, E.(2004). A procedure for developing intuitive and er-gonomic gesture interfaces for hci. In Camurri, A.and Volpe, G., editors, Gesture-Based Communica-tion in Human-Computer Interaction, volume 2915 ofLecture Notes in Computer Science, pages 409–420.Springer Berlin Heidelberg.
Pedrosa, D., Guimaraes, R. L., da Graca Pimentel, M., Bul-terman, D. C. A., and Cesar, P. (2013). Interactivecoffee table for exploration of personal photos andvideos. In Proceedings of the 28th Annual ACM Sym-posium on Applied Computing, SAC ’13, pages 967–974.
Qin, Y., Liu, J., Wu, C., and Shi, Y. (2012). uEmergency:a collaborative system for emergency management onvery large tabletop. In Proceedings of the 2012 ACM
international conference on Interactive tabletops andsurfaces, ITS ’12, pages 399–402.
Rick, J., Marshall, P., and Yuill, N. (2011). Beyond one-size-fits-all: how interactive tabletops support collab-orative learning. In Proceedings of the 10th Inter-national Conference on Interaction Design and Chil-dren, IDC ’11, pages 109–117.
Seto, M., Scott, S., and Hancock, M. (2012). Investigatingmenu discoverability on a digital tabletop in a publicsetting. In Proceedings of the 2012 ACM internationalconference on Interactive tabletops and surfaces, ITS’12, pages 71–80.
SMART Technologies (2013). SMART Table SDK. http://downloads01.smarttech.com/media/products/sdk/smart-table-sdk-summary.pdf.
Toffanin, P. (2013). Glassomium Project. http://www.glassomium.org/.
Touchwindow S.r.l. (2013). Slice Table Multi-Touch http://www.touchwindow.it/en/slice-multi-touch-table.php/.
Unedged (2013). Arena Multitouch Platform. http://arena.unedged.com/.
Urakami, J. (2012). Developing and testing a human-basedgesture vocabulary for tabletop systems. Human Fac-tors, 54(4):636–653.
Wigdor, D., Fletcher, J., and Morrison, G. (2009). De-signing user interfaces for multi-touch and gesture de-vices. In CHI ’09 Extended Abstracts on Human Fac-tors in Computing Systems, CHI EA ’09, pages 2755–2758.
WEBIST�2014�-�International�Conference�on�Web�Information�Systems�and�Technologies
98
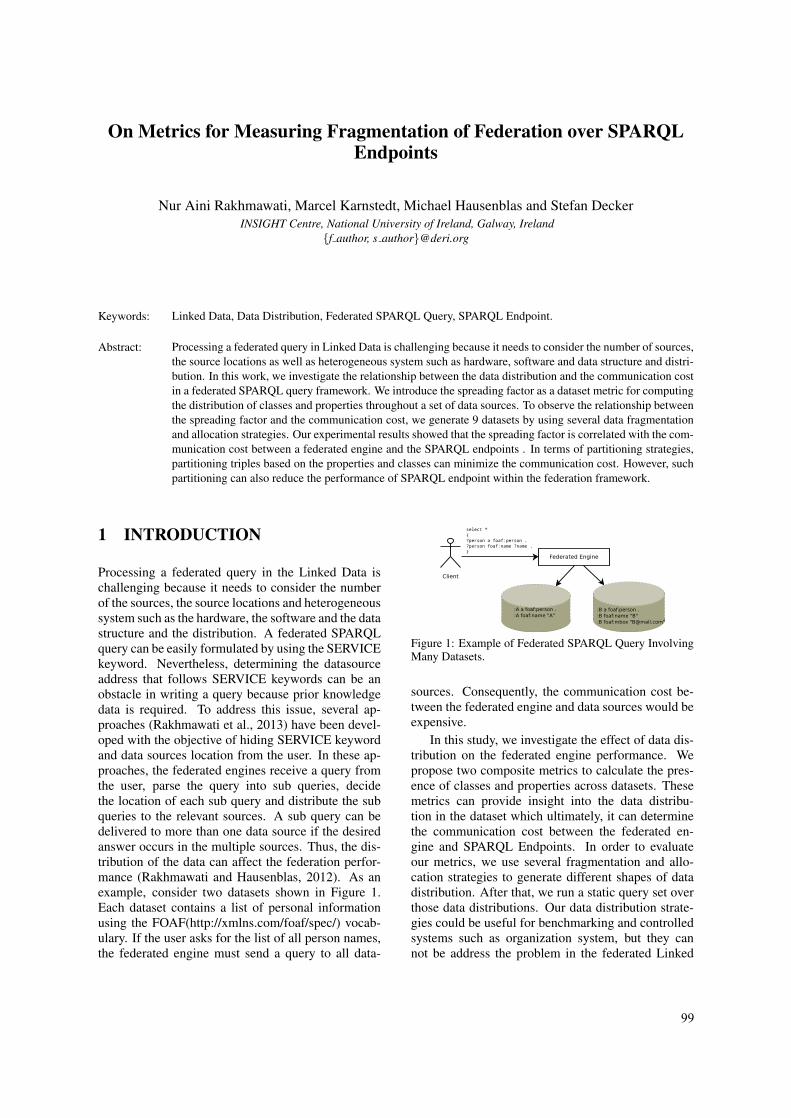
On Metrics for Measuring Fragmentation of Federation over SPARQLEndpoints
Nur Aini Rakhmawati, Marcel Karnstedt, Michael Hausenblas and Stefan DeckerINSIGHT Centre, National University of Ireland, Galway, Ireland
{f author, s author}@deri.org
Keywords: Linked Data, Data Distribution, Federated SPARQL Query, SPARQL Endpoint.
Abstract: Processing a federated query in Linked Data is challenging because it needs to consider the number of sources,the source locations as well as heterogeneous system such as hardware, software and data structure and distri-bution. In this work, we investigate the relationship between the data distribution and the communication costin a federated SPARQL query framework. We introduce the spreading factor as a dataset metric for computingthe distribution of classes and properties throughout a set of data sources. To observe the relationship betweenthe spreading factor and the communication cost, we generate 9 datasets by using several data fragmentationand allocation strategies. Our experimental results showed that the spreading factor is correlated with the com-munication cost between a federated engine and the SPARQL endpoints . In terms of partitioning strategies,partitioning triples based on the properties and classes can minimize the communication cost. However, suchpartitioning can also reduce the performance of SPARQL endpoint within the federation framework.
1 INTRODUCTION
Processing a federated query in the Linked Data ischallenging because it needs to consider the numberof the sources, the source locations and heterogeneoussystem such as the hardware, the software and the datastructure and the distribution. A federated SPARQLquery can be easily formulated by using the SERVICEkeyword. Nevertheless, determining the datasourceaddress that follows SERVICE keywords can be anobstacle in writing a query because prior knowledgedata is required. To address this issue, several ap-proaches (Rakhmawati et al., 2013) have been devel-oped with the objective of hiding SERVICE keywordand data sources location from the user. In these ap-proaches, the federated engines receive a query fromthe user, parse the query into sub queries, decidethe location of each sub query and distribute the subqueries to the relevant sources. A sub query can bedelivered to more than one data source if the desiredanswer occurs in the multiple sources. Thus, the dis-tribution of the data can affect the federation perfor-mance (Rakhmawati and Hausenblas, 2012). As anexample, consider two datasets shown in Figure 1.Each dataset contains a list of personal informationusing the FOAF(http://xmlns.com/foaf/spec/) vocab-ulary. If the user asks for the list of all person names,the federated engine must send a query to all data-
Figure 1: Example of Federated SPARQL Query InvolvingMany Datasets.
sources. Consequently, the communication cost be-tween the federated engine and data sources would beexpensive.
In this study, we investigate the effect of data dis-tribution on the federated engine performance. Wepropose two composite metrics to calculate the pres-ence of classes and properties across datasets. Thesemetrics can provide insight into the data distribu-tion in the dataset which ultimately, it can determinethe communication cost between the federated en-gine and SPARQL Endpoints. In order to evaluateour metrics, we use several fragmentation and allo-cation strategies to generate different shapes of datadistribution. After that, we run a static query set overthose data distributions. Our data distribution strate-gies could be useful for benchmarking and controlledsystems such as organization system, but they cannot be address the problem in the federated Linked
99
Open Data environment because the Linked Data pub-lisher has the power to control the dataset genera-tion. The existing evaluations for assessing the feder-ation over SPARQL endpoints (Montoya et al., 2012;Schwarte et al., 2012) usually run their experimentover different datasets and different query sets. Infact, the performance of the federated engine is influ-enced by both dataset and query set. As a result, theperformance results may vary. For benchmarking, abetter comparison of federated engines performancecan made with either static query sets over differentdatasets or static dataset with various query sets.
We only perform our observation on federationover SPARQL endpoints. Query with a SERVICEkeyword is also out of the scope of our study be-cause the query only goes to the specified source. Inother words, the data distribution does not influencethe performance of the federation engine in that query.Our contributions can be stated as follows: 1) We in-vestigate the effects of data fragmentation and allo-cation on the communication cost of the FederatedSPARQL query. 2) We introduce the spreading fac-tor as a metric for calculating the distribution of dataacross a dataset. In addition, we present the relation-ship between the spreading factor and the communi-cation cost of federated SPARQL queries. 3) Lastly,we create datasets for evaluating the spreading factormetric drawing from the real datasets. In particular,we provide datasets and a dataset generator that canbe useful for benchmarking purpose.
2 RELATED WORKS
Primitive data metrics such as the number of triples,the number of literals are not sufficiently represen-tative to reveal the essential characteristics of thedatasets. Thus, Duan (Duan et al., 2011) introduceda structuredness notion. Since this notion is appliedto a single RDF repository, it is not suitable for feder-ated SPARQL queries which should consider the dataallocation in each repository as well as the number ofdata sources involved in the dataset.
There are several data partitioning approaches forRDF data clustering repository such as vertical parti-tioning (Abadi et al., 2007) and Property Table par-titioning (Huang et al., 2011). However, the commu-nication in the RDF data clustering is totally differ-ent than the communication in the federated SPARQLquery. In data clustering, several machines needto communicate with each other in order to executea query, whereas in the federated SPARQL query,there is no interaction amongst SPARQL endpoints.The mediator has a role to communicate to each
SPARQL endpoint during query execution in the fed-erated SPARQL query. Nevertheless, we apply RDFdata clustering strategies to generate the datasets forevaluation.
The existing evaluations of the federation frame-works used data partitioning in their experiment byadopting data clustering strategies. Prasser (Prasseret al., 2012) implemented three partitions: naturally-partitioned, horizontally-partitioned and randomly-partitioned. Fedbench(Schmidt et al., 2011) dividedthe SP2B (Schmidt et al., 2009) dataset into sev-eral partitions to run one of their evaluations. Ourprior work (Rakhmawati and Hausenblas, 2012) ob-served the impact of data distribution on federatedquery execution which particularly focus on the num-ber of sources involved, the number of links and thepopulated entities in several sources. In this work,we extend our previous evaluation by implementingmore data partitioning schemes and we investigatethe effect of the distribution of classes and propertiesthroughout the dataset partitions on the performanceof federated SPARQL query.
3 SPREADING FACTOR OFDATASET
Federated engines generally use a data catalogue topredict the most relevant sources for a sub query.The data catalogue mostly consists of a list of pred-icates and classes. Apart from deciding the destina-tion of the sub queries, a data catalogue can help fed-erated engine generate set of query execution plans.Hence, we consider computing the Spreading factorof dataset to analyse the distribution of classes andproperties throughout the dataset. We initially definethe dataset used in this paper as follows:
Definition 1. Dataset D is a finite set of data sourcesd. In the context of federation over SPARQL end-points, d denotes a set of triple statements t thatcan be accessed by a SPARQL endpoint. For eachSPARQL endpoint, there exists multiple RDF graphs.
In our work, we ignore the existence of graphs,because we are only interested in the occurrences ofproperties and classes in the SPARQL endpoint.
Definition 2. Let U be the set of all URIs, B be the setof all BlankNodes, L be the set of all Literals, then atriple t = (s, p,o) ∈ (U ∪B)×U × (U ∪L∪B) wheres is the subject, p is the predicate and o is the objectof triple t.
Later on, we determine the property and the classin the dataset as follows:
WEBIST�2014�-�International�Conference�on�Web�Information�Systems�and�Technologies
100
Definition 3. Suppose d is a datasource in the datasetD, then the set Pd(d,D) of properties p in the sourced is defined as Pd(d,D) = {p|∃(s, p,o) ∈ d ∧ d ∈ D}and the set P(D) of properties p in the dataset D isdefined as P(D) = {p|p ∈ Pd(d,D)∧d ∈ D}Definition 4. Suppose d is a datasource in the datasetD, then the set Cd(d,D) of classes c in the source dis defined as Cd(d,D) = {c|∃(s,rd f type,c) ∈ d∧d ∈D} and the set of classes c in the dataset D is definedas C(D) = {c|c ∈Cd(d,D)∧d ∈ D}
Given two datasets D = {d1,d2} as shown inFigure 1. Then Pd(d1,D) = {rdf:type, foaf:name},Pd(d2,D) = P(D) = {rdf:type, foaf:name, foaf:mbox}and Cd(d1,D) =Cd(d2,D) =C(D) = {foaf:person}.
3.1 Spreading Factor of Dataset
With the above definitions of class, property anddataset, now we can describe how we calculate thespreading factor. The spreading factor of the datasetis based on whether or not classes and properties oc-cur. Note that, we do not count the number of timesa class and property that are found in the source d be-cause the federated engine usually relies on the pres-ence of property in order to predict the data locationof a sub query. Given dataset D that contains a setof datasets d, the normalizing number of occurrencesof properties in the Dataset D (OCP(D))is calculatedas follows: OCP(D) = ∑∀d∈D |Pd(d,D)|
|P(D)|×|D| And the normal-izing number of occurrences of classes in Dataset D(OCC(D)) is computed as OCC(D) = ∑∀d∈D |Cd(d,D)|
|C(D)|×|D|OCP(D) and OCC(D) have a range value from
zero to one. Inspired by the F-Measure function,we combine OCP(D) and OCC(D) into a single met-ric which is called the Spreading Factor Γ(D) of the
dataset D. Γ(D) = (1+β2)OCP(D)×OCC(D)β2×OCP(D)+OCC(D)
where β =
0.5We assign β = 0.5 in order to put more stress on
properties than classes. The intuition is that the high-est number of the query pattern delivered to SPARQLendpoint mostly contains constant predicates (Ariaset al., 2011). Moreover, the number of distinct prop-erties in the dataset is usually higher than the numberof distinct classes in the dataset. The high Γ valueindicates that the class and properties are spread outover the dataset.
Look back at our previous example in whichwe define Pd(d1,D), Pd(d2,D), P(D), C(D),Cd(d1,D),Cd(d2,D), then we can calculateOCP(D) = 2+3
3X2 = 0.833 and OCC(D) = 1+11X2 = 1.
Finally, we obtain Γ(D) = 1.172
3.2 Spreading Factor of Datasetassociated with the Queryset
The spreading factor of a dataset reveals how thewhole of classes and properties are distributed overthe dataset. However, a query only consists of partialproperties and classes in the dataset. Thus, it is nec-essary to quantify the spreading factor of the datasetwith respect to the queryset.
Definition 5. A query consists of set of triple patternsτ which is formally defined as τ(s, p,o) ∈ (U ∪V )×(U∪V )×(U∪L∪V ) where V is a set of all variables.
Given a queryset Q = {q1,q2, · · · ,qn}, the Q-spreading factor γ of dataset D associated with query-set Q is computed as γ(Q,D) = ∑∀q∈Q
∑∀τ∈q OC(τ,D)
|Q|where the occurrences of class and property for τ isspecified as
OC(τ,D) =
o f D(oτ,D)
|D|if pτ is rdf:type
∧oτ /∈Vp f D(pτ,D)
|D|if pτ is not rdf:type
∧pτ /∈V
∑∀d∈D |Pd(d,D)||D|
otherwise
o f D(o,D) denotes the occurrences of object o inthe dataset D and p f D(p,D) denotes the occurrencesof predicate p in the dataset D which can be calculatedas follows: o f D(o,D) = ∑∀d∈D o f d(o,d,D) The oc-currences of object o in the source d can be explainedas follows:
o f d(o,d,D) =
{1 if o ∈Cd(d,D)0 otherwise
p f D(p,D) = ∑∀d∈D p f d(p,d,D) The occurrenceof predicate p in the source d can be obtained fromthe following formula:
p f d(p,d,D) =
{1 if p ∈ Pd(d,D)0 otherwise
Consider an example, given a queryand a dataset as shown in Figure 1,then OC(?person a foaf:person,D) = 1 andOC(?person foaf:name ?name,D) = 1 becausefoaf:person and foaf:name are located in two datasources. As a result, the q-Spreading factor γ(Q,D)is 1+1
1 = 2
4 EVALUATION
We ran our evaluation on an Intel Xeon CPU X5650,2.67GHz server with Ubuntu Linux 64-bit installed as
On�Metrics�for�Measuring�Fragmentation�of�Federation�over�SPARQL�Endpoints
101

Listing 1: Dailymed Sample Triples.d a i l y m e d d r u g : 8 2 a da i lymed : drugd a i l y m e d d r u g : 8 2 da i lymed : a c t i v e i n g r e d i e n t d a i l y m e d i n g :
P h e n y t o i nd a i l y m e d d r u g : 8 2 r d f s : l a b e l ” D i l a n t i n −125 ( S u s p e n s i o n ) ”
d a i l y m e d d r u g :201 a da i lymed : drugd a i l y m e d d r u g :201 da i lymed : a c t i v e i n g r e d i e n t d a i l y m e d i n g :
E t h o s u x i m i d ed a i l y m e d d r u g :201 r d f s : l a b e l ” Z a r o n t i n ( Capsu l e ) ”
d a i l y m e d o r g : Parke−Davis a da i lymed : o r g a n i z a t i o nd a i l y m e d o r g : Parke−Davis r d f s : l a b e l ” Parke−Davis ”d a i l y m e d o r g : Parke−Davis da i lymed : p roducesDrug
d a i l y m e d d r u g : 8 2d a i l y m e d o r g : Parke−Davis da i lymed : p roducesDrug
d a i l y m e d d r u g :201
d a i l y m e d i n g : P h e n y t o i n a da i lymed : i n g r e d i e n t sd a i l y m e d i n g : P h e n y t o i n r d f s : l a b e l ” P h e n y t o i n ”
d a i l y m e d i n g : E t h o s u x i m i d e a da i lymed : i n g r e d i e n t sd a i l y m e d i n g : E t h o s u x i m i d e r d f s : l a b e l ” E t h o s u x i m i d e ”
the Operating System and Fuseki 1.0 as the SPARQLEndpoint server. For each dataset, we set up Fusekion different ports. We re-used the query set from ourprevious work (Rakhmawati and Hausenblas, 2012).We limited the query processing duration to one hour.Each query was executed three times on two federa-tion engines, namely SPLENDID (Gorlitz and Staab,2011) and DARQ (Quilitz and Leser, 2008). Theseengines were chosen because SPLENDID employsVoID(http://www.w3.org/TR/void/) as data cataloguethat contains a list of predicates and entities, whileDARQ has a list of predicates which is stored in theService Description(http://www.w3.org/TR/sparql11-service-description/). Apart from using VoID,SPLENDID also sends a SPARQL ASK query to de-termine whether or not the source can potentially re-turn the answer. We explain the details of our datasetgeneration and metrics as follows:
4.1 Data Distribution
To determine the correlation between the commu-nication cost of the federated SPARQL query andthe data distribution, we generate 9 datasets by di-viding the Dailymed(http://wifo5-03.informatik.uni-mannheim.de/dailymed/) into three partitions basedon following strategies:
4.1.1 Graph Partition
Inspired by data clustering for a single RDF storage(Huang et al., 2011), we performed graph partitionover our dataset by using METIS (Karypis and Ku-mar, 1998). The aim of this partition scheme is toreduce the communication needed between machinesduring the query execution process by storing the con-nected components of the graph in the same machine.We initially identify the connections of subject and
object in different triples. We only consider the URIobject which is also a subject in other triples. Intu-itively, the reason is that the object which appears asthe subject in other triples can create a connection ifthe triples are located in different dataset partitions.V (D) denotes the set of pairs of subject and object thatare connected in the dataset D which can be formallyspecified as V (D) = {(s,o)|∃s,o, p, p′ ∈U : (s, p,o)∈D∧ (o, p′,o′) ∈ D′}. We assign a numeric identifierfor each s,o ∈V (D). After that, we create a list of se-quential adjacent vertexes for each vertex then uses itas input of METIS API. Run METIS to divide the ver-texes and get a list of the partition number of vertexesas output. Finally, we distribute each triple based onthe partition number of its subject and object. Con-sider an example, given Listing 1 as a dataset sample,then
V (D)={(dailymeddrug:82,
dailymeding:Phenytoin),(dailymeddrug:201,
dailymeding:Ethosuximide),(dailymedorg:Parke-Davis,
dailymeddrug:82),(dailymedorg:Parke-Davis,
dailymeddrug:201)}
Starting an identifier value from one and incrementthe identifier later, we set the identifier for daily-meddrug:82 = 1, dailymeding:Phenytoin =2, dai-lymeddrug:201=3, dailymeding:Ethosuximide=4 anddailymedorg:Parke-Davis=5. After that, we cancreate list of sequential adjacent vertexes V (D) is{(2,5),1,(4,5),3,(1,3)}. Suppose that we divide thesample of dataset into 2 partitions, then the output ofMETIS partition is {1,1,2,2,1} where each value isthe partition number for each vertex. According to theMETIS output, we can say that dailymeddrug:82 be-longs to partition 1, dailymeding:Phenytoin belongsto partition 1, dailymeddrug:201 belongs to partition2 and so on. In the end, we have two following parti-tions:Partition 1: all triples that contain dailymeddrug:82, daily-meding:Phenytoin and dailymedorg:Parke-DavisPartition 2: all triples that contain dailymeddrug:201 anddailymeding:Ethosuximide
4.1.2 Entity Partition
The goal of this partition is to distribute the number ofentities evenly in each partition. Different classes canbe located in a single partition. However, the entitiesof the same class should be grouped in the same parti-tion until the number of entities reaches the maximumnumber of entities for each source. We initially createa list of the subjects along with its class (E(D)). Theset E(D) of pairs of subject and its class in the datasetD is defined as E(D) = {(s,o)|∃(s,rd f type,o) ∈ D}
WEBIST�2014�-�International�Conference�on�Web�Information�Systems�and�Technologies
102
Then, we sort E(D) by its class o and store each pairof the subject and object in a partition until the num-ber of pairs of subject and object equals to the totalpairs of subject and object divided by the number ofpartitions. After that, we distribute the remainders oftriples in the dataset based on the subject location.Given Listing 1 as a dataset sample, then
E(D)={(dailymeddrug:82,dailymed:drug),(dailymeddrug:201
,dailymed:drug),(dailymedorg:Parke-Davis,dailymed:organization),
(dailymeding:Phenytoin,dailymed:ingredients),
(dailymeding:Ethosuximide,dailymed:ingredients)}
Suppose that we split the dataset into two parti-tions, then the maximum number of entities for eachpartition is |E(D)|
numbero f partitions = 52 = 3 (ceiling 2.5).
We place dailymeddrug:82, dailymeddrug:201 anddailymedorg:Parke-Davis in the partition 1 and storethe remainders of entities in the partition 2. As thefinal step, we distribute the related triples based on itssubject partition number.
4.1.3 Class Partition
Class Partition divides the dataset based on its classes.The related triples that belong to one entity are placedin the same machine. To begin with, we also createE(D) which was used in Entity partition. Later, wedistribute each triple based on the subject class. ikeour previous entity partition example, we do the samestep to generate E(D). However, in the class partition,we divide the dataset to three partitions since we havethree classes (dailymed:drug, dailymed:organization,dailymed:ingredients).
4.1.4 Property Partition
Wilkinson(Wilkinson, 2006) introduced a method forstoring RDF data in traditional databases known asProperty Table (PT). There are two types of PT par-titions: Clustered Property Table and Property-classTable. In our property partition, we do not havea Property class table because we treat all proper-ties in the same manner. We place the triples thathave the same property in one data source. Be-cause the number of properties in the dataset is gen-erally high, we allow more than one property tobe stored in the same partition as long as we geta balanced number of triples among the partitions.Firstly, we group the triples based on its property.Next, we store each group in a partition until thenumber of partition triples is less than or equal tothe number of dataset triples divided by the num-ber of partitions. For instance, given a dataset asshown in Listing 1, then we have four properties:
rdf:type, dailymed:activeingredient, rdf:label and dai-lymed:producesDrug. Suppose that we want to dividethe dataset into 2 partitions, then the maximum num-ber of triples in each partition is thenumbero f triples
thenumbero f partitions =142 = 7. As the following step, we store the triples
based on its property as follows: Partition 1: fivetriples with rdf:type property, two triples with dai-lymed:activeingredient property and Partition 2: fivetriples with rdfs:label property, two triples with daily-med:producesDrug
4.1.5 Triples Partition
The federation framework performance is influencednot only by the federated engine solely, but also de-pends on the SPARQL Endpoints within the federa-tion framework. In order to keep balanced workloadfor SPARQL Endpoints, we split up the triples of eachsource evenly because LUBM (Guo et al., 2005) men-tioned that the number of triples can influence the per-formance of a RDF repository. We created three triplepartition datasets (T D, T D2, T D3). T D is obtainedby partitioning the native Dailymed dataset into threeparts. T D2 and T D3 are generated by picking a ran-dom starting point within the Dailymed dump file(bypicking a random line number).
4.1.6 Hybrid Partition
The Hybrid Partition is a partitioning method thatcombines two or more previous partition strategies.For instance, if the number of triples in a class is toohigh, we can distribute the triples to another partitionto equalize the number of triples. Since the num-ber of triples in each dataset of the Class Distribu-tion CD are not equal, we create HD to distributethe triples evenly. However, rdf:type property andrdfs:label property are evenly through all partitions indataset HD2. This distribution is intended for balanc-ing the workload amongst SPARQL Endpoints sincethose properties are commonly used in our query set.
As shown in those figures, the classes and proper-ties are distributed over most of the partitions in theGD dataset. The PD has the lowest Spreading Fac-tor among the dataset because each property occursin exactly one partition and only in one partition has aset of triples that contains rdf:type. The dataset gen-eration code and the generation results can be foundat DFedQ github(https://github.com/nurainir/DFedQ)
4.2 Metrics
To calculate the communication cost of the the fed-erated SPARQL query, we compute the data transfer
On�Metrics�for�Measuring�Fragmentation�of�Federation�over�SPARQL�Endpoints
103
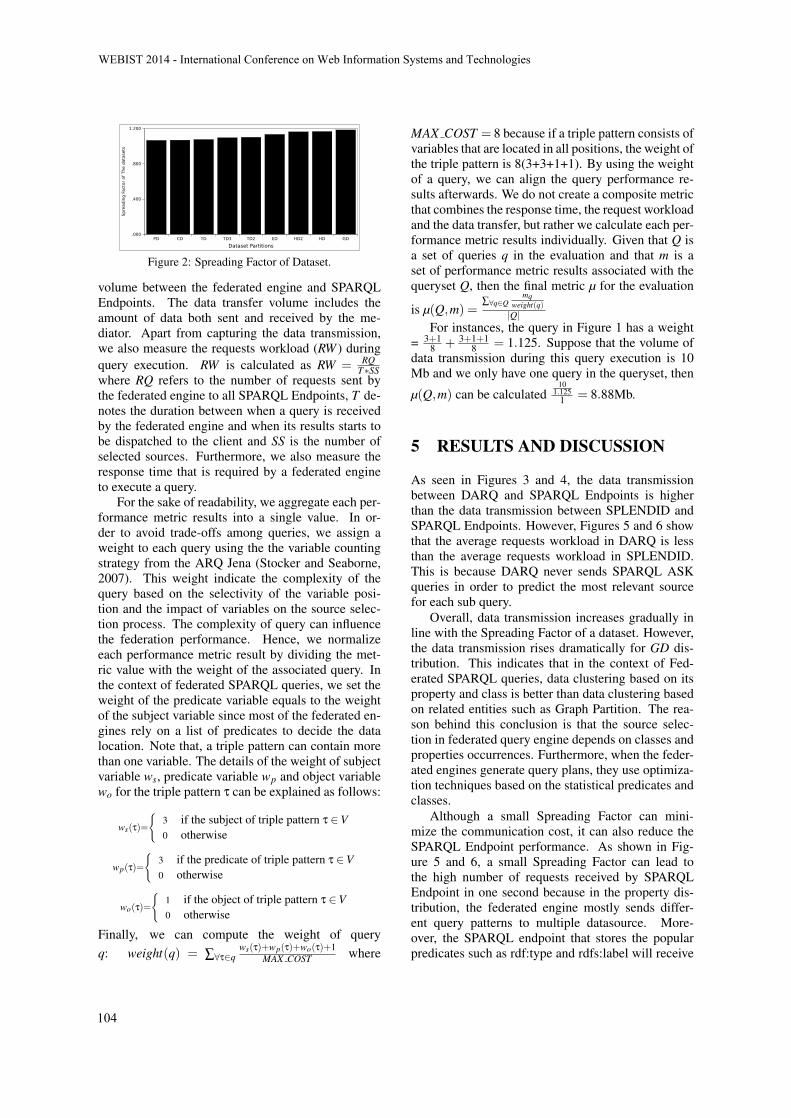
PD CD TD TD3 TD2 ED HD2 HD GD
Dataset Partitions
.000
.400
.800
1.200
Spre
adin
g F
acto
r of
The d
ata
sets
Figure 2: Spreading Factor of Dataset.
volume between the federated engine and SPARQLEndpoints. The data transfer volume includes theamount of data both sent and received by the me-diator. Apart from capturing the data transmission,we also measure the requests workload (RW ) duringquery execution. RW is calculated as RW = RQ
T∗SSwhere RQ refers to the number of requests sent bythe federated engine to all SPARQL Endpoints, T de-notes the duration between when a query is receivedby the federated engine and when its results starts tobe dispatched to the client and SS is the number ofselected sources. Furthermore, we also measure theresponse time that is required by a federated engineto execute a query.
For the sake of readability, we aggregate each per-formance metric results into a single value. In or-der to avoid trade-offs among queries, we assign aweight to each query using the the variable countingstrategy from the ARQ Jena (Stocker and Seaborne,2007). This weight indicate the complexity of thequery based on the selectivity of the variable posi-tion and the impact of variables on the source selec-tion process. The complexity of query can influencethe federation performance. Hence, we normalizeeach performance metric result by dividing the met-ric value with the weight of the associated query. Inthe context of federated SPARQL queries, we set theweight of the predicate variable equals to the weightof the subject variable since most of the federated en-gines rely on a list of predicates to decide the datalocation. Note that, a triple pattern can contain morethan one variable. The details of the weight of subjectvariable ws, predicate variable wp and object variablewo for the triple pattern τ can be explained as follows:
ws(τ)=
{3 if the subject of triple pattern τ ∈V0 otherwise
wp(τ)=
{3 if the predicate of triple pattern τ ∈V0 otherwise
wo(τ)=
{1 if the object of triple pattern τ ∈V0 otherwise
Finally, we can compute the weight of queryq: weight(q) = ∑∀τ∈q
ws(τ)+wp(τ)+wo(τ)+1MAX COST where
MAX COST = 8 because if a triple pattern consists ofvariables that are located in all positions, the weight ofthe triple pattern is 8(3+3+1+1). By using the weightof a query, we can align the query performance re-sults afterwards. We do not create a composite metricthat combines the response time, the request workloadand the data transfer, but rather we calculate each per-formance metric results individually. Given that Q isa set of queries q in the evaluation and that m is aset of performance metric results associated with thequeryset Q, then the final metric µ for the evaluation
is µ(Q,m) =∑∀q∈Q
mqweight(q)|Q|
For instances, the query in Figure 1 has a weight= 3+1
8 + 3+1+18 = 1.125. Suppose that the volume of
data transmission during this query execution is 10Mb and we only have one query in the queryset, then
µ(Q,m) can be calculated10
1.1251 = 8.88Mb.
5 RESULTS AND DISCUSSION
As seen in Figures 3 and 4, the data transmissionbetween DARQ and SPARQL Endpoints is higherthan the data transmission between SPLENDID andSPARQL Endpoints. However, Figures 5 and 6 showthat the average requests workload in DARQ is lessthan the average requests workload in SPLENDID.This is because DARQ never sends SPARQL ASKqueries in order to predict the most relevant sourcefor each sub query.
Overall, data transmission increases gradually inline with the Spreading Factor of a dataset. However,the data transmission rises dramatically for GD dis-tribution. This indicates that in the context of Fed-erated SPARQL queries, data clustering based on itsproperty and class is better than data clustering basedon related entities such as Graph Partition. The rea-son behind this conclusion is that the source selec-tion in federated query engine depends on classes andproperties occurrences. Furthermore, when the feder-ated engines generate query plans, they use optimiza-tion techniques based on the statistical predicates andclasses.
Although a small Spreading Factor can mini-mize the communication cost, it can also reduce theSPARQL Endpoint performance. As shown in Fig-ure 5 and 6, a small Spreading Factor can lead tothe high number of requests received by SPARQLEndpoint in one second because in the property dis-tribution, the federated engine mostly sends differ-ent query patterns to multiple datasource. More-over, the SPARQL endpoint that stores the popularpredicates such as rdf:type and rdfs:label will receive
WEBIST�2014�-�International�Conference�on�Web�Information�Systems�and�Technologies
104

PD CD TD TD3 TD2 ED HD2 HD GD
Dataset Partitions
0E+00
500E+03
1E+06
2E+06
2E+06
2E+06
3E+06
4E+06
4E+06
Avera
ge D
ata
Tra
nsm
issio
n (
Byte
s)
Splendid
DARQ
Figure 3: Average Data Transfer Volume Vs the SpreadingFactor of Datasets (order by the Spreading Factor value).
PD TD CD TD3 TD2 ED HD2 HD GD
Dataset Partitions
0E+00
500E+03
1E+06
2E+06
2E+06
2E+06
3E+06
4E+06
4E+06
Avera
ge D
ata
Tra
nsm
issio
n (
Byte
s)
Splendid
DARQ
Figure 4: Average Data Transfer Volume Vs the Q-Spreading Factor of Datasets associated with the Query-set(order by the Spreading Factor value).
more requests than other SPARQL endpoints. Con-sequently, this such condition can lead to incompleteresults because when overloaded, the SPARQL End-point might reject requests (e.g Sindice SPARQL end-point(http://sindice.com/) only allows one client send-ing one query per second). Poor performance is alsoshown at the highest value of Spreading Factor ofthe dataset (GD) because the entities are spread overthe dataset partitions. Hence, with the calculation ofthe spreading factor of the dataset, the federated en-gine can create a query optimization which attemptsto adapt the dataset characteristic that is shown fromthe spreading factor value. For instance, if the datasethas too small Spreading Factor, the federated engineshould maintain a timer to send several requests to thesame SPARQL endpoint in order to keep the sustain-ability of the SPARQL endpoint as well as avoid the
PD CD TD TD3 TD2 ED HD2 HD GD
Dataset Partitions
0E+00
5E+00
10E+00
15E+00
20E+00
25E+00
Avera
ge R
equests
Work
load (
Requests
/Second)
Splendid
DARQ
Figure 5: Average Requests Workload Vs the SpreadingFactor of Datasets(order by the Spreading Factor value).
PD TD CD TD3 TD2 ED HD2 HD GD
Dataset Partitions
0E+00
5E+00
10E+00
15E+00
20E+00
25E+00
Avera
ge R
equests
Work
load (
Requests
/Second)
Splendid
DARQ
Figure 6: Average Requests Workload Vs the Q-SpreadingFactor of Datasets associated with the Queryset(order by theSpreading Factor value).
incomplete answer.
6 CONCLUSION
We have implemented various data distribution strate-gies to partition classes and properties over datasetpartitions. We introduced two notions of dataset met-rics, namely the Spreading Factor of a dataset andthe Spreading Factor of a Dataset associated with thequery set. These metrics expose the distribution ofclasses and properties over the dataset partitions. Ourexperiment results revealed that the class and propertydistribution effects on the communication cost be-tween the federated engine and SPARQL endpoints.However, it does not significantly influence the re-quest workload of a SPARQL endpoint. Partitioningtriples based on the properties and classes can mini-mize the communication cost. However, such parti-tioning can also reduce the performance of SPARQLendpoints within the federation infrastructure. Fur-ther, it can also influence the overall performance offederation framework.
In future work, we will apply other dataset par-titioning strategies and use more federated queryengines which have different characteristics fromDARQ and SPLENDID.
ACKNOWLEDGEMENTS
This publication has emanated from research con-ducted with the financial support of ScienceFoundation Ireland (SFI) under Grant NumberSFI/12/RC/2289 and Indonesian Directorate Generalof Higher Education. Thanks to Soheila for a greatdiscussion
On�Metrics�for�Measuring�Fragmentation�of�Federation�over�SPARQL�Endpoints
105
REFERENCES
Abadi, D. J., Marcus, A., Madden, S. R., and Hollenbach,K. (2007). Scalable semantic web data managementusing vertical partitioning. In Proceedings of the 33rdinternational conference on Very large data bases,VLDB ’07, pages 411–422.
Arias, M., Fernandez, J. D., Martınez-Prieto, M. A., andde la Fuente, P. (2011). An empirical study of real-world sparql queries. CoRR, abs/1103.5043.
Duan, S., Kementsietsidis, A., Srinivas, K., and Udrea,O. (2011). Apples and oranges: a comparison ofrdf benchmarks and real rdf datasets. In ACM Inter-national Conference on Management of Data (SIG-MOD).
Gorlitz, O. and Staab, S. (2011). SPLENDID: SPARQLEndpoint Federation Exploiting VOID Descriptions.In COLD2011, Bonn, Germany.
Guo, Y., Pan, Z., and Heflin, J. (2005). Lubm: A bench-mark for owl knowledge base systems. Web Seman-tics: Science, Services and Agents on the World WideWeb, 3(2-3):158 – 182.
Huang, J., Abadi, D. J., and Ren, K. (2011). Scalable sparqlquerying of large rdf graphs. PVLDB, 4(11):1123–1134.
Karypis, G. and Kumar, V. (1998). A fast and high qual-ity multilevel scheme for partitioning irregular graphs.SIAM J. Sci. Comput., 20(1):359–392.
Montoya, G., Vidal, M.-E., Corcho, O., Ruckhaus, E., andAranda, C. B. (2012). Benchmarking federated sparqlquery engines: Are existing testbeds enough? In In-ternational Semantic Web Conference (2), pages 313–324.
Prasser, F., Kemper, A., and Kuhn, K. A. (2012). Ef-ficient distributed query processing for autonomousrdf databases. In Proceedings of the 15th Interna-tional Conference on Extending Database Technol-ogy, EDBT ’12, pages 372–383, New York, NY, USA.ACM.
Quilitz, B. and Leser, U. (2008). Querying distributed rdfdata sources with sparql. In ESWC2008, pages 524–538, Berlin, Heidelberg. Springer-Verlag.
Rakhmawati, N. A. and Hausenblas, M. (2012). On the im-pact of data distribution in federated sparql queries. InSemantic Computing (ICSC), 2012 IEEE Sixth Inter-national Conference on, pages 255 –260.
Rakhmawati, N. A., Umbrich, J., Karnstedt, M., Hasnain,A., and Hausenblas, M. (2013). Querying over feder-ated sparql endpoints - a state of the art survey. CoRR,abs/1306.1723.
Schmidt, M., Gorlitz, O., Haase, P., Ladwig, G., Schwarte,A., and Tran, T. (2011). Fedbench: A benchmark suitefor federated semantic data query processing. In ISWC
Schmidt, M., Hornung, T., Lausen, G., and Pinkel, C.(2009). Spˆ 2bench: a sparql performance benchmark.In Data Engineering, 2009. ICDE’09. IEEE 25th In-ternational Conference on, pages 222–233. IEEE.
Schwarte, A., Haase, P., Schmidt, M., Hose, K., andSchenkel, R. (2012). An experience report of largescale federations. CoRR, abs/1210.5403.
Stocker, M. and Seaborne, A. (2007). Arqo: The architec-ture for an arq static query optimizer.
Wilkinson, K. (2006). Jena property table implementation.In In SSWS.
WEBIST�2014�-�International�Conference�on�Web�Information�Systems�and�Technologies
106

Development Process and Evaluation Methods for Adaptive Hypermedia
Martin Balık and Ivan JelınekDepartment of Computer Science and Engineering, Faculty of Electrical Engineering, Czech Technical University
Karlovo namestı 13, 121 35 Prague, Czech Republicfbalikm1, [email protected]
Keywords: Adaptive Hypermedia, Personalization, Development Process, Software Framework, Evaluation.
Abstract: Adaptive Hypermedia address the fact that each individual user has different preferences and expectations.Hypermedia need adaptive features to provide an improved user experience. This requirement resultsin an increased complexity of the development process and evaluation methodology. In this article,we first discuss development methodologies used for hypermedia development in general and especiallyfor user-adaptive hypermedia development. Second, we discuss evaluation methodologies that constitutea very important part of the development process. Finally, we propose a customized development processsupported by ASF, a special framework designed to build Adaptive Hypermedia Systems.
1 INTRODUCTION
Software development is a complex process, wheremodeling and specification on various levels have be-come a necessity and a standard approach. Web-basedhypermedia systems require a special attention thathas led to evolution of a new line of research – WebEngineering (Deshpande et al., 2002). A number ofdevelopment methodologies have been created to of-fer new techniques, models and notations. Additionalchallenges came with a new category of intelligent,user-adaptive applications.
User-adaptive systems monitor users’ behaviorand keep track of each individual user’s character-istics, preferences, knowledge, aims, etc. Someof the systems focus on providing the user withrelevant items based on the browsing history. Othersystems focus mainly on improving the human-computer interactions. The collection of personaldata used in the adaptation process is associatedwith a specific user. It is called the User Model.While modeling the adaptive system, it is necessaryto separate the non-adaptive and user-specific aspectsof the application.
In our work, we focus on Adaptive HypermediaSystems (AHS). Typical adaptation techniques usedin AHS are categorized as content adaptation, adap-tive presentation, and adaptive navigation (Knutovet al., 2009). The categories overlap, as someof the techniques do not change informationor the possible navigation, but only offer suggestions
to the user by changing the presentation. The de-sign of adaptation techniques needs to be consideredwithin the development process.
User-adaptive systems bring additional complex-ity into the development process and lay higherdemands on system evaluation. This needs to beconsidered through all development phases. In orderto guarantee the required behavior, we have to ensurethat the system works correctly during and after adap-tations (Zhang and Cheng, 2006).
Evaluation of adaptive systems is an importantpart of their development process and should not beunderestimated. Currently, there is not much con-sistency in the evaluation of AHS (Mulwa et al.,2011). It is important to use an appropriate methodfor evaluation (Gena and Weibelzahl, 2007). Evalua-tion should ensure savings in terms of time and cost,completeness of system functionality, minimizing re-quired repair efforts, and improving user satisfaction(Nielsen, 1993). AHSs are interactive, hypermedia-based systems. Usually, similar methods as in human-computer interaction (HCI) field are used. However,user-adaptive systems introduce new challenges.
The remainder of this paper is structured as fol-lows. In Section 2, a current state of the art of de-velopment and evaluation methodologies is beingreviewed. In Section 3, AHS development processis proposed and associated with the use of Adap-tive System Framework. Finally, Section 4 concludesthe paper by summarizing results of the researchand indicates the directions of the future work.
107
2 RELATED WORK
In this section, we will review existing approachesused in AHS development. First, we will focus onthe development methodologies mainly focused ondesign and system architecture. Second, we will re-view evaluation methodologies and problems relatedspecifically with user-adaptive system evaluation.
2.1 AHS Development Methodologies
Similar to development of other software prod-ucts, adaptive-system development needs to be basedon standardized methods. For the design of hy-permedia applications, several methods have beendeveloped. In the early period of hypermediasystems, hypermedia-specific design methodologieswere proposed, for example, Hypermedia DesignMethod (HDM) (Garzotto et al., 1993), Relation-ship Management Methodology (RMM) (Isakowitzet al., 1995), Enhanced Object-Relationship Model(EORM) (Lange, 1994) and Web Site Design Method(WSDM) (De Troyer and Leune, 1998). An Overviewof additional and more recent development method-ologies for software and Web engineering can befound in (Aragon et al., 2013; Thakare, 2012). How-ever, the methodologies developed for hypermediasystems in general do not take into account the adap-tivity and user modeling. Therefore, an extendedadaptation-aware methodology is needed to improvethe AHS development process.
Fig. 1 shows the typical phases of a software-development process. To abstract complex problemsof the system design, models are used. The modelshelp to create and validate the software architecture.
Figure 1: Typical phases of a software devel. process.
Model-Driven Architecture (MDA) (Miller andMukerji, 2003) was proposed by the Object Manage-ment Group (OMG) in 2001. This architecture de-fines four model levels. Computation-IndependentModel (CIM) describes behavior of the system in alanguage appropriate for users and business analysts.This level includes models of requirements and busi-ness models. Platform-Independent Model (PIM) isstill independent of a specific computer technology,yet unlike the CIM it includes information essentialfor solving the assignment using information tech-nologies. The PIM is usually created by computeranalyst. The benefit of this level is the reusability forvarious implementations and platform independency.
Platform-Specific Model (PSM) combines the PIMwith a particular technology-dependent solution. Thismodel can include objects tightly related to a specificprogramming language environment, e.g., construc-tors, attribute accessors, or references to classes in-cluded in the development platform packages. Themodel is an abstraction of source code structure and isused as a base for implementation. Code is the high-est level of MDA and includes the implementation ofthe system.
Adaptive systems usually access large informa-tion base of domain objects, and their behavior isbased on information stored in the user model. Suchsystems are quite complex and therefore, develop-ment methodology oriented on adaptive hypermediais needed.
Object-oriented approach in designing adaptivehypermedia systems seems to be the most appropri-ate. Object oriented design is best suited for systemsundergoing complex transitions over time (Papasa-louros and Retalis, 2002). For object-oriented soft-ware systems modeling, we have a standard, widely-adopted, formally defined language – UML (Boochet al., 1999). To be able to express a variety of systemmodels, UML provides extension mechanisms in def-inition of the model elements, description of the nota-tion and expressing semantic of models. These exten-sions are stereotypes, tagged values and constraints.UML stereotypes are the most important extensionmechanism.
There are some projects that utilize UML mod-eling in the area of adaptive systems. The MunichReference Model (Koch and Wirsing, 2001) is an ex-tension of the Dexter model. It was proposed in thesame period as the well-known Adaptive Hyperme-dia Application Model (AHAM) (De Bra et al., 1999)and in a similar way adds a user model and an adapta-tion model. The main difference between The MunichReference Model and AHAM is that AHAM speci-fies an adaptation rule language, while The MunichReference Model uses object-oriented specification.It is described with the Unified Modeling Language(UML) which provides the notation and the object-oriented modeling techniques.
Object-Oriented Hypermedia Design Method(OOHDM) (Rossi and Schwabe, 2008) is basedon both HDM and the object-oriented paradigm.It allows the designer to specify a Web applicationby using several specialized meta-models. OOHDMproposed dividing hypermedia design into threemodels – a conceptual model, a navigational modeland an abstract interface model. When used to de-sign a user-adaptive application, most of the personal-ization aspects are captured in the conceptual model.
WEBIST�2014�-�International�Conference�on�Web�Information�Systems�and�Technologies
108

As an example, we can mention a class model of theuser and user group models (Barna et al., 2004).
Another method to specify design of complexWeb sites is WebML (Ceri et al., 2000). For the phaseof conceptual modeling, WebML does not define itsown notation and proposes the use of standard mod-eling techniques based on UML. In the next phase,the hypertext model is defined. This model definesthe Web site by means of two sub-models – compo-sition model and navigation model. Development ofthe presentation model defining the appearance of theWeb site is the next step. Part of the data model isthe personalization sub-schema. The content manage-ment model specifies how is the information updateddynamically based on user’s actions. Finally, the pre-sentation model specifies how the system has to beadapted to each user’s role (Aragon et al., 2013).
For the purpose of interoperability, storage modelscan be represented by a domain ontology. Therefore,there is a need to represent ontology-based models ina standardized way. Researchers already identifiedthis issue and proposed UML profile for OWL andfeasible mappings, which support the transformationbetween OWL ontologies and UML models and viceversa (Brockmans et al., 2006). This is achieved bythe UML stereotypes. Table 1 provides the mappingsfor the most important constructs.
Table 1: UML and OWL mappings (Brockmans, 2006).UML Feature OWL Feature Commentclass, type classinstance individualownedAttribute, property,binary association inverseOfsubclass, subclass,generalization, subproperty,N-ary association, class, Requiresassociation class property decompositionenumeration oneOfdisjoint, cover disjointWith, unionOfmultiplicity minCardinality, OWL cardinality
maxCardinality, restrictionsFunctionalProperty, declaredInverseFunctionalProperty only for range
package ontology
Special attention should be also devoted to thedevelopment of the content of the adaptive systems.As it was observed many times – authoring of adap-tive systems is a difficult task (Cristea, 2003). Theadaptive-system development process can be dividedinto four phases: Conceptual Phase, PresentationPhase, Navigation Phase and Learning Phase (Med-ina et al., 2003).
During the conceptual phase, the author createsbasic page elements, in the presentation phase thestructure of page elements is defined, in the naviga-tion phase the navigational map is created and in thelearning phase, adaptive behavior is defined.
2.2 AHS Evaluation Methodologies
Recent research has identified the importance of user-adaptive systems evaluation. Reviews on the topichave been published by several researchers (Gena,2005; Velsen et al., 2008; Mulwa et al., 2011; Albertand Steiner, 2011). Due to the complexity of adaptivesystems, the evaluation is difficult. The main chal-lenge lies in evaluating particularly the adaptive be-havior. Evaluation of adaptive systems is a very im-portant part of the development process. Moreover, itis necessary, that correct methods and evaluation met-rics are used.
Usability is evaluated by the quality of interac-tion between a system and a user. The unit of mea-surement is the user’s behavior (satisfaction, comfort)in a specific context of use (Federici, 2010). De-sign of adaptive hypermedia systems might violatestandard usability principles such as user control andconsistency. Evaluation approaches in HCI assumethat the interactive system’s state and behavior areonly affected by direct and explicit action of the user(Paramythis et al., 2010). This, however, is not true inuser-adaptive systems.
Personalization and user-modeling techniques aimto improve the quality of user experience within thesystem. However, at the same time these techniquesmake the systems more complex. By comparing theadaptive and non-adaptive versions, we should deter-mine the added benefits of the adaptive behavior.
General (non-adaptive) interactive systems ac-quire from user the data strictly related to the per-formed task. Adaptive systems, however, requiremuch more information. This information might notbe required for the current task and can be in thecurrent context completely unrelated. This is causedby continuos observation of the user by the sys-tem. Adaptive systems can monitor visited pages,keystrokes or mouse movement. Users can be evenasked superfluous information directly. Within theevaluation process, it is challenging to identify thepurpose and correctness of such a meta-information.
Important difference between evaluation of adap-tive and non-adaptive systems is that evaluation ofadaptive systems cannot consider the system as awhole. At least two layers have to be evaluated sepa-rately (Gena, 2005).
In the next paragraphs, we will summarize themost important methods used to evaluate adaptive hy-permedia systems.
Comparative Evaluation
It is possible to assess the improvements gained byadaptivity by comparing the adaptive system with
Development�Process�and�Evaluation�Methods�for�Adaptive�Hypermedia
109

a non-adaptive variant of the system (Hook, 2000).However, it is not easy to make such comparison. Itwould be necessary, to decompose the adaptive ap-plication into adaptive and non-adaptive components.Usually adaptive features are an integral part of thesystem, and the non-adaptive version could lead tounsystematic and not optimal results. Additionally, itmight not be clear why the adaptive version is better.
In case of adaptive learning, a typical applicationarea of adaptation, it is possible to compare the sys-tem with a different learning technology or with tra-ditional learning methods. However, the evaluation ofadaptation effects can interfere with look and feel ora novelty effect (Albert and Steiner, 2011).
Empirical Evaluation
Empirical evaluation, also known as the controlled ex-periment, appraises theories by observations in exper-iments. This approach can help to discover failuresin interactive systems, that would remain uncoveredotherwise. For software engineering, formal verifi-cation and correctness are important methods. How-ever, empirical evaluation is an important comple-ment that could contribute for improvement signifi-cantly. Empirical evaluation has not been applied forthe user modeling techniques very often (Weibelzahland Weber, 2003). However, in recent studies, the im-portance of this approach is pointed out (Paramythiset al., 2010). This method of evaluation is derivedfrom empirical science and cognitive and experimen-tal psychology (Gena, 2005). In the area of adaptivesystems, the method is usually used for the evaluationof interface adaptations.
Layered Evaluation
For evaluation of adaptive hypermedia systems, usu-ally approaches considering the system “as a whole”and focusing of an “end value” are used. Examples ofthe focused values are user’s performance or users’ssatisfaction. The problem of this approach is, thatevaluating system as a whole requires building thewhole system before evaluation. This way, the evalu-ation is not able to guide authors in the developmentprocess. Another problem is, that the reasons behindunsatisfactory adaptive behavior are not evident.
A solution to the mentioned problems was pro-posed by Brusilovsky in (Brusilovsky and Sampson,2004) as a model-based evaluation approach calledlayered evaluation. In the exemplary case, two lay-ers were defined – user modeling layer and adaptationdecision making layer. User modeling (UM) is theprocess, where information about user is acquired by
monitoring user-computer interaction. Adaptation de-cision making is a phase, where specific adaptationsare selected, based on the results of the UM phase.Both processes are closely interconnected. However,when evaluating the system as a whole, it is not evi-dent, which of the phases has been unsuccessful. Thisis solved by decomposing evaluation into layers andevaluating both phases separately. This has also thebenefit, that results of UM process evaluation can bereused for different decision making modules.
Layered evaluation has gained a high level of at-tention in the adaptive hypermedia research commu-nity. That reaffirms the claim that the evaluation ofadaptive systems implicates some inherent difficul-ties (Mulwa et al., 2011). The original idea is of-ten used by authors to justify experimental designs oftheir evaluation studies.
Process-oriented Evaluation
Evaluation should be considered as an inherent part ofthe development cycle. Continuous evaluation shouldrange from very early phases of the project till theend. Evaluation should start with requirements analy-sis and continue at the prototype level. Evaluation ofinitial implementations is referred as formative evalu-ation. Identifying early issues can greatly reduce de-velopment costs. The quality of the overall systemis evaluated in the final phase of the development cy-cle and is referred a summative evaluation. The focusof current evaluations of adaptive systems is mostlytargeted on the summative evaluation. To ensure thatuser’s needs are sufficiently reflected, formative eval-uation must be more intensively used.
User-centered Evaluation
For adaptive systems, especially user-centered eval-uation approaches are recommended (Velsen et al.,2008).
Following are the typical user-centered evaluationmethods:
� QuestionnairesQuestionnaires collect data from users by answer-ing a fixed set of questions. They can be usedto collect global impressions or to identify prob-lems. Advantage is, that large number of partic-ipants can be accommodated (compared to inter-views).
� InterviewsIn interviews, participants are asked questions byan interviewer. Interviews can identify individ-ual and situational factors and help explain, why asystem will or will not be adopted.
WEBIST�2014�-�International�Conference�on�Web�Information�Systems�and�Technologies
110

� Data Log AnalysisThe log analysis can focus on user behavior or theuser performance. It is strongly advised to use thismethod with a qualitative user-centred evaluation.
� Focus Groups and Group DiscussionsGroups of participants discuss a fixed set of top-ics, and the discussion is led by a moderator. Thismethod is suitable for gathering a large amount ofqualitative data in a short time.
� Think-aloud ProtocolsParticipants are asked to say their thoughts outloud while using the system.
� Expert ReviewsSystem is reviewed by an expert, who gives hisopinion.
3 AHS DEVELOPMENTPROCESS
The development methodologies mentioned in sec-tion 2.1 were developed for non-adaptive hypermediasystems and therefore, the methodologies do not pro-vide sufficient support for the adaptation process. Byadding adaptive features, the design complexity in-creases. Without adequate development support, theapplication can become unmaintainable, or the behav-ior of the application can become inconsistent.
As an example of deficiency, the OOHDMmethodology allows user-role-based personalizationas part of the conceptual model. However, there isno clear separation of the user-adaptive behavior. Al-though the WebML defines an explicit personaliza-tion model for users and user-groups, it is missingmeans for expressing and separating various adapta-tion methods. Other legacy development methodolo-gies do not consider personalization at all.
In a development methodology, two importantcomponents can be identified. One of them is the lan-guage, which can be used by a designer to modelthe different aspects of the system. The other com-ponent is the development process, which acts asthe dynamic, behavioral part. The development pro-cess determines what activities should be carriedout to develop the system, in what order and how.To specify the development process for user-adaptivehypermedia systems, we follow the model-drivenarchitecture (MDA).
Fig. 2 depicts the MDA adopted to user-adaptivehypermedia systems engineering. The principles arevisualized as a stereotyped UML activity diagrambased on the diagram presented in (Koch et al., 2006).The process starts with the Computation-Independent
Model (CIM) that defines requirements models anduser characteristics model. Platform-IndependentModel (PIM) is divided into two segments. User In-dependent Model (UIM) describes the system with-out its adaptation features and is equivalent to thestandard web engineering design methodology. Threemodels, based on the OOHDM, are created – con-ceptual model, navigational model, and abstract in-terface model. The other segment consists of theUser Specific Model (USM). USM consists of threesub-models, that are patterned on adaptation methodcategories (Knutov et al., 2009) – content adaptationmodel, adaptive navigation model, and adaptive pre-sentation model.
The user-specific PIM sub-models are closely re-lated with our theoretical basis of adaptive hyper-media architecture – the Generic Ontology-basedModel for Adaptive Web Environments (GOMAWE).The adaptation function, defined as a transforma-tion between default and adapted hypermedia ele-ments, is the basis for content adaptation. Transfor-mations are defined by Inference Rules. Adaptivenavigation defines transformations within the navi-gational model, and results into the Link-AdaptationAlgorithms in subsequent modeling phases. Adap-tive presentation is modeled as transformations withinthe Adaptive Hypermedia Document Template.For formal definitions of GOMAWE, see (Balık andJelınek, 2013b).
After the models for both the user-independentand user-specific segments are separately defined,they can be transformed and merged together to formthe “big picture” of the system. The next step is trans-forming the PIM into the Platform-Specific model(PSM). As an example, we show Java and .NETmodel, but there are many other possible platforms.From the PSM, a program code can be possibly gen-erated.
While the PIM depends usually in large extent onUML and UML profiles that provide a standard ab-stract model notation, the PSM, on the other hand,should refer to software framework packages usedto simplify the development on a specific platform.In our previous work, we have proposed a softwareframework intended to support the development ofuser-adaptive hypermedia systems. The AdaptiveSystem Framework (ASF) (Balık and Jelınek, 2013a)defines a fundamental adaptive hypermedia systemarchitecture and implements the most common adap-tive system components.
One of the important ASF components is the user-specific data storage. The centralized user modelmanagement is beneficial for the application devel-opment. Using the adaptation manager, the user pro-
Development�Process�and�Evaluation�Methods�for�Adaptive�Hypermedia
111

file and user model properties can be accessed fromany component of the application. Another part ofthe data-storage layer is the rule repository. A rule-repository manager provides an interface for access-ing and evaluating the inference rules. This interfacecan be utilized in the adaptation algorithms, e.g., thecontent adaptation algorithm can use conditional rulesto find an alternative content for a specific user.
The design of the application core based on theASF framework consists of the following importantsteps:1. Definition of the domain objects and their rela-
tions2. Definition of the user profile and user model at-
tributes3. Design of the adaptive algorithms for the desired
behavior4. Configuration of data sources5. Binding the data results either to the application
logic or directly to the adaptive UI componentsAll the steps are supported by the ASF framework.
Based on UML model, the developer implements do-
main objects by using support classes of the frame-work. User data storage needs only data model spec-ification (preferably as an ontology). Adaptive algo-rithms can be reused or extended. And finally, userinterface components can be used to support the pre-sentation.
The implemented user-adaptive application needsto be evaluated, and evaluation should be an integralpart of the development process. Various methodsmentioned in Section 2.2 can be used.
Based on the evaluation methodology proposedin (Lampropoulou et al., 2010), we use a three-phase evaluation as part of the development pro-cess. The first phase is a short empirical study,in the second phase a qualitative and quantitativemeasurement is performed, and finally, the third phaseevaluates subjective comments of test session partici-pants. For the purpose of AHS evaluation, we extendthe second and third phases by the comparison witha non-adaptive system users control group.
Typical adaptive system evaluation is based oncomparison between adaptive and non-adaptive ver-sion of the application. ASF framework is well
Figure 2: MDA structure for user-adaptive hypermedia systems engineering.
WEBIST�2014�-�International�Conference�on�Web�Information�Systems�and�Technologies
112

designed for such a comparative evaluation. Eachadaptation-type algorithm strategy supports the non-adaptive algorithm version. This feature can be usedas an additional user-accessible preference setting, orit can be administered for special purposes, e.g., tosupport the adaptation evaluation session.
To be reasonable, the evaluation needs to be per-formed with a representative group of users. For suchpurposes, adaptive educational applications, wherea large amount of students can participate, is highlyappropriate. Many of the typical aspects of adap-tive applications can be simulated and evaluated bystudents. The tutorials can include theoretical tests,practical assignments, or test questions used to reviewthe knowledge of students.
In our adaptive e-learning prototype, we focusmainly on the user-centered evaluation. In the fistevaluation phase, the students were asked abouttheir preferences regarding the online curriculum.The questions included preference of used adapta-tion techniques. They were also asked if their resultsshould be available to the tutor with all details, ina form of whole class statistics, or completely hid-den. In the second evaluation phase, we used a datalog analysis to observe the behavior of users, progressin knowledge and selected preferences. The sessionwith multiple students is suitable to measure the sys-tem performance, identify possible bottlenecks andcompare the adaptive system with the non-adaptivealternative. The evaluation sessions are usually com-bined with questionnaires, where students answerquestions related to the application content, and theycan provide a feedback about their satisfaction or is-sues they encounter while using the system. This isthe last of the three evaluation phases. Afterwards,all the collected data are analyzed, and the resultsprovide a feedback for system customization and im-provements.
4 CONCLUSION
Design, modeling and evaluation are fundamen-tal steps in the development process of softwareproducts. Web technologies and requirements of per-sonalization add more complexity into the process,and specialized methodologies are needed. In this pa-per, we have given an overview of existing method-ologies and their use in the context of user-adaptivesystems. Further, we have proposed a special method-ology for adaptive hypermedia, based on MDAand OOHDM. The development methodology wasextended to include the aspects of user-adaptive sys-tems. The AHS-specific methodology is important for
improving the development effectiveness and qualityof the resulting product.
In our future work, we aim to use the methodologyin additional prototypes’ development based on ASF.We will apply the framework in different applicationtypes, and we will focus in more detail on adaptivesystems’ recommendation adaptation features. Fur-ther, we want to integrate the learning curriculum ap-plication with other systems and assessments used inthe courses, and we want to utilize the ontology-baseddata maintained by the adaptive systems to exchangethe user models of students.
ACKNOWLEDGEMENTS
The results of our research form a part of the scientificwork of a special research group WEBING.1
REFERENCES
Albert, D. and Steiner, C. M. (2011). Reflections on theEvaluation of Adaptive Learning Technologies. InProceedings of the IEEE International Conference onTechnology for Education (T4E), pages 295–296.
Aragon, G., Escalona, M.-J., Lang, M., and Hilera, J. R.(2013). An Analysis of Model-Driven Web Engineer-ing Methodologies. Int. Journal of Innovative Com-puting, Information and Control, 9(1):413–436.
Balık, M. and Jelınek, I. (2013a). Adaptive System Frame-work: A Way to a Simple Development of AdaptiveHypermedia Systems. In The Fifth International Con-ference on Adaptive and Self-Adaptive Systems andApplications (ADAPTIVE2013), pages 20–25, Valen-cia, Spain. IARIA.
Balık, M. and Jelınek, I. (2013b). Generic Ontology-BasedModel for Adaptive Web Environments: A RevisedFormal Description Explained within the Context ofits Implementation. In Proceedings of the 13th IEEEInternational Conference on Computer and Informa-tion Technology (CIT2013), Sydney, Australia.
Barna, P., Houben, G.-j., and Frasincar, F. (2004). Specifi-cation of Adaptive Behavior Using a General-purposeDesign Methodology for Dynamic Web Applications.In Proceedings of AdaptiveHypermedia and Adap-tive Web-Based Systems (AH 2004), Eindhoven, TheNetherlands.
Booch, G., Rumbaugh, J., and Jacobson, I. (1999). TheUnified Modeling Language User Guide, volume 30of Addison-Wesley object technology series. Addison-Wesley.
Brockmans, S., Colomb, R. M., Haase, P., Kendall, E. F.,Wallace, E. K., Welty, C., and Xie, G. T. (2006).A model driven approach for building OWL DL and
1Webing research group – http://webing.felk.cvut.cz
Development�Process�and�Evaluation�Methods�for�Adaptive�Hypermedia
113

OWL full ontologies. In ISWC’06 Proceedings of the5th international conference on The Semantic Web,pages 187–200. Springer-Verlag.
Brusilovsky, P. and Sampson, D. (2004). Layered evalu-ation of adaptive learning systems. Int. J. Continu-ing Engineering Education and Life-Long Learning,14(4-5):402–421.
Ceri, S., Fraternali, P., Bongio, A., and Milano, P. (2000).Web Modeling Language (WebML): a modeling lan-guage for designing Web sites. Computer Networks:The International Journal of Computer and Telecom-munications Networking, 33(1-6):137–157.
Cristea, A. (2003). Automatic authoring in the LAOS AHSauthoring model. In Hypertext 2003, Workshop onAdaptive Hypermedia and Adaptive Web-Based Sys-tems, Nottingham, UK.
De Bra, P., Houben, G.-J., and Wu, H. (1999). AHAM : ADexter-based Reference Model for Adaptive Hyper-media. In Proceedings of the ACM Conference on Hy-pertext and Hypermedia, pages 147–156. ACM.
De Troyer, O. and Leune, C. (1998). WSDM: a user cen-tered design method for Web sites. In Proceedingsof the Seventh International WWW Conference, vol-ume 30, pages 85–94, Brisbane, Australia. ElsevierScience Publishers B. V.
Deshpande, Y., Murugesan, S., Ginige, A., Hansen, S.,Schwabe, D., Gaedke, M., and White, B. (2002). Webengineering. Journal of Web Engineering, 1(1):3–17.
Federici, S. (2010). Usability evaluation : models, meth-ods, and applications. In International Encyclopediaof Rehabilitation.
Garzotto, F., Schwabe, D., and Paolini, P. (1993). HDM AModel-Based Approach to Hypertext Application De-sign. ACM Trans. on Information Systems, 11(1):1–26.
Gena, C. (2005). Methods and techniques for the evaluationof user-adaptive systems. The Knowledge Engineer-ing Review, 20(01):1.
Gena, C. and Weibelzahl, S. (2007). Usability Engineeringfor the Adaptive Web. In Brusilovsky, P., Kobsa, A.,and Nejdl, W., editors, The adaptive web, pages 720–762. Springer-Verlag, Berlin, Heidelberg.
Hook, K. (2000). Steps to take before intelligent user in-terfaces become real. Interacting with Computers,12(4):409–426.
Isakowitz, T., Stohr, E. A., and Balasubramanian, P. (1995).RMM: a methodology for structured hypermedia de-sign. Communications of the ACM, 38(8):34–44.
Knutov, E., De Bra, P., and Pechenizkiy, M. (2009). AH12 years later: a comprehensive survey of adaptivehypermedia methods and techniques. New Review ofHypermedia and Multimedia, 15(1):5–38.
Koch, N. and Wirsing, M. (2001). Software Engineeringfor Adaptive Hypermedia Applications? In 8th In-ternational Conference on User Modeling, pages 1–6,Sonthofen, Germany.
Koch, N., Zhang, G., and Escalona, M. J. (2006). ModelTransformations from Requirements to Web SystemDesign. In Proc. Sixth Int’l Conf. Web Eng., pages281–288.
Lampropoulou, P. S., Lampropoulos, A. S., and Tsihrintzis,G. A. (2010). A Framework for Evaluation of Mid-dleware Systems of Mobile Multimedia Services. InThe 2010 IEEE International Conference on Systems,Man, and Cybernetics (SMC2010), pages 1041–1045,Istanbul, Turkey.
Lange, D. (1994). An Object-Oriented Design Method forHypermedia Information Systems. In Proceedings ofthe 27th - Hawaii International Conference on SystemSciences, volume 6, pages 336–375, Hawaii. IEEEComputer Society Press.
Medina, N., Molina, F., and Garcıa, L. (2003). PersonalizedGuided Routes in an Adaptive Evolutionary Hyperme-dia System. In Lecture Notes in Computer Science2809, pages 196–207.
Miller, J. and Mukerji, J. (2003). MDA Guide Version 1.0.[Accessed: August 24, 2013]. [Online]. Available:http://www.omg.org/mda/mda files/MDA Guide Version1-0.pdf.
Mulwa, C., Lawless, S., Sharp, M., and Wade, V. (2011).The evaluation of adaptive and personalised informa-tion retrieval systems: a review. International Journalof Knowledge and Web Intelligence, 2(2-3):138–156.
Nielsen, J. (1993). Usability Engineering. Academic Press,Boston, MA.
Papasalouros, A. and Retalis, S. (2002). Ob-AHEM: AUML-enabled model for Adaptive Educational Hy-permedia Applications. Interactive educational Mul-timedia, 4(4):76–88.
Paramythis, A., Weibelzahl, S., and Masthoff, J. (2010).Layered evaluation of interactive adaptive systems:framework and formative methods. User Modelingand User-Adapted Interaction, 20(5):383–453.
Rossi, G. and Schwabe, D. (2008). Modeling and imple-menting web applications with OOHDM. In Rossi,G., Pastor, O., Schwabe, D., and Olsina, L., editors,Web Engineering, chapter 6, pages 109–155. Springer.
Thakare, B. (2012). Deriving Best Practices from Develop-ment Methodology Base (Part 2). International Jour-nal of Engineering Research & Technology, 1(6):1–8.
Velsen, L. V., van der Geest, T., Klaasen, R., and Stee-houder, M. (2008). User-centered evaluation of adap-tive and adaptable systems: a literature review. TheKnowledge Engineering Review, 23(3):261–281.
Weibelzahl, S. and Weber, G. (2003). Evaluating the infer-ence mechanism of adaptive learning systems. In UserModeling 2003, pages 154–162. Springer-Verlag.
Zhang, J. and Cheng, B. H. C. (2006). Model-based devel-opment of dynamically adaptive software. In Proceed-ing of the 28th international conference on Softwareengineering - ICSE ’06, number 1, pages 371–380,New York, New York, USA. ACM Press.
WEBIST�2014�-�International�Conference�on�Web�Information�Systems�and�Technologies
114

CAPTCHA and Accessibility Is This the Best We Can Do?
Lourdes Moreno, María González and Paloma Martínez Computer science department, Universidad Carlos III de Madrid, Av. Universidad, 30, Leganes, Spain
{lmoreno, mgonza1, pml}@inf.uc3m.es
Keywords: Web Accessibility, CAPTCHA.
Abstract: Web access is affected by a great amount of accessibility issues that do not allow some users to access all information presented. Therefore, Web accessibility is an important issue because everybody should access Web content independently of their access features. Among these accessibility issues, a Web content element that interferes with Web accessibility is a CAPTCHA. A CAPTCHA is a challenge-response test used to determine whether or not the user is a human instead of a computer or a robot. This type of element causes accessibility barriers especially to users with disabilities. This paper presents an overview about Web accessibility and CAPTCHA. Besides, an analysis of the accessibility barriers and a solution proposal depending on the type of disability is provided. Moreover, a survey of CAPTCHA approaches is introduced and its results are shown. With the knowledge gathered, a data discussion is provided. The lesson learned is that the CAPTCHA objective must be that security checks should be responsibility of websites or servers, that is, they cannot be delegated to the user.
1 INTRODUCTION
The Web sites security directive uses Completely Automated Public Turing test to tell Computers and Humans Apart (CAPTCHA) in order to avoid input that has been generated by a computer or a bot, and authenticate that whoever is accessing is a human user. There is a trend to use this content element on many websites and sometimes it provokes accessibility barriers that avoid Web content access to people with disabilities. Besides, a lot of CAPTCHA techniques have emerged that cheat through software allowing computers or robots to access the content and that include more accessibility barriers. Users with disabilities need assistive technology to access to the Web, and CAPTCHA techniques. CAPTCHA techniques must take account it to provide a supported access to this technology. In order to deal with these accessibility barriers, most users have to be helped by other people. This fact has caused that some people protest against it as in the case of Australia (Hawkins, 2013) to ask for the elimination of Web CAPTCHA and the use of other ways of security such as SMS or mails. On the other hand, it is also important to highlight that security should be included by the server avoiding that users have to be concerned
about it. The motivation of this paper is to carry out a
study concerning accessible CAPTCHA taking into account the access features of the users with disabilities. After analysing all this information, accessibility barriers to perceive, to solve, to access (answer -typing, to pointing, ..- and submit) of the CAPCHA for several user profiles of people with disabilities have been distinguished and proposed solutions are provide in each user profile.
The remainder of the paper is organised as follows: Section 2 covers the background of accessibility and some CAPTCHA issues. Section 4 introducs an analysis of accessibility barriers and a solution proposal. In section 5, a survey of several CAPTCHA approaches are shown. Finally, discussion of the data and lessons learned are presented in Section 7.
2 BACKGROUND
A large increase of CAPTCHA on the Web is observed. The growth of CAPTCHA is due to it is a security mechanism which can be introduced easily.. But it has not been properly carried. The accessibility has not been in mind when this element
115

has been integrated on the Web.
2.1 Web accessibility & CAPTCHA
It is essential to achieve an accessible Web in order to provide equal access and equal opportunity to people with diverse abilities. Therefore, an accessible CAPTCHA should be a mechanism that avoids the access of robots but not the access of a human user independently of his language, knowledge or whether the user has any kind of disability that hinders his interaction with Web content.
Currently, the use of CAPTCHA causes a great number of accessibility barriers. In order to avoid these barriers, designers have to know what the main standards and regulations have to follow in order to design an accessible CAPTCHA. Every website has to be designed according to accessibility standards that allow users to access Web content independently whether or not they have a disability.
Regarding accessibility standards is important to highlight the World Wide Web Consortium (W3C) with its Web Accessibility Initiative (WAI) (W3C, 2012). WAI includes various works such as User Agent Accessibility Guidelines (UAAG), Authoring Tool Accessibility Guidelines (ATAG) and the most important standard, the Web Content Accessibility Guidelines (WCAG) (W3C, 2008),
WCAG 2.0 is the set of accessibility guidelines most referenced in the world and since 2012 is a standard ISO/IEC 40500:2012, Information technology - W3C Web Content Accessibility Guidelines (WCAG) 2.0). Following this standard, there are several initiatives in different countries related to Web accessibility such as: Section 508, BITV 2.0, RGAA, AODA among others. These initiatives are similar to WCAG 2.0, being in some case a copy of it.
Following the WCAG 2.0, the Success Criterion 1.1.1 indicates that Non-text content explicitly excludes the requirement to supply a text alternative to a CAPTCHA image for this very reason. But that doesn't let the developer off the hook, because it required that: …text alternatives that identify and describe the purpose of the non-text content are provided, and alternative forms of CAPTCHA using output modes for different types of sensory perception are provided to accommodate different disabilities (W3C, 2008).
The difficulty in making a CAPTCHA image accessible is that providing a text alternative of the image, as required for screen reader users to understand the content, also supplies the answer to
the bot. Besides, designers should take into account some techniques such as: Technique G143 (Providing a alternative text
that describes the purpose of the CAPTCHA): the purpose of the technique is to provide information via the alternative text that identifies the non-text content as a CAPTCHA.
Technique G144 (Ensuring that the Web Page contains another CAPTCHA serving the same purpose using a different modality): the purpose of the technique is to reduce occasions in which a user with a disability cannot complete a CAPTCHA task.
Others international standards found related to accessibility are: the ISO 9241-151, Ergonomics of human-system interaction - Guidance on World Wide Web user interface, the ISO 9241-171, Ergonomics of human-system interaction - Guidance on software accessibility that provide guidance on software accessibility and the ISO/IEC TR 29138-1, Information technology - Accessibility considerations for people with disabilities - User needs summary.
2.2 Disabilities
A great amount of web applications and websites present accessibility problems and they are not adapted to people taking into account their type of disability. The main types of disabilities are: Visual disability (blindness, low vision and color-blindness), Auditory disability (deaf and hearing loss), Motor disability (muscular dystrophy, multiple sclerosis, etc.) and Cognitive disability (WebAIM, 1999).
Besides this type of disability, it is important to take into consideration the degrees of a disability. For example, there are four degrees of hearing loss, mild, moderate, severe and profound.
On the other hand, a user can have more than one disability or multiple disabilities. For example, many people develop age-related impairments. These combinations of disabilities cause users have to face more accessibility barriers.
People with disabilities sometimes use other technology (software and hardware), called Assistive Technology (AT), to interact with the Web. There are types of AT that allow users to access web content. For example, for visual disability, screen readers, adapted keyboard, screen magnifiers and braille embossers can be highlighted.
The review carried out in this paper may be helpful to designers so that they can keep in mind several aspects regarding type of disabilities that
WEBIST�2014�-�International�Conference�on�Web�Information�Systems�and�Technologies
116
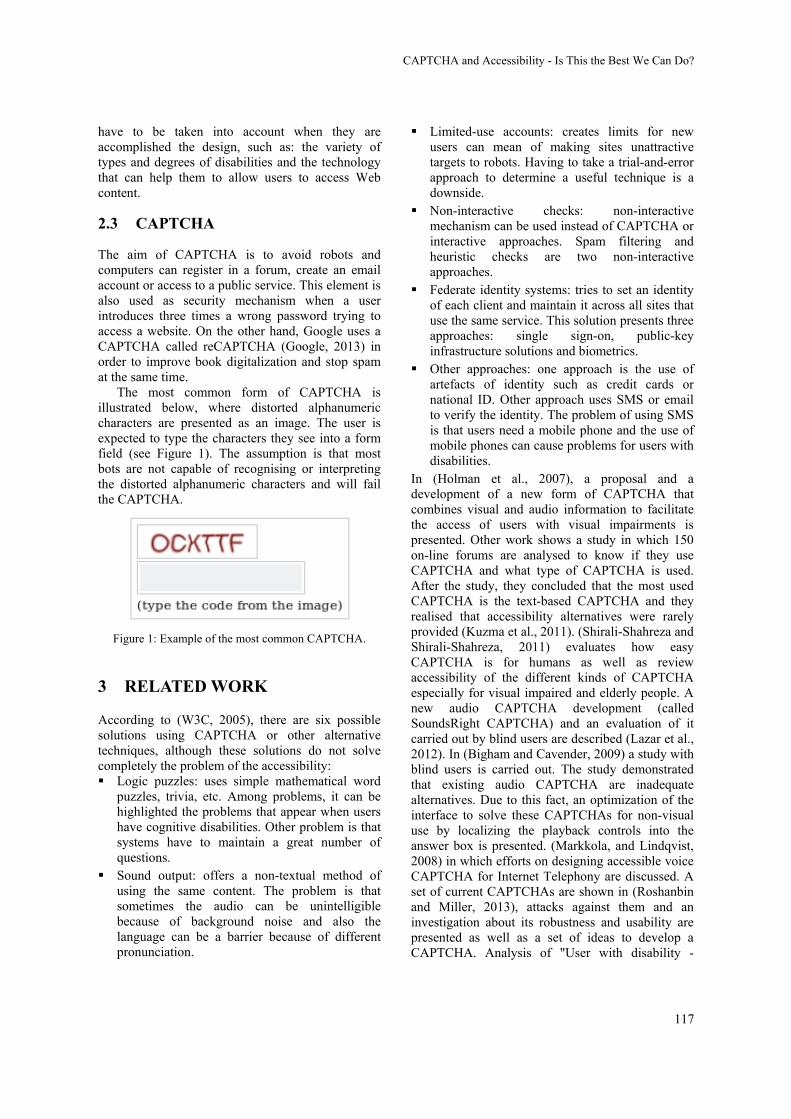
have to be taken into account when they are accomplished the design, such as: the variety of types and degrees of disabilities and the technology that can help them to allow users to access Web content.
2.3 CAPTCHA
The aim of CAPTCHA is to avoid robots and computers can register in a forum, create an email account or access to a public service. This element is also used as security mechanism when a user introduces three times a wrong password trying to access a website. On the other hand, Google uses a CAPTCHA called reCAPTCHA (Google, 2013) in order to improve book digitalization and stop spam at the same time.
The most common form of CAPTCHA is illustrated below, where distorted alphanumeric characters are presented as an image. The user is expected to type the characters they see into a form field (see Figure 1). The assumption is that most bots are not capable of recognising or interpreting the distorted alphanumeric characters and will fail the CAPTCHA.
Figure 1: Example of the most common CAPTCHA.
3 RELATED WORK
According to (W3C, 2005), there are six possible solutions using CAPTCHA or other alternative techniques, although these solutions do not solve completely the problem of the accessibility: Logic puzzles: uses simple mathematical word
puzzles, trivia, etc. Among problems, it can be highlighted the problems that appear when users have cognitive disabilities. Other problem is that systems have to maintain a great number of questions.
Sound output: offers a non-textual method of using the same content. The problem is that sometimes the audio can be unintelligible because of background noise and also the language can be a barrier because of different pronunciation.
Limited-use accounts: creates limits for new users can mean of making sites unattractive targets to robots. Having to take a trial-and-error approach to determine a useful technique is a downside.
Non-interactive checks: non-interactive mechanism can be used instead of CAPTCHA or interactive approaches. Spam filtering and heuristic checks are two non-interactive approaches.
Federate identity systems: tries to set an identity of each client and maintain it across all sites that use the same service. This solution presents three approaches: single sign-on, public-key infrastructure solutions and biometrics.
Other approaches: one approach is the use of artefacts of identity such as credit cards or national ID. Other approach uses SMS or email to verify the identity. The problem of using SMS is that users need a mobile phone and the use of mobile phones can cause problems for users with disabilities.
In (Holman et al., 2007), a proposal and a development of a new form of CAPTCHA that combines visual and audio information to facilitate the access of users with visual impairments is presented. Other work shows a study in which 150 on-line forums are analysed to know if they use CAPTCHA and what type of CAPTCHA is used. After the study, they concluded that the most used CAPTCHA is the text-based CAPTCHA and they realised that accessibility alternatives were rarely provided (Kuzma et al., 2011). (Shirali-Shahreza and Shirali-Shahreza, 2011) evaluates how easy CAPTCHA is for humans as well as review accessibility of the different kinds of CAPTCHA especially for visual impaired and elderly people. A new audio CAPTCHA development (called SoundsRight CAPTCHA) and an evaluation of it carried out by blind users are described (Lazar et al., 2012). In (Bigham and Cavender, 2009) a study with blind users is carried out. The study demonstrated that existing audio CAPTCHA are inadequate alternatives. Due to this fact, an optimization of the interface to solve these CAPTCHAs for non-visual use by localizing the playback controls into the answer box is presented. (Markkola, and Lindqvist, 2008) in which efforts on designing accessible voice CAPTCHA for Internet Telephony are discussed. A set of current CAPTCHAs are shown in (Roshanbin and Miller, 2013), attacks against them and an investigation about its robustness and usability are presented as well as a set of ideas to develop a CAPTCHA. Analysis of "User with disability -
CAPTCHA�and�Accessibility�-�Is�This�the�Best�We�Can�Do?
117

CAPTCHA - Interaction". In order to make a thorough study of the barriers
that people with disabilities face when interacting with CAPTCHA, an analysis using the Scenario Method has been carried out in this work (Carroll, 1994). Scenarios are useful to get used to problems and solutions that users have to face up.
Table 1 shows a summary of the defined scenarios taking into account the different kinds of disabilities, combinations between them, their access needs and the types of barriers in the interaction with the CAPTCHA (perceive, solve and access (answer
and submit)). Besides, as a conclusion of the analysis of each scenario, proposed solutions based on standards and expert heuristics are presented. In this analysis has been considered the CAPTCHA most common, i.e., with distorted text which is presented as an image (see Figure 1).
In order to illustrate the scenarios, one of them, the scenario regarding visual disability is going to be explained. As far as visual disability is concerned, it is defined a scenario where a blind or low vision user needs AT (such as screen readers) to access information provided by a CAPTCHA. As a
Table 1: Scenarios defined according to types of disability.
Type of disability
Acc. Barriers [Perceive, Solve, Access (Answer/
Submit) ]
How to access CAPTCHA? Proposed Solution
Visual disability
X X (*) User may need AT such as magnifier or
screen reader
Provide the user the perception of the CAPTCHA with auditory modality. In addition, the WCAG 2.0 must be achieved. So, user can access with his/her AT such as
keyboard to ensure that user accesses (Answer / Submit) the form.
Auditory disability
User should not have any problem to perceive, solve and access (answer, submit) the form because it is perceived by
visual modality. In addition, the WCAG 2.0 must be achieved.
Motor disability
X (*) User accesses with keyboard or may
need AT
The WCAG 2.0 must be achieved. So, user can access with his/her AT such as with keyboard to ensure that user
accesses (Answer / Submit) the form.
Cognitive disability
X X (*) User can have difficulties to understand
and solve CAPTCHA
Limiting the degree of difficulty of CAPTCHA to ensure that user solves it. In addition, the WCAG 2.0 must be
achieved. Visual and auditory disability
X X (*) User may need AT such as Braille
Displays
The WCAG 2.0 must be achieved. So, the user can use his/her AT that allows him/her to perceive and access
(answer and submit) the form.
Visual and motor
disability X X (*)
User may need AT such as screen reader, magnifier, only keyboard and
other AT
Provide the user the perception of the CAPTCHA with auditory modality. In addition, the WCAG 2.0 must be
achieved. So, user can access with his/her AT to ensure that user accesses (Answer / Submit) the form.
Visual and cognitive disability
X X X (*)
User may need to use AT such as screen reader, magnifier and he can have difficulties to understand and
solve CAPTCHA
Provide the user the perception of the CAPTCHA with auditory modality. Besides, the difficulty of how to solve
the CAPTCHA should be restricted to ensure that user can solve it. In addition, the WCAG 2.0 must be achieved. So,
user can access with his/her AT to ensure that he/she accesses (Answer / Submit) the form.
Auditory and motor
disability X (*)
User accesses with keyboard or may need AT
User should not have any problem to perceive and solve the CAPTCHA because it is perceived by visual modality. But,
it is necessary that WCAG 2.0 is complied to ensure the access. So, user can access with his/her AT such as
keyboard to ensure that user accesses (Answer / Submit) the form.
Auditory and cognitive disability
X X (*) User can have difficulties to understand
and solve CAPTCHA
User should not have any problem to perceive and solve the CAPTCHA because it is perceived by visual modality. But, it is necessary limit the degree of difficulty of CAPTCHA to
ensure that user can solve it. In addition, the WCAG 2.0 must be achieved.
Motor and cognitive disability
X X (*)
User accesses with keyboard or may need AT and he/she can have
difficulties to understand and solve CAPTCHA
The difficulty of how to solve the CAPTCHA should be restricted to ensure that user solves it. The WCAG 2.0 must
be achieved. So, user can access his/her AT such as with keyboard to ensure that user accesses (Answer / Submit) the
form.
(*) If web content does not fulfil the WCAG 2.0.
WEBIST�2014�-�International�Conference�on�Web�Information�Systems�and�Technologies
118
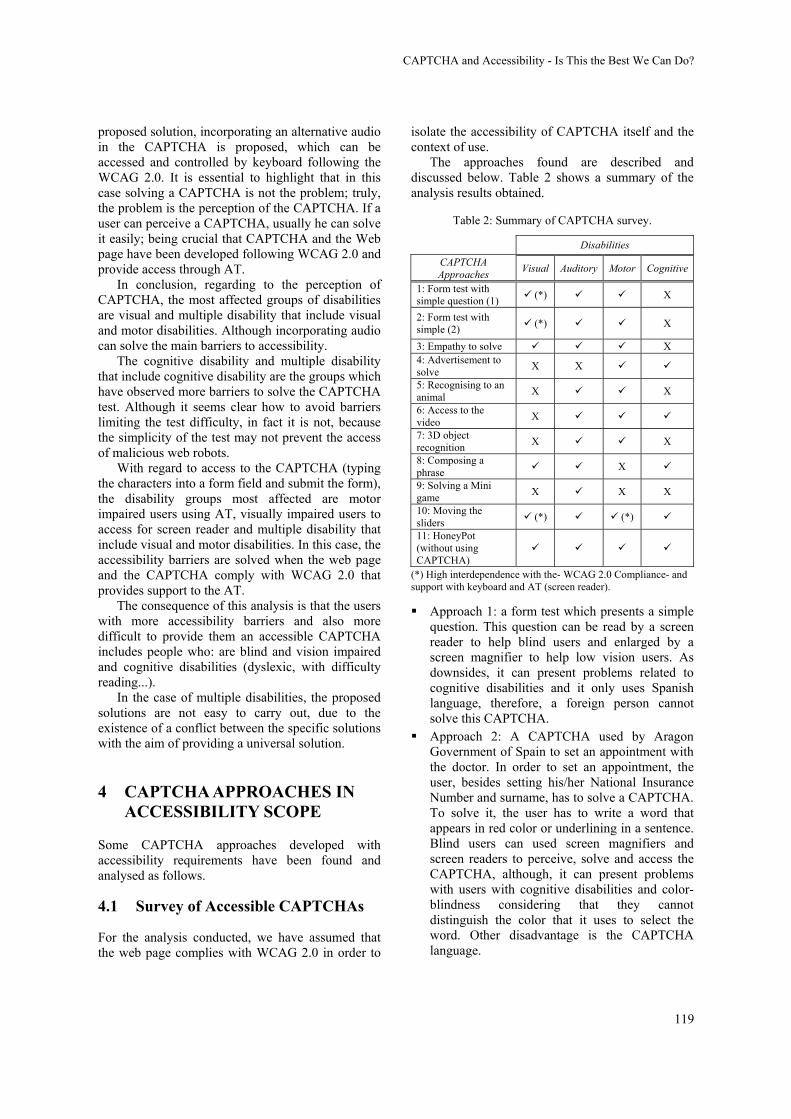
proposed solution, incorporating an alternative audio in the CAPTCHA is proposed, which can be accessed and controlled by keyboard following the WCAG 2.0. It is essential to highlight that in this case solving a CAPTCHA is not the problem; truly, the problem is the perception of the CAPTCHA. If a user can perceive a CAPTCHA, usually he can solve it easily; being crucial that CAPTCHA and the Web page have been developed following WCAG 2.0 and provide access through AT.
In conclusion, regarding to the perception of CAPTCHA, the most affected groups of disabilities are visual and multiple disability that include visual and motor disabilities. Although incorporating audio can solve the main barriers to accessibility.
The cognitive disability and multiple disability that include cognitive disability are the groups which have observed more barriers to solve the CAPTCHA test. Although it seems clear how to avoid barriers limiting the test difficulty, in fact it is not, because the simplicity of the test may not prevent the access of malicious web robots.
With regard to access to the CAPTCHA (typing the characters into a form field and submit the form), the disability groups most affected are motor impaired users using AT, visually impaired users to access for screen reader and multiple disability that include visual and motor disabilities. In this case, the accessibility barriers are solved when the web page and the CAPTCHA comply with WCAG 2.0 that provides support to the AT.
The consequence of this analysis is that the users with more accessibility barriers and also more difficult to provide them an accessible CAPTCHA includes people who: are blind and vision impaired and cognitive disabilities (dyslexic, with difficulty reading...).
In the case of multiple disabilities, the proposed solutions are not easy to carry out, due to the existence of a conflict between the specific solutions with the aim of providing a universal solution.
4 CAPTCHA APPROACHES IN ACCESSIBILITY SCOPE
Some CAPTCHA approaches developed with accessibility requirements have been found and analysed as follows.
4.1 Survey of Accessible CAPTCHAs
For the analysis conducted, we have assumed that the web page complies with WCAG 2.0 in order to
isolate the accessibility of CAPTCHA itself and the context of use.
The approaches found are described and discussed below. Table 2 shows a summary of the analysis results obtained.
Table 2: Summary of CAPTCHA survey.
Disabilities
CAPTCHA Approaches
Visual Auditory Motor Cognitive
1: Form test with simple question (1)
(*) X
2: Form test with simple (2)
(*) X
3: Empathy to solve X 4: Advertisement to solve
X X
5: Recognising to an animal
X X
6: Access to the video
X
7: 3D object recognition
X X
8: Composing a phrase
X
9: Solving a Mini game
X X X
10: Moving the sliders
(*) (*)
11: HoneyPot (without using CAPTCHA)
(*) High interdependence with the- WCAG 2.0 Compliance- and support with keyboard and AT (screen reader).
Approach 1: a form test which presents a simple question. This question can be read by a screen reader to help blind users and enlarged by a screen magnifier to help low vision users. As downsides, it can present problems related to cognitive disabilities and it only uses Spanish language, therefore, a foreign person cannot solve this CAPTCHA.
Approach 2: A CAPTCHA used by Aragon Government of Spain to set an appointment with the doctor. In order to set an appointment, the user, besides setting his/her National Insurance Number and surname, has to solve a CAPTCHA. To solve it, the user has to write a word that appears in red color or underlining in a sentence. Blind users can used screen magnifiers and screen readers to perceive, solve and access the CAPTCHA, although, it can present problems with users with cognitive disabilities and color-blindness considering that they cannot distinguish the color that it uses to select the word. Other disadvantage is the CAPTCHA language.
CAPTCHA�and�Accessibility�-�Is�This�the�Best�We�Can�Do?
119
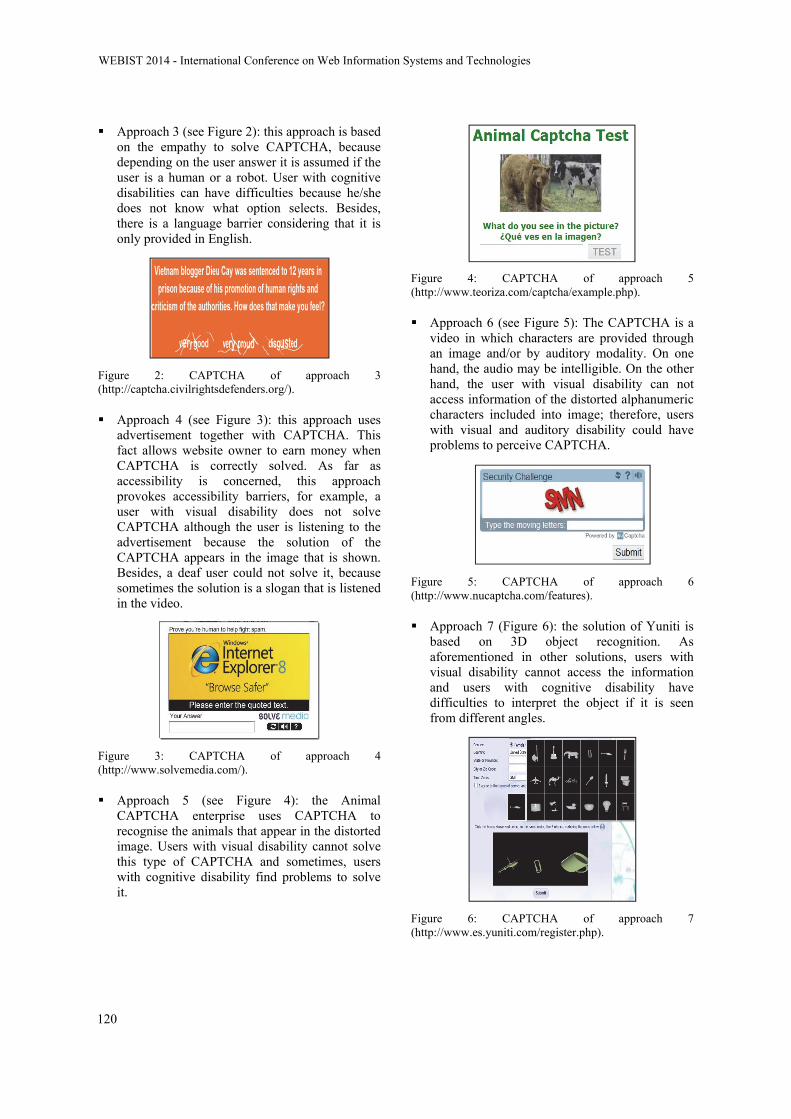
Approach 3 (see Figure 2): this approach is based on the empathy to solve CAPTCHA, because depending on the user answer it is assumed if the user is a human or a robot. User with cognitive disabilities can have difficulties because he/she does not know what option selects. Besides, there is a language barrier considering that it is only provided in English.
Figure 2: CAPTCHA of approach 3 (http://captcha.civilrightsdefenders.org/).
Approach 4 (see Figure 3): this approach uses advertisement together with CAPTCHA. This fact allows website owner to earn money when CAPTCHA is correctly solved. As far as accessibility is concerned, this approach provokes accessibility barriers, for example, a user with visual disability does not solve CAPTCHA although the user is listening to the advertisement because the solution of the CAPTCHA appears in the image that is shown. Besides, a deaf user could not solve it, because sometimes the solution is a slogan that is listened in the video.
Figure 3: CAPTCHA of approach 4 (http://www.solvemedia.com/).
Approach 5 (see Figure 4): the Animal CAPTCHA enterprise uses CAPTCHA to recognise the animals that appear in the distorted image. Users with visual disability cannot solve this type of CAPTCHA and sometimes, users with cognitive disability find problems to solve it.
Figure 4: CAPTCHA of approach 5 (http://www.teoriza.com/captcha/example.php).
Approach 6 (see Figure 5): The CAPTCHA is a video in which characters are provided through an image and/or by auditory modality. On one hand, the audio may be intelligible. On the other hand, the user with visual disability can not access information of the distorted alphanumeric characters included into image; therefore, users with visual and auditory disability could have problems to perceive CAPTCHA.
Figure 5: CAPTCHA of approach 6 (http://www.nucaptcha.com/features).
Approach 7 (Figure 6): the solution of Yuniti is based on 3D object recognition. As aforementioned in other solutions, users with visual disability cannot access the information and users with cognitive disability have difficulties to interpret the object if it is seen from different angles.
Figure 6: CAPTCHA of approach 7 (http://www.es.yuniti.com/register.php).
WEBIST�2014�-�International�Conference�on�Web�Information�Systems�and�Technologies
120

Approach 8 (see Figure 7): this CAPTCHA shows a table with several columns which are composed of words. In order to solve CAPTCHA, user has to set a phrase selecting a word of each column. Among drawbacks, it can be highlighted the language of the CAPTCHA, in this case English, and problems for users with motor disabilities if words are so close complicating their selection via keyboard.
Figure 7: CAPTCHA of approach 8 (http://www.businessinfo.co.uk/labs/HeyesCaptcha3/heyes_captcha_test.php).
Approach 9 (see Figure 8): instead of using a CAPTCHA, it is used a mini game. This CAPTCHA provokes accessibility barriers for users with visual disability, users with cognitive disability because they are not able to understand the game and users with motor disability. Although, this type of CAPTCHA provides audio, this audio can be incomprehensible. Other drawback is the language; currently it is only available in English.
Figure 8: CAPTCHA of approach 9 (http://areyouahuman.com/).
Approach 10 (see Figure 9): it tries to move a slider from left to the right. It causes problems for blind users if the web content is not accessible by keyboard and screen reader and users with motor disabilities with dexterity problems. A blind user would need that his/her assistive technology allows user to know the position of CAPTCHA and to where move it.
Figure 9: CAPTCHA of approach 10 (http://theymakeapps.com/users/add).
Others solutions (Approach 11) which can solve the problem of CAPTCHAs are to avoid the use of them. It is considered that server should face up spam instead of user. An example is the project HoneyPot (HoneyPot, 2004). This proposal is based on that robot only interprets HTML code of web page, but they do not pay attention to CSS code, considering that, a field that user do not see could be hidden and, therefore, it could stay empty when the form is filled in. On the other hand, the robot could see the field and fill in it. In this way, a robot could be discovered. This idea avoids user to have to solve challenges that many times provoke accessibility barriers.
4.2 Discussion
The conclusion obtained is that users with cognitive disabilities are the users who have more difficulties followed by blind users. The reason of this conclusion is due to the main problem of users with cognitive disability: they do not have a good perception of the CAPTCHA. On the other hand, blind users also have problems because most CAPTCHAs are perceived through a visual canal.
Despite that the CAPTCHAs try to be accessible for people with disabilities, they do not achieve this goal completely, considering that if they provide a good solution, this solution could be easy to tackle by the robots and computers. Therefore, after the review carried out in this section, we consider the best solution is to avoid accessibility barriers by using other system to control spam instead of using CAPTCHA.
5 LEARNED LESSONS AND CONCLUSIONS
The use of CAPTCHA on the Web provokes several accessibility problems, especially for people with disabilities. This fact has motivated this work.
CAPTCHA�and�Accessibility�-�Is�This�the�Best�We�Can�Do?
121

This paper introduces a research work which includes: a study of Web accessibility and CAPTCHA, a study of the kinds of disabilities and their accessibility barriers. According to findings of this study, the disability groups most affected by the accessibility barriers when they interact with Web content CAPTCHA are the users with cognitive and visual impairments, or multiple disability that include them. Besides, a survey and analysis of current CAPTCHA approaches in scope accessibility has been shown.
Considering that not all users can perceive, solve and access (answer y submit) the CAPTCHA, the challenge would be to design a CAPTCHA such that several alternatives to perceive the CAPTCHA and several methods to communicate the answer will be provided to the user following WCAG 2.0 techniques. In order to provide a solution proposal, as alternatives to perceive the CAPTCHA, there are two possible solutions: visual CAPTCHA and auditory CAPTCHA. But this proposal should take into account cognitive barriers.
To conclude, it is possible to design proposals CAPTCHA that can present a high level of accessibility, but unfortunately accessibility barriers continue to occur.
This lack of solutions leads us to ask ourselves whether the server has to be in charge of security without involving the final user or not. It should continue working on security solutions that prevent the use of the CAPTCHA. Some solutions already exist and can be used as using a system to control spam such as Approach 11 or email instead of using a CAPTCHA.
ACKNOWLEDGEMENTS
This work was supported by the Regional Government of Madrid under the Research Network MA2VICMR [S2009/TIC-1542], by the Spanish Ministry of Education under the project MULTIMEDICA [TIN2010-20644-C03-01] and by the European Commission Seventh Framework Programme under the project TrendMiner (EU FP7-ICT 287863).
REFERENCES
Bigham, J., P., Cavender, A. C., 2009, Evaluating existing audio CAPTCHAs and an interface optimized for non-visual use. Proceedings of the SIGCHI Conference on Human Factors in Computing Systems (CHI’09), pp.
1829-1838. Carroll, J. M., 1994, Making use: a design representation.
Magazine Communications of the ACM, Volume 37, Issue 12, pp. 28-35.
Google, 2013, reCAPTCHA, http://www.google.com/ recaptcha/.
Hawkins, W. 2013, http://www.change.org/en-AU/ petitions/it-s-time-to-finally-kill-captcha-2.
Holman, J., Lazar, J., Feng, J. H., D’Arcy, J., 2007, Developing usable CAPTCHAs for blind users. Proceedings of the 9th International ACM SIGACCESS Conference on Computers and Accessibility (Assets ’07), pp. 245-246.
HoneyPot, 2004, Project HoneyPot, https:// www.projecthoneypot.org/.
Kuzma, J., Barnes, S., Oestreicher, K., 2011, CAPTCHA accessibility study of online forums. International Journal of Web Based Communities, Volume 7, Number 3/2011.
Lazar, J., Feng, J., Brooks, T., Melamed, G., Wentz, B., Holman, J., Olalere, A., Ekedebe, N., 2012, The SoundsRight CAPTCHA: an improved approach to audio human interaction proofs for blind users. Proceedings of the SIGCHI Conference on Human Factors in Computing Systems (CHI’12), pp. 2267-2276.
Markkola, A., Lindqvist, J., 2008, Accessible voice CAPTiCHA for Internet Telephony. Proceedings. of the 2008 Symposium on Accessible Privacy and Security.
Roshanbin, N., Miller, J., 2013. A survey and analysis of current CAPTCHA approaches. Journal of Web Engineering, Vol. 12, No. 1&2, pp. 1-40.
Shirali-Shahreza, S., Shirali-Shahreza, M.H., 2011, Accessibility of CAPTCHA methods. Proceedings of the 4th ACM workshop on Security and artificial intelligence (AISec’11), pp. 109-110.
WebAIM, Web Accessibility in Mind, 1999, http://webaim.org/articles/.
W3C, 2005, Inaccessibility of CAPTCHA - Alternatives to Visual Turing Tests on the Web, http://www.w3.org/TR/turingtest/#solutions.
W3C, 2012, Web Accessibility Initiative (WAI), http://www.w3.org/WAI/intro/components.php.
W3C, WAI, 2010c, Web Content Accessibility Guidelines (WCAG), http://www.w3.org/WAI/intro/wcag.php.
W3C, 2008, Web Content Accessibility Guidelines (WCAG) 2.0, http://www.w3.org/TR/WCAG20/.
WEBIST�2014�-�International�Conference�on�Web�Information�Systems�and�Technologies
122

Fuzzy-Ontology-Enrichment-based Framework for Semantic Search
Hajer Baazaoui-Zghal and Henda Ben GhezalaRiadi-GDL Laboratory, ENSI, Manouba University, Tunis, Tunisia
fhajer.baazaouizghal, [email protected]
Keywords: Fuzzy Ontology, Web Search, Query Reformulation.
Abstract: The dominance of information retrieval on the Web makes integrating and designing ontologies for the on-line Information Retrieval Systems (IRS) an attractive research area. In addition to domain ontology, someattempts have been recently made to integrate fuzzy set theory with ontology, to provide a solution to vagueand uncertain information. This paper presents a framework for semantic search based on ontology enrich-ment and fuzziness (FuzzOntoEnrichIR). FuzzOntoEnrichIR main components are: (1) a fuzzy informationretrieval component, (2) an incremental ontology enrichment component and (3) an ontology repository com-ponent. The framework aims on the one hand to capitalize and formulate extraction-ontology rules based ona meta-ontology. On the other hand, it aims to integrate the domain ontology enrichment and the fuzzy ontol-ogy building in the IR process. The framework has been implemented and experimented to demonstrate theeffectiveness and validity of the proposal.
1 INTRODUCTION
Ontologies are defined as an explicit formal specifica-tion of a shared conceptualization. They can be classi-fied as lightweight ontologies gathering concepts andrelations’ hierarchies which can be enriched by classi-cal properties called axiom schemata (algebraic prop-erties and signatures of relations, abstraction of con-cepts, etc.) and heavyweight ontologies which addproperties to the semantics of the conceptual primi-tives and are only expressible in axiom domain form.The axioms schemata describe the classical proper-ties of concepts and relations (subsumption, disjunc-tion of concepts, algebraic properties and cardinalitiesof the relations, etc.). The domain axioms character-ize domain properties expressible only in an axiomform. They specify the formal semantics constrainingthe conceptual primitive interpretation.
Currently, ontologies are playing a fundamentalrole in knowledge management and semantic Web.Building ontology manually is a long and tedioustask. Thus, many approaches have been proposed dur-ing the last decade to make this task easier. Infor-mation Retrieval (IR) deals with models and systemsaiming to facilitate accessibility to sets of documentsand provide to users the corresponding ones to theirneeds, by using queries. Generally, Information Re-trieval System (IRS) integrates techniques allowingselection of relevant information. The first researchon ontologies for the IRS dates back to the late 90s
(McGuinness, 1998), and aims to remedy limits ofthe traditional IRS based on the keywords. This re-search topic presents one of the main actual axes ofthe semantic Web.
In addition to domain ontology, the integrationof the fuzzy logic shows that it presents an interest-ing way to solve uncertain information problems. Infact, fuzzy logic is used in IR to solve the ambigu-ity issues by defining flexible queries or fuzzy indexes(e.g., (Baazaoui-Zghal et al., 2008). A fuzzy ontologycan be considered as an extension of domain ontologyby embedding a set of membership degrees in eachconcept of the domain ontology and adding fuzzy re-lationships among these fuzzy concepts (Zhou et al.,2006).
In this paper, we present a framework for seman-tic search based on fuzzy ontologies. It includes anontology repository (meta-ontology generating a do-main ontology and ontology of domain services), in-cremental approach of domain ontology learning andfuzzy ontology enrichment method. The frameworkhas been implemented to demonstrate the proposal ef-fectiveness and to evaluate it.
The remaining of this paper is organized as fol-lows. Section 2 presents related works to informationretrieval and fuzzy ontologies. Section 3 describesour proposal. Section 4 presents and discusses someexperimental results of our framework. Finally, sec-tion 5 concludes and discusses directions for futureresearch.
123

Figure 1: An example of a fuzzy ontology.
2 RELATED WORKS ANDMOTIVATIONS
Several studies were presented showing how thefuzzy logic could be integrated to IRS, to solve un-certain information problems (Zhou et al., 2006). Weprecise here, that in a fuzzy ontology, each index termor object is related to every term (or object) in the on-tology, with a degree of membership assigned to therelationship and based on fuzzy logic.
The fuzzy membership value µ is used for the re-lationship between terms or objects, where 0 < µ < 1,and µ corresponds to a fuzzy membership relationsuch as ”strongly”, ”partially”, ”somewhat”,”slightly”
etc, where for each term:i=nå
i=1µi = 1 ;
n is the number of relations that a particular objecthas, n = (N� 1), with N representing the total num-ber of objects in the ontology (Lee et al., 2005).
The insertion of the fuzzy logic and the ontol-ogy in the process of information retrieval has im-proved the quality and the precision of the returnedresults. Thus, integration of the fuzzy ontology intothe IR process is an interesting area of research andcan lead to more relevant results than in the casewhere ontology and fuzzy logic are used separately(Chien et al., 2010; Bordogna et al., 2009; Calegariand Ciucci, 2006). Several existing IRSs (Zhou et al.,2006; Chien et al., 2010; Calegari and Ciucci, 2006)generally use semi-automatic or automatic methods,which allow the fuzzification only of the ”IS-A” rela-
tion. In addition, from the state of the art (Chien et al.,2010; Colleoni et al., 2009), it is noticed that there is alack of information retrieval system integrating fuzzyontology allowing a document classification and as-sisting users in their searches.
First, in (Sayed et al., 2007), document classifica-tion is not based on fuzzy ontologies.In fact, classification based only on domain ontologycould not take into account dynamic aspect of fuzzyontology, mainly when the aim is to improve queryreformulation and information retrieval results. Bothin (Parry, 2006; Akinribido et al., 2011), only ”IS-A” relations are taken into account. Nevertheless, allrelations are important mainly in case of query refor-mulation.
From the conducted survey made on methods forfuzzy ontology construction, we have noticed that au-tomatic methods can take as input a database (Leeet al., ; Quan et al., 2006), a documentary corpus(Widyantoro and Yen, 2001) or an existing ontol-ogy (fuzzification) (Parry, 2006),(Sayed et al., 2007),(Chien et al., 2010), (Calegari and Ciucci, 2006).
Figure 1 illustrates an example of a fuzzy ontol-ogy. The number related to relations represents themembership value of the relationship between theconcept ”Hotel” and other concepts (room, Suite).The related value to a concept describes the impor-tance of this concept into the ontology. These differ-ent relations and concepts will have different mem-bership values depending on the context of the query,and particularly the user’s view of the world.
In this paper, our main objective is to develop a
WEBIST�2014�-�International�Conference�on�Web�Information�Systems�and�Technologies
124

framework allowing ontology’s building for the se-mantic Web. The proposed framework includes anontology repository (meta-ontology generating a do-main ontology and ontology of domain services, andfuzzy ontology), incremental approach of domain on-tology learning, fuzzy ontology building method andontology based retrieval process.So, the aims of this paper can be summarized in:� The integration of the domain ontology enrich-
ment and the fuzzy ontology building in the IRprocess.
� The capitalization and formulation of extractionontology rules based on a meta-ontology aimingto explicitly specify knowledge about the con-cepts, relationships, instances and axioms extrac-tion, the learned patterns and frames, and the se-mantic distance
3 FUZZY-ONTOLOGY-ENRICHMENT-BASEDFRAMEWORK FOR SEMANTICSEARCH
The general structure of the framework (FuzzyOn-toEnrichIR) is given by Figure 2. FuzzOntoEnrichIRframework is based on a fuzzy ontology building, anincremental ontology learning and an ontology repos-itory.
The main FuzzOntoEnrichIR components are: afuzzy ontology building component, an incremen-tal ontology learning component and an ontologicalrepository component.
The first component is composed of:� Two methods of information retrieval based on a
domain ontology and an individual fuzzy ontol-ogy.
� An automatic method of fuzzy ontology building:allowing the fuzzification of all existing relationsin the initial domain ontology initial, and assur-ing the updating of membership values at the endof every information retrieval, which is made dy-namically by the user
� A classification of documents by service using adomain ontology
This first component aims to automate the collectionof the relevant documents which will be used as entryof the second component
The second component is based on a meta-ontology (which is a high-level ontology of abstrac-tion (Baazaoui-Zghal et al., 2007a)) and an incremen-tal ontology learning which may require enrichment
phase. It allows incremental construction of ontolo-gies from the Web documents. Thus, this componentproposes a composite ontological architecture of threeinterdependent ontologies: a generic ontology of websites structures, a domain ontology and a service on-tology.
These offer a representation of the domain and ser-vices behind Web content, which could be exploitedby the semantic search engines. This latter is instanti-ated with the contextual information of concepts andrelations of the ontology extracted incrementally fromtexts. The semi-automatic construction of the domainontology is the main objective of this component.
The third component is composed of a meta-ontology generating a domain ontology and ontologyof domain services, and fuzzy ontology.
The details related to each component will begiven in the next subsections.
3.1 Fuzzy Ontology BuildingComponent
FuzzyOntoEnrichIR integrates an automatic fuzzyontology building method, with an automatic fuzzifi-cation of all the existing relations in the domain ontol-ogy, not restricted to ”Is-a” relations. Indeed, in con-ventional ontologies, particular objects may occur inmultiple locations. So, a simple expansion that doesnot understand the intended location of the query termmay lead to many irrelevant results being returned. Afuzzy ontology membership value could therefore beused to identify the most likely location in the ontol-ogy of a particular term. Each user would have ownvalues for the membership assigned to terms in theontology, reflecting their likely information need andworldview.
Then, the use of an individual fuzzy ontologyapproach allows the convenient representation of therelationships in a domain according to a particularview, without sacrificing commonality with otherviews; the ontology framework is common, just themembership values are different. An individual fuzzyontology using an automatic fuzzification based isbuilt.
Initialization of Membership ValuesWe propose to build an individual fuzzy ontologyusing an automatic fuzzification based on Jiang-Conrath similarity measure (Jiang and Conrath,1997). To calculate IC (Information Content), we usethe formula presented by (Seco et al., 2004) whichis based on the structure of the ontology hierarchy.In fact, this frequency has the advantage of bringingthe occurrence frequency of the concept itself and the
Fuzzy-Ontology-Enrichment-based�Framework�for�Semantic�Search
125

Figure 2: FuzzyOntoEnrichIR famework architecture.
concepts it subsumes, which allows supporting allrelations’ types.
Updating the Membership Value of Concepts andRelationsWe suppose that a defined fuzzy ontology is not avail-able in any context. Thus, it is necessary to define anupdate process of fuzzy values, taking into accountthe user’s needs. The membership value should con-sider the previous values, the retrieved documents andthe query. In the literature, there are researchers thathave presented similar ways of updating membershipvalue (Calegari and Ciucci, 2006; Parry, 2006). In-spired by these methods, we have integrated in ourcase two updating membership values respectively forconcepts and relations.
µnew = µold +µ�µold
Q+1(1)
where µold is the current membership value, Q is thenumber of update performed to this value and µnewis the new value. µ is a value that evaluates the newchange added to the relation or the concept. µ musttake into account the query and the returned docu-ments content that have been selected by the user.
The fuzzy ontology is used for query reformula-tion and for documents and query indexing. A fuzzyontology is an individual an ontology owned by eachuser.
To show the purpose of the given formulas, wetake as example the query sent by the user contain-ing the concept ”Hotel”. The framework computes
themeasures of this concept and all its related con-cepts (like: Rate, Restaurant, Motel. . . ) using the re-turned documents selected by the user. Finally, themembership value of relations using the formula 5 arealso updated. In this example the membership valueof the relation ”has-restaurant” between ”Hotel” and”restaurant”’ will be updated (cf. Figure 3).
3.2 Ontological Repository Component
A dedicated architecture is proposed based on two in-terdependent ontologies to build a knowledge-base ofa particular domain, constituted by a set of Web doc-uments, and associated services. Thus, two ontolo-gies are distinguished: domain ontology and ontologyof domain services, which are in interaction. Thesetwo ontologies are built in accordance with the meta-ontology. Domain ontology is a set of concepts, rela-tions and axioms that specify shared knowledge con-cerning a target domain. Ontology of domain servicesspecifies for each service, its provider, its interestedusers, possible process of its unrolling, main activitiesand tasks that constitute this service (Baazaoui-Zghalet al., 2007b).
This ontology contains axioms specifying the re-lations between domain services and precise main do-main concepts which identify each service. These on-tologies are semantically linked and relationships be-tween them are defined. The meta-ontology is a spec-ification of meta-models of domain ontology and on-tology of domain services. Besides, knowledge con-cerning the semi-automatic construction of domain
WEBIST�2014�-�International�Conference�on�Web�Information�Systems�and�Technologies
126

Figure 3: Relation between domain ontology and service ontology.
ontology is also specified by this meta-ontology.The proposed architecture is composed of three
ontologies, namely a generic ontology of web sitesstructures, domain ontology and service ontology.
The generic ontology or meta-ontology containsknowledge representation related to each ontology,which required knowledge for ontology construc-tion, knowledge representation specified by the meta-model related to these ontologies. It is mostlybased on generic concepts: ”meta-concept”, ”meta-relation”, and ”meta-arxiom”. The class of ”meta-concept” is divided into subclasses which repre-sent respectively the domain meta-concept, the meta-concept of domain services and the meta-concept ofelement. Besides, the class ”meta-relation” and theclass ”meta-axiom” are designed in the same way.The meta-ontology is, consequently, made up of threehomogeneous knowledge fields. The first field is aconceptualization of knowledge related to learningconcepts, relations and axioms related to a target do-main.
Besides, for each instance of the class Do-main Concept and the class Domain Relation, thetechnique leading to its discovery is specified.
The service ontology specifies the common ser-vices that can be solicited by web users and can beattached to several ontologies defined on subparts ofthe domain (cf. Figure 3 showing the relation betweendomain ontology and service ontology)
3.3 Incremental Ontology LearningComponent
The incremental ontology learning component isbased on a process of ontology learning fromWeb content according to LEO By LEMO (LEarningOntology BY Learning Meta Ontology) approach(Baazaoui-Zghal et al., 2007b). Our approach isbased on learning rules of ontology extraction fromtexts in order to enrich ontologies in three main
phases:
� Initialization phase
� Incremental phase of learning ontology
� Result analysis phase.
The initialization phase is dedicated to data sourcecleaning. The input of this phase is constituted bya minimal ontology, the meta-ontology, the termino-logical resource ”Wordnet” (Miller”, 1995) and a setof Web sites delivered by a search engine and classi-fied by domain services. A minimal ontology is de-signed and built to be enriched in the second phase.It is called ”minimal domain ontology” as the numberof concepts and relations are reduced. Consequently,data source preparation consists of: searching Webdocuments related to the domain corresponding to aquery based on concepts describing a target service(these concepts are obtained from the projection ofthe corresponding service specified in the ontology ofdomain services), selecting Web sites provided by asearch engine tool (the number of chosen sites is lim-ited because analyzing an important number of Webpages requires very important execution time), classi-fying Web pages according to domain services.
Finally, cleaning Web pages by eliminatingmarkup elements and images, text segmentation andtagging in order to obtain a tagged textual corpus.One hypothesis is that we deal with Web documentswritten in a target language. The meta-ontology ad-justment is thus done according to linguistic knowl-edge related to the target language. The second phaseis a learning iterative process. Each one of the iter-ations is made up of two main steps. The first oneis the meta-ontology instantiation and the second oneenables us to apply the meta-ontology axioms relatedto the learning of ontology. An iteration is processedin two steps. In the first step, techniques are appliedto the corpus. In this context, we have adapted theconstruction of a word space (Baazaoui-Zghal et al.,2008) by applying the N-Gram analysis instead of a 4-
Fuzzy-Ontology-Enrichment-based�Framework�for�Semantic�Search
127

Figure 4: Modular architecture framework.
gram analysis. We have also proposed a disambigua-tion algorithm (Baazaoui-Zghal et al., 2007b). It aimsto determine the right sense of a lexical unit. This al-gorithm is based on the study of term co-occurrencein the text and the selection of the adequate sense. Be-sides, we propose to use many similarity measures tobuild the similarity matrix which describes the con-textual similarity between concepts.
The last phase is useful to verify the coherence ofenriched ontology by analyzing learning results. Weadmit that the maintenance of the meta-ontology al-lows the readjustment of the rules according to theresults obtained in order to improve the ontologyconstruction during a further execution of the sec-ond phase of the process. Moreover the correctionof meta-ontology generates a more valid ontologyscheme and richer.
4 EXPERIMENTATION ANDRESULTS ANALYSIS
The implementation and experimentations of the pro-posed framework, have been done in order to eval-uate the proposed architecture. Figure 4 gives anidea about the developped modules and the applica-tion structure. FuzzEnrichIR is composed of the con-struction and updating module which allows manip-ulation of the fuzzy ontology. The processing mod-ule regroups classes assuring the different treatmentsdone on the request and on the documents (as index-ing and downloading). The class module regroups the
different useful classes to the document classificationby service. A pre-processing module of data sourceswhich pre-process textual corpus, its POS (Part-of-Speech) tagging and importation of terminologicaland conceptual resources (minimal ontology, Ontol-ogy of domain services and terminological resource”Wordnet”). An editing module of the meta-ontologywhich allows concepts and ontology axioms updateby integrating the Plug-in of Protege-OWL tool. Amodule for domain ontology generation. An alimen-tation module of the meta-ontology which consistsof conceptual elements in the meta-ontology fromtext and implements the incremental process of on-tology domain construction proposed by the ”LEO-By-LEMO” approach. Finally, a module of domainontology learning which is the result of the associa-tion and the development of learning techniques set(concepts and relations).
The framework was implemented in Java, provid-ing an online service and using the Jena Api to handleontologies and Google Api to search through the Web.
Several experiments were conducted to investigatethe performance of our proposal and to evaluate:
� The impact of ontology enrichement on informa-tion retrieval relevance
� The impact of fuzzy ontology enrichement on in-formation retrieval relevance with and without up-date
The adopted protocol is centered on users, and theused data for the experimentation and the evaluationwas composed of a domain ontology and users’ re-quests. Fifteeen queries in the tourism’s domain and
WEBIST�2014�-�International�Conference�on�Web�Information�Systems�and�Technologies
128

Figure 5: Scenarios’ results.
ten users were considered. Users evaluate the resultsobtained by using the domain ontology, the individ-ual fuzzy ontology and the updated individual fuzzyontology.
Three scenarios were designed to evaluate the pro-posed framework:
� Scenario based on domain ontology (Sc1)
� Scenario based on individual fuzzy ontology,without update (Sc2)
� Scenario based individual fuzzy ontology, with 4updates (Sc3)
Figure 5 shows the results in terms of precision (P)and recall (R), for Top 5, 10, 20, 30 and 50 retrieveddocuments. To evaluate the recall values, we considerthe same queries used for the precision. We anal-ysed the first 50 relevant URL’s returned by every sce-nario. The obtained precision and recall related withFuzzOntoEnrichIR for scenario Sc3 are clearly higherthan the ones obtained by Sc1 and Sc2. Indeed, re-sults related to the comparison of exact precision ob-tained with FuzzOntoEnrichIR based on domain on-tology only, FuzzOntoEnrichIR based on fuzzy on-tology with and without update, present a precisionof 0.95 which is superior to the two other scenarios.These results show that the use of fuzzy ontology sup-porting update process increases the precision morethan the use of simple domain ontology.
To complete these results we computed the im-provements given by Table 1, which show that indi-vidual fuzzy ontology updated four times is reportedto achieve 18,75% precision and 37,50% recall. In-deed, the results show that the use of fuzzy ontologyincreased the precision more than the use of simpledomain ontology.
In the experimentations, the initial used ontologyand fuzzy ontology are composed of 8 concepts, en-riched with 20 concepts after the first iteration, with
Table 1: The improvement of the average recall and the av-erage precision of the FuzzEnrichOntoIR framework.
Precision/ Precision RecallRecall improvement improvement
TS3 vs.TS1 TS3 vs.TS1(in %) (in %)
P/R 05 18,75 37,50P/R 10 16,25 35,29P/R 20 14,28 25,00P/R 30 12,00 22,44P/R 50 07,50 17,50
20 concepts, enriched with 27 concepts after the sec-ond iteration, enriched with 40 concepts after the thirditeration, and enriched with 100 concepts after thefourth iteration. From the obtained results after theexperimentations, we note that the incremental en-richment of the domain ontology improves the rele-vance.
However, relevance becomes stable after the thirditeration, when the size of the ontology is enoughgreat to cover a unique complex query. Indeed, the100 concepts don’t cover the field of the same request,but they serve to other composed requests in the samedomain. For this reason, the variance of the relevanceof the first iteration of the enrichment has a remark-able impact on the relevance of improvement.
5 CONCLUSIONS AND FUTUREWORKS
In this paper, we proposed a fuzzy-ontology-enrichment framework based on fuzzy ontology,namely FuzzOntoEnrichIR. Since ontologies haveproven their capacity to improve IR, fuzzy ontology-based IR is becoming an increasing research area.FuzzOntoEnrichIR’s framework takes place in four
Fuzzy-Ontology-Enrichment-based�Framework�for�Semantic�Search
129

main phases:
� Initialization of membership values,
� Updating the membership value of concepts andrelations,
� Updating the membership value of the existingconcepts in the user’s query
� Updating the membership value of relations re-lated to the existing concepts in the user’s query.
Fuzzy ontologies buiding method is integrated toIR process, and returned results are classified takinginto account fuzzified relations.
So, in this work, our first contribution concerns thefuzzy ontoly’s building process. Our method consid-ers automatic fuzzification of a domain ontology tak-ing into account both taxonomic and non taxonomicrelations, however, all relations are important mainlyin case of query reformulation.
Second contribution concerns the integration ofour fuzzy ontology method into the IR process. In-deed, query reformulation is based on the weights as-sociated to all the relations existing in the fuzzy ontol-ogy, and this fuzzy ontology is used to classify docu-ments by services.
Finally, the obtained results establish the greatinterest and FuzzOntoEnrichIR’s contribution to im-prove the performance of the retrieval task. Experi-ments and evaluations have been carried out, whichhighlight that overall achieved improvement are ob-tained thanks to the integration of fuzzy ontologiesinto IR process, integration of update and classifica-tion. These components contribute to significantly in-crease the relevance of search results, by enhancingdocuments ranking as shown by the obtained results.
As an evolution of this work, integration of mod-ular ontologies in order to facilitate the updates is inprogress. Otherwise, the ontology will be extendedto different domains so that architecture will supporta multi-domain use of the ontology. A multi-domainretrieval based on modular and fuzzy ontologies willbe possible.
REFERENCES
Akinribido, C. T., Afolabi, B. S., Akhigbe, B. I., and Udo,I. J. (2011). A fuzzy-ontology based information re-trieval system for relevant feedback. In InternationalJournal of Computer Science Issues.
Baazaoui-Zghal, H., Aufaure, M.-A., and Mustapha, N. B.(2007a). Extraction of ontologies from web pages:Conceptual modelling and tourism application. Jour-nal of Internet Technology (JIT), Special Issue on On-tology Technology and Its Applications, 8:410–421.
Baazaoui-Zghal, H., Aufaure, M.-A., and Mustapha, N. B.(2007b). A model-driven approach of ontologicalcomponents for on- line semantic web information re-trieval. Journal of Web Engineering, 6(4):309–336.
Baazaoui-Zghal, H., Aufaure, M.-A., and Soussi, R. (2008).Towards an on-line semantic information retrieval sys-tem based on fuzzy ontologies. JDIM, 6(5):375–385.
Bordogna, G., Pagani, M., Pasi, G., and Psaila, G.(2009). Managing uncertainty in location-basedqueries. Fuzzy Sets and Systems, 160(15):2241–2252.
Calegari, S. and Ciucci, D. (2006). Towards a fuzzy ontol-ogy definition and a fuzzy extension of an ontologyeditor. In ICEIS (Selected Papers), pages 147–158.
Chien, B.-C., Hu, C.-H., and Ju, M.-Y. (2010). Ontology-based information retrieval using fuzzy concept docu-mentation. Cybernetics and Systems, 41(1):4–16.
Colleoni, F., Calegari, S., Ciucci, D., and Dominoni, M.(2009). Ocean project a prototype of aiwbes based onfuzzy ontology. In ISDA, pages 944–949.
Jiang, J. J. and Conrath, D. W. (1997). Semantic similar-ity based on corpus statistics and lexical taxonomy.CoRR, cmp-lg/9709008.
Lee, C.-S., Jian, Z.-W., and Huang, L.-K. (2005). A fuzzyontology and its application to news summarization.IEEE Transactions on Systems, Man, and Cybernet-ics, Part B, 35(5):859–880.
Lee, C.-W., Shih, C.-W., Day, M.-Y., Tsai, T.-H., Jiang, T.-J., Wu, C.-W., Sung, C.-L., Chen, Y.-R., Wu, S.-H.,Hsu, and Wen-Lian. Asqa: Academia sinica questionanswering system for ntcir-5 clqa.
McGuinness, D. L. (1998). Ontological issues forknowledge-enhanced search. In Proceedings of For-mal Ontology in Information Systems.
Miller”, G. A. (1995). ”wordnet: A lexical database forenglish”. Commun. ACM, 38(11):39–41.
Parry, D. (2006). Chapter 2 fuzzy ontologies for informa-tion retrieval on the fWWWg. In Sanchez, E., editor,Fuzzy Logic and the Semantic Web, volume 1 of Cap-turing Intelligence, pages 21 – 48. Elsevier.
Quan, T. T., Hui, S. C., Fong, A. C. M., and Cao,T. H. (2006). Automatic fuzzy ontology generationfor semantic web. IEEE Trans. Knowl. Data Eng.,18(6):842–856.
Sayed, A. E., Hacid, H., and Zighed, D. A. (2007). Usingsemantic distance in a content-based heterogeneousinformation retrieval system. In MCD, pages 224–237.
Seco, N., Veale, T., and Hayes, J. (2004). An intrinsic infor-mation content metric for semantic similarity in word-net. In ECAI, pages 1089–1090.
Widyantoro, D. and Yen, J. (2001). A fuzzy ontology-basedabstract search engine and its user studies. In FuzzySystems, 2001. The 10th IEEE International Confer-ence on, volume 3, pages 1291–1294.
Zhou, L., Zhang, L., Chen, J., Xie, Q., Ding, Q., and Sun,Z. X. (2006). The application of fuzzy ontology indesign management. In IC-AI, pages 278–282.
WEBIST�2014�-�International�Conference�on�Web�Information�Systems�and�Technologies
130

A Semantic-based Data Service for Oil and Gas Engineering
Lina Jia1,2, Changjun Hu1,2, Yang Li1,2, Xin Liu1,2, Xin Cheng1,2, Jianjun Zhang3 and Junfeng Shi3 1School of Computer & Communication Engineering, University of Science & Technology Beijing,
No.30 Xueyuan Road, Haidian District, Beijing, China 2Beijing Key Laboratory of Knowledge Engineering for Materials Science,
No.30 Xueyuan Road, Haidian District, Beijing, China 3Research Institute of Exploration& Development, CNPC, No.20 Xueyuan Road, Haidian District, Beijing, China
{jialinabetter, hu.cj.mail, mailbox.liyang, ustb.liuxin, chengxin0613}@gmail.com, [email protected]
Keywords: Semantic-based Data Integration, Ontology, Data Service, Data of Oil and Gas Engineering.
Abstract: For complex data sources of oil and gas engineering, this paper summarizes characteristics and semantic relationships of oil data, and presents a semantic-based data service for oil and gas engineering (SDSOge). The domain semantic data model is constructed using ontology technology, and semantic-based data integration is achieved by ontology extraction, ontology mapping, query translation, and data cleaning. With the semantic-based data query and sharing service, users can directly access distributed and heterogeneous data sources through the global semantic data model. SDSOge has been used by upper applications, and the results show that SDSOge is efficient in providing a comprehensive and real-time data service, saving energy, and improving production.
1 INTRODUCTION
With continuous expansion of the scale of petroleum exploration industry, the domain of oil and gas engineering has accumulated massive data resources, like production data, geological structures, equipment data, well structure data, etc. These data are large in scales, numerous in kinds, complex in relationships and various in characteristics:
1) Distribution: In oil fields, different types of data are stored in different specialized databases, such as production database, geological database, and equipment database. But applications of oil and gas engineering require various data from different databases.
2) Heterogeneity: Each specialized database has its own data organizing and naming convention, which results in system, syntax, structure, and semantic heterogeneity. (1) System heterogeneity: Different data have different operating environments, such as hardware configurations and operating systems. (2) Syntax heterogeneity: Different data are stored in different forms in the computers. Some are in relational databases, while some are in text files. (3) Structure heterogeneity: Similar data are represented in different data schemas. (4) Semantic heterogeneity: Similar data
have different semantic understandings, or different data have the same meaning, which has traditionally been divided into homonyms and synonyms.
3) Complex Semantic Relationships: There are complex relationships between different data.
4) Real-time Performance: The data of oil and gas engineering is dynamic and instantly updated with high real-time demand.
The characteristics of data of oil and gas engineering bring unprecedented challenges for conventional data management. On the one hand, with the differences in data schemas of different oil fields and the shortage of data management and naming rules, it is necessary to shield heterogeneity of underlying data to establish a global semantic data model for the domain of oil and gas engineering, which can maintain the unification of rules and standards, and data management platform. On the other hand, applications of oil and gas engineering are typically data-intensive. Data are the source of these applications and various data from different specialized databases are needed, but databases of oil fields are highly autonomous, which makes data interacting and sharing more difficulty. Thus semantic-based data integration is urgently in need, which can provide a unified and semantic-based interface to access the underlying data sources directly and implement data sharing.
131

This paper presents a semantic-based data service for oil and gas engineering named SDSOge, which provides a rich semantic view of the underlying data and enables an advanced querying functionality. Users can enjoy a plug-and-play (Mezini and Lieberherr 1998) model and have direct access to the distributed and heterogeneous data resources anywhere. In addition, the data service offers a semantic reasoning functionality, which can reason implicit knowledge behind the complicated semantic relationships.
SDSOge firstly extracts local ontologies from schemas of data sources using ontology technology, and then establishes a completed global ontology which can support each local data source. Furthermore, an interface is set up to access underlying data sources, which can eliminate differences in data sources and provide a uniform and transparent semantic-based data query service. Finally, the cleaned standard data are returned to the upper applications.
This paper is organized as follows. Section 2 introduces related work while section 3 describes the architecture of SDSOge and its implementation in details. The usage of SDSOge system and its production application pointing out the advantages comparing to previously employed techniques are illustrated in section 4. Finally, the conclusion and directions for future work are given in section 5.
2 RELATED WORK
As the complexity of data brings more and more challenges, a new approach of data service is becoming increasingly necessary.
Carey et al. (2012) survey three kinds of popular data services, service-enabling data stores, integrated data services and cloud data service, respectively. But none of the three considers semantic association.
Doan et al. (2004) introduce the special issue on semantic integration. They point out that 60-80% of the resources in a data sharing project are spent on reconciling semantic heterogeneity. Halevy et al. (2005) describe successes, challenges and controversies of enterprise information integration. Kondylakis et al. (2009) review existing approaches for ontology/schema evolution and give the requirements for an ideal data integration system.
Bellatreche et al. (2006) propose the contribution of ontology-based data modeling to automatic integration of electronic catalogues within engineering databases, but this method assumes the data source itself does not have enough semantic
information. Ghawi and Cullot (2007) propose a semantic
interoperability from relational database to ontology, but it only considers the case of one data source.
In order to make a more intuitive view of mapping, many mapping tools like COG, DartGrid, VisAVis, and MAPONTO, are developed. These tools need users to build mappings in an interactive way.
Data from different domains have different characteristics. These data are the basis of scientific research in the fields. Semantic–based data integration and data services for domain-oriented ontology are hotspots of current research. Establishment of semantic data models, and integration and application of semantic data in scientific fields are important aspects worthy of discussion and research.
3 SDSOGE ARCHITECTURE AND IMPLEMENTATION
3.1 System Architecture
SDSOge provides a global semantic data model and APIs for users and upper applications to send queries and receive desired data. Service consumers need not to know the source and original schema of data. Figure 1 shows the architecture of SDSOge.
Semantic‐based Data Service for Oil and Gas Engineering
SDSOge
Request
Response
Figure 1: SDSOge Architecture.
3.2 Global Ontology Construction
There are four steps to establish the global ontology.
WEBIST�2014�-�International�Conference�on�Web�Information�Systems�and�Technologies
132

First of all, filter data of oil and gas engineering field and get entities that system needs and relationships between the entities. Next, extract schema information of databases to establish local ontoloties using ontology technology. Then, the global ontology can be built through standardizing names of properties with the synonym table, and further refining, improving and merging of local ontologies. Finally, adding semantic constraint rules and reasoning mechanisms to form a complete and semantically rich global ontology. The global ontology construction process is shown in Figure 2.
DB
DB
Iteration
Figure 2: The global ontology construction process.
3.2.1 Data Filtering
In the field of petroleum exploration and development, data involve more than 20 professional aspects, and data of oil and gas engineering domain are just a part of them. So we should firstly define the basic scope of required data to form entities, attributes and relationships between entities referring to the data dictionary.
Take block data entity and sucker rod data entity as examples, the corresponding entity models are as follows. Block data entity: E(BlockInfo)={block_name, oil_density, permeability,
reservoir_depth, ……} Sucker rod data entity: E(SuckerRodInfo)={sucker_rod_id, diameter, length,……}
3.2.2 From Relational Database to Local Ontology
Based on the features of tables and constraints between tables in the specialized databases, rules from relational database to local ontology are defined as follows.
Rule1: Convert each table T into a class or a subclass CT (OWL: Class or OWL: Subclass).
Rule2: Convert CTj into a subclass of CTi, if the foreign key of table Ti corresponds to the primary key of table Tj (OWL: Subclass).
Rule3: Convert the foreign key of table T into object property OPT (OWL: ObjectProperty).
Rule4: Convert the primary key of table T into the datatype property with functional property DPT (OWL: DatatypeProperty).
Rule5: Convert other columns of table T into
data properties DPT (OWL: DatatypeProperty).
Figure 3: Tables in production database (partial).
Figure 3 shows the schema of a few tables in production database. According to the mapping rules above, the local ontology can be generated automatically. The relationships between classes are foreign key constraints in the database, as shown in Figure 4.
Figure 4: Local ontology of production database (partial classes).
3.2.3 From Local Ontologies to Global Ontology
The process of local ontologies to global ontology is divided into three steps, renaming of properties, merging of classes, and combination of local ontologies.
Renaming of properties, comparing names of ontology properties with the corresponding terms in the synonym table, aims at ensuring consistency of domain terminologies and reusing the semantic data model in the field. The synonym table, which is constructed by domain experts and DBAs referring to exploration-development database handbooks, can solve problems of semantic heterogeneity. The names of terms with synonymous semantic relations in the handbooks are stored in a same collection in the synonym table. The collection name is unified into the corresponding name of the attribute in the entity, which is defined in 3.2.1.
A�Semantic-based�Data�Service�for�Oil�and�Gas�Engineering
133

If the name of ontology property is in the synonym table, rename the ontology property to the corresponding collection name in the synonym table. If it is not in the synonym table, user is required to complete the property renaming task through the GUI, and then add the property into the synonym table. If one property name of local ontology corresponds to multiple collection names in the synonym table, which is semantic heterogeneity of the same vocabulary expressing different meanings in different data sources, the GUI is also needed.
We propose a merging algorithm in the stage of classes merging. Comparing local ontology properties with the entity attributes constructed in the step of data filtering, the scope of ontology datatype properties of a class must be consistent with the corresponding attributes range of the entity, and the class name must be same with the corresponding entity name. If properties of two or more ontology classes correspond to one entity, merge the two or more classes into one class named the corresponding entity name.
The classes merging algorithm is detailed as follows.
Step1: Create an ontology class Ci, whose name is the name of entity E(i).
Step2: DPT∈CT, if DPT ∈E(i) ∧ DPT ∉Ci,add DPT into class Ci, and delete DPT from class CT. If DPT∈E(i) ∧ DPT ∈Ci, delete DPT from class CT, and do not add DPT into class Ci.
Step3: If DPT∉CT, delete class CT, the CT’ constraint relationships convert into Ci’.
Step4: Traverse other classes CT of local ontology, loop through Step 2 and 3.
Step5: Select other entities E(i), and loop through Step 1-4 until all the entities have been traversed.
Figure 5 shows the normalized local ontology of production database after properties renaming and classes merging. Take class BlockInfo in Figure 5 as an example to illustrate the classes merging steps. Create a new class named BlockInfo firstly. In Figure 4, the names of datatype properties of class block_reservoir are in the entity BlockInfo, which is defined in the step of data filtering, so add the datatype properties into the new class BlockInfo, and delete the datatype properties from class block_reservoir. If all the datatype properties in class block_reservoir are deleted, delete class block_reservoir, and the constraint relationships of class block_reservoir are turned into class BlockInfo’. Similarly, traverse other classes. Here, we also add the datatype properties of block_physical into the new class BlockInfo.
WellInfo
well_nameBasicInfo
well_class
output
lifting_method
BlockInfo
ProdInfo
well_type
oil_density
fluid_level
block_name
permeability
sucker_rod_id
Figure 5: Normalized local ontology of production database (partial classes).
Next is combining local ontologies generated from different specialized databases into a global ontology. Starting to traverse the root classes of two local ontologies, if the two classes have the same datatype property, bridge the two classes by a foreign key constraint relationship. The class with functional property is converted into the subclass of the other class without functional property. Two local ontologies can be linked in this way. And then other local ontologies can be combined.
sucker_rod_id
WellInfo
well_nameBasicInfo
well_class
output
lifting_method
BlockInfo
ProdInfo
well_type
SuckerRodInfo
oil_density
fluid_leveldiameter
block_name
permeability
Figure 6: Global Ontology (partial classes).
Figure 6 shows a global ontology, which is a result of the combination of production database ontology and equipment database ontology. Sucker_rod_id is not only the primary key of table sucker_rod in equipment database, but also a property of table prod_info in production database, so bridge the two classes via sucker_rod_id by a foreign key constraint relationship.
Local ontologies can be converted into a global ontology after properties renaming, classes merging, and local ontologies combining.
3.2.4 Adding Semantic Constraint Rules
Semantic constraint rules are added to strengthen the
WEBIST�2014�-�International�Conference�on�Web�Information�Systems�and�Technologies
134
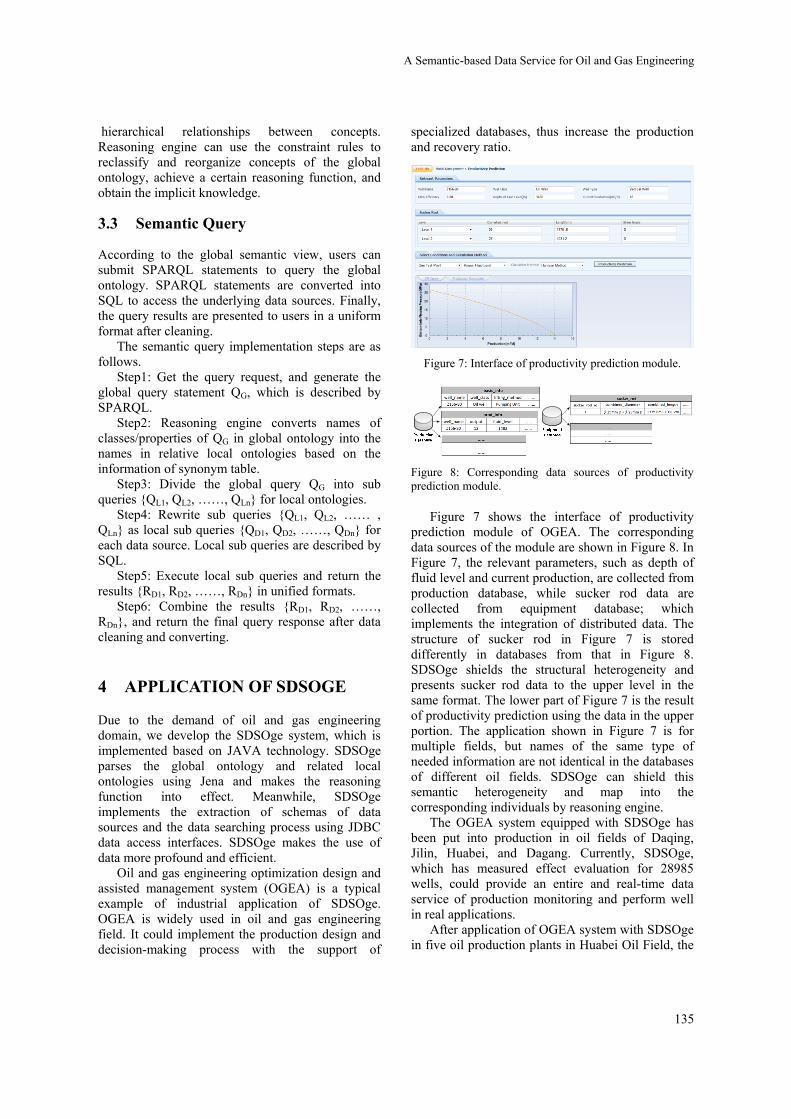
hierarchical relationships between concepts. Reasoning engine can use the constraint rules to reclassify and reorganize concepts of the global ontology, achieve a certain reasoning function, and obtain the implicit knowledge.
3.3 Semantic Query
According to the global semantic view, users can submit SPARQL statements to query the global ontology. SPARQL statements are converted into SQL to access the underlying data sources. Finally, the query results are presented to users in a uniform format after cleaning.
The semantic query implementation steps are as follows.
Step1: Get the query request, and generate the global query statement QG, which is described by SPARQL.
Step2: Reasoning engine converts names of classes/properties of QG in global ontology into the names in relative local ontologies based on the information of synonym table.
Step3: Divide the global query QG into sub queries {QL1, QL2, ……, QLn} for local ontologies.
Step4: Rewrite sub queries {QL1, QL2, …… , QLn} as local sub queries {QD1, QD2, ……, QDn} for each data source. Local sub queries are described by SQL.
Step5: Execute local sub queries and return the results {RD1, RD2, ……, RDn} in unified formats.
Step6: Combine the results {RD1, RD2, ……, RDn}, and return the final query response after data cleaning and converting.
4 APPLICATION OF SDSOGE
Due to the demand of oil and gas engineering domain, we develop the SDSOge system, which is implemented based on JAVA technology. SDSOge parses the global ontology and related local ontologies using Jena and makes the reasoning function into effect. Meanwhile, SDSOge implements the extraction of schemas of data sources and the data searching process using JDBC data access interfaces. SDSOge makes the use of data more profound and efficient.
Oil and gas engineering optimization design and assisted management system (OGEA) is a typical example of industrial application of SDSOge. OGEA is widely used in oil and gas engineering field. It could implement the production design and decision-making process with the support of
specialized databases, thus increase the production and recovery ratio.
Figure 7: Interface of productivity prediction module.
Figure 8: Corresponding data sources of productivity prediction module.
Figure 7 shows the interface of productivity prediction module of OGEA. The corresponding data sources of the module are shown in Figure 8. In Figure 7, the relevant parameters, such as depth of fluid level and current production, are collected from production database, while sucker rod data are collected from equipment database; which implements the integration of distributed data. The structure of sucker rod in Figure 7 is stored differently in databases from that in Figure 8. SDSOge shields the structural heterogeneity and presents sucker rod data to the upper level in the same format. The lower part of Figure 7 is the result of productivity prediction using the data in the upper portion. The application shown in Figure 7 is for multiple fields, but names of the same type of needed information are not identical in the databases of different oil fields. SDSOge can shield this semantic heterogeneity and map into the corresponding individuals by reasoning engine.
The OGEA system equipped with SDSOge has been put into production in oil fields of Daqing, Jilin, Huabei, and Dagang. Currently, SDSOge, which has measured effect evaluation for 28985 wells, could provide an entire and real-time data service of production monitoring and perform well in real applications.
After application of OGEA system with SDSOge in five oil production plants in Huabei Oil Field, the
A�Semantic-based�Data�Service�for�Oil�and�Gas�Engineering
135
average efficiency has increased by 3.6%, while the average pump inspection period has increased by 83 days, and total oil production has increased by 9054 tons. The cost of manpower and material resources has been saved, and the efficiency of management has been improved. Moreover, the average system efficiency has improved 3.75% and the average pump inspection period has increased by 75 days after the SDSOge applied in six oil production plants of Dagang Oil Field, which makes a lot of sense in extending pump inspection period, saving energy and raising production.
Based on the distributed and heterogeneous databases of oil fields, SDSOge shields the heterogeneity of underlying databases, builds the global semantic data model, provides the semantic searching function based on domain terminologies, and makes the searching results available for upper applications. SDSOge enables the value of data improved.
5 CONCLUSIONS AND FUTURE WORK
The current researches and applications mainly focus on solving semantic heterogeneity between data sources using ontology, data integration based on semantic methods, and data services for upper applications.
The semantic-based data service mentioned in this paper connects distributed, heterogeneous and complicated data seamlessly, which makes upper applications moving smoothly on SDSOge platform. SDSOge, which makes data shared and reused, builds a semantic-abundant global ontology in the domain of oil and gas engineering, implements data query transformations based on semantic methods, and provides a data service for upper applications. SDSOge could shield the heterogeneity of underlying data sources and allow users to access the standard data everywhere directly, thus provide effective data supports for production. SDSOge combines industrial production and scientific research tightly and is a great example that science promotes the progress of industry.
In the future, we would add more reasoning mechanisms to provide better semantic-based data services, and introduce SDSOge into more oil fields.
ACKNOWLEDGEMENTS
This work is supported by the R&D Infrastructure and Facility Development Program under Grant No. 2005DKA32800, the Key Science-Technology Plan of the National ‘Twelfth Five-Year-Plan’ of China under Grant No. 2011BAK08B04, the 2012 Ladder Plan Project of Beijing Key Laboratory of Knowledge Engineering for Materials Science under Grant No. Z121101002812005, the National Key Basic Research and Development Program (973 Program) under Grant No. 2013CB329606, and the Fundamental Research Funds for the Central Universities under Grant No. FRF-MP-12-007A.
REFERENCES
Bellatreche, L., Dung, N. X., Pierra, G., Dehainsala, H., 2006. Contribution of ontology-based data modelling to automatic integration of electronic catalogues within engineering databases. In Computers in Industry, 57(8-9), 711-724.
Carey, M. J., Onose, N., Petropoulos, M., 2012. Data Services. Communications of the ACM, 55(6), 86-97.
Doan, A., Noy, N., Halevy, A., 2004. Introduction to the special issue on semantic integration. In ACM SIGMOD Record, 33(4), 11-13.
Ghawi, R., Cullot, N., 2007. Database-to-Ontology Mapping Generation for Semantic Interoperability. In VLDB ’07, Vienna, Austria.
Halevy, A.Y., Ashish, N., Bitton, D., et al, 2005.Enterprise information integration: Successes, Challenges and Controversies. In SIGMOD Conference, 778-187.
Hu, C., Tong, Z., et al, 2001. Research on Constructing of Object-Oriented Petroleum Common Data Model. Journal of Software, 12(3), 427-434.
Kondylakis, H., Flouris, G., Plexousakis, D., 2009. Ontology and Schema Evolution in Data Integration: Review and Assessment. In Meeraman, R., Dillon, T., Herrero, P. (eds.) OTM 2009. LNCS, 5871, 932-947. Springer, Heidelberg (2009).
Kondylakis, H., Plexousakis, D., 2011. Exlixis: Evolving Ontology-Based Data Integration System. In SIGMOD’11, 1283-1286.
Ludäscher, B., Lin, K., Bowers S., et al, 2006. Managing Scientific Data: From Data Integration to Scientific Workflows. Geological Society of America Special Paper on GeoInformatics, 109-129.
Mezini, M., Lieberherr, K., 1998. Adaptive Plug-and-Play Components for Evolutionary Software Development. In: Proceedings OOPSLA’98, ACM, Vancouver, British Columbia, Canada, 97-116.
Ye, Y., Yang, D., Jiang, Z., Tong, L., 2008. Ontology-based semantic models for supply chain management. In The International Journal of Advanced Manufacturing Technology, 37(11-12), 1250-1260.
WEBIST�2014�-�International�Conference�on�Web�Information�Systems�and�Technologies
136
Cloud SpaceWeb-based Smart Space with Management UI
Anna-Liisa Mattila, Kari Systa, Jari-Pekka Voutilainen and Tommi MikkonenDepartment of Pervasive Computing, Tampere University of Technology, Korkeakoulunkatu 1, Tampere, Finland
fanna-liisa.mattila, kari.systa, [email protected], [email protected]
Keywords: Internet-of-Things, Mobile Agents, HTML5, Web Applications, Experimentation.
Abstract: The emergence of HTML5 allows more complex applications to be run in browsers. However, these applica-tions need not run inside the browser only. In our previous work we have shown that it is feasible to implementmobile agents with Web technologies, such as HTML5 and JavaScript. These mobile agents can be used tocontrol systems like home automation. In this paper we show how this execution environment can be describedas a Cloud Space that provides the users with a new type of multi-device experience to the content and theenvironment the users need to access and control. Furthermore, we present a new way to control and monitorthe Cloud Space through a web application with a 3D UI based on direct manipulation.
1 INTRODUCTION
Modern web applications are systems that use dy-namic HTML – HTML, CSS, DOM and JavaScript –for user interfaces and the HTTP protocol as the com-munication protocol. These systems form the back-bone of the current ICT infrastructure. End userscan easily access information and services through theWeb using the browser without additional installationof specific client software. This commonality and uni-formity has simplified end-users’ life, and given thebrowser a central role in all information access andnowadays increasingly often also in entertainment,office applications, and services such as banking.
For users, most of the relevant computing re-sources and content are located in the Internet. Thistrend is related to two recent developments: 1) usershave multiple devices that they use to access data andservices, and 2) users store their content in severalcloud-based services. These two aspects are not yetfully supported since information that is typically lo-cal – like bookmarks – is often on a wrong device,and data that is stored in cloud-based services cannotbe accessed as seamlessly as data stored in user’s owndevices. Although some services provide a REST API– an architectural style for systems where resourcesplay a major role (Fielding, 2000) – to access the con-tent in a generic fashion, far too often data is onlyavailable through the specific service or proprietaryapplication, and it is not possible to create new appli-cations that would benefit from that data.
The increasing amount of computing power in oureveryday environment is also an emerging trend. Forexample, home entertainment systems are increas-ingly often online, with considerable computing andstorage capacity. We are surrounded by several ”smartspaces”, or systems where our environment is con-trolled and monitored with computers and softwarerunning in them. Cheap computing devices, suchas Raspberry Pi (Raspberry PI, 2013), have becomewidely available and are suitable for research and do-it-yourself (DIY) needs. This enables low-risk exper-iments and provides evidence that low-cost, Internetconnected and powerful computing nodes are com-ing closer to us. We believe that the most naturalway to access these pervasive computing elements arethrough a browser instead of platform specific instal-lable proprietary solutions which are commonly usedin today’s smart spaces.
In this paper we describe vision and proof-of-concept implementation of a system called CloudSpace, where all computing resources form interop-erable clouds that users can access with any device.Users do not need to care about boundaries betweenparticular services or individual devices available insmart spaces. Still, however, users can maintain theirownership and they are in control of their own con-tent. In other words, data and computing will becompletely cloudified for the user without riskingusers’ ownership of the content. In addition, we showhow such an environment can be controlled and man-aged with a virtual 3D environment built using the
137

same technologies. In fact, the monitoring applica-tion could be stored in the same cloud infrastructureas the applications it is presently managing.
The rest of the paper is structured as follows. Sec-tion 2 describes the background. Section 3 introducesthe concept of Cloud Spaces, and Section 4 describesa manager application for Cloud Spaces. Section 5addresses related work. Finally Section 6 draws somefinal conclusions.
2 BACKGROUND
Our work has been motivated by a number of alreadyreported research artifacts. These artifacts will bebriefly introduced in the following subsections.
2.1 Interactive Web Applications
Emerging web technologies such as HTML5 (WorldWide Web Consortium, 2012) and WebGL (KhronosGroup, 2011) have rapidly altered the landscape ofweb application development. With such technolo-gies, it is feasible to develop interactive applicationswith web technologies only, with no vendor-specificplug-ins that require separate installation. Even forgames, the browser is increasingly often the desiredplatform due to its convenience – the users never needto install anything except the browser itself.
These interactive applications are changing ourperception of browser-based applications. The codethat runs in a browser is no longer a simple renderingprocedure generated in the server-side. The applica-tions are deployed and updated from the server likea web page, but after that the needs of the applica-tions determine how dependent the execution is of theserver. The applications can even be cached in thedevice so that they can be used in off-line situations.Examples of large web applications include systemslike Google’s Gmail1, which consists of a consider-able amount of code run inside the browser.
At the same time increasingly powerful librarieshave simplified the development of JavaScript appli-cations. These libraries help dealing with browserincompatibilities and JavaScript’s not-so-good parts(Crockford, 2008). Furthermore, they support the de-velopment of web applications that provide the lookand feel that is fundamentally similar to desktop ap-plications. This was shown to be feasible by theLively Kernel, which provided Smalltalk-like pro-gramming environment inside the browser (Ingallset al., 2008), and Cloudberry (Taivalsaari and Systa,
1http://gmail.com/
2012) which showed that all user-visible software ofa smart phone can be implemented with dynamicallydownloaded web-content.
2.2 Evolving Web Architecture
Latest web application trends have brought technolo-gies originating from the browsers to servers, too. Forexample, Node.js (Node.js, 2013) has lately gainedpopularity. Node.js allows running JavaScript in theserver side, and thus to some extent Node.js allows theexecution of the same code in both server and client.This is a core enabler of our HTML5-agents describedin the next subsection.
Technologies like Meteor (Meteor, 2013) andbackend-as-a-service systems like Firebase (Firebase,2013) are also changing the web architecture towardscloud-like architectures. In general, these systemsprovide features that are commonly needed online.Such features include user management, push noti-fications, and integration with social networking ser-vices, all of which are commonly needed in web ap-plications.
2.3 HTML5 Agents
The Web is fundamentally based on mobile code,pages that may contain applications are downloadedfrom remote locations and evaluated inside thebrowser. Four paradigms of mobile code have beenproposed (Carzaniga et al., 1997):
1. Client-Server where client uses code that is lo-cated in another node.
2. Remote Evaluation where client sends executioninstructions, e.g. SQL queries, to another node.
3. Code on Demand where code is downloaded tothe client for execution. HTML5 applications arewidely used examples of code-on-demand.
4. Mobile Agent where code together with internalstate of the application is moved to other node forexecution.
The first three paradigms are regularly used inWeb applications; the fourth paradigm is connectedto cloud browsing paradigm (Taivalsaari et al., 2013)at least indirectly. In the following, we focus on thefourth paradigm, i.e. mobile agents.
In our previous work, we have designed an agentarchitecture (Systa et al., 2013), where agents cantravel between hosts which can be either browsersor web servers. When running inside browsers theseagents act like any Web application, but when locatedin a server, they are run in headless mode without a
WEBIST�2014�-�International�Conference�on�Web�Information�Systems�and�Technologies
138

user interface. The agent can move between serversand browsers and thus toggle the mode between head-less mode and UI mode. Furthermore, we supportmulti-device usage – the browser instance that pullsan executing agent can be different from the browserinstance that had originally pushed the agent to theserver. The internal state of the application is an im-portant part of a mobile agent. HTML5 agent’s stateneeds to be serialized when the agent is moved froma location to another. Thus, the agent needs to bewritten so that serialization of the relevant parts of thestate is possible. Our design provides support for suchserialization. During agent’s life-cycle the agent mayvisit several browsers and several agent servers. Asample life cycle is presented in Figure 1.
Figure 1: Life-cycle of a HTML5 agent (Systa et al., 2013).
In Figure 1, an agent is started by Browser1, whenthe agent is downloaded from its origin server (Step1). In this phase the agent is initialized and the execu-tion begins. Since the agent executes in a browser ithas a user interface. In Step 2, the agent is pushed toan agent server. This means that the agent server getsthe internal execution state of the agent and the appli-cation code (actually a URL to the code). The agentcan continue the execution in the server. In Steps 3-5, the agent moves from one environment to another,but preserves its internal state and continues execu-tion from where it left off. Finally, the execution isterminated in Step 6.
In our present implementation, the life cycleshown in Figure 1 has been modified so that agentscan move between server and client but also betweentwo servers. This liberates applications to travel freelybetween different computing nodes included in thesystem.
2.4 Agents for Web-of-Things
In (Jarvenpaa et al., 2013) we proposed using mobileagents in the context of Internet-of-Things (IoT). Theapproach was based on the fact that agent servers canbe instantiated in small embedded computers and themobile agents can move between different devices,and if necessary it is also possible to clone agents
to create more instances. One of the possible appli-cation areas we discussed in (Jarvenpaa et al., 2013)was home automation that goes beyond remote con-trol when the agents can be run in embedded devicesinstalled in the physical environment. In that case anintelligent agent can work on behalf of the user andimplement even complex strategies to optimize en-ergy consumption and user comfort.
There are approaches that are based on uploadingand remote evaluation of code in a ”thing”. For ex-ample, MoteLab (Werner-Allen et al., 2005) is a testbed for sensor networks, where developers can uploadexecutable Java to a device. Somewhat similar sys-tem is Kansei (Ertin et al., 2006) (later refactored toKanseiGenie) where developers can also create jobsto execute sensor applications. Our system can alsobe used in a similar way and from similar motiva-tions. However, in our system the uploaded code isWeb content and we can upload an executing agentwith its internal state – i.e. our system is the paradigmof mobile agents.
Maybe the most similar approach to us is the mo-bile agent framework proposed in (Godfrey et al.,2013). It provides nodes in heterogeneous device net-works with a way to communicate and co-operate.The system is based on Java-based AgentSpace (Silvaet al., 1999) mobile agent platform. For us the use ofWeb technologies is essential since it enables leverag-ing the power of the web development ecosystem inapplication development (Systa et al., 2013). Further-more, our agents have been designed to work a part ofthe Cloud Space explained in Section 3.
Since our mobile agents are based on Web tech-nologies – HTML and JavaScript – they integrate wellin Internet-based infrastructures. Moreover, normalbrowsers can be used to access and control the agents.
3 CLOUD SPACE
A key concept of our work is computing and con-tent service called Cloud Space. Users have their ownCloud Spaces – in essence private clouds – in whichall content is stored. Cloud Space includes the follow-ing three parts that relate and depend on each other:1. A data solution that provides a uniform access to
all content. Unlike typical cloud service, CloudSpace does not enforce service-specific silos orlimit what kind of content is uploaded to the ser-vice. All the content is synchronized automati-cally between Cloud Space and devices and ap-plications using the content.
2. A system that stores interaction (browsing) ses-sions so that they can be later continued in another
Cloud�Space�-�Web-based�Smart�Space�with�Management�UI
139

device.
3. The software infrastructure for mobile agents.
3.1 Concept
Cloud Spaces can be virtualized. For instance, asingle computing resource can host several CloudSpaces. However, like in cloud computing, the CloudSpaces appear to both users and applications as a sin-gle service. The Cloud Space hosts arbitary amountof contexts, which represent physical locations withdevices like a kitchen, living room and mobile phone.Each context is a view to one or more Cloud Spaceswith a user interface optimized for different screensizes and for the needs of the context. Mobile phonecontext would need an easy access to lot of contentin user’s personal Cloud Space and Cloud Space ofthe current location but with simplistic UI since mostlikely, the screen size is small. Additionally to thecontext user interfaces, the admin interface needs itsown UI. The admin UI handles creation of new users,new contexts and so on.
An example configuration of Cloud Space hasbeen presented in Figure 2.
Figure 2: Concept of Cloud Space.
It should be noted that Cloud Space contexts canrepresent both physical and virtual entities. Further-more, when user is in some physical space, for exam-ple in a room, she can access both her own personalCloud Space and the Cloud Space of the room.
3.2 Implementation
Cloud Space is partly implemented as a proof-of-concept system. User management and context cre-ation are implemented and they are available in theadmin user interface. Currently contexts are bound tophysical locations and agent servers can be assignedto a context. The design is implemented in Node.js,
mainly to leverage the existing agent server imple-mentation. Hosting the user content will be exportedto backend-as-a-service platform because synchroniz-ing data across multiple databases is out of scope ofthe research.
4 MANAGEMENT UI IN 3D
As already pointed out, mobile agents can be usedfor managing and monitoring devices in the spirit ofInternet-of-Things (Jarvenpaa et al., 2013). How-ever, in our previous publications, (Systa et al., 2013),(Jarvenpaa et al., 2013) the management of the agentshas been left as future work. In the following, weaddress the management of IoT environment whereCloud Space contexts and agents are located in thephysical space.
4.1 Concept
The concept of the manager application is to providea tool for a user to manage her Cloud Space contextsrelated to physical spaces, e.g. to a living room. Us-ing the manager application the user can connect tothe Cloud Space, select context and toggle betweencontexts. The user can monitor agent servers runningin a context and move agents from a server to anotherserver and to another context.
Because Cloud Space contexts are bound to physi-cal spaces 3D user interface for the manager is a natu-ral choice. A context can be visualized as a 3D modelof the physical space to which the context is related.Resources related to the context and navigation wid-gets can be visualized as 3D objects.
Cloud Space and mobile agents use browsers asthe front end. Similarly the monitor application isbased on web technologies and runs on the browser.
4.2 Implementation
We are currently working on a proof-of-concept im-plementation of a Cloud Space context manager usingWebGL and WebWidget3D (Mattila and Mikkonen,2013) system. WebWidget3D is a 3D widget librarythat provides tools for creating 3D widgets and de-signing associated interaction. For actual rendering,WebWidget3D uses Three.js (Three.js, 2014) 3D en-gine for WebGL.
While the use of WebGL enables the creation ofseemingly arbitrarily complex graphics and interac-tions, we simply aim at demonstrating the feasibilityof our approach to the control and management tasks.
WEBIST�2014�-�International�Conference�on�Web�Information�Systems�and�Technologies
140

Consequently, the implementation effort has been in-vested in the creation of a simple model that can beeasily understood and interacted with.
In the present implementation the user can man-age her Cloud Space contexts using a direct manipu-lation 3D UI. Instead of using 3D models to visual-ize Cloud Space contexts, panoramic image spheresinside a 3D world are used. The agent servers andagents as well as navigation widgets are visualizedusing 3D objects. All user interaction is done usingdirect manipulation of 3D content. The user can movein the 3D world according to simple fly paradigm.
The manager consists of three views:
1. Login View where user logs in to her CloudSpace. This view is simple HTML form in 2D.
2. Context Selection View shown in Figure 3.
3. Context Management View shown in Figure 4.
Figure 3: Context selection view.
Figure 4: Context Management View.
When the user connects and logs in to her CloudSpace the manager fetches her contexts and moves tocontext selection view. The user can select the contextto manage by double clicking a context sphere.
When the user has selected the context to monitorthe Context Management View of the selected con-text is shown. The view consists of the servers re-lated to the context visualized as grids inside the con-text sphere. Boxes inside grids are representations ofagents. The user can load an agent to her browser
by double clicking an agent box. Moving an agent toanother server can be done by dragging the agent toanother grid and dropping it there.
Inside the Context Management View the Selec-tion View is also visualized. The user can toggle be-tween Context Management Views using the Selec-tion View. The Selection View inside a Context Man-agement View is shown in right side of Figure 4. Theuser can also drag agents from a context to another.Moving agents are visualized in Figure 5.
Figure 5: Moving agent from a Context to another Context.
In the first fragment of Figure 5 (marked withnumber 1) the user has dragged the agent on top ofthe context which she wants to move the agent. Whenshe releases the agent the Management View changesto the context she chose. This is visualized in the frag-ment 2 of Figure 5. Finally the user can drag the agentto the server in the context and the agent is movedthere (fragement 3 in Figure 5).
5 RELATED WORK
As far as we know our HTML5 mobile agents is aunique application of HTML technology. However,mobile agents as such are an old invention of tech-nologies and concepts (Carzaniga et al., 1997). Simi-larly, Cloud Space is a unique combination, althoughparts of it have been realized by commercial systemslike iCloud by Apple, which implements some partsof the Cloud Space’s idea but is limited to a vendor-specific ”silo”.
Visualization of the agent configuration is im-plemented, for example, in MoteLab (Werner-Allen
Cloud�Space�-�Web-based�Smart�Space�with�Management�UI
141

et al., 2005) where nodes in a sensor network canhost Java-based agents. In MoteLab a Maps Pageshows the sensor network with connections, but thevisualization is two-dimensional only and does not in-clude management operations. Some management as-pects have been included in the WebIoT architecture(Castellani et al., 2012), where a heterogeneous de-vice set can be visualized and controlled through anextensible user interface. Similarly to our approachthe UI of WebIoT is based on the Web and runs in abrowser. However, WebIoT does not use 3D to showthe UI and does not introduce direct manipulation.
6 CONCLUSIONS
In this paper we have introduced the concept of CloudSpaces and a proof-of-concept 3D interface for man-aging Cloud Spaces in the IoT context.
The concept of Cloud Spaces provides personalclouds for user, but it is more than data storage. ACloud Space can also host agent servers and a CloudSpace context can be connected to a physical space.This makes it possible to use Cloud Spaces togetherwith HTML5 agents to build smart spaces for e.g.home automation.
The 3D UI for managing contexts inside a CloudSpace shows how a browser can host interactive 3Duser interface for monitoring and managing smartspaces. The UI provides functionality, e.g. for mov-ing agent from server to another server, with directmanipulation in the 3D context. Exploring the mostfeasible 3D visualizations for contexts, agent serversand agents in a smart space are at this point left asfuture work.
REFERENCESCarzaniga, A., Picco, G. P., and Vigna, G. (1997). De-
signing Distributed Applications With Mobile CodeParadigms. In Proceedings of the 19th internationalconference on Software engineering, pages 22–32.ACM.
Castellani, A. P., Dissegna, M., Bui, N., and Zorzi, M.(2012). WebIoT: A Web Application Framework forthe Internet of Things. In Wireless Communicationsand Networking Conference Workshops (WCNCW),2012 IEEE, pages 202–207. IEEE.
Crockford, D. (2008). JavaScript: The Good Parts.O’Reilly.
Ertin, E., Arora, A., Ramnath, R., Nesterenko, M., Naik, V.,Bapat, S., Kulathumani, V., Sridharan, M., Zhang, H.,and Cao, H. (2006). Kansei: A Testbed for Sensing atScale. In Proceedings of the 4th Symposium on Infor-mation Processing in Sensor Networks (IPSN/SPOTSTRACK, pages 399–406. ACM Press.
Fielding, R. T. (2000). Architectural Styles and the Designof Network-Based Software Architectures. PhD thesis,University of California.
Firebase (2013). Web page of firebase technology. Tech-nical report. https://www.firebase.com/. Last viewed31.12.2013.
Godfrey, W. W., Jha, S. S., and Nair, S. B. (2013). On aMobile Agent Framework for an Internet of Things. InProceedings of the 2013 International Conference onCommunication Systems and Network Technologies,CSNT ’13, pages 345–350, Washington, DC, USA.IEEE Computer Society.
Ingalls, D., Palacz, K., Uhler, S., Taivalsaari, A., andMikkonen, T. (2008). The Lively Kernel a Self-Supporting System on a Web Page. In Self-SustainingSystems, pages 31–50. Springer.
Jarvenpaa, L., Lintinen, M., Mattila, A.-L., Mikkonen,T., Systa, K., and Voutilainen, J.-P. (2013). MobileAgents for the Internet of Things. In System Theory,Control and Computing (ICSTCC), 2013 17th Inter-national Conference, pages 763–767. IEEE.
Khronos Group (2011). WebGL Specification. Tech-nical report. http://www.khronos.org/registry/webgl/specs/1.0/.
Mattila, A.-L. and Mikkonen, T. (2013). Designing a 3DWidget Library for WebGL Enabled Browsers. In pro-ceedings of the 28th Symposium On Applied Comput-ing, volume 1, pages 757–760. ACM.
Meteor (2013). Web page for meteor technology. Tech-nical report. https://www.meteor.com/, Last viewed31,12,2013.
Node.js (2013). Web page for document and down-load of node.js technology. Technical report.http://nodejs.org/. Last viewed 31.12.2013.
Raspberry PI (2013). Web page of raspberry pi. Techni-cal report. http://www.raspberrypi.org/, last viewed31.12.2013.
Silva, A., Silva, M. M. d., and Delgado, J. (1999). AnOverview of AgentSpace: A Next-Generation MobileAgent System. In Proceedings of the Second Inter-national Workshop on Mobile Agents, MA ’98, pages148–159, London, UK, UK. Springer-Verlag.
Systa, K., Mikkonen, T., and Jarvenpaa, L. (2013). HTML5Agents - Mobile Agents for the Web. In WEBIST,pages 37–44.
Taivalsaari, A., Mikkonen, T., and Systa, K. (2013). CloudBrowser: Enhancing the Web Browser With CloudSessions and Downloadable User Interface. In Gridand Pervasive Computing, pages 224–233. Springer.
Taivalsaari, A. and Systa, K. (2012). Cloudberry: AnHTML5 Cloud Phone Platform for Mobile Devices.Software, IEEE, 29(4):40–45.
Three.js (2014). Web page of three.js 3d engine. Technicalreport. http://threejs.org/, last viewed 7.1.2014.
Werner-Allen, G., Swieskowski, P., and Welsh, M. (2005).Motelab: A Wireless Sensor Network Testbed. In Pro-ceedings of the 4th international symposium on Infor-mation processing in sensor networks, page 68. IEEEPress.
World Wide Web Consortium (2012). HTML5 Specifica-tion, candidate recommendation. Technical report.http://www.w3.org/TR/html5/.
WEBIST�2014�-�International�Conference�on�Web�Information�Systems�and�Technologies
142

Sequential Model of User Browsing on Websites Three Activities Defined: Scanning, Interaction and Reading
Aneta Bartuskova and Ondrej Krejcar Dpt. of Information Technologies, University of Hradec Kralove, Rokitanskeho 62, Hradec Kralove, Czech Republic
[email protected], [email protected]
Keywords: Websites, Interaction, Browsing, Usability, Aesthetics, Information Quality.
Abstract: This paper presents a model of user browsing behaviour on websites. Main user activities on websites are suggested, discussed and supported by previous research. Proposed activities are then associated with three main aspects of the website - usability, aesthetics and information quality. Their role in each phase of user browsing on the website is discussed. Basic browsing model is then constructed on the basis of previous research´s conclusions, accompanied by new considerations. Model variations are taken into consideration and discussed in relevance to the mode of use.
1 INTRODUCTION
User browsing, interaction and generally behaviour on website are widely researched topics in human-computer interaction, which can be studied in various contexts and from many different angles. Many of research goals in this area eventually lead to user preference, which is very important in today´s competitive environment. User preference, user experience and evaluation in the scope of websites are often associated with constructs like usability and aesthetics.
Main goal of this paper is to connect these constructs or aspects with phases of interaction between a user and a website. According to authors, every phase has its prominent aspect, which has the biggest influence on user. Proposition of these activities is supported by review of relevant literature. Browsing model of user activities on the website is then constructed, on the basis of previous research and new considerations about expected course of actions.
2 ASPECTS OF THE WEBSITE
The use of a webpage is determined by several factors: the information provided, usability of the website and the impression given to the user (Schenkman and Jönsson, 2000). Web design
attributes were defined as: content organization, visual organization, navigation system, colour and typography (McCracken and Wolfe, 2004). Websites can be evaluated by their usability, memorability, aesthetics, information quality and engagement, which result in overall preference (de Angeli, Sutcliffe and Hartmann, 2006).
Generally, three main aspects of websites emerge from previous research: usability, aesthetics and content (or information quality).
2.1 Aesthetics
Aesthetics of user interfaces is undoubtedly one of the most influential factors of their success with users. General concept of aesthetics comprises several similar constructs such as visual appeal, beauty or goodness.
Beauty is an important predictor of the overall impression and user judgment and therefore beauty of a webpage is an important factor determining how it will be experienced and judged (Schenkman and Jönsson, 2000). Another research showed an influence of aesthetics on credibility and trust, dependent mainly on first aesthetics impression of the website (Robins and Holmes, 2008). Other construct similar to aesthetics - perceived visual attractiveness of the website - was proven to influence usefulness and ease-of-use, i.e. usability (van der Heijden, 2003).
143

2.2 Usability
Usability can be taken as an objective construct (precise measurements of user performance) or subjective (perceived usability). This division is similar to another two concepts: pre-use usability, which is perceived usability of the interface before use, and user performance as a result of user´s activities on the site (Lee and Koubek, 2010). As specified in ISO 9241-11, we can also divide usability measures into these three groups: the measures of effectiveness, efficiency and satisfaction (Hornbæk, 2006).
There is not a conformity among various studies, which aspects are included in usability. One study presents as usability criteria: ease of use, readability, productivity, content quality, completeness or relevance (Spool et al., 1999). Other extensive research includes consistency, navigability, supportability, learnability, simplicity, interactivity, telepresence, credibility, content relevance and readability (Lee, Kozar, 2012).
According to authors´ opinion, content should create a separate category, along with its attributes such as content quality, content relevance or completeness. Usability aspect of websites should be limited to ease of use according to layout, navigation, affordances, readability and similar concepts.
2.3 Content
Finally, content or information quality is one of the key aspects in a website´s success (Lynch and Horton, 2001). Characteristics of content can be defined as quality and quantity of provided information (de Angeli et al., 2006). Content can be also taken as a subjective measure in form of perceived quality of content (Bartuskova and Krejcar, 2013).
Content is often presented as part of usability aspect, nevertheless it creates a whole different category. Content´s criteria relevant to textual form can be divided into quantity measures (e.g. completeness) and quality measures (e.g. relevance, accuracy or understandability).
It is however apparent, that these aspects - aesthetics, usability and content - can be taken separately only to a certain degree. They are all present together in the website, they have an influence on each other and they are all incorporated in overall user preference. Relation between usability and aesthetics in human-computer interactions generally is widely researched (Tuch,
Roth, Hornbæk, Opwis, Bargas-Avila, 2012). Previous studies have shown that subjective evaluations of usability and aesthetics are correlated (Hassenzahl, 2004).
3 ACTIVITIES ON WEBSITE
There is a large number of studies, which deal with browsing and interaction on websites. To the authors´ best knowledge, there is limited research on sequential modelling of user activity in scope of one website and one session, in association with website´s aspects. The approach presented in this paper aspires to bring a novel view on this matter.
Three essential user activities were identified in relation to browsing a website. These activities were labelled as: scanning, interaction and reading. Scanning comprises visual scan of a website, along with developing basic orientation on the website, scanning text and pictures and building first impression. Interaction includes searching for interaction possibilities and using them in actual interaction with the website. Reading activity involves more thorough scanning and actual reading of website content, as well as its understanding and evaluation. Suggested activities are based on review of related literature, which is further discussed in separate sections.
3.1 Scanning
Scanning had been used in literature as e.g. organizational scanning or browsing. Four scanning modes had been defined: undirected viewing, conditioned viewing, informal search and formal search (Choo et al., 2000). These strategies are divided according to mode in which user access internet. Scanning can be of different nature according to user´s mode of browsing. Users can either look up a certain web page for a particular piece of information or just surf the internet without any particular goal of their surfing (Schenkman and Jönsson, 2000). Scanning in this context indicates user behaviour across more websites. Scanning in the context of this article refers to brief survey of the website (one website) visually, also including basic text scanning and searching for affordances.
In a scenario of one website, user can either search for particular information within the website, or he can just browse through the website according to what catches his attention. Moving to another webpage is very easy if the current webpage does not appeal to the user, which is why the first
WEBIST�2014�-�International�Conference�on�Web�Information�Systems�and�Technologies
144

impression of websites is so important (Schenkman and Jönsson, 2000). It was proven that people form an opinion about website based on its visual appeal in a time interval as short as 50ms (Lindgaard et al., 2006).
Scanning is, according to authors´ opinion, the first activity performed by a user while entering a website and includes several continuously proceeding actions: gathering impression about visual appeal
(usually mostly unaware) scanning graphics and pictures - according to
their nature, pictures either contribute to visual appeal or help the user with scanning text or searching for affordances
scanning text - searching for desired text fragments in headlines and paragraphs
searching for affordances (action possibilities) - hyperlinks, menu items, and other interactions
Studies of how users read on websites found that they do not actually read, instead they scan the text, or they first scan the text before actually reading it (Morkes and Nielsen, 1997). Scanning text means not reading word by word, but e.g. only the first sentence of each paragraph to find the desired information. If the user finds scanned section of text satisfactory, reading activity takes place. If the user does not find desired information, he tries to interact with the website, usually in order to get to another set of information. Usually it requires at least several mouse clicks until the user finds what he is looking for. Interaction is therefore the next activity in proposed browsing model.
3.2 Interaction
Interaction in the context of this article means finding and using an affordance (action possibility) on the website, which is conditioned by quality of the information architecture and navigation of the website.
Affordances are not just about functional meanings and motor capabilities; they are also about emotional and cognitive processes that emerge through interaction (Overbeeke and Wensveen, 2003). Interaction aesthetics are one among other factors that allow users to enhance the detection of action possibilities and consequently, the detection of affordances (Xenakis and Arnellos, 2013). That is why searching for affordances is included also in scanning activity and it is therefore connected with aesthetics, even though interactions are mostly associated with usability.
Affordances include control areas of the website such as menu, hyperlinks in sections of text, additional functionality in the form of buttons etc. Interaction activity implies finding desired functionality and appropriately using associated affordance.
This interaction activity comprises several actions: searching for functionality (this originate from
scanning activity) identifying desired affordance using the affordance correctly (e.g. hovering
or clicking) Successful search for functionality is dependent
on purposeful navigation and logical information architecture. It also depends on design and therefore also aesthetics, or more specifically interaction aesthetics. Also successful identification of the affordance and using it correctly depends on appropriate design. Correct usage implies recognition of action - usually it is a mouse clicking, but it can be also e.g. hovering, dragging or scrolling.
3.3 Reading
Reading activity is proposed to follow after scanning activity, as users usually scan the text before actually reading it. Reading activity can be preceded by series of scanning and interaction activities, until the user reaches desired or just interesting section of text. Reading is expected to include two sequentially or interchangeably performed actions: more thorough scanning of headlines and
paragraphs actual reading and understanding of the text retrieving desired information evaluation of read text and retrieved
information Successful reading depends on many factors
associated with information quality and quantity but also usability, especially legibility. Content should be relevant, understandable and its arrangement should follow some basic design principles such as chunking or proximity.
All presented activities are performed by user sequentially, some of them are overlapping in specific actions.
4 BROWSING MODEL
User browsing cannot be entirely generalized, as every user has different background, abilities,
Sequential�Model�of�User�Browsing�on�Websites�-�Three�Activities�Defined:�Scanning,�Interaction�and�Reading
145
personality etc. which results in individual browsing style. Nevertheless general order of actions can be expected based on conclusions from previous sections and related literature with performed experiments on user testing.
The authors suppose, that in every sequential phase or activity, the different aspect of the website is primarily influencing user actions and also success of his actions.
It was demonstrated that visual appeal or aesthetics is likely to be detected first and it can influence subsequent experience with the webpage (Lindgaard, Fernandes, Dudek and Brown, 2006). Therefore scanning as the first activity is supposed to be mostly connected with aesthetics aspect. Aesthetics is then the most pronounced during the scanning activity.
Interaction activity includes searching for interaction possibilities and their usage. This activity is influenced especially by usability of user interface such as information architecture, navigation etc. Therefore, usability is expected to be the most pronounced aspect of interaction activity.
Reading activity is supposed to be experienced at the latest, as the user rarely finds what he is looking for on the first page. Information quality (or quality of content) is proposed as the most influential during reading activity.
Table 1: Suggested user activities on the website associated with most pronounced aspects.
User activity The most pronounced
aspect during the activity Scanning Aesthetics
Interaction Usability Reading Content
4.1 Simulation of User Browsing
Development of activities in the presented simulation is an example of real situation, when the user starts actual reading or information retrieval after two clicks and then again and again after additional click. The magnitude of individual aspects signifies their participation on current activity, which is perceived by the user. Actual values are estimated according to previous research conclusions and also authors´ own presumptions, which are listed in the next section.
4.2 Entering Conditions
Previous simulation depicts expected influence of aesthetics, usability and content on user in different
Figure 1: Simulation of user browsing on the website.
WEBIST�2014�-�International�Conference�on�Web�Information�Systems�and�Technologies
146
phases of working with the website. The conditions on which was constructed simulation of the browsing model are discussed in this section. These presumptions are: aesthetics is the most influential aspect in the
scanning activity (see first aesthetics impression), but it is gradually losing its magnitude (only to a certain degree - feeling on visual appearance usually persists) with user´s increasing interest in content, which can be expected with further browsing on the website
aesthetics, especially in a form of interaction aesthetics, is also significant during interaction activity, but its magnitude is again gradually decreasing (only to a certain degree)
aesthetics during actual reading or information retrieval is quite insignificant on stable level
usability is the most prominent aspect during the interaction activity and its share of influence is expected to be stable during all interactions
influence of usability in scanning activity is low at first (aesthetics dominates), but is gradually increasing, as the usability issues such as visual organization and navigation are becoming more apparent during scanning
participation of usability while actual reading is low but higher than of aesthetics, as organization and legibility are parts of usability aspect
quality of content is of course most significant during reading activity
quality of content in scanning and interaction activities is low at first but gradually increasing, as orientation on the website is already clearer for the user and visual impression is established, scanning is expected to become more content-oriented with more time spent on the website
Presented model and its development suggest, that influence of individual aspects and their participation on overall judgement is varying according to the time spent browsing on the website and distribution of performed activities in that time. It is expected, that with more time spent browsing the website, the overall judgement will be more influenced by information quality.
The aesthetics and usability aspects however are crucial for actual getting to the content. This usually corresponds with the real situation. Another study which was researching importance of quality dimensions to overall judgement also discovered that the most important component was content, then
usability and finally aesthetics (Hartmann et al., 2007).
4.3 Mode of Use Variations
The overall judgement as well as perception of usability and aesthetics are highly dependent on context (de Angeli, Sutcliffe and Hartmann, 2006). They are also influenced by the mode in which the user approaches the interface (van Schaik and Ling, 2009). Information retrieval is different than surfing. When looking for information, users are more focused and content is the driving force. When users surf, they are just browsing and clicking at what looks most interesting (Spool et al., 1998).
Mode of use would certainly influence the browsing model. It is expected that aesthetics would be more influential during surfing. In the goal mode could be more significant usability and information quality even during scanning.
5 CONCLUSIONS
This paper presented the model of user browsing behaviour on the website. Main user activities during browsing on the website were proposed, discussed and supported by related literature. Suggested activities were associated with three main aspects of the website, which were identified as aesthetics, usability and information quality. Associated in the sense that they are primarily influencing user actions and also success of his actions during the relevant activity.
Browsing model was designed on the basis of previous research´s conclusions and new considerations. Simulation of user browsing on the website was presented. Variations of the model according to mode of use were discussed.
More factors can alter course of the browsing simulation. Proposed browsing model dealt only with the first visit on the website in one browsing session. The influence of individual aspects would be different in case of repeated visits. The model also did not take into consideration various types of websites. This should be covered in future research as well as supported with results from user testing.
ACKNOWLEDGEMENTS
This work and the contribution were supported by: (1) project No. CZ.1.07/2.2.00/28.0327 Innovation
Sequential�Model�of�User�Browsing�on�Websites�-�Three�Activities�Defined:�Scanning,�Interaction�and�Reading
147

and support of doctoral study program (INDOP), financed from EU and Czech Republic funds; (2) project “Smart Solutions in Ubiquitous Computing Network Environments”, from the Grant Agency of Excellence, University of Hradec Kralove, Faculty of Informatics and Management, Czech Republic; (3) project “SP/2014/ - Smart Solutions for Ubiquitous Computing Environments” from FIM, University of Hradec Kralove.
REFERENCES
Bartuskova, A., Krejcar, O., 2013. Evaluation framework for user preference research implemented as web application. In Computational Collective Intelligence, Technologies and Applications, Lecture Notes in Computer Science, 537-548.
de Angeli, A., Sutcliffe, A., Hartmann, J., 2006. Interaction, usability and aesthetics: what influences users' preferences? In Proceedings of the 6th conference on Designing Interactive systems, University Park, PA, USA.
Dondio, P., Longo, L., Barrett, S., 2008. A translation mechanism for recommendations, In International Federation for Information Processing, Vol. 263, pp. 87-102.
Hartmann, J., Sutcliffe, A., de Angeli, A., 2007. Investigating attractiveness in web user interfaces. In Proceedings of the SIGCHI conference on human factors in computing systems, 396.
Hassenzahl, M., 2004. The interplay of beauty, goodness, and usability in interactive products. In Human–Computer Interaction, 19(4), 319–349.
Hornbæk, K., 2006. Current practice in measuring usability: Challenges to usability studies and research. In International Journal of Human-Computer Studies, 64 (2).
Choo, C. W., Detlor, B., & Turnbull, D., 2000. Information seeking on the Web: An integrated model of browsing and searching. Available from: http://firstmonday.org/issues/issue5_2/choo/index.html.
Krejcar, O., 2007. Benefits of building information system with wireless connected mobile device - PDPT Framework. In 1st IEEE International Conference on Portable Information Devices, IEEE Portable 2007, March 25-29, 2007, Orlando, USA. pp. 251-254. DOI 10.1109/PORTABLE.2007.57.
Krejcar, O., Jirka, J., Janckulik, D., 2011. Use of Mobile Phone as Intelligent Sensor for Sound Input Analysis and Sleep State Detection. In Sensors. vol. 11, Iss. 6, pp. 6037-6055. DOI 10.3390/s110606037.
Lee, S., Koubek, R. J., 2010. The effects of usability and web design attributes on user preference for e-commerce web sites. In Computers in Industry, 61 (4).
Lee, Y., Kozar, K. A., 2012. Understanding of website usability: Specifying and measuring constructs and their relationships. In Decision Support Systems, v.52 n.2.
Lindgaard, G., Fernandes, G., Dudek, C., Brown, J., 2006. Attention web designers: you have 50 milliseconds to make a good impression! In Behaviour and Information Technology 25, 115–126.
Longo, L., Barrett, S., Dondio, P., 2009. TOWARD SOCIAL SEARCH From Explicit to Implicit Collaboration to Predict Users' Interests, In proceedings of 5th International Conference on Web Information Systems and Technologies,pp. 693-696.
Lynch, P. J., Horton, S. (2001). Web Style Guidelines (2nd ed.). Yale University Press.
McCracken, D. D., Wolfe, R. J., 2004. User-centered Website Development: A Human-Computer Interaction Approach. Pearson Prentice Hall Inc., Upper Saddle River.
Morkes, J., & Nielsen, J., 1997. Concise, SCANNABLE, and Objective: How to Write for the Web. Available from: http://www.useit.com/alertbox/9710a.html and http://www.useit.com/papers/webwriting/writing.html.
Overbeeke, K. C. J., & Wensveen, S., 2003. From perception to experience, from a�ordances to irresistibles. In Proceedings of the 2003 international conference on designing pleasurable products and interfaces (pp. 92 e 97). Pittsburgh, PA, USA: ACM.
Penhaker, M., Jeziorska R., Novak, V., 2013. Computer Based Psychometric Testing and Well Being Software for Sleep Depravations Analysis. In Studies in Computational Intelligence, vol. 457. pp. 207-216.
Robins, D., Holmes, J., 2008. Aesthetics and credibility in web site design. In Information Processing & Management, 44 (1), 386-399.
Schenkman, B., Jönsson, F. , 2000. Aesthetics and preferences of web pages. In Behaviour and Information Technology, 19(5), 367–377.
Spool, J., Scanlon, T., Schroeder, W., Snyder, C., DeAngelo, T., 1998. Web Site Usability: A Designer's Guide. Morgan Kaufmann Publishers, San Francisco.
Tuch, A. N., Roth, S. P., Hornbæk, K., Opwis, K., Bargas-Avila, J. A., 2012. Is beautiful really usable? Toward understanding the relation between usability, aesthetics, and affect in HCI. In Computers in Human Behavior, 28(5), 1596-1607.
van der Heijden, H., 2003. Factors influencing the usage of websites: the case of a generic portal in the Netherlands. In Information & Management 40 (6).
van Schaik, P., Ling, J., 2009. The role of context in perceptions of the aesthetics of web pages over time. In International Journal of Human–Computer Studies, 67(1).
Xenakis, I., Arnellos, A., 2013. The relation between interaction aesthetics and affordances. In Design Studies, 34 (1), 57-73.
WEBIST�2014�-�International�Conference�on�Web�Information�Systems�and�Technologies
148
Automated Usability Testing for Mobile Applications
Wolfgang Kluth, Karl-Heinz Krempels and Christian SamselInformation Systems & Databases, RWTH Aachen University, Aachen, Germany
fkluth, krempels, [email protected]
Keywords: Usability Testing, Usability Evaluation, HCI, Automated Testing, Mobile.
Abstract: In this paper we discuss the design and implementation of an automated usability evaluation method for iOSapplications. In contrast to common usability testing methods, it is not explicitly necessary to involve an expertor subjects. These circumstances reduce costs, time and personnel expenditures. Professionals are replacedby the automation tool while test participants are exchanged with consumers of the launched application.Interactions of users are captured via a fully automated capturing framework which creates a record of userinteractions for each session and sends them to a central server. A usability problem is defined as a sequence ofinteractions and pattern recognition specified by interaction design patterns is applied to find these problems.Nevertheless, it falls back to the user input for accurate results. Similar to the problem, the solution of theproblem is based on the HCI design pattern. An evaluation shows the functionality of our approach comparedto a traditional usability evaluation method.
1 INTRODUCTION
In a time when more and more consumers use tech-nical devices to manage their everyday life, usabilityin software is important. A user friendly handling ofsmart phones, personal computers and smart televi-sions depends on the interface between human andcomputer. The large number of mobile applicationsin the consumer market leads to increased efforts toimprove the usability for mobile devices. Addition-ally, better and faster hardware leaves mobile devicesmore capabilities for realizing complex software, butthe device and display is still of small size. Thus, it isa challenge to develop appropriate software with gooduser experience.
In human-computer interaction (HCI) one goal ismeasuring and improving the usability of soft- andhardware. Different usability testing methods havebeen developed to estimate the quality of user inter-faces and to derive solutions for usability improve-ments. While evaluations with users (e.g., cogni-tive walkthrough and heuristic evaluation) and with-out users (e.g., user observation and think aloud) arewidely used, automated usability testing (AUT) is stillan untouched area, especially in the method of mobiledevices. With and without users, usability testing re-quires a lot of development time, money and HCI ex-perts. These are reasons and excuses to avoid the in-tegration in software development processes. One so-
lution could be the automation of usability tests withthe objective of reducing the efforts of software de-velopers to make usability evaluation more attractive.
The focus of this work is on mobile applications,which, in comparison to personal computers, have ad-ditional usability problems due to their mobile context(i.e., in which situation the device is used) (Schmidt,2000), size and computing power. Nevertheless, it isalso a challenge to find appropriate usability testingmethods to evaluate mobile applications (Zhang andAdipat, 2005). The development of the mobile deviceand app market shows the importance of an automatedusability evaluation tool.
Our main objective for this paper is the develop-ment of a fully automated tool for testing usabilityproblems of mobile applications in the post-launchphase implemented for Apple’s1 iOS platform. Itshould replace the current evaluation technique thinkaloud which is typical for smart phones.
This paper is structured in six chapters. Section 2gives an overview of current approaches in AUT. Sec-tion 3 and Section 4 describe the theoretical idea andimplementation. At the end, in Section 5 the imple-mentation is tested with a bike sharing applicationprototype and Section 6 reviews this work with anoutlook to future work.
1http://www.apple.com
149

2 RELATED WORK
In (Ivory and Hearst, 2001) AUT is separated in fivemethod classes: testing, inspection, questionnaire,analytic models, and simulation. The approach de-scribed in this paper concentrates on the class of test-ing with real users which are involved to evaluate themobile application. However, we limit the amount ofrelated work in this section to mobile platforms.
According to (Ivory and Hearst, 2001), AUT hasfour different steps of automation: nonautomatic, au-tomatic capture, automatic analysis, and automaticcritic. Each automation step is consecutive to its pre-decessor. Furthermore, the effort of AUT is estimatedformally (explicit tasks for participants) and infor-mally (participants use target system without any fur-ther tasks).
2.1 Capturing
In (Lettner and Holzmann, 2012a) and (Lettner andHolzmann, 2012b), Lettner and Holzmann presenttheir Evaluation Framework for capturing user in-teractions for the Android2 environment. Theapproach works with aspect-oriented programming(AOP) which adds the capture functionality auto-mated within the Android application. With AOP thecompiler includes the important logger methods di-rectly into the application’s lifecycle.
Another capturing approach is presented in (Weissand Zduniak, 2007) where a capture and replay frame-work for Java2MicroEdition (J2ME) environment hasbeen developed. A proxy was used in combinationwith code injection (modify event methods) to inter-cept graphical user interface (GUI) events. The toolcreates a log file, which can be read, modified by thedeveloper, and replayed on a simulator.
2.2 Analysis
Many approaches for websites and desktop computersexist which automatically capture the interactions ofthe users to analyze them (Ivory and Hearst, 2001).Nevertheless, their functionality is reduced to thevisualization of interaction processes and statisticalanalyses of e.g., resting time in views, number ofclicks, and hyperlink selections.
One of the rare AUT tools for analysis of mobileapplications is EvaHelper (Balagtas-Fernandez andHussmann, 2009). It is implemented in a four phasemodel: preparation, collect, extraction, and analy-sis. Preparation and collect are phases of the auto-mated capturing process and in contrast to approaches
2http://www.android.com
in Section 2.1 it needs a manual implementation of thelogger methods. Nonetheless, in extraction the logis converted into GraphML3, a machine readable for-mat. This format makes it possible for the developerto apply explicit queries on this graph for analysis.
2.3 Critic
In (Albraheem and Alnuem, 2012) a survey of AUTapproaches shows that only one approach existswhich implements automatic critic for mobile appli-cations. With HUI Analyzer (Au et al., 2008)(Bakerand Au, 2008) Au and Baker developed a frame-work and an implementation for capturing and ana-lyzing user interactions for applications of the Mi-crosoft .NET Compact Framework 2.0 environment.Automatic critic is implemented in this project in anautomatic review of static GUI elements on the basisof guidelines. However, with HUI Analyzer it is pos-sible to compare actual interaction data (e.g., clicks,text input, and list selections) with expected interac-tion data (i.e., series of interactions predefined by theevaluator). With this piece of information the evalu-ator can check if the user successfully finished a taskor failed.
In the field of commercial AUT tools, remotere-sear.ch4 gives a good overview of existing prod-ucts. Two examples for capture and replay areMorae5 and Silverback2.06. Furthermore, Localyt-ics7, Heatmaps8, and Google Analytics9 support cap-ture and automated analysis functionality. They in-clude statistics and heatmap visualizations to repre-sent the collection of interaction data. A disadvantageof all tools is the manual integration of capture meth-ods by the developer. None of them supports auto-matic critic.
3 APPROACH
Section 2 gives a good overview of existing ap-proaches and makes clear that no approach existswhich uses user interaction data to automatically an-alyze and critique the usability of mobile applica-tions. In this context, one of the major objectives inthis paper is an approach which fulfills this require-ment. According to (Baharuddin et al., 2013), the
3http://graphml.graphdrawing.org/4http://remoteresear.ch/tools5http://www.techsmith.com/morae.html6http://silverbackapp.com7http://localytics.com8http://heatmaps.io9http://www.google.com/analytics/mobile
WEBIST�2014�-�International�Conference�on�Web�Information�Systems�and�Technologies
150

1. PhasePrepare
2. PhaseCapture
3. PhaseAnalyse
4. PhaseCiritique
- Design HCI design patterns- Integrate capture framework
- Create/transfer capture log- Collect/sort interactions
- Find problem instances
- Rate problems- Provide solutions
- Mark problems in interaction graph
- Create interaction graph
Figure 1: From (Balagtas-Fernandez and Hussmann, 2009)adapted four-phase model for fully AUT tool.
most common approach to evaluate mobile applica-tions is think aloud (the user is observed while he isusing the application; he talks about what he is ac-tually doing and thinking). What is the method ofthink aloud and how can machines be used to sim-ulate this process to generate similar results? Theimportant steps of this evaluation method is to rec-ognize misuse, usability problems, different and nonpredicted behavior. The findings are always differentbecause of where they occur. Nevertheless, most ofthe problems have a significant pattern. Our goal is todetermine which problem patterns exist and how theycan be found automatically. For this purpose, HCIdesign patterns (best practices to solve a recurring us-ability problem)(Borchers, 2000) help to define inter-action problems in a usual matter to reuse them forautomated analysis and critic. The four-phase modelfrom (Balagtas-Fernandez and Hussmann, 2009) hasbeen adapted with the difference that the phase of ex-traction and analysis are taken together and a phaseof critique has been inserted. The phase of critiqueallows the developer to get feedback in form of a sug-gestion for improvement for analyzed usability prob-lems. The purpose of each phase is explained as fol-lows:
1. Preparation Phase. To prepare his project, thedeveloper integrates the AUT capture frameworkinto his application. In addition, he needs HCIdesign patterns to apply them to the captured in-teractions. He can reuse patterns from an openplatform or he can develop his own patterns.
2. Capture Phase. Each mobile device will auto-matically generate logs with the user’s interactiondata. When the session ends, the application willsend the log to a central server where it is pro-cessed.
3. Analysis Phase. Pattern recognition definition,built from the problem specifications of the HCIdesign patterns, are applied to each new transmit-ted log to find and mark related problems.
4. Critique Phase. With the problem HCI designpattern relation a solution in form of best practicesfor each problem is given. With a higher detaildegree of problem specification, the precision ofthe solution increases.
In this paper a lightweight HCI design pattern defini-tion is used. A pattern consists of a name, a weight-ing, a problem specification, and a solution. Accord-ing to the Usability Problem Taxonomy from (Keenanet al., 1999), all considered problems are within thetask-mapping category consiting of interaction, navi-gation, and functionality. We assume that especiallythis kind of usability problems can be found and im-proved with our approach. The solution to the usabil-ity problem, an improvement of the usability, is givenin form of best practices based on the HCI design pat-tern. The weighting scale is based on Nielsen’s sever-ity rating (Nielsen, 1995).
Hence, we have designed four HCI design pat-terns presented in Table 1 which satisfy the declaredattributes.
The capture component has the purpose of collect-ing user interactions directly on the mobile device ofthe user (see Figure 4). An interaction consists ofseven attributes: startview, endview, called method,user input-type, timestamp, touch position, and acti-vated UI-element. A log (group of user interactions)is transferred to a server when the user session is over(i.e., when the application is closed). The procedureof capturing is automated and similar to (Lettner andHolzmann, 2012b) and (Weiss and Zduniak, 2007).
A B A C DE F E F E
D C A B A
A B A C DE F E F E
D C A B A
A B AE F E
A B APattern Recognizition
Definition
Log of Interactions Log with markedProblem Instances
[ABA, EFE, ABA]Problem Instances
ABA EFEProblems
101011100110101011101110010110000
Figure 2: Analyze process with pattern recognition.
In our perspective a usability problem is a se-quence of specific user interactions which is definedin the problem specification of a HCI design pattern.E.g., for the pattern Fitts’s Law all sequences are ob-served where the user touches repeatedly points nextto a button until the button itself is pressed. For this
Automated�Usability�Testing�for�Mobile�Applications
151

Table 1: Four HCI design patterns developed for AUT tool.
Name Problem Specification Solution Weighting Reference
Fitts’s Law User misses UI-Element (e.g.,button) several times
Make UI-Element biggerand/or move to center
Major usabilityproblem (3)
(Fitts, 1992)& (Henze andBoll, 2011)
Silent Misentry User repeatedly touches UI-elements without functionality(e.g., imageview)
Analyze pressed UI-elementand figure out which function-ality the user intended; e.g.,imageview: image-zoom; addfunctionality or make clearfunction is missing
Cosmetic prob-lem only (1)
-
NavigationalBurden
User switches back and forthbetween two views multipletimes (e.g., master-/detailview)
User is looking for some in-formation which is presented indetailview; needs the way overthe masterview to open a newdetailview
Minor usabilityproblem (2)
(Ahmad et al.,2006)
AccidentalTouch
User touches the screen acci-dentally and and activates viewchange; he immediately re-vokes input
Check accidentally touched UI-element; move/resize/remove it
Cosmetic prob-lem only (1)
(Matero andColley, 2012)
purpose, we use pattern recognition with the user in-teraction log as input word and the sequence we arelooking for as search word (s. Figure 2). Further-more, it is important to mention that the recognizerlooks for dynamic keywords, because in the last ex-ample, the views, and the button can change, but it isstill a sequence of the same problem and just anotherinstance. As a consequence, we defined an advancedregular expression with dynamic behavior which gen-eralizes the sequences for each pattern. To recognizethe usability problems in the pool of interactions, webuilt from the problem specification of each HCI de-sign pattern a pattern recognition definition based ona regular expression (RE):� Fitts’s Law:(A+B);A := (a;e;a);B := (a;x;b)
� Navigational Burden:(AB)+;A := (a;x;b);B := (b;z;a)
� Accidental Touch:(AB);A := (a;x;b);B := (b;z;a);�t(A;B)< t0
� Silent Misentry:(A+);A := (a;e;a)
For the sake of simplicity, we reduced the complexityof the regular expression with a simpler definition ofinteractions. The interaction A in this case consists ofa tuple (startview� executedmethod� endview) ande represents no-action. The RE (A+B) describes asearch pattern which starts at least with one interac-tion A and ends with one B. Additional comparisons,e.g., timespan and distance, have to be done manually.
Each problem instance is part of a problem andeach problem is derived from a HCI design pattern
which has a solution for it. The accuracy of a solutiondepends on the accuracy of a problem specification.
For a better visual communication with the devel-oper, a finite state-machine has been designed whereall interactions are represented. Hence, nodes standfor views and edges for user-input with executedmethod (methodname) or no method (e). In addition,each problem instance is a sequence of interactionsand can be marked in the graph to indicate in whichstate a problem occurs for a better understanding (s.Figure 3). As a result, the developer knows immedi-ately in which states a usability problem occurs, thekind of usability problem, and how it could be solved.
Menu BikeOverview
BikeDetails
ε ε
check()
rent()
showBikeDetails()
back()
showOverview()
Figure 3: Example for an interaction graph with markedNavigational Burden problem.
Figure 4 represents the composition of all phases inone architecture. There are two separated workers,the capturing framework on the client’s mobile phoneand the central computer unit which evaluates the col-lected information. Furthermore, the server presentsthe results of the evaluation in form of a dashboard tothe developer.
WEBIST�2014�-�International�Conference�on�Web�Information�Systems�and�Technologies
152

Smart PhonesLog
GeneratesInteraction Log
User
Management Backend
Pattern Recognition Module
Database
UsabiliyProblems
Logs
Developer
10101001010101010101010100010
Dashboard
Figure 4: Architecture of the AUT tool.
4 IMPLEMENTATION
Figure 5 shows an overview of all used componentsfor the implementation of the AUT tool. The captureframework has been implemented for Apple’s iOS7environment, uses method swizzling10 and a gesturerecognizer (Apple, 2013) to identify user interactions.
iOS application Django-Server
SQLite3
HTTP-POST
CaptureFramework
MethodSwizzling
Gesture Recognizer Bootstrap Viz.js
(GraphViz)
Pattern Recognition
Module
Regular ExpressionsPython
Figure 5: Implementation of the AUT tool.
The log of user interactions is sent via an HTTP-POST to a Python Django 1.511 webserver. Each cap-ture log is processed in three steps:
1. Loading the interactions into a database
2. Searching for problem instances with patternrecognition modules in collection of interactions
3. Mapping problem instances into suitable problemcategories related to their HCI design pattern
The visualization of the information is dynamicallygenerated from database and presented on a dash-
10http://cocoadev.com/MethodSwizzling11https://www.djangoproject.com/
board for the evaluator/developer. The interactiongraph is visualized with the help of Viz.js12 (aGraphViz13 implementation in JavaScript) and usabil-ity problems are marked in red.
4.1 Capture Framework
For the implementation of the capture framework foriOS7 we had to define the interaction attributes andthe technique to gather them. Table 2 shows anoverview of the type, name, and technique of an in-teraction attribute. In our context, an advantage of theiOS environment is the Objective-C runtime whichworks with messages instead of direct method callswhen executing a specific method in the application.
Table 2: Interaction Attributes with Type and used Tech-nique.
Type Name Technique
NSNumber* id GRBOOL hasMethod MS
NSString* methodName MSNSString* viewControllerTitle MSNSString* viewControllerClass MS
NSTimeINterval timestamp GRCGPoint position GR
NSString* uiElement GRGR = Gesture Recognizer; MS = Method Swizzling
With method swizzling the target method is replacedby another method. This procedure allows us to ex-tend methods of private classes which are responsiblefor the lifecycle of a view controller and the execu-tion of events with capture functionality (s. Table 3).For this purpose, categories (Objective-C; extend ex-isting classes with methods) are used to add a newmethod with capture functionality to the private classand to call the intended method afterwards. On theother hand, a gesture recognizer (UIGestureRecog-nizer) which automatically identifies a user tap (a sin-gle touch event) is added to the root view controllerof an application (i.e., foreground view in size of thescreen). This allows to recognize when a touch be-gins and ends in all views. In each start/end callback,the touch event (instance of UIEvent) is included. Ta-ble 4 shows the attributes which are set in the delegatemethods touchesBegan and touchesEnded.
Single interaction objects are collected in an arraywhich is sent to the backend with a standard HTTP-POST in JSON format when the application is sent tobackground.
12https://github.com/mdaines/viz.js13http://www.graphviz.org/
Automated�Usability�Testing�for�Mobile�Applications
153

Table 3: Overview of extended private classes.
Category Method Attribute
NSObject+Swizzle.h
respondsToSelector
hasMethod
UIApplication+Swizzle.h
sendAction methodName
UIViewController+Swizzle.h
viewDidAppear viewController-Title
UIViewController+Swizzle.h
viewDidAppear viewController-Class
Table 4: Attributes set in Gesture Recognizer DelegateMethods.
Delegate Method Attribute
touchesBegan init new interactiontouchesBegan idtouchesEnded positiontouchesEnded timestamptouchesEnded uiElement
4.2 Pattern Recognition Module
Pattern recognition is implemented in Python14 andhas the purpose of finding problem instances in listinteractions. Each module implements the methodfind_problems_for_pattern(interactions)which gets a list of interactions as input and returnsa list of problem instances. The detailed implemen-tation of the module is provided by the developer.He can use regular expressions, python code or othertools, to describe the target pattern. We designed twoexample patterns with RE and two programmatically.For the Fitts’s Law module interactions are convertedinto string tuples (start-view, executed method,end-view) and the following RE is applied:(n[(?P<view>nw+), no action, (?P=view)n],)+(n[(?P=view), nw+:?, nw+n])
4.3 Management Backend
The backend manages all incoming data. The back-end tasks are maintain database, persist user interac-tions, integration of pattern recognition modules, andvisualize results in an interaction graph.
4.4 Data Visualization
The database stores the interactions of all users. Tovisualize this information in an interaction graph, theattributes of all interactions and problems are reducedto start-view, executed method, and end-view. This
14http://www.python.org/
makes it possible to remove doubled interactions. Af-terwards, the structure of the graph is generated as aDOT15 defined string which can be embedded into thedashboard for the developer. On client side, the Viz.jsframework, a GraphViz implementation in JavaScript,transforms the DOT definition in a perceptible inter-action graph (s. Figure 6). Recognized usability prob-lems are marked as red.
5 EVALUATION
We compare and evaluate the traditional user observ-ing evaluation method in contrast to our AUT toolwith a bike sharing prototype application. The appli-cation is designed to find problems defined in the fourHCI design patterns in Section 3. The flowchart inFigure 7 shows the views and connections of the ap-plication. The image with the title “Fahrrad-Verleih”(1st view) provokes a Silent Misentry, the lent statusin the detailview (3rd and 4th view) causes Naviga-tional Burden and the small checkbox in the detail-view engenders Fitts’s Law. The application is devel-oped for iOS7 and the capture framework is integratedand initialized. While the AUT tool generates interac-tion logs automatically, we had to design a question-naire for the User Observing method which takes careof the user’s behavior considering the usability prob-lems in the four HCI design patterns. Eight partici-pants aged between 23 and 28 years, two researchersand six computer science students attend the evalua-tion. All of them has experience with smart phones,half with Android and half with iOS.
The participants got the target to rent a bike withthis application. The task specifies a context for thisevaluation, but it is not necessary for the AUT tool.In our eyes it is still an informal test in the lab andthe user can use the app as a normal bike sharing app.The results in Table 5 show that the AUT tool and theclassical user observing identify all seeded usabilityproblems. In contrast to an automated capturing solu-tion, we had the feeling that user observing makes itdifficult to capture all user inputs on a touch screen in-terface. Getting a clear analysis of the user observingdata was tedious, because we manually sorted it intothe classification of interaction design patterns. How-ever, the AUT tool gave us an overview of all prob-lems for each pattern with an appropriate interactiongraph.
15http://www.graphviz.org/content/dot-language
WEBIST�2014�-�International�Conference�on�Web�Information�Systems�and�Technologies
154

Figure 6: Screenshot of the dashboard visualization for Navigational Burden.
Figure 7: Bike sharing application for iOS7 prepared with usability problems.
Table 5: Results of Bike Sharing App evaluation with UserObservation and AUT tool.
HCI design pattern A B C
Fitts’s Law 2 9 26Accidental Touch 5 32 -Silent Misentry 1 4 11Navigational Burden 2 6 17A = number of problems (AUT tool)
B = number of problem instances (AUT tool)C = number of problems (user observing)
6 CONCLUSIONS AND FUTUREWORK
Today, usability is one of the major topics in soft-ware development and the relevance for mobile ap-plications is still increasing. Automatic testing, e.g.,unit tests, shows that it has a huge influence on thesoftware process and quality. With automated usabil-ity testing (AUT) we believe that usability testing will
become a firm part of the software development pro-cess.
The objective was to develop an automated usabil-ity testing tool for iOS applications to get a cheaper,faster and simpler usability evaluation process. Wefound no existing approaches which fulfill the crite-ria of automatic critic for mobile applications whichtakes the responsibility of usability decisions from thedeveloper to a tool.
For this purpose we modified the four phase modelfrom (Balagtas-Fernandez and Hussmann, 2009) andextended it with a phase of automatic critic. Usabilityproblems are recognized by pattern recognition whichworks with definitions from four exemplary HCI de-sign patterns. We implemented a fully automated cap-ture framework for iOS applications and a backendfor data management, analysis and representation.
We evaluated the AUT tool using a prototype bikesharing application and compared it to a classic eval-uation method, user observing. The results show thatthe AUT tool is able to find all usability problemswhich are described in the interaction design patterns.
Automated�Usability�Testing�for�Mobile�Applications
155

In contrast to user observing, working with the AUTtool was less complicated and time-consuming for thedeveloper, which, for us, is an evidence for success.
Future Work
In the next version of the AUT tool, we are goingto improve the visualization of the graph by show-ing a screenshot of the current view as node and theedge will begin directly from the point where the usertouched (similar to Figure 7). In addition, we will cre-ate more HCI design patterns and a tool which makesthe design process much simpler. We also plan to in-tegrate existing fully automated capture frameworksfor other mobile platforms (s. Section 2.1).
ACKNOWLEDGEMENTS
We would like to thank our former colleague PaulHeiniz for his support in the early phase of thisproject. This work was supported by the GermanFederal Ministry of Economics and Technology16:(Grant 01ME12052 econnect Germany, Grant01ME12136 Mobility Broker).
REFERENCES
Ahmad, R., Li, Z., and Azam, F. (2006). Measuring nav-igational burden. In Software Engineering Research,Management and Applications, 2006. Fourth Interna-tional Conference on, pages 307–314.
Albraheem, L. and Alnuem, M. (2012). Automated Usabil-ity Testing : A Literature Review and an Evaluation.
Apple (2013). iOS Developer Library: UIGestureRecog-nizer Class Reference.
Au, F., Baker, S., Warren, I., and Dobbie, G. (2008). Au-tomated Usability Testing Framework. volume 76,pages 55–64.
Baharuddin, R., Singh, D., and Razali, R. (2013). UsabilityDimensions for Mobile Applications-A Review. Re-search Journal of Applied Sciences, Engineering andTechnology, 5(6):2225–2231.
Baker, S. and Au, F. (2008). Automated Usability TestingUsing HUI Analyzer. pages 579–588.
Balagtas-Fernandez, F. and Hussmann, H. (2009). AMethodology and Framework to Simplify UsabilityAnalysis of Mobile Applications. pages 520–524.IEEE.
Borchers, J. O. (2000). A pattern approach to interactiondesign. pages 369–378.
16Bundesministerium fur Wirtschaft und Technologie(BMWi) http://www.bmwi.de/
Fitts, P. M. (1992). The Information Capacity of the HumanMotor System in Controlling the Amplitude of Move-ment. Journal of Experimental Psychology: General,121(3):262–9.
Henze, N. and Boll, S. (2011). It Does Not Fitts MyData! Analysing Large Amounts of Mobile TouchData Niels. INTERACT 2011, Part IV, pages 564–567.
Ivory, M. and Hearst, M. (2001). The state of the art in au-tomating usability evaluation of user interfaces. ACMComputing Surveys, 33(4):470–516.
Keenan, S. L., Hartson, H. R., Kafura, D. G., and Schulman,R. S. (1999). The Usability Problem Taxonomy: AFramework for Classification and Analysis. EmpiricalSoftware Engineering, 4:71–104.
Lettner, F. and Holzmann, C. (2012a). Sensing mobilephone interaction in the field. In Pervasive Com-puting and Communications Workshops (PERCOMWorkshops), 2012 IEEE International Conference on,pages 877–882.
Lettner, F. and Holzmann, C. (2012b). Usability evaluationframework: Automated interface analysis for androidapplications. In Proceedings of the 13th InternationalConference on Computer Aided Systems Theory - Vol-ume Part II, EUROCAST’11, pages 560–567, Berlin,Heidelberg. Springer-Verlag.
Matero, J. and Colley, A. (2012). Identifying unintentionaltouches on handheld touch screen devices. pages 506–509.
Nielsen, J. (1995). Severity Ratings for Usability Problems.Schmidt, A. (2000). Implicit human computer interaction
through context. Personal and Ubiquitous Computing,4(2-3):191–199.
Weiss, D. and Zduniak, M. (2007). Automated integrationtests for mobile applications in java 2 micro edition.pages 478–487.
Zhang, D. and Adipat, B. (2005). Challenges, Method-ologies, and Issues in the Usability Testing of Mo-bile Applications. International Journal of Human-Computer, pages 293–308.
WEBIST�2014�-�International�Conference�on�Web�Information�Systems�and�Technologies
156

WEB INTELLIGENCE


FULL PAPERS

The GENIE ProjectA Semantic Pipeline for Automatic Document Categorisation
Angel L. Garrido, Maria G. Buey, Sandra Escudero, Alvaro Peiro, Sergio Ilarri and Eduardo MenaIIS Department, University of Zaragoza, Zaragoza, Spain
fgarrido, mgbuey, sandra.escudero, peiro, silarri, [email protected]
Keywords: Knowledge Management, Text Mining, Ontologies, Linguistics.
Abstract: Automatic text categorisation systems is a type of software that every day it is receiving more interest, due notonly to its use in documentaries environments but also to its possible application to tag properly documentson the Web. Many options have been proposed to face this subject using statistical approaches, natural lan-guage processing tools, ontologies and lexical databases. Nevertheless, there have been no too many empiricalevaluations comparing the influence of the different tools used to solve these problems, particularly in a mul-tilingual environment. In this paper we propose a multi-language rule-based pipeline system for automaticdocument categorisation and we compare empirically the results of applying techniques that rely on statisticsand supervised learning with the results of applying the same techniques but with the support of smarter toolsbased on language semantics and ontologies, using for this purpose several corpora of documents. GENIE isbeing applied to real environments, which shows the potential of the proposal.
1 INTRODUCTION
In almost any public or private organization that man-ages a considerable amount of information, activi-ties related to text categorisation and document tag-ging can be found. To do this job, large organiza-tions have documentation departments. However, thebig amount of information in text format that orga-nizations usually accumulate cannot be properly pro-cessed and documented by these departments. Be-sides, the manual labor of labeling carried out bythese people is subject to errors due to the subjectivityof the individuals. That is why a tool that automatescategorisation tasks would be very useful, and wouldhelp to improve the quality of searches that are per-formed later over the data.
To perform these tasks, software based on statis-tics and the frequency of use of words can beused, and it is also very common to use machinelearning systems (Sebastiani, 2002). However, wethink that other kinds of tools capable of dealingwith aspects related to Natural Language Processing(NLP) (Smeaton, 1999) are also necessary to comple-ment and enhance the results provided by these afore-mentioned techniques.
Moreover, to perform any task related to the pro-cessing of text documents, it is highly recommendedto own the know-how of the organization, so it is
highly advisable to manage ontologies (Gruber et al.,1993) and semantic tools such as reasoners (Mishraand Kumar, 2011) to make knowledge explicit andreason over it, respectively. Furthermore, it is verycommon for organizations to have their own catalogof labels, known as thesaurus (Gilchrist, 2003), so itis important that the system is able to obtain not onlykeywords from the text, but also know how to relatethem to the set of thesaurus descriptors.
Furthermore, this same issue is also found in theWeb where much of the information is in text for-mat. Providing tools capable of automatically tag-ging web pages is something very helpful in orderto improve the search and retrieval tasks of informa-tion using search engines, and today is still an openproblem (Atkinson and Van der Goot, 2009; Chau andYeh, 2004) due (among others) to the existing seman-tic and linguistic difficulties to process.
Our purpose is to bring together these techniquesinto an architecture that enables the automatic classi-fication of texts, with the particular feature that it ex-ploits different semantic methods, which is added asa new element in text categorization to support typ-ical techniques that rely on statistics and supervisedlearning. Although there are some researches in textcategorization that takes into account Spanish textsas examples, there are no tools especially focused onthe Spanish language. Moreover, the proposed sys-
161
tem has been implemented to be open to allow thepossibility to add the analysis of other languages, likeEnglish, French, or Portuguese.
Other important characteristics of the architec-ture is that it has been proposed as a pipeline sys-tem and it has been implemented with different mod-ules. We consider these as important features becausea pipeline system gives us the chance to control theresults at each phase of the process and also the struc-ture with different modules allows us to easily up-grade its individual components. For example, ge-ographic or lexical databases change over time, andour modular arthitecture easily acommodates thesechanges.
The fact that the system is implemented in differ-ent modules is also interesting because it is ideal whenperforming the analysis of a text. Sometimes, we maywant not to have to use all the modules that make upthe architecture to achieve a desired result. For exam-ple, we may want to extract only statistical informa-tion from the words present in a text, but nothing re-lated about their semantics. Also, it is possible that weneed to change the order of the modules a text passesthrough depending on the type of analysis of the textwe want to perform. For these reasons it is impor-tant to consider a modular architecture: it makes thesystem easy to use and it facilitates improving it overtime.This paper provides two main contributions:� Firstly, we present a tool called GENIE, whose
general architecture is valid for text categorisationtasks in any language. This system has been in-stalled and tested in several real environments us-ing different datasets. The set-up of our algorithmis rule-based and we use for inference the docu-ment’s features as well as the linguistic content ofthe text and its meaning.
� Secondly, we experimentally quantify the influ-ence of using linguistic and semantic tools whenperforming the automatic classification, workingon a real case with Spanish texts previously classi-fied by a professional documentation department.The rest of this paper is structured as follows. Sec-
tion 2 explains the general architecture of the pro-posed categorisation system. Section 3 discusses theresults of our experiments with real data. Section 4analyzes other related works. Finally, Section 5 pro-vides our conclusions and future work.
2 PROPOSED ARCHITECTURE
In this section, we explain the general architecture ofthe proposed system as well as and the corresponding
working methodology. The system relies on the ex-istence of several resources. First, we will describethese resources, and then we will explain in detail theclassification process (see Figure 1).
2.1 Resources
Regarding resources, we have to consider both staticdata repositories and software tools:
� Thesaurus. A thesaurus is a list of words anda set of relations among them, used to classifyitems (Gilchrist, 2003). We use its elements asthe set of tags that must be used to categorize theset of documents. Examples of thesaurus entriesare words like HEALTH, ACCIDENT, FOOT-BALL, BASKETBALL, REALMADRID, CIN-EMA, JACK NICHOLSON, THEATER, etc. Theterms can be related. For example, FOOTBALLand BASKETBALL could depend hierarchicallyon SPORTS. Each document may take a variablenumber of terms in the thesaurus during the cate-gorisation process.
� Gazetter. A gazetteer is a geographic directorycontaining information about places and placenames (Goodchild and Hill, 2008). In our system,it is used to identify geographic features.
� Morphological Analyzer. It is an NLP tool whosemission is the identification, analysis and descrip-tion of the structure of a set of given linguisticunits. This analyzer consists of a set of differ-ent analysis libraries, which can be configuredand used depending on the working language, anda custom middleware architecture which aims tostore all the different analysis results in structuresthat represent the desired linguistic units, such aswords (with their morphological and lexical in-formation), sentences (with their syntax and de-pendency trees) and texts. With this approach wecan provide the same entities to the other modulesthat work with NLP, resulting in an architecturethat can work with multiple analysis tools and lan-guages.
� Lexical Database. A lexical database is a lexi-cal resource which groups words into sets of syn-onyms called synsets, includes semantic relationsamong them, and provides definitions. Examplescould be WordNet (Miller, 1995) and Euroword-Net (Vossen, 1998).
� Stop Word List. This is a list of frequent wordsthat do not contain relevant semantic informa-tion (Wilbur and Sirotkin, 1992). In this set wemay include the following types of words: arti-cles, conjunctions, numbers, etc.
WEBIST�2014�-�International�Conference�on�Web�Information�Systems�and�Technologies
162

Figure 1: General pipeline of GENIE, the proposed text categorisation system.
� Knowledge Base. This refers to the explicit repre-sentation of knowledge related to the topics cov-ered in the documents that have to be catalogued.As a tool for knowledge representation in a soft-ware system, we use ontologies. An ontology is aformal and explicit specification of a shared con-ceptualization (Gruber et al., 1993) that providesa vocabulary of classes and relations to describea particular area, supporting automatic inferencesby using a reasoner (Mishra and Kumar, 2011).The idea is to represent in these ontologies theconcepts that could help to label a document in agiven context, and to populate the ontologies withas many instances as possible.
� Statistical Information. This consists of a set offiles with information about the use frequency ofeach word, related to the attributes of the text andto the set of elements in the thesaurus. For ex-ample: the word “ONU” appears more frequentlyin documents of type “International” and it is re-lated with the descriptor INTERNAT in a the-saurus used in the documentation department of anewspaper we have worked with. These frequen-cies allow us to estimate if a given text can be cate-gorized with a particular element of the thesaurus.
� Relationships Table. This table relates items in theGazetteer and knowledge base concepts with the-saurus elements. It may be necessary in an organi-zation because the concepts stored in the seman-tic resources available may not match the labelsin the thesaurus that must be considered for clas-sification. The construction of this table could bemanual or automatic, using any machine learningmethod.
As we will show in the experimental evaluation,the use of some resources is optional, leading to dif-
ferent results in terms of the expected performanceof the system. This system could be used with dif-ferent languages by changing the language-dependentresources, i.e. the Gazetteer, the NLP tool, the lexicaldatabase, and the stop word list.
2.2 Process Pipeline
We have used a pipeline scheme with separatedstages. Each of the stages is associated with only onetype of process and they communicate between them-selves through different files. Although it is a pipelinesystem, the process can be configured so that each ofthe tasks can be activated or deactivated depending onwhether we want the text document to go through cer-tain phases or not. For example, we may want to usethe pipeline without having activated the Geographi-cal Classifier. This choice has three purposes:
1. The early stages perform a more general classi-fication, and later phases make more specific la-beling that requires more precise resources. Wehave verified, through experimental evaluation,that taking advantage of a filter to select the mostappropriate resources for the later stages improvesthe results.
2. Separating each stage simplifies control for eval-uation. We know that there are certain tasks thatcould be parallelized, but the aim is to analyze theresults in the best possible way, rather than to pro-vide an optimized algorithm.
3. We have more freedom to add, delete or modifyany of the stages of the pipeline if they are inde-pendent. If we would like to use a different toolin any of the stages, changing it is very easy whenthere is a minimum coupling between phases.
The�GENIE�Project�-�A�Semantic�Pipeline�for�Automatic�Document�Categorisation
163

Our system works over a set of text documents,but we have to note that each of them could have avariable number of attributes (author, title, subtitle,domain, date, section, type, extension, etc.), that wewill use during the categorisation process. These at-tributes vary according to the origin of the document:a digital library, a database, a website, etc. Numericfields, dates, strings, or even HTML tags may be per-fectly valid attributes to the system. We could alsoconsider as attributes those elements that are specificto the structure of the type of document, such as hy-perlinks (Shen et al., 2006) in the case of web pages.As a very first stage, the system includes specific in-terfaces to convert the original documents into XMLfiles with a specific field for plain text and others forattributes.
The tasks for the proposed automatic text categori-sation system are:
1. Preprocessing of the text of the document, whichconsists of three steps:
(a) Lemmatization. Through this process we ob-tain a new text consisting of a set of wordscorresponding to the lemmas (canonical forms)of the words in the initial text. This processeliminates prepositions, articles, conjunctionsand other words included in the Stop WordsList. All the word information (Part of Speech,gender, number) is stored in the correspondingstructure, so it can be recovered later for futureuses.
(b) Named Entities Recognition (NER). Named en-tities are atomic elements in a text represent-ing, for example, names of persons, organiza-tions, locations, quantities, monetary values, orpercentages (Sekine and Ranchhod, 2009). Byusing a named entity extractor, this proceduregets a list of items identified as named entities.This extractor can be paired with a statisticalNamed Entity Classification (NEC) in a first at-tempt to classify the named entity into a pre-defined group (person, place, organization) orleave it undefined so the following tasks (Geo-graphical Classifier) can disambiguate it.
(c) Keywords Extraction. Keywords are words se-lected from the text that are in fact key elementsto consider to categorize the document. Weuse the lemmatized form of such words and theTF/IDF algorithm (Salton and Buckley, 1988).
These processes produce several results that areused in subsequent stages. The resources used inthis stage are the morphological analyzer, the StopWord List and the statistical data.
2. Attributes-Based Classifier. Taking advantage ofthe attributes of each of the documents, this ruled-based process makes a first basic and general tag-ging. For example, if we find the words “filmreview” in the “title” field the system will inferthat the thesaurus descriptor CINEMA could beassigned to this document. At the same time, it es-tablishes the values of the attributes to be used forthe selection of appropriate resources in the fol-lowing steps, choosing for instance an ontologyabout cinema for the Ontological Classifier stage.
3. Statistical Classifier. Using machine learningtechniques (Sebastiani, 2002), the document textis analyzed to try to find patterns that correspondto data in the files storing statistical information.This step is mainly useful to try to obtain labelsthat correspond to the general themes of the doc-ument. Trying to deduce if a document is talkingabout football or basketball could be a good ex-ample.
4. Geographical Classifier. By using the gazetteer,named entities (NE) corresponding to geograph-ical locations are detected. This stage is man-aged by a ruled-based system. Besides, it candeal with typical disambiguation problems amonglocations of the same name and locations whosenames match other NE (e.g., people), by usingthe well-known techniques described in (Amitayet al., 2004): usually there is only single senseper discourse (so, an ambiguous term is likely tomean only one of its senses when it its used multi-ple times), and place names appearing in the samecontext tend to show close locations. Other im-portant considerations that GENIE takes into ac-count are to look at the population of the locationcandidates as an important aspect to disambiguateplaces (Amitay et al., 2004) and consider the con-text where the text is framed to establish a list ofbonuses for certain regions (Quercini et al., 2010).Other used techniques are to construct an N-termwindow on both sides of the entity considered tobe a geographic term, as some words can con-tribute with a positive or negative modifier (Rauchet al., 2003), or to try to find syntactic structureslike “city, country” (e.g. “Madrid, Spain”) (Liet al., 2002). Finally, using techniques explainedin (Garrido et al., 2013b), the system uses ontolo-gies in order to capture information about impor-tant aspects related to certain locations. For ex-ample: most important streets, monuments andoutstanding buildings, neighborhoods, etc. This isuseful when a text has not explicit location identi-fied. Besides, it takes advantage too of the resultsof previous stages. For example, if in the previ-
WEBIST�2014�-�International�Conference�on�Web�Information�Systems�and�Technologies
164
ous stages we got the descriptor EUROPE we canassign higher scores to the results related to Eu-ropean countries and major European cities thanto results related to locations in other continents.The geographical tagging unit is very useful be-cause, empirically, near 30% of tags in our exper-imental context are related to locations.
5. Ontological Classifier. To perform a detailed la-beling, the knowledge base is queried about thenamed entities and keywords found in the text.If a positive response is obtained, it means thatthe main related concepts can be used to labelthe text. A great advantage is that these con-cepts need not appear explicitly in the text, as theymay be inferred from existing ontological rela-tions. If there is an ambiguous word, it can bedisambiguated (Resnik, 1999) by using the Lexi-cal Database resource (for a survey on word sensedisambiguation, see (Navigli, 2009)). As soon asa concept related to the text is found, the relationsstored in the Relationships Table are consideredto obtain appropriate tags from the thesaurus. Asexplained before, the fact that at this phase wehave a partially classified document allows us tochoose the most appropriate ontologies for classi-fication using configurable rules. For example, ifwe have already realised with the statistical clas-sifier that the text speaks of the American Bas-ketball League, we will use a specific ontologyto classify the document more accurately findingout for instance the teams and the players, and wewill not try to use any other resource. This partic-ular ontology could be obtained and re-used fromthe Web. But if we had discovered that the textis about local politics, we will use another spe-cific ontology to deduce the most appropriate tags.This ontology would probably be hand-made, orit would be adapted from other similar ontology,because this kind of resources are difficult or im-possible to find for free on the Web. So, oursystem is generic enough to acommodate the re-quired and more appropriate ontologies (existingor hand-made) for the different topics covered inthe texts.The way to obtain the tags is asking aboutkeywords and NE to the ontology, by usingSPARQL1, a set of rules, and the relationship ta-ble to deduce the most suitable tags. The behaviorof the ontology is not only to be a simple bag-of-words, because it can contain concepts, relationsand axioms, all of them very useful to inquire the
1http://www.w3.org/TR/2006/WD-rdf-sparql-query-20061004/
implicit topics in the text.
In summary, the text categorization process that GE-NIE performs consists of following each of the pro-posed tasks that constitute the system’s pipeline. Thisprocess begins with the preprocessing of the inputtext, which implies labors of lemmatization of the textand extraction of named entities and keywords fromthe text. Then it analyzes a set of attributes that aregiven with the text that is being analyzed in order toextract the first basic and general labels. Afterwards,it applies a statistical classification method based onmachine learning techniques to obtain labels that cor-respond to the general themes of the document. Thenit applies a geographic classifier for the purpose ofidentifying possible geographical references includedin the text. Finally, it applies an ontological classifierin order to carry out a more detailed classification ofthe text, which performs an analysis of named enti-ties and keywords obtained from the text, consults theappropriate ontology, and uses a lexical database toremove possible ambiguities.
3 EXPERIMENTAL EVALUATION
We have performed a set of experiments to test andcompare the performance of our architecture with oth-ers tools. For this purpose, we have tested in a realenvironment using three corpus of news previouslylabeled by a professional documentation departmentof several major Spanish Media: Heraldo de Aragon2,Diario de Navarra3 and Heraldo de Soria4. Each cor-pus had respectively 11,275, 10,200, and 4,500 news.These corpora are divided in several categories: lo-cal, national, international, sports, and culture. Ev-ery media has a different professional thesaurus usedto classify documents, with more than 10,000 entrieseach. For classification, each document can receiveany number of descriptors belonging to the thesaurus.The ideal situation would be that the automatic textcategorization system could perform a work identicalto the one performed by the real documentation de-partments.
These news are stored in several databases, in ta-bles where different fields are used to store the dif-ferent attributes explained in Section 2 (title, au-thor, date, section, type, extension, etc.). For exper-imental evaluation, we have extracted them from thedatabases and we have put each text and the data of itsfields in XML files. We have used this corpus of XML
2http://www.heraldo.es/3http://www.diariodenavarra.es/4http://www.heraldodesoria.es/
The�GENIE�Project�-�A�Semantic�Pipeline�for�Automatic�Document�Categorisation
165

Figure 2: GENIE control interface.
files as the input of the system, and the output is thesame set of files but with an additional field: classifi-cation information. This new XML node contains theset of words (descriptors) belonging to the thesaurusused to categorize the document, i.e., this node con-tains the different tags that describe the XML file. Anexample of node that can be contained in an XML fileof cinema is:
<classify>CULTURE CINEMA WOODY_ALLEN</classify>
As the news in the dataset considered had beenpreviously manually annotated by the professionalsworking in the documentation department, we cancompare the automatic categorization with that per-formed by humans. So, we can evaluate the numberof hits, omissions and misses.
3.1 Experimental Settings
In the experiments, we have examined the follow-ing measures, commonly used in the Information Re-trieval context (Manning et al., 2008): the precision,the recall, and the F-Measure. The dataset used ini-tially in the experiments has been the Heraldo deAragon corpus. We have used the information fromthis dataset to define most of the rules of the vari-ous processes associated with each of the stages ofthe classification system. These rules are integratedin a configuration file which contains all the informa-tion necessary to lead the process and obtain the cor-rect result. The other two datasets (Diario de Navarraand Heraldo de Soria) have been used just to double-check if the application of those rules also producedthe desired result; for comparison purposes, at the endof this section we will also present some experimentalresults based on them. Since news, thesauri, ontolo-gies and classification fields are private data of eachcompany, they are not available on-line on the Web5.
5Anyway, if any researcher wants to use our corpus forexperimental purposes, he/she is entitled to apply directlyto the first author and they will be provided privately.
In a first stage, we have used MALLET (Mc-Callum, 2002) to classify the different news corpus.MALLET is a tool that allows the classification ofdocuments. A classifier is an algorithm that dis-tinguishes between a fixed set of classes, such as“spam” vs. “non-spam”, based on labeled training ex-amples. MALLET includes implementations of sev-eral classification algorithms, including Naive Bayes,Maximum Entropy, and Decision Trees. In addi-tion, MALLET provides tools for evaluating classi-fiers. In addition to classification, MALLET includestools for sequence tagging for applications such asthe extraction of named entities from text. The al-gorithms include Hidden Markov Models, MaximumEntropy Markov Models, and Conditional RandomFields. These methods are implemented in an extensi-ble system for finite state transducers. The followingclassifiers were used: MaxEnt, Naive Bayes, C45 andDecisionTree, achieving in the best case 60% in all ofthe three measures (precision, recall and F-measure).
Afterwards, we have performed four experimentswith our own classifier. The appearance of the GE-NIE control application can be seen in Figure 2. Eachstage of the pipeline can be enabled or disabled sep-arately. Regarding the resources and tools consid-ered, we have used Freeling (Carreras et al., 2004),as the Morphological Analyzer and Support VectorMachines (SVM) (Joachims, 1998) to automaticallyclassify topics in the Statistical Classifier.We have chosen Freeling as is the only and widely usedactive analysis tool suite that supports several analysis ser-vices in both Spanish and English, as well other languageswhich can be incorporated in our architecture in future de-velopments. Some implementation details of Freeling weremodified in order to encapsulate it as a consistent library,incorporating it into our architecture. As Freeling outputstheir analysis results in an undesired format to our approach,the need to construct new structures for the several linguisticunits was necessary to define an architecture which can sup-port this library and other different analysis tools than canbe added in the future. These structures aim to group mostof the mutual characteristics of the Romanic languages andthe English language into a single approach, while singularlanguage features had to be handled apart.
Regarding the type of SVM used, we have used amodified version of the Cornell SVM-Light implementa-tion (Joachims, 2004) with a Gaussian radial basis func-
WEBIST�2014�-�International�Conference�on�Web�Information�Systems�and�Technologies
166
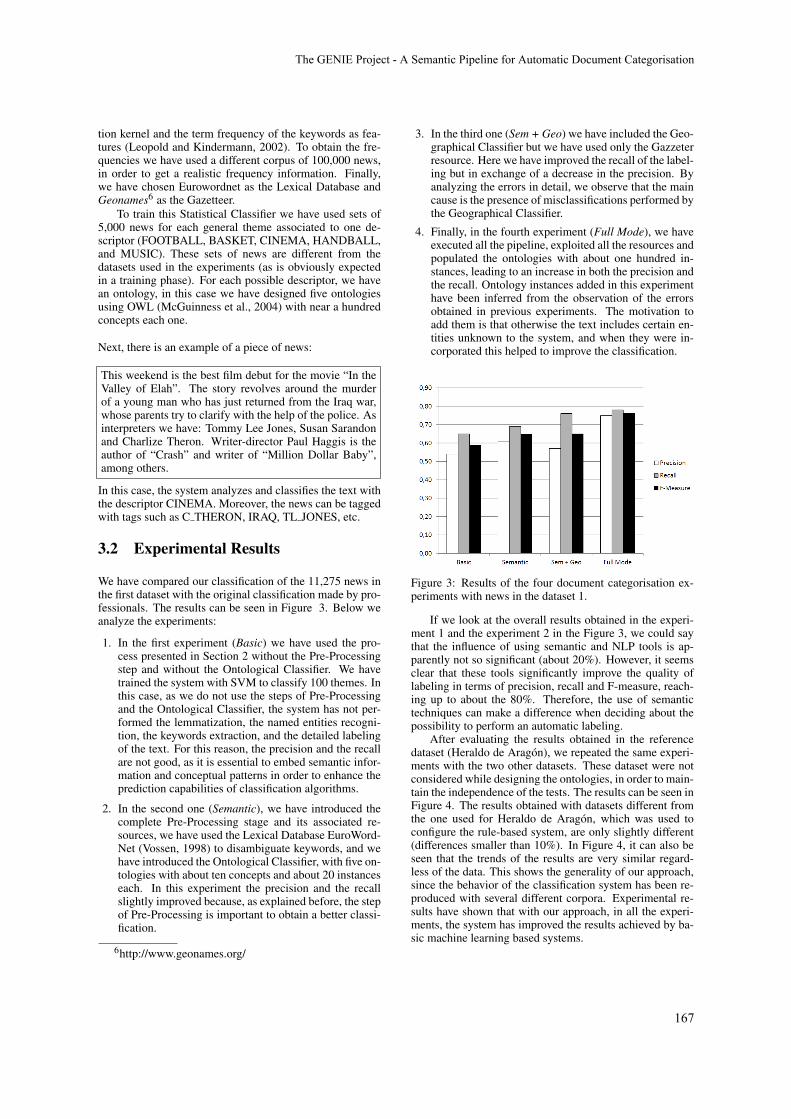
tion kernel and the term frequency of the keywords as fea-tures (Leopold and Kindermann, 2002). To obtain the fre-quencies we have used a different corpus of 100,000 news,in order to get a realistic frequency information. Finally,we have chosen Eurowordnet as the Lexical Database andGeonames6 as the Gazetteer.
To train this Statistical Classifier we have used sets of5,000 news for each general theme associated to one de-scriptor (FOOTBALL, BASKET, CINEMA, HANDBALL,and MUSIC). These sets of news are different from thedatasets used in the experiments (as is obviously expectedin a training phase). For each possible descriptor, we havean ontology, in this case we have designed five ontologiesusing OWL (McGuinness et al., 2004) with near a hundredconcepts each one.
Next, there is an example of a piece of news:
This weekend is the best film debut for the movie “In theValley of Elah”. The story revolves around the murderof a young man who has just returned from the Iraq war,whose parents try to clarify with the help of the police. Asinterpreters we have: Tommy Lee Jones, Susan Sarandonand Charlize Theron. Writer-director Paul Haggis is theauthor of “Crash” and writer of “Million Dollar Baby”,among others.
In this case, the system analyzes and classifies the text withthe descriptor CINEMA. Moreover, the news can be taggedwith tags such as C THERON, IRAQ, TL JONES, etc.
3.2 Experimental Results
We have compared our classification of the 11,275 news inthe first dataset with the original classification made by pro-fessionals. The results can be seen in Figure 3. Below weanalyze the experiments:
1. In the first experiment (Basic) we have used the pro-cess presented in Section 2 without the Pre-Processingstep and without the Ontological Classifier. We havetrained the system with SVM to classify 100 themes. Inthis case, as we do not use the steps of Pre-Processingand the Ontological Classifier, the system has not per-formed the lemmatization, the named entities recogni-tion, the keywords extraction, and the detailed labelingof the text. For this reason, the precision and the recallare not good, as it is essential to embed semantic infor-mation and conceptual patterns in order to enhance theprediction capabilities of classification algorithms.
2. In the second one (Semantic), we have introduced thecomplete Pre-Processing stage and its associated re-sources, we have used the Lexical Database EuroWord-Net (Vossen, 1998) to disambiguate keywords, and wehave introduced the Ontological Classifier, with five on-tologies with about ten concepts and about 20 instanceseach. In this experiment the precision and the recallslightly improved because, as explained before, the stepof Pre-Processing is important to obtain a better classi-fication.
6http://www.geonames.org/
3. In the third one (Sem + Geo) we have included the Geo-graphical Classifier but we have used only the Gazzeterresource. Here we have improved the recall of the label-ing but in exchange of a decrease in the precision. Byanalyzing the errors in detail, we observe that the maincause is the presence of misclassifications performed bythe Geographical Classifier.
4. Finally, in the fourth experiment (Full Mode), we haveexecuted all the pipeline, exploited all the resources andpopulated the ontologies with about one hundred in-stances, leading to an increase in both the precision andthe recall. Ontology instances added in this experimenthave been inferred from the observation of the errorsobtained in previous experiments. The motivation toadd them is that otherwise the text includes certain en-tities unknown to the system, and when they were in-corporated this helped to improve the classification.
Figure 3: Results of the four document categorisation ex-periments with news in the dataset 1.
If we look at the overall results obtained in the experi-ment 1 and the experiment 2 in the Figure 3, we could saythat the influence of using semantic and NLP tools is ap-parently not so significant (about 20%). However, it seemsclear that these tools significantly improve the quality oflabeling in terms of precision, recall and F-measure, reach-ing up to about the 80%. Therefore, the use of semantictechniques can make a difference when deciding about thepossibility to perform an automatic labeling.
After evaluating the results obtained in the referencedataset (Heraldo de Aragon), we repeated the same experi-ments with the two other datasets. These dataset were notconsidered while designing the ontologies, in order to main-tain the independence of the tests. The results can be seen inFigure 4. The results obtained with datasets different fromthe one used for Heraldo de Aragon, which was used toconfigure the rule-based system, are only slightly different(differences smaller than 10%). In Figure 4, it can also beseen that the trends of the results are very similar regard-less of the data. This shows the generality of our approach,since the behavior of the classification system has been re-produced with several different corpora. Experimental re-sults have shown that with our approach, in all the experi-ments, the system has improved the results achieved by ba-sic machine learning based systems.
The�GENIE�Project�-�A�Semantic�Pipeline�for�Automatic�Document�Categorisation
167
4 RELATED WORK
Text categorisation represents a challenging problem for thedata mining and machine learning communities, due to thegrowing demand for automatic information retrieval sys-tems. Systems that automatically classify text documentsinto predefined thematic classes, and thereby contextualizeinformation, offer a promising approach to tackle this com-plexity (Sebastiani, 2002).
Document classification presents difficult challengesdue to the sparsity and the high dimensionality of text data,and to the complex semantics of natural language. Thetraditional document representation is a word-based vectorwhere each dimension is associated with a term of a dic-tionary containing all the words that appear in the corpus.The value associated to a given term reflects its frequency ofoccurrence within the corresponding document and withinthe entire corpus (the tf-idf metric). Although this is a rep-resentation that is simple and commonly used, it has sev-eral limitations. Specifically, this technique has three maindrawbacks: (1) it breaks multi-word expressions into inde-pendent features; (2) it maps synonymous words into dif-ferent components; and (3) it considers polysemous wordsas one single component. While a traditional preprocessingof documents, such as eliminating stop words, pruning rarewords, stemming, and normalization, can improve the rep-resentation, its effect is also still limited. So, it is essentialto embed semantic information and conceptual patterns inorder to enhance the prediction capabilities of classificationalgorithms.
Research has been done to exploit ontologies forcontent-based categorisation of large corpora of documents.WordNet has been widely used, for example in (Siolas andd’Alche Buc, 2000) or (Elberrichi et al., 2008), but theirapproaches only use synonyms and hyponyms, fail to han-dle polysemy, and break multi-word concepts into singleterms. Our approach overcomes these limitations by incor-porating background knowledge derived from ontologies.This methodology is able to keep multi-word concepts un-broken, it captures the semantic closeness to synonyms, andperforms word sense disambiguation for polysemous terms.
For disambiguation tasks we have taken into accountan approximation described in (Trillo et al., 2007), that isbased on a semantic relatedness computation to detect theset of words that could induce an effective disambiguation.That technique receives an ambiguous keyword and its con-text words as input and provides a list of possible senses.Other studies show how background knowledge in form ofsimple ontologies can improve text classification results bydirectly addressing these problems (Bloehdorn and Hotho,2006), and others make use of this intelligence to automat-ically generate tag suggestions based on the semantic con-tent of texts. For example (Lee and Chun, 2007), whichextracts keywords and their frequencies, uses WordNet assemantics and an artificial neural network for learning.
Among other related studies that quantify the quality ofan automatic labeling performed by using ontologies, wecould mention (Maynard et al., 2006; Hovy et al., 2006),but both are focused on a purely semantic labeling (i.e., theydo not consider statistics-based methods). More related toour study, it is interesting to mention the work presentedin (Scharkow, 2013), although it does not include much in-
formation about the use of ontologies. Examples of hybridsystems using both types of tools include the web serviceclassifier explained in (Bruno et al., 2005), the system NASS(News Annotation Semantic System) described in (Garridoet al., 2011; Garrido et al., 2012), which is an automaticannotation tool for the Media, or GoNTogle (Bikakis et al.,2010), which is a framework for general document annota-tion and retrieval.
5 CONCLUSIONS AND FUTUREWORK
A tool for automating categorisation tasks is very usefulnowadays, as it helps to improve the quality of searchesthat are performed later over textual repositories like digitallibraries, databases or web pages. For this reason, in thispaper we have presented a pipeline architecture to help inthe study of the problem of automatic text categorisationusing specific vocabulary contained in a thesaurus. Ourmain contribution is the design of a system that combinesstatistics, lexical databases, NLP tools, ontologies, andgeographical databases. Its stage-based architecture easilyallows the use and exchange of different resources andtools. We have also performed a deep study of the impactof the semantics in a text categorisation process.
Our pipeline architecture is based on five stages:preprocessing, attribute-based classification, statisticalclassification, geographical classification, and ontologicalclassification. Although the experimental part has beendeveloped in Spanish, the tool is ready to work with anyother language. Changing linguistic resources suitable forthe intended language is enough to make the system work,since the process is sufficiently general to be applicableregardless of the language used. The main contribution ofour work is, apart from the useful and modular pipelinearchitecture, the experimental study with real data of theproblem of categorization of natural language documentswritten in Spanish. There are many studies related tosuch problems in English, but it is difficult to find themin Spanish. Besides, we have compared the impact ofapplying techniques that rely on statistics and supervisedlearning with the results obtained when semantic tech-niques are also used. There are two remarkable aspects.Firstly, enhancing the amount of knowledge available byincreasing the number of instances in the ontologies leadsto a substantial improvement in the results. Secondly, theuse of knowledge bases helps to correct many errors from aGeographical Classifier.
Spanish vs. English Language. Our research on thistopic focuses on transfer projects related to the extractionof information, so for us it is very important to work withreal cases. Therefore, the comparison of our work with typ-ical benchmark data sets in English is not fundamental tous, since they are not useful to improve the performance ofour system in Spanish, and we have seen that the ambientconditions (language, regional context, thematic news, etc.)have a great influence on the outcome of experiments. Manyresearchers have already analyzed the differences betweenworking in NLP topics in English and in Spanish, and they
WEBIST�2014�-�International�Conference�on�Web�Information�Systems�and�Technologies
168
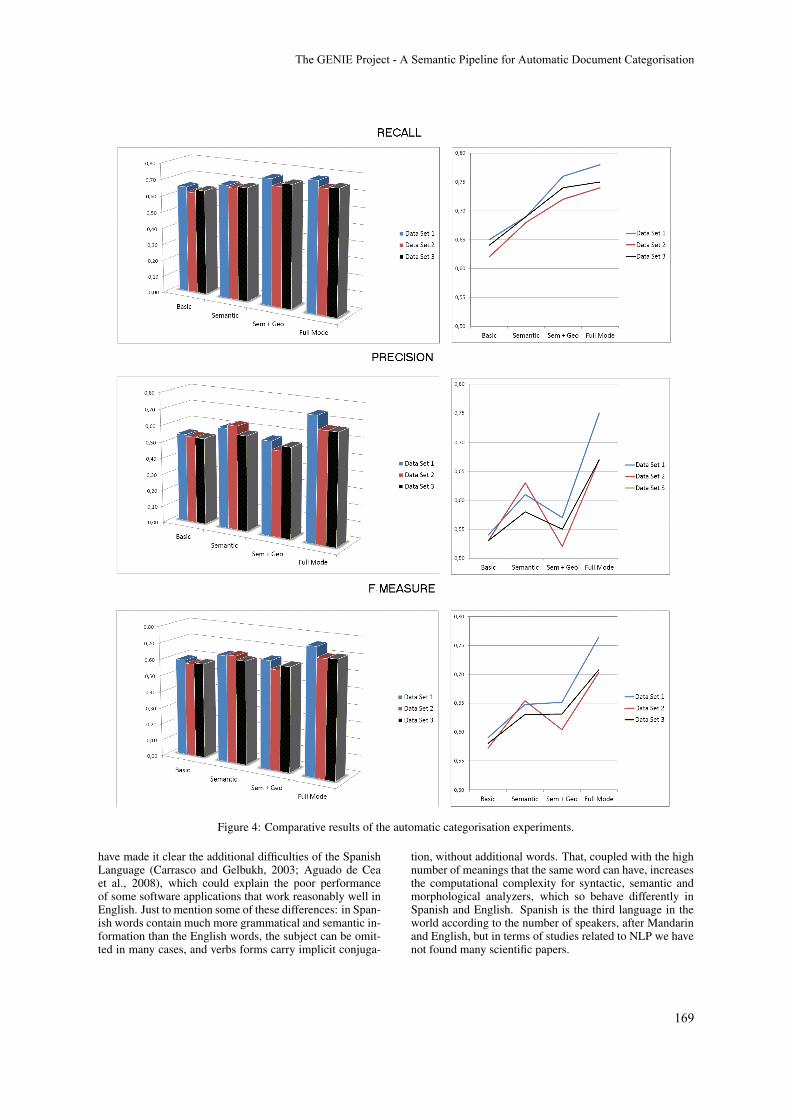
Figure 4: Comparative results of the automatic categorisation experiments.
have made it clear the additional difficulties of the SpanishLanguage (Carrasco and Gelbukh, 2003; Aguado de Ceaet al., 2008), which could explain the poor performanceof some software applications that work reasonably well inEnglish. Just to mention some of these differences: in Span-ish words contain much more grammatical and semantic in-formation than the English words, the subject can be omit-ted in many cases, and verbs forms carry implicit conjuga-
tion, without additional words. That, coupled with the highnumber of meanings that the same word can have, increasesthe computational complexity for syntactic, semantic andmorphological analyzers, which so behave differently inSpanish and English. Spanish is the third language in theworld according to the number of speakers, after Mandarinand English, but in terms of studies related to NLP we havenot found many scientific papers.
The�GENIE�Project�-�A�Semantic�Pipeline�for�Automatic�Document�Categorisation
169

Impact of NLP and Semantics. Our experimental evalu-ation suggests that the influence of NLP and semantic toolsis not quantitatively as important as the classic statisticalapproaches, although their contribution can tip the scaleswhen evaluating the quality of a labeling technique, sincethe difference in terms of precision and recall is sufficientlyinfluential (near 20%). So, our conclusion is that a statis-tical approach can be successfully complemented with se-mantic techniques to obtain an acceptable automatic cate-gorisation. Our experience also proves that facing this issuein a real environment when professional results are needed,the typical machine learning approach is the best option butis not always enough. We have seen that it should be com-plemented with other techniques, in our case semantic andlinguistic ones. Anyway, the main drawback of the seman-tic techniques is that the work of searching or constructingthe ontologies for each set of tags of every topic, populat-ing them, and building the relationship tables, is harder thanthe typical training of the machine learning approaches. So,although the results are better, the scalability could be prob-lematic. Sometimes it can be quite costly, especially if de-tailed knowledge of the topic to tag is required in order toappropriately configure the system.
NLP Future Tasks In some categorisation scenarios,like bigger analysis (novels, reports, etc.) or groups of doc-uments of the same field, it can be interesting to obtain asummary of the given inputs in order to categorise themwith their general terms before entering a more detailedanalysis which requires the entire texts. These summaries,alongside with the previous defined tasks, can led to a moresuitable detailed labelling, providing hints of which knowl-edge bases might be interesting to work with. In order toachieve this, we can perform syntactic analysis to simplifythe sentences of the summaries, as we have seen in workslike (Silveira and Branco, 2012), and then we will use theobtained results to filter unnecessary information and selectthe most relevant sentences without compromising the textintegrity. Although the required structures have been im-plemented and some approaches as (Garrido et al., 2013a)are being designed and tested, they are into an early stageand they require more work before trying to use it inside thecategorisation pipeline.
Open Tasks. As future work, we plan to increase thenumber of methods used in the pipeline, and to test thismethodology in new contexts and languages. It is notewor-thy that a piece of news is a very specific type of text, char-acterized by objectivity, clarity, and the use of synonymsand acronyms, the high presence of specific and descriptiveadjectives, the tendency to use impersonal or passive con-structions, and the use of connectors. Therefore it is notsufficient to test only with this kind of text, and to make amore complete study is necessary to work with other types.In fact, some tests have been made with GENIE with othertypes of documents very different from news, such as bookreviews, business reports, lyrics, blogs, etc. and the resultsare very promising, but it is early to assert the generality ofthe solution in different contexts because the studies are stillin progress.
ACKNOWLEDGEMENTS
This research work has been supported by the CICYTproject TIN2010-21387-C02-02 and DGA-FSE. Thank youto Heraldo Group and Diario de Navarra.
REFERENCES
Aguado de Cea, G., Puch, J., and Ramos, J. (2008). Tag-ging Spanish texts: The problem of ’se’. In Sixth In-ternational Conference on Language Resources andEvaluation (LREC’08), pages 2321–2324.
Amitay, E., Har’El, N., Sivan, R., and Soffer, A. (2004).Web-a-where: geotagging web content. In 27th An-nual International ACM SIGIR Conference on Re-search and Development in Information Retrieval,pages 273–280. ACM.
Atkinson, M. and Van der Goot, E. (2009). Near real timeinformation mining in multilingual news. In Proceed-ings of the 18th International Conference on WorldWide Web, WWW ’09, pages 1153–1154. ACM.
Bikakis, N., Giannopoulos, G., Dalamagas, T., and Sellis, T.(2010). Integrating keywords and semantics on docu-ment annotation and search. In On the Move to Mean-ingful Internet Systems (OTM 2010), pages 921–938.Springer.
Bloehdorn, S. and Hotho, A. (2006). Boosting for textclassification with semantic features. In Advances inWeb mining and Web Usage Analysis, pages 149–166.Springer.
Bruno, M., Canfora, G., Di Penta, M., and Scognamiglio, R.(2005). An approach to support web service classifica-tion and annotation. In 2005 IEEE International Con-ference on e-Technology, e-Commerce and e-Service(EEE’05), pages 138–143. IEEE.
Carrasco, R. and Gelbukh, A. (2003). Evaluation of TnTTagger for Spanish. In Proceedings of ENC, FourthMexican International Conference on Computer Sci-ence, pages 18–25. IEEE.
Carreras, X., Chao, I., Padro, L., and Padro, M. (2004).FreeLing: An open-source suite of language analyz-ers. In Fourth International Conference on LanguageResources and Evaluation (LREC’04), pages 239–242. European Language Resources Association.
Chau, R. and Yeh, C.-H. (2004). Filtering multilingual webcontent using fuzzy logic and self-organizing maps.Neural Computing and Applications, 13(2):140–148.
Elberrichi, Z., Rahmoun, A., and Bentaallah, M. A. (2008).Using WordNet for text categorization. The Interna-tional Arab Journal of Information Technology (IA-JIT), 5(1):16–24.
Garrido, A. L., Buey, M. G., Escudero, S., Ilarri, S., Mena,E., and Silveira, S. B. (2013a). TM-gen: A topic mapgenerator from text documents. In 25th IEEE Interna-tional Conference on Tools with Artificial Intelligence(ICTAI 2013), Washington DC (USA), pages 735–740.IEEE Computer Society.
Garrido, A. L., Buey, M. G., Ilarri, S., and Mena, E.(2013b). GEO-NASS: A semantic tagging experience
WEBIST�2014�-�International�Conference�on�Web�Information�Systems�and�Technologies
170
from geographical data on the media. In 17th East-European Conference on Advances in Databases andInformation Systems (ADBIS 2013), Genoa (Italy),volume 8133, pages 56–69. Springer.
Garrido, A. L., Gomez, O., Ilarri, S., and Mena, E. (2011).NASS: News Annotation Semantic System. In 23rdIEEE International Conference on Tools with Artifi-cial Intelligence (ICTAI 2011), Boca Raton, Florida(USA), pages 904–905. IEEE Computer Society.
Garrido, A. L., Gomez, O., Ilarri, S., and Mena, E. (2012).An experience developing a semantic annotation sys-tem in a media group. In Proceedings of the 17thInternational Conference on Applications of NaturalLanguage Processing and Information Systems, pages333–338. Springer.
Gilchrist, A. (2003). Thesauri, taxonomies and ontologies- an etymological note. Journal of Documentation,59(1):7–18.
Goodchild, M. F. and Hill, L. (2008). Introduction to dig-ital gazetteer research. International Journal of Geo-graphical Information Science, 22(10):1039–1044.
Gruber, T. R. et al. (1993). A translation approach toportable ontology specifications. Knowledge Acqui-sition, 5(2):199–220.
Hovy, E., Marcus, M., Palmer, M., Ramshaw, L., andWeischedel, R. (2006). OntoNotes: The 90% solu-tion. In Human Language Technology Conference ofthe NAACL, Companion Volume: Short Papers, pages57–60. Association for Computational Linguistics.
Joachims, T. (1998). Text categorization with support vec-tor machines: Learning with many relevant features.In Tenth European Conference on Machine Learning(ECML’98), pages 137–142. Springer.
Joachims, T. (2004). SVM Light Version: 6.01.http://svmlight.joachims.org/.
Lee, S. O. K. and Chun, A. H. W. (2007). Automatictag recommendation for the web 2.0 blogosphere us-ing collaborative tagging and hybrid and semanticstructures. Sixth Conference on WSEAS InternationalConference on Applied Computer Science (ACOS’07),World Scientific and Engineering Academy and Soci-ety (WSEAS), 7:88–93.
Leopold, E. and Kindermann, J. (2002). Text categorizationwith support vector machines. How to represent textsin input space? Machine Learning, 46:423–444.
Li, H., Srihari, R. K., Niu, C., and Li, W. (2002). Locationnormalization for information extraction. In Proceed-ings of the 19th international conference on Compu-tational linguistics-Volume 1, pages 1–7. Associationfor Computational Linguistics.
Manning, C. D., Raghavan, P., and Schutze, H. (2008). In-troduction to Information Retrieval, volume 1. Cam-bridge University Press.
Maynard, D., Peters, W., and Li, Y. (2006). Metrics forevaluation of ontology-based information extraction.In Workshop on Evaluation of Ontologies for the Web(EON) at the International World Wide Web Confer-ence (WWW’06).
McGuinness, D. L., Van Harmelen, F., et al. (2004). OWLweb ontology language overview. W3C recommenda-tion 10 February 2004.
Miller, G. A. (1995). WordNet: a lexical database for en-glish. Communications of ACM, 38(11):39–41.
Mishra, R. B. and Kumar, S. (2011). Semantic web rea-soners and languages. Artificial Intelligence Review,35(4):339–368.
Navigli, R. (2009). Word sense disambiguation: A survey.ACM Computing Surveys, 41(2):10:1–10:69.
Quercini, G., Samet, H., Sankaranarayanan, J., and Lieber-man, M. D. (2010). Determining the spatial readerscopes of news sources using local lexicons. In Pro-ceedings of the 18th SIGSPATIAL International Con-ference on Advances in Geographic Information Sys-tems, pages 43–52. ACM.
Rauch, E., Bukatin, M., and Baker, K. (2003). Aconfidence-based framework for disambiguating ge-ographic terms. In HLT-NAACL 2003 Workshop onAnalysis of Geographic References, vol. 1, pages 50–54. Association for Computational Linguistics.
Resnik, P. (1999). Disambiguating noun groupings withrespect to WordNet senses. In Natural LanguageProcessing Using Very Large Corpora, pages 77–98.Springer.
Salton, G. and Buckley, C. (1988). Term-weighting ap-proaches in automatic text retrieval. Information Pro-cessing and Management, 24(5):513–523.
Scharkow, M. (2013). Thematic content analysis using su-pervised machine learning: An empirical evaluationusing German online news. Quality and Quantity,47(2):761–773.
Sebastiani, F. (2002). Machine learning in automated textcategorization. ACM Computing Surveys, 34(1):1–47.
Sekine, S. and Ranchhod, E. (2009). Named Entities:Recognition, Classification and Use. John Benjamins.
Shen, D., Sun, J.-T., Yang, Q., and Chen, Z. (2006). Acomparison of implicit and explicit links for web pageclassification. In Proceedings of the 15th Interna-tional Conference on World Wide Web, WWW ’06,pages 643–650. ACM.
Silveira, S. B. and Branco, A. (2012). Extracting multi-document summaries with a double clustering ap-proach. In Natural Language Processing and Infor-mation Systems, pages 70–81. Springer.
Siolas, G. and d’Alche Buc, F. (2000). Support vector ma-chines based on a semantic kernel for text categoriza-tion. In IEEE-INNS-ENNS International Joint Con-ference on Neural Networks (IJCNN 2000), volume 5,pages 205–209. IEEE.
Smeaton, A. F. (1999). Using NLP or NLP Resources forInformation Retrieval Tasks. Natural Language Infor-mation Retrieval. Kluwer Academic Publishers.
Trillo, R., Gracia, J., Espinoza, M., and Mena, E. (2007).Discovering the semantics of user keywords. Journalof Universal Computer Science, 13(12):1908–1935.
Vossen, P. (1998). EuroWordNet: A multilingual databasewith lexical semantic networks. Kluwer AcademicBoston.
Wilbur, W. J. and Sirotkin, K. (1992). The automatic iden-tification of stop words. Journal of Information Sci-ence, 18(1):45–55.
The�GENIE�Project�-�A�Semantic�Pipeline�for�Automatic�Document�Categorisation
171
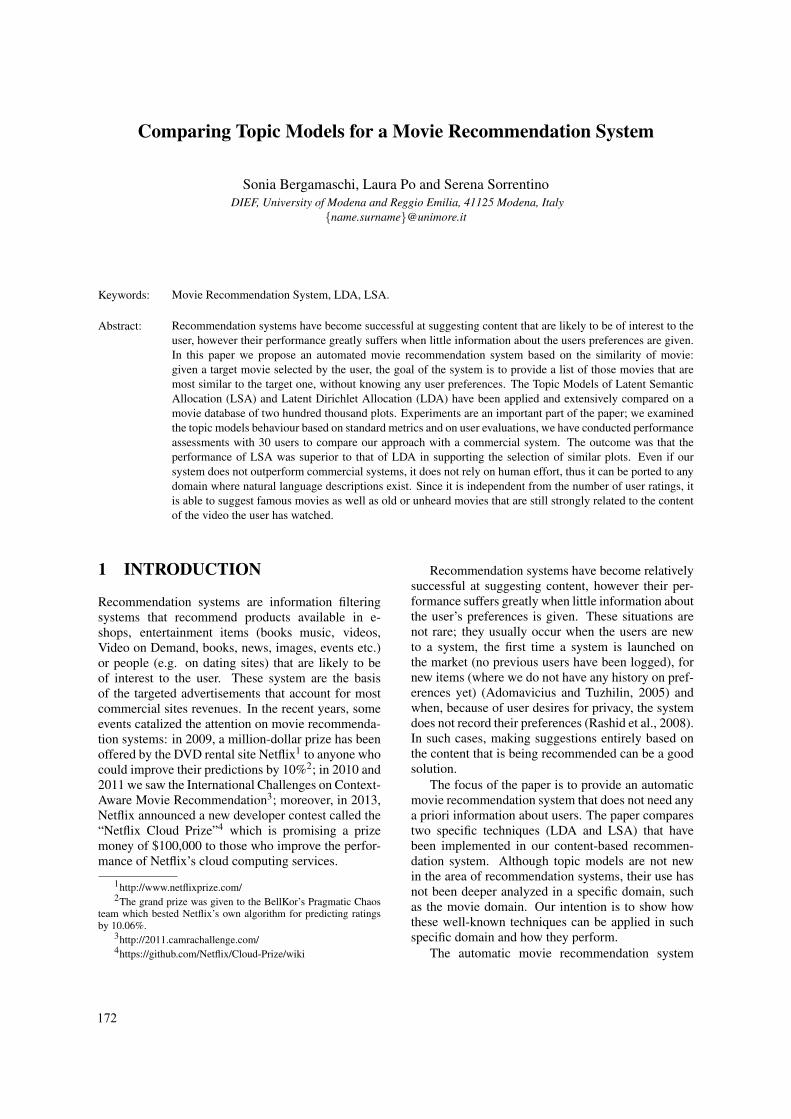
Comparing Topic Models for a Movie Recommendation System
Sonia Bergamaschi, Laura Po and Serena SorrentinoDIEF, University of Modena and Reggio Emilia, 41125 Modena, Italy
{name.surname}@unimore.it
Keywords: Movie Recommendation System, LDA, LSA.
Abstract: Recommendation systems have become successful at suggesting content that are likely to be of interest to theuser, however their performance greatly suffers when little information about the users preferences are given.In this paper we propose an automated movie recommendation system based on the similarity of movie:given a target movie selected by the user, the goal of the system is to provide a list of those movies that aremost similar to the target one, without knowing any user preferences. The Topic Models of Latent SemanticAllocation (LSA) and Latent Dirichlet Allocation (LDA) have been applied and extensively compared on amovie database of two hundred thousand plots. Experiments are an important part of the paper; we examinedthe topic models behaviour based on standard metrics and on user evaluations, we have conducted performanceassessments with 30 users to compare our approach with a commercial system. The outcome was that theperformance of LSA was superior to that of LDA in supporting the selection of similar plots. Even if oursystem does not outperform commercial systems, it does not rely on human effort, thus it can be ported to anydomain where natural language descriptions exist. Since it is independent from the number of user ratings, itis able to suggest famous movies as well as old or unheard movies that are still strongly related to the contentof the video the user has watched.
1 INTRODUCTION
Recommendation systems are information filteringsystems that recommend products available in e-shops, entertainment items (books music, videos,Video on Demand, books, news, images, events etc.)or people (e.g. on dating sites) that are likely to beof interest to the user. These system are the basisof the targeted advertisements that account for mostcommercial sites revenues. In the recent years, someevents catalized the attention on movie recommenda-tion systems: in 2009, a million-dollar prize has beenoffered by the DVD rental site Netflix1 to anyone whocould improve their predictions by 10%2; in 2010 and2011 we saw the International Challenges on Context-Aware Movie Recommendation3; moreover, in 2013,Netflix announced a new developer contest called the“Netflix Cloud Prize”4 which is promising a prizemoney of $100,000 to those who improve the perfor-mance of Netflix’s cloud computing services.
1http://www.netflixprize.com/2The grand prize was given to the BellKor’s Pragmatic Chaos
team which bested Netflix’s own algorithm for predicting ratingsby 10.06%.
3http://2011.camrachallenge.com/4https://github.com/Netflix/Cloud-Prize/wiki
Recommendation systems have become relativelysuccessful at suggesting content, however their per-formance suffers greatly when little information aboutthe user’s preferences is given. These situations arenot rare; they usually occur when the users are newto a system, the first time a system is launched onthe market (no previous users have been logged), fornew items (where we do not have any history on pref-erences yet) (Adomavicius and Tuzhilin, 2005) andwhen, because of user desires for privacy, the systemdoes not record their preferences (Rashid et al., 2008).In such cases, making suggestions entirely based onthe content that is being recommended can be a goodsolution.
The focus of the paper is to provide an automaticmovie recommendation system that does not need anya priori information about users. The paper comparestwo specific techniques (LDA and LSA) that havebeen implemented in our content-based recommen-dation system. Although topic models are not newin the area of recommendation systems, their use hasnot been deeper analyzed in a specific domain, suchas the movie domain. Our intention is to show howthese well-known techniques can be applied in suchspecific domain and how they perform.
The automatic movie recommendation system
172

Figure 1: The local MongoDB database.
permits, given a movie, to supply users with a list ofthose movies that are most similar to the target one.The way the system detects the list of similar moviesis based upon an evaluation of similarity among theplot of the target movie and a large amount of plotsthat is stored in a movie database. The movie databasehas been constructed by integrating different moviedatabases in a local NoSQL (MongoDB) database,building a collection of about two hundred thousandplots together with the most relevant movie metadata.
The context where our system works is that ofvideo-on-demand (VOD). Generally speaking, this isthe case when a user is looking for an item withoutbeing registered on the site in which he is looking for(searching a book on Amazoon, a movie on IMDbetc.). We assumed the only information we have aboutthe user is his first choice, the movie he has selected/he is watching (we do not have a history about hispast selections nor a profile about his general inter-ests). When watching a VOD movie, users explicitlyrequest to buy and to pay for that movie, then whatour system attempt to do is proposing a list of sim-ilar movies assuming that the chosen film has beenappreciated by the user (the system assumes the userliked the movie if his play time is more then 3/4 ofthe movie play time). Here, we also assume that wehave no knowledge about the preferences of the users;namely, about who is watching the film, and also withregard to other users who have previously accessedthe system.
There are dozens of movie recommendation en-gines on the web. Some require little or no input be-fore they give you movie titles, while others want tofind out exactly what your interests are, however allof these systems rely on ratings directly or indirectlyexpressed by users of the system (some examples areNetflix, Rotten Tomatoes, Movielens, IMDb, Jinni).
Starting from our previous work (Farinella et al.,2012) that highlighted the power of using the LatentSemantic Analysis (LSA) in contrast with weighting
techniques (such as log and tf-idf) in suggesting sim-ilar movies, in this paper we intend to integrate in thesystem the Latent Dirichlet Allocation (LDA) (Bleiet al., 2003) and then, by evaluating on real userswe compare the performance of our system based onLSA and LDA.
In (Griffiths et al., 2007) it has been shown that theLatent Dirichlet Allocation (LDA) Topic Model (Bleiet al., 2003) outperforms LSA, in the representationof ambiguous words and in a variety of other linguis-tic processing and memory tasks. Hereby, we intendto analyze the performance of LDA on the movie do-main and compare its behaviour with regard to LDA.In the end, we examine the performance of our systemwith regard to a commercial approach.
The system has been developed in collaborationbetween the database group of the University of Mod-ena and Reggio Emilia5 and vfree.tv6, a young andinnovative German company focused on creating newways of distributing television content and generatingan unprecedented watching experience for the user.
The paper is structured as follows. Section 2 de-scribes the structure of the local movie database Mon-goDB. Section 3 describes hoe the system performsthe similarity computations among movie plots by us-ing the LDA and LSA Topic Models. The experi-mental results of this study are presented in Section 4:we show the computational costs of building the LSAand LDA matrices, and the results of off-line testsperformed on three recommendation systems (LSA,LDA and a commercial approach). Section 5 presentssome related work. Conclusion and future work aredepicted in Section 6.
5http://www.dbgroup.unimo.it6http://vfree.tv
Comparing�Topic�Models�for�a�Movie�Recommendation�System
173

Figure 2: Documents related to the “Schindler’s List” movie.
2 THE MOVIE DATABASE
The principal aim of a local repository of moviesis to supply an extensive and reliable representationof multimedia that can be queried in a reasonabletime. The local database of our system has beendefined, as in our previous work (Farinella et al.,2012), by importing data from external repositories.In particular, we selected the Internet Movie Database(IMDb)7, DBpedia8 and the Open Movie Database(TMDb)9. Since local database needs to easily im-port data from different sources and perform querieson a huge amount of data (thousands of movies) ina short time, we chose MongoDB10, a non relationaldatabase and schema-free. MongoDB features allowto create databases with flexible and simple structurewithout decreasing the time performance when theyare queried.
Information about movies can be classified in ei-ther information that are related to multimedia or in-formation that are about people that participated inthe production of multimedia. This led to the creationof three main databases, each storing collections fromthe 4 sources (as shown in Figure 1). As MongoDB donot enforce document structure, this flexibility allowsan easy adaptation to integrate different/new datasets
7http://www.imdb.com/8http://dbpedia.org/9http://www.themoviedb.org/
10http://www.mongodb.org/
into the system. A single collection can store doc-uments with different fields. Thus there cannot re-ally be a description of a collection, like the descrip-tion of a table in the relational databases. However,to give an insight into the local DB, we extractedsome documents that store information related to the“Schindler’s List” movie. In figure 2, documents fromdifferent collections (IMDb, and the English and Ger-man version of DBpedia) are shown. It can be no-ticed how the information are heterogeneously repre-sented in the collections (see the different informationstored in the English and German version of DBpe-dia Movie collection) and how flexible the structureof each documents is (see for example in the EnglishDBpedia Crew Collection the double role of StevenSpielberg that is both the director and the producer ofthe movie).
3 PLOT SIMILARITYCOMPUTATION
The similarity of two media items depends on theirfeatures likeness. Hence, for each feature, a spe-cific metric is defined in order to compute a similarityscore. Most of the metrics that are adopted are calcu-lated through only few simple operations. However,if we want to consider also movie plots, the similaritycomputation becomes more complex. Our approachis based on the Vector Space Model (VSM) (Salton
WEBIST�2014�-�International�Conference�on�Web�Information�Systems�and�Technologies
174

et al., 1975), this model creates a space in whichboth documents and queries are represented by vec-tors. In the area of the Information Retrieval the VSMhas been considered as one of the most effective ap-proaches, and its behaviour has also been studied ap-plied on recommendation systems (Musto, 2010).
Our system takes advantage of this model to repre-sent the different movie plots: each plot (or documentfrom now on) is represented as a vector of keywordswith associated weights. These weights depend onthe distribution of the keywords in the given trainingset of plots that are stored in the database. Vectorsrepresenting plots are then joined in a matrix repre-sentation where each row corresponds to a plot andeach column corresponds to a keyword extracted fromthe training set plots (i.e. the document by keywordmatrix). Thus, each cell of the matrix represents theweight of a specific keyword according to a specificplot.
The matrix computation goes through four mainsteps:
1. Plot Vectorization - relevant keywords are ex-tracted and then stop words removal and lemma-tization techniques are applied;
2. Weights Computation- weights are defined as theoccurrences of keywords in the plots; the ini-tial weights are then modified by using the tf-idftechnique (Salton et al., 1975)(but other suitableweighting techniques could be used as well), thusbuilding the document by keyword matrix;
3. Matrix Reduction by using Topic Models - thedocument by keyword matrix is reduced to a lowerdimensional space by using the Topic ModelsLDA and LSA, thus it is transformed into a docu-ment by topic matrix.
4. Movie Similarity Computation- starting from thedocument by topic matrix, the similarity betweentwo plots is computed by considering their topicsas features instead of words.
3.1 Plot Vectorization
If two plots are to be compared, they will need to beconverted into vectors of keywords. As preliminaryoperations, keyword extraction and filtering activityare performed. Keywords correspond to terms withinthe document that are representative of the documentitself and that, at the same time, are discriminating.Less discriminative words, the so called stop words,are discarded, while the other terms are preprocessedand substituted in the vector by their lemmas (lemma-tization).
Lemmatization and keyword extraction are per-formed by using TreeTagger11, developed at the In-stitute for Computational Linguistics of the Univer-sity of Stuttgart. This tool can annotate documentswith part-of-speech and lemma information in bothEnglish and German language.
Keywords extracted from plots as well as their lo-cal frequencies (occurrences in the description of theplot) are stored as features of the media item in thelocal database MongoDB. This choice has been madefor two main reasons. First, the keyword extractionprocess is relatively slow12 compared to the access todatabase values. Since the weighting techniques arebased on the global distribution of the keywords overthe whole corpus of plots, it is necessary to gener-ate all the vectors before applying the weighting tech-nique. Second, while weights change when new mul-timedia plots are added into the system, the local key-word occurrences do not.
3.2 Weights Computation
Weighting techniques are used for computing key-word weights. A weight is a value in the range [0,1]that represents the relevance of a specific keyword ac-cording to a specific document. A weight is calcu-lated on the basis of the local distribution of the key-word within the document as well as on the globaldistribution of the keyword in the whole corpus ofplots. Keywords with a document frequency equal to1 are discarded. Since, our previous work (Farinellaet al., 2012) has compared tf-idf and log weightingtechniques revealing that the results are very similar,in this paper we employ only the tf-idf technique forcomputing the weights.
3.3 Matrix Reduction by using TopicModel
The Vector Space Model treats keywords as indepen-dent entities. To find documents on specific concepts,we must provide the correct key terms. This rep-resentation leads to several issues: (1) there can bean high number of keywords when we have to dealwith a huge amount of documents; (2) if any keywordchanged, the document would not convey the sameconcept.
These problems can be faced by a representationinto a Topic Model(Park and Ramamohanarao, 2009).
11http://www.cis.uni-muenchen.de/ schmid/tools/ Tree-Tagger/
12One database access, using MongoDB, takes about 0.3milliseconds while the extraction of keywords from a plottakes more than one second.
Comparing�Topic�Models�for�a�Movie�Recommendation�System
175

The Topic Model explores the idea that the conceptheld by a set of terms can be represented as a weighteddistribution over a set of topics. Each topic is a linearcombination of terms, where to each term a weightreflecting the relevance of the term for that topic isassociated. For example, high weights for family andhouse would suggest that a topic refers to a social unitliving together, whereas high weights for users andcommunication would suggest that a topic refers tosocial networking.
Topics can be found by clustering the set of key-words. The use of topics drastically reduces the di-mension of the keyword Matrix obtained by VectorSpace Model. Moreover, if a keyword changes, thedocument conveys the same idea as long as the newkeyword is taken from the same topic pool.
Topic vectors may be useful in the context ofmovie recommendation systems for three main rea-sons: (1) the number of topics that is equal to thenumber of non-zero eigenvectors is usually signifi-cantly lower than the number of keywords, the topicrepresentation of the plots is more compact13; (2) thetopic representation of the keywords makes possibleto add movies that have been released after the defini-tion of the matrix without recomputing it;
(3) to find similar movies starting from a givenone, we just need to compute the topic vectors for theplot of the movie and then compare these vectors withthe ones we have stored in the matrix finding the toprelevant.
The main Topic Models exploited so far in litera-ture are the LSA (also called Latent Semantic Index-ing (LSI)) and the LDA. In the following, we brieflydescribe both the methods and how they can be ap-plied to our movie recommendation system.
3.3.1 Latent Semantic Analysis (LSA)
LSA is a model for extracting and representingthe contextual-usage meaning of words by statisticalcomputations applied to a large corpus of documents.
The LSA consists of a Singular Value Decomposi-tion (SVD) of the matrix T (Training set matrix) fol-lowed by a Rank lowering (for more details see (Du-mais, 2004; Deerwester et al., 1990)). The Singu-lar Value Decomposition consists of representing thematrix T , the document by keyword matrix that rep-resents the relationships between keywords and plots,as the product of three matrices: K, S, DT . Matrix K,the topic by keyword matrix, represents the relation-ships between keywords and topics, while matrix S isa diagonal matrix whose values represent the square
13Thus, we store the matrix of document-topic vectors torepresent the training set.
roots of the so called eigenvalues of the matrix T T T .Matrix DT , document by topic matrix, represents therelationships between plots and topics.
The Singular Value Decomposition is conse-quently followed by a Rank lowering by which thematrices S and T are transformed respectively into thematrices S′,T ′. The purpose of dimensionality reduc-tion is to reduce noise in the latent space, resulting ina richer word relationship structure that reveals latentsemantics present in the collection. In a LSA system,the matrices are truncated to z dimensions (i.e. top-ics). The optimal z is determined empirically for eachcollection. In general, smaller z values are preferredwhen using LSA, due to the computational cost asso-ciated with the SVD algorithm, as well as the cost ofstoring and comparing large dimension vectors14.
3.3.2 Latent Dirichlet Allocation (LDA)
LSA provides a simple and efficient procedure forextracting a topic representation of the associationsbetween terms from a term-document co-occurrencematrix. However, as shown in (Griffiths et al., 2007),this representation makes it difficult for LSA do dealwith the polysemous terms. The key issue is that itsrepresentation does not explicitly identify the differ-ent senses of a term. To address this problem we in-vestigated the use of the Latent Dirichlet Allocation(LDA) Topic Model.
Unlike LSA, LDA is a probabilistic Topic Model,where the goal is to decompose a conditional term bydocument probability distribution into two differentdistributions, this allows each semantic topic z to berepresented as a multinominal distribution of terms,and each document d to be represented as a multinom-inal distribution of semantic topics. The model in-troduces a conditional independence assumption thatdocument d and keyword k are independent condi-tioned on the hidden variable, topic z.
LDA can also be interpreted as matrix factoriza-tion where document over keyword probability dis-tribution can be split into two different distributions:the topic over keyword distribution, and the documentover topic distribution. Thus, it appears clear, that wecan easily make a direct correspondence between thedocument by topic matrix obtained from LSA and thethe document over topic distribution obtained by us-ing LDA.
Both LDA and LSA permit to find a low dimen-sional representation for a set of documents with re-
14In our previous work we determined 500 as a goodnumber of topic. This value allows have reasonable com-putational costs, and maintains an appropriate level of ac-curacy.
WEBIST�2014�-�International�Conference�on�Web�Information�Systems�and�Technologies
176

gard to the simple term by document matrix. Thisdimensionality in both cases has to be decided a pri-ori. By adopting LSA, we were able to represent eachplot of the IMDb database with 500 topics, insteadof 220,000 keywords (Farinella et al., 2012). ForLDA (which has been demonstrated working well fora number of topics over 50 (Blei et al., 2003)), aftera few experimental evaluations, we decided to use 50topics.
3.4 Movie Similarity Computation
As previously described by using LSA or LDA thedocument by keyword matrix is decomposed into sev-eral matrices. The document by topic matrix is the onethat is used to represent the movie of our database ina lower dimensional space and also to compute thesimilarity score between two plots.
To calculate the similarity score between two doc-uments we use the cosine similarity. This metric isused to either compare plots within the training set orplots that are not included in the training set.
Definition - Cosine Similarity: Given two vec-tors vi, and v j, that represent two different plots, thecosine angle between them can be calculated as fol-lows:
cosin(vi,v j) =∑k (vi[k] · v j[k])√
∑k vi[k]2 ·√
∑k v j[k]2
The value of the cosine angle is a real number inthe range [−1,1]. If the cosine is equal to 1 the twovectors are equivalent, whereas if it is −1 the two vec-tors are opposite.
The similarity of plots can also be combined withthe similarity of other features such as directors,genre, producers, release year, cast etc.
Definition - Feature-based Similarity: Giventwo media items (m1 and m2) the feature-based simi-larity is defined as a weighted linear combination ofthe similarity of the feature values that describe thetwo items:
sim(m1,m2) =FN
∑i=1
wi · simi( f1,i, f2,i)
where FN is the number of features that describe amedia item, simi is the metric used to compare the i-th feature, f j,k is the value assumed by feature k inthe j-th media item. The result of each metric is nor-malized to obtain a value in the range [0,1] where 1denotes equivalence of the values that have been com-pared and 0 means maximum dissimilarity of the val-ues (Debnath et al., 2008).
4 EXPERIMENTS
We have performed several tests in order to evaluateour system, the goal was to compare the effectivenessof LDA and LSA techniques and to evaluate the per-formance of the system on real users.
Our previous research (Farinella et al., 2012) hasshown that:
• There is not a big difference in the results ob-tained by applying log or tf-idf weighting tech-niques. Thus, we can use one of them.
• The use of the Topic Model LSA shows a notice-able quality improvement compared to the use ofthe SVD model. LSA allows to select plots thatare better related to the target’s plot themes.
Starting from these results, we conducted newtests and evaluations of the system. First of all, weloaded data from IMDb into the local database Mon-goDB and evaluated the computational costs of build-ing the LSA and LDA matrices. Then, we comparedthe two Topic Models manually, by analyzing theirbehaviours in some special cases. Finally, we con-ducted off-line tests. We built two surveys asking realusers to judge the similarity of each film in a list withregard to a target movie. The first test compared theperformance of LDA and LSA. The second test com-pared the performance of LSA and a commercial sys-tem, IMDb. A third test evaluates the precision of thethree recommendation systems.
4.1 Setup of the Environment
The DataBase Management System used is Mon-goDB 2.4.1, the system has been installed on a ma-chine with the following characteristics: OS: Win-dows Server 2008 R2 64-bit; CPU: Intel (R) XeonE5620 Ghz 2:40; RAM: 12 GB. The 64bit version ofMongoDB is necessary as it is the only version thatallow working with databases greater than 2 GB.
A virtual machine for the execution of the codehas been installed on the server. The virtual machinehas the following features: OS: Ubuntu 12.04 LTS 64-bit; RAM: 8 GB; 20 GB dedicated to the virtual harddisk; 4 cores. The virtual machine has been set upwith VMWare Workstation 9.0.115. The 32-bit archi-tecture makes it possible to instantiate a maximum of2 GB of memory for a process. The creation of theLSA and LDA models exceeds the threshold of 2 GB,then the use of a 64-bit architecture is crucial in orderto avoid memory errors.
15http://www.vmware.com/products/workstation/
Comparing�Topic�Models�for�a�Movie�Recommendation�System
177

4.2 Evaluation of the ComputationalCosts
The SVM of the plot-keyword matrix have a com-plexity of O(d × k) where d is the number of mul-timedia (rows of the matrix) and k is the number ofkeywords and d ≥ k. There are about 1,861,736 mul-timedia in the IMDb database, but only for 200,000there is a plot available. These plots contain almost220,000 different keywords. Thus, the time cost forthe decomposition of the matrix is O = 3 ·1015. Fur-thermore, the decomposition requires random accessto the matrix, which implies an intensive usage of thecentral memory.
Both LSA and LDA decrease this cost by using areduced matrix. The Document by Topic Matrix usedby LSA has a dimension of d × z where z is the num-ber of topic (columns). The Document Distributionover Topic Matrix used by LDA has a dimension ofd × z. Usually LSA requires more topics then LDA.Thus, the cost for the computation of the LDA ma-trix is further decreased. In order to avoid the centralmemory saturation, we employ the framework Gen-sim16. It offers functions to process plain documentincluding algorithms performing both LSA and LDAwhich are independent from the training corpus size.
Table 1 shows the computational costs to createthe LSA and LDA models (the cost refers to the envi-ronment that we described in 4.1).
Table 1: Computational Costs.
Operation Time CPU Memory(minutes) avg use avg use
Plot vect. 5 75% 11%Tf-idf weights 1 97% 10%LSA weights 120 97% 42%LDA weights 60 95% 40%
Table 2: LSA and LDA Topic Model comparison.
Configuration LSA LDAmin. document freq. 10 10min. vector length 20 20min. tf-idf weight 0.09 0.09min. lsa/lda weight 0.001 0.001n. of topics 500 50matrix size 204285 x 500 204285 x 50Similarity time cost 12 sec 6 sec
Table 2 summarizes the configuration adopted forLSA and LDA and the time performance of the topicmodels when, starting from a given plot, they rank allthe other plots in the database. Since the LDA modelrequires less topics (50 instead of the 500 required by
16http://radimrehurek.com/gensim/
LSA), it has a computation cost and a similarity timecost lower than the ones for LSA.
Table 3: A comparison between LSA and LDA techniqueson the movie “Batman Begins”.
LSA LDA1.Batman Begins(2005) 1.Batman Begins(2005)2.Batman(1989) 2.Batman Forever(1995)3.Batman:GothamKnight(2008)
3.The Dark Knight(2008)
4.The Batman/SupermanHour(1968)
4.The Batman(2004)
5.The Batman(2004) 5.Frankie andJohnny(1991)
6.The Dark Knight(2008) 6.The Exorcist(1973)
Table 4: A comparison between LSA and LDA techniqueson the movie “The Matrix”.
LSA LDA1.The Matrix (1999) 1.The Matrix (1999)2.Computer Warriors(1990)
2.The Matrix Reloaded(2003)
3.Electric Dreams (1984) 3.Simulacrum (2009)4.Willkommen in Baby-lon (1995)
4.Virus X (2010)
5.TRON 2.0 (2003) 5.Fallen Moon (2011)6.Hackers (1995) 6.The Matrix Revolutions
(2003)
4.3 Topic Model Comparison
We have performed several tests in order to evaluatewhich of the Topic Models was the best in definingthe recommended movie list.
As described in section 3, the similarity of plotscan be combined with the similarity of other features.We decided not to consider the features for this evalu-ation, so the LSA and LDA are compared consideringonly plots and none of the movie features. This deci-sion was gained after a manual evaluation of the re-sults of LDA and LSA with or without features. Themanual evaluation showed several problems that haveled us to formulate some considerations: (1) for eachmovie we have a broad list of actors, as IMDb re-ports the complete list including the background ac-tors. Evaluating similarity starting from this list isreally complicated and might lead to meaningless re-sults; (2) in order to decrease computation cost, thefeatures have been applied as a filter after the compu-tation of the top 100 most similar movies according tothe plot. Thus, the application of the features do notalways improve the results gained by LSA or LDA.
To examine the quality of results of LDA andLSA, we chose three movies: two movies of a sagaand a movie without a sequel. We calculated the fivemost similar movies for each target movie and an-alyzed the outcome. Table 3 shows the results for
WEBIST�2014�-�International�Conference�on�Web�Information�Systems�and�Technologies
178
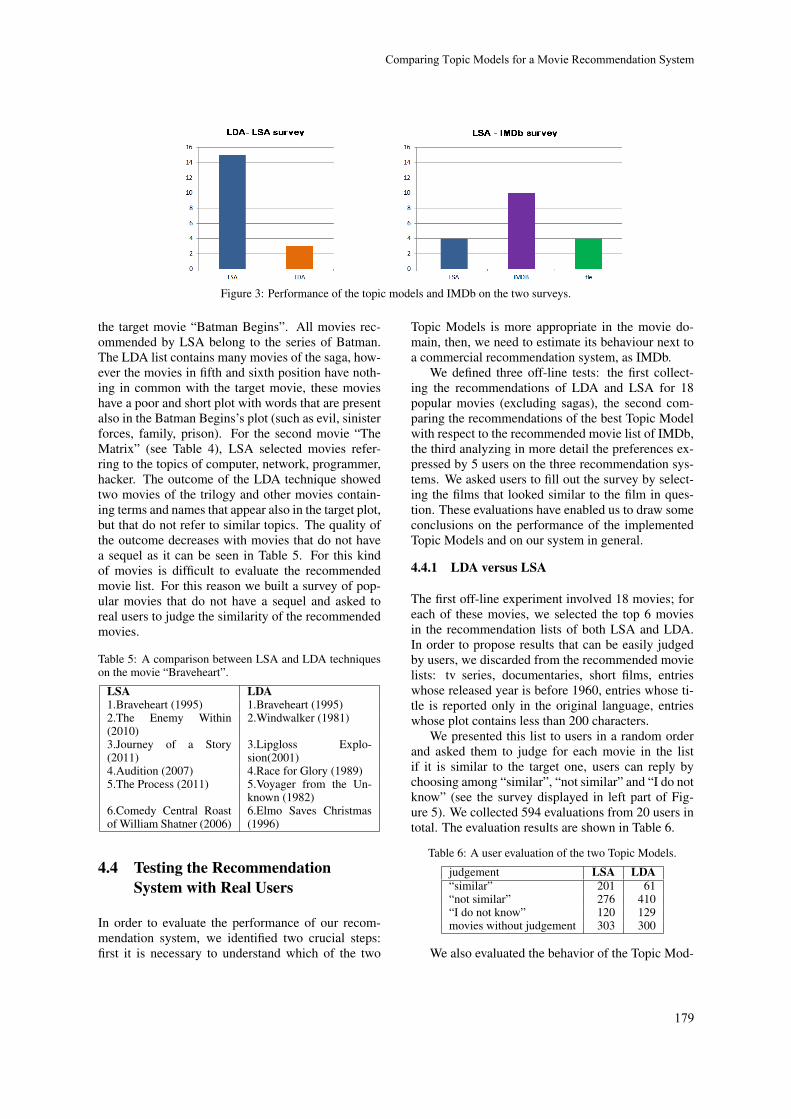
Figure 3: Performance of the topic models and IMDb on the two surveys.
the target movie “Batman Begins”. All movies rec-ommended by LSA belong to the series of Batman.The LDA list contains many movies of the saga, how-ever the movies in fifth and sixth position have noth-ing in common with the target movie, these movieshave a poor and short plot with words that are presentalso in the Batman Begins’s plot (such as evil, sinisterforces, family, prison). For the second movie “TheMatrix” (see Table 4), LSA selected movies refer-ring to the topics of computer, network, programmer,hacker. The outcome of the LDA technique showedtwo movies of the trilogy and other movies contain-ing terms and names that appear also in the target plot,but that do not refer to similar topics. The quality ofthe outcome decreases with movies that do not havea sequel as it can be seen in Table 5. For this kindof movies is difficult to evaluate the recommendedmovie list. For this reason we built a survey of pop-ular movies that do not have a sequel and asked toreal users to judge the similarity of the recommendedmovies.
Table 5: A comparison between LSA and LDA techniqueson the movie “Braveheart”.
LSA LDA1.Braveheart (1995) 1.Braveheart (1995)2.The Enemy Within(2010)
2.Windwalker (1981)
3.Journey of a Story(2011)
3.Lipgloss Explo-sion(2001)
4.Audition (2007) 4.Race for Glory (1989)5.The Process (2011) 5.Voyager from the Un-
known (1982)6.Comedy Central Roastof William Shatner (2006)
6.Elmo Saves Christmas(1996)
4.4 Testing the RecommendationSystem with Real Users
In order to evaluate the performance of our recom-mendation system, we identified two crucial steps:first it is necessary to understand which of the two
Topic Models is more appropriate in the movie do-main, then, we need to estimate its behaviour next toa commercial recommendation system, as IMDb.
We defined three off-line tests: the first collect-ing the recommendations of LDA and LSA for 18popular movies (excluding sagas), the second com-paring the recommendations of the best Topic Modelwith respect to the recommended movie list of IMDb,the third analyzing in more detail the preferences ex-pressed by 5 users on the three recommendation sys-tems. We asked users to fill out the survey by select-ing the films that looked similar to the film in ques-tion. These evaluations have enabled us to draw someconclusions on the performance of the implementedTopic Models and on our system in general.
4.4.1 LDA versus LSA
The first off-line experiment involved 18 movies; foreach of these movies, we selected the top 6 moviesin the recommendation lists of both LSA and LDA.In order to propose results that can be easily judgedby users, we discarded from the recommended movielists: tv series, documentaries, short films, entrieswhose released year is before 1960, entries whose ti-tle is reported only in the original language, entrieswhose plot contains less than 200 characters.
We presented this list to users in a random orderand asked them to judge for each movie in the listif it is similar to the target one, users can reply bychoosing among “similar”, “not similar” and “I do notknow” (see the survey displayed in left part of Fig-ure 5). We collected 594 evaluations from 20 users intotal. The evaluation results are shown in Table 6.
Table 6: A user evaluation of the two Topic Models.
judgement LSA LDA“similar” 201 61“not similar” 276 410“I do not know” 120 129movies without judgement 303 300
We also evaluated the behavior of the Topic Mod-
Comparing�Topic�Models�for�a�Movie�Recommendation�System
179

Figure 4: Percentage of users’ judgements on LSA-LDAsurvey.
els on each film: on the 18 movies, we found thatin 15 cases LSA selected the best recommendationsand in 3 cases LDA selected the best recommenda-tions (see left part of Figure 3). As expected from theprevious comparison of the two models (reported inTables 3,4,5), LSA supplied better recommendationsthan LDA. In Table 6 we have reported the total num-ber of user judgements received (here we do not con-sider the movies for which users have not expressed ajudgement).
4.4.2 LSA versus IMDb
In order to compare our system with respect to IMDb,we built another survey collecting recommendationsfor 18 popular movies (different with respect to theones used in the LDA comparison): we selected themfrom the top 250 movies of IMDb17). Also in thiscase, we extracted only the top 6 movies in the rec-ommendation lists of both LSA and IMDb.
In the previous survey, we obtained many voidanswers (i.e. on several recommended movies usersdo not expressed any opinion), moreover, some usershighlighted that filling out the entire survey was verytime consuming. Therefore, we decided to limit theoptions only to “similar”.
We presented this list to users in a random orderand asked users to judge for each movie in the list ifit is similar to the target one (see the survey displayedin right part of Figure 5). The experiment has beenconducted on 30 test participants. We collected 146evaluations from 30 users in total. On the 18 movies,we found that in 4 cases LSA selected the best recom-mendations, in 10 cases IMDb selected the best rec-ommendations and in 4 cases both systems showedthe same performances (see right part of Figure 3).
17http://www.imdb.com/chart/top
4.4.3 User Preference Evaluation
We added an in-deep evaluation of the users prefer-ences for the 18 popular movies used in 4.4.2. Thisevaluation has been based on the precision measurecomputes by using the classification of recommenda-tion results introduced in (Gunawardana and Shani,2009) (see table 7) as
Precision =#t p
#t p+# f p
Table 7: Classification of the possible results of a recom-mendation of an item to a user (Gunawardana and Shani,2009).
Recommended Not recommendedPreferred True-Positive (tp) False-Negative (fn)
Not preferred False-Positive (fp) True-Negative (tn)
On the 18 movies, we examine punctual prefer-ences expressed by 5 expert users on the top 6 items ofthe recommendation list, for this evaluation we con-sider the “similar” and “not similar” judgement ex-pressed by the users. Thus for each recommendationlist we calculate the precision of the system based onthe user judgement.
We computed the average precision among users(AVG P@6) and the standard deviation among themovies (DEV M P@6) and the users (DEV U P@6)(see table 8). AVG P@6 reflects the average ratio ofthe number of relevant movies over the top-6 recom-mended movies for all users.
We found that the precision of LDA is quite low(about half as much as the LSA precision), while bothLSA and IMDb reach a good precision. From thispreliminary evaluation (that is quite limited since itis performed only on 5 users), it seems that the aver-age precision on the entire set of movies of LSA isquite the same as the precision of IMDb. As it canbe noticed, there is however a strong deviation of theprecision value among different movies.
Table 8: Precision of the systems based on a punctual userpreference evaluation.
AVG P@6 DEV M P@6 DEV U P@6LDA 0.215 0.163 0.133LSA 0.468 0.258 0.056
IMDb 0.416 0.281 0.064
4.5 Results and Discussion
Based on the results of the above-mentioned experi-ments, we can draw some conclusions:
• LDA does not have good performance on movierecommendations: it is not able to suggest movies
WEBIST�2014�-�International�Conference�on�Web�Information�Systems�and�Technologies
180

Figure 5: A screenshot of the beginning of a page of the surveys: LDA-LSA survey on the left, and LSA-IMDb survey on theright.
of the same saga and it suggests erroneous en-tries for movies that have short plot with wordsthat are present also in the plot of the targetmovie (Sect.4.3), also the user evaluation under-lines poor quality of the LDA recommendations(Sect.4.4.1,4.4.3);
• LSA achieves good performance on movie recom-mendations: it is able to suggest movies of thesame saga and also unknown movies related to thetarget one (Sect.4.3), also the user evaluation un-derlines the good quality of the LSA recommen-dations (Sect.4.4.1,4.4.2,4.4.3);
• Although our system did not outperform theIMDb performance (Sect.4.4.2), an in-deep eval-uation of users preferences has shown that the av-erage precision gained by LSA is very close to theprecision of IMDb (Sect.4.4.3); it would thereforebe necessary to conduct an online analysis of thebehaviour of the system in order to better under-stand how it performs compared to IMDb.
Finally, we can not ignore that IMDb is stronglyaffected by user experiences: it uses features suchas user votes, genre, title, keywords, and, most im-portantly, user recommendations themselves to gen-erate an automatic response. On the contrary, ourcontent-based recommendations system is user inde-pendent.Thus, our system can be also used to makerecommendations when knowledge of users prefer-ences is not available.
5 RELATED WORK
Recommendation algorithms are usually classified incontent-based and collaborative filtering (Ekstrand
et al., 2011). Collaborative filtering systems arewidely industrially utilized, for example by Amazon,MovieLens and Netflix, and recommendation is com-puted by analysing user profiles and user ratings of theitems. When user preferences are not available, as inthe start-up phase, or not accessible, due to privacy is-sues, it might be necessary to develop a content-basedrecommendation algorithm, or combined different ap-proaches as in hybrid systems.
Among recommendation systems (Adomaviciusand Tuzhilin, 2005), content-based recommendationsystems rely on item descriptions that usually consistof punctual data.
Jinni18 is a movie recommendation system thatanalyses as well movie plots, but, differently from ourapproach, relies on user ratings, manual annotationsand machine learning techniques.
LSA was shown to perform better than the sim-pler word and n-gram feature vectors in an interestingstudy (Lee and Welsh, 2005) where several types ofvector similarity metrics (e.g., binary vs. count vec-tors, Jaccard vs. cosine vs. overlap distance measure,etc.) have been evaluated and compared.
Due to the high computational cost of LSA therehave been many work around in the area of approxi-mate matrix factorization; these algorithms maintainthe spirit of SVD but are much easier to compute (Ko-ren et al., 2009). For example, in (Gemulla et al.,2011) an effective distributed factorization algorithmbased on stochastic gradient descent is shown. Weopted for a scalable implementation of the processthat does not require the term-document matrix to bestored in memory and is therefore independent of thecorpus size (Rehurek and Sojka, 2010).
Also the LDA Topic Model has been already ap-
18http://www.jinni.com/
Comparing�Topic�Models�for�a�Movie�Recommendation�System
181

plied in recommendation systems to analyze textualinformation. In particular in (Jin et al., 2005) a Webrecommendation system to help users in locating in-formation on the Web is proposed. In this systemLDA is used as technique for discovering hidden se-mantic relationships among Web items by analyzingtheir content information. Another interesting appli-cation is described in (Krestel et al., 2009) where theauthors propose a tag recommendation system whereLDA is exploited to suggest tags for new resources.
In the specific domain of movie recommendationsystems, we found only few frameworks that makeuse of plots. In particular in (Shi et al., 2013) aContext-Aware Recommendation algorithm is intro-duced, the framework combines the similarity basedon plot keywords with a mood-specific movie similar-ity for providing recommendations. Also in (Mosh-feghi et al., 2011) authors attempts to solve thecold start problem (where there is no past rating foran item) for collaborative filtering recommendationsystems. The paper describes a framework, basedon an extended version of LDA, able to take intoaccount item-related emotions, extracted from themovie plots, and semantic data, inferred from moviefeatures.
6 CONCLUSIONS AND FUTUREWORK
The paper presented a plot-based recommendationsystem. The system classifies two videos as beingsimilar if their plots are alike. Two Topic Models,LDA and LSA, have been implemented and integratedwithin the recommendation system. The techniqueshave been compared and tested over a large collec-tion of movies. The local movie database MongoDBhas been created to store a large amount of metadatarelated to multimedia content coming from differentsources with heterogeneous schemata.
Experimental evaluation of both LDA and LSAhas been conducted to provide answers in term of ef-ficiency and effectiveness. LSA turns out to be supe-rior to LDA. The performance of both the techniqueshave been compared to user evaluation, and commer-cial approaches. LSA has been revealed to be bet-ter then LDA in supporting the suggestion of similarplots, however it does not outperform the commer-cial approach (IMDb). However, it is important tonotice that our system does not rely on human effortand can be ported to any domain where natural lan-guage descriptions exist. Moreover, a nice feature ofthe system is its independence from the movie ratingsexpressed by users; thanks to this independence, it is
able to propose famous and beloved movies as wellas old or unheard movies/programs that are similar tothe content of the video the user has watched. Thisallows the system to find strongly related movies thatother recommendation systems, such as IMDb, do notconsider, as they has a low number of ratings.
The results shown in this paper highlight somelimitations and stimulate some future directions forour research.
The plot-based recommendation techniques as-sume that the main feature a user likes in a movie isthe plot, i.e. the content of the movie, if this is not thecase, the system will fail in suggestion similar movies.Thus, we should couple our recommendation systemwith other techniques that do not totally rely on theplot.
Another major limitation is the description, i.e.the content of the plot. Most of the entries in theDBpedia collection do not have a plot. Even withina database like IMDb (the most accurate) not all theplots are described in a similar manner. Some are de-scribed by only one or two sentences, others, instead,are meticulously detailed. In addition to this, in mostof the movies, the plot is not completely revealed, andthis leads to have several movie descriptions that arepartial.
While LDA deals with polysemy issue, LSA doesnot. This problem can be faced by making use of alexical database as WordNet19. Each keyword mightbe replaced by its meaning (synset), before the appli-cation of the weight techniques. To understand whichof the synsets better express the meaning of a keywordin a plot we may adopt Word Sense Disambiguationtechniques (Navigli, 2009). The semantic relation-ships between synsets can be used for enhancing thekeyword meaning by adding all its hypernyms and hy-ponyms (Po and Sorrentino, 2011; Sorrentino et al.,2010).
We used our system to compute the similarity of amovie with other movies in the database. However, ingeneral we can use it to evaluate the similarity of tex-tual descriptions such as plots of movies not presentin the DB or news, book plots, book reviews etc.
For example, the system can find movies that con-tain a story similar to the one tell in a book, e.g. amovie or a television series that used it as a script,or dramatic movies based on true events similar to anews. The database could be expanded with othercontents to suggest further items similar to the se-lected movie (e.g. if I liked a movie about the warin Cambodia I should be interested in newspaper arti-cles, essays, or books about that topic).
19http://wordnet.princeton.edu/
WEBIST�2014�-�International�Conference�on�Web�Information�Systems�and�Technologies
182

ACKNOWLEDGEMENTS
We want to express our gratitude to Tania Farinella,Matteo Abbruzzo and Olga Kryukova, master stu-dents in Computer Engineering and Science at the De-partment of Engineering “Enzo Ferrari” at Universityof Modena and Reggio Emilia for their contributionin term of implementation of the first and second ver-sion of the system (without and with LDA) and fortheir support during the evaluation of the system.
Particular appreciation goes to Thomas Wernerand Andreas Lahr20, founders of vfree.it, for theirsuggestions and valuable comments on the paper.
REFERENCES
Adomavicius, G. and Tuzhilin, A. (2005). Toward the nextgeneration of recommender systems: A survey of thestate-of-the-art and possible extensions. IEEE Trans.on Knowl. and Data Eng., 17(6):734–749.
Blei, D. M., Ng, A. Y., and Jordan, M. I. (2003). Latentdirichlet allocation. Journal of Machine Learning Re-search, 3:993–1022.
Debnath, S., Ganguly, N., and Mitra, P. (2008). Featureweighting in content based recommendation systemusing social network analysis. In Proceedings of the17th international conference on World Wide Web,WWW ’08, pages 1041–1042, New York, NY, USA.ACM.
Deerwester, S., Dumais, S. T., Furnas, G. W., Landauer,T. K., and Harshman, R. (1990). Indexing by latentsemantic analysis. Journal of the American Societyfor Information Science, 41(6):391–407.
Dumais, S. T. (2004). Latent semantic analysis. An-nual Review of Information Science and Technology,38(1):188–230.
Ekstrand, M. D., Riedl, J. T., and Konstan, J. A. (2011).Collaborative filtering recommender systems. Found.Trends Hum.-Comput. Interact., 4(2):81–173.
Farinella, T., Bergamaschi, S., and Po, L. (2012). A non-intrusive movie recommendation system. In OTMConferences (2), pages 736–751.
Gemulla, R., Nijkamp, E., Haas, P. J., and Sismanis, Y.(2011). Large-scale matrix factorization with dis-tributed stochastic gradient descent. In Proceedingsof the 17th ACM SIGKDD international conferenceon Knowledge discovery and data mining, KDD ’11,pages 69–77, New York, NY, USA. ACM.
Griffiths, T., Steyvers, M., and Tenenbaum, J. (2007). Top-ics in semantic representation. Psychological Review,114(2):211–244.
Gunawardana, A. and Shani, G. (2009). A survey of ac-curacy evaluation metrics of recommendation tasks.The Journal of Machine Learning Research, 10:2935–2962.
[email protected], [email protected]
Jin, X., Mobasher, B., and Zhou, Y. (2005). A web rec-ommendation system based on maximum entropy. InITCC (1), pages 213–218. IEEE Computer Society.
Koren, Y., Bell, R., and Volinsky, C. (2009). Matrix factor-ization techniques for recommender systems. Com-puter, 42(8):30–37.
Krestel, R., Fankhauser, P., and Nejdl, W. (2009). La-tent dirichlet allocation for tag recommendation. InBergman, L. D., Tuzhilin, A., Burke, R. D., Felfernig,A., and Schmidt-Thieme, L., editors, RecSys, pages61–68. ACM.
Lee, M. D. and Welsh, M. (2005). An empirical evaluationof models of text document similarity. In Proceed-ings of the 27th Annual Conference of the CognitiveScience Society, CogSci2005, pages 1254–1259. Erl-baum.
Moshfeghi, Y., Piwowarski, B., and Jose, J. M. (2011).Handling data sparsity in collaborative filtering usingemotion and semantic based features. In Proceedingsof the 34th International ACM SIGIR Conference onResearch and Development in Information Retrieval,SIGIR ’11, pages 625–634, New York, NY, USA.ACM.
Musto, C. (2010). Enhanced vector space models forcontent-based recommender systems. In Proceedingsof the Fourth ACM Conference on Recommender Sys-tems, RecSys ’10, pages 361–364, New York, NY,USA. ACM.
Navigli, R. (2009). Word sense disambiguation: A survey.ACM Comput. Surv., 41(2).
Park, L. A. F. and Ramamohanarao, K. (2009). An analysisof latent semantic term self-correlation. ACM Trans.Inf. Syst., 27(2):8:1–8:35.
Po, L. and Sorrentino, S. (2011). Automatic generationof probabilistic relationships for improving schemamatching. Inf. Syst., 36(2):192–208.
Rashid, A. M., Karypis, G., and Riedl, J. (2008). Learn-ing preferences of new users in recommender systems:an information theoretic approach. SIGKDD Explor.Newsl., 10(2):90–100.
Rehurek, R. and Sojka, P. (2010). Software Frameworkfor Topic Modelling with Large Corpora. In Proceed-ings of the LREC 2010 Workshop on New Challengesfor NLP Frameworks, pages 45–50, Valletta, Malta.ELRA. http://is.muni.cz/publication/884893/en.
Salton, G., Wong, A., and Yang, C. S. (1975). A vectorspace model for automatic indexing. Commun. ACM,18:613–620.
Shi, Y., Larson, M., and Hanjalic, A. (2013). Mining con-textual movie similarity with matrix factorization forcontext-aware recommendation. ACM Trans. Intell.Syst. Technol., 4(1):16:1–16:19.
Sorrentino, S., Bergamaschi, S., Gawinecki, M., and Po,L. (2010). Schema label normalization for improvingschema matching. Data Knowl. Eng., 69(12):1254–1273.
Comparing�Topic�Models�for�a�Movie�Recommendation�System
183
Product Feature Taxonomy Learning based on User Reviews
Nan Tian1, Yue Xu1, Yuefeng Li1, Ahmad Abdel-Hafez1 and Audun Josang2
1Faculty of Science and Engineering, Queensland University of Technology, Brisbane, Australia2Department of Informatics, University of Oslo, Oslo, Norway
fn.tian, yue.xu, y2.li, [email protected], [email protected]
Keywords: Feature Extraction, Opinion Mining, Association Rules, Feature Taxonomy, User Reviews.
Abstract: In recent years, the Web 2.0 has provided considerable facilities for people to create, share and exchange in-formation and ideas. Upon this, the user generated content, such as reviews, has exploded. Such data providea rich source to exploit in order to identify the information associated with specific reviewed items. Opin-ion mining has been widely used to identify the significant features of items (e.g., cameras) based upon userreviews. Feature extraction is the most critical step to identify useful information from texts. Most existingapproaches only find individual features about a product without revealing the structural relationships betweenthe features which usually exist. In this paper, we propose an approach to extract features and feature rela-tionships, represented as a tree structure called feature taxonomy, based on frequent patterns and associationsbetween patterns derived from user reviews. The generated feature taxonomy profiles the product at multi-ple levels and provides more detailed information about the product. Our experiment results based on somepopularly used review datasets show that our proposed approach is able to capture the product features andrelations effectively.
1 INTRODUCTION
In recent years, the user generated online content ex-ploded due to the advent of Web 2.0. For instance,online users write reviews to how they enjoy or dis-like a product they purchased. This helps to identifyfeatures or characteristics of the product from users’point of view, which is an important addition to theproduct specification. However, to identify the rele-vant features from users’ subjective review data is ex-tremely challenging.
Feature-based opinion mining has attracted big at-tention recently. A significant amount of researchhas been proposed to improve the accuracy of featuregeneration for products (Hu and Liu, 2004a; Scaffidiet al., 2007; Hu et al., 2010; Zhang and Zhu, 2013;Popescu and Etzioni, 2005; Ding et al., 2008). How-ever, most techniques only extract features; the struc-tural relationship between product features has beenomitted. For example, “picture resolution” is a com-mon feature of digital camera in which “resolution”expresses the specific feature concept to describe thegeneral feature “picture”. Yet, existing approachestreat “resolution” and “picture” as two individualfeatures instead of finding the relationship betweenthem. Thus, the information derived by existing fea-ture extraction approaches is not sufficient for gen-
erating a precise product model since all features areallocated in the same level and independent from eachother.
Association rule mining is a well explored methodin data mining (Pasquier et al., 1999). Based on asso-ciation rules generated from a collection of item trans-actions, we can discover the relations between items.However, the amount of generated association rulesis usually huge and selecting the most useful rules ischallenging (Xu et al., 2011). In our research, we pro-pose to identify a group of frequent patterns as po-tential features to assist selecting useful associationrules. The selected rules are used to identify relation-ships between features. Furthermore, in order to en-sure that the most useful rules are to be selected, wealso propose to apply statistical topic modelling tech-nique (Blei et al., 2003) to the selection of associationrules.
Our approach takes advantages of existing featureextraction approaches and makes two contributions.Firstly, we present a method to make use of associa-tion rules to find related features. Secondly, we createa product model called feature taxonomy which rep-resents the product more accurately by explicitly rep-resenting the concrete relationships between generalfeatures and specific features.
184

2 RELATED WORK
Our research aims to extract useful product infor-mation based on user generated information to cre-ate a product model. This work is closely related tofeature-based opinion mining which has drawn manyresearchers’ attention in recent years. In detail, iden-tifying features that have been mentioned by users isconsidered the most significant step in opinion mining(Hai et al., 2013). Hu and Liu (2004) first proposeda feature-based opinion mining method to extract fea-tures and sentiments from customer reviews. Theyuse pattern mining to find frequent itemsets (nouns).These itemsets are pruned and considered frequentproduct features. A list of sentiment words (adjec-tives) that are nearby frequent features in reviewscan be extracted and used to identify those productfeatures that cannot be identified by pattern mining.Scaffidi et al. (2007) improved the performance offeature extraction in their proposed system called RedOpal. Specifically, they made use of a language modelto find features by comparing the frequency of nounsin the review and in common use of English. Thosefrequent nouns in both reviews and in common useare considered invalid features. Hu et al. (2010)make use of SentiWordNet to identify all sentencesthat may contain users’ sentiment polarity. Then, thepattern mining is applied to generate explicit featuresbased on these opinionated sentences. In addition, amapping database has been constructed to find thoseimplicit features represented by sentiment words(e.g.,expensive indicates price). To enhance the accuracyof finding correct features from free text review, Haiet al (2013) proposed a novel method which evaluatesthe domain relevance of a feature by exploiting fea-tures’ distribution disparities across different corpora(domain-dependent review corpus such as cellphonereviews and domain-irrelevant corpus such as culturearticle collection). In detail, the intrinsic-domain rel-evance (IDR) and extrinsic-domain relevance (EDR)have been proposed to benchmark if a examined fea-ture is related to a certain domain. The candidatefeature with low IDR and high EDR scores will bepruned.
Lau et al. (2009) presented an ontology-basedapproach to profile the product. In detail, a numberof ontology levels, such as feature level that containsidentified features for a certain product and sentimentlevel in which sentiment words that describe a certainfeature are stored, have been constructed (Lau et al.,2009). This method provides a simple product profilerather than extracting product features only.
The statistical topic modeling technique has beenused in various fields such as text mining (Blei et al.,
2003; Hofmann, 2001) in recent years. Latent Se-mantic Analysis (LSA) is first proposed to capturethe most significant features of a document collec-tion based upon semantic structure of relevant doc-uments (Lewis, 1992). Then, Probabilistic LSA(pLSA) (Hofmann, 2001) and Latent Dirichlet Allo-cation (LDA) (Blei et al., 2003) are proposed to im-prove the interpretation of results from LSA. Thesetechniques have been proven more effective on doc-ument modeling and topic extraction, which are rep-resented by topic-document and word-topic distribu-tion, respectively. Particularly, multinomial distribu-tion over words which is derived based upon word fre-quency can be generated to represent topics in a giventext collection.
None of aforementioned feature identification ap-proaches is able to identify the relationships betweenthe extracted product features. The structural relation-ships that exist between features can be used to de-scribe the reviewed product in more depth. However,how to evaluate and determine the relations betweenfeatures is still challenging.
The remainder of the paper is organized as fol-lows. The next section illustrates the constructionprocess of our proposed feature taxonomy. Then, theevaluation of our approach is reported afterwards. Fi-nally, we conclude and describe future direction ofour research work.
3 THE PROPOSED APPROACH
Our proposed approach consists of two main steps:product taxonomy construction using associationrules and taxonomy expansion based on reference fea-tures. The input of our system is a collection of userreviews for a certain product. The output is a productfeature taxonomy which contains not only all gener-ated features but also the relationships between them.
3.1 Pre-processing and Transaction FileGeneration
First of all, we construct a single document called anaggregated review document which combines all thereviews in a collection of reviews, keeping each sen-tence in the original reviews as one sentence in theconstructed aggregated review document. Three stepsare undertaken to process the review text in order toextract useful information. Firstly, we generate thepart-of-speech (POS) tag for each word in the aggre-gated review document to indicate whether the wordis a noun, adjective or adverb etc. For instance, af-ter the POS tagging,“The flash is very weak.” would
Product�Feature�Taxonomy�Learning�based�on�User�Reviews
185
be transformed to “The/DT flash/NN is/VBZ very/RBweak/JJ ./.”, where DT, NN, VBZ, RB, and JJ repre-sent Determiner, Noun, Verb, Adverb and Adjective,respectively. Secondly, according to the thumb rulethat most product features are nouns or noun phrases(Hu and Liu, 2004b), we process each sentence inthe aggregated review document to only keep wordsthat are nouns. All the remaining nouns are also pre-processed by stemming and spelling correction. Eachsentence in the aggregated review document consistsof all identified nouns of a sentence in the originalreviews. Finally, a transactional dataset is generatedfrom the aggregated review document. Each sentencewhich consists of a sequence of nouns in the aggre-gated review document is treated as a transaction inthe transactional dataset.
3.2 Potential Features Generation
Our first task is to generate potential product featuresthat are expressed by those identified nouns or nounphrases. According to (Hu and Liu, 2004a), signif-icant product features are discussed extensively byusers in reviews (e.g.,“battery” for cameras). Uponthis, most existing feature extraction approachesmake use of pattern mining techniques to find poten-tial features. Specifically, an itemset is a set of items(i.e., words in review text in this paper) that appeartogether in one or multiple transactions in a transac-tional dataset. Given a set of items, I = fi1; i2; :::; ing,an itemset is defined as X � I. The support of anitemset X, denoted as Supp(X), is the percentage oftransactions in the dataset that contain X. All frequentitemsets from a set of transactions that satisfy a user-specified minimum support will be extracted as thepotential features. However, not all frequent item-sets are genuine since some of them may be just fre-quent but meaningless. We use compactness pruningmethod proposed by (Hu and Liu, 2004a) to filter fre-quent itemsets. After the pruning, we can get a listof frequent itemsets that are considered potential fea-tures, denoted as FP.
3.3 Product Feature TaxonomyConstruction
In this step, we propose to utilize association rulesgenerated from the discovered potential product fea-tures to identify relations in order to construct a fea-ture taxonomy.
Association rule mining can be described as fol-lows: Let I = fi1; i2; :::; ing, be a set of items, andthe dataset consists of a set of transactions D =ft1; t2; :::; tmg. Each transaction t contains a subset of
items from I. Therefore, an association rule r repre-sents an implication relationship between two item-sets which can be defined as the form X ! Y , whereX , Y � I and X \Y = /0. The itemsets X and Y arecalled antecedent and consequent of the rule, respec-tively. To assist selecting useful rules, the supportSupp(X [Y ) and the confidence Con f (X!Y ) of therule can be used (Xu et al., 2011).
For easily describing our approach, we definesome useful and important concepts as follows:
Definition 1 (Feature Taxonomy): A feature tax-onomy consists of a set of features and their relation-ships, denoted as FH = fF;Lg, F is a set of featureswhere F = f f1; f2; :::; fng and L is a set of relations.The feature taxonomy has the following constraints:
(1) The relationship between a pair of features is thesub-feature relationship. For fi; f j 2 F , if f j isa sub feature of fi, then ( fi; f j) is a link in thetaxonomy and ( fi; f j) 2 L, which indicates that f jis more specific than fi. fi is called the parentfeature of f j and denoted as P( f j).
(2) Except for the root, each feature has only oneparent feature. This means that the taxonomy isstructured as a tree.
(3) The root of the taxonomy represents the productitself.
Definition 2 (Feature Existence):For a given fea-ture taxonomy FH = fF;Lg, let W (g) represent aset of words that appear in a potential feature g, letES(g) =
naijai 2 2w(g);ai 2 F
ocontain all subsets of
g which exist in the feature taxonomy, ES(g) is calledthe existing subsets of g, if
Sai2ES(g)
W (ai) = W (g),
then g is considered exist in FH, denoted as exist(g),otherwise :exist(g).
Opinion mining is also referred as sentiment anal-ysis (Subrahmanian and Reforgiato, 2008; Abbasiet al., 2008; Wright, 2009). Adjectives or adverbsthat appear together with product features are consid-ered as the sentiment words in opinion mining. Thefollowing definition defines the sentiment words thatare related to a product feature.
Definition 3 (Related Sentiments): For a featuref 2 F , let RS( f ) denote a set of sentiment wordswhich appear in the same sentences as f in user re-views, RS( f ) is defined as the related sentiments off .
Definition 4 (Sentiment Sharing): For featuresf1; f2 2 F , the sentiment sharing between f1 and f2is defined as SS ( f1; f2) = jRS ( f1)\RS ( f2) j.
For deriving sub features using association rules,we need to select a set of useful rules rather than usingall the rules. In the next two subsections, we will first
WEBIST�2014�-�International�Conference�on�Web�Information�Systems�and�Technologies
186

propose two methods to select rules, one method isto select rules based on the sentiment sharing amongfeatures and the other method is to select rules byusing the word relatedness derived from the resultsgenerated by using the typical topic model techniquemethod LDA (Blei et al., 2003); then introduce somestrategies to update the feature taxonomy by addingsub features using the selected rules.
In order to explain the topic modelling basedmethod, we first define some related concepts. LetRE = fr1;r2; :::;rMg be a collection of reviews, eachreview consists of nouns only, W = fw1;w2; :::;wngbe a set of words appearing in RE, and Z =fZ1; :::;Zvg be a set of pre-specified hidden topics.LDA can be used to generate topic models for rep-resenting the collection as a whole and also for eachreview in the collection. At the collection level, thetopic model represents the collection RE using a setof topics each of which is represented by a probabil-ity distribution over words (i.e., nouns in the contextof this paper) for topic. In this paper, we will use thecollection level representation to find the relatednessbetween words.
At collection level, each topic Z j is representedby a probability distribution over words, f j =fp(w1jZ j) ; p(w2jZ j) ; :::; p(wnjZ j)g;ån
k=1 j j;k = 1,p(wkjZ j) is the probability of word wk being usedto represent the topic Z j. Based on the probabilityp(wkjZ j), we can choose the top words to representthe topic Z j.
Definition 5 (Topic Words): Let f j =fp(w1jZ j) ; p(w2jZ j) ; :::; p(wnjZ j)g be the topicrepresentation for topic Z j produced by LDAand 0 � d � 1 be a threshold, a set of the topicwords for Z j, denoted as TW (Z j), is defined asTW (Z j) = fwjw 2W; p(wjZ j)> dg.
Definition 6 (Word Relatedness): We use wordrelatedness to indicate how likely that two words havebeen used to represent a topic together. Let wi;w j 2W be two words, the word relatedness between twowords with respect to topic z is defined below:
WRz(wi;w j) =
8<: 1�jp(wijz)� p(w jjz)j wi 2 TW (z)and w j 2 TW (z)
0 otherwise(1)
Definition 7 (Feature Topic Representation):For feature f 2 F , let WD( f ) be a set of words ap-pearing in f and TW (z) be the topic words of topicz. If WD( f ) � TW (z), the feature topic representa-tion of feature f for topic z is defined as FT P( f ;z) =f(w; p(wjz)) jw 2WD( f )g.
Definition 8 (Feature Relatedness): For featuresfi; f j 2 F , if both features appear in a certain topic
z, then the feature relatedness between fi and f j withrespect to z is defined as:
FRz( fi; f j) = minwi2WD( fi)w j2WD( f j)
fWRz(wi;w j)g (2)
3.3.1 Rule Selection
Let R = fr1;r2; :::;rng be a set of association rulesgenerated from the frequent itemsets FP, each rule rin R has the form Xr!Yr, Xr and Yr are the antecedentand consequent of r, respectively.
Assuming that fe is a feature which has alreadybeen in the current feature taxonomy FH, to generatethe sub features for fe, we first select a set of can-didate rules, denoted as Rc
fe, which could be used to
generate the sub features:
Rcfe= fX ! Y jX ! Y 2 R;X = fe;
Supp(X)> (Y )g(3)
As defined in Equation (3), the rules in Rcfe
shouldsatisfy two constraints. The first constraint, X = fe,specifies that the antecedent of a selected rule mustbe the same as the feature fe. Sub features repre-sent specific cases of a feature, they are more spe-cific compared to the feature. The second constraintis based on the assumption that more frequent item-sets usually represent more general concepts, and lessfrequent itemsets usually represent more specific con-cepts. For instance, according to our observation to-ward features, a general feature (e.g., “picture”, itsfrequency is 62) appears more frequently than a spe-cific feature (e.g., “resolution”, its frequency is 9)in reviews for the camera 2 in the dataset publishedby Liu (Ding et al., 2008). Therefore, only the ruleswhich can derive more specific features will be se-lected.
However, not all selected rules represent correctsub-feature relationship. For instance, mode! autois more appropriate for describing a sub-feature rela-tionship rather than camera! auto. Therefore, therule camera! auto should not be considered whenwe generate the sub features for “camera”. Uponthis, we aim to prune the unnecessary rules beforegenerating sub features for each taxonomy feature.Firstly, a feature and its sub features should share sim-ilar sentiment words since they describe the same as-pect of a product at different abstract levels (e.g., vividcan be use to describe both picture and color). There-fore, we should select rules whose antecedent (rep-resenting the feature) and consequent (representing apossible sub feature) share as many sentiment wordsas possible because the more sentiment words theyshare, the more possible they are about the same as-pect of the product. Secondly, based on topic models
Product�Feature�Taxonomy�Learning�based�on�User�Reviews
187
generated from LDA, the more a feature and its po-tential sub feature appear in the same topics, the morelikely they are related to each other.
Let fX , fY be two features and Z( fX ; fY ) be a set oftopics that contains both features, the feature related-ness between fX ; fY with respect to all topics, denotedas FRavg( fX ; fY ), is defined as the average feature re-latedness between the two features over Z( fX ; fY ):
FRavg( fX ; fY ) =åz2Z( fX ; fY )
FRz( fX ; fY )
jZ( fX ; fY )j(4)
Based on this view, we propose the following equa-tion to calculate a score for each candidate rule X!Yin Rc
fe:
Weigh(X ! Y ) = a(Supp(Y )�Con f (X ! Y ))+
bSS(X ;Y )
jRS(X)[RS(Y )j+ gFRavg(X ;Y )
(5)
0 < a;b;g < 1. The value of a;b; and g is set to0.8, 0.1, and 0.1, respectively in our experiment de-scribed in Section 4. There are three parts in Equation(5). The first part is used to measure the belief to theconsequent Y by using this rule since Con f (X ! Y )measures the confidence to the association between Xand Y and Supp(Y ) measures the popularity of Y . Thesecond part is the percentage of the shared sentimentwords given by SS(X ;Y ) over all the sentiment wordsused for either X or Y . Yet, the third part in the equa-tion is the average feature relatedness between X andY . Given a threshold s, we propose to use the fol-lowing equation to select the rules from the candidaterules in Rc
fe. The rules in R fe will be used to derive
sub features for the features in FP. R fe is called therule set of fe.
R fe = fX ! Y jX ! Y 2 Rcfe;
Weigh(X ! Y )> sg(6)
3.3.2 Feature Taxonomy Construction
Let FH = fF;Lg be a feature taxonomy which couldbe an empty tree, FP be a set of frequent itemsetsgenerated from user reviews which are potential fea-tures, and R be a set of rules generated from user re-views. This task is to construct a feature taxonomyif F is empty or update the feature taxonomy if F isnot empty by using the rules in R. Let UF be a setof features on the tree which need to be processed inorder to construct or update the tree. If F is empty,the itemset in FP which has the highest support willbe chosen as the root of FH, it will be the only item
in UF at the beginning. If F is not empty, UF will beF , i.e., UF = F .
Without losing generality, assuming that F is notempty and the set of features currently on the tree,UF is the set of features which need to be processedto update or construct the tree. For each feature inUF , let fe be a feature in UF , i.e., fe 2 UF andX ! Y 2 R fe be a rule with X = fe, the next step isto decide whether or not Y should be added to thefeature taxonomy as a sub feature of fe. There aretwo possible situations: Y does not exist in the featuretaxonomy, i.e., :exist(Y ) and Y does exist in the tax-onomy, i.e., exist(Y ). In the first situation, the featuretaxonomy will be updated by adding Y as a sub fea-ture of fe, i.e., F = F [fYg, L = L[ ( fe;Y ), and Yshould be added to UF for further checking.
In the second situation, i.e., Y already exists in thetaxonomy, i.e., according to Definition 2, there aretwo cases, Y =2 ES(Y ) (i.e., Y is not in the tree) orY 2 ES(Y ) (i.e., Y is in the tree). In the first case,Y is not considered a sub feature of fe and conse-quently, no change is required to the tree. In the sec-ond case, 9 fy 2 F , fy is the parent feature of Y , i.e.,P(Y ) = fy and ( fy;Y ) 2 L. Now, we need to deter-mine whether to keep fy as the parent feature of Yor change the parent feature of Y to fe. That is, weneed to examine fy and fe to see which of them ismore suitable to be the parent feature of Y . The ba-sic strategy is to compare fy and fe to see which ofthem has more sentiment sharing and feature related-ness with Y . Let fP; fC be a potential parent featureand sub feature, respectively. We propose a rank-ing equation to indicate how likely fC is related tofP: Q( fP; fC) =
SS( fP; fC)RS( fC)
+ FRavg( fP; fC). Thus, ifQ( fy;Y ) < Q( fe;Y ), the link ( fy;Y ) will be removedfrom the taxonomy tree, ( fe;Y ) will be added to thetree, otherwise, no change to the tree and fy is still theparent feature of Y .
3.3.3 Algorithms
The construction of the feature taxonomy is to gener-ate a feature tree by finding all sub features for eachfeature. In this section, we will describe the algo-rithms to construct the feature taxonomy. As men-tioned above, if the tree is empty, the feature with thehighest support will be chosen as the root. So, at thevery beginning, F and UF contain at least one itemwhich is the root. Algorithm 1 describes the methodto construct or update a feature taxonomy.
After the taxonomy construction, some potentialfeatures may be left over in RF and have not beenadded to the taxonomy. The main reason is becausethese itemsets may not frequently occur in the reviews
WEBIST�2014�-�International�Conference�on�Web�Information�Systems�and�Technologies
188

Algorithm 1:Feature Taxonomy Construction.
Input:R, FH = fF;Lg, FP.
Output:FH, RF //RF is the remaining features which arenot added to FH after the construction
1: if F = /0, then root := argmax f2FPfsupp( f )g;F :=UF := frootg;
2: else UF := F ;3: for each feature fe 2UF4: if R fe 6= /0 //the rule set of fe is not empty5: for each rule X ! Y 2 R fe6: if :exist(Y ) //Y does not exist on the tree7: F := F [fYg;L := L[ ( fe;Y );
UF :=UF [fYg;FP := FP�fYg;8: else //Y exists on the tree9: if Y 2 ES(Y ) and Q( fy;Y )< Q( fe;Y )
// fy is Y 0s parent feature10: L := L[ ( fe;Y );L := L� ( fy;Y );
//add ( fe;Y ) and remove ( fy;Y )11: else //Y =2 ES(Y ), Y is not on the tree12: FP := FP�fYg;13: endfor14: endif15: UF :=UF�f feg; //remove fe from UF16: endfor17: RF := FP
together with the features that have been added in thetaxonomy. In order to prevent valid features from be-ing missed out, we check those remaining itemsets inRF by examining the shared sentiment words and fea-ture relatedness between the remaining itemsets andthe features in the taxonomy. Let FH = fF;Lg bethe constructed feature taxonomy, RF be the set ofremaining potential features, for a potential feature gin RF , the basic strategy to determine whether g is afeature or not is to examine the Q ranking between gand the features in the taxonomy. Let Fg = f f j f 2F;Q( f ;g) > 0g be a set of features which are relatedto g, if Fg 6= /0, g is considered a feature. The most re-lated feature is defined as fm = argmax f2FgfQ( f ;g)g.g will be added to the taxonomy with fm as its parentfeature. If there are multiple such features fm whichhave the highest ranking score with g, the one with thehighest support will be chosen as the parent feature ofg.
Algorithm 2 formally describes the method men-tioned above to expand the taxonomy by adding theremaining features.
After the expansion, the features left over in RFare not considered as features for this product.
Algorithm 2: Feature Taxonomy Expansion.
Input:FH = fF;Lg, RF .
Output:FH
1: for each feature g 2 RF2: if (Fg := f f j f 2 F;Q( f ;g)> 0g) 6= /0
3: M := faja 2 Fg andQ(a;g) = max f2FgfQ( f ;g)gg
4: fm := argmax f2Mfsupp( f )g5: F := F [fgg, L := L[ ( fm;g)6: RF := RF�fgg
4 EXPERIMENT ANDEVALUATION
We use three datasets in the experiments. Each datasetcontains user reviews for a certain type of digital cam-eras. One dataset is used in (Hu and Liu, 2004a),while the other two are used in (Ding et al., 2008).Each review in the datasets has been manually anno-tated. In detail, a human examiner read a review sen-tence by sentence. If a sentence is considered indicat-ing the user’s opinions, such as positive and negative,all possible features in the sentence that are modifiedby sentiment words are tagged. We take these anno-tated features as the correct features to evaluate theperformance of our proposed method in feature ex-traction. The number of reviews and number of anno-tated features are 51 and 98 for camera 1, 34 and 75for camera 2, and 45 and 105 for camera 3.
Our proposed feature taxonomy captures bothproduct features and relations between features.Therefore, the evaluations are twofold: feature extrac-tion evaluation and structural relations evaluation.
4.1 Feature Extraction Evaluation
First of all, we evaluate the performance of our ap-proach by examining the number of accurate featuresin user reviews that have been extracted. We use thefeature extraction method (FBS) proposed in (Hu andLiu, 2004a) as the baseline for comparison. In ad-dition, in order to examine the effectiveness of usingthe sentiment sharing measure, the feature relatednessmeasure, and the combination of the two, we conductour experiment in four runs:(1) Rule: construct the feature taxonomy by only uti-
lizing the information of association rules (i.e.,support and confidence value only) without usingthe sentiment sharing and the feature relatednessmeasures;
Product�Feature�Taxonomy�Learning�based�on�User�Reviews
189

(2) SS: construct the feature taxonomy by taking theinformation of association rules and the sentimentsharing measure without using the feature related-ness measure;
(3) FR: construct the feature taxonomy by taking theinformation of association rules and the featurerelatedness measure without using the sentimentsharing measure;
(4) Hybrid: the sentiment sharing and the feature re-latedness are combined together with the informa-tion of association rules to construct the featuretaxonomy.
Table 1: Recall Comparison.Camera 1 Camera 2 Camera 3 Average
FBS 0.57 0.63 0.57 0.59Rule 0.38 0.52 0.45 0.45SS 0.56 0.65 0.58 0.60FR 0.56 0.67 0.58 0.60Hybrid 0.56 0.68 0.58 0.61
Table 2: Precision Comparison.Camera 1 Camera 2 Camera 3 Average
FBS 0.45 0.42 0.51 0.46Rule 0.55 0.57 0.74 0.62SS 0.62 0.57 0.63 0.61FR 0.60 0.56 0.63 0.60Hybrid 0.62 0.59 0.68 0.63
Table 3: F1 Score Comparison.Camera 1 Camera 2 Camera 3 Average
FBS 0.50 0.50 0.54 0.51Rule 0.45 0.54 0.56 0.52SS 0.59 0.61 0.60 0.60FR 0.58 0.61 0.60 0.60Hybrid 0.59 0.63 0.63 0.62
Table 1, 2, 3 illustrate the recall, precision, and F1score results produced in the four runs, respectively.From the results, we can see that using both the senti-ment sharing and feature relatedness can obtain betterfeature extraction performance than the use of asso-ciation rule’s information only. In particular, the hy-brid method, which uses both sentiment sharing andfeature relatedness, achieves the best results in mostcases. However, the size of the review dataset andthe number of annotated features can affect the pre-cision and recall, which makes the values of the pre-cision and recall vary in different range for differentdatasets. For instance, camera 3 has higher precisionvalues than camera 2 due to more reviews in camera3 dataset than that in camera 2 dataset, but camera3 has lower recall values than camera 2 due to moremanually annotated features in camera 3 dataset.
4.2 Structural Relation Evaluation
The evaluation of the relations requires the standardtaxonomy or knowledge from experts (Tang et al.,
2009). Since there is no existing standard taxonomyavailable for comparison, we manually created taxon-omy for the three cameras according to the producttechnical specifications provided online by manufac-ture organizations1, 2, 3. From the product specifica-tions on these websites, each camera has a numberof attributes such as lens system and shooting modes.In addition, each attribute may also have several subattributes. For instance, the shooting modes of thecamera contains more specific attributes (e.g., intelli-gent auto and custom). Based upon such information,we create the product feature taxonomy for three dig-ital cameras and use the taxonomy as the testing tax-onomy, called Manual Feature Taxonomy (MFT ), toevaluate the relations within our proposed feature tax-onomy.
Due to the difference between the technical spec-ifications from domain experts and the subjective re-views from online users, the words used to representa feature in user reviews are very often different fromthe words for the same feature specified by domainexperts in the product specification. For example, thefeature lens system in the testing taxonomy and thefeature lens in our generated taxonomy should be thesame according to common knowledge even thoughthey are not exactly matched with each other. Be-cause of this fact, we will determine the match be-tween two features based on overlapping of the twofeatures rather than exact matching.
Let MFT = fFMFT ;LMFTg be the testing taxon-omy with FMFT being a set of standard features givenby domain experts and LMFT being a set of links inthe testing taxonomy. For a given link ( fF p; fFc) 2 Lin the constructed product feature taxonomy and twofeatures fMp; fMc 2 FMFT in the testing taxonomy, thelink ( fF p; fFc) is considered matched with ( fMp; fMc)and therefore represent a correct feature relation if thefollowing conditions are satisfied:1. W ( fMp)\W ( fF p) 6= /0 and W ( fMc)\W ( fFc) 6= /0
2. There exists a path in MFT ,h fMp; f1; f2; :::; fn; fMci, ( fMp; f1), ( fi; fi+1),( fn; fMc) 2 LMFT , i = 1; :::;n�1We examine the testing taxonomy and the con-
structed taxonomy to identify all matched links in theconstructed taxonomy. The traditional measures pre-cision and recall are used to evaluate the correctnessof the feature relations in the constructed feature tax-onomy. Let ML(FH) denote the matched links in
1http://www.canon.com.au/Personal/Products/Camerasand-Accessories/Digital-Cameras/PowerShot-S100
2http://www.nikonusa.com/en/Nikon-Products/Product/Compact-Digital-Cameras/26332/COOLPIX-S4300.html
3http://www.usa.canon.com/cusa/support/consumer/digitalcameras/powershot g series/powershot g3]Specifications
WEBIST�2014�-�International�Conference�on�Web�Information�Systems�and�Technologies
190

Figure 1: Constructed Feature Taxonomy.
Figure 2: Testing Feature Taxonomy.
the constructed taxonomy, the precision and recall aredefined as : Precision = ML(FH)=jLj and Recall =ML(FH)=jLMFT j.
Table 4: Recall and Precision of Relation EvaluationRelations in MFT Relations in FH Recall Precision
Camera 1 75 97 0.40 0.46Camera 2 63 97 0.57 0.65Camera 3 71 102 0.51 0.57
Table 4 illustrates the evaluation results includ-ing the number of relations within the testing tax-onomy, the number of relations within our generatedtaxonomy, recall and precision for the three differentcameras, respectively. From the results, we can seethat our generated feature taxonomy correctly cap-ture around 50% of the relationships. Figure 1 andFigure 2 show a part of the feature taxonomy gen-erated from our proposed approach and the testingtaxonomy generated based on the product specifica-tion available online given by domain experts, respec-tively. From the comparison, our generated featuretaxonomy identifies the relation between picture andresolution. Although the testing taxonomy uses moretechnical terms, which are image sensor instead ofpicture; in fact, they refer to the same attribute of thecamera according to common knowledge. Similarly,the (mode,auto) and (shooting modes,intelligent auto)indicate the same relationship between two features.
As aforementioned, the online users and manufac-ture experts may describe the same feature by usingtotally different terms or words. This does affect theperformance (both recall and precision) of our pro-posed approach in feature relationship identificationnegatively. For instance, the user may prefer using“manual” to depict a specific camera mode option.By contrast, the manufacture experts usually pick theterm “custom” to describe this sub feature which be-
longs to ”shooting modes”. In such a case, the tworelations: (mode, manual) and (shooting modes, cus-tom) cannot match.
5 CONCLUSION AND FUTUREWORK
In this paper, we introduced a product feature taxon-omy learning approach based on frequent patterns andassociation rules. The objective is to not only extractproduct features mentioned in user reviews but alsoidentify the relationship between the generated fea-tures. The results of our experiment indicate that ourproposed approach is effective in both identifying cor-rect features and structural relationship between them.Particularly, the feature relationships captured in thefeature taxonomy provide more detailed informationabout products. This leads us to represent productsprofiles as multi-levels of feature, rather than a singlelevel as most other methods do.
In the future, we plan to improve and evaluate ourproposed product model by utilizing semantic simi-larity tools. For instance, the vocabulary mismatchcan be handled by examining the semantic similar-ity when we undertake the structural relation evalua-tion. In addition, we plan to develop a review recom-mender system that makes use of the proposed prod-uct model in order to identify high quality reviews.The structural relations of the product model are ableto assist identifying some characteristics of reviews,such as how a certain feature and its sub features havebeen discussed and how many different features havebeen covered. Our system will therefore aim at rec-ommending reviews based upon such criteria to helpusers make purchasing decisions.
REFERENCES
Abbasi, A., Chen, H., and Salem, A. (2008). Sentimentanalysis in multiple languages: Feature selection foropinion classification in web forum. ACM Transac-tions on Information Systems, 26(3).
Blei, D. M., Ng, A. Y., and Jordan, M. I. (2003). Latentdirichlet allocation. Journal of Machine Learning Re-search, 3:993 – 1022.
Ding, X., Liu, B., and Yu, P. S. (2008). A holistic lexicon-based approach to opinion mining. In Proceedings ofthe 2008 International Conference on Web Search andData Mining, pages 231 – 240.
Hai, Z., Chang, K., Kim, J., and Yang, C. (2013). Identify-ing features in opinion mining via intrinsic and extrin-sic domain relevance. IEEE Transactions on Knowl-edge and Data Engineering, pages 1 – 1.
Product�Feature�Taxonomy�Learning�based�on�User�Reviews
191

Hofmann, T. (2001). Unsupervised learning by probabilisticlatent semantic analysis. Machine Learning, 42(1 -2):177 – 196.
Hu, M. and Liu, B. (2004a). Mining and summarizing cus-tomer reviews. In 10th ACM SIGKDD internationalconference on Knowledge discovery and data mining.
Hu, M. and Liu, B. (2004b). Mining opinion features incustomer reviews. In Proceedings of the 19th nationalconference on Artifical intelligence.
Hu, W., Gong, Z., and Guo, J. (2010). Mining product fea-tures from online reviews. In IEEE International Con-ference on E-Business Engineering, pages 24 – 29.
Lau, R. Y., Lai, C. C., Ma, J., and Li, Y. (2009). Automaticdomain ontology extraction for context-sensitive opin-ion mining. In Proceedings of the Thirtieth Interna-tional Conference on Information Systems.
Lewis, D. D. (1992). An evaluation of phrasal and clus-tered representations on a text categorization task. InProceedings of the 15th ACM International Confer-ence on Research and Development in InformationRetrieval, pages 177 – 196.
Pasquier, N., Bastide, Y., Taouil, R., and Lakhal, L. (1999).Efficient mining of association rules using closeditemset lattices. Information Systems, 24(1):25 – 46.
Popescu, A.-M. and Etzioni, O. (2005). Extracting productfeatures and opinions from reviews. In Proceedings ofthe conference on Human Language Technology andEmpirical Methods in Natural Language Processing,pages 339–346.
Scaffidi, C., Bierhoff, K., Chang, E., Felker, M., Ng, H., andJin, C. (2007). Red opal: Product-feature scoring fromreviews. In Proceedings of the 8th ACM conference onElectronic commerce, number 182 - 191.
Subrahmanian, V. S. and Reforgiato, D. (2008). Ava:Adjective-verb-adverb combinations for sentimentanalysis. IEEE Intelligent Systems, pages 43 – 50.
Tang, J., Leung, H.-f., Luo, Q., Chen, D., and Gong,J. (2009). Towards ontology learning from folk-sonomies. In Proceedings of the 21st internationaljont conference on Artifical intelligence, pages 2089 –2094.
Wright, A. (2009). Our sentiments, exactly. Communica-tions of the ACM, 52(4):14 – 15.
Xu, Y., Li, Y., and Shaw, G. (2011). Representations forassociation rules. Data and Knowledge Engineering,70(6):237 – 256.
Zhang, Y. and Zhu, W. (2013). Extracting implicit featuresin online customer reviews for opinion mining. InProceedings of the 22nd international conference onWorld Wide Web companion, pages 103 – 104.
WEBIST�2014�-�International�Conference�on�Web�Information�Systems�and�Technologies
192

Automatic Web Page Classification Using Visual Content
Antonio Videira and Nuno GoncalvesInstitute of Systems and Robotics, University of Coimbra, Coimbra, Portugal
favideira, [email protected]
Keywords: Web Page Classification, Feature Extraction, Feature Selection, Machine Learning.
Abstract: There is a constantly increasing requirement for automatic classification techniques with greater classificationaccuracy. To automatically classify and process web pages, the current systems use the text content of thosepages. However, little work has been done on using the visual content of a web page. On this account, ourwork is focused on performing web page classification using only their visual content. First a descriptor isconstructed, by extracting different features from each page. The features used are the simple color and edgehistograms, Gabor and Tamura features. Then two methods of feature selection, one based on the Chi-Squarecriterion, the other on the Principal Components Analysis are applied to that descriptor, to select the topdiscriminative attributes. Another approach involves using the Bag of Words (BoW) model to treat the SIFTlocal features extracted from each image as words, allowing to construct a dictionary. Then we classify webpages based on their aesthetic value, their recency and type of content. The machine learning methods usedin this work are the Naıve Bayes, Support Vector Machine, Decision Tree and AdaBoost. Different tests areperformed to evaluate the performance of each classifier. Finally, we thus prove that the visual appearance ofa web page has rich content not explored by current web crawlers based only on text content.
1 INTRODUCTION
Over the last years, the world has witnessed a hugegrowth on the internet, with millions of web pages onevery topic easily accessible through the web, makingthe web a huge repository of information. Hence thereis need for categorizing web documents to facilitatethe indexing, searching and retrieving of pages. In or-der to achieve web’s full potential as an informationresource, the vast amount of content available in theinternet has to be well described and organized. Thatis why automation of web page classification (WPC)is useful. WPC helps in focused crawling, assistsin the development and expanding of web directories(for instance Yahoo), helps in the analysis of specificweb link topic, in the analysis of the content structureof the web, improves the quality of web search (e.g.,categories view, ranking view), web content filtering,assisted web browsing and much more.
Since the first websites in the early 1990’s, design-ers have been innovating the way websites look. Thevisual appearance of a web page influences the waythe user will interact with it. The structural elementsof a web page (e.g. text blocks, tables, links, images)and visual characteristics (e.g., color, size) are usedto determine the visual presentation and level of com-plexity of a page. This visual presentation is known
as Look and Feel, which is one of the most impor-tant properties of a web page. The visual appearance(Look and Feel) of each website is constructed usingcolors and color combinations, type fonts, images andvideos, and much more.
The aim of this work is to enable automatic anal-ysis of this visual appearance of web pages by usingthe web page as it appears to the user and evaluate theperformance of different classifiers in the classifica-tion of web pages in several tasks.
The motivation behind our work is based on(de Boer et al., 2010), where the authors provedthat by using generic visual features it was possibleto classify web pages for several different types oftasks. They classify web pages based on their aes-thetic value, their design recency and the type of web-site. They concluded that by using low-level featuresof web pages, it is possible to distinguish betweenseveral classes that vary in their Look and Feel, inparticular aesthetically well designed vs. badly de-signed, recent vs. old fashioned and different topics.We extend their work by using and comparing sev-eral features, testing new feature selection methodsand classifiers. We used the same binary variables(aesthetic value and design recency) but extended thetype of webpage content for 8 classes instead of 4. Wealso aim to obtain better accuracy in classification.
193

2 RELATED WORK
The text content that is directly located on the page isthe most used feature. A WPC method presented bySelamat and Omatu (Selamat and Omatu, 2004) useda neural network with inputs based on the PrincipalComponent Analysis and class profile-based features.By selecting the most regular words in each class andweighted them, and with several methods of classifi-cation, they were able to demonstrate an acceptableaccuracy. Chen and Hsieh (Chen and Hsieh, 2006)proposed a WPC method using a SVM based on aweighted voting scheme. This method uses Latentsemantic analysis to find relations between keywordsand documents, and text features extracted from theweb page content.Those two features are then sent tothe SVM model for training and testing respectively.Then, based on the SVM output, a voting scheme isused to determine the category of the web page.
There are few studies of WPC using the visualcontent, because traditionally only text informationis used, achieving reasonable accuracy. It has been,however, noticed (de Boer et al., 2010) that the visualcontent can help in disambiguating the classificationbased only on this text content. Additionally, anotherfactor in favor of using the visual content is the factthat subjective variables as design recency and aes-thetic value cannot be studied using text content con-tained in the html code. These variables are increasingin importance due to web marketing strategies.
A WPC approach based on the visual informationwas implemented by Asirvatham et al. (Asirvathamand Ravi, 2001), where a number of visual features,as well as text features, were used. They proposeda method for automatic categorization of web pagesinto a few broad categories based on the structure ofthe web documents and the images presented on it.Another approach was proposed by Kovacevic et al.(Kovacevic1 et al., 2004), where a page is representedas a hierarchical structure - Visual Adjacency Multi-graph, in which, nodes represent simple HTML ob-jects, texts and images, while directed edges reflectspatial relations on the browser screen.
As mentioned previously, Boer et al. (de Boeret al., 2010) has successfully classified web pages us-ing only visual features. They classified pages in twobinary variables: aesthetic value and design recency,achieving good accuracy. The authors also applied thesame classification algorithm and methods to a multi-class categorization of the website topic and althoughthe results obtained are reasonable, it was concludedthat this classification is more difficult to perform.
3 CLASSIFICATION PROCESS
This section presents the work methodology used tofulfill the proposed objectives. Namely, how the pro-cess of classification of new web pages is done. InFig. 1 it is possible to see the necessary steps to pre-dict the class of new web pages. The algorithms weredeveloped in C/C++ using the OpenCV library (Brad-ski, 2000), that runs under Windows, Linux and MacOS X.
The next subsections present an explanation of themethods used to extract features from the images, andthe construction of the respective feature descriptors.It is explained in detail the techniques used to performfeature selection.
3.1 Feature Extraction
The concept of feature in computer vision and imageprocessing refers to a piece of information which isrelevant and distinctive. For each web page, differ-ent feature descriptors (feature vector) are computed.This section describes how a descriptor of low levelfeatures which contains 166 attributes that character-ize the page is obtained and how the SIFT descriptorusing Bag of Words model is built.
3.1.1 Low Level Descriptor
Visual descriptors are descriptions of visual featuresof the content of an image. These descriptors describeelementary characteristics such as shape, color, tex-ture, motion, among others. To built this descriptorthe following features were extracted from each im-age: color histogram, edge histogram, tamura featuresand gabor features.
Color Histogram. It is a representation of the dis-tribution of colors in an image. It can be built inany color space, but the ones used in this work is theHSV color space. It was selected because it reflectshuman vision quite accurately and because it mainlyuses only one of its components (Hue) to describe themain properties of color in the image. The Hue his-togram is constructed by discretization of the colorsin the image into 32 bins. Each bin will represent anintensity spectrum. This means that a histogram pro-vides a compact summarization of the distribution ofdata in an image.
Edge Histogram. An edge histogram will repre-sent the frequency and directionality of the brightnesschanges in the image. The Edge Histogram Descrip-tor (EHD) describes the edge distribution in an image.It is a descriptor that expresses only the local edge
WEBIST�2014�-�International�Conference�on�Web�Information�Systems�and�Technologies
194

Figure 1: Classification Process diagram.
distribution in the image, describing the distributionof non-directional edges and non-edge cases, as wellas four directional edges, and keeps the size of the de-scriptor as compact as possible for an efficient storageof the metadata. To extract the EHD, the image is di-vided into a fixed number of sub-images (4x4) and thelocal edge distribution for each sub image is representby a histogram. The edge extraction scheme is basedon an image block rather than on the pixel, i.e., eachsub-image space is divided into small square blocks.For each image block it is determined which edge ispredominant, i.e., the image block is classified intoone of the 5 types of edge or a non edge block. Sincethere are 16 sub images in the image, the final his-togram is construct by 16x5 = 80 bins.
Tamura Features. Tamura et al. (Tamura et al.,1978), on the basis of psychological experiments,proposed six features corresponding to human visualperception: coarseness, contrast, directionality, line-likeness, regularity and roughness. After testing thefeatures, the first three attained very successful resultsand they concluded those were the most significantfeatures corresponding to human visual perception.The definition of these three features in (Deselaers,2003) shows the preprocessing that is applied to theimages and the steps necessary to extract those threefeatures. The coarseness and contrast are scalar val-ues, and the directionality is histogramized into a his-togram of 16 bins.
Gabor Features. The interest about the Gabor func-
tions is that it acts as low-level oriented edge andtexture discriminators, sensitive to different frequen-cies and scales, which motivated researchers to exten-sively exploit the properties of the Gabor functions.The Gabor filters have been shown to posses optimalproperties in both spatial and frequency domain, andfor this reason it is well suited for texture segmen-tation problems. Zhang et al. (Zhang et al., 2000)present an image retrieval method based on Gabor fil-ter, where the texture features were found by comput-ing the mean and variation of the Gabor filtered im-age. The final descriptor is composed by 36 attributes.
3.1.2 SIFT Descriptor using Bag of WordsModel
In pattern recognition and machine learning,keypoint-based image features are getting moreattention. Keypoints are salient image patches thatcontain rich local information of an image. The ScaleInvariant Feature Transform was developed in 1999by David Lowe. The SIFT features are one of themost popular local image features for general images,and was later refined and widely described in (Lowe,2004). This approach transforms image data intoscale-invariant coordinates relative to local features.
On the other hand, the bag-of-words (BoW) model(Liu, 2013) is a feature summarization technique thatcan be defined as follows. Given a training datasetD, that contains n images, where D = fd1;d2; :::;dng,where d is the extracted features, a specific algorithmis used to group D based on a fixed number of visual
Automatic�Web�Page�Classification�Using�Visual�Content
195
words W represented by W = fw1;w2; :::;wvg, wherev is the number of clusters. Then, it is possible tosummarize the data in a n� v co occurrence table ofcounts Ni j = N(wi;d j), where N(wi;d j) denotes howoften the word wi occurred in an image d j.
To extract the BoW feature from images the fol-lowing steps are required: i) detect the SIFT key-points, ii) compute the local descriptors over thosekeypoints, iii) quantize the descriptors into words toform the visual vocabulary, and iv) to retrieve theBoW feature, find the occurrences in the image ofeach specific word in the vocabulary.
Using the SIFT image feature detector and de-scriptor implemented in OpenCV, each image is ab-stracted by several local keypoints. These vectors arecalled feature descriptors and as explained above theSIFT converts this keypoints into a 128-dimensionalvector. But once we extract such local descriptorsfor each image, the total number of them would mostlikely be of overwhelming size. In that case, BoWsolve this problem by quantizing descriptors into ”vi-sual words”, which decreases the descriptors amountdramatically. This is done by k-means clustering, aniterative algorithm for finding clusters in data. Thiswill allow to find a limited number of feature vectorsthat represent the feature space, allowing to constructthe dictionary.
Once the dictionary is constructed, it is ready tobe used to encode images. In the implementation ofthis algorithm, different sizes of the dictionary (i.e.,the number of cluster centers) were used, to analyzethe difference in the performance of the classifiers.
3.2 Feature Selection
An important component of both supervised and un-supervised classification problems is feature selection- a technique that selects a subset of the original at-tributes by selecting a number of relevant features. Bychoosing a better feature space, a number of problemscan be solved, e.g., avoid overfitting and achieve bet-ter generalization ability, reduce the storage require-ment and training time and allowing us to better un-derstand the domain. Two algorithms for applyingfeature selection are built. One is based on the Chi-Square Criterion, the other uses the Principal Compo-nents Analysis. In both methods a different numberR corresponding to the most relevant features is se-lected. The different values of R used in this work are1%, 2%, 5%, 10%, 20% and 50% of the total features.
3.2.1 Chi-Square Criterion
Feature Selection via chi square (c2) test is a verycommonly used method (Liu and Setiono, 1995).
Chi-squared attribute evaluates the worth of a fea-ture by computing the value of the chi-squared statis-tic with respect to the class. The Feature Selectionmethod using the Chi-Squared criterion is representedin algorithm 1.
Algorithm 1 : Feature Selection using Chi-SquareCriterion.
Input: Data Matrix (M�N) . M represents thenumber of samples, and N the number of featuresInput: Number of classes C.Output: Top R features
1: For each feature and classFind the mean value corresponding to each feature.
2: For each featureCompute the mean value of the classes mean val-ues.Compute the Expected and Observed Frequencies,and calculate the chi-squared value.
c2 = å(ExpectedFreq�ObservedFreq)2
ExpectedFreq ;
3: Sort the chi-squared values and choose the Rfeatures with the smallest sum of all values.
3.2.2 Principal Component Analysis usingSingular Value Decomposition
PCA was invented in 1901 by Karl Pearson as ananalogue of the principal axes theorem in mechanics.This algorithm is based on (Song et al., 2010), thatproposed a method using PCA to perform feature se-lection. They achieved feature selection by using thePCA transform from a viewpoint of numerical anal-ysis, allowing to select a number of M features com-ponents from all the original samples. In algorithm 2the Singular Value Decomposition (SVD) is used toperform PCA. The SVD technique allows to reducedimensionality by obtaining a more compact repre-sentation of the most significant elements of the dataset, and this enable to express the data set more com-pactly.
4 WEB PAGES DATABASE
In this work, different web page classification experi-ments are evaluated. There are two binary classifica-tions and one multi-category classification. The twobinary classifications are: the aesthetic value of a web
WEBIST�2014�-�International�Conference�on�Web�Information�Systems�and�Technologies
196
Algorithm 2: Feature Selection using PCA throughSVD.
Input: Data Matrix (M�N) . M represents thenumber of samples, and N the number of featuresOutput: Top R features
1: Perform mean normalization in the Data Matrix.
2: Calculate the SVD decomposition of the DataMatrix.
3: Select the eigenvectors that correspond to thefirst d largest singular values, and denote these vec-tors as K1; :::;Kd , respectively.
4: Calculate the contribution, of each feature com-ponent as follows c j = å
dp=1 jKp jj,
where Kp j denotes the j entry of Kp, j = 1;2; :::;N,p = 1;2; :::;d. jKp jj stands for the absolute value ofKp j.
5: Sort c j in the descending order, and select the Rfeatures corresponding to the R largest orders in c j.
page, i.e., if a web page is beautiful or ugly (a mea-sure that depends on the notion of aesthetic of eachperson), and the design recency of a web page, i.e.,trying to distinguish between old fashioned and newfashioned web pages. The multi category classifica-tion involves classification on the web page topic.
Using the Fireshot plugin1 for the Firefox webbrowser, allows to retrieve a screen shot of a web pageand save it as a .PNG file. Different training sets of30, 60 and 90 pages are built for each class of the clas-sification experiment. For each site we only retrievedthe landing page which is generally the index page.
4.1 Aesthetic
The notion of aesthetic differs from person to person,because what can be beautiful for someone, can beugly for another. That is why this classification de-pends of each classifier and it is a subjective classi-fication. Nevertheless, there is a generic notion ofthe beautiful and of the ugly that is common to theindividuals of a certain culture. We emphasize thatthis underlying notion of the aesthetic value is of ex-tremely importance to marketing and psychologicalexplorations.
1https://addons.mozilla.org/pt-pt/firefox/addon/fireshot/
In this classification experiment two classes arethen defined: ugly and beautiful web pages. Noticethat in Aesthetic, the important aspect is the visualdesign (”Look and Feel”) of a web page, and not thequality of information or popularity of the page.
The ugly pages were downloaded from two arti-cles (Andrade, 2009) and (Shuey, 2013) and their cor-responding comment section, and also from the web-site World Worst Websites of the Year 2012 - 2005(Flanders, 2012). The beautiful pages were retrieved,consulting a design web log, listing the author’s selec-tion of the most beautiful web pages of 2008, 2009,2010, 2011 and 2012 (Crazyleafdesign.com, 2013).
After analyzing the web pages retrieved (Fig.2) ,it was possible to notice that, in general, an ugly webpage don’t transmit a clear message, uses too muchpowerful colors, lacks clarity and a consistent navi-gation. While, on the opposite side, it was possibleto notice that a beautiful web page usually has an en-gaging picture, an easy navigation, the colors compli-ment each other and it is easy to find the informationneeded. Obviously these are some directives observedfrom the database and do not correspond to strict con-clusions.
4.2 Design Recency
The objective of this classification is to be able to dis-tinguish from old fashioned and new fashioned pages.The principal differences between these pages (Fig.3)is that nowadays the web design of a page has firmlyestablished itself as an irreplaceable component of ev-ery good marketing strategy. Recent pages usuallyhave large background images, blended typography,colorful and flat graphics, that is, every design ele-ment brings relevant content to the user. In the pastthe use of GIFs, very large comprised text and blind-ing background were common in most sites.
The old web pages were retrieved consulting thearticle (waxy.org, 2010), that shows the most popu-lar pages in 1999, and using the Internet Archive website2 allowed to retrieve the versions of those websitesin that year. To retrieve the new pages, the Alexa3 webpage popularity rankings was used, selecting then the2012 most popular pages.
4.3 Web Page Topic
In this classification eight classes are defined. Theseclasses are newspapers, hotels, celebrities, confer-ences, classified advertisements, social networks,gaming and video-sharing.
2http://archive.org/web/web.php3http://www.alexa.com
Automatic�Web�Page�Classification�Using�Visual�Content
197
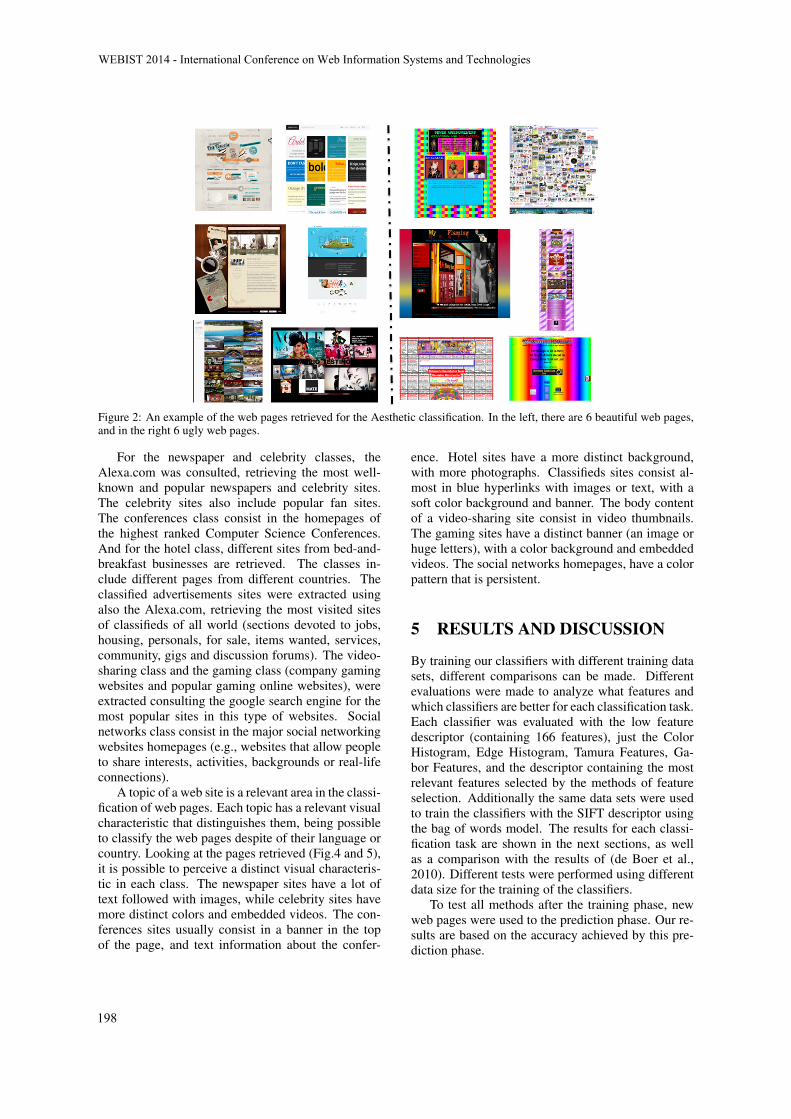
Figure 2: An example of the web pages retrieved for the Aesthetic classification. In the left, there are 6 beautiful web pages,and in the right 6 ugly web pages.
For the newspaper and celebrity classes, theAlexa.com was consulted, retrieving the most well-known and popular newspapers and celebrity sites.The celebrity sites also include popular fan sites.The conferences class consist in the homepages ofthe highest ranked Computer Science Conferences.And for the hotel class, different sites from bed-and-breakfast businesses are retrieved. The classes in-clude different pages from different countries. Theclassified advertisements sites were extracted usingalso the Alexa.com, retrieving the most visited sitesof classifieds of all world (sections devoted to jobs,housing, personals, for sale, items wanted, services,community, gigs and discussion forums). The video-sharing class and the gaming class (company gamingwebsites and popular gaming online websites), wereextracted consulting the google search engine for themost popular sites in this type of websites. Socialnetworks class consist in the major social networkingwebsites homepages (e.g., websites that allow peopleto share interests, activities, backgrounds or real-lifeconnections).
A topic of a web site is a relevant area in the classi-fication of web pages. Each topic has a relevant visualcharacteristic that distinguishes them, being possibleto classify the web pages despite of their language orcountry. Looking at the pages retrieved (Fig.4 and 5),it is possible to perceive a distinct visual characteris-tic in each class. The newspaper sites have a lot oftext followed with images, while celebrity sites havemore distinct colors and embedded videos. The con-ferences sites usually consist in a banner in the topof the page, and text information about the confer-
ence. Hotel sites have a more distinct background,with more photographs. Classifieds sites consist al-most in blue hyperlinks with images or text, with asoft color background and banner. The body contentof a video-sharing site consist in video thumbnails.The gaming sites have a distinct banner (an image orhuge letters), with a color background and embeddedvideos. The social networks homepages, have a colorpattern that is persistent.
5 RESULTS AND DISCUSSION
By training our classifiers with different training datasets, different comparisons can be made. Differentevaluations were made to analyze what features andwhich classifiers are better for each classification task.Each classifier was evaluated with the low featuredescriptor (containing 166 features), just the ColorHistogram, Edge Histogram, Tamura Features, Ga-bor Features, and the descriptor containing the mostrelevant features selected by the methods of featureselection. Additionally the same data sets were usedto train the classifiers with the SIFT descriptor usingthe bag of words model. The results for each classi-fication task are shown in the next sections, as wellas a comparison with the results of (de Boer et al.,2010). Different tests were performed using differentdata size for the training of the classifiers.
To test all methods after the training phase, newweb pages were used to the prediction phase. Our re-sults are based on the accuracy achieved by this pre-diction phase.
WEBIST�2014�-�International�Conference�on�Web�Information�Systems�and�Technologies
198

Figure 3: An example of the web pages retrieved for the Recency classification. In the left, there are 6 old fashioned webpages from 1999, and in the right 6 new fashioned web pages from 2012.
Figure 4: Examples of web pages extracted for four web site topic classes.
5.1 Aesthetic Value Results
Boer et al. (de Boer et al., 2010) in this experimentwith the 166 features achieved an accuracy using theNaive Bayes and a J48 Decision Tree of 68% and 80%respectively. Using just the Simple Color Histogramand Edge Histogram they correctly classified 68% and70% respectively for the Naive Bayes, and 66% and53% for the J48 Decision Tree classifier.
For this experiment, Fig.6 show the best rate pre-diction for our classifiers, when used the SIFT de-
scriptor. Using different sizes for the dictionary, weobtained good result for each classifier. The best re-sults for the Naıve Bayes, SVM and the Decision Treewas of 80%, and for the AdaBoost we achieved a pre-diction accuracy of 85%.
When trained the model using just the Color His-togram attributes, the results show an accuracy of65% for Naive Bayes, 85% in SVM, 70% for the De-cision Tree and 85% using the AdaBoost when trainedwith 90 images for each class. When we selectedthe top discriminative attributes to train the classi-
Automatic�Web�Page�Classification�Using�Visual�Content
199

Figure 5: Examples of web pages extracted for the other four web site topic classes.
Figure 6: SIFT Descriptor using BoW Model prediction re-sults with different dictionary sizes (100, 200 and 500) forthe Aesthetic Value.
fiers, the best results using the Chi-Squared methodwas when the classifiers were trained with the top50% attributes. The Naive Bayes and SVM achievedan accuracy of 65%, the Decision Tree 80% and theAdaBoost an accuracy of 75%. When trained withthe top 20% attributes by using the PCA method, theNaive Bayes classifier achieved an accuracy of 75%,the SVM classifier predicted 65% of corrected pages,and finally, the Decision Tree and the AdaBoost clas-sifiers both had an accuracy of 80%.
All the classifiers showed a high prediction accu-racy, with different features. Since most of the fea-tures chosen by the feature selection method are fromthe Color Histogram, it is possible to achieve a goodprediction rate just by passing this simple descriptor.The SIFT descriptor give the best results, proving thatthe images from this two classes have distinctive key-points.
5.2 Design Recency Results
In this experiment, Boer et al. (de Boer et al., 2010)using the complete feature vector achieved an accu-racy using the Naıve Bayes and a J48 Decision Treeof 82% and 85% respectively. Using just the SimpleColor Histogram the Naıve Bayes performed slightlyworse than the baseline and the J48 Decision Treeclassifier sightly better. Using only the edge informa-tion, both models correctly classified 72% and 78%respectively for the Naıve Bayes and J48 DecisionTree classifier.
Our best results for this experiment, using the low-level descriptor, are shown in Fig.7. The Naıve Bayes,SVM and Adaboost achieved an accuracy of 100%,when the top 5% attributes were selected using thechi-square method for the first one and the Gabor de-scriptor for the other two. The Decision Tree best ac-curacy (95%), was when the PCA method selected thetop 5% attributes.
Relatively to the SIFT descriptor, all the classifiersobtain a good accuracy. Noteworthy that all the classi-fiers obtain an accuracy of 90% when they used a dic-tionary size of 500. The best accuracy result achievedwas for the Naıve Bayes with a 95% rate of success,with a dictionary size of 200 words.
These results proves that the classifiers can learnjust by using simple visual features. All the classi-fiers obtained good accuracy around 85%, using justthe top 1% attributes selected by both methods. In-stead of using a more complex method like BoW, theuse of simple visual features allows to decrease thecomputational cost for larger databases.
WEBIST�2014�-�International�Conference�on�Web�Information�Systems�and�Technologies
200
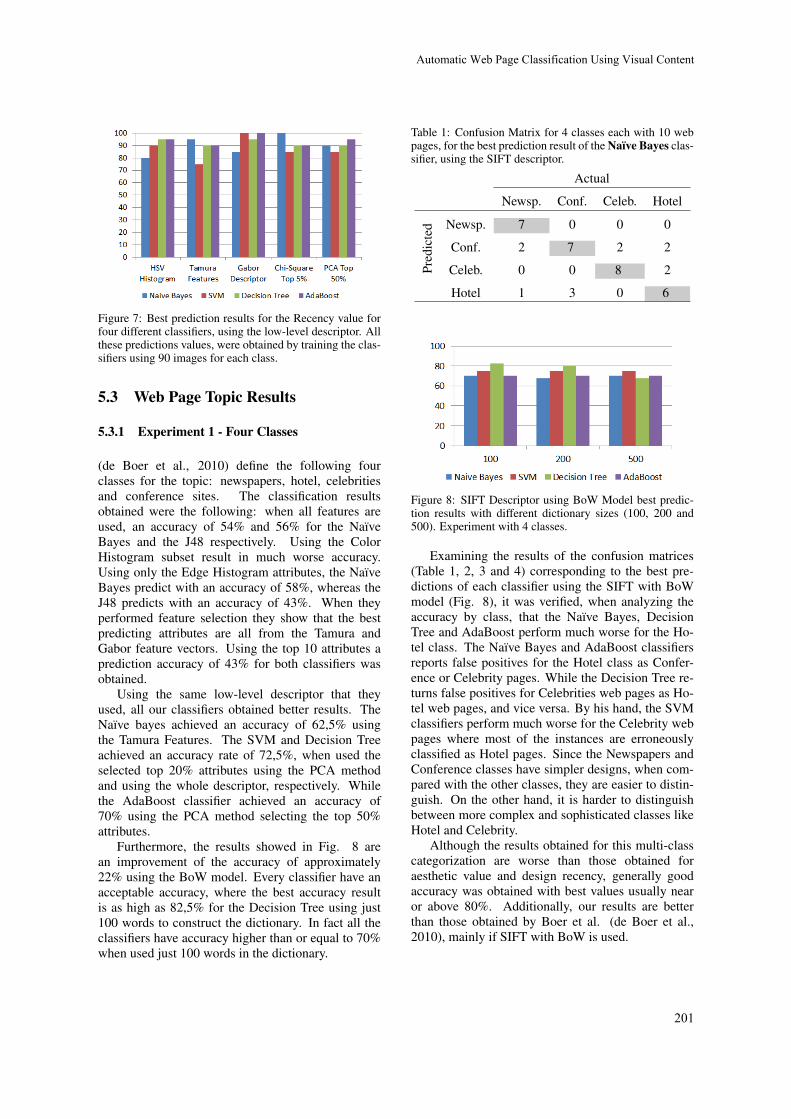
Figure 7: Best prediction results for the Recency value forfour different classifiers, using the low-level descriptor. Allthese predictions values, were obtained by training the clas-sifiers using 90 images for each class.
5.3 Web Page Topic Results
5.3.1 Experiment 1 - Four Classes
(de Boer et al., 2010) define the following fourclasses for the topic: newspapers, hotel, celebritiesand conference sites. The classification resultsobtained were the following: when all features areused, an accuracy of 54% and 56% for the NaıveBayes and the J48 respectively. Using the ColorHistogram subset result in much worse accuracy.Using only the Edge Histogram attributes, the NaıveBayes predict with an accuracy of 58%, whereas theJ48 predicts with an accuracy of 43%. When theyperformed feature selection they show that the bestpredicting attributes are all from the Tamura andGabor feature vectors. Using the top 10 attributes aprediction accuracy of 43% for both classifiers wasobtained.
Using the same low-level descriptor that theyused, all our classifiers obtained better results. TheNaıve bayes achieved an accuracy of 62,5% usingthe Tamura Features. The SVM and Decision Treeachieved an accuracy rate of 72,5%, when used theselected top 20% attributes using the PCA methodand using the whole descriptor, respectively. Whilethe AdaBoost classifier achieved an accuracy of70% using the PCA method selecting the top 50%attributes.
Furthermore, the results showed in Fig. 8 arean improvement of the accuracy of approximately22% using the BoW model. Every classifier have anacceptable accuracy, where the best accuracy resultis as high as 82,5% for the Decision Tree using just100 words to construct the dictionary. In fact all theclassifiers have accuracy higher than or equal to 70%when used just 100 words in the dictionary.
Table 1: Confusion Matrix for 4 classes each with 10 webpages, for the best prediction result of the Naıve Bayes clas-sifier, using the SIFT descriptor.
Actual
Newsp. Conf. Celeb. Hotel
Pred
icte
d Newsp. 7 0 0 0
Conf. 2 7 2 2
Celeb. 0 0 8 2
Hotel 1 3 0 6
Figure 8: SIFT Descriptor using BoW Model best predic-tion results with different dictionary sizes (100, 200 and500). Experiment with 4 classes.
Examining the results of the confusion matrices(Table 1, 2, 3 and 4) corresponding to the best pre-dictions of each classifier using the SIFT with BoWmodel (Fig. 8), it was verified, when analyzing theaccuracy by class, that the Naıve Bayes, DecisionTree and AdaBoost perform much worse for the Ho-tel class. The Naıve Bayes and AdaBoost classifiersreports false positives for the Hotel class as Confer-ence or Celebrity pages. While the Decision Tree re-turns false positives for Celebrities web pages as Ho-tel web pages, and vice versa. By his hand, the SVMclassifiers perform much worse for the Celebrity webpages where most of the instances are erroneouslyclassified as Hotel pages. Since the Newspapers andConference classes have simpler designs, when com-pared with the other classes, they are easier to distin-guish. On the other hand, it is harder to distinguishbetween more complex and sophisticated classes likeHotel and Celebrity.
Although the results obtained for this multi-classcategorization are worse than those obtained foraesthetic value and design recency, generally goodaccuracy was obtained with best values usually nearor above 80%. Additionally, our results are betterthan those obtained by Boer et al. (de Boer et al.,2010), mainly if SIFT with BoW is used.
Automatic�Web�Page�Classification�Using�Visual�Content
201
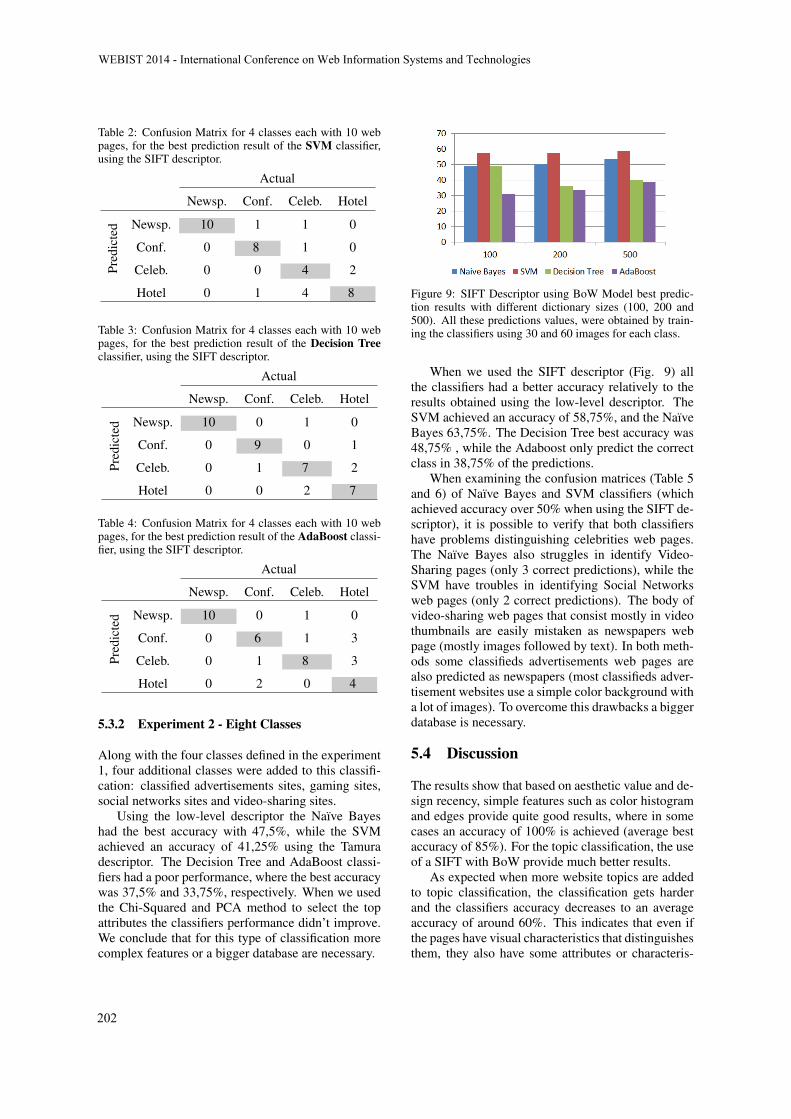
Table 2: Confusion Matrix for 4 classes each with 10 webpages, for the best prediction result of the SVM classifier,using the SIFT descriptor.
Actual
Newsp. Conf. Celeb. Hotel
Pred
icte
d Newsp. 10 1 1 0
Conf. 0 8 1 0
Celeb. 0 0 4 2
Hotel 0 1 4 8
Table 3: Confusion Matrix for 4 classes each with 10 webpages, for the best prediction result of the Decision Treeclassifier, using the SIFT descriptor.
Actual
Newsp. Conf. Celeb. Hotel
Pred
icte
d Newsp. 10 0 1 0
Conf. 0 9 0 1
Celeb. 0 1 7 2
Hotel 0 0 2 7
Table 4: Confusion Matrix for 4 classes each with 10 webpages, for the best prediction result of the AdaBoost classi-fier, using the SIFT descriptor.
Actual
Newsp. Conf. Celeb. Hotel
Pred
icte
d Newsp. 10 0 1 0
Conf. 0 6 1 3
Celeb. 0 1 8 3
Hotel 0 2 0 4
5.3.2 Experiment 2 - Eight Classes
Along with the four classes defined in the experiment1, four additional classes were added to this classifi-cation: classified advertisements sites, gaming sites,social networks sites and video-sharing sites.
Using the low-level descriptor the Naıve Bayeshad the best accuracy with 47,5%, while the SVMachieved an accuracy of 41,25% using the Tamuradescriptor. The Decision Tree and AdaBoost classi-fiers had a poor performance, where the best accuracywas 37,5% and 33,75%, respectively. When we usedthe Chi-Squared and PCA method to select the topattributes the classifiers performance didn’t improve.We conclude that for this type of classification morecomplex features or a bigger database are necessary.
Figure 9: SIFT Descriptor using BoW Model best predic-tion results with different dictionary sizes (100, 200 and500). All these predictions values, were obtained by train-ing the classifiers using 30 and 60 images for each class.
When we used the SIFT descriptor (Fig. 9) allthe classifiers had a better accuracy relatively to theresults obtained using the low-level descriptor. TheSVM achieved an accuracy of 58,75%, and the NaıveBayes 63,75%. The Decision Tree best accuracy was48,75% , while the Adaboost only predict the correctclass in 38,75% of the predictions.
When examining the confusion matrices (Table 5and 6) of Naıve Bayes and SVM classifiers (whichachieved accuracy over 50% when using the SIFT de-scriptor), it is possible to verify that both classifiershave problems distinguishing celebrities web pages.The Naıve Bayes also struggles in identify Video-Sharing pages (only 3 correct predictions), while theSVM have troubles in identifying Social Networksweb pages (only 2 correct predictions). The body ofvideo-sharing web pages that consist mostly in videothumbnails are easily mistaken as newspapers webpage (mostly images followed by text). In both meth-ods some classifieds advertisements web pages arealso predicted as newspapers (most classifieds adver-tisement websites use a simple color background witha lot of images). To overcome this drawbacks a biggerdatabase is necessary.
5.4 Discussion
The results show that based on aesthetic value and de-sign recency, simple features such as color histogramand edges provide quite good results, where in somecases an accuracy of 100% is achieved (average bestaccuracy of 85%). For the topic classification, the useof a SIFT with BoW provide much better results.
As expected when more website topics are addedto topic classification, the classification gets harderand the classifiers accuracy decreases to an averageaccuracy of around 60%. This indicates that even ifthe pages have visual characteristics that distinguishesthem, they also have some attributes or characteris-
WEBIST�2014�-�International�Conference�on�Web�Information�Systems�and�Technologies
202
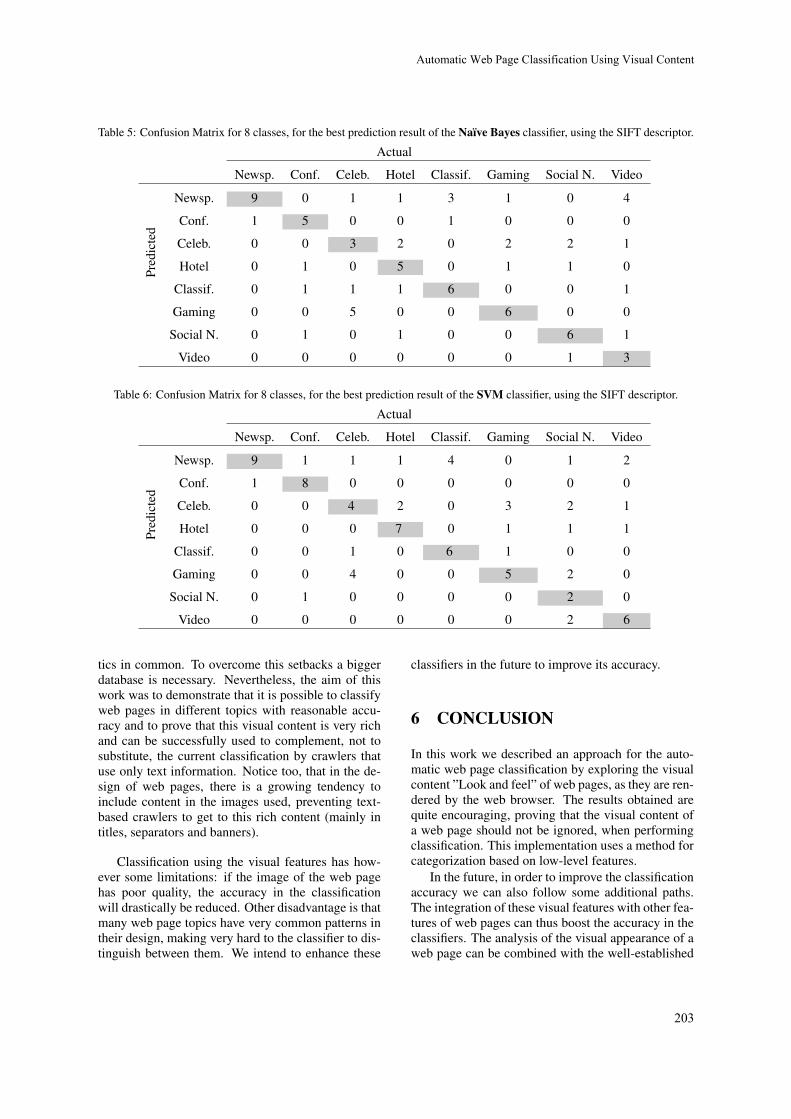
Table 5: Confusion Matrix for 8 classes, for the best prediction result of the Naıve Bayes classifier, using the SIFT descriptor.
Actual
Newsp. Conf. Celeb. Hotel Classif. Gaming Social N. Video
Pred
icte
d
Newsp. 9 0 1 1 3 1 0 4
Conf. 1 5 0 0 1 0 0 0
Celeb. 0 0 3 2 0 2 2 1
Hotel 0 1 0 5 0 1 1 0
Classif. 0 1 1 1 6 0 0 1
Gaming 0 0 5 0 0 6 0 0
Social N. 0 1 0 1 0 0 6 1
Video 0 0 0 0 0 0 1 3
Table 6: Confusion Matrix for 8 classes, for the best prediction result of the SVM classifier, using the SIFT descriptor.
Actual
Newsp. Conf. Celeb. Hotel Classif. Gaming Social N. Video
Pred
icte
d
Newsp. 9 1 1 1 4 0 1 2
Conf. 1 8 0 0 0 0 0 0
Celeb. 0 0 4 2 0 3 2 1
Hotel 0 0 0 7 0 1 1 1
Classif. 0 0 1 0 6 1 0 0
Gaming 0 0 4 0 0 5 2 0
Social N. 0 1 0 0 0 0 2 0
Video 0 0 0 0 0 0 2 6
tics in common. To overcome this setbacks a biggerdatabase is necessary. Nevertheless, the aim of thiswork was to demonstrate that it is possible to classifyweb pages in different topics with reasonable accu-racy and to prove that this visual content is very richand can be successfully used to complement, not tosubstitute, the current classification by crawlers thatuse only text information. Notice too, that in the de-sign of web pages, there is a growing tendency toinclude content in the images used, preventing text-based crawlers to get to this rich content (mainly intitles, separators and banners).
Classification using the visual features has how-ever some limitations: if the image of the web pagehas poor quality, the accuracy in the classificationwill drastically be reduced. Other disadvantage is thatmany web page topics have very common patterns intheir design, making very hard to the classifier to dis-tinguish between them. We intend to enhance these
classifiers in the future to improve its accuracy.
6 CONCLUSION
In this work we described an approach for the auto-matic web page classification by exploring the visualcontent ”Look and feel” of web pages, as they are ren-dered by the web browser. The results obtained arequite encouraging, proving that the visual content ofa web page should not be ignored, when performingclassification. This implementation uses a method forcategorization based on low-level features.
In the future, in order to improve the classificationaccuracy we can also follow some additional paths.The integration of these visual features with other fea-tures of web pages can thus boost the accuracy in theclassifiers. The analysis of the visual appearance of aweb page can be combined with the well-established
Automatic�Web�Page�Classification�Using�Visual�Content
203

analysis based on text content, URL, the underlyingHTML, or others. In this case associate this visualfeatures with the text content may give rise to a pow-erful classification system. Additionally, we also in-tend to mix the classification using visual featureswith a semantic analysis of them. We expect to im-prove the results by integrating the semantic contentof a webpage image not only in the classification ofthe aesthetic or recency value but also for the classi-fication of the topic. Another approach is the extrac-tion of more sophisticated features that can analyzetheir dynamic elements (animated gifs, flash, adver-tisement content, and so on).
As for the applications of the visual classificationof web pages, the methods studied may be applied toan advice system that assist the design and rating ofweb sites that can be applied to content filtering. Ina research perspective, the fact that the aesthetic anddesign recency value are such a subjective measures,also make of great interest studies of the consumerprofile for the field of digital marketing.
ACKNOWLEDGEMENTS
The authors acknowledge the support of the Por-tuguese Science Foundation through project PEst-C/EEI/UI0048/2013.
REFERENCES
Andrade, L. (2009). The worlds ugli-est websites!!! retrieved october 2009:http://www.nikibrown.com/designoblog/2009/03/03/theworlds-ugliest-websites/.
Asirvatham, A. P. and Ravi, K. K. (2001). Web page clas-sification based on document structure. In IEEE Na-tional Convention.
Bradski, G. (2000). The OpenCV Library. Dr. Dobb’s Jour-nal of Software Tools.
Chen, R. C. and Hsieh, C. H. (2006). Web page classi-fication based on a support vector machine using aweighted vote schema. Expert Syst. Appl., 31(2):427–435.
Crazyleafdesign.com (2013). Most beautiful and inspira-tional website designs.
de Boer, V., van Someren, M., and Lupascu, T. (2010). Clas-sifying web pages with visual features. In WEBIST(2010), pages 245–252.
Deselaers, T. (2003). Features for image retrieval (thesis).Master’s thesis, RWTH Aachen University, Aachen,Germany.
Flanders, V. (2012). Worst websites of the year 2012- 2005: http://www.webpagesthatsuck.com/worst-websites-of-the-year.html.
Kovacevic1, M., Diligenti, M., Gori, M., and Milutinovic1,V. (2004). Visual adjacency multigraphs, a novel ap-proach for a web page classification. Workshop onStatistical Approaches to Web Mining (SAWM), pages38–49.
Liu, H. and Setiono, R. (1995). Chi2: Feature selection anddiscretization of numeric attributes. In Proceedingsof the Seventh International Conference on Tools withArtificial Intelligence, TAI ’95.
Liu, J. (2013). Image retrieval based on bag-of-wordsmodel. arXiv preprint arXiv:1304.5168.
Lowe, D. G. (2004). Distinctive image features from scale-invariant keypoints. IJCV, 60(2):91–110.
Selamat, A. and Omatu, S. (2004). Web page feature selec-tion and classification using neural networks. Inf. Sci.Inf. Comput. Sci., pages 69–88.
Shuey, M. (2013). 10-worst-websites-for-2013:http://www.globalwebfx.com/10-worst-websites-for-2013/.
Song, F., Guo, Z., and Mei, D. (2010). Feature selection us-ing principal component analysis. In System Science,Engineering Design and Manufacturing Informatiza-tion (ICSEM), 2010 International Conference on, vol-ume 1, pages 27–30.
Tamura, H., Mori, S., and Yamawaki, T. (1978). Tex-tural features corresponding to visual perception.IEEE Transaction on Systems, Man, and Cybernetics,8:460–472.
waxy.org (2010). Den.net and the top 100 websites of 1999:http://waxy.org/2010/02/dennet and the top 100 web-sites of 1999/.
Zhang, D., Wong, A., Indrawan, M., and Lu, G. (2000).Content-based image retrieval using gabor texture fea-tures. In IEEE Pacific-Rim Conference on Multimedia,University of Sydney, Australia.
WEBIST�2014�-�International�Conference�on�Web�Information�Systems�and�Technologies
204

User Semantic Model for Dependent Attributes to Enhance CollaborativeFiltering
Sonia Ben Ticha1;2, Azim Roussanaly1, Anne Boyer1 and Khaled Bsaıes2
1 LORIA-KIWI Team, Lorraine University, Nancy, France2LIPA Lab, Tunis El Manar University, Tunis, Tunisia
fsonia.benticha, azim.roussanaly, [email protected], [email protected]
Keywords: Hybrid Recommender System, Latent Semantic Analysis, Rocchio Algorithm.
Abstract: Recommender system provides relevant items to users from huge catalogue. Collaborative filtering andcontent-based filtering are the most widely used techniques in personalized recommender systems. Collab-orative filtering uses only the user-ratings data to make predictions, while content-based filtering relies onsemantic information of items for recommendation. Hybrid recommendation system combines the two tech-niques. The aim of this work is to introduce a new approach for semantically enhanced collaborative filtering.Many works have addressed this problem by proposing hybrid solutions. In this paper, we present anotherhybridization technique that predicts users preferences for items based on their inferred preferences for se-mantic information of items. For this, we design a new user semantic model by using Rocchio algorithm andwe apply a latent semantic analysis to reduce the dimension of data. Applying our approach to real data, theMoviesLens 1M dataset, significant improvement can be noticed compared to usage only approach, and hybridalgorithm.
1 INTRODUCTION
Recommender Systems (RS) provide relevant itemsto users from a large number of choices. Severalrecommendations techniques exist in the literature.Among these techniques, there are those that providepersonalized recommendations by defining a profilefor each user. In this work, we are interested inpersonalized recommender systems where the usermodel is based on an analysis of usage. This model isusually described by a user-item ratings matrix, whichis extremely sparse (� 90% of missing data).
Collaborative Filtering (CF) and Content-Based(CB) filtering are the most widely used techniquesin RS. The fundamental assumption of CF is that ifusers X and Y rate n items similarly and hence willrate or act on other items similarly (Su and Khoshgof-taar, 2009). CB filtering assumes that each user op-erates independently and user will be recommendeditems similar to the ones he preferred in the past (Lopset al., 2011). The major difference between CF andCB recommender systems is that CF uses only theuser-item ratings data to make predictions and recom-mendations, while CB relies on item content (seman-tic information) for recommendations. However, CFand CB techniques must face many challenges like
the data sparsity problem, the scalability problem forlarge data with the increasing numbers of users anditems.
To overcome the disadvantages of both techniquesand benefit from their strengths, hybrid solutions haveemerged. In this paper, we present a new approachtaking into account the semantic information of itemsin a CF process. In our approach, we design a newhybridization technique, which predicts user prefer-ences for items based on their inferred preferences forlatent item content; and presents a solution to the spar-sity and scalability problems. Our system consists oftwo components: the first builds a new user model,the user semantic model, by inferring user preferencesfor item content; the second computes predictions andprovides recommendations by using the user seman-tic model in a user-based CF algorithm (Resnick et al.,1994) to calculate the similarity between users. Theoriginality of this work is in the building of the usersemantic model. Indeed, assuming that items are rep-resented by structured data in which each item is de-scribed by a same set of attributes, we build a usersemantic attribute model for each relevant attribute.With this aim, we define two classes of attributes: de-pendent and non dependent and we propose a suitedalgorithm for each class. User semantic model is
205
then deducted from the horizontal concatenation ofall user semantic attribute model. In previous works(Ben Ticha et al., 2012; Ben Ticha et al., 2011) wehave presented solutions based on machine learningalgorithm to build a user semantic attribute model fornon dependent attribute. In this work, we present anew approach for building a user semantic attributemodel for dependent attribute by using Rocchio al-gorithm (Rocchio, 1971). Due to the high numberof attribute values, and to reduce the expensivenessof user similarity computing, we apply a Latent Se-mantic Analysis (LSA)(Dumais, 2004) to reduce thesize of the user semantic attribute model. We compareour results to the standards user-based CF, item-basedCF and hybrid algorithms. Our approach results in anoverall improvement in prediction accuracy.
The rest of paper is organized as follows: Section2 summarizes the related work. User semantic modelis described in Section 3. Section 4 describes our ap-proach to build user semantic attribute model for nondependent attribute. Section 5 describes the recom-mendation component of our system. Experimentalresults are presented and discussed in Section 6. Fi-nally, we conclude with a summary of our findingsand some directions for future work.
2 RELATED WORK
Recommender System (RS) have become an indepen-dent research area in the middle 1990s. CF is themost widespread used technique in RS, it was the sub-ject of several researches (Resnick et al., 1994; Sar-war et al., 2001). In CF, user will be recommendeditems that people with similar tastes and preferencesliked in the past (Adomavicius and Tuzhilin, 2005).CB is another important technique; it uses techniquesdeveloped in information filtering research (Pazzaniand Billsus, 2007). CB assumes that each user oper-ates independently and recommends items similar tothe ones he preferred in the past. Hybrid approachconsists on combining CF and CB techniques. TheFab System (Balabanovic and Shoham, 1997) countsamong the first hybrid RS. Many systems have beendeveloped since (Burke, 2007). Most of these hy-brid systems do not distinguish between attributesand treat their values in a same way. Moreover, be-cause of the huge number of items and users, calcu-lating the similarity between users in CF algorithmbecame very expensive in time computing. Dimen-sion reduction of data is one of the solution to re-duce the expensiveness of users similarity comput-ing. Mobasher et al. (Mobasher et al., 2003) com-bine values of all attributes and then apply a LSA to
reduce dimension of data. Sen et al. (Sen et al., 2009)are inferring user preferences for only one attribute,the item’ tags, without reducing dimension. Manzato(Manzato, 2012) computes a user semantic model foronly the movie genre attribute and applies a SingularValue Decomposition (SVD) to reduce the dimensionof data. In our approach, we compute a user semanticattribute model for each relevant attribute and we ap-ply a suited reduction dimension algorithm for eachattribute class.
3 USER SEMANTIC MODEL
In this paper, we are interested only to items describedby structured data. According to the definition of Paz-zani et al. (Pazzani and Billsus, 2007), in structuredrepresentation, item can be represented by a smallnumber of attributes, and there is a known set of val-ues that each attribute may have, for instance, the at-tributes of a movie can be title, genre, actor and di-rector. In the following, we will use the term featureto refer to an attribute value, for instance Documen-tary, Musical and Thriller are features of movie genreattribute.
3.1 Dependent and Non DependentAttribute
In structured representation, each attribute has a set ofrestricted features. However, the number of featurescan be related or not to the number of items. That iswhy we have defined two classes of attributes:
� Dependent Attribute: attribute, which havingvery variable number of features. This number isclosely related to the number of items. So, whenthe number of items is increasing, the number offeatures is increasing also. For example: directorsand actors of movies, user tags.
� Non Dependent Attribute: attribute, which hav-ing a very few variable number of features, andthis number is not related to the number of items.Thus, the increasing number of items has no effecton the number of features. For example: moviegenre, movie origin and cuisine of restaurants.
In addition, all attributes do not have the samedegrees of importance to users. There are attributesmore relevant than others. For instance, the moviegenre can be more significant, in the evaluation crite-ria of user, than the origin. Experiments that we haveconducted (see Section 6.2) confirmed this hypothe-sis. In this paper, we assume that relevant attributeswill be provided by a human expert. Therefore, for
WEBIST�2014�-�International�Conference�on�Web�Information�Systems�and�Technologies
206

each relevant attribute A, we build a user semantic at-tribute model that predicts the users preferences forits features (or group of features). This model is de-scribed by a matrix QA (users in lines and features (orgroup of features) of A in columns). In our approach,we design a suited algorithm for building the user se-mantic attribute model for each class of attribute. Fornon dependent attribute, due to the low number of fea-tures, we have used a clustering algorithm. Section3.2 briefly described the operating principle of oursolution that have been addressed in previous works(Ben Ticha et al., 2012; Ben Ticha et al., 2011). Fordependent attribute, we have explored techniques is-sues from information retrieval (IR) research. Section4 presents our solution for building the user semanticattribute model for dependent attribute that is the aimof this paper. The user semantic model for all relevantattributes, described by the matrix Q, is the result ofthe horizontal concatenation of all user semantic at-tribute models QA.
3.2 User Semantic Model for NonDependent Attribute
Let us denote by S the set of items, U the set of users, sa given item 2 S, u a given user 2U and a rating valuer 2 f1;2; :::;5g � R. Us the set of users that rating theitem s, then we define the rating function for item sby ds : u 2Us 7�! ds(u) 2 R. We denote also by FAthe set of features of attribute A, f a given feature2 FA and S f the set of items associated to feature f .For instance if we consider the movie genre attribute,Saction is the set of all action movies.
An item s is represented by its usage profile vec-tor sup =(ds(u)�du)(u=1::jU j), where du is the averagerating of all rated items by user u. The idea is to par-tition all items described by their usage profile in Kclusters, each cluster is labeled by a feature f 2 FA(or a set of features).
The number K of clusters and the initial center ofeach cluster is computed by the initialization step ofthe clustering algorithm. In initial step, each clus-ter Ck consists of items in
Sf labeling Ck
S f and labeledby the set of corresponding features; so its center isthe mean of its items described by their usage profilevector sup. Moreover, an attribute can be mono val-ued or multivalued depending on the number of fea-tures that can be associated to a given item s. Forexample, the attribute movie genre is multivalued be-cause a movie can have several genres while movieorigin is a mono valued attribute because a movie hasonly one origin. Thus, if an attribute is multivalued,s can belong to several clusters Ck, while for monovalued attribute, an item should belong only to one
cluster. Therefore, for multivalued attribute, the clus-tering algorithm should provide non disjointed clus-ters (a fuzzy clustering), whereas, for mono valuedattribute, the clustering algorithm should provide dis-jointed clusters.
After running the clustering algorithm, we obtainK cluster centers; each center k is described by a vec-tor ck = (qk;u)(u=1::jU j). The K centers is modelingk latent variables issued from the features of the at-tribute A. Thus, the user semantic attribute model isdescribed by the matrix QA = (qu;k)(u=1::jU j; k=1::K).
With non dependent attribute, the number of as-sociated features is low, this is why the clustering issuitable. Moreover, the user semantic attribute modelallows an important reduction of dimension and so re-duce the expensiveness of user similarity computing.In (Ben Ticha et al., 2011), we have used the FuzzyCMean Algorithm on the movie genre attribute, wehave obtained good performance because the user se-mantic attribute model has no missing values and allsimilarities between users were able to be computed.In (Ben Ticha et al., 2012), we have used the KMeanclustering algorithm on the movie origin attribute.Because of the missing values in the user item ratingmatrix, we have proposed an algorithm for the initial-ization step of the KMean clustering using a movieorigin ontology. We obtained good results comparedto user-based CF but not as good as results for thegenre attribute.
4 USER SEMANTIC MODEL FORDEPENDENTS ATTRIBUTES
For a dependent attribute A, the set FA of its featurescan be important and it augments with the increasingof the set of items S. In this paper, we present oursolution to compute a user semantic attribute modelfor dependent attribute.
In addition to the formalism used in Section 3.2,we denote by FAs the set of features f 2 FA associ-ated to item s and by Su the set of items s 2 S ratedby user u. We define also, the rating function ofuser u as du : s 2 Su 7! du(s) 2 R; and the Item Fre-quency Function for item s 2 S as f reqs : f 2 FA 7!1 i f f 2 FAs( f associated to item s); 0 otherwise. TheFrequency Item Matrix F = ( f reqs( f ))s2S and f2FA isprovided by computing f reqs( f ) for all items and allfeatures.
User�Semantic�Model�for�Dependent�Attributes�to�Enhance�Collaborative�Filtering
207
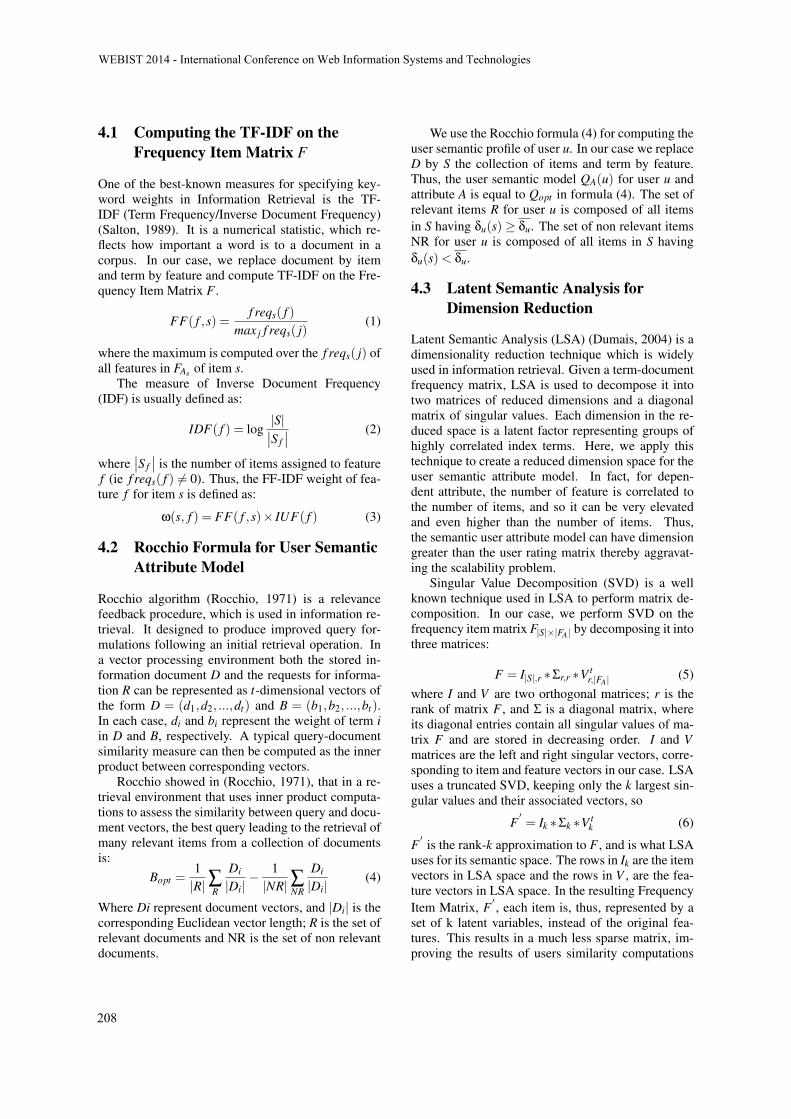
4.1 Computing the TF-IDF on theFrequency Item Matrix F
One of the best-known measures for specifying key-word weights in Information Retrieval is the TF-IDF (Term Frequency/Inverse Document Frequency)(Salton, 1989). It is a numerical statistic, which re-flects how important a word is to a document in acorpus. In our case, we replace document by itemand term by feature and compute TF-IDF on the Fre-quency Item Matrix F .
FF( f ;s) =f reqs( f )
max j f reqs( j)(1)
where the maximum is computed over the f reqs( j) ofall features in FAs of item s.
The measure of Inverse Document Frequency(IDF) is usually defined as:
IDF( f ) = logjSj��S f�� (2)
where��S f�� is the number of items assigned to feature
f (ie f reqs( f ) 6= 0). Thus, the FF-IDF weight of fea-ture f for item s is defined as:
w(s; f ) = FF( f ;s)� IUF( f ) (3)
4.2 Rocchio Formula for User SemanticAttribute Model
Rocchio algorithm (Rocchio, 1971) is a relevancefeedback procedure, which is used in information re-trieval. It designed to produce improved query for-mulations following an initial retrieval operation. Ina vector processing environment both the stored in-formation document D and the requests for informa-tion R can be represented as t-dimensional vectors ofthe form D = (d1;d2; :::;dt) and B = (b1;b2; :::;bt).In each case, di and bi represent the weight of term iin D and B, respectively. A typical query-documentsimilarity measure can then be computed as the innerproduct between corresponding vectors.
Rocchio showed in (Rocchio, 1971), that in a re-trieval environment that uses inner product computa-tions to assess the similarity between query and docu-ment vectors, the best query leading to the retrieval ofmany relevant items from a collection of documentsis:
Bopt =1jRjåR
Di
jDij� 1jNRjåNR
Di
jDij(4)
Where Di represent document vectors, and jDij is thecorresponding Euclidean vector length; R is the set ofrelevant documents and NR is the set of non relevantdocuments.
We use the Rocchio formula (4) for computing theuser semantic profile of user u. In our case we replaceD by S the collection of items and term by feature.Thus, the user semantic model QA(u) for user u andattribute A is equal to Qopt in formula (4). The set ofrelevant items R for user u is composed of all itemsin S having du(s)� du. The set of non relevant itemsNR for user u is composed of all items in S havingdu(s)< du.
4.3 Latent Semantic Analysis forDimension Reduction
Latent Semantic Analysis (LSA) (Dumais, 2004) is adimensionality reduction technique which is widelyused in information retrieval. Given a term-documentfrequency matrix, LSA is used to decompose it intotwo matrices of reduced dimensions and a diagonalmatrix of singular values. Each dimension in the re-duced space is a latent factor representing groups ofhighly correlated index terms. Here, we apply thistechnique to create a reduced dimension space for theuser semantic attribute model. In fact, for depen-dent attribute, the number of feature is correlated tothe number of items, and so it can be very elevatedand even higher than the number of items. Thus,the semantic user attribute model can have dimensiongreater than the user rating matrix thereby aggravat-ing the scalability problem.
Singular Value Decomposition (SVD) is a wellknown technique used in LSA to perform matrix de-composition. In our case, we perform SVD on thefrequency item matrix FjSj�jFAj by decomposing it intothree matrices:
F = IjSj;r �Sr;r �V tr;jFAj (5)
where I and V are two orthogonal matrices; r is therank of matrix F , and S is a diagonal matrix, whereits diagonal entries contain all singular values of ma-trix F and are stored in decreasing order. I and Vmatrices are the left and right singular vectors, corre-sponding to item and feature vectors in our case. LSAuses a truncated SVD, keeping only the k largest sin-gular values and their associated vectors, so
F0= Ik �Sk �V t
k (6)
F0
is the rank-k approximation to F , and is what LSAuses for its semantic space. The rows in Ik are the itemvectors in LSA space and the rows in V , are the fea-ture vectors in LSA space. In the resulting FrequencyItem Matrix, F
0, each item is, thus, represented by a
set of k latent variables, instead of the original fea-tures. This results in a much less sparse matrix, im-proving the results of users similarity computations
WEBIST�2014�-�International�Conference�on�Web�Information�Systems�and�Technologies
208

in CF process. Furthermore, the generated latent vari-ables represent groups of highly correlated features inthe original data, thus potentially reducing the amountof noise associated with the semantic information.
In summary, for building the user semantic at-tribute matrix QA for a dependent attribute A; first,we apply a TF-IDF measure on Frequency Item Ma-trix F ; second, we reduce the dimension of FrequencyItem Matrix F by applying a LSA; third, we computethe user semantic attribute model by using Rocchioformula (4).
5 RECOMMENDATION
To compute predictions for the active user ua, we usethe user-based CF algorithm (Resnick et al., 1994).User-Based CF predicts the rating value of active userua on non rated item s 2 S, it is based on the k-Nearest-Neighbors algorithm. A subset of nearestneighbors of ua are chosen based on their similaritywith him or her, and a weighted aggregate of their rat-ings is used to generate predictions for ua. Equation7 provides formula for computing predictions.
p(ua;s) = dua +L åv2V
sim(ua;v)(dv(s)�dv) (7)
where L = 1åv2V jsim(ua;v)j and V is the set of the nearest
neighbors (most similar users) to ua that have rateditem s. V can range anywhere from 1 to the numberof all users.
sim(u;v) =åk(qu;k�qu)(qv;k�qv)p
åk(qu;k�qu)2p
åk(qv;k�qv)2(8)
The function sim(u;v) provides the similarity be-tween users u and v and is computed by usingthe Pearson Correlation (8). In the standard user-based CF algorithm, the users-items rating matrix(du(s)(u2U; s2S)) is used to compute users’ similarities.In our algorithm, for computing the similarities be-tween users we use instead the user semantic matrixQ. As we have already mentioned, the matrix Q isthe horizontal concatenation of user semantic attributemodel QA for each relevant attribute A.
Although we apply a user-based CF for rec-ommendation, our approach is also a model-basedmethod because it is based on a new user model toprovide ratings of active user on non rated items. Ourapproach resolves the scalability problem for severalreasons. First, the building process of user seman-tic model is fully parallelizable (because the comput-ing of user semantic attribute model is done in in-dependent way for each other) and can be done off
line. Second, this model allows a dimension reduc-tion since the number of columns in the user seman-tic model is much lower than those of user item rat-ing matrix, so, the computing of similarities betweenusers is less expensive than in the standard user-basedCF. In addition, our approach allows inferring simi-larity between two users even when they have any co-rated items because the users-semantic matrix has lessmissing values than user item ratings matrix. Thus,our approach provides solution to the neighbor transi-tivity problem emanates from the sparse nature of theunderlying data sets. In this problem, users with sim-ilar preferences may not be identified as such if theyhaven’t any items rated in common.
6 PERFORMANCE STUDY
In this section, we study the performance of our ap-proach, User Semantic Collaborative Filtering (USCFin plots), against the standards CF algorithms: User-Based CF(UBCF) (Resnick et al., 1994), and Item-Based CF(IBCF) (Sarwar et al., 2001) and an hybridalgorithm. We evaluate these algorithms in terms ofpredictions accuracy by using the Mean Absolute Er-ror (MAE) (Herlocker et al., 2004), which is the mostwidely used metric in CF research literature. It com-putes the average of the absolute difference betweenthe predictions and true ratings in the test data set,lower the MAE is, better is the prediction.
We have experimented our approach on real datafrom the MovieLens1M dataset of the MovieLensrecommender system1. The MovieLens1M providesthe usage data set and contains 1,000,209 explicit rat-ings of approximately 3,900 movies made by 6,040users. For the semantic information of items, weuse the HetRec 2011 dataset (HetRec2011, 2011) thatlinks the movies of MovieLens dataset with their cor-responding web pages at Internet Movie Database(IMDb) and Rotten Tomatoes movie review systems.We use movie genre and movie origin as non depen-dent attributes, movie director and movie actor as de-pendent attributes.
We have filtered the data by maintaining onlyusers with at least 20 ratings, and available featuresfor all movies. After the filtering process, we obtaina data set with 6020 users, 3552 movies, 19 genres,44 origins, 1825 directors and 4237 actors. The usagedata set has been sorted by the timestamps, in ascend-ing order, and has been divided into a training set (in-cluding the first 80% of all ratings) and a test set (thelast 20% of all ratings). Thus, ratings of each user in
1http://www.movielens.org
User�Semantic�Model�for�Dependent�Attributes�to�Enhance�Collaborative�Filtering
209

(a) (b) (c)Figure 1: Impact of LSA on prediction accuracy of Rocchio algorithm.
test set have been assigned after those of training set.It should be noted that the building of user semanticattribute model for the non dependent attributes genreand origin have been addressed respectively in previ-ous works (Ben Ticha et al., 2011; Ben Ticha et al.,2012). Therefore, we will not detail the experimentsconducted for these attributes in this paper. If it is notspecified, the number of nearest neighbors is equal to60.
6.1 Impact of LSA on PredictionAccuracy
In Figure 1, the MAE has been plotted with respectto the LSA rank. It compares the Rocchio approachwith and without applying LSA (dimension reduc-tion) on director attribute (Figure 1(a)), actor attribute(Figure 1(b)) and combined attribute director actor(Figure 1(c)). In all cases, the plots have the samelook, the MAE of Rocchio with LSA decreases untilit reaches the MAE value of Rocchio without LSA.So, LSA dimension reduction has no effect on im-proving the accuracy. This can be explained by thefact that features are not highly correlated, which isunderstandable especially for attributes director andactor, hence their poor performance. Indeed, for thedirector attribute, for instance, the MAE without re-duction (1825 features) is equal to 0.7122 while thebest value with LSA is equal to 0.7884. However, forcombined attributes director actor (6062 features),the best value is equal to 0.7083 (obtained for Rocchiowithout LSA) while the worst value is equal to 0.7145(Rocchio with LSA, rank=400). For rank equal to1200, MAE= 0.7096, so a dimension reduction about80% for a loss of accuracy about 0.18%. In thiscase, features of combined attribute, actor director,are more correlated than the features of each attributetaken alone hence, the best performance. Althoughthe LSA doesnt improve the accuracy, dimension re-
duction is significant. Thus, it allows to reduce thecost of users similarity computing, specially when thenumber of features is very high, as is the case of com-bined attributes director actor.
6.2 Impact of Attribute Class onPrediction Accuracy
Figure 2 compares algorithms for building usersemantic attribute model in term of MAE. TheAverage algorithm (Average in plot) is build-ing user semantic attribute model by computingthe average of user ratings by feature (q(u; f ) =AV Gfdu(s)=s 2 Su and f 2 FAsg). Fuzzy C Mean al-gorithm (FuzzyCM in plot) is a fuzzy clustering usedfor non dependent and multivalued attribute (heregenre) and KMean algorithm (KMean in plot) isused on non dependent and mono valued attribute(here origin). Moreover, Rocchio algorithm (Roc-chio in plot) is applied here for all attributes depen-dent and non dependent. For genre, origin and di-rector attributes, Rocchio without LSA provides bestresults than with dimension reduction. For actor at-tribute, LSA with rank equal to 1100 is applied (Roc-chio+LSA in plot). When analyzing this figure wenote first, that Average algorithm provides, for all at-tributes, the worst performance compared to all otheralgorithms. Second, if we applied the Rocchio al-gorithm to non dependent attribute the performancecompares unfavorably against the dependent attribute,while the best performance is attained by FuzzyCMalgorithm on genre attribute and the difference is im-portant (0.7079 for FuzzyCM and 0.7274 for Roc-chio). This allows to deduct that, using a suited al-gorithm for each attribute class provides best perfor-mance than applying the same algorithm for all at-tributes. Third, the origin attribute has the worst per-formance compared to the other three attributes andthis for all algorithms; this is confirm our hypothe-
WEBIST�2014�-�International�Conference�on�Web�Information�Systems�and�Technologies
210

Figure 2: Impact of user semantic attribute algorithm on prediction accuracy.
Figure 3: Evaluation of USCF against standards CF.
sis that all attributes don’t have the same relevance tousers. The attribute origin can be less significant inthe choice of users than the genre, actor or director,which is intuitively understandable.
6.3 Comparative Results of USCFagainst Standard CF Systems
Figure 3 depicts the recommendation accuracy ofUser Semantic Collaborative Filtering (USCF) incontrast to standard Item-Based CF (IBCF) andUser-Based CF (UBCF). USCF-<Attributes> in plotmeans the list of relevant attributes involved in build-ing the user semantic model Q. For each relevantattribute, the suited algorithm is applied. So, FuzzyCMean for genre, KMean for origin, and Rocchiowith LSA (rank=1200) for combined attribute direc-
tor actor. Furthermore, MAE has been plotted withrespect to the number of neighbors (similar users) inthe k-nearest-neighbor algorithm. In all cases, theMAE converges between 60 and 70 neighbors. Ourapproach, USCF (in plot) results in an overall im-provement in accuracy for all attributes. In addition,the best performance is achieved by the combinationgenre-origin-director actor. This improvement canbe explained by many reasons. First, taking into ac-count the semantic profile of items in a CF recommen-dation process. Second, for non dependent attribute,user semantic model is built according to a collabora-tive principle; ratings of all users are used to computethe semantic profile of each user. It is not the case ofthe Average algorithm; this may explain its results de-spite taking into account the semantic aspect. Third,the choice of the attribute can have significant influ-ence on improving the accuracy. Lastly, users seman-
User�Semantic�Model�for�Dependent�Attributes�to�Enhance�Collaborative�Filtering
211
tic model Q has few missing values, so, it allows in-ferring similarity between two given users even whenthey have any items rated in common.
7 CONCLUSION AND FUTUREWORK
The approach presented in this paper is a compo-nent of a global work, which the aim, is to seman-tically enhanced collaborative Filtering recommenda-tion and to resolve the scalability problem by reducingthe dimension. For this purpose, we have designeda new hybridization technique, which predicts users’preferences for items based on their inferred prefer-ences for semantic information. We have defined twoclasses of attributes: dependent and non dependent at-tribute, and presented a suited algorithm for each classfor building user semantic attribute model. The aimof this paper is to present our approach for buildinguser semantic attribute model for dependent attribute.We have defined an algorithm based on Rocchio al-gorithm and have applied Latent Semantic Analysis(LSA) for dimension reduction. Our approach pro-vides solutions to the scalability problem, and alle-viates the data sparsity problem by reducing the di-mensionality of data. The experimental results showthat USCF algorithm improves the prediction accu-racy compared to usage only approach (UBCF andIBCF) and hybrid algorithm (Average). In addition,we have shown that applying Rocchio formula on nondependent attribute, decreases significantly the pre-diction accuracy compared to results obtained withmachine learning algorithms. Furthermore, we haveexperimentally shown that all attributes don’t have thesame importance to users. Finally, experiments haveshown that the combination of relevant attributes en-hances the recommendations.
An interesting area of future work is to use ma-chine learning techniques to infer relevant attributes.We will also study the extension of the user seman-tic model to non structured data in witch items aredescribed by free text. Lastly, study how our ap-proach can provide solution to the cold start prob-lem in which new user has few ratings. Indeed, CFcannot provide recommendation because similaritieswith others users cannot be computed.
REFERENCES
Adomavicius, G. and Tuzhilin, A. (2005). Toward the nextgeneration of recommender systems: A survey of the
state-of-the-art and possible extensions. IEEE Trans.Knowl. Data Eng., 17(6):734–749.
Balabanovic, M. and Shoham, Y. (1997). Fab: Content-based, collaborative recommendation. Commun.ACM, 40(3):66–72.
Ben Ticha, S., Roussanaly, A., and Boyer, A. (2011).User semantic model for hybrid recommender sys-tems. In The 1st Int. Conf. on Social Eco-Informatics- SOTICS, Barcelona, Espagne. IARIA.
Ben Ticha, S., Roussanaly, A., Boyer, A., and Bsaıes, K.(2012). User semantic preferences for collaborativerecommendations. In 13th Int. Conf. on E-Commerceand Web Technologies - EC-Web, pages 203–211, Vi-enna, Austria. Springer.
Burke, R. D. (2007). Hybrid web recommender systems. InThe Adaptive Web, volume 4321 of Lecture Notes inComputer Science, pages 377–408. Springer.
Dumais, S. T. (2004). Latent semantic analysis. An-nual Review of Information Science and Technology,38(1):188–230.
Herlocker, J. L., Konstan, J. A., Terveen, L. G., and Riedl,J. (2004). Evaluating collaborative filtering recom-mender systems. ACM Trans. Inf. Syst., 22(1):5–53.
HetRec2011 (2011). In 2nd Int Workshop on InformationHeterogeneity and Fusion in Recommender Systems.The 5th ACM Conf. RecSys.
Lops, P., de Gemmis, M., and Semeraro, G. (2011).Content-based recommender systems: State of theart and trends. In Recommender Systems Handbook,pages 73–105. Springer US.
Manzato, M. G. (2012). Discovering latent factors frommovies genres for enhanced recommendation. In The6th ACM conf. on Recommender systems - RecSys,pages 249–252, Dublin, Ireland.
Mobasher, B., Jin, X., and Zhou, Y. (2003). Semanticallyenhanced collaborative filtering on the web. In 1st Eu-ropean Web Mining Forum, volume 3209, pages 57–76, Cavtat-Dubrovnik, Croatia.
Pazzani, M. and Billsus, D. (2007). Content-based recom-mendation systems. In The Adaptive Web, volume4321 of Lecture Notes in Computer Science, pages325–341. Springer Berlin Heidelberg.
Resnick, P., Iacovou, N., Suchak, M., Bergstrom, P., andRiedl, J. (1994). Grouplens: an open architecture forcollaborative filtering of netnews. In The 1994 ACMconf. on Computer supported cooperative work, pages175–186, Chapel Hill, North Carolina, USA.
Rocchio, J. (1971). Relevance feedback in information re-trieval. In Salton, G., editor, The Smart Retrieval Sys-tem - Experiments in Automatic Document Process-ing, chapter 14, pages 313–323. Prentice-Hall, Inc.
Salton, G. (1989). Automatic Text Processing. Addison-Wesley.
Sarwar, B. M., Karypis, G., Konstan, J. A., and Riedl, J.(2001). Item-based collaborative filtering recommen-dation algorithms. In The 10 Int. WWW Conf., pages285–295, Hong Kong, China.
Sen, S., Vig, J., and Riedl, J. (2009). Tagommenders: con-necting users to items through tags. In The 18th IntConf. on WWW, pages 671–680, Madrid, Spain.
Su, X. and Khoshgoftaar, T. M. (2009). A survey of collabo-rative filtering techniques. Adv. Artificial Intellegence.
WEBIST�2014�-�International�Conference�on�Web�Information�Systems�and�Technologies
212

SHORT PAPERS


Extracting Multi-item Sequential Patterns by Wap-tree Based Approach
Kezban Dilek Onal and Pinar KaragozDepartment of Computer Engineering, Middle East Technical University, Ankara, Turkey
fdilek, [email protected]
Keywords: WAP-Tree (Web Access Pattern Tree), Sequential Pattern Mining, FOF (First Occurrence Forest), SiblingPrinciple, Web Usage Mining.
Abstract: Sequential pattern mining constitutes a basis for solution of problems in web mining, especially in web us-age mining. Research on sequence mining continues seeking faster algorithms. WAP-Tree based algorithmsthat emerged from the web usage mining literature have shown a remarkable performance on single-itemsequence databases. In this study, we investigate the application of WAP-Tree based mining to multi-item se-quential pattern mining and we present MULTI-WAP-Tree, which extends WAP-Tree for multi-item sequencedatabases. In addition, we propose a new algorithm MULTI-FOF-SP (MULTI-FOF-Sibling Principle) thatextracts patterns on MULTI-WAP-Tree. MULTI-FOF-SP is based on the previous WAP-Tree based algorithmFOF (First Occurrence Forest) and an early pruning strategy called ”Sibling Principle” from the literature.Experimental results reveal that MULTI-FOF-SP finds patterns faster than PrefixSpan on dense multi-itemsequence databases with small alphabets.
1 INTRODUCTION
Sequential pattern mining is one of the major tasksin data mining and it constitutes a basis for solu-tion of pattern discovery problems in various domains(Mooney and Roddick, 2013). Use of sequential pat-tern mining in web usage mining problems helps dis-covering user navigation patterns on web sites thatcan guide processes like recommendation and website design.
In some applications of sequence mining like webusage mining and bioinformatics, the sequences havefixed transaction size of 1. This specific case of se-quence mining is referred as Single-Item SequentialPattern Mining. In accordance with this naming, thegeneral form of the problem is referred as Multi-ItemSequential Pattern Mining.
WAP-Tree (Web Access Pattern Tree) based al-gorithms have shown remarkable execution time per-formance on single-item sequential pattern mining(Mabroukeh and Ezeife, 2010). WAP-Tree is a com-pact data structure for representing single-item se-quence databases (Pei et al., 2000). There is a con-siderable number of WAP-Tree based algorithms inthe literature. Among the previous WAP-Tree basedalgorithms, PLWAP (Ezeife and Lu, 2005) is re-ported to outperform well known general sequen-tial pattern mining algorithms PrefixSpan and LAPIN
on single-item sequence databases (Mabroukeh andEzeife, 2010) for single item patterns.
Inspired by the success of WAP-Tree, we designeda new data structure MULTI-WAP-Tree which ex-tends WAP-Tree for representing multi-item/generalsequence databases. Secondly, we propose a newsequential pattern mining algorithm MULTI-FOF-SPbased on MULTI-WAP-Tree inspired by the WAP-Tree based algorithm FOF (First Occurrence For-est) (Peterson and Tang, 2008). MULTI-FOF-SP,integrates FOF approach and the early prunningidea ”Sibling Principle” from the previous studies(Masseglia et al., 2000) and (Song et al., 2005).
We have analyzed the performance of the pro-posed method on several test cases. The results showthat MULTI-WAP-Tree and the associated mining al-gorithm on this structure presents successful results,especially for dense multi-item sequence databaseswith small alphabets.
The rest of the paper is composed of four sections.In Section 2, we provide background information onWAP-Tree and the FOF algorithm. We present ourcontributions, MULTI-WAP-Tree and MULTI-FOF-SP, in Section 3 and Section 4, respectively. Finally,we present experiment results in Section 5 and con-clude in Section 6.
215
2 RELATED WORK ANDBACKGROUND
Sequential pattern mining is the extraction of the se-quences that occur at least as frequently as the mini-mum support minSupport in a sequence database D(Agrawal and Srikant, 1995). The sequential pat-tern mining algorithms in the literature can be re-viewed under four categories (Mabroukeh and Ezeife,2010), namely Apriori based, vertical projection, pat-tern growth and early prunning.
The WAP-Tree based algorithms follow the pat-tern growth approach on single-item sequential pat-tern mining. Since our study is focused on WAP-Tree based mining, we first review the WAP-Tree datastructure in the next subsection. Secondly, we sum-marize the pattern growth approach in Subsection 2.2.Finally, we review the FOF (First Occurrence Forest)algorithm in comparison with the other WAP-Treebased algorithms in Subsection 2.3.
2.1 WAP-Tree
The WAP-Tree (Web Access Pattern Tree) is a treedata structure that is designed to represent a single-item sequence database. This data structure was firstintroduced together with the WAP-Mine algorithm(Pei et al., 2000). WAP-Mine algorithm converts thesequence database into a WAP-Tree with an initialdatabase scan and performs mining on the WAP-Treeto find frequent patterns.
Table 1: Sample Single-item Sequence Database.
Sequence Id Sequence1 aba2 adcdb3 beae4 ac
Figure 1 illustrates the WAP-Tree for the sequencedatabase given in Table 1 under minimum support 0.5.Each node of the WAP-Tree comprises two fields:Item and Count. Count field of a node n stores thecount of the sequences starting with the prefix ob-tained by following the path from root to n. The twochildren of R, (a:3) and (b:1) in Figure 1 indicate thatthere are 3 sequences starting with a and a single se-quence starting with b. WAP-Tree provides a compactrepresentation since shared prefixes can be encodedon the nodes.
R
a:3
b:1
a:1
c:2
b:1
b:1
a:1
Figure 1: WAP-Tree For The Sequence Database in Table 1Under Support Threshold 0.5.
2.2 Pattern Growth Approach
The pattern growth approach follows the divide andconquer paradigm (Han et al., 2005). The originalproblem of finding the frequent sequences is recur-sively broken down into smaller problems by shrink-ing the database into projected databases. The lex-icographic search space is traversed depth-first andwhenever a pattern is found to be frequent, thedatabase is projected by the pattern. The mining pro-cess is recursed on the projected database.
The realization of the pattern growth approach de-pends on the pattern growing direction, how the pro-jected databases are represented and located duringmining (Han et al., 2005). There are two alternativedirections for growing patterns: namely su�x grow-ing and prefix growing. The patterns are grown by ap-pending symbols in prefix growing whereas they aregrown by prepending symbols in su�x growing.
D j�abaadcdbbeaeac
(a)
D jabadcdbec(b)
D jaba���(c)
Figure 2: Projected Databases for Di�erent Patterns.
Three sample projected databases for prefix-growing are given in horizontal database representa-tion in Figure 2. From left to right, the tables in Figure2 are the projected databases of the patterns �,b,ba inthe sequence database D given in Table 1. The pro-jections of the sequences can be traced by followingthe rows of the tables at the same level. For exam-ple, the a-projection of the sequence aba is ba. Theb-projection of the sequence ba is a and it is equal tothe ab-projection of aba.
2.3 FOF (First Occurrence Forest)
FOF is a prefix growing WAP-Tree based algorithm.The FOF algorithm represents the sequence databaseas a WAP-Tree and it adopts the recursive projected
WEBIST�2014�-�International�Conference�on�Web�Information�Systems�and�Technologies
216
R
a:3
b:1
a:1n1
c:2
b:1
b:1
a:1
(a) FOF for the Pattern �.
R
a:3
b:1
a:1
c:2
b:1
b:1
a:1
(b) FOF for the Patterna.
R
a:3
b:1
a:1
c:2
b:1
b:1
a:1
(c) FOF for the Patternab.
Figure 3: FOFs for Prefix Growing On WAP-Tree.
database mining approach of the pattern growth algo-rithms. The FOF algorithm represents the projecteddatabases as First Occurrence Forests (FOFs). FirstOccurrence Forest is a list of WAP-Tree nodes whichroot a forest of WAP-Trees. The WAP-Trees rootedby the FOF nodes of a pattern encode the projectionsof the sequences by the pattern. FOF representationenables easy support counting for a pattern by sum-ming the count values of the FOF nodes.
The mining process of the FOF algorithm is basedon searching the first level occurrences of symbols re-cursively. At each pattern growing step by a symbol,the first level occurrences of the symbol in the for-est of WAP-Trees defined by the FOF of the originalpattern are assigned as the FOF nodes for the grownpattern. The mining process is recursed on the FOFnodes for the grown pattern.
The mining process of the FOF algorithm on theWAP-Tree in Figure 1 is partially illustrated in Fig-ure 3. FOF of three di�erent patterns are presented inFigure 3. The shaded nodes in the WAP-Trees indi-cate the FOF nodes. Initially, the FOF for the pattern� is fR : 4g. Secondly, the first level occurrences of thesymbol a under the node R:4 are found as the FOFfor the pattern a. The node n1 is not included in theFOF of the symbol a since it is not a first level occur-rence. In the next level of recursion, the FOF algo-rithm mines the FOF for a. The FOF for ab is the setof first level b occurrences in the sub-trees rooted bythe shaded nodes for pattern a. FOF of ab is found bysearching the first level b occurrences in the sub-treesrooted by the FOF nodes for the pattern a.
The projected database representation as a list ofnodes, i.e. FOF, was adapted by previous WAP-
Tree based algorithms except WAP-Mine. All WAP-Tree based algorithms in the literature follow pattern-growth approach. However, they di�er in the patterngrowing direction. WAP-Mine does su�x growingand represents projected databases as WAP-Trees. Allof the latter algorithms, namely PLWAP (Ezeife andLu, 2005), FLWAP (Tang et al., 2006), FOF (Petersonand Tang, 2008) and BLWAP (Liu and Liu, 2010), doprefix growing.
Prefix growing WAP-Tree based algorithms dif-fer in their approach for locating the first level oc-currences of a symbol in a WAP-Tree. The FOF al-gorithm locates first level occurrences of an item bysimple depth-first search. On the contrary, PLWAP,BLWAP and FLWAP leverage additional data struc-tures links and header table besides the WAP-Tree.The links connect all occurrences of an item in aWAP-Tree and the links can be followed starting fromthe header table. The first level occurences of an itemin a WAP-Tree can be easily found by following thelinks of an item and filtering the occurrences whichare found at the first level. The FOF algorithm is re-ported to outperform PLWAP and FLWAP in (Peter-son and Tang, 2008) although. FOF uses less mem-ory since it mines WAP-Tree without additional struc-tures. Besides, although the links provide direct ac-cess to the occurrences, filtering the first level occur-rences brings an extra cost to PLWAP and FLWAP.
3 MULTI-WAP-TREE
MULTI-WAP-Tree is an extended WAP-Tree whichcan represent both single and multi-item sequencedatabases. MULTI-WAP-Tree is identical to theWAP-Tree in that it contains only frequent items inits nodes and each sequence in the sequence databaseis encoded in MULTI-WAP-Tree on a path from theroot to a node of the tree.
MULTI-WAP-Tree di�ers from the WAP-Tree intwo points:
� MULTI-WAP-Tree has two types of edges be-tween nodes : S-Edge and I-Edge whereas WAP-Tree has a single edge type.
� MULTI-WAP-Tree nodes keep a pointer to theirparent nodes in addition to the fields of WAP-Tree.
MULTI-WAP-Tree is able to represent a multi-item sequence database owing to two di�erent edgetypes between nodes. A multi-item sequence is com-posed of a series of item-sets. WAP-Tree is not ableto represent multi-item databases since it cannot ex-press boundaries between item-sets in multi-item se-
Extracting�Multi-item�Sequential�Patterns�by�Wap-tree�Based�Approach
217

quences. S-Edges of MULTI-WAP-Tree can encodeitem set boundaries. An S-Edge from a node to itschild indicates the separator between two item sets:item set ending with the parent and item set startingwith the child. On the contrary, the nodes connectedwith I-Edges are always in the same item set.
Figure 4(d) shows the MULTI-WAP-Tree for thesample multi-item database in Table 2 under the sup-port threshold 0.5. The dashed edges in the figure areI-Edges, whereas the plain edges are S-Edges. Theprefix represented by the gray coloured node is (ab).Although both of the edges originating from this nodepoint to c labeled nodes, they yield di�erent prefixessince their edge types are di�erent. The child of thisnode connected with an S-Edge represents the prefix(ab)(c), whereas the other child connected with theI-Edge represents the prefix (abc).
Table 2: Sample Multi-item Sequence Database.
Sequence Id Sequence1 (ab)(c)2 (a)(b)(c)3 (abc)(c)
The second extension to the WAP-Tree, ”pointerto parent node” in MULTI-WAP-Tree nodes, enablestracking item sets upwards in the tree in the miningphase. This additional field does not contribute tothe database representation but it is an important con-struct for mining MULTI-WAP-Tree.
4 MULTI-FOF-SP
MULTI-FOF-SP algorithm is a multi-item sequen-tial pattern mining algorithm based on the representa-tion MULTI-WAP-Tree. MULTI-FOF-SP algorithmhas three basic steps, as in all WAP-Tree based algo-rithms:
1. Scan database to find frequent items.
2. Scan database and build MULTI-WAP-Tree.
3. Mine frequent patterns from MULTI-WAP-Tree.
4.1 Building MULTI-WAP-Tree
For MULTI-WAP-Tree construction, after eliminat-ing the infrequent items, each sequence is insertedinto the tree starting from the root, updating countsof shared prefix nodes and inserting new nodes forthe unshared su�x part, as in WAP-Tree construc-tion. While constructing a WAP-Tree, checking onlyequality of item fields of nodes is su�cient. However,in the MULTI-WAP-Tree case, checking the equality
of edge types is also required. To illustrate, Figure 4depicts the MULTI-WAP-Tree database constructionalgorithm on the mini database in Table 2. When in-serting the second sequence (a)(b)(c), although the anode already has a b child, since this child is con-nected with an I-Edge, a new b node is added with anS-Edge.
(a)
R R
a:1
b:1
c:1
(b)
R
a:2
b:1
c:1
b:1
c:1
(c)
R
a:3
b:2
c:1 c:1
c:1
b:1
c:1
(d)Figure 4: Building Steps of the MULTI-WAP-Tree for theDatabase in Table 2. Left to right: MULTI-WAP-Tree af-ter sequences (ab)(c), (a)(b)(c), (abc)(c) are inserted succe-sively.
4.2 Mining MULTI-WAP-Tree
MULTI-FOF-SP follows prefix growing and FOF ap-proach for extracting multi-item sequential patternson MULTI-WAP-Tree. MULTI-FOF-SP representsprojected databases in FOF form and finds first leveloccurrences of an item by simple depth first search onthe MULTI-WAP-Tree, as in FOF algorithm. How-ever, MULTI-FOF-SP algorithm di�ers from FOF intwo points which are explained in detail in the follow-ing two subsections.
4.2.1 S-Occurrence vs. I-Occurrence
Existence of two di�erent edge types S-Edge andI-Edge in MULTI-WAP-Tree necessitates distinc-tion between S-Occurrences and I-Occurrences. S-Occurrences are the first level occurrences that yielda sequence extension, whereas I-Occurrences yield anitem-set extension.
MULTI-FOF-SP algorithm treats S-Occurrencesand I-Occurrences as occurrences of di�erent sym-bols and searches for them separately. Whenever anoccurrence is located, it is subjected to a test for itsoccurrence type. If an occurrence is found in the sub-tree rooted by startNode, the algorithm decides on thetype of occurrence based on the three rules below:1. A node is an S-Occurrence if there exists at least
one S-Edge on the path from the startNode to thisnode.
WEBIST�2014�-�International�Conference�on�Web�Information�Systems�and�Technologies
218
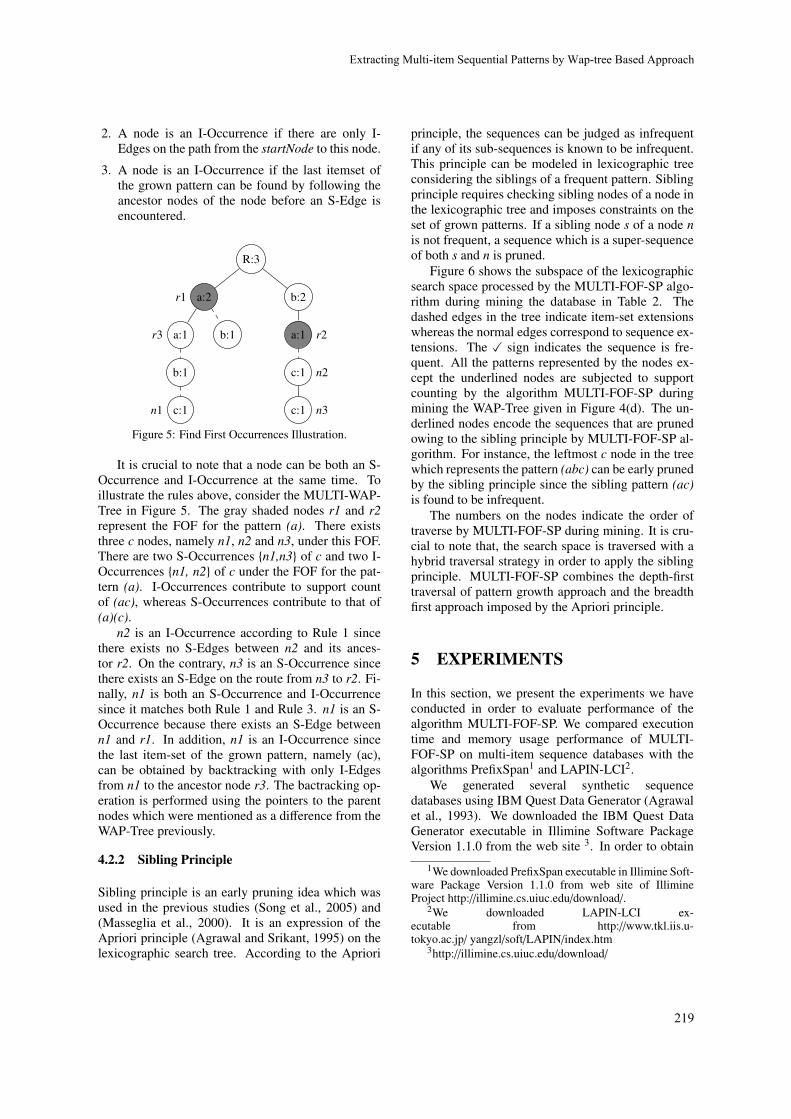
2. A node is an I-Occurrence if there are only I-Edges on the path from the startNode to this node.
3. A node is an I-Occurrence if the last itemset ofthe grown pattern can be found by following theancestor nodes of the node before an S-Edge isencountered.
R:3
a:2r1
a:1r3
b:1
c:1n1
b:1
b:2
a:1 r2
c:1 n2
c:1 n3
Figure 5: Find First Occurrences Illustration.
It is crucial to note that a node can be both an S-Occurrence and I-Occurrence at the same time. Toillustrate the rules above, consider the MULTI-WAP-Tree in Figure 5. The gray shaded nodes r1 and r2represent the FOF for the pattern (a). There existsthree c nodes, namely n1, n2 and n3, under this FOF.There are two S-Occurrences fn1,n3g of c and two I-Occurrences fn1, n2g of c under the FOF for the pat-tern (a). I-Occurrences contribute to support countof (ac), whereas S-Occurrences contribute to that of(a)(c).
n2 is an I-Occurrence according to Rule 1 sincethere exists no S-Edges between n2 and its ances-tor r2. On the contrary, n3 is an S-Occurrence sincethere exists an S-Edge on the route from n3 to r2. Fi-nally, n1 is both an S-Occurrence and I-Occurrencesince it matches both Rule 1 and Rule 3. n1 is an S-Occurrence because there exists an S-Edge betweenn1 and r1. In addition, n1 is an I-Occurrence sincethe last item-set of the grown pattern, namely (ac),can be obtained by backtracking with only I-Edgesfrom n1 to the ancestor node r3. The bactracking op-eration is performed using the pointers to the parentnodes which were mentioned as a di�erence from theWAP-Tree previously.
4.2.2 Sibling Principle
Sibling principle is an early pruning idea which wasused in the previous studies (Song et al., 2005) and(Masseglia et al., 2000). It is an expression of theApriori principle (Agrawal and Srikant, 1995) on thelexicographic search tree. According to the Apriori
principle, the sequences can be judged as infrequentif any of its sub-sequences is known to be infrequent.This principle can be modeled in lexicographic treeconsidering the siblings of a frequent pattern. Siblingprinciple requires checking sibling nodes of a node inthe lexicographic tree and imposes constraints on theset of grown patterns. If a sibling node s of a node nis not frequent, a sequence which is a super-sequenceof both s and n is pruned.
Figure 6 shows the subspace of the lexicographicsearch space processed by the MULTI-FOF-SP algo-rithm during mining the database in Table 2. Thedashed edges in the tree indicate item-set extensionswhereas the normal edges correspond to sequence ex-tensions. The X sign indicates the sequence is fre-quent. All the patterns represented by the nodes ex-cept the underlined nodes are subjected to supportcounting by the algorithm MULTI-FOF-SP duringmining the WAP-Tree given in Figure 4(d). The un-derlined nodes encode the sequences that are prunedowing to the sibling principle by MULTI-FOF-SP al-gorithm. For instance, the leftmost c node in the treewhich represents the pattern (abc) can be early prunedby the sibling principle since the sibling pattern (ac)is found to be infrequent.
The numbers on the nodes indicate the order oftraverse by MULTI-FOF-SP during mining. It is cru-cial to note that, the search space is traversed with ahybrid traversal strategy in order to apply the siblingprinciple. MULTI-FOF-SP combines the depth-firsttraversal of pattern growth approach and the breadthfirst approach imposed by the Apriori principle.
5 EXPERIMENTS
In this section, we present the experiments we haveconducted in order to evaluate performance of thealgorithm MULTI-FOF-SP. We compared executiontime and memory usage performance of MULTI-FOF-SP on multi-item sequence databases with thealgorithms PrefixSpan1 and LAPIN-LCI2.
We generated several synthetic sequencedatabases using IBM Quest Data Generator (Agrawalet al., 1993). We downloaded the IBM Quest DataGenerator executable in Illimine Software PackageVersion 1.1.0 from the web site 3. In order to obtain
1We downloaded PrefixSpan executable in Illimine Soft-ware Package Version 1.1.0 from web site of IllimineProject http://illimine.cs.uiuc.edu/download/.
2We downloaded LAPIN-LCI ex-ecutable from http://www.tkl.iis.u-tokyo.ac.jp/ yangzl/soft/LAPIN/index.htm
3http://illimine.cs.uiuc.edu/download/
Extracting�Multi-item�Sequential�Patterns�by�Wap-tree�Based�Approach
219

�
a X1
b X4
c a b c X 9
a b c10
c5
a6
b7
c X 8
a b c11
b X2
c12
a13
b14
c X
15
a b c16
c X
3
a17
b18
c19
Figure 6: The Subspace of the Lexicographic Search Space Processed by the MULTI-FOF-SP Algorithm for Mining theDatabase in Table. 2
a comprehensive data set, we determined a set ofvalues for each of the parameters C (Average lengthof sequences) =f25g, T (average size of itemsets) =
f3,7g, D (number of sequences) = f200K,800Kg and N(size of database alphabet) = f10,500g. We generateddatabases with combination of values from these sets.
Each sequence database in the experiment set isnamed in accordance with the parameter values. Forinstance C25T3S25I3N10D200k specifies a databasegenerated with parameters C=25, T=3, S=25, I=3,N=10 and D=200K. The support values for the ex-periment sets are chosen such that comparative per-formance results can be obtained in a reasonable time.
We performed experiments on a personal com-puter with Intel(R) Core(TM) i7 860 @2.80Ghz 2.80Ghz CPU, 8 GB installed memory and Windows 7Professional 64-bit operating system. For each exper-iment case identified by the 4-tuple (Algorithm, Se-quence Database, MinSupport), we report the execu-tion time and memory consumption of algorithm onthe sequence database. We repeated each test case runat least three times and reported the average value forall the algorithms. Due to space limitation, we presentresults of only a part of the conducted experiments.
As the first set of experiments, we present resultson two di�erent sequence databases of alphabet sizeN=500 in Figure 7 and Figure 8. In these experimentswith large alphabet, PrefixSpan is faster then MULTI-FOF-SP in all of the cases. Although, LAPIN-LCI isfaster than MULTI-FOF-SP in some cases, there arealso cases in which LAPIN ends unexpectedly con-suming more than 2 GBs of memory. MULTI-FOF-SP can prune the search space owing to sibling prin-ciple yet it may not be su�cient when the alphabet islarge.
As the second set of experiments, we present re-sults on three di�erent sequence databases of alphabetsize N=10 in Figure 9 and Figure 10.
MULTI-FOF-SP outperforms PrefixSpan in termsof execution time on all sequence databases with al-phabet size N=10. In most of the cases, MULTI-
30 20 10
0
500
1;000
Min Support(%)E
xecu
tion
Tim
e(s
econ
ds)
C25T3S25I3D200k
30 20 10
0
2;000
4;000
Min Support(%)
Exe
cutio
nTi
me
(sec
onds
)
C25T3S25I3D800k
PrefixSpanLAPIN-LCI
MULTI-FOF-SP
Figure 7: Execution Times of Algorithms on Databaseswith N=500.
FOF-SP is faster than LAPIN-LCI yet there are casesin which LAPIN-LCI is slightly faster. However,there are also cases LAPIN-LCI could not com-plete execution since it ran out of memory. Onesuch case is given in Figure 10 for the databaseC25T7S25I7N10D800k when the minimum supportvalue is decreased to 99.3.
MULTI-FOF-SP ranks the second on databaseswith N=10 in terms of memory consumption. The al-gorithm stores many FOFs in the memory in order toapply sibling principle. However, the memory con-sumption is moderate because this cost is compen-
WEBIST�2014�-�International�Conference�on�Web�Information�Systems�and�Technologies
220
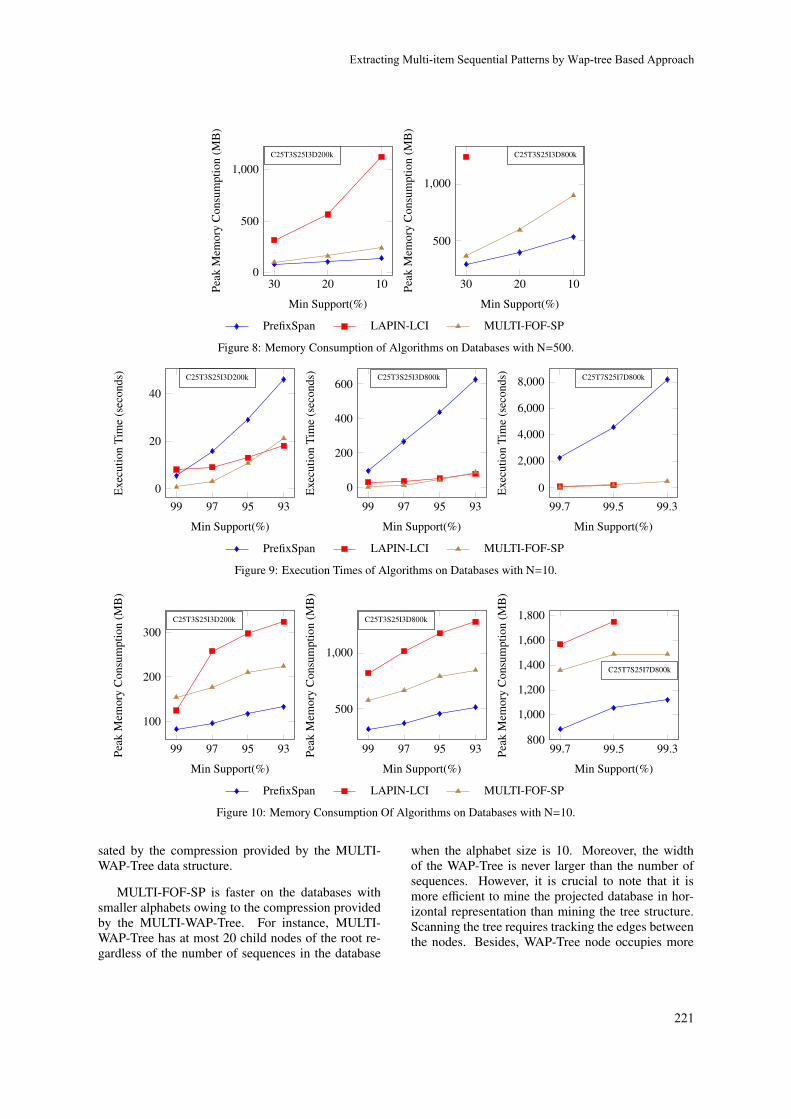
30 20 100
500
1;000
Min Support(%)
Peak
Mem
ory
Con
sum
ptio
n(M
B)
C25T3S25I3D200k
30 20 10
500
1;000
Min Support(%)
Peak
Mem
ory
Con
sum
ptio
n(M
B)
C25T3S25I3D800k
PrefixSpan LAPIN-LCI MULTI-FOF-SP
Figure 8: Memory Consumption of Algorithms on Databases with N=500.
99 97 95 930
20
40
Min Support(%)
Exe
cutio
nTi
me
(sec
onds
)
C25T3S25I3D200k
99 97 95 93
0
200
400
600
Min Support(%)
Exe
cutio
nTi
me
(sec
onds
)
C25T3S25I3D800k
99:7 99:5 99:3
0
2;000
4;000
6;000
8;000
Min Support(%)
Exe
cutio
nTi
me
(sec
onds
)
C25T7S25I7D800k
PrefixSpan LAPIN-LCI MULTI-FOF-SP
Figure 9: Execution Times of Algorithms on Databases with N=10.
99 97 95 93
100
200
300
Min Support(%)
Peak
Mem
ory
Con
sum
ptio
n(M
B)
C25T3S25I3D200k
99 97 95 93
500
1;000
Min Support(%)
Peak
Mem
ory
Con
sum
ptio
n(M
B)
C25T3S25I3D800k
99:7 99:5 99:3800
1;000
1;200
1;400
1;600
1;800
Min Support(%)
Peak
Mem
ory
Con
sum
ptio
n(M
B)
C25T7S25I7D800k
PrefixSpan LAPIN-LCI MULTI-FOF-SP
Figure 10: Memory Consumption Of Algorithms on Databases with N=10.
sated by the compression provided by the MULTI-WAP-Tree data structure.
MULTI-FOF-SP is faster on the databases withsmaller alphabets owing to the compression providedby the MULTI-WAP-Tree. For instance, MULTI-WAP-Tree has at most 20 child nodes of the root re-gardless of the number of sequences in the database
when the alphabet size is 10. Moreover, the widthof the WAP-Tree is never larger than the number ofsequences. However, it is crucial to note that it ismore e�cient to mine the projected database in hor-izontal representation than mining the tree structure.Scanning the tree requires tracking the edges betweenthe nodes. Besides, WAP-Tree node occupies more
Extracting�Multi-item�Sequential�Patterns�by�Wap-tree�Based�Approach
221

space than the space occupied by an item in hori-zontol representation. Consequently, if the FOF ap-proach were applied on the MULTI-WAP-Tree with-out the sibling principle, both memory and time re-quirements of FOF approach would be higher in casesof large alphabets. A high degree of compression bythe MULTI-WAP-Tree is required to outperform Pre-fixSpan and LAPIN in terms of both execution timeand memory. We observed that this requirement can-not be met in case of large alphabets.
6 CONCLUSIONS AND FUTUREWORK
In this paper, we introduced a new data structureMULTI-WAP-Tree and a new algorithm MULTI-FOF-SP for extracting multi-item sequence patterns.MULTI-WAP-Tree is the first tree structure for repre-senting general sequence databases. MULTI-FOF-SPemploys the early pruning idea Sibling Principle.
We have experimented on several test cases tocompare MULTI-FOF-SP with previous multi-itemsequence mining algorithms, PrefixSpan and LAPIN-LCI. Experiments revealed that MULTI-FOF-SP out-performs PrefixSpan and has a performance closeto LAPIN-LCI in terms of execution time on densemulti-item databases with small alphabets. In addi-tion, it has a better performance than LAPIN-LCI interms of memory usage for these databases.
In this work, we devised a MULTI-WAP-Treebased algorithm that uses sibling principle and ob-tained good results. As a continuation of this line,other existing tree based algorithms can be inves-tigated for multi-item sequence mining using theMULTI-WAP-Tree data structure.
REFERENCES
Agrawal, R., Imelinski, T., and Swami, A. (1993). Min-ing association rules between sets of items in largedatabases. In Proceedings of the ACM SIGMODConference on Management of Data, pages 207–216.ACM.
Agrawal, R. and Srikant, R. (1995). Mining sequential pat-terns. In Proceedings of the Eleventh InternationalConference on Data Engineering (ICDE’95), pages3–14. IEEE.
Ezeife, C. and Lu, Y. (2005). Mining web log sequen-tial patterns with position coded pre-order linkedwap-tree. Data Mining and Knowledge Discovery,10(1):5–38.
Han, J., Pei, J., and Yan, X. (2005). Sequential pat-tern mining by pattern-growth: Principles and exten-
sions*. In Chu, W. and Lin, T., editors, Foundationsand Advances in Data Mining, volume 180 of Stud-ies in Fuzziness and Soft Computing, pages 183–220.Springer Berlin Heidelberg.
Liu, L. and Liu, J. (2010). Mining web log sequential pat-terns with layer coded breadth-first linked wap-tree. InInternational Conference of Information Science andManagement Engineering (ISME’2010), volume 1,pages 28–31. IEEE.
Mabroukeh, N. and Ezeife, C. (2010). A taxonomy of se-quential pattern mining algorithms. ACM ComputingSurveys (CSUR), 43(1):3.
Masseglia, F., Poncelet, P., and Cicchetti, R. (2000). Ane�cient algorithm for web usage mining. Networkingand Information Systems Journal, 2(5/6):571–604.
Mooney, C. H. and Roddick, J. F. (2013). Sequential patternmining – approaches and algorithms. ACM Comput.Surv., 45(2):19:1–19:39.
Pei, J., Han, J., Mortazavi-Asl, B., and Zhu, H. (2000). Min-ing access patterns e�ciently from web logs. Knowl-edge Discovery and Data Mining. Current Issues andNew Applications, pages 396–407.
Peterson, E. and Tang, P. (2008). Mining frequent sequen-tial patterns with first-occurrence forests. In Proceed-ings of the 46th Annual Southeast Regional Confer-ence (ACMSE), pages 34–39. ACM.
Song, S., Hu, H., and Jin, S. (2005). Hvsm: A new sequen-tial pattern mining algorithm using bitmap representa-tion. In Li, X., Wang, S., and Dong, Z., editors, Ad-vanced Data Mining and Applications, volume 3584of Lecture Notes in Computer Science, pages 455–463. Springer Berlin Heidelberg.
Tang, P., Turkia, M., and Gallivan, K. (2006). Miningweb access patterns with first-occurrence linked wap-trees. In Proceedings of the 16th International Confer-ence on Software Engineering and Data Engineering(SEDE’07), pages 247–252. Citeseer.
WEBIST�2014�-�International�Conference�on�Web�Information�Systems�and�Technologies
222

Improving Opinion-based Entity Ranking
Christos Makris and Panagiotis Panagopoulos Department of Computer Engineering and Informatics, University of Patras, Patras, Greece
{makri, panagoppa}@ceid.upatras.gr
Keywords: Opinion Mining and Sentiment Analysis, Web Information Filtering and Retrieval, Searching and Browsing.
Abstract: We examine the problem of entity ranking using opinions expressed in users' reviews. There is a massive development of opinions and reviews on the web, which includes reviews of products and services, and opinions about events and persons. For products especially, there are thousands of users' reviews, that consumers usually consult before proceeding in a purchase. In this study we are following the idea of turning the entity ranking problem into a matching preferences problem. This allows us to approach its solution using any standard information retrieval model. Building on this framework, we examine techniques which use sentiment and clustering information, and we suggest the naive consumer model. We describe the results of two sets of experiments and we show that the proposed techniques deliver interesting results.
1 INTRODUCTION
The rapid development of web technologies and social networks, has created a huge volume of reviews on products and services, and opinions on events and individuals.
Opinions are an important part of human activity because they affect our behavior in decision-making. It has become a habit for consumers to be informed by the reviews of other users, before they make a purchase of a product or a service. Businesses also want to be able to know the opinions concerning all their products or services and modify appropriately their promotion and their further development.
The consumer, however, in order to create an overall evaluation assessment for a set of objects of a specific entity, must refer to many reviews. From those reviews he must extract as many opinions as possible, in order to create an observable conclusion for each of the objects, and then to finally classify the objects and discern those that are notable. It is clear that this multitude of opinions creates a challenge for the consumer and also for the entity ranking systems.
Thus we recognize that the development of computational techniques, that help users to digest and utilize all opinions, is a very important and interesting research challenge.
In (Ganesan and ChengXiang, 2012) it is
depicted the setup for an opinion-based entity ranking system. The idea is that each entity is represented by the text of all its reviews, and that the users of such a system, determine their preferences on several attributes during the evaluation process. Thus we can expect that a user's query, will consist of preferences on multiple attributes. By turning the problem of assessing entities into a matching preferences problem, we can use, in order to solve it, any standard information retrieval model. Given a query from the user, which consists of keywords and expresses the desired characteristics an entity must have, we can evaluate all candidate entities based on how well the opinions of those entities match the user's preferences.
Building on this idea. in the present paper, we develop schemes which take into account clustering and sentiment information about the opinions expressed in reviews. We also propose a naive consumer model as a setup that uses information from the web to gather knowledge from the community in order to evaluate the entities that are more important.
2 RELATED WORK
In this study we deal with the problem of creating a ranked list of entities using users' reviews. In order
223
to approach effectively its handling, we are moving to the direction of aspect-oriented opinion mining or feature-based opinion mining as defined in (Ganesan and ChengXiang, 2012). In this consideration, each entity is represented as the total text of all the available reviews for it, and users express their queries as preferences in multiple aspects. Entities are evaluated depending on how well the opinions, expressed in the reviews, are matched user's preferences.
Regarding reviews, a great deal of research has been done on the classification of reviews to positive and negative based on the overall sentiment information contained (document level sentiment classification). There have been proposed several supervised in (Gamon, 2005), (Pang and Lee, 2004), unsupervised in (Turney and Littman, 2002), (Nasukawa and Yi, 2003), and also hybrid in (Pang and Lee, 2005), (Prabowo and Thelwall, 2009) techniques.
A related research area is opinion retrieval in (Liu, 2012). The goal of opinion retrieval is to identify documents that contain opinions. An opinion retrieval system is usually created on top of the classical recovery models, where relevant documents are initially retrieved and then some opinion analysis techniques are being used to export only documents containing opinions. In our approach we are assuming that we already have available the texts, which contain the opinions for the entities.
Another related research area is the field of Expert Finding. In this area, the goal is to recover one ranked list of persons, which are experts on a certain topic (Fang and Zhai, 2007), (Baeza-Yates and Ribeiro-Neto, 2011), (Wang et al., 2010). In particular, we are trying to export a ranked list of entities, but instead of evaluating the entities based on how well they match a topic, we use the opinions for the entities and we are observing how well they match the user's preferences.
Also, there has been much research in the direction of using reviews for provisioning aspect based ratings in (Wang et al.,2010), (Snyder and Barzilay, 2007). This direction is relevant to ours, because by performing aspect based analysis, we can extract the ratings of the different aspects from the reviews. Thus we can assess entities based on the ratings of the aspects, which are in the user's interests.
In section 6, we examine the naive consumer model as an unsupervised schema that utilizes information from the web in order to yield a weight of importance to each of the features used for
evaluating the entities. We choose to use a formula that has some resemblance to those used in item response theory (ITL), (Hambleton et al., 1991) and the Rasch model (Rasch), (Rasch, 1960/1980). Item response theory is a paradigm for the design, analysis, and scoring of tests, questionnaires, and similar instruments measuring abilities, attitudes, or other variables. The mathematical theory underlying Rasch models is a special case of item response theory. There are approaches in text mining that use the Rasch model and item response theory such as (Tikves et al., 2012), (He, 2013). However our approach differs in the chosen metrics and in the applied methodology and we do not use explicitly any of the modeling capabilities of these theories. For other different approaches that take aspect weight into account see (Liu, 2012) and more specifically (Yu et al., 2011) however our technique is simpler and fits into the framework presented in (Ganesan and ChengXiang, 2012).
2.1 Novelty in Contribution
In (Ganesan and ChengXiang, 2012), they presented a setup for entity ranking, where entities are evaluated depending on how well the opinions expressed in the reviews are matched against user's preferences. They studied the use of various state-of-the-art retrieval models for this task, such as the BM25 retrieval function (Baeza-Yates and Ribeiro-Neto, 2011), (Robertson and Zaragoza, 2009), and they also proposed some new extensions over these models, including query aspect modeling (QAM) and opinion expansion. With these extensions they were given the opportunity to classical information retrieval models to detect subjective information, i.e. opinions, that exist in review texts. More specifically, the opinion expansion introduced intensifiers and common praise words with positive meaning, placing at the top entities with many positive opinions. This expansion favoured texts, and correspondingly entities, with positive opinions on aspects, which is the goal. However this approach does not impose penalties for negative opinions.
We further improve this setup by developing schemes, which take into account sentiment (section 4) and clustering information (section 5) about the opinions expressed in reviews. We also propose the naive consumer model in section 6.
WEBIST�2014�-�International�Conference�on�Web�Information�Systems�and�Technologies
224
3 THE PROBLEM OF RANKING ENTITIES AS INFORMATION RETRIEVAL PROBLEM
Consider an entity ranking system, RS, and a collection of entities E= {e1, e2, ..., en} of the same kind. Assume that each of the entities in the set E, is accompanied by a big collective text with all the reviews for it, written by some reviewers. Let R = {r1, r2, ..., rn} be the set of all those texts. Then there exists an "1-1" relationship between the entities of E and the texts of R. Given a query q that is composed by a subset of the aspects, the RS system produces a ranking list of entities in E.
The idea to assess the entities, is to represent each entity with the text of all the reviews referred to in that entity. Given a keyword query by a user, which expresses the desirable features that an entity should have, we can evaluate the entities based on how well the review texts (ri) match the user's preferences. So the problem of entity ranking becomes an information retrieval problem. Thus we can employ some of the known information retrieval models, such as BM25. This setup is being presented in (Ganesan and ChengXiang, 2012). In particular they employed the BM25 retrieval function (Baeza-Yates and Ribeiro-Neto, 2011), (Robertson and Zaragoza, 2009), the Dirichlet prior retrieval function (Zhai and Lafferty, 2001), and the PL2 function (Amati, and van Rijsbergen, 2002) and proposed some new extensions over these models, including query aspect modeling (QAM) and opinion expansion and they performed a set of experiments depicting the superiority of their approach. The QAM extension uses each query aspect to rank entities and then aggregates the ranked results from the multiple aspects of the query using an aggregation function such as the average score. The opinion expansion extension, expands a query with related opinion words found in an online thesaurus. The results of the experiments showed that while all three state-of-the-art retrieval models show improvement with the proposed extensions, the BM25 retrieval model is most consistent and works especially well with these extensions.
4 OPINION-BASED ASPECT RATINGS
Addressing the entity ranking problem as a matching preferences problem on specific features using an information retrieval model as presented in
(Ganesan and ChengXiang, 2012) favors texts, and correspondingly entities, with positive opinions on aspects, which is the goal. However this approach does not impose penalties for negative opinions. Then we seek to examine the performance of known techniques for sentiment analysis. These techniques take into account the positive and negative opinions on the entity rating process. Our goal is to compare their performance with the performance of the information retrieval approach.
Instead of using the significance of the features (aspects) of the query for a review text (ri) to create a ranking of the review texts, we attempt to use the sentiment information that exists in the opinions, expressed in the review texts, on specific features. In order to create a model which takes into account the sentiment information of the opinions that are expressed in the reviews by the reviewers, we use two simple unsupervised sentiment analysis techniques.
Given that each review text ri contains the users' opinions for a particular entity, we apply simple aspect-based sentiment analysis techniques to extract the sentiment information about the features from the sentences, and aspect-based summarization (or feature-based summarization) to calculate the score of the features throughout the text.
4.1 Lexicon-based Sentiment Analysis
Let A = {a1, a2, ..., am} be the set of the query aspects. We perform aspect level sentiment analysis. by extracting from the reviews ri the polarity, s(aj), which is expressed for each of the aspect query keywords.
The total score the review ri receives is the sum of the aspects sentiment scores, in this text, normalized by the number of aspects in the query. To calculate the sentiment score s(aj), we locate in the review text ri the sentences on which any of the query aspects (aj) appear and we assign to them a sentiment rating. The score s(aj) is the sum of the sentences scores on which there is the aspect aj. To calculate the sentiment score of a sentence, we apply a pos tagging process (Tsuruoka), in order to tag every term with a pos tag, and we process only the terms that have been assigned the following pos tags (see List of part-of-speech tags at references):
{ RB / RBR / RBS / VBG / JJ / JJR / JJS }
as elements that usually contain sentiment information. For each of those terms we find the word's sentiment score in a sentiment dictionary (Liu, Sentiment Lexicon), 1 if it is labeled as a
Improving�Opinion-based�Entity�Ranking
225

positive concept term, -1 if it is labeled as a negative concept term. Finally we sum the scores of all the terms. If the sum is positive the sentence's sentiment score is 1, while if the sum is negative the sentence's sentiment score is -1.
Also we take care of the negation and we use sentiments shifters. If in a sentence there is one of the following words: {not, don't, none, nobody, nowhere, neither, cannot}, we reverse the polarity of the sentence's final sentiment score.
4.1.1 Query Expansion
This automatic process reads every review text (ri), sentence by sentence, and processes only those that contain one or more of the query's aspect keywords. But users usually use different words or phrases to describe their opinions on a feature (aspect) of the entity. To manage this effect we perform query expansion on the original query, which we seek to enrich with synonyms of the aspects σ(aj), as they are from the semantic network WordNet (Fellbaum, 1998).
For example, suppose a query q which consists of the aspect keywords {a1, a2, a3}. For each keyword in q, we try to find synonymous terms σ(aj) using the semantic network WordNet and we import them to the query. The final query that emerges is q = ( a1 , σ1a1 , σ2a1 , a2 , σ1a2 , σ2a2 , σ3 a2 , a3 , σ1 a3 ). In this case the sentiment score of the aspect ai, sexp(ai), is the sentiment score of the term ai plus the sentiments scores of all imported terms σjai, s(σjai).
4.2 Syntactic Patterns based Sentiment Analysis
In this scheme we employ as base of our construction the algorithm that is presented in (Turney, 2002) in order to calculate the sentiment score of each sentence. This process performs analysis in a similar manner to the first. Like the first sentiment analysis technique, which is presented in section 4.1 above, so this technique reads every review text (ri), sentence by sentence, and processes only those that contain one or more of the query's aspect keywords. However here, instead of using the sentiment score of the words in the sentence, we use the sentiment orientation (SO) of syntactic patterns in the sentence, which are usually used to form an opinion.
Syntactic patterns are identified within a sentence based on pos tags of terms, which appear in
a specific order. The following are syntactic patterns that are used to extract two-word phrases:
1st Word 2nd Word 3rd Word(not extracted)
JJ NN/NNS anything RB/RBR/RBS JJ not(NN/NNS)
NN/NNS JJ not(NN/NNS)
RB/RBR/RBS VB/VBD/VBN/VBG anything
In order to calculate the sentiment orientation (SO) of the phrases, we use the point wise mutual information (PMI). The PMI metric measures the statistical dependence between two terms. The sentiment orientation of a phrase is calculated based on its relationship with a set of positive reference words and a set of negative reference words. We use the set '+' = {excellent, good} as positive reference words and the set '-' = {horrible, bad} as negative reference words, and we enrich these sets with synonyms from the semantic network WordNet. Thus the sentiment, orientation of a phrase is calculated as follows:
where the hits( ) for all the elements of a set are added. For example:
with σj being represented by the synonymous terms which is added into the set from the WordNet during the process.
5 SMOOTHING RANKING WITH OPINION-BASED CLUSTERS
In this scheme we strive to use clustering information around the reviews to improve the ranking of entities. We use the algorithm ClustFuse of Kurland (Kurland, 2006), which makes use of two components to provide a score to a document d, the probability's relevance of the text to the query and the assumption that clusters can be used as proxies for the texts, that rewards texts belonging "strongly" in a cluster which is very relevant to the query.
The ClustFuse algorithm uses cluster information to improve the ranking. In summary, the algorithm in order to create a document ranking to a query q, creates a set of similar queries to q, let it be Q = {q1, q2, ..., qk}, and for each one of them receives a text ranking Li. Then it tries to exploit clustering to all texts in the rankings Li. Finally it produces a final
sexp(ai)= s(ai )+ ∑j= 1,2,. .. , h
s (σjai)
SO( phrase)= log2hits( phrase NEAR'+ ' )hits('− ' )hits( phrase NEAR'− ' )hits(' + ' )
hits(' + ' )= hits(' excellent ')+ hits( ' good ' )+ ∑j= 1,2,... , h
hits(σj )
WEBIST�2014�-�International�Conference�on�Web�Information�Systems�and�Technologies
226
text ranking using the following equation:
( )( | ) (1 ) ( | ) ( | ) ( | )
c Cl CLp q d p d q p c q p d c
In our case as CL we set all review texts (ri). To create the set of queries Q = {q1, q2, ..., qk} for each query q, we use combinations of synonyms of the terms from the semantic network WordNet. We employ the Vector space model for representing review texts (ri), the cosine similarity as texts distance metric, the k-means algorithm for clustering, the FcombSUM (d, q) as fusion method (Kurland, 2006), and the BM25 metric for assessing ri to the questions and produce the ranked list Li. Also as ris' features we use the sentiment ratings of aspects as they are obtained by the process described above in Section 4. So each cluster will consist of review texts with similar ratings in aspects. A detailed presentation of Kurland's scheme and an interpretation of the equations is presented in (Kurland, 2006).
6 THE NAIVE CONSUMER MODEL
In the previous schemes we employed a set of aspects keywords (features) as queries and evaluated the review texts on the relativity with those. But we consider that all aspects are equally important to be used in the assessment of the entities. For example, in the domain of the car we may say that the aspect "fuel consumption" is more important than the aspect "leather seats". It may not. We believe that the answer can only be given by the community. So we retrieve the appropriate information from the web; let Dinf be the set of those texts.
With this model we attempt to simulate the behavior of a consumer who is trying to assess entities from a specific domain and he knows some aspects, but he does not know the importance that each aspect has as criteria in the assessment. Usually such a user consults the web, for relevant articles in Wikipedia, in blogs, in forums, as well in sites that contain reviews of other users, to understand the importance that each aspect has.
We are attempting to collect the knowledge of Dinf, on which of the features are more important. We create a set of queries Q = {q1, q2, ..., qk} containing the aspect query keywords. Each of the elements of Q is given as a query in a web search engine and the first ten results are being collected. Considering that search engines use a linear combination of measures such as BM25 and
PageRank (Page, Larry, 2002), (Baeza-Yates and Ribeiro-Neto, 2011), we can say that all the texts (pages) that we collect are relevant to the entities' domain which we examine, and that those texts are important nodes in the graph of the web, so important for the community.
Concerning the significance of a term t in a document d, as part of a text collection, we can say that is calculated from the BM25 score of the term t in d. Having the Dinf set of all texts, we are trying to extract how important is each aspect query keyword (ai) for the entity domain that we examine, by calculating a score of significance. For this computation we can apply many formulas, but we choose to use the following which contains the participation rate of the feature ai in the score of reviews:
(1)
This formula tends to be similar with the Rasch model. In the analysis of data with a Rasch model, the aim is to measure each examinee’s level of a latent trait (e.g., math ability, attitude toward capital punishment) that underlies his or her scores on items of a test. In our case the test is the assessment of the reviews, the examinees are the aspects, and the items of the test are the review texts.
Based on this idea we develop two models NCM1 and NCM2.
6.1 NCM1
Having the rate scoreA(t) for each aspect, expressing how important this feature is, when used to evaluate entities of a particular class, we can combine it with the term that expresses how important each aspect for a specific review text (ri) as part of a text collection (R), in order to assess reviews in queries consisting of aspect keywords, as follows:
t q( , ) * ( )( )
rip q ri score scoreA tt (2)
where p(q, ri) is the probability of relevance between the query and the review ri, score(t)ri is the BM25 score of the word / aspect t for the review text ri and scoreA(t) is derived from (1).
6.2 NCM2
NCM2 works as at NCM1 applying additionally the Kurland's schema (Kurland, 2006), to exploit any
scoreA(ai)=∑
d ∈Dinf
BM25 (ai)d
∑a ' ∈A
( ∑d ∈Dinf
BM25(a ' )d )
Improving�Opinion-based�Entity�Ranking
227

cluster organization, which may exist across the review texts. We employ equation (2) to assess the review texts to all queries Q = {q1, q2, ..., qk} and create the Li lists, where scoreA(t) is the importance score of aspects for their use in the evaluation process of entities, as it is calculated from the set of texts collected from the web. We use the algorithm ClustFuse as shown previously, in section 5.
7 EXPERIMENTS
We performed two sets of experiments to test the performance of our schemes, using two different datasets respectively. The datasets consist of sets of entities that are accompanied by users' reviews, which come from online sites. The queries consist of aspects keywords. For each one of the queries we produce the ideal entities' ranking based on the ratings given by the users in aspects together with the texts of the reviews. It is calculated as the average of the ratings given by each user for a certain characteristic as the Average Aspect Rating (AAR). For queries that are composed by several aspects, the average of the AAR aspects' scores of the question is calculated as the Multi-Aspect AAR (MAAR). More specifically, consider a query q={a1, a2, …, am}, with m aspects as keywords, and an entity e, then ri(e) is the AAR of the entity e for the i-th aspect. Consequently MAAR is calculated as follows:
In the first set of experiments we use the OpinRank Dataset, which was presented in (Ganesan and ChengXiang, 2012) and consists of entities, which are accompanied by reviews of users from two different domains (cars and hotels). The reviews come from the sites Edmunds.com and Tripadvisor.com respectively. We use the reviews from the domain of the cars which includes car models and the corresponding reviews, for the years 2007-2009 (588) and we perform 300 queries. The texts of the reviews have averaged about 3000 words.
In the second set of experiments we use a collection of review texts for restaurants from the website www.we8there.com. Each review is accompanied by a set of 5 ratings, each in the range 1 to 5, one for each of the following five features {food. ambience. service, value, experience}. These scores were given by consumers who had written the
reviews. In the second set of experiments we use 420 texts with reviews, averaging 115 words, as published on the link: http://people. csail.mit.edu/bsnyder/naacl07/data/ and we perform 31 queries. In this set of experiments, we also compare the performance of our schemas with a multiple aspect online ranking model which is presented in (Snyder and Barzilay, 2007), and is based on the algorithm Prank which is presented by Crammer and Singer in (Crammer and Singer, 2001). This supervised technique has shown that it delivers quite well in predicting the ratings on specific aspects of an entity using reviews of users for this. To create an m-aspect ranking model we use m independent Prank models, one for each aspect. Each of the m models, are trained to correctly predict one of the m aspects. Having represented the review texts ri as a feature vector x ∈ Rn, this model predicts a score value y ∈ {1, .., k} for each x ∈ Rn. The model is trained using the algorithm Prank (Perceptron Ranking algorithm), which reacts to incorrect predictions during training, updating the weight (w) and limits (b) vectors.
We evaluate the performance of the our schemas to produce the correct entity ranking, calculating the nDCG at the first 10 results.
7.1 Experimental Results
Initially we compare the performance of the BM25 model with and without the AvgScoreQAM and opinion expansion extensions, which are presented in (Ganesan and ChengXiang, 2012). We note that in both sets of experiments we conducted, using the BM25 model with the proposed extensions gives better results. This is one of the main observations in (Ganesan and ChengXiang, 2012), and here it is verified. In our measurements, however, we did not observe the expected increase in performance at the first set of experiments. It should be noted that in our experiments we did not use pseudo feedback mechanism, as in (Ganesan and ChengXiang, 2012).
The experimental results depict that the use of sentiment information present in reviews on the evaluation of the entities, can be used equally well as the conventional information retrieval techniques, such as the use of the BM25 metric. Both sentiment schemas perform sentiment analysis at sentence level, each in a different way. In the first set of experiments, our schemas show that they almost perform the same, while in the second set the technique using syntactic patterns evinces better than that using the sentiment lexicon. We believe that the better performance of the syntactic patterns-
MAAR(e , q)=1m
=∑i= 1
m
ri(e)
WEBIST�2014�-�International�Conference�on�Web�Information�Systems�and�Technologies
228

based sentiment analysis in the second dataset is probably due to the fact that in the second dataset the reviews are small (average 115 words) and users express immediately and clearly their opinions forming simple expressions. It should be noted that although we chose simple unsupervised sentiment analysis techniques which do not perform in-depth analysis, we hoped that they would exceed in performance the information retrieval approach. This is because they have the ability to recognize and negative opinions, knowledge that ignores a model like ΒΜ25std+AvgScoreQAM+opinExp. However we do not observe this. We still believe that with more sophisticated sentiment techniques that can be accomplished. We must not forget that sentiment analysis techniques have to deal with the diversity of human expression. People use many ways to express their opinions, and there are many types of opinions. On the other hand, the performance and the simplicity of the information retrieval approach makes it an attractive option.
More we observe the performance of our two clustering models, the BM25std+Kurland and the BM25std+Kurland+opinion-based clusters, with which we seek to exploit clustering information from the review texts to improve the ranking of entities. In the first set of experiments BM25std+Kurland performs well, while in the second has low performance. The low performance of BM25std+Kurland is probably due to the fact that the texts in the second dataset are small in length (average words per text 115 words). So its representation in the vector space characteristics are similar, which introduces noise in the clustering process using the k-means algorithm. Τhe BM25std+Kurland+opinion-based clusters scheme, performs well in both experiment sets. Also it is always better than that the standard BM25 formula and the BM25std+Kurland schema. Thus we can say that opinion based clustering can identify similar assessment behaviors to similar aspect queries among the entities and use this information to make a better entity ranking. This also shows that the opinion-based clustering is more suitable for an opinion-based entity ranking process than the content clustering.
Both of the naive consumer models show to perform better in the first set of experiments, while in the second set of experiments the schema that uses the Kurland technique and makes use of the cluster information, seems to overcome even the supervised classifier technique of the m-aspect prank model. So we see that it indeed plays an important role the knowledge of the importance of each
attribute used in the entities assessment, and also the knowledge of the aspects groups as they are defined by the users' community.
Table 1: We present the average of the nDCG@10 of the questions for all schemes on the two set of our experiments.
method 1st exp. set 2nd exp. set
BM25std 0.87 0.936
ΒΜ25std+AvgScoreQAM+opinExp
0.88 0.955
lexicon-based SA 0.865 0.91
syntactic patterns-based SA 0.869 0.94
BM25std+kurland 0.88 0.90
BM25std+Kurland+opinion-based clusters
0.89 0.956
NCM1 0.891 0.938
NCM2 0.893 0.96
m-aspect Prank - 0.95
8 CONCLUSIONS
In this paper we examined the problem of ranking entities. We developed schemes, which take into account sentiment and clustering information, and we also propose the naive consumer model. In order to supply more analytical hints we need more experiments for various application areas and this is a topic of future work however in this paper we aimed at providing a proof of concept of the validity of our approach. The information retrieval approach with the two extensions, the aspect modeling and the opinion expansion, presented in (Ganesan and ChengXiang, 2012), is a working and attractive option. The NCM model can be used to reveal more reliable entity rankings, thanks to the knowledge it extracts from the web. The opinion-based clustering schema can be also used to generate more accurate entity rankings. Regarding the sentiment analysis techniques, which are those that would probably give the complete solution on the entity ranking problem, for now, they are dependent on the level of analysis and on the characteristics of the opinionated text. The syntactic patterns based sentiment analysis technique in the second set of our experiments has better performance than the lexicon-based sentiment analysis. In the second dataset the reviews are small and users express immediately and clearly their opinions forming simple expressions, while in the first dataset the reviews are longer and opinion extraction becomes complex. Although there are
Improving�Opinion-based�Entity�Ranking
229

datasets that contain short texts, such as twitter datasets, in which opinion extraction can be quite difficult and require techniques that perform deeper sentiment analysis.
REFERENCES
Amati, G., and van Rijsbergen, C. J.,. Probabilistic models of information retrieval based on measuring the divergence from randomness. ACM Trans. Inf. Syst., 20(4):357{389, 2002.
Baeza-Yates, R., and Ribeiro-Neto, B. Modern Information Retrieval: the concepts and technology behind search. Addison Wesley, Essex, 2011.
Crammer K., Singer Y., Pranking with ranking. NIPS 2001, 641-647.
Fang H. and Zhai C., Probabilistic models for expert finding. ECIR 2007: 418-430.
Fellbaum, C., editor. WordNet, an electronic lexical database. The MIT Press.1998.
Gamon M., Sentiment classification on customer feedback data: noisy data, large feature vectors, and the role of linguistic analysis. COLING (2005), pp. 841-847 .
Ganesan, K., and ChengXiang Z., Opinion-Based Entity Ranking. Inf. Retr. 15(2): 116-150 (2012).
Hambleton, R. K., Swaminathan, H., and Rogers, H. J. Fundamentals of Item Response Theory. Newbury Park, CA: Sage Press (1991).
He, Q., Text Mining and IRT for Psychiatric and Psychological Assessment. Ph.D. thesis, University of Twente, Enschede, the Netherlands. (2013).
Kurland Oren, Inter-Document similarities, language models, and ad-hoc information retrieval. Ph.D. Thesis (2006).
Liu Bing, Opinion/Sentiment Lexicon http:// www.cs.uic.edu/~liub/FBS/sentiment-analysis.html.
Liu Bing, Sentiment Analysis and Opinion Mining. Morgan & Claypool Publishers, 2012 .
Nasukawa T. and Yi J., Sentiment analysis: capturing favorability using natural language processing. Proceedings K-CAP '03 Proceedings of the 2nd international conference on Knowledge capture, pp. 70-77 .
Page, Larry, PageRank: Bringing Order to the Web. Proceedings, Stanford Digital Library Project, talk. August 18, 1997 (archived 2002).
Pang B. and Lee L., A sentimental education: Sentiment analysis using subjectivity summarization based on minimum cuts. Proceedings, ACL'04 Proceedings of the 42nd Annual Meeting on Association for Computational Linguistics.
Pang B. and Lee L., Seeing stars: Exploiting class relationships for sentiment categorization with respect to rating scales. ACL 2005.
Prabowo R. and Thelwall M., Sentiment analysis: A combined approach. Journal of Informetrics, Volume 3, Issue 2, April 2009, Pages 143–157.
Rasch, G., Probabilistic Models for Some Intelligence and
Attainment Tests, (Copenhagen, Danish Institute for Educational Research), with foreward and after word by B. D. Wright. The University of Chicago Press, Chicago (1960/1980).
Robertson, S., Zaragoza, H., The Probabilistic Relevance Framework: BM25 and Beyond., Foundations and Trends in Information Retrieval 3(4): 333-389 (2009).
Snyder B. and Barzilay R., Multiple aspect ranking using the good grief algorithm. Human Language Technologies 2007: The Conference of the North American Chapter of the Association for Computational Linguistics; Proceedings of the Main Conference, pp. 300-307.
Tikves, S., Banerjee, S., Temkit, H., Gokalp, S., Davulcu, H., Sen, A., Corman, S., Woodward, M., Nair, S., Rohmaniyah, I., Amin,A., A system for ranking organizations using social scale analysis, Soc. Netw. Anal. Min., (2012).
Titov, Ivan and Ryan McDonald, A joint model of text and aspect ratings for sentiment summarization., In Proceedings of Annual Meeting of the Association for Computational Linguistics (AC L-2008)., (2008a).
Titov, Ivan and Ryan McDonald, Modeling online reviews with multi-grain topic models., In Proceedings.
of International Conference on World Wide Web (WWW-2008). 2008b. doi:10.1145/1367497.1367513.
Tsuruoka Yoshimasa, Lookahead POS Tagger, http://www.logos.t.u-tokyo.ac.jp/~tsuruoka/lapos/. Turney, P.D, Thumbs up or thumbs down? Semantic
Orientation Applied to Unsupervised Classification of Reviews. ACL, pages 417-424. (2002).
Turney P. D. and Littman M. L., Measuring praise and criticism: Inference of semantic orientation from association. In Proceedings of the 40th Annual Meeting on Association for Computational Linguistics (ACL 2002).
Wang H., Lu Y., and Zhai C., Latent aspect rating analysis on review text data: a rating regression approach. In Proceedings KDD '10 Proceedings of the 16th ACM SIGKDD international conference on Knowledge discovery and data mining, pp. 783-792 (2010).
Yu, Jianxing, Zheng-Jun Zha, Meng Wang, and Tat-Seng Chua, Aspect ranking: identifying important product aspects from online consumer reviews. In Proceedings of the 49th Annual Meeting of the Association for Computational Linguistics. (2001).
Zhai, C. and Lafferty, J., A study of smoothing methods for language models applied to ad hoc information retrieval. In Proceedings of SIGIR’01, pp. 334–342 (2001).
Rasch, The Rasch model, http://en.wikipedia.org/ wiki/Rasch_model.
ITL, Item Response Theory, http://en.wikipedia.org/ wiki/Item_response_theory.
List of part-of-speech tags, http://www.ling.upenn.edu/ courses/Fall_2003/ling001/penn_treebank_pos.html.
WEBIST�2014�-�International�Conference�on�Web�Information�Systems�and�Technologies
230
Handling Weighted Sequences Employing Inverted Files and Suffix Trees
Klev Diamanti1, Andreas Kanavos2, Christos Makris2 and Thodoris Tokis2
1Science for Life Laboratory, Department of Cell and Molecular Biology, Uppsala University, Sweden2Department of Computer Engineering and Informatics, University of Patras, Greece
[email protected], kanavos, makri, [email protected]
Keywords: Searching and Browsing, Web Information Filtering and Retrieval, Text Mining, Indexing Structures, In-verted Files, n-gram Indexing, Sequence Analysis and Assembly, Weighted Sequences, Weighted Suffix Trees.
Abstract: In this paper, we address the problem of handling weighted sequences. This is by taking advantage of theinverted files machinery and targeting text processing applications, where the involved documents cannotbe separated into words (such as texts representing biological sequences) or word separation is difficult andinvolves extra linguistic knowledge (texts in Asian languages). Besides providing a handling of weightedsequences using n-grams, we also provide a study of constructing space efficient n-gram inverted indexes.The proposed techniques combine classic straightforward n-gram indexing, with the recently proposed two-level n-gram inverted file technique. The final outcomes are new data structures for n-gram indexing, whichperform better in terms of space consumption than the existing ones. Our experimental results are encouragingand depict that these techniques can surely handle n-gram indexes more space efficiently than already existingmethods.
1 INTRODUCTION
In this paper we focus on handling weighted se-quences (Makris and Theodoridis, 2011). The diffe-rence between weighted sequences and regular stringsis that in the former, we permit in each position theappearance of more than one character, each with acertain probability (Makris and Theodoridis, 2011).Specifically, a weighted word w = w1w2 � � �wn is asequence of positions, where each position wi consistsof a set of couples; each couple has the form (s;pi(s)),where pi(s) is the probability of having the characters at position i. Also, for every position wi, 1 � i � n,åpi(s) = 1. Moreover, it is usually assumed that apossible subword is worth the effort to be examined ifthe probability of its existence is larger than 1=k; withk being a user defined parameter. In order to han-dle weighted sequences the Weighted Suffix Tree datastructure was implemented (Iliopoulos et al., 2006).We consider this specific data strusture as a propersuffix tree generalization.
The novelty in our approach is that for the firsttime, we exploit inverted files and n-grams in the han-dling of weighted sequences, thus providing an inter-esting alternative to weighted suffix trees for a varietyof applications that involve weighted sequences. Ourapproach is interesting since it offers interesting al-
ternatives to approaches using suffix arrays and suffixtrees with inverted files. This lacked in the bibliog-raphy in contrast to traditional pattern search appli-cations such as in search engines where both alter-natives were offered (see for example (Puglisi et al.,2006)). We do not delve into details of various pat-tern matching operations but merely focus on how tospace efficiently transform weighted sequences intonormal and then handle them using the well knowntechnique of n-grams. Our target is not only at bio-logical, but also at natural language applications. n-grams are sequences of consecutive text elements (ei-ther words or symbols); they are widely used in In-formation Retrieval (Ogawa and Iwasaki, 1995), (Leeand Ahn, 1996), (Navarro and Baeza-Yates, 1998),(Millar et al., 2000), (Navarro et al., 2000), (Navarroet al., 2001), (Gao et al., 2002), (Mayfield and Mc-Namee, 2003), (Kim et al., 2007), (Yang et al., 2007),especially in applications employing text that cannotbe separated into words.
The indexes produced with the n-gram inverted in-dex technique, have a number of advantages. One ofthem is that they work on any kind of sequences, evenif the sequence consists of words which have no prac-tical meaning, such as DNA and protein sequences.Moreover, the n-gram technique is language neutralsince it can be applied on different languages. Ano-
231

ther major benefit is that this indexing method is error-tolerant, putting up with errors that occur during theconstruction of the index; this is as it uses for its con-struction, the 1-sliding technique.
Nevertheless, the n-gram inverted index has alsosome drawbacks; the size tends to be very large andthe performance of queries tends to be inefficient.This is the reason why a wide amount of research onhow to use this technique space efficiently has beenperformed (Kim et al., 2005), (du Mouza et al., 2009),(Tang et al., 2009).
In (Kim et al., 2005), an efficient method for con-structing a two-level index is proposed. Specifically,this method reduces significantly the size of the in-dex and improves the query performance when com-paring to the straightforward n-gram inverted indextechnique; while preserving all the advantages of then-gram inverted index. This technique extracts sub-strings of fixed length m from the original sequenceand then applies the classic n-gram technique on eachof those extracted substrings. As shown in (Kim et al.,2005), this technique can provide significant spaceimprovements, but as it can be observed in our ex-perimental results, when the original sequence is notenough repetitive, the performance of this two-levelindexing technique deteriorates.
In detail, we propose three new techniques forhandling weighted sequences using n-grams index-ing. We additionally propose a new framework forspace compaction aiming to face the aforementionedspace shortcomings of (Kim et al., 2005). In ourspace efficient framework, instead of resorting to thetwo-level indexing scheme, we judiciously select a setof substrings of the initial sequences for the n-gramsof which, we employ the two-level indexing scheme;while for the rest of them, we employ the straightfor-ward one-level indexing scheme. The substrings areselected based on the frequency of their appearancein the whole document set. Also, the length of sub-strings covering the initial sequence as well as the twodistinct variants of the algorithmic scheme (variant forselecting these substrings employing a forest of suffixtrees and a variant for the generalized suffix tree) areimplemented and tested. It should be noted that thesegeneralized suffix trees are the weighted suffix treesderived from the initial set of weighted sequences.
What is more, experiments on both synthetic andreal data are performed in order to validate the perfor-mance of our constructions and the space reductionthat they offer. Our work can be considered both anexperimental research for the weighted sequences aswell as a survey for validating the space efficiency ofnewly and previously proposed constructions in thearea of n-gram indexing.
The rest of the paper is organized as follows. Insection 2, the related work as well as the contributionis presented. In section 3, we present the techniquesfor handling weighted sequences. Subsequently, insection 4, we describe our space compaction heuris-tics. In following, section 5 presents a referenceto our experimental results. Finally, section 6 con-cludes the paper and provides future steps and openproblems.
2 RELATED WORK ANDCONTRIBUTION
In (Christodoulakis et al., 2006), a set of efficient al-gorithms for string problems, involving weighted se-quences arising in the computational biology area,were presented adapting traditional pattern matchingtechniques to the weighted scenario. What is more, inorder to approximately match a pattern in a weightedsequence, a method was presented in (Amir et al.,2006) for the multiplicative model of probability esti-mation. In particular, two different definitions for theHamming as well as for the edit distance, in weightedsequences, were given. Furthermore, we should referto some more recent techniques (Zhang et al., 2010a),(Zhang et al., 2010b), (Alatabbi et al., 2012), that be-sides extending previous approaches, they also em-ploy the Equivalence Class Tree for the problem athand. From these papers, special mentioning deservesthe work in (Zhang et al., 2010a), which generalizesthe approach in (Iliopoulos et al., 2006), so as to han-dle effectively various approximate and exact patternmatching problems in weighted sequences.
In addition, there is a connection with the pro-babilistic suffix tree, which is basically a stochasticmodel that employs a suffix tree as its index struc-ture. This connection aims to represent compactlythe conditional distribution of probabilities for a setof sequences. Each node of the corresponding proba-bilistic suffix tree is associated with a probability vec-tor that stores the probability distribution for the nextsymbol, given the label of the node as the precedingsegment (Marsan and Sagot, 2000), (Sun et al., 2004).
In our work, we will mainly employ the pre-processing techniques presented in (Iliopoulos et al.,2006), where an efficient data structure for comput-ing string regularities in weighted sequences was pre-sented; this data structure is called Weighted SuffixTree. Our approach however can be also modified toincorporate the techniques presented in (Zhang et al.,2010a).
The main motivation for handling weighted se-quences comes from Computational Molecular Bio-
WEBIST�2014�-�International�Conference�on�Web�Information�Systems�and�Technologies
232
logy. However, there are possible applications inCryptanalysis and musical texts (see for a discussionbut in this time for the related area of IndeterminateStrings, which are strings having in positions, setsof symbols, (Holub and Smyth, 2003), (Holub et al.,2008)). In Cryptanalysis, undecoded symbols maybe modeled as set of letters with several probabili-ties, while in music, single notes may match chordsor notes with several probabilities. In addition, ourrepresentation of n-grams and our space compactionheuristics are of general nature concerning the ef-ficient handling of multilingual documents in websearch engines and general in information retrievalapplications.
Character n-grams are used especially in CJK(Chinese, Japanese and Korean) languages, which bynature cannot be easily separated into words. In theselanguages, 2-gram indexing seems to work well. Forexample in (Manning et al., 2008), it is mentionedthat in these languages, the characters are more likesyllables than letters and that most words are small innumbers of characters; also, the word boundaries aresmall and in these cases, it is better to use n-grams.Moreover, n-grams are helpful in Optical CharacterRecognition where the text is difficult to comprehendand it is not possible to introduce word breaks. Ad-ditionally, k-grams are useful in applications such aswildcard queries and spelling correction.
3 ALGORITHMS
We initially describe the n-gram based techniquesfor handling normal sequences, which are being pre-sented in (Kim et al., 2005). Then we explain howthese can be adapted so that we can handle weightedsequences. The algorithm proposed in (Kim et al.,2005) tries to improve the straightforward invertedfile scheme that produces n-grams on the fly using asliding window; afterwards the algorithm stores themin an inverted file by replacing it with a two-levelscheme, which is shown to be more space efficient.
In particular, this novel two-level scheme is basedon the following approach: (i) each of the initial se-quences is processed and a set of substrings of lengthm is extracted so as to overlap with each other byn � 1 symbols, (ii) an inverted index (called back-end index) for these substrings as well as the initialsequence set, considering the substrings as distinctwords, are built, (iii) all the n-grams in each of thesubstrings are extracted, (iv) an inverted index (calledfront-index) is built, regarding the substrings as docu-ments and the n-grams as words. This scheme, calledby its authors n-gram/2L, can be applied to any text
and in some cases, results to significant space reduc-tion.
If the text can be partitioned into words (naturallanguage text), another scheme termed n-gram/2L-v is provided. So, the subsequences are defined asconsecutive sequences of the text words, by exploi-ting the intuitive remark that words exhibit repetitive-ness in natural language text. Their experiments showthat when applied to natural text n-gram/2L-v, samplespace savings, compared to the initial technique, areproduced.
We attempt to adapt their techniques by present-ing three algorithms for handling weighted sequences,which are based in the exploitation of the techniquepresented in (Kim et al., 2005); then we can adjustthem to the problem at hand.
3.1 1st Technique - SubsequencesIdentification
In the first technique, we form separate sequences aswe split each weighted sequence into weighted sub-strings; each one of length m. Each one of theseweighted substrings is used to produce normal sub-strings by employing the normal substrings gene-ration phase of (Iliopoulos et al., 2006) (p.267, algo-rithm 2). In this phase, the generation of a substringstops when its cumulative possibility has reached the1=k threshold. The cumulative possibility is calcu-lated by multiplying the relative probabilities of ap-pearance of each character in every position. Eachproduced substring is of maximum size m and forevery substring, we produce all the possible n-grams.After this procedure, we store all the produced n-grams in the n-gram/2L-v scheme.
Concerning the generation phase, all the positionsin the weighted sequences are thoroughly scannedand at each branching position, a list of possible sub-strings, starting from this position, is created. Thenmoving from left to right, the current subwords areextended by adding the same single character when-ever a non-branching position is encountered; in con-trast there is also a creation of new subwords at bran-ching positions where potentially many choices aresupplied.
3.2 2nd Technique - On the fly n-gramsIdentification
This technique is much simpler as we don’t need todeploy all the generic sequences. Unlike the previoustechnique, we just need to produce all the possiblen-grams and in following for each report, its corre-sponding weighted sequences as well as their offsets.
Handling�Weighted�Sequences�Employing�Inverted�Files�and�Suffix�Trees
233

As a matter of fact, we don’t have to form separate se-quences, as in the previous approach, but instead onlysplit each generalized sequence into segments, eachof size m, and for each segment, just produce the re-quested n-grams.
Hence, this particular scheme is by nature one-level and we propose its use due its simplicity. Ho-wever, as it will be highlighted in the experiments,there are cases when the technique outperforms theprevious one in terms of space complexity.
4 SPACE EFFICIENT INVERTEDFILE IMPLEMENTATIONS FORNORMAL SEQUENCES
Our crucial remark is that, in order for the n-gram/2Ltechnique to provide space savings, the substrings,where the initial sequences are separated, should ap-pear a large number of times and should cover a broadextent of the initial sequences, otherwise in case thisdoes not apply (e.g. if there is a large number ofunique substrings), then the space occupancy turnsout to increase instead of shrinking.
Hence, it would be preferable to use a hybridscheme instead of a two-level one; there we shouldextract from the initial sequences, substrings that ap-pear repetitively enough and cover a large extent ofthe initial sequences. In following, for the specificsubstrings, we will employ a two-level scheme; whilefor the remaining parts of the sequences, we will usethe straightforward one-level representation. Duringthis separation, we elongate each selected substringby n-1, as in (Kim et al., 2005).
So, as to achieve our goal and build a hybrid oneand two-level inverted index, we introduce three tech-niques:
4.1 One Simple Technique
A variant of the algorithm described in (Kim et al.,2005), called Hybrid indexing Algorithm version 0 -hybrid(0), is implemented. In this implementation,we decided to store the substrings of length m and ofa number of occurrences in the back-end inverted fileof the two-level scheme; provided that this number isgreater than a trigger. The user is asked to provide thevalue of the trigger; the trigger is set equal to 1, forthe results presented in the corresponding section.
The substrings, occuring less or equal to the pro-vided trigger, are just decomposed in their n-gramsand then saved in a one-level index. The substringsstored in the two-level scheme, are also decomposed
in their n-grams, which we forward to the front-endindex of the two-level scheme.
4.2 Two Techniques based on SuffixTrees
In these techniques, we locate substrings that (in con-trast to hybrid(0)) can be of varying size, highly repe-titive and cover a large extent of the initial sequences.So as to locate them, we employ suffix trees (Mc-Creight, 1976) that have been previously used in si-milar problems (Gusfield, 1997) of locating frequentsubstrings. In particular, we provide two differentvariants in the implementation of our space efficientheuristic schema. Those two distinct versions share acommon initial phase, while differing in their subse-quent workings.
More analytically, we insert all the sequences ina generalized suffix tree as described in (Gusfield,1997) and in following we use this tree for countingthe repetitions of each substring of the stored docu-ments. Note that if the sequences have been producedby using mappings from weighted sequences, then theproduced suffix tree is similar to the weighted suffixtree of the initial sequences. This operation is per-formed during the building of the generalized suffixtree; after that, each node of the tree keeps the in-formation concerning the repetitions of the substringsstored in it.
Subsequently, in each repetition, our algorithmchooses a substring and a subset of each occurrence.These two objects are in following included in thetwo-level index. The selection procedure is describedas follows:
1. The substring needs to have a length equal orgreater than s; s is the least acceptable length ofa substring and constitutes a user defined parame-ter at the start of the algorithm’s execution.
2. The substring has to be highly repetitive. Thismeans that it should have more than a specificnumber of occurrences (trigger) in the set of in-dexed documents; this trigger is also a user de-fined parameter.
3. The appearances of the selected substring, whichare to be included in the two-level index, shouldnot overlap in more than half the length of thesubsequence; i.e. if the substring has a lengthof 10 characters, consecutive appearances of thissubstring should not overlap on more than 5 cha-racters. By setting this criterion, we keep only thediscrete appearances of the selected substring.
After the end of the procedure, we have selected acollection of substrings. We then sort this collection
WEBIST�2014�-�International�Conference�on�Web�Information�Systems�and�Technologies
234

Figure 1: Visualizing hybrid(1) and hybrid(2) techniques.
based on the total length of the original sequences thatthe distinct occurrences cover (according to criterion3). Furthermore, we select as best the occurrencesof specific subsequence that cover the majority of thelength of the initial sequences. We extract all thesesubstrings from the initial sequences, thus includingthem in the two-level index. As a result, we have splitthe initial sequences into a set of partitions that arenot included in the two-level index. Next, we elongatethem by n�1, so as not to miss any n-gram; where nis the n-gram length. Finally, we keep all these elon-gated substrings in a list. As a result, we have per-fomed the preprocessing step that allows us to followone out of two methods described below (see the pro-cedure in Fig. 1):
(i) Hybrid Indexing Algorithm version 1 - hy-brid(1). We construct for each elongated substring,a separate suffix tree and process best utilizing thesame method as above. Then, our algorithm continuesexecuting the process for each suffix tree constructedas cited above. This process is repeated as many timesas the user chooses at the beginning of the algorithmexecution.
(ii) Hybrid Indexing Algorithm version 2 - hy-brid(2). We include all elongated substrings men-tioned in a unified generalized suffix tree. In follo-wing, our algorithm executes the process for the ge-neralized suffix tree constructed. This process is re-peated as many times as requested. Generally, themore recursions we made, the better results we had;however, because of the limited system resources, weopted for 50 recursions in our experiments.
5 EXPERIMENTS
5.1 Experimental Setting
In our experiments, we used random weighted se-quences to test our n-gram mapping techniques aswell as one file (of size 1 GB) containing Protein dataand DNA data to test our space compaction heuris-tics. We also performed experiments with 10MB and100MB with similar results. Due to lack of space,only figures and comments from the 1GB data are pre-sented in the main body of the article. Our experimen-tal data were downloaded from the NCBI databases(ftp://ftp.ncbi.nih.gov/genomes/). Furthermore, weuse initials to designate both m (length of substrings)as well as the parameter s (size in bytes) in our spacecompaction heuristics.
The computer system, where the experimentswere performed, was an Intel Core i5-2410M 2.3GHz CPU with a 3GB (1x1GB and 1x2GB in 2xDualChannel) RAM. The techniques we implemented andapplied on the experimental data mentioned above,were:
1. Weighted Sequences Identification:(i) Subsequences Identification,(ii) On the fly n-grams Identification and(iii) Offline Identification.
2. Space compaction heuristics:(i) One-Level Inverted File (using the classicstraightforward technique),(ii) Two-Level Inverted File (using the techniquein (Kim et al., 2005)),(iii) Hybrid Inverted File using the Simple Tech-nique - hybrid(0),(iv) Hybrid Inverted File with separate suffix trees- hybrid(1) and(v) Hybrid Inverted File with a unified generalizedsuffix tree - hybrid(2).
For our space compaction heuristics, we run alltechniques proposed in this paper (hybrid(0), hy-brid(1) and hybrid(2)) in order to identify the mostspace efficient solution available. So as to depict thespace compaction effectiveness of our approach, wetried our approach on real data of significant size andperformed several experiments. As the experimentsshow, our approach outstandingly reduces the spacecomplexity and stands by itself as a considerable im-provement.
5.2 Weighted Sequences Results
As is depicted in Fig. 2, the offline approach is theworst in the attained space complexity, as expected.
Handling�Weighted�Sequences�Employing�Inverted�Files�and�Suffix�Trees
235
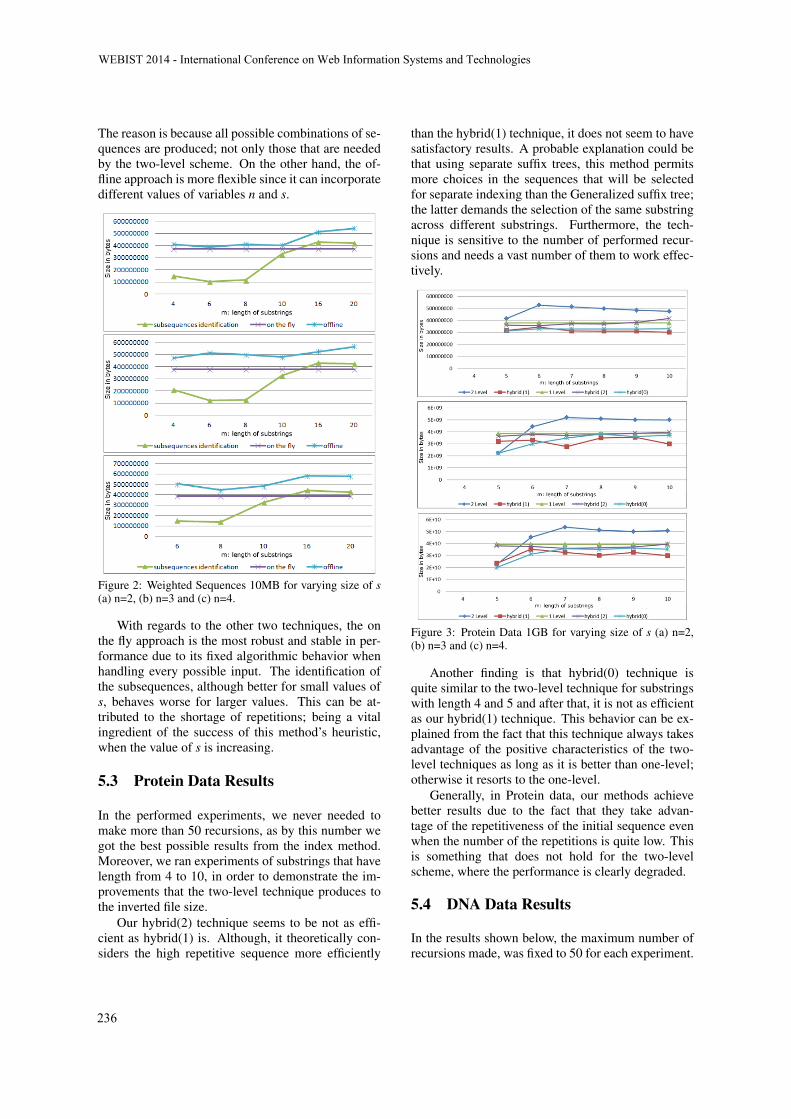
The reason is because all possible combinations of se-quences are produced; not only those that are neededby the two-level scheme. On the other hand, the of-fline approach is more flexible since it can incorporatedifferent values of variables n and s.
Figure 2: Weighted Sequences 10MB for varying size of s(a) n=2, (b) n=3 and (c) n=4.
With regards to the other two techniques, the onthe fly approach is the most robust and stable in per-formance due to its fixed algorithmic behavior whenhandling every possible input. The identification ofthe subsequences, although better for small values ofs, behaves worse for larger values. This can be at-tributed to the shortage of repetitions; being a vitalingredient of the success of this method’s heuristic,when the value of s is increasing.
5.3 Protein Data Results
In the performed experiments, we never needed tomake more than 50 recursions, as by this number wegot the best possible results from the index method.Moreover, we ran experiments of substrings that havelength from 4 to 10, in order to demonstrate the im-provements that the two-level technique produces tothe inverted file size.
Our hybrid(2) technique seems to be not as effi-cient as hybrid(1) is. Although, it theoretically con-siders the high repetitive sequence more efficiently
than the hybrid(1) technique, it does not seem to havesatisfactory results. A probable explanation could bethat using separate suffix trees, this method permitsmore choices in the sequences that will be selectedfor separate indexing than the Generalized suffix tree;the latter demands the selection of the same substringacross different substrings. Furthermore, the tech-nique is sensitive to the number of performed recur-sions and needs a vast number of them to work effec-tively.
Figure 3: Protein Data 1GB for varying size of s (a) n=2,(b) n=3 and (c) n=4.
Another finding is that hybrid(0) technique isquite similar to the two-level technique for substringswith length 4 and 5 and after that, it is not as efficientas our hybrid(1) technique. This behavior can be ex-plained from the fact that this technique always takesadvantage of the positive characteristics of the two-level techniques as long as it is better than one-level;otherwise it resorts to the one-level.
Generally, in Protein data, our methods achievebetter results due to the fact that they take advan-tage of the repetitiveness of the initial sequence evenwhen the number of the repetitions is quite low. Thisis something that does not hold for the two-levelscheme, where the performance is clearly degraded.
5.4 DNA Data Results
In the results shown below, the maximum number ofrecursions made, was fixed to 50 for each experiment.
WEBIST�2014�-�International�Conference�on�Web�Information�Systems�and�Technologies
236
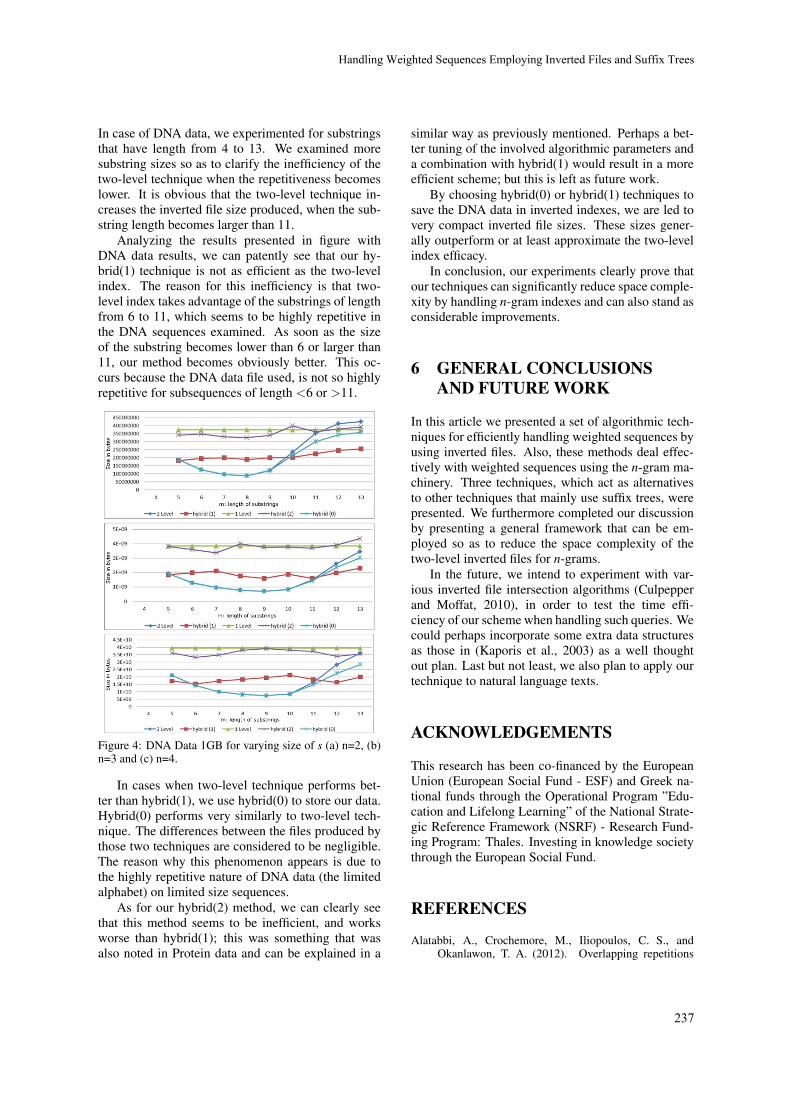
In case of DNA data, we experimented for substringsthat have length from 4 to 13. We examined moresubstring sizes so as to clarify the inefficiency of thetwo-level technique when the repetitiveness becomeslower. It is obvious that the two-level technique in-creases the inverted file size produced, when the sub-string length becomes larger than 11.
Analyzing the results presented in figure withDNA data results, we can patently see that our hy-brid(1) technique is not as efficient as the two-levelindex. The reason for this inefficiency is that two-level index takes advantage of the substrings of lengthfrom 6 to 11, which seems to be highly repetitive inthe DNA sequences examined. As soon as the sizeof the substring becomes lower than 6 or larger than11, our method becomes obviously better. This oc-curs because the DNA data file used, is not so highlyrepetitive for subsequences of length <6 or >11.
Figure 4: DNA Data 1GB for varying size of s (a) n=2, (b)n=3 and (c) n=4.
In cases when two-level technique performs bet-ter than hybrid(1), we use hybrid(0) to store our data.Hybrid(0) performs very similarly to two-level tech-nique. The differences between the files produced bythose two techniques are considered to be negligible.The reason why this phenomenon appears is due tothe highly repetitive nature of DNA data (the limitedalphabet) on limited size sequences.
As for our hybrid(2) method, we can clearly seethat this method seems to be inefficient, and worksworse than hybrid(1); this was something that wasalso noted in Protein data and can be explained in a
similar way as previously mentioned. Perhaps a bet-ter tuning of the involved algorithmic parameters anda combination with hybrid(1) would result in a moreefficient scheme; but this is left as future work.
By choosing hybrid(0) or hybrid(1) techniques tosave the DNA data in inverted indexes, we are led tovery compact inverted file sizes. These sizes gener-ally outperform or at least approximate the two-levelindex efficacy.
In conclusion, our experiments clearly prove thatour techniques can significantly reduce space comple-xity by handling n-gram indexes and can also stand asconsiderable improvements.
6 GENERAL CONCLUSIONSAND FUTURE WORK
In this article we presented a set of algorithmic tech-niques for efficiently handling weighted sequences byusing inverted files. Also, these methods deal effec-tively with weighted sequences using the n-gram ma-chinery. Three techniques, which act as alternativesto other techniques that mainly use suffix trees, werepresented. We furthermore completed our discussionby presenting a general framework that can be em-ployed so as to reduce the space complexity of thetwo-level inverted files for n-grams.
In the future, we intend to experiment with var-ious inverted file intersection algorithms (Culpepperand Moffat, 2010), in order to test the time effi-ciency of our scheme when handling such queries. Wecould perhaps incorporate some extra data structuresas those in (Kaporis et al., 2003) as a well thoughtout plan. Last but not least, we also plan to apply ourtechnique to natural language texts.
ACKNOWLEDGEMENTS
This research has been co-financed by the EuropeanUnion (European Social Fund - ESF) and Greek na-tional funds through the Operational Program ”Edu-cation and Lifelong Learning” of the National Strate-gic Reference Framework (NSRF) - Research Fund-ing Program: Thales. Investing in knowledge societythrough the European Social Fund.
REFERENCES
Alatabbi, A., Crochemore, M., Iliopoulos, C. S., andOkanlawon, T. A. (2012). Overlapping repetitions
Handling�Weighted�Sequences�Employing�Inverted�Files�and�Suffix�Trees
237

in weighted sequence. In International InformationTechnology Conference (CUBE), pp. 435-440.
Amir, A., Iliopoulos, C. S., Kapah, O., and Porat, E. (2006).Approximate matching in weighted sequences. InCombinatorial Pattern Matching (CPM), pp. 365376.
Christodoulakis, M., Iliopoulos, C. S., Mouchard, L.,Perdikuri, K., Tsakalidis, A. K., and Tsichlas, K.(2006). Computation of repetitions and regularities ofbiologically weighted sequences. In Journal of Com-putational Biology (JCB), Volume 13, pp. 1214-1231.
Culpepper, J. S. and Moffat, A. (2010). Efficient set inter-section for inverted indexing. In ACM Transactionson Information Systems (TOIS), Volume 29, Article 1.
du Mouza, C., Litwin, W., Rigaux, P., and Schwarz, T. J. E.(2009). As-index: a structure for string search usingn-grams and algebraic signatures. In ACM Conferenceon Information and Knowledge Management (CIKM),pp. 295-304.
Gao, J., Goodman, J., Li, M., and Lee, K.-F. (2002). Effi-cient set intersection for inverted indexing. In ACMTransactions on Asian Language Information Pro-cessing, Volume 1, Number 1, pp. 3-33.
Gusfield, D. (1997). Algorithms on Strings, Trees and Se-quences: Computer Science and Computational Bio-logy. Cambridge University Press.
Holub, J. and Smyth, W. F. (2003). Algorithms on indeter-minate strings. In Australasian Workshop on Combi-natorial Algorithms.
Holub, J., Smyth, W. F., and Wang, S. (2008). Fast pattern-matching on indeterminate strings. In Journal of Dis-crete Algorithms, Volume 6, pp. 37-50.
Iliopoulos, C. S., Makris, C., Panagis, Y., Perdikuri, K.,Theodoridis, E., and Tsakalidis, A. K. (2006). Theweighted suffix tree: An efficient data structure forhandling molecular weighted sequences and its appli-cations. In Fundamenta Informaticae (FUIN), Volume71, pp. 259-277.
Kaporis, A. C., Makris, C., Sioutas, S., Tsakalidis, A. K.,Tsichlas, K., and Zaroliagis, C. D. (2003). Improvedbounds for finger search on a ram. In ESA, Volume2832, pp. 325-336.
Kim, M.-S., Whang, K.-Y., and Lee, J.-G. (2007). n-gram/2l-approximation: a two-level n-gram invertedindex structure for approximate string matching. InComputer Systems: Science and Engineering, Volume22, Number 6.
Kim, M.-S., Whang, K.-Y., Lee, J.-G., and Lee, M.-J.(2005). n-gram/2l: A space and time efficient two-level n-gram inverted index structure. In Interna-tional Conference on Very Large Databases (VLDB),pp. 325-336.
Lee, J. H. and Ahn, J. S. (1996). Using n-grams for koreantext retrieval. In ACM SIGIR, pp. 216-224.
Makris, C. and Theodoridis, E. (2011). Algorithms inComputational Molecular Biology: Techniques, Ap-proaches and Applications. Wiley Series in Bioinfor-matics.
Manning, C. D., Raghavan, P., and Schutze, H. (2008). In-troduction to Information Retrieval. Cambridge Uni-versity Press.
Marsan, L. and Sagot, M.-F. (2000). Extracting structuredmotifs using a suffix tree - algorithms and applicationto promoter consensus identification. In InternationalConference on Research in Computational MolecularBiology (RECOMB), pp. 210-219.
Mayfield, J. and McNamee, P. (2003). Single n-gram stem-ming. In ACM SIGIR, pp. 415-416.
McCreight, E. M. (1976). A space-economical suffixtree construction algorithm. In Journal of the ACM(JACM), Volume 23, pp. 262-272.
Millar, E., Shen, D., Liu, J., and Nicholas, C. K. (2000).Performance and scalability of a large-scale n-grambased information retrieval system. In Journal of Dig-ital Information, Volume 1, Number 5.
Navarro, G. and Baeza-Yates, R. A. (1998). A practical q-gram index for text retrieval allowing errors. In CLEIElectronic Journal, Volume 1, Number 2.
Navarro, G., Baeza-Yates, R. A., Sutinen, E., and Tarhio,J. (2001). Indexing methods for approximate stringmatching. In IEEE Data Engineering Bulletin, Volume24, Number 4, pp. 19-27.
Navarro, G., Sutinen, E., Tanninen, J., and Tarhio, J. (2000).Indexing text with approximate q-grams. In Combina-torial Pattern Matching (CPM), pp. 350-363.
Ogawa, Y. and Iwasaki, M. (1995). A new character-based indexing organization using frequency data forjapanese documents. In ACM SIGIR, pp. 121-129.
Puglisi, S. J., Smyth, W. F., and Turpin, A. (2006). Invertedfiles versus suffix arrays for locating patterns in pri-mary memory. In String Processing and InformationRetrieval (SPIRE), pp. 122-133.
Sun, Z., Yang, J., and Deogun, J. S. (2004). Misae: A newapproach for regulatory motif extraction. In Computa-tional Systems Bioinformatics Conference (CSB), pp.173-181.
Tang, N., Sidirourgos, L., and Boncz, P. A. (2009). Space-economical partial gram indices for exact substringmatching. In ACM Conference on Information andKnowledge Management (CIKM), pp. 285-294.
Yang, S., Zhu, H., Apostoli, A., and Cao, P. (2007). N-gram statistics in english and chinese: Similarities anddifferences. In International Conference on SemanticComputing (ICSC), pp. 454-460.
Zhang, H., Guo, Q., and Iliopoulos, C. S. (2010a). An al-gorithmic framework for motif discovery problems inweighted sequences. In International Conference onAlgorithms and Complexity (CIAC), pp. 335-346.
Zhang, H., Guo, Q., and Iliopoulos, C. S. (2010b). Varietiesof regularities in weighted sequences. In AlgorithmicAspects in Information and Management (AAIM), pp.271-280.
WEBIST�2014�-�International�Conference�on�Web�Information�Systems�and�Technologies
238

XML Approximate Semantic Query based on Ontology
Yunkai Zhu, Chunhong Zhang and Yang Ji Mobile Life and New Media Laboratotry, Beijing University of Post and Telecommucations (BUPT), Beijing, China
[email protected], {zhangch.bupt.001, ji.yang.0001}@gmail.com
Keywords: Query Relaxation, Domain Ontology, NLP, RDF Triple, WordNet, SPARQL.
Abstract: More and more data is generated in XML format. How to effectively retrieve information from these data has attracted much research interest. Users have been used to keyword query without knowledge of data in advance. But XML data has additional structure than keywords. Almost all previous XML keyword queries require that user should be fully familiar with the XML structures and query syntax, which is not user-friendly and is seriously impediment to the prevalence of XML. In this paper, we propose to use natural sentence as query input because it can contain both keywords and their structure information. Query processing engine depends on NLP (Natural Language Process) technology and predefined templates to catch the query goal of user, optimally expressed as RDF (Resource Description Framework) triples. We exploit hierarchical structure relaxation based on query tree variation and vocabulary relaxation based on WordNet to relax input query. To better reflect the semantics of the query, we also use a certain domain OWL ontology constructed from XML schemas for reasoning and searching. Ontology gives us a reliable group of concepts and relations between the concepts. Ontology accurately transfers semantic information between human users and the computers. Finally we translate the RDF triples to SPARQL query sentences to retrieve RDF data.
1 INTRODUCTION
As XML data are generated more and more commonly in the Web and scientific applications, how to effectively retrieve information from these data has attracted much research interest (Guerrini, 2013). Keyword search has achieved great success on the web due to its merit of user-friendliness. As XML documents are more complex in structure, effective keyword search on XML documents requires deep understanding and special treatment of the structures in XML documents. Recently, a number of methods for XML keyword search have been proposed (Li, 2004; Cohen, 2003; Li, 2007), these methods pay considerable attention to the structural features of XML documents, and have shown their effectiveness. However, we find that almost all these methods ignore an important aspect of XML input query, which is the structure of the queries themselves. These methods require that user should be fully familiar with the XML structures and query syntax such as Xpath (http://www.w3.org/TR/xpath/) and XQuery (http://www.w3.org/TR/xquery/), which are W3C standards. (Liu, 2013) proposes keyword query with structure (QWS), but its recommended query unit
such as q journaldatabase can only accommodate a layer of
relationship and is also not user-friendly. We need an XML search engine that has user-friendliness and accuracy.
XML data on the Web is characterized by data heterogeneity. Heterogeneity in XML data reflects the different value representation formats or structures. Heterogeneity may appear in the vocabulary and hierarchical structure: different tags may be employed in different collections to label the same information; the hierarchical structure of same documents in different sources may be slightly different. In order to cope with the heterogeneity of XML, we need to relax query. Query relaxation contains two aspects, vocabulary and hierarchical structure. As to vocabulary relaxation, specialists usually build XML tags and schemas, and users don’t always share or understand their viewpoints. Users might not use the right keyword, leading to miss answers when writing a query. For example, a user might use mailbox instead of email. Users might also use an instance of some concept instead of concept itself. For example, a user may use location instead of space. As far as hierarchical structure relaxation, the query structure may not
239
correspond to the xml data structure, such as excess or lack of an intermediate node, or attribute nodes dislocation. So the hierarchical structure relaxation is indispensible in query processing. Consequently, approximate query processing is of importance for XML search.
Although conventional keyword search neglects the relationship between keywords, we can use a sentence instead of only keywords, in which we can accommodate both keywords and their relations. Querix and its query language allowing full English questions with a limited set of sentence beginnings is judged to be the most useful and best-liked query interface (Kaufmann, 2010). For higher accuracy and practicability of our system, we do some improvements in the sentence beginnings above Querix and form some rules of RDF triples abstractions. We use WordNet and domain ontology to verify and extend query in aspects of both vocabulary and hierarchical structure. At the same time, we note the credits of new extensive RDF triples, and show the result retrieved with extensive query descending by the credits.
As (Decker, 2000) points out, XML and RDF are the current standards for establishing semantic interoperability on the Web, but XML addresses only document structure. RDF better facilitates interoperation because it provides a data model that can be extended to address sophisticated ontology representation techniques. XTR-RTO (Xu, 2007) provides an approach to build OWL ontology using XML document. The construction approach firstly maps source of XML schema into RDF and then into OWL ontology.
Through a series of query processing like statements component analysis, query classification, and RDF triple abstraction, we finally transfer user query input to SPARQL (http://www.w3.org/TR/rdf-sparql-query) query language to retrieve RDF data.
To achieve query relaxation and take the advantages of keyword query and twig query, we propose our query system. Through natural language into RDF triples and triples expansion, we can connect user’s demand with XML data. RDF triples can cover almost all the information of a query input. Triples expansion can adapt the user’s query demand to XML data. Our contributions can be summarized as follows: 1) we propose connection general ontology WordNet with certain domain ontology to support semantic search. 2) We propose a user-friendly XML search interface in which user needn’t know the structure of XML in advance. The user only needs to express his/her query requirements in the search box. 3) We introduce a
novel semantic ranking scheme to compute the relationship of expansive RDF triples with original ones. 4) We build a real system to support our semantic XML search architecture, in which we needn’t worry about the difference of expression.
The rest of this paper is organized as follows: In Section 2, we review the related word. The architecture of our query system and several components are presented in Section 3. In Section 4, we present semantic similarity computation, followed by Section 5 where we do experiment on IOT (Internet of things) data. We conclude this paper in Section 6, where we provide a discussion on the overall agenda of ontology-based XML query relaxation and give the future ideas.
2 RELATED WORK
2.1 Keyword Query on XML
Various approaches have been proposed to identify relevant keyword matches. We divide these papers into three categories: LCA (lowest common ancestor) based approaches, which connect keyword matches and identify relevant matches using variants of LCA; statistics-based approaches, which identify relevant matches according to the statistics of the data; minimal tree/graph based approaches, which consider keyword matches in subtree/subgraph of the data that satisfy certain conditions as relevant.
A number of LCA based approaches have been proposed, including XSEarch (Cohen, 2003), MLCA (Li, 2004), SLCA (Xu, 2003), and MaxMatch (Liu, 2008), etc. But these structures do not consider the semantic meanings of keywords. Among all the methods, only XSEarch provides a ranking scheme. On the ranking scheme, (Golenberg , 2008) proposes to rank query results according to the distance between different keyword matches in a document. XSEarch combines a simple TF/IDF IR ranking with tree size to rank results. However, its keyword input format requires users to have some knowledge of underlying schema information. This drawback limits its population. As a method based on statistics, XReal (Bao, 2010) exploits the statistics of underlying XML data to identify relevant matches and ranking. As the LCA concept does not apply for graph shaped XML documents (such as XML with ID/IDREF and RDF documents), the approaches that search XML graphs define a query result as a minimal subtree/subgraph of the XML graph that contains all or part of the query keywords. A minimal tree/graph is a subtree/subgraph of the data
WEBIST�2014�-�International�Conference�on�Web�Information�Systems�and�Technologies
240
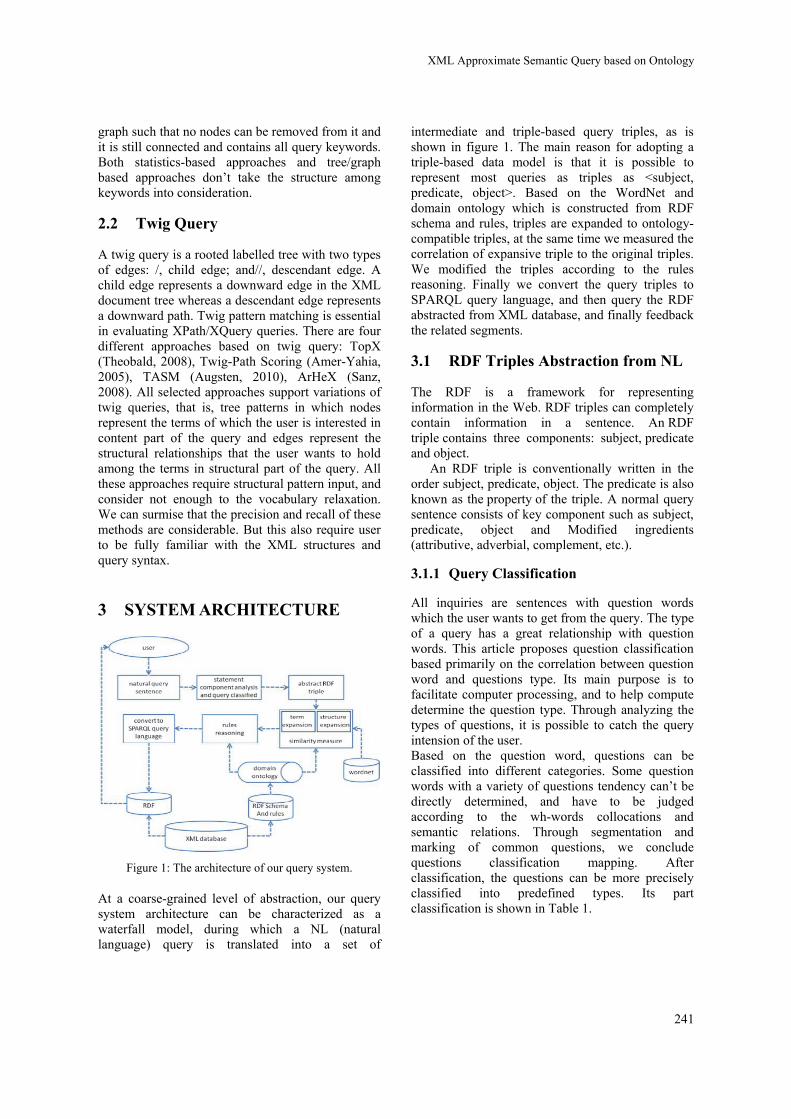
graph such that no nodes can be removed from it and it is still connected and contains all query keywords. Both statistics-based approaches and tree/graph based approaches don’t take the structure among keywords into consideration.
2.2 Twig Query
A twig query is a rooted labelled tree with two types of edges: /, child edge; and//, descendant edge. A child edge represents a downward edge in the XML document tree whereas a descendant edge represents a downward path. Twig pattern matching is essential in evaluating XPath/XQuery queries. There are four different approaches based on twig query: TopX (Theobald, 2008), Twig-Path Scoring (Amer-Yahia, 2005), TASM (Augsten, 2010), ArHeX (Sanz, 2008). All selected approaches support variations of twig queries, that is, tree patterns in which nodes represent the terms of which the user is interested in content part of the query and edges represent the structural relationships that the user wants to hold among the terms in structural part of the query. All these approaches require structural pattern input, and consider not enough to the vocabulary relaxation. We can surmise that the precision and recall of these methods are considerable. But this also require user to be fully familiar with the XML structures and query syntax.
3 SYSTEM ARCHITECTURE
Figure 1: The architecture of our query system.
At a coarse-grained level of abstraction, our query system architecture can be characterized as a waterfall model, during which a NL (natural language) query is translated into a set of
intermediate and triple-based query triples, as is shown in figure 1. The main reason for adopting a triple-based data model is that it is possible to represent most queries as triples as <subject, predicate, object>. Based on the WordNet and domain ontology which is constructed from RDF schema and rules, triples are expanded to ontology-compatible triples, at the same time we measured the correlation of expansive triple to the original triples. We modified the triples according to the rules reasoning. Finally we convert the query triples to SPARQL query language, and then query the RDF abstracted from XML database, and finally feedback the related segments.
3.1 RDF Triples Abstraction from NL
The RDF is a framework for representing information in the Web. RDF triples can completely contain information in a sentence. An RDF triple contains three components: subject, predicate and object.
An RDF triple is conventionally written in the order subject, predicate, object. The predicate is also known as the property of the triple. A normal query sentence consists of key component such as subject, predicate, object and Modified ingredients (attributive, adverbial, complement, etc.).
3.1.1 Query Classification
All inquiries are sentences with question words which the user wants to get from the query. The type of a query has a great relationship with question words. This article proposes question classification based primarily on the correlation between question word and questions type. Its main purpose is to facilitate computer processing, and to help compute determine the question type. Through analyzing the types of questions, it is possible to catch the query intension of the user. Based on the question word, questions can be classified into different categories. Some question words with a variety of questions tendency can’t be directly determined, and have to be judged according to the wh-words collocations and semantic relations. Through segmentation and marking of common questions, we conclude questions classification mapping. After classification, the questions can be more precisely classified into predefined types. Its part classification is shown in Table 1.
XML�Approximate�Semantic�Query�based�on�Ontology
241
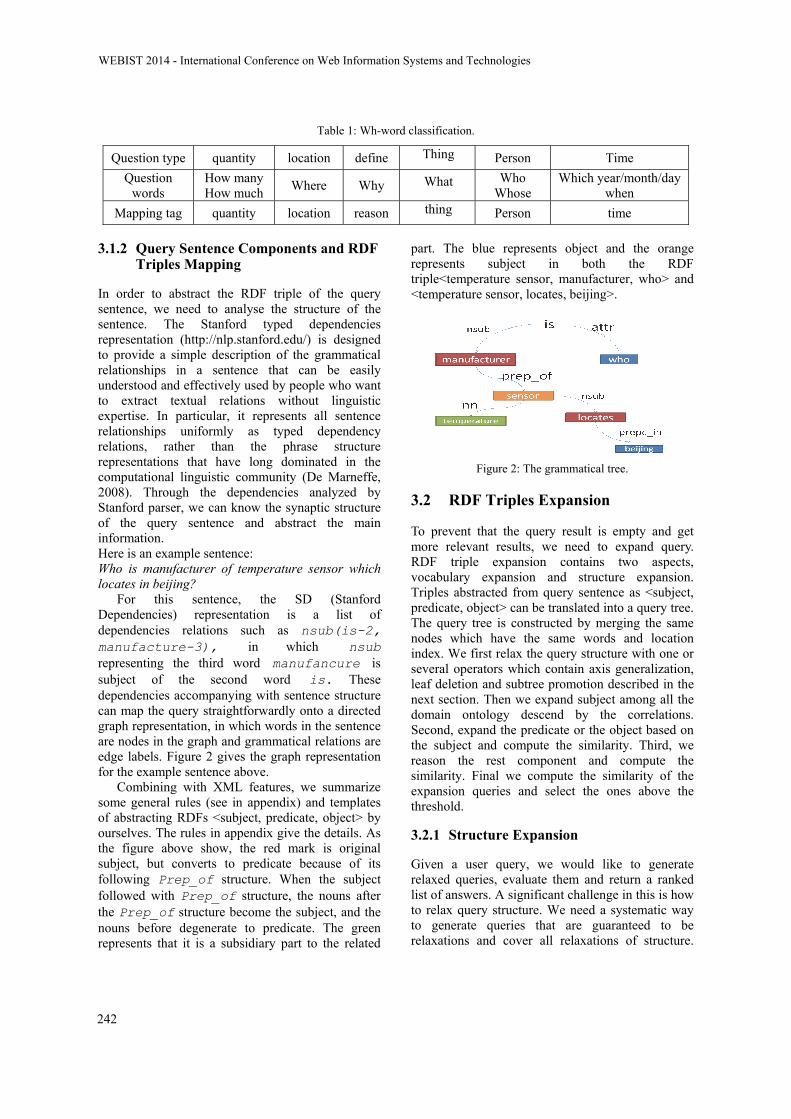
Table 1: Wh-word classification.
Question type quantity location define Thing Person Time
Question words
How many How much
Where Why What Who Whose
Which year/month/day when
Mapping tag quantity location reason thing Person time
3.1.2 Query Sentence Components and RDF
Triples Mapping
In order to abstract the RDF triple of the query sentence, we need to analyse the structure of the sentence. The Stanford typed dependencies representation (http://nlp.stanford.edu/) is designed to provide a simple description of the grammatical relationships in a sentence that can be easily understood and effectively used by people who want to extract textual relations without linguistic expertise. In particular, it represents all sentence relationships uniformly as typed dependency relations, rather than the phrase structure representations that have long dominated in the computational linguistic community (De Marneffe, 2008). Through the dependencies analyzed by Stanford parser, we can know the synaptic structure of the query sentence and abstract the main information. Here is an example sentence: Who is manufacturer of temperature sensor which locates in beijing?
For this sentence, the SD (Stanford Dependencies) representation is a list of dependencies relations such as nsub(is-2, manufacture-3), in which nsub representing the third word manufancure is subject of the second word is. These dependencies accompanying with sentence structure can map the query straightforwardly onto a directed graph representation, in which words in the sentence are nodes in the graph and grammatical relations are edge labels. Figure 2 gives the graph representation for the example sentence above.
Combining with XML features, we summarize some general rules (see in appendix) and templates of abstracting RDFs <subject, predicate, object> by ourselves. The rules in appendix give the details. As the figure above show, the red mark is original subject, but converts to predicate because of its following Prep_of structure. When the subject followed with Prep_of structure, the nouns after the Prep_of structure become the subject, and the nouns before degenerate to predicate. The green represents that it is a subsidiary part to the related
part. The blue represents object and the orange represents subject in both the RDF triple<temperature sensor, manufacturer, who> and <temperature sensor, locates, beijing>.
Figure 2: The grammatical tree.
3.2 RDF Triples Expansion
To prevent that the query result is empty and get more relevant results, we need to expand query. RDF triple expansion contains two aspects, vocabulary expansion and structure expansion. Triples abstracted from query sentence as <subject, predicate, object> can be translated into a query tree. The query tree is constructed by merging the same nodes which have the same words and location index. We first relax the query structure with one or several operators which contain axis generalization, leaf deletion and subtree promotion described in the next section. Then we expand subject among all the domain ontology descend by the correlations. Second, expand the predicate or the object based on the subject and compute the similarity. Third, we reason the rest component and compute the similarity. Final we compute the similarity of the expansion queries and select the ones above the threshold.
3.2.1 Structure Expansion
Given a user query, we would like to generate relaxed queries, evaluate them and return a ranked list of answers. A significant challenge in this is how to relax query structure. We need a systematic way to generate queries that are guaranteed to be relaxations and cover all relaxations of structure.
WEBIST�2014�-�International�Conference�on�Web�Information�Systems�and�Technologies
242
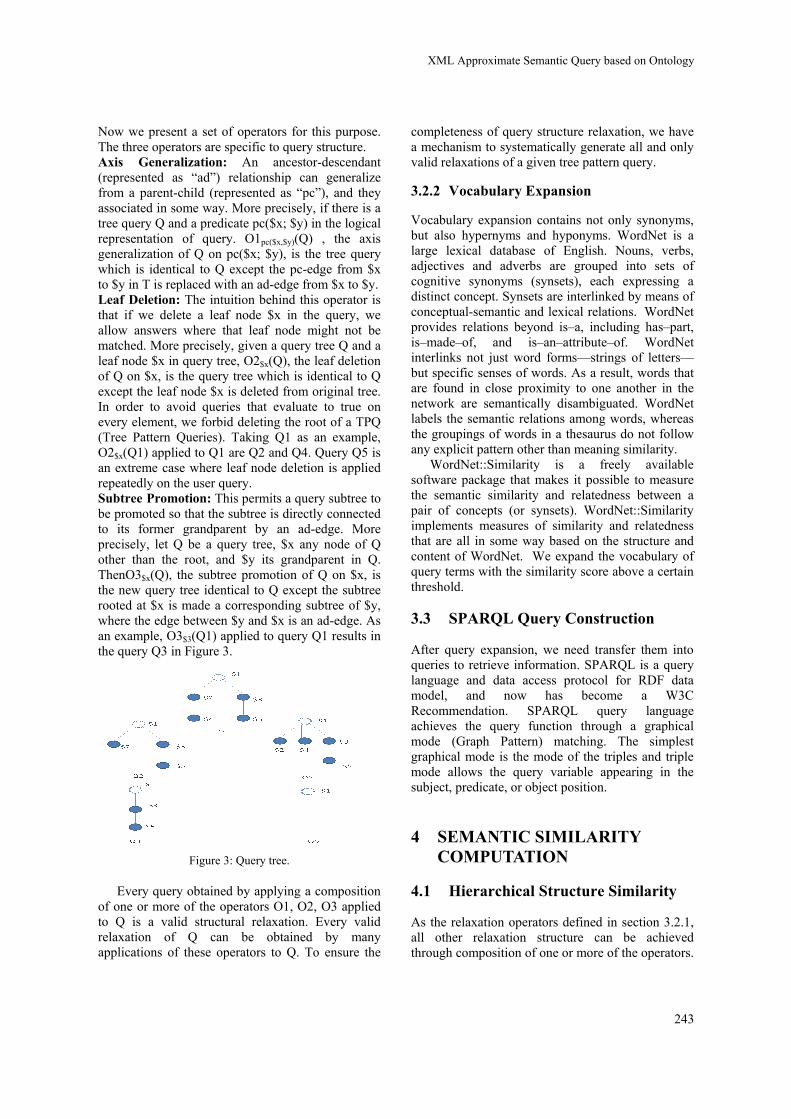
Now we present a set of operators for this purpose. The three operators are specific to query structure. Axis Generalization: An ancestor-descendant (represented as “ad”) relationship can generalize from a parent-child (represented as “pc”), and they associated in some way. More precisely, if there is a tree query Q and a predicate pc($x; $y) in the logical representation of query. O1pc($x,$y)(Q) , the axis generalization of Q on pc($x; $y), is the tree query which is identical to Q except the pc-edge from $x to $y in T is replaced with an ad-edge from $x to $y. Leaf Deletion: The intuition behind this operator is that if we delete a leaf node $x in the query, we allow answers where that leaf node might not be matched. More precisely, given a query tree Q and a leaf node $x in query tree, O2$x(Q), the leaf deletion of Q on $x, is the query tree which is identical to Q except the leaf node $x is deleted from original tree. In order to avoid queries that evaluate to true on every element, we forbid deleting the root of a TPQ (Tree Pattern Queries). Taking Q1 as an example, O2$x(Q1) applied to Q1 are Q2 and Q4. Query Q5 is an extreme case where leaf node deletion is applied repeatedly on the user query. Subtree Promotion: This permits a query subtree to be promoted so that the subtree is directly connected to its former grandparent by an ad-edge. More precisely, let Q be a query tree, $x any node of Q other than the root, and $y its grandparent in Q. ThenO3$x(Q), the subtree promotion of Q on $x, is the new query tree identical to Q except the subtree rooted at $x is made a corresponding subtree of $y, where the edge between $y and $x is an ad-edge. As an example, O3$3(Q1) applied to query Q1 results in the query Q3 in Figure 3.
Figure 3: Query tree.
Every query obtained by applying a composition of one or more of the operators O1, O2, O3 applied to Q is a valid structural relaxation. Every valid relaxation of Q can be obtained by many applications of these operators to Q. To ensure the
completeness of query structure relaxation, we have a mechanism to systematically generate all and only valid relaxations of a given tree pattern query.
3.2.2 Vocabulary Expansion
Vocabulary expansion contains not only synonyms, but also hypernyms and hyponyms. WordNet is a large lexical database of English. Nouns, verbs, adjectives and adverbs are grouped into sets of cognitive synonyms (synsets), each expressing a distinct concept. Synsets are interlinked by means of conceptual-semantic and lexical relations. WordNet provides relations beyond is–a, including has–part, is–made–of, and is–an–attribute–of. WordNet interlinks not just word forms—strings of letters—but specific senses of words. As a result, words that are found in close proximity to one another in the network are semantically disambiguated. WordNet labels the semantic relations among words, whereas the groupings of words in a thesaurus do not follow any explicit pattern other than meaning similarity.
WordNet::Similarity is a freely available software package that makes it possible to measure the semantic similarity and relatedness between a pair of concepts (or synsets). WordNet::Similarity implements measures of similarity and relatedness that are all in some way based on the structure and content of WordNet. We expand the vocabulary of query terms with the similarity score above a certain threshold.
3.3 SPARQL Query Construction
After query expansion, we need transfer them into queries to retrieve information. SPARQL is a query language and data access protocol for RDF data model, and now has become a W3C Recommendation. SPARQL query language achieves the query function through a graphical mode (Graph Pattern) matching. The simplest graphical mode is the mode of the triples and triple mode allows the query variable appearing in the subject, predicate, or object position.
4 SEMANTIC SIMILARITY COMPUTATION
4.1 Hierarchical Structure Similarity
As the relaxation operators defined in section 3.2.1, all other relaxation structure can be achieved through composition of one or more of the operators.
XML�Approximate�Semantic�Query�based�on�Ontology
243
Each operation results in similarity reduction between the changed and the original RDF triples in structure aspect. We assume that each operator of O1, O2, and O3 results in reduction of the same similarity. We exploit a mechanism to systematically generate all and but valid relaxations of a given tree pattern query. We list all the structure relaxations and the number of the operations. Then we use following formula to normalize the relaxation queries similarity to [0, 1].
ii
i
(q ) 1max(n ) 1
nHSsimi
(1)
in represents the number of operations through
which expansive query i vary from original query.
4.2 Vocabulary Similarity
WordNet::Similarity provides six measures of similarity, and three measures of relatedness, all of which are based on the lexical database WordNet (http://wordnet.princeton.edu). These measures take two concepts as input, and return a numeric value that represents the degree that they are similar or related to each other.
Five different proposed measures of similarity or semantic distance in WordNet are experimentally compared by examining their performance in a real-world spelling correction system. It was found that Jiang and Conrath’smeasure (Jiang, 1997) gave the best results overall (Budanitsky, 2001).So we choose JCN as semantic similarity measures.
As an element in <subject, predicate, object> is not necessary word, it is more likely to be a phrase. The name similarity between the two sets of name phrase T1 and T2 can be determined as the average best similarity of each token with all tokens in the other set. So we use formula (2) to compute the phrase similarity as follows:
1 1 2 21 1 2 2max (t1, t 2) max (t 2, t1)
Psim(T1,T2)|T1|+|T2|
t T t Tt T t Tsim sim
(2)
t1 represent the word in T1, t2 represent word in T2. Psim(t1,t2) measure the relatedness of t1 and t2
using JCN. To compute the credit of expensive RDF triples, we adapt the formula below. Because of the probability of predicate or object absence, we adapt both multiply and add in the formula (3). CreditS, CreditP and CreditO are respectively the similarities between the expansive subject, predicate, object and the input ones. CreditTriples is the similarity between expensive RDF triples and input RDF triple.
iCredit s(q ) CreditS*CreditP*CreditOCreditS CreditP CreditO
Triple
(3)
α,β,γ,θrepresent the weight of each component. And α+β+γ+θ=1.
We finally combine the structure similarity with vocabulary similarity to credit the final relaxation query scores.
5 EVALUATION
In this section, we will introduce our system with an example scenario, and then we compare our system with classical text retrieval system. Our query system has an appropriate usage scenario—IOT. The Schema of IOT XML is of severe heterogeneity. To build the IOT ontology, we collect xml documents from six websites of IOT platforms, which contain Pachube (https://xively.com/), Cloudsensing (http://wot.cloudsensing.cn), Evrythng (http://www.evrythng.com/), Thingspeak (http://thingspeak.com/), Yeelink (http://www.yeelink.net/) and Exosite (http://exosite.com/). The xml documents contain 24,782 xml files. We run the experiment on an Intel Core 2 Duo 2.8GHz ma-chine with 1536MB memory and 250GB disk space.
5.1 Example Scenario
As an example, the user wants to know the maker of temperature sensor located in Beijing. So he writes “Who is the maker of temperature sensor which locates in beijing?” in the searchBox. The figure of the structure above is figure 2.
Depended on the grammar dependency tree, we can abstract the RDFs (temperature sensor, maker, who) and (temperature sensor, lactation, beijing) combining with our triple RDF abstraction rules and templates. The query tree shows as follow: Then we relax the query tree structure as mentioned in the section of Hierarchical Structure similarity. Then we expand our subject, predicate and object referring to the section of Vocabulary Similarity. We compute the similarity of the expansive triples and original RDF triple.
If you are a specialist of IOT, you may know that the temperature and humidity are generally integrated in one device. And sometime they publish only one manufacturer. This can be reasoned from the domain ontology. We should modify the triple to (temperature/humidity sensor, manufacturer, person) based on the domain ontology. We can make similar
WEBIST�2014�-�International�Conference�on�Web�Information�Systems�and�Technologies
244

Figure 5: The first 5 results.
Figure 4: Query tree.
reasoning by adding expert knowledge to the domain ontology. Then translate these triples to SPARQL sentences to retrieve the RDF data. The first 5 results is as the Figure 5, Click any the “more relative nodes”, we can redirect to see the parent, siblings and children nodes.
5.2 The Evaluation of Our System
The precision of our system Then we construct 363 queries by 34 testers in the forms of both natural language and keyword. We do information retrieval in both keyword search system and our system. The keyword search was implemented like the text retrieval system. The precise evaluation is as in the figure 6.
Figure 6: The precision.
We can get a very high precision in first 10 results. Because of the insufficiency of WordNet itself, we lose about 10% precision. Query Execution Time In order to determine the scalability of our system, we check how long it on average takes to accomplish a search. Because the scale of domain ontology is usually fixed without much fluctuation, so the time will not increase linearly with the xml
document. Now we conduct an experiment to see the relation of similarity threshold and searching cost time.
Almost all the searching cost is no more than one second. The search time is mainly decided by the scale of the ontology and the threshold of similarity expansion. As figure shows, as the threshold reduces, the searching cost time declines.
Figure 7: Query execution time.
6 CONCLUSIONS
This paper proposes an xml semantic query system that combines general ontology like WordNet with certain domain ontology constructed by RDF Schema. We consider two aspects of query relaxation, vocabulary and hierarchical structure, to ensure the relevance sort and the recall of results. We rely on natural language processing techniques to provide user-friendliness, allowing NL input query. In this paper,I have summarized some of the structure patterns to extract RDF queries from most common query statements. This approach has limitations of corpus scale and accuracy of RDF extraction. In future work, we can use machine learning, and even deep learning to enhance the accuracy of extracting RDF.
ACKNOWLEDGEMENTS
The State Key Program of China- project on the Architecture, Key technology research and
XML�Approximate�Semantic�Query�based�on�Ontology
245
Demonstration of Web-based wireless ubiquitous business environment (2012ZX03005008).
REFERENCES
Guerrini G. 2013. Approximate XML Query Processing[M]//Advanced Query Processing. Springer Berlin Heidelberg.
Y. Li, C. Yu, H.V. Jagadish. 2004. Schema-free xquery, in: Proceedings of the 30th International Conference on Very Large Data Bases (VLDB2004).
S. Cohen, J. Mamou, Y. Kanza, Y. Sagiv. 2003. Xsearch: a semantic search engine for XML. in: Proceedings of 29th International Conference on Very Large Data Bases (VLDB2003).
G. Li, J. Feng, J. Wang, L. Zhou. 2007. Effective keyword search for valuable lcas over XML documents. in: Proceedings of the Sixteenth ACM Conference on Information and Knowledge Management.
Liu X, Chen L, Wan C, et al. 2013. Exploiting structures in keyword queries for effective XML search[J]. Information Sciences.
Kaufmann E, Bernstein A. 2010. Evaluating the usability of natural language query languages and interfaces to Semantic Web knowledge bases[J]. Web Semantics: Science, Services and Agents on the World Wide Web.
Decker S, Melnik S, Van Harmelen F, et al.2000. The semantic web: The roles of XML and RDF[J]. Internet Computing.
J. Xu, W. Li. 2007. Using Relational Database to Build OWL Ontology from XML Data Sources. Proceeding 2007 International Conference on Computational Intelligence and Security Workshops, CISW.
Liu. Z, Chen. Y. 2008. Reasoning and identifying relevant matches for XML keyword search. PVLDB.
Y. Xu, Y. Papakonstantinou. 2005. Efficient keyword search for smallest lcas in XML databases. in:
Proceedings of the ACM SIGMOD International Conference on Management of Data (SIGMOD2005).
Golenberg K, Kimelfeld B, Sagiv Y. 2008. Keyword proximity search in complex data graphs[C]. Proceedings of the 2008 ACM SIGMOD international conference on Management of data.
Bao Z, Lu J, Ling T W.2010. Xreal: an interactive xml keyword searching[C]//Proceedings of the 19th ACM international conference on Information and knowledge management. ACM.
Theobald M, Bast H, Majumdar D, et al. 2008. TopX: efficient and versatile top-k query processing for semistructured data[J]. The VLDB Journal.
Amer-Yahia S, Koudas N, Marian A, et al. 2005. Structure and Content Scoring for XML. In: VLDB.
Augsten N, Barbosa D, Bohlen M, et al. 2010. Tasm: Top-k approximate subtree matching[C]//Data Engineering (ICDE), 2010 IEEE 26th International Conference on.
Sanz I, Mesiti M, Guerrini G, et al. 2008. Fragment-based approximate retrieval in highly heterogeneous XML collections[J]. Data & Knowledge Engineering.
De Marneffe M C, Manning C D. 2008. Stanford typed dependencies manual[J].
J. Jiang and D. Conrath. 1997. Semantic similarity based on corpus statistics and lexical taxonomy. In Proceedings on International Conference on Research in Computational Linguistics.
Budanitsky, A., & Hirst, G. 2001. Semantic distance in WordNet: An experimental, application-oriented evaluation of five measures. In Workshop on WordNet and Other Lexical Resources.
APPENDIX
Triples extraction principle is based on the whole dependencies between words , vocabulary speech , marked entity to mark RDF triples .
Module 1 : Get subject dependencies, analyze the subject
1)Dependencies extract is satisfied {"nsubj", "xsubj", "top", "nsubjpass"} in any one of dependencies.
2)Get the current dependency of entities as the center of the word , when analyzing
the subject followed with Prep_of structure, the nouns after the Prep_of structure become the subject, and the nouns
the association triples.
before degenerate to predicat 3)If
e.
4)Transfer the dependency nodes into triple nodes
Module 2 : Get relations of predicate and object, analyze predicate and object
1)Extract dependencies that satisfy {"dobj", "pobj", "range", "attr", "dep", "ccomp", "pccomp", "lccomp", "rcomp"} or {"conj", "ccomp ",
" pcomp "," lcomp "," rcomp "} dependencies. If the predicate is nonsense word like is, ignore it.
2)According to the word collection of entity types types, access to the current node as the center of the " predicate - object" right, first obtain the
predicate , and then get the object.
3)Adjustment predicate, object because the original object may be predicate of cluase and the subject of clause may be predicate of the main clause)
Analysis predicate : take the current word as predicate in the center to analyse the association triples
Analysis of object : Get the current dependency of entities as a subject and the center of the word , when analyzing the association.
4) If the predicate is a verb, translate it to noun.
Module 3: Connect predicate and object with subject to RDF triples
WEBIST�2014�-�International�Conference�on�Web�Information�Systems�and�Technologies
246

Finding Domain Experts in Microblogs
Shao Xianlei, Zhang Chunhong and Ji Yang Mobile Life and New Media Laboratory, Beijing University of Posts and Telecommunications (BUPT), Beijing, China
[email protected], {zhangch.bupt.001, ji.yang.0001}@gmail.com
Keywords: Domain Experts Finding System, Microblog Lda, GBDT, User Features.
Abstract: As users and contents of microblogging services gain a sharp increase, it presents the challenge of finding domain experts who are of high profession but generally don’t have followers widely. To address this, we propose a domain experts finding system, which consists of three modules: data preprocessing module, user features extracting engine, experts identifying and ranking module. Firstly, we extract three kinds of features for characterizing social media authors, including user profile features, tweeting behavior features and linguistic content features which are generated by our Microblog Latent Dirichlet Allocation(Microblog Lda) model. Secondly, by casting the problem of finding domain experts as a 0-1 classification problem, we use the Gradient Boosted Decision Trees (GBDT) framework to do probabilistic classification over these features, execute a ranking procedure and yield a list of top N users for a given domain. Experimental results on actual datasets show our Microblog Lda outperforms LDA(Latent Dirichlet Allocation) and our system has a high accuracy in the task of finding domain experts in Microblogs.
1 INTRODUCTION
Millions of people turn to microblogging services such as twitter which is known to all and Sina Microblog which is the most influential microblogging services in China to gather real time news or opinions about people, things, or events of interest. Such services are not only used as social networking to stay in touch with friends and colleagues but also used as publishing platforms to create and consume content from sets of users with overlapping or disparate interests.
Through a survey on users’ following decisions on Twitter (Ramage, 2010), we can know that the most two common reasons for users to make following decisions are “professional interest” and “technology”. From this conclusion and our long-term observation of user behavior, it is not difficult to find that meeting users’ demand to access domain expertise of users would make a great significance for both the advancing of microblogging services and the efficiency of using microblogging.
In order to meet users’ demand to access expertise, finding the users that are recognized as sources of relevant and trustworthy information in specific domains is an important challenge. But currently, Twitter and Sina Microblog interface fails to support such kinds of services.
Despite the important role of domain expert users in microblogging, the challenge of identifying true experts is trickier than it appears at first blush. Content in microblogging systems is produced by tens to hundreds of millions of users. In microblogging contexts, for any given domain, the number of these content producers even in a single day can easily reach tens of thousands. While this large number can generate notable diversity, it also makes finding the true experts, those generally rated as learned and authoritative in a given domain, challenging.
Furthermore, most domain experts are not as well known as some celebrities known by many people, they are less discoverable due to low network metrics like follower count and the amount of content produced to date. Thus, we cannot use traditional graph-based methods of discrimination degree of user authority to find domain experts. Besides, graph based algorithms are computationally infeasible for near real time scenarios (Pal, 2011) and social graph information has a negligible impact on the overall performance of identifying a user (Pennacchiotti, 2011).
In this paper, we propose a new method for finding domain experts in microblogs. To sum up, the contributions of this paper are: (1) we propose a domain experts finding system which can identify
247

true experts in Microblogs with high accuracy. (2) A user feature engine is build to extract user features that are useful to identify one’s authority. (3) Microblog Lda, which is based on Lda (Blei, 2003) but is more suitable for microblogging-style informal written genres, is proposed to extract users’ linguistic content features.
The rest of the paper is organized as follows: Section 2 places our research in the context of previous work. Section 3 gives the framework of our domain experts finding system. Details of each module of our system are provided separately in Section 4 and Section 5. Results of experiments, which are provided in Section 6, show that the Microblog Lda can obtain significant performance gains and the system, as a whole, can achieve high accuracy in finding true experts in a given domain.
2 RELATED WORK
Within the microblogging research field, little work has explored the issue of domain expert identification. There have been several attempts to measure the influence of Twitter users and thereby identify influential users or experts (Bakshy, 2011; Cha, 2010; Romero, 2011). To our knowledge, there have been only two notable efforts that have approached the problem of identifying experts in specific topics (Weng, 2010; Pal, 2011). (Weng, 2010) proposed a Page-Rank like algorithm TwitterRank that uses both the Twitter graph and processed information from tweets to identify experts in particular topics. On the other hand, (Pal, 2011) used clustering and ranking on more than 15 features extracted from the Twitter graph and the tweets posted by users.
While somewhat similar to paper (Pal, 2011), our method differs in several important ways. Firstly, in paper (Pal, 2011), authors only emphasized users’ tweeting behavior features but ignored the precise linguistic content features which can make great significant to domain experts finding task. In our paper, we choose several features used in (Pal, 2011) which are suitable for our target users – Sina Microblog users but also add some more features. Secondly, apart from users’ tweeting behavior, we also make use of users’ profile features and linguistic content features and use a new method to
build the features of users. Finally,our approach
offers the potential advantage over network-based calculations in that it is less likely to interface by a few users with high popularity(i.e., celebritieds).
Outside microblogging, finding authoritative users generally has been widely studied. Authority finding has been explored extensively on the World Wide Web. Amongst the most popular graph based algorithms towards this goal are PageRank, HITS and their variations (Page, 1998; Kleinberg, 1998; Farahat, 2002). Also predating microblogging, several efforts have attempted to surface authoritative bloggers. (Java, 2006) model the spread of influence on the Blogosphere in order to select an influential set of bloggers which maximize the spread of information on the blogosphere.
Authority finding has also been explored extensively in the domain of Community question answering(CQA). Among most of the models proposed, some authors used network modeling approach(i.e., Agichtein, 2008). Others modeled CQA as a graph induced as a result of a users’ interactions with other community members (Jurczyk, 2007; Zhang, 2007). Still other approaches used characteristics of users’ interactions (Bouguessa, 2008, Pal, 2010).
In the domain of academic search, authority identification also has been studied extensively. (Tang, 2008) studied the problom of expertise search in their academic search system-ArnetMiner. (Kempe, 2003) modeled the spread of influence in co-authorshipnetworks.
Summarizing related work, the problom of finding authority has been explored extensively in other domains. Among these work, some used network analysis approaches which is computationally expensive, some used structed information (i.e., users’ interaction behaviors) and some used both appraoches in an integrated way. Our domain of interest, microblogging, has seen far less attention. As mentioned above, we feel our approach extends research in the following points:apart from users’ interaction behaviors, we also use users’ linguitic content features which carry rich information about users; without using graph-based approach, we use a classification approach which is computationally tractable.
3 DOMAIN EXPERTS FINDING SYSTEM
Our domain experts finding system mainly consists of three parts: data preprocessing module, user features extracting enginee, experts identifying and ranking module. The framework of our systen is shwon in the following Figure1.
WEBIST�2014�-�International�Conference�on�Web�Information�Systems�and�Technologies
248

Figure 1: Framework of Domain Experts Finding System.
The work of data preprocessing module is to prepare cleaned source data for features engine and experts identifying and ranking module. Details of this module’s workflow are described in Section 6.
In our proposed system, user features extracting engine can automatically construct user features and extract numerous features that are useful in domain expert authentication. In Section 4, we will describe the details of user features extracting engine and give a comprehensive analysis to the features we choose.
In Section 5, we would describe how we use the features extracted in Section 4 in our classification model to identify experts. The module will eventually generate the experts list and give the top N experts.
4 USER FEATURES EXTRACTING ENGINE
To learn the classification model, we use a large set of features that can reflect the impact of users in the system and their expertise. According to the nature they aim to capture, the features can fall into three main categories: profile features, tweeting behavior features and linguistic content features.
The rest of this section will further describe in depth these main categories of user features.
4.1 Profile Features
To start we present the list of valuable profile features in Table 1.
Having registered the service, users would have several profile features such as PF1-5 which are maintained by the microblogging service system automatically. Through the open API (application program interface) service of microblogging, we can get these profile features of users.
Experimental, a domain expert is more likely to
Table 1: Profile Features.
Name Feature PF1 PF2 PF3 PF4 PF5 PF6 PF7 PF8
Followers Count Verified Friends Count Statuses Count Favorites Count Followers per Friend Description Score Tags Score
have higher PF1, PF4 and PF6 because of his identity of information provider. PF2 is a service provided by microblogging system. If a user is authenticated, his identity is more likely to be true.
In self-descriptions and tags, users would like to use some words or sentences to describe themselves and choose tags provided by microblogging system to stand for them. Hence, from users’ descriptions and tags we can partially know their interests and domains. In this paper, we convert user’s description and tags to two features, PF7 and PF8. By counting words used in description of training users in the domain we care, we get top N words in all users’ descriptions according to their word frequency, which is expressed as Ddomain . PF7 is calculated
using formula (1).
PF7= i domain
domain
D D
D
(1)
Where iD is the words in ith user’s descriptions.
Similarly, PF8 is calculated using the following formula (2).
PF8= i dom ain
dom ain
T T
T
(2)
Where domainT is top N tags in all users’ tags with
high frequency andiT is tags of the ith user.
4.2 Tweeting Behavior Features
Tweeting behavior is characterized by a set of statistics capturing the way the user interacts with the microblogging service. In paper (Pal, 2011), the authors listed several tweeting behavior features that reflect the impact of users in microblogging system. In our paper, we use some of features that listed in paper (Pal, 2011), and add more features that can be extracted from Sina Microblogging service. The valuable tweeting behavior features we used are listed in Table2.
In paper (Java, 2007), the authors suggested
Finding�Domain�Experts�in�Microblogs
249

that users who often post URLs in their tweets are most likely information providers. Giving an URL in microblogs is an efficient way to supply information in depth. In our work, we use feature TBF1 to record number of links user shared.
Hashtag keywords (TBF2) are words starting with the # symbol and are often used to denote topical keywords in microblogs. These keywords can clearly reflect the topic of microblog.
Table 2: Tweeting Behavior Features.
Name Feature TBF1 TBF2 TBF3 TBF4 TBF5 TBF6 TBF7 TBF8 TBF9 TBF10
Number of links shared Number of keyword hashtags(#) used Number of conversation microblogs Number of retweeted microblogs Number of mentions (@) of other users by author Number of unique users mentioned by the author Number of users mentioned by the author Average number of messages per day Average comments per microblog Average reports per microblog
In paper (Boyd, 2010), retweeting or reposting someone’s post were discussed. A user can mention other users using the “@user” tag. In paper (Honeycutt, 2009), authors discussed @user. And in papers (Naaman, 2010) and (Ritter, 2010), authors modeled the conversations. It’s not difficult to know that features TBF2-7 can make a big difference in identifying domain experts. As an information provider, a domain expert tends to tweet several or even dozens of messages a day. TBF 8 can measure the impact of this behavior. Because the content of microblogs tweeted by domain experts is of high value, follows of experts would comment or even repost it. Statistics show that the higher the features TBF9 and TBF10 are, the higher user’s authority is.
4.3 Linguistic Content Features
According the results in paper (Pennacchiotti, 2011), user’s microblogs content makes most of the contribution in user features extraction. Making a good use of microblogs content would determine the performance of our system in a large extent.
Linguistic content information encapsulates the user’s behavior of lexical usage and the main topics the user is interested in. Several studies, e.g. (Rao, 2010), have shown that bag-of-words models usually outperform more advanced linguistic ones.
Different from other primarily spoken genres previously studied in the user-property classification literature, microblogging-style informal written genres has its own characteristic.
The content of microblog can fall into three categories: original microblog, which is produced by the author; conversation microblog, which is replied by the author; reposted microblog, which is produced by someone else and forwarded by the author with some additional comments. In Sina Microblog service, the format of conversation microblog and reposted microblog is shown as follow: Conversation microblog:
回 复 (reply)@user: content of reply//@user: source content. Reposted microblog:
Additional comments //@user: source content.
4.3.1 Microblog Latent Dirichlet Allocation
Reply and repost characterize the relation between microblogs. In general, content of reply in conversation microblog and additional comments in reposted microblogs shares related topics with source content of microblog. In this paper, we take into account the above two relationships, extend the original Lda (Blei, 2003), and propose our Microblog Lda.
Microblog Lda adopts the basic idea of topic model, namely each microblogging exhibits multiple topics which are represented by probability distributions over words, denoted as ( | )P z w
respectively. The Bayesian network of Microblog Lda is shown as follow in Figure 2.
Figure 2: Bayesian network of Microblog Lda.
Apart from special instructions, symbols in Microblog Lda follow the definitions in (Blei, 2003).
Microblog Lda generates microblogging in the following process:
1.Random choose a topic distribution over words.
2.Judge whether a microblogging is retweeted or
replied. If so, mark C as 1, random choose a
contactor-topic distribution c , which is sampled
from a Dirichlet distribution with
WEBIST�2014�-�International�Conference�on�Web�Information�Systems�and�Technologies
250

hyperparameter c , then assign the value of C
to S; if not, random choose a document-topic
distribution S , whose id sampled from a
Dirichlet distribution with hyperparameter S
.The probability distribution of is shown as
follows:
1
( ; )
( ; , )
( ; ) ( ; )c cc c
P
P c
P P
S S
(3)
3. Draw the specific word dnw from the
Multinomial distribution with parameter dnz .
For a microblogging, the joint probability is :
,
1
1-
1
, ,1
( , , , ; , )
( ; )
( ; ) ( ; )
( | ) ( | )
C
j t
K
ii
M
j C j Sj
N
j t Z j t jt
P W Z
P
P P
P W P Z
C
(4)
Generative process is shown as follows:
Algorithm 1: Microblog Lda.
For each topic {1,2,... }k T do
Draw ( )k Dir
End for
For each microblog d do
Judge whether d is conversation or reposted
microblog
If true
Draw ( )c cDir S
Else
Draw ( )Dir S S
For each word dnw do
Draw ( )dnz Multi S
End for
End for
4.3.2 Topic Features
Our Microblog Lda model is an adaptation of the original Lda proposed in paper (Blei, 2003), where documents are replaced by user’s stream. Our hypothesis is that a user can be represented as a multinomial distribution over topics. While (Blei, 2003) represents documents by their corresponding bag of words, we represent users in microblogging
service by the words of their tweets. Results from (Pennacchiotti, 2011) shown that Lda
system outperforms the tf-idf baseline with statistical significance. These prove our claim that topic models are good representations of user-level interests.
User’s multinomial distribution over topics can clearly reflect his interest. Therefore domain experts’ multinomial distribution over topics would be distinct. In our paper, we used results of Microblog LDA as linguistic content features of user and modeled each user by a topic-vector, where the weights are the probabilities to emit the topic.
5 EXPERTS IDENTIFYING AND RANKING
In Section 4, we generated user features, including profile features, tweeting behavior features and linguistic features, using our user features engine. In this section, we would use features generated above to identify domain experts and rank the result list.
In this paper, we cast the problem of identifying domain expert as a problem of 0-1 classification. As a classification algorithm, we use the Gradient Boosted Decision Trees – GBDT framework (Friedman, 2001). (Friedman, 2001) shows that by drastically easing the problem of over-fitting on training data (which is common in boosting algorithms). GBDT outperforms the state-of-the-art machine learning algorithms such as SVM with much smaller resulting models and faster decoding time (Friedman, 2006).
We use the features listed in section 4 to learn the classification model. After learning the GBDT model, we will use it to classify the large set of Sina Microblogging users and give the probability of a user judged as a domain expert.
In GBDT framework, results are shown in the format of probability of a user classified into classes. Having generated the probability of a user seen as a domain expert, we can ranking the probability and give the top N most liked experts of the domain we care.
6 EXPERIMENTAL EVALUATION
6.1 Data Preprocessing
Different from English, there are no spaces in words
Finding�Domain�Experts�in�Microblogs
251
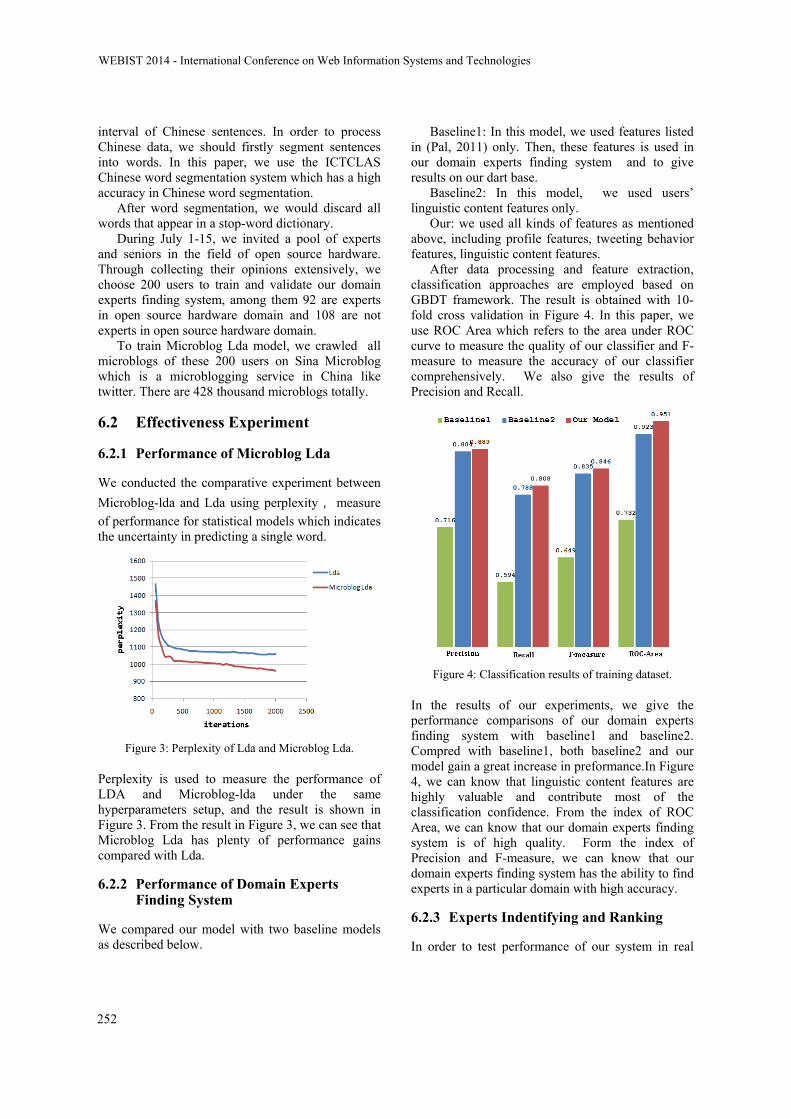
interval of Chinese sentences. In order to process Chinese data, we should firstly segment sentences into words. In this paper, we use the ICTCLAS Chinese word segmentation system which has a high accuracy in Chinese word segmentation.
After word segmentation, we would discard all words that appear in a stop-word dictionary.
During July 1-15, we invited a pool of experts and seniors in the field of open source hardware. Through collecting their opinions extensively, we choose 200 users to train and validate our domain experts finding system, among them 92 are experts in open source hardware domain and 108 are not experts in open source hardware domain.
To train Microblog Lda model, we crawled all microblogs of these 200 users on Sina Microblog which is a microblogging service in China like twitter. There are 428 thousand microblogs totally.
6.2 Effectiveness Experiment
6.2.1 Performance of Microblog Lda
We conducted the comparative experiment between
Microblog-lda and Lda using perplexity, measure of performance for statistical models which indicates the uncertainty in predicting a single word.
Figure 3: Perplexity of Lda and Microblog Lda.
Perplexity is used to measure the performance of LDA and Microblog-lda under the same hyperparameters setup, and the result is shown in Figure 3. From the result in Figure 3, we can see that Microblog Lda has plenty of performance gains compared with Lda.
6.2.2 Performance of Domain Experts Finding System
We compared our model with two baseline models as described below.
Baseline1: In this model, we used features listed in (Pal, 2011) only. Then, these features is used in our domain experts finding system and to give results on our dart base.
Baseline2: In this model, we used users’ linguistic content features only.
Our: we used all kinds of features as mentioned above, including profile features, tweeting behavior features, linguistic content features.
After data processing and feature extraction, classification approaches are employed based on GBDT framework. The result is obtained with 10-fold cross validation in Figure 4. In this paper, we use ROC Area which refers to the area under ROC curve to measure the quality of our classifier and F-measure to measure the accuracy of our classifier comprehensively. We also give the results of Precision and Recall.
Figure 4: Classification results of training dataset.
In the results of our experiments, we give the performance comparisons of our domain experts finding system with baseline1 and baseline2. Compred with baseline1, both baseline2 and our model gain a great increase in preformance.In Figure 4, we can know that linguistic content features are highly valuable and contribute most of the classification confidence. From the index of ROC Area, we can know that our domain experts finding system is of high quality. Form the index of Precision and F-measure, we can know that our domain experts finding system has the ability to find experts in a particular domain with high accuracy.
6.2.3 Experts Indentifying and Ranking
In order to test performance of our system in real
WEBIST�2014�-�International�Conference�on�Web�Information�Systems�and�Technologies
252
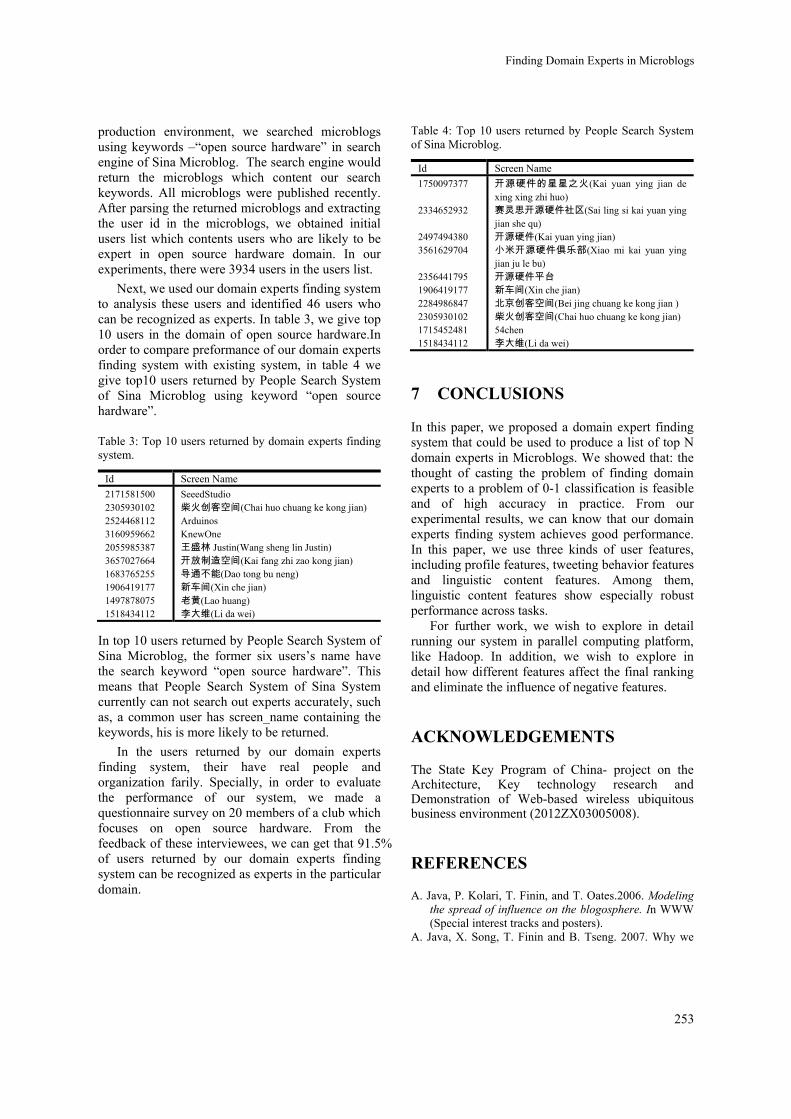
production environment, we searched microblogs using keywords –“open source hardware” in search engine of Sina Microblog. The search engine would return the microblogs which content our search keywords. All microblogs were published recently. After parsing the returned microblogs and extracting the user id in the microblogs, we obtained initial users list which contents users who are likely to be expert in open source hardware domain. In our experiments, there were 3934 users in the users list.
Next, we used our domain experts finding system to analysis these users and identified 46 users who can be recognized as experts. In table 3, we give top 10 users in the domain of open source hardware.In order to compare preformance of our domain experts finding system with existing system, in table 4 we give top10 users returned by People Search System of Sina Microblog using keyword “open source hardware”.
Table 3: Top 10 users returned by domain experts finding system.
Id Screen Name
2171581500 2305930102 2524468112 3160959662 2055985387 3657027664 1683765255 1906419177 1497878075 1518434112
SeeedStudio 柴火创客空间(Chai huo chuang ke kong jian) Arduinos KnewOne 王盛林 Justin(Wang sheng lin Justin) 开放制造空间(Kai fang zhi zao kong jian) 导通不能(Dao tong bu neng) 新车间(Xin che jian) 老黄(Lao huang) 李大维(Li da wei)
In top 10 users returned by People Search System of Sina Microblog, the former six users’s name have the search keyword “open source hardware”. This means that People Search System of Sina System currently can not search out experts accurately, such as, a common user has screen_name containing the keywords, his is more likely to be returned.
In the users returned by our domain experts finding system, their have real people and organization farily. Specially, in order to evaluate the performance of our system, we made a questionnaire survey on 20 members of a club which focuses on open source hardware. From the feedback of these interviewees, we can get that 91.5% of users returned by our domain experts finding system can be recognized as experts in the particular domain.
Table 4: Top 10 users returned by People Search System of Sina Microblog.
Id Screen Name
1750097377 2334652932 2497494380 3561629704 2356441795 1906419177 2284986847 2305930102 1715452481 1518434112
开源硬件的星星之火(Kai yuan ying jian de xing xing zhi huo) 赛灵思开源硬件社区(Sai ling si kai yuan ying jian she qu) 开源硬件(Kai yuan ying jian) 小米开源硬件俱乐部(Xiao mi kai yuan ying jian ju le bu) 开源硬件平台 新车间(Xin che jian) 北京创客空间(Bei jing chuang ke kong jian ) 柴火创客空间(Chai huo chuang ke kong jian) 54chen 李大维(Li da wei)
7 CONCLUSIONS
In this paper, we proposed a domain expert finding system that could be used to produce a list of top N domain experts in Microblogs. We showed that: the thought of casting the problem of finding domain experts to a problem of 0-1 classification is feasible and of high accuracy in practice. From our experimental results, we can know that our domain experts finding system achieves good performance. In this paper, we use three kinds of user features, including profile features, tweeting behavior features and linguistic content features. Among them, linguistic content features show especially robust performance across tasks.
For further work, we wish to explore in detail running our system in parallel computing platform, like Hadoop. In addition, we wish to explore in detail how different features affect the final ranking and eliminate the influence of negative features.
ACKNOWLEDGEMENTS
The State Key Program of China- project on the Architecture, Key technology research and Demonstration of Web-based wireless ubiquitous business environment (2012ZX03005008).
REFERENCES
A. Java, P. Kolari, T. Finin, and T. Oates.2006. Modeling the spread of influence on the blogosphere. In WWW (Special interest tracks and posters).
A. Java, X. Song, T. Finin and B. Tseng. 2007. Why we
Finding�Domain�Experts�in�Microblogs
253

twitter: understanding microblogging usage and communities. Joint 9th WEBKDD and 1st SNA-KDD Workshop (WebKDD/SNA-KDD).
A. Pal and J. A. Konstan.2010.Expert Identification in Community Question Answering: Exploring Question Selection Bias. InCIKM.
A. Ritter, C. Cherry and B. Dolan. 2010. Unsupervised Modeling of Twitter Conversations. In the 2010 Conference of the North American Chapter of the Association for Computational Linguistics.
Blei, D. M., Ng, A. Y., & Jordan, M. I. 2003. Latent dirichlet allocation. the Journal of machine Learning research.
C. Honeycutt, S. C.Herring. 2009. Beyond microblogging: Conversations and collaboration via Twitter. In Hawaii International Conference on System Sciences (HICSS).
D. Boyd, S. Golder, G. Lotan. 2010. Retweet: Conversational Aspects of Retweeting on Twitter. In Hawaii International Conference on System Sciences (HICSS).
D. Kempe.2003. Maximizing the spread of influence through a social network. In KDD.
D. M. Romero, W. Galuba, S. Asur, B. A. Huberman. 2011. Influence and passivity in social media. In Proceedings of ACM Conference on World Wide Web (WWW).
E. Agichtein, C. Castillo, D. Donato, A. Gionis, and G. Mishne.2008. Finding high-quality content in social media. In WSDM.
E. Bakshy, J. M. Hofman, W. A. Mason, D. J. Watts. 2011. Everyone’s an influencer: quantifying influence on Twitter. In Proceedings of ACM Conference on Web Search and Data Mining (WSDM).
Farahat, A., Nunberg, G., & Chen, F. 2002. Augeas: authoritativeness grading, estimation, and sorting. In Proceedings of the eleventh international conference on Information and knowledge management.
Friedman, J. H. 2001. Greedy function approximation: a gradient boosting machine. Annals of Statistics.
Friedman, J. H. 2006. Recent advances in predictive (machine) learning. Journal of classification.
Institute of Computing Technology, Chinese Lexical Analysis System, http://ictclas.org/.
J. M. Kleinberg.1998.Authoritative sources in a hyperlinked environment. In SIAM symposium on Discrete algorithms (SODA).
J. Tang, J. Zhang, L.Yao, J. Li, L. Zhang, and Z. Su. 2008.Arnetminer: Extraction and mining of academic social networks. In Proceedings of the 14th ACM SIGKDD International Conference on Knowledge Discovery and Data Mining (SIGKDD’08).
J. Weng, E. -P. Lim, J. Jiang, Q. He. 2010. TwitterRank: Finding Topic-sensitive Influential Twitterers. In Proceedings of ACM Conference on Web Search and Data Mining(WSDM).
J. Zhang, M. S. Ackerman, and L. Adamic. 2007. Expertise networks in online communities: structure and algorithms. In WWW.
L. Page, S. Brin, R. Motwani, and T. Winograd.1998. The pagerank citation ranking: Bringing order to the web. Technical report, Stanford Digital Library Technologies Project.
M. Bouguessa, B. Dumoulin, and S. Wang.2008. Identifying authoritative actors in question-answering forums: the case of yahoo! answers. In KDD.
M. Cha, H. Haddadi, F. Benevenuto, K. P. Gummadi. 2010. Measuring User Influence in Twitter: The Million Follower Fallacy. In Proceedings of AAAI Conference on Weblogs and Social Media (ICWSM).
M. Naaman, J. Boase and C. H. Lai. 2010. Is it Really About Me? Message Content in Social Awareness Streams. In Computer Supported Cooperative Work.
Pal, A., & Counts, S. 2011. Identifying topical authorities in microblogs. In Proceedings of the fourth ACM international conference on Web search and data mining .
Pennacchiotti, M., & Gurumurthy, S. 2011. Investigating topic models for social media user recommendation. In Proceedings of the 20th international conference companion on World wide web.
Pennacchiotti, M., & Popescu, A. M. 2011. Democrats, republicans and starbucks afficionados: user classification in twitter. In Proceedings of the 17th ACM SIGKDD international conference on Knowledge discovery and data mining .
P. Jurczyk and E. Agichtein.2007. Discovering authorities in question answer communities by using link analysis. In CIKM.
Ramage, D., Dumais, S. T., & Liebling, D. J. 2010. Characterizing Microblogs with Topic Models. In ICWSM.
Rao, D., Yarowsky, D., Shreevats, A., & Gupta, M. 2010. Classifying latent user attributes in twitter. In Proceedings of the 2nd international workshop on Search and mining user-generated contents.
WEBIST�2014�-�International�Conference�on�Web�Information�Systems�and�Technologies
254
Comparison between LSA-LDA-Lexical Chains
Costin Chiru, Traian Rebedea and Silvia Ciotec University Politehnica of Bucharest, Department of Computer Science and Engineering,
313 Splaiul Independetei, Bucharest, Romania {costin.chiru, traian.rebedea}@cs.pub.ro, [email protected]
Keywords: Latent Semantic Analysis - LSA, Latent Dirichlet Allocation - LDA, Lexical Chains, Semantic Relatedness.
Abstract: This paper presents an analysis of three techniques used for similar tasks, especially related to semantics, in Natural Language Processing (NLP): Latent Semantic Analysis (LSA), Latent Dirichlet Allocation (LDA) and lexical chains. These techniques were evaluated and compared on two different corpora in order to highlight the similarities and differences between them from a semantic analysis viewpoint. The first corpus consisted of four Wikipedia articles on different topics, while the second one consisted of 35 online chat conversations between 4-12 participants debating four imposed topics (forum, chat, blog and wikis). The study focuses on finding similarities and differences between the outcomes of the three methods from a semantic analysis point of view, by computing quantitative factors such as correlations, degree of coverage of the resulting topics, etc. Using corpora from different types of discourse and quantitative factors that are task-independent allows us to prove that although LSA and LDA provide similar results, the results of lexical chaining are not very correlated with neither the ones of LSA or LDA, therefore lexical chains might be used complementary to LSA or LDA when performing semantic analysis for various NLP applications.
1 INTRODUCTION
Latent Semantic Analysis (LSA) (Landauer and Dumais, 1997), Latent Dirichlet Allocation (LDA) (Blei et. al, 2003) and lexical chains (Halliday and Hasan, 1976; Morris and Hirst, 1991) are widely used in NLP applications for similar tasks. All these methods use semantic distances or similarities/ relatedness between terms to form topics or chains of words. LSA and LDA use the joint frequency of the co-occurrence of words in different corpora, while the lexical chains technique uses WordNet (http://wordnet.princeton.edu/) synsets and links between them to find groups of highly-connected or closely-related words.
Although these methods can be similarly used for various NLP tasks - text summarization (Barzilay and Elhadad, 1997; Gong and Liu, 2001; Haghighi and Vanderwende, 2009), question answering (Novischi and Moldovan, 2006) or topic detection (Carthy, 2004) - they calculate different measures, having different meanings. LDA generates topical threads under a prior Dirichlet distribution, LSA produces a correlation matrix between words and documents, while lexical chains use the WordNet structure to establish a connection between synsets.
Therefore, the comparison and interpretation of similarities and differences between the aforementioned methods is important to understand which model might be the most appropriate for a given scenario (task and discourse type, for example). Previous studies were aimed at comparing different similarity measures built on top of WordNet in order to decide which one gives better results (Barzilay and Elhadad, 1997), or to compare the results provided by the lexical chains built using different measures with the ones given by LSA in order to add a further relationship layer to WordNet for improving its usefulness to NLP tasks (Boyd-Graber et. al, 2006). However, more recently Cramer (2008) pointed out that the existing studies are inconsistent to each other and that human judgments should not be used as a baseline for the evaluation or comparison of different semantic measures.
This work aims to study the behaviour of the three methods: LSA, LDA and lexical chains, based on a series of tests performed on two corpora: one consisting on four Wikipedia articles on different topics and another one built from multi-party online chat conversations debating four pre-imposed topics: forum, chat, blog, wikis.
The paper continues with a review of the
255

evaluated techniques. Afterwards, we present the procedure for comparing the three methods along with the texts used for evaluation. Section 4 describes the obtained results and our observations, while the last section highlights the main conclusions of the study.
2 EVALUATED METHODS
2.1 LSA – Latent Semantic Analysis
LSA (Landauer and Dumais, 1997) is a statistical method for extracting the relations between words in texts. It is a corpus-based method that does not use dictionaries, semantic networks, grammars, syntactic or morphological parsers, and its input is represented only by raw text divided in “chunks”. A chunk may be a sentence, an utterance in a chat, a paragraph or even a whole document, depending on the corpus. The method starts from the term-doc matrix computed on the corpus segmented into chunks and then applies a singular value decomposition in order to compute the most important singular values. Then, it produces a representation in a new space, called the latent semantic space, which uses only the most important (large) k singular values. The value for k depends on the corpus and task, and is usually between 100 and 600, a common choice being 300. This new space is used to compute similarities between different words and even whole documents, practically considering that words that are co-occurring in similar contexts may be considered to be semantically related.
2.2 LDA – Latent Dirichlet Allocation
LDA (Blei et. al, 2003) is a generative probabilistic model designed to extract topics from text. The basic idea behind LDA is that documents are represented as random mixtures of latent topics, where each topic is characterized by a set of pairs word-probability, representing the probability that a word belongs to a topic.
LDA assumes the following generative process for each document in a corpus: for each word wd,i in the corpus, it generates a topic z dependent on the mixture θ associated to the document d and then it generates a word from the topic z. To simplify this basic model, the size of the Dirichlet distribution k (the number of topics z) is assumed to be known and fixed. The Dirichlet prior is used because it has several convenient properties that facilitate inference and parameter estimation algorithms for LDA.
2.3 Lexical Chains
Lexical chains are groups of words that are semantically similar (Halliday and Hasan, 1976; Morris and Hirst, 1991). Each word in the chain is linked to its predecessors through a certain lexical cohesion relationship. Lexical chains require a lexical database or an ontology (most of the time, this database is WordNet) for establishing a semantic similarity between words. For this task, we have used WordNet and the Jiang-Conrath measure (Jiang and Conrath, 1997). As this measure requires the frequency of words in the English language and since we didn’t have access to a relevant corpus, we have used the number of hits returned by a Google search for each of the considered words. Once the distances between words were computed, we have used a full-clustering algorithm to group the words in chains. The algorithm worked in an online fashion (each word was evaluated in the order of their appearance in the analyzed text), adding a word to an existing cluster only if it was related to more than 90% of the words that were already part of that chain. If the considered word could not be fitted in any of the existing chains, then we created a new chain containing only that specific word (Chiru, Janca and Rebedea, 2010).
3 COMPARISON METHODOLOGY
Experiments were conducted on two different corpora: a corpus composed of four articles from
Wikipedia that were debating completely different topics: graffiti, tennis, volcano and astrology, consisting of 294 paragraphs and having a vocabulary size of 7744 words. In order not to have our results affected by noise, we removed from the corpus pronouns, articles, prepositions and conjunctions.
a corpus consisting of 35 online chat conversations debating four pre-imposed topics: forum, chat, blog, wikis, each of them involving between 4 to 12 participants. This corpus consisted of 6000 utterances (41902 words), with a vocabulary size of 2241 words.
3.1 Methods for Obtaining the Results
The SVD is performed using the airhead-research package (https://code.google.com/p/airhead-
WEBIST�2014�-�International�Conference�on�Web�Information�Systems�and�Technologies
256

research/wiki/LatentSemanticAnalysis) and a value of k = 300. Then, the LSA results are obtained starting from the matrix of similarities between each pair of words in the corpus. The degree of similarity between two words is computed using the cosine of the corresponding vectors in the latent space.
For LDA, the results are obtained from the distribution of each topic’s words and the corresponding probabilities. In the first corpus, containing encyclopaedic articles from four different domains, we decided to use a number of topics k = 4 for this analysis. For the second corpus, consisting on debates on four imposed topics, we decided to use k = 5 topics for the analysis, as besides the imposed topics, the participants also inputted some off-topic content that could have been considered as the fifth topic. In order to better understand the behaviour of LDA, we extracted the top 35, 50, 100, 150 and 200 words that were considered representative for each topic, given that each article contained over 1000 words. The topic models were extracted using MALLET - MAchine Learning for LanguagE Toolkit (http://mallet.cs.umass.edu/).
In the case of lexical chains, we analyzed the words from each chain and also considered the maximum length and the total number of the lexical chains from a document (chat or Wikipedia article).
3.1.1 LDA - LSA Comparison
In order to compare the two methods, we started from the LDA topics and computed an LSA score for each concept from each topic generated by LDA. This score represented the average similarity between the target concept and each of the remaining words from the topic. The assessment of the relationship between LSA and LDA scores distributions was performed using Pearson’s correlation coefficient and Spearman’s rank correlation coefficient. LSA and LDA have also been compared on several NLP tasks, such as predicting word associations (Griffiths et al., 2007) and automatic essay grading (Kakkonen et al., 2008).
3.1.2 LSA - Lexical Chains Comparison
For comparing these two methods, we determined a similarity value for each lexical chain based on the LSA similarity as follows: we computed the LSA similarity between any pair of two words from the chain and averaged over all the words in that chain. LSA has been previously compared with semantic distances in WordNet (Tsatsaronis et al., 2010), but not with lexical chains.
3.1.3 LDA - Lexical Chains Comparison
This comparison is based on the number of common words between the lexical chains and the LDA topics. For each LDA topic we extracted a number of 35, 50, 100, 150 and 200 words, and computed different statistics for each case. To our knowledge, LDA and lexical chains have only been compared as an alternative for text segmentation (Misra et al., 2009).
4 EXPERIMENTAL RESULTS
4.1 Wikipedia Corpus
4.1.1 LDA - LSA Comparison
Table 1 presents the top 10 words from the 4 LDA topics of the first corpus. In Table 2 we present the most similar 30 word-pairs generated by LSA. We need to mention that LSA was trained on the concatenation of all 4 articles from Wikipedia.
Table 1: Top 10 words from the LDA topics for the Wikipedia corpus.
Topic 0 Topic 1 Topic 2 Topic 3graffiti tennis volcanoes astrology
new game volcano been culture player lava Chinese form first volcanic personality york players surface scientific
design two example based popular court formed considered
hip three examples birth style point extinct bce spray French flows belief
Table 2: Top 30 most similar word-pairs generated by LSA for the Wikipedia corpus.
LSA Word Pairs men-cup mid-thinning plates-tectonic mid-crust tie-addition center-baseline hop-music thinning-ridge choice-receiver mid-ridge pace-receiver depicted-dealer lake-park shift-equinox degrees-equinox
mm-bounce basque-perera gladiatorial-cil lady-week degrees-shift difficult-extinct são-brazil rhode-newport tectonic-ridge force-hero federation-itf era-compete test-results mud-formation lifespans-
volcanologist
For each topic we plotted the distributions of LDA and LSA scores for each word from that topic,
Comparison�between�LSA-LDA-Lexical�Chains
257

computed as described in the previous section. Each LDA topic has 35 words that are sorted decreasing according to the LSA scores. The best result we have obtained was for the Topic 1 (tennis), where with very few exceptions, the LSA and LDA scores were very well correlated (0.855). This case is presented in Figure 1, where the x-axis represents the word number from the LDA topic and on the y axis we plotted the LDA and LSA scores corresponding to that word. The words’ probabilities for the considered topic computed with LDA are represented by the blue colour while in red we present the LSA scores. The scattering diagram for the same topic is presented in Figure 2.
Figure 1: LDA – LSA distributions for Topic 1 (tennis) from the Wikipedia corpus.
Figure 2: Scattering plot for the rank distributions for the LDA – LSA comparison for Topic 1 (tennis).
For a better visualization of the relationship between the two distributions, we present in Table 3 the Pearson’s correlation and the Spearman’s rank correlation coefficients between the LDA and LSA scores for each of the four LDA topics. With one exception, these values are close to 1, indicating a very good correlation (the strongest is highlighted in bold).
Table 3: LDA-LSA Pearson’s Coefficient for the Wikipedia corpus.
Topic Pearson’s
Coefficient Spearman’s Coefficient
0 (graffiti) 0.560 0.778 1 (tennis) 0.855 0.873
2 (volcanoes) 0.782 0.840 3 (astrology) 0.745 0.745
These results prove that there is clearly a correlation between the two distributions because both tend to decrease towards the last words of the topic. However, there are some words for which the two scores are discordant. We have extracted them and obtained the following results: for Topic 0 (graffiti): hip, produced, styles,
non, offered, property; for Topic 1 (tennis): point, receiving; for Topic 2 (volcanoes): extinct, gases,
features, falls; for Topic 3 (astrology): considered, challenge,
avoid. It is interesting to observe that the better
correlated the LSA and LDA scores are for a given topic, the more the words underestimated by LSA correspond to that topic.
4.1.2 LSA - Lexical Chains Comparison
Using the LSA similarity between words, we computed a score ranging from 0 to 1 for every lexical chain.
Figure 3: LSA scores for the lexical chains of the tennis article from the Wikipedia corpus.
For an example of the obtained results, see Figure 3 (for Topic 1 - tennis) where on the x-axis are the lexical chains (excluding those formed only by one word) and on the y-axis are their LSA scores.
We have noticed that the best lexical chains are obtained for the texts that had also a good
WEBIST�2014�-�International�Conference�on�Web�Information�Systems�and�Technologies
258
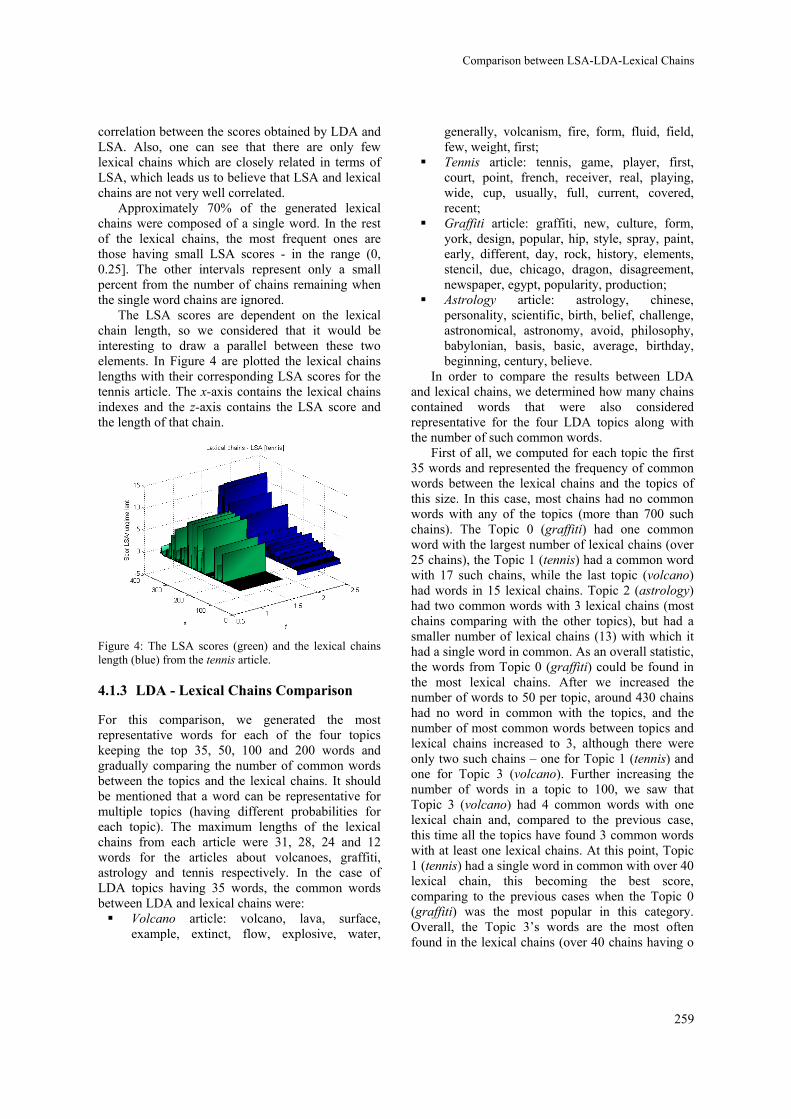
correlation between the scores obtained by LDA and LSA. Also, one can see that there are only few lexical chains which are closely related in terms of LSA, which leads us to believe that LSA and lexical chains are not very well correlated.
Approximately 70% of the generated lexical chains were composed of a single word. In the rest of the lexical chains, the most frequent ones are those having small LSA scores - in the range (0, 0.25]. The other intervals represent only a small percent from the number of chains remaining when the single word chains are ignored.
The LSA scores are dependent on the lexical chain length, so we considered that it would be interesting to draw a parallel between these two elements. In Figure 4 are plotted the lexical chains lengths with their corresponding LSA scores for the tennis article. The x-axis contains the lexical chains indexes and the z-axis contains the LSA score and the length of that chain.
Figure 4: The LSA scores (green) and the lexical chains length (blue) from the tennis article.
4.1.3 LDA - Lexical Chains Comparison
For this comparison, we generated the most representative words for each of the four topics keeping the top 35, 50, 100 and 200 words and gradually comparing the number of common words between the topics and the lexical chains. It should be mentioned that a word can be representative for multiple topics (having different probabilities for each topic). The maximum lengths of the lexical chains from each article were 31, 28, 24 and 12 words for the articles about volcanoes, graffiti, astrology and tennis respectively. In the case of LDA topics having 35 words, the common words between LDA and lexical chains were: Volcano article: volcano, lava, surface,
example, extinct, flow, explosive, water,
generally, volcanism, fire, form, fluid, field, few, weight, first;
Tennis article: tennis, game, player, first, court, point, french, receiver, real, playing, wide, cup, usually, full, current, covered, recent;
Graffiti article: graffiti, new, culture, form, york, design, popular, hip, style, spray, paint, early, different, day, rock, history, elements, stencil, due, chicago, dragon, disagreement, newspaper, egypt, popularity, production;
Astrology article: astrology, chinese, personality, scientific, birth, belief, challenge, astronomical, astronomy, avoid, philosophy, babylonian, basis, basic, average, birthday, beginning, century, believe.
In order to compare the results between LDA and lexical chains, we determined how many chains contained words that were also considered representative for the four LDA topics along with the number of such common words.
First of all, we computed for each topic the first 35 words and represented the frequency of common words between the lexical chains and the topics of this size. In this case, most chains had no common words with any of the topics (more than 700 such chains). The Topic 0 (graffiti) had one common word with the largest number of lexical chains (over 25 chains), the Topic 1 (tennis) had a common word with 17 such chains, while the last topic (volcano) had words in 15 lexical chains. Topic 2 (astrology) had two common words with 3 lexical chains (most chains comparing with the other topics), but had a smaller number of lexical chains (13) with which it had a single word in common. As an overall statistic, the words from Topic 0 (graffiti) could be found in the most lexical chains. After we increased the number of words to 50 per topic, around 430 chains had no word in common with the topics, and the number of most common words between topics and lexical chains increased to 3, although there were only two such chains – one for Topic 1 (tennis) and one for Topic 3 (volcano). Further increasing the number of words in a topic to 100, we saw that Topic 3 (volcano) had 4 common words with one lexical chain and, compared to the previous case, this time all the topics have found 3 common words with at least one lexical chains. At this point, Topic 1 (tennis) had a single word in common with over 40 lexical chain, this becoming the best score, comparing to the previous cases when the Topic 0 (graffiti) was the most popular in this category. Overall, the Topic 3’s words are the most often found in the lexical chains (over 40 chains having o
Comparison�between�LSA-LDA-Lexical�Chains
259
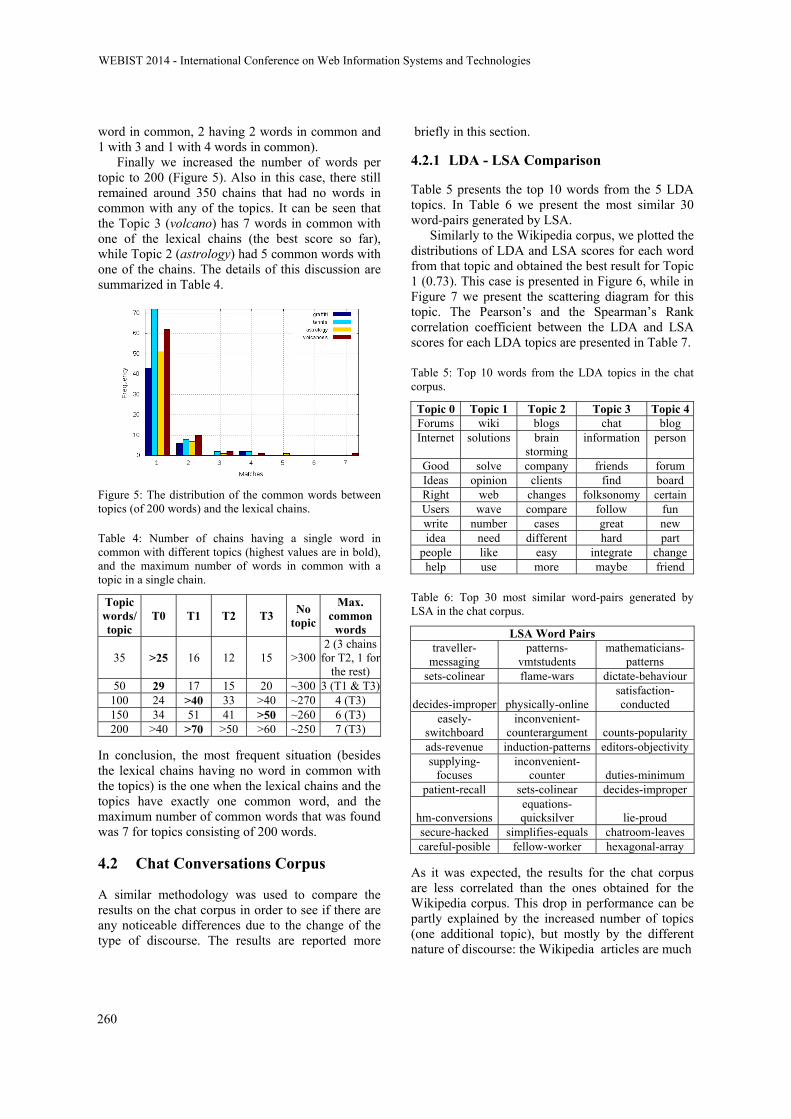
word in common, 2 having 2 words in common and 1 with 3 and 1 with 4 words in common).
Finally we increased the number of words per topic to 200 (Figure 5). Also in this case, there still remained around 350 chains that had no words in common with any of the topics. It can be seen that the Topic 3 (volcano) has 7 words in common with one of the lexical chains (the best score so far), while Topic 2 (astrology) had 5 common words with one of the chains. The details of this discussion are summarized in Table 4.
Figure 5: The distribution of the common words between topics (of 200 words) and the lexical chains.
Table 4: Number of chains having a single word in common with different topics (highest values are in bold), and the maximum number of words in common with a topic in a single chain.
Topic words/ topic
T0 T1 T2 T3 No
topic
Max. common
words
35 >25 16 12 15 >300 2 (3 chains
for T2, 1 for the rest)
50 29 17 15 20 ~300 3 (T1 & T3)100 24 >40 33 >40 ~270 4 (T3) 150 34 51 41 >50 ~260 6 (T3) 200 >40 >70 >50 >60 ~250 7 (T3)
In conclusion, the most frequent situation (besides the lexical chains having no word in common with the topics) is the one when the lexical chains and the topics have exactly one common word, and the maximum number of common words that was found was 7 for topics consisting of 200 words.
4.2 Chat Conversations Corpus
A similar methodology was used to compare the results on the chat corpus in order to see if there are any noticeable differences due to the change of the type of discourse. The results are reported more
briefly in this section.
4.2.1 LDA - LSA Comparison
Table 5 presents the top 10 words from the 5 LDA topics. In Table 6 we present the most similar 30 word-pairs generated by LSA.
Similarly to the Wikipedia corpus, we plotted the distributions of LDA and LSA scores for each word from that topic and obtained the best result for Topic 1 (0.73). This case is presented in Figure 6, while in Figure 7 we present the scattering diagram for this topic. The Pearson’s and the Spearman’s Rank correlation coefficient between the LDA and LSA scores for each LDA topics are presented in Table 7.
Table 5: Top 10 words from the LDA topics in the chat corpus.
Topic 0 Topic 1 Topic 2 Topic 3 Topic 4Forums wiki blogs chat blog Internet solutions brain
storming information person
Good solve company friends forum Ideas opinion clients find board Right web changes folksonomy certain Users wave compare follow fun write number cases great new idea need different hard part
people like easy integrate change help use more maybe friend
Table 6: Top 30 most similar word-pairs generated by LSA in the chat corpus.
LSA Word Pairs traveller-
messaging patterns-
vmtstudents mathematicians-
patterns sets-colinear flame-wars dictate-behaviour
decides-improper physically-online satisfaction-conducted
easely-switchboard
inconvenient-counterargument counts-popularity
ads-revenue induction-patterns editors-objectivitysupplying-
focuses inconvenient-
counter duties-minimum patient-recall sets-colinear decides-improper
hm-conversions equations-quicksilver lie-proud
secure-hacked simplifies-equals chatroom-leaves careful-posible fellow-worker hexagonal-array
As it was expected, the results for the chat corpus are less correlated than the ones obtained for the Wikipedia corpus. This drop in performance can be partly explained by the increased number of topics (one additional topic), but mostly by the different nature of discourse: the Wikipedia articles are much
WEBIST�2014�-�International�Conference�on�Web�Information�Systems�and�Technologies
260

Figure 6: LDA – LSA distributions for Topic 1 from the chat corpus.
Figure 7: Scattering plot for the ranks distributions for the LDA–LSA comparison for Topic 1 from the chat corpus.
Table 7: LDA-LSA Pearson’s Coefficient for the chat corpus.
Topic Pearson’s
Coefficient Spearman’s Coefficient
0 0.63 0.46 1 0.73 0.55 2 0.55 0.41 3 0.46 0.35 4 0.71 0.32
more focused/cohesive and coherent than chat conversation between multiple participants. It also provides an insight related to the content of the chat conversations: it seemed that the topic one (related to wikis/Wikipedia) discovered by LDA was more coherent than the other topics, at least by looking at the LSA correlation scores. The second highest score in this hierarchy was for the forum-blog topic showing that the participants do not perceive significant differences between these concepts. However, the most intriguing result was the placement of the third topic (related to chat) on the last place, showing the least coherence. We expected that this topic to have in fact the highest coherence, being the tool most frequently used by the participants and therefore the tool that they knew
best. These results may also be influenced by the way we are measuring the coherence of a LDA topic through its correlation with the average LSA similarity scores.
4.2.2 LSA - Lexical Chains Comparison
For the chat corpus, the values of the LSA similarity between words for every lexical chain ranged from -1 to 1, as it can be seen in Figure 8. We can observe that the correlation between the LSA and lexical chains for the chat corpus is lower than the one for the Wikipedia corpus, this fact being generated by the lower cohesion of the text in this case.
Figure 8: LSA scores for the lexical chains from the chat corpus.
4.2.3 LDA - Lexical Chains Comparison
Similarly to the Wikipedia corpus, each of the five topics was generated keeping the top 35, 50, 100 and 200 words and gradually comparing the number of common words between the topics and the lexical chains. The maximum length of the lexical chains from this corpus was 84, much larger than the one obtained in the case of the Wikipedia corpus. This is due to the fact that the four topics imposed for debating in the chat conversations (forum, chat, blog, and wikipedia) were strongly related compared to the Wikipedia articles that debated topics from different domains.
The number of common words is predominantly 1, reaching a maximum of 8 common words for the third topic (related to chat) for a length of the lexical chain of 150 words. The results are similar to those obtained for the Wikipedia corpus.
Comparison�between�LSA-LDA-Lexical�Chains
261

5 CONCLUSIONS
In this paper we discussed the characteristics and behaviour of three methods frequently used to assess semantics in various NLP applications: LSA, LDA and lexical chaining. These methods have been tested on two different corpora containg different types of written discouse: a corpus consisting of 4 articles from Wikipedia and another one consisting of 35 chat conversations with multiple participants debating four pre-imposed topics: forum, chat, blog and wikis.
In contrast with the previous studies, we have compared the outcomes of the three methods using quantitative scores computed based on the outputs of each method. These scores included correlations between similarity scores and the number of common words from topics and chains. Thus, the obtained results are task and discourse-independent.
The most important result is that LSA and LDA have shown the strongest correlation on both corpora. This is consistent with the theoretical underpinnings, as LDA is similar to Probabilistic Latent Semantic Analysis (pLSA), except that the LDA distribution of topics is assumed to have a prior Dirichlet distribution. Moreover, LSA scores might be used to compute the coherence of a LDA topic as shown in the paper.
Another important contribution is that WordNet-based lexical chains are not very correlated with neither LSA nor LDA, therefore they might be seen as complementary to the LSA or LDA results.
ACKNOWLEDGEMENTS
This research was supported by project No.264207, ERRIC-Empowering Romanian Research on Intelligent Information Technologies/FP7-REGPOT-2010-1.
REFERENCES
Barzilay, R. and Elhadad. M., 1997. Using lexical chains for text summarization. In: Proceedings of the Intelligent Scalable Text Summarization Workshop, pp. 10–17.
Budanitsky, A. and Hirst, G., 2006. Evaluating wordnet-based measures of semantic relatedness. In: Computational Linguistics 32 (1), pp. 13–47.
Blei, D. M., Ng, A. Y. and Jordan, M. I., 2003. Latent Dirichlet allocation. In: Journal of Machine Learning Research 3, pp. 993-1022.
Boyd-Graber, J., Fellbaum, C., Osherson, D. and Schapire, R., 2006. Adding dense, weighted, connections to WordNet. In: Proceedings of the 3rd GlobalWordNet Meeting, pp. 29–35.
Carthy, J., 2004. Lexical chains versus keywords for topic tracking. In: Computational Linguistics and Intelligent Text Processing, LNCS, pp. 507–510. Springer.
Chiru, C., Janca, A., Rebedea, T., 2010. Disambiguation and Lexical Chains Construction Using WordNet. In S. Trăuşan-Matu, P.Dessus (Eds.) Natural Language Processing in Support of Learning: Metrics, Feedback and Connectivity, MatrixRom, pp 65-71.
Cramer, I., 2008. How well do semantic relatedness measures perform? a meta-study. In: Proceedings of the Symposium on Semantics in Systems for Text Processing.
Griffiths, T. L., Steyvers, M. and Tenenbaum, J. B., 2007. Topics in semantic representation. In: Psychological Review, vol. 114, no. 2, pp. 211–244.
Gong, Y. and Liu, X., 2001. Generic Text Summarization Using Relevance Measure and Latent Semantic Analysis. In: Proceedings of the 24th ACM SIGIR conference, pp. 19-25.
Haghighi, A. and Vanderwende, L., 2009. Exploring content models for multi-document summarization. In: Proceedings of HLT-NAACL, pp. 362–370.
Halliday, M. A.K. and Hasan, R., 1976. Cohesion In English, Longman.
Jiang, J. J. and Conrath, D. W, 1997. Semantic similarity based on corpus statistics and lexical taxonomy. In: Proceedings of ROCLING X, pp. 19-33.
Kakkonen, T., Myller, N., Sutinen, E.and Timonen, J., 2008. Comparison of Dimension Reduction Methods for Automated Essay Grading. In: Educational Technology & Society, 11(3), pp. 275–288.
Landauer, T. K. and Dumais, S. T., 1997. A solution to Plato's problem: the Latent Semantic Analysis theory of acquisition, induction and representation of knowledge. Psychological Review, 104(2), 211-240.
Misra, H., Yvon, F., Jose, J. and Cappé, O., 2009. Text Segmentation via Topic Modeling: An Analytical Study. In: 18th ACM Conference on Information and Knowledge Management, pp. 1553–1556.
Morris, J. and Hirst, G., 1991. Lexical Cohesion, the Thesaurus, and the Structure of Text. In: Computational Linguistics, Vol 17(1), pp. 211-232.
Novischi, A. and Moldovan, D., 2006. Question answering with lexical chains propagating verb arguments. In: Proceedings of the 21st International Conference on CL and 44th Annual Meeting of ACL, pp. 897–904.
Tsatsaronis, G., Varlamis, I. and Vazirgiannis, M., 2010. Text relatedness based on a word thesaurus. In: Artificial Intelligence Research, 37, pp. 1–39.
WEBIST�2014�-�International�Conference�on�Web�Information�Systems�and�Technologies
262

Prediction of Human Personality Traits From Annotation Activities
Nizar Omheni1, Omar Mazhoud1, Anis Kalboussi1 and Ahmed HadjKacem2
1Higher Institute of Computer and Management, University of Kairouan, ReDCAD Laboratory,Khmais Alouini Street 3100, Kairouan, Tunisia
2Faculty of Economics and Management, University of Sfax, ReDCAD Laboratory,Road of the Airport Km4 3018, Sfax, Tunisia
fomheninizar, omarmazhoud, [email protected], [email protected]
Keywords: Annotation, Personality, Big Five Personality Model.
Abstract: We show how reader’s annotation activity captured during an active reading session relates to their personal-ity, as measured by the standard Five Factor Model. For 120 volunteers having usually the habit of reading,we gather personality data and annotation practices. We examine correlations between readers personalityand such features of their annotative activities such as the total number of annotation acts, average number ofannotation acts, number of textual annotation acts, number of graphical annotation acts, number of referentialannotation acts and number of compounding annotation acts. Our results show significant relationships be-tween personality traits and such features of annotation practices. Then we show how multivariate regressionallows prediction of the readers personalities traits given their annotation activities.
1 INTRODUCTION
Studying human activity and interaction with technol-ogy has grown dramatically over the last decade. Yetstudying reading poses particular challenges. (Mar-shall,2010) reported the citation of Tzvetan Todorov,quoted by Nicholas Howe in Jonathan Boyarins com-pilation, the Ethnography of Reading: ”Nothing ismore commonplace than the reading experience, andyet nothing is more unknown. Reading is such a mat-ter of course that at first glance it seems there is noth-ing to say about it”. Although details of reading ac-tivity (moving eyes, writing annotation...) may tell ussomething about the reader. When people read andinteract actively with their reading materials they dounselfconscious activities which can be keys featuresto their personalities.
For decades, the psychologists search to under-stand the human personality and to find a systematicway to measure it. After several researches they showa relation of dependence between human personalitytraits and different behaviors. (Ryckman,2010) re-ported the Allport’s 1 definition of personality: ”per-sonality is the dynamic organization within the in-
1Gordon Willard Allport (November 11, 1897 October9, 1967) was an American psychologist. He was one of thefirst psychologists to focus on the study of the personality,and is often referred to as one of the founding figures ofpersonality psychology.
dividual of those psychophysical systems that deter-mine his characteristic behavior and thought”. Thus,in Allports view human behavior is really controlledby internal forces known as the personality traits.
This paper attemps to bridge the gap betweenreading activity research and personality researchthrough reader’s annotation practices. Our core re-search question asks whether annotation activity canpredict personality traits. If so, then there is an oppor-tunity to use a natural human practice as a new sourceto better understand the reader personality.
Several works has shown the opportunity of pre-dicting user personality using the information peo-ple reveal in their online social profile (Twitter, Face-Book) (Bachrach et al,2012) (Golbeck et al,2011).They refer to what people share, self-description, sta-tus updates, photos, tags, etc. We pretend that annota-tive activity is more spontaneously and natural prac-tice and it can reveal something about human person-ality.
Personalization attracted increased attention inmany areas. So the need to predict personality traitsincreases over time mainly when several research hasshown the link between personality traits and suc-cess in human relationship and practices (Barrick andMount,1991) (Eswaran et al,2011). By nature an in-troverted person is not interested to make so much re-lation with other while an extravert person do. Actu-ally, certain developed recommendation systems con-
263
sider the personality traits as key feature of recom-mendation (Nunes et al,2008).
The paper is structured as follows: In Section 2,we present background on the Big Five personalityindex. Then we present our experimental setup andmethods. In the third section we present the results oncorrelation between each annotative activity featureand personality factor. Next, we show how multivari-ate regression allows prediction of annotators person-alities traits given their annotation activities. We con-clude with a discussion of the possible implicationsthat this work has for such domains of application.
2 BACKGROUND AND RELATEDWORK
2.1 The Big Five Personality Model
The big five personality traits are the best ac-cepted and most commonly used scientific measureof personality and have been extensively researched(Peabody and De Raad,2002). That personality iswell described as five traits was discovered throughthe study of the adjectives from natural langage thatpeople used to describe themselves and then analyz-ing the data with a statistical procedure known as fac-tor analysis that is used to reduce lots of informationdown to its most important parts. In the following wecite a brief explanation of the five personality traits.
2.1.1 Openness to Experience
Openness includes traits like imagination, apprecia-tion for art, depth of emotions, adventure, unusualideas, intellectual curiosity, and willingness to experi-ment. People who score high in openness like usuallyto learn new things and enjoy new experiences.
2.1.2 Conscientiousness
Conscientiousness includes traits like orderliness,selfdiscipline, deliberateness, and striving theachievement. People that have a high degree ofconscientiousness are planned, have the tendencyto act dutifully, have the sense of responsibility andcompetence.
2.1.3 Extraversion
Extraversion includes traits like energy, positiveemotions, surgency, assertiveness, sociability andtalkativeness. Extraverts people get their energy from
interacting with others, while introverts get their en-ergy from within themselves.
2.1.4 Agreeableness
Agreeableness includes traits like trust in others, sin-cerity, altruism, compliance, modesty and sympathy.People that have high degree of agreeableness arefriendly, cooperative, and compassionate, while peo-ple with low agreeableness may be more distant.
2.1.5 Neuroticism
Neuroticism relates to ones emotional stability anddegree of negative emotions. This dimension mea-sures the people degree of anxiety, angry, moodiness,and the sensitivity to stress. People that score highon neuroticism often experience emotional instabilityand negative emotions.
2.2 Related Work
In (Burger,2011) view the personality is a ”consistentbehavior patterns and intrapersonal processes orig-inating within the individual”. Trait psychologistsassume that personality is relatively stable and pre-dictable (Burger,2011). So, several research work hasbeen done with personality traits as it influences hu-man decision making process and interests. (Nuneset al,2008) pionneered the model and implement ofpersonality traits in computers. Indeed, (Nunes etal,2008) propose to model the user’s traits in a pro-file which they called User Psychological Profile -UPP. In order to fill in the profile UPP the authorsutilised an online tool called the NEO-IPIP2 inven-tory based on 300 items. Through user’s answers toNEO-IPIP inventory the authors are able to predictthe user personality. Through their experimentation(Nunes et al,2008) try to prove that RecommenderSystems can be more efficient if they use the UserPsychological Profile (UPP). Although the authorsfollow an explicit way to predict the user traits, the re-sults presented in (Nunes,2008) are fruitful. (Tkalcicet al,2009) propose a personality-based approach thatis based on the big five model for collaborative fil-tering Recommender Systems. In fact, the authorscalculate the user personality scores by means of aquestionnaire. Then they measure the user similar-ity, that is based on personality, that yields a list ofclose neighbours. This list is used after as a databaseto compile a personalized list of recommended items.
2The NEO-IPIP is a computer based Personality Inven-tory, able to measure people Personality Traits created byJohn Johnson (Johnson.).
WEBIST�2014�-�International�Conference�on�Web�Information�Systems�and�Technologies
264

(Roshchina et al,2011) propose personality-based rec-ommender system which the aim is to select for theuser reviews that have been written by like-minded in-dividuals. The user similarity is calculated based onthe presonality traits according to the Big Five model.The authors predict the presonality traits based on lin-guistic cues collected from the user-generated text.(Bachrach et al,2012) and (Golbeck et al,2011) showthe relationship between personality traits and variousfeatures of social media (FaceBook, Twitter). Theirfindings prove the possibility to predict accurately theuser’s personality through the publicly avaible infor-mation on their social network profile.
As it is mentioned above most of works has beendone with the ”Big Five” model of personality dimen-sions which has emerged as the most well-researchedand regarded measures of personality in last decades.The best of our knowledge, our work is among thefirst to look at the relationship between annotation ac-tivity and personaltiy traits. Much works try to pre-dict personality from what the user offer consciously(answers to a questionnaire, informations available onpublic social profile...). Despite the fact that the find-ings of these researchs are fruitful we believe that pre-dicting personality from annotative activity is morecredible as the annotation is defined as ”a basic andoften unselfconscious way in which readers interactwith texts” (Marshall,2010).
Due to the spontaneously and unselfconscious as-pects of annotation we are interested to predict per-sonality from this potential source of knowledge.
3 DATA COLLECTION
We consider group of 120 volunteers. The subjects se-lected were recruited with respect to certain criterias.Infact, the age of our volunteers should be between 18and more and they should be academic people. In oursample we have the two sex (44 women and 76 men).Another criteria for selection , we asked if the volun-teer has the habit of reading and does he annotated hisdocuments frequently. If all these conditions exist thesubject can be selected to our experimentation.Each subject was instructed to answer a standard FiveFactor Model questionnaire (the NEO-IPIP Inven-tory). Then, he obtained a feedback regarding his per-sonality based on his responses. This step gives usthe personality scores based on the Big Five Modelfor each volunteer. To associate personality scoresto subjects annotative activities, we gather annotationpractices for each people. Here, we collect documentsannotated in a spontaneous and natural way. So weasked, first of all, if the subject had a document an-
notated previously (academic course, book,...). If notwe asked him what topics interest him, then we givehim an article with few pages to not weary him.We are very careful to the comfortability of the vol-unteers during the experience to guarantee their spon-taneous and natural reactions. Thus they are free tochoose places and conditions to read and annotate thedocuments and they have enough time to do. Thestrategy followed give us fruitful results. Infact, thedifferent subjects (who have not a document anno-tated previously) interact actively with the readingmaterials in view of the feel of comfortableness andthe interest to the document read.
Figure 1: Annotation practices of a reader.
3.1 User Annotation Activity
(Marshall,2010) defines the annotation as ”a basic andoften unselfconscious way in which readers interactwith texts”. We mean by annotation the act to adda critical or explanatory notes to a written work, tohighlight a passage, to write down, and so on marksthe reader makes on a page during his reading activity.To fulfil our experimentation, we ask each subject togive us an annotated paper document. Then, we anal-yse the readers annotations to extract some features.We started by classifying annotations in the threegeneral categories cited by (Agosti and Ferro,2003) :graphical annotation acts, textual annotation acts, andreference annotation act all depends to the material-ization sign of the semantics of the annotation addedto the annotated document. Then, for each reader, wecollect a simple set of statistics about their annotativeactivity. These included the following:
1. Total Number of Annotation Act (TNAA)
2. Average Number of Annotation Act (num-ber of annotation acts per a single annotatedpage)(ANAN)
3. Number of Graphical Annotation Act (NGAA)
4. Number of Textual Annotation Act (NTAA)
Prediction�of�Human�Personality�Traits�From�Annotation�Activities
265

5. Number of Reference Annotation Act (NRAA)
6. Number of compounding Annotation Act (textualsign, graphic sign and reference sign of annotationact can be compounded together in order to ex-press complex meanings of annotation)(NCAA).
This set of statistics tends to characterize quantita-tively the reader’s annotation practices. Next we runa Pearson correlation3 analysis between subjects’ per-sonality scores and each of the features obtained fromanalyzing their annotative activities.
4 PERSONALITY ANDANNOTATION FEATURESCORRELATION
We study the Pearson correlation between subjects’personality scores and each of the features obtainedfrom analyzing their annotative activities. We reportthe correlation values in table I. Those that were sta-tistically significant for p < 0:05 are bolded.
Table 1: Pearson correlation values between annotation fea-tures scores and presonality scores.
Open. Consc. Extra. Agree. Neuro.TNAA -0,059 0,128 -0,138 0,089 -0,287ANAA 0,003 0,080 -0,210 0,163 -0,183NGAA -0,067 0,040 -0,130 0,105 -0,207NTAA 0,001 0,182 0,040 0,085 -0,211NRAA -0,075 0,045 -0,122 0,077 -0,207NCAA -0,059 -0,012 -0,147 0,014 -0,219
We found in our analysis fewer significant corre-lations, but we believe a larger sample size would pro-duce much better results. However, the results we ob-tained even with a small sample show promise that theannotative activity can be useful for computing suchpersonality traits. In fact, table I shows significantcorrelations for Neuroticism, Conscientiousness, andExtraversion traits. We need larger sample to verifythe inference of the other traits from peoples annota-tions.
Next, we present the scatter plots for the most sig-nificant correlations between annotation practices fea-tures and personality traits. These plots presentingthe relationship between annotative activity featuresand human traits, where horizontal axis represents theaverage personality trait scores and the vertical axisrepresnts the annotative activity feature values.
3Pearson’s correlation r 2 [�1;1] measures the linear re-lationship between two random variables.
4.1 Conscientiousness
As presented in table I Conscientiousness is positivelyrelated to the number of textual annotation act (fig.2).The rest of the correlation values are not consideratedbecause of p-value > 0:05. But this is not a reason toreject definitively the rest of annotation features as alarger sample size may produces other significant cor-relations.The considered correlation may indicates that consci-entious people are interested to use textual annota-tion acts. Infact, conscientious individuals are prudentwhich means both wise and cautious, better organizedand they avoid acting spontaneously and impulsively.Thus, it may be the case that people who have highdegree of conscientiousness are interested to use tex-tual annotation more than other annotation acts as itdemands more reflexion, reasoning and cognitive ef-fort.
Figure 2: Scatter Plot showing Number of Textual Annota-tion Act against Conscientiousness scores.
4.2 Extraversion
According to results shown in table I, Extraversion isnegatively correlated with the average number of an-notation act (fig.3). The rest of the correlation valuescan be probably significant with a larger sample size.We can interpret the regression fit shown in figure 3as follow: The fit is correlated negatively which is notsurprising as extraversion is marked by pronouncedengagement with the external world where extravertstend to be energetic and talkative while introverts aremore likely to be solitary and reserved. Thus, it maybe the case that reading and annotation is an intimateactivities, we do it in private, so people who are so-cially active are less willing to practice annotation.
4.3 Neuroticism
Table I shows that neuroticism is negatively corre-lated with all the features of annotation activity. Here,
WEBIST�2014�-�International�Conference�on�Web�Information�Systems�and�Technologies
266

Figure 3: Scatter Plot showing Average Number of Annota-tion Act against Extraversion scores.
the chosen sample size is sufficient to have significantcorrelations for all the annotation features. The differ-ent correlation values are very significant which canshow the sensitivity of annotation practices to the neu-roticism trait.In other hand, one possible explanation for these cor-relations is that more Neurotic people are emotion-ally reactive and they experience negative emotionsfor unusually long periods of time which can dimin-ish the neurotics ability to think clearly and make de-cisions. Thus those who score high on Neuroticismare less eager to use annotation act as they can notactively and critically engaging with the content for along periods of time.
Figure 4: Scatter Plot showing Total Number of AnnotationAct against Neuroticism scores.
4.4 Openness and Agreeableness
Unfortunately, the correlation values related to theOpenness and Agreeableness traits are very low. Butwe can not reject definetly the hypothese of predictionof these traits from annotation activity. We may ob-tain significant values if we increase the sample size.As an exemple, the p-value of the regression fit ofthe Average Number of Annotation Act against theAgreeableness traits is p = 0:076. This value can beameliorated with a larger sample size.
Figure 5: Scatter Plot showing Number of compoundingAnnotation Act against Neuroticism scores.
5 PREDICTING PERSONALITY
Previously we examined the correlations betweeneach of Big Five personality dimension and anno-tative activity features. Now, we are interested tomake predictions about a subject’s personality basedon multiple annotation features. First of all, we usedthe multivariate linear regression to predict each per-sonality trait using the annotation features. Next, weused the coefficient of multiple determination R2 tomeasure the strength of fit. Also, we measure theF-test to verify the statistical significance of the col-lective influence that have the annotation features onthe personality traits. Thus, larger values of the F-teststatistic provide stronger evidence against H0
4. To re-ject H0 the value of the F-test should exceeds a criticalvalue calculated as follow:
F =R2=k
(1�R2)=[n� (K +1)]
Where k is the number of explanatory variables in ourmodel which corresponds to the number of annotationactivity features(K=6)and n represents the sample size(n=120). So the Fobserved is compared against a criticalF with 6 degree of freedom in the numerator and n-7degrees of freedom for error in denominator. In ourcase Fcritical=2.18 for alpha level5 of 0.05. Resultsshown in table II indicate that the null hypothesis isrejected for two cases. In fact, Neuroticism and Con-scientiousness can be predicted with reasonable ac-curacy using features of annotation activity, whereasother traits are more difficult to be predicted using an-notations. Prediction regarding Conscientiousness isreasonably accurate, with R2 value of 0.12, Fobserved
4The null hypothesis states that there is no relationshipbetween annotation activity features and personality traits.
5The alpha level is defined as the probability of what iscalled a Type I error in statistics. That is the probability ofrejecting H0 when in fact it was true.
Prediction�of�Human�Personality�Traits�From�Annotation�Activities
267

value of 2.52 which exceeds the Fcritical value and P-value of 0.03 which is lower than the a value whereP-value is the probability the F-test statistic is largerthan the observed F-value. For Neuroticism we ob-tained the model with the best fit, with an R2 valueof 0.14, Fobserved value of 3.11 and P-value of 0.01,indicating quite accurate a prediction. The model forExtraversion has a lower fit and the model for Agree-ableness is even less accurate. It seems that Opennessis the hardest trait to predict using annotation activityfeatures.Table 2: Predicting personality traits using annotation ac-tivity features through multivariate linear regression.
Trait R2 F test P-valueOpenness 0.03 0.57 0.76
Conscientiousness 0.12 2.52 0.03Extraversion 0.07 1.32 0.25
Agreeableness 0.05 1.03 0.41Neuroticism 0.14 3.11 0.01
6 DISCUSSION
In this study we show that Neuroticism and Conscien-tiousness traits are correlated with annotation activityfeatures. We expect a larger sample size can be help-ful to verify the correlation of the other human traitsto annotation practices.
Our findings are based on pen-and-paper approachwhich is qualified by its relative ease with which thereader may interact with a document in an intuitiveand familiar manner.
Recent researchs endeavor to replace the ”pen-and paper” pardigm for the annotating needs. Dif-ferent systems and tools of annotation are developedsuch as: iAnnotate (Plimmer et al,2010), u-Annotate(Chatti et al,2006), YAWAS6, iMarkup (2013), etc.Such tools enable readers to annotate their digital doc-uments with free form annotations similarly to ”pen-and paper” case. iAnnotate for example is an anno-tation tool for android system and it enables users toadd annotations with the pencil, highlighter, and notetools.
Recently we intend talking about new products forreading such as the tablet. With the aid of such de-vices, the user may interact easily with a digital docu-ment and enter her annotations as he do in the case of”pen-and-paper”. Thus, our findings is promising andoriginal to be applied in such digital areas.
6Yawas is a free web annotation tool for Firefox andChrome built on top of Google Bookmarks. Yawas enablesyou to highlight text on any webpage and save it in yourGoogle Bookmarks account.
We believe it’s the occasion to develop a systemto attract those that have a curiosity to use anno-tation platforms and practices - from end users in-cluding scholars, scientists, journalists, public ser-vants...etc. We expect our system enables readers tointeract actively with their reading materials via an-notation practices. Our goal is to use the traced anno-tations on the digital document to infer the annotatorpersonality traits. Thus the expected system shouldcontain free form annotation tool easy to be used, beable to infer user personality traits from captured an-notation activity and refines the user traits profile byreference to new captured annotations. Based on themodelled profile we expect our system be able to offerservices to users such as friendship recommendationbased on similarity of users personality, customizinguser interface using such predefined personas, sharingannotated documents...etc.
To achieve the personalization process we need toknow certain user’s features. Several research worksprove that prediction of personality traits reveals alot about a user’s features. These findings was ap-plied in several domains such as recommender sys-tems (Nunes et al,2008) (Roshchina et al,2011) andthe results is interesting.
The annotation as an unselfconscious practiceconstitutes a credible source of knowledge. In(Kalboussi et al,2013) the annotation activity is usedto invoke the appropriate Web services to users. Thisproves that annotation is rich enough to be used dif-ferently.
In this paper we use annotation to infer suchreader traits. That is a promising work and representsa new tendency to model user personality from humanbehaviour.
In other hand, let’s be objective, there are somelimitations to this work. The most important issue isthe sample size as we expect more significant resultswith a larger sample. This limitation may be due tothe dependency to ”pen-and-paper” approach whichprevents us to benefit from the population of readersover the web. In addition, people are not interestedto participate in our experimentation unless they aremotivated. We expect resolving these issues in futureworks.
Finally, our work is the first step to study the rela-tion of reader annotation practices to human person-ality traits. So much perspectives can be subjects offuture works such as studying factors which are likelyto influence annotating behaviour such as familiaritywith annotation tools and interest in the content topic.Also our research can be extended to study the pos-sibility to predict human traits through social annota-tions. These avenues and others are very interesting
WEBIST�2014�-�International�Conference�on�Web�Information�Systems�and�Technologies
268

and represent an opened future directions which needsmore investigations.
7 CONCLUSION
In this paper, we have shown that such users’ per-sonalities traits can be predicted from their annota-tion practices. With this ability of prediction manyopportunities are opened which suggests future direc-tions in variety of areas such as user modeling, recom-mender systems, user interface design and so on areasrelative to personalization research domain. Further-more, this work bridges the gap between the readingand the personality research domains and it remainsan open research questions to see whether personalitycan also be predicted using other potentially featuresof reading activity as well as the influence of such en-vironmental factors on human annotation behaviour.
REFERENCES
Agosti,M. Ferro,N., 2003. Annotations: Enriching a Digi-tal Library. In: Proceedings of the 7th European Con-ference (ECDL) Trondheim, Norway. Springer Pages88-100.
Bachrach,Y. Kosinski,M. Graepel,T. Kohli,P. Still-well,D.,2012. Personality and Patterns of FacebookUsage. In: Web Science12 Proceedings of the 3rdAnnual ACM Web Science Conference. ACM NewYork, NY, USA, Pages 24-32.
Burger, J. M., 2011. Personality. Editor Wadsworth, USA.Barrick, M. R. Mount, M.K., 1991. The big five personal-
ity dimensions and job performance: a meta-analysis.Personnel psychology, Volume 44, Issue 1, Pages 126.
Chatti, M. A. Sodhi,T. Specht, M. Klamma,R. Klemke,R.,2006. u-Annotate: An Application for User DrivenFreeform Digital Ink Annotation of E-Learning Con-tent. In: Proceedings of the Sixth IEEE Interna-tional Conference on Advanced Learning Technolo-gies (ICALT), Washington, DC, USA. Pages 1039-1043.
Eswaran,S. Aminul Islam,Md. Dayang Hasliza,M.Y., 2011.A Study of the Relationship between the Big Five Per-sonality Dimensions and Job Involvement in a ForeignBased Financial Institution in Penang. In: Interna-tional Business Research. Vol. 4, No. 4.
Johnson, J.A. The IPIP-NEO: InternationalPersonality Item Pool Representationof the NEOPI-R, viewed 8 June 2013,http://www.personal.psu.edu/ j5j/IPIP/ipipneo300.htm
Golbeck, J. Robles,C. Edmondson, M. Turner,K., 2011.Predicting Personality from Twitter. In: Privacy, Se-curity, Risk and Trust PASSAT, 2011 IEEE Third In-ternational Conference on Privacy, Security, Risk, and
Trust, and 2011 IEEE Third International Conferneceon Social Computing.
Kalboussi, A. Mazhoud, O. Hadj Kacem,A.,2013. Annota-tive Activity as a Potential Source of Web Service Invo-cation. In: Proceedings of the 9th International Con-ference on Web Information Systems and Technolo-gies (WEBIST), Aachen, Germany. SciTePress Pages288-292.
Nunes, M.A. Cerri,S.A. Blanc,N., 2008. Improving Rec-ommendations by Using Personality Traits in UserProfiles. In: International Conferences on KnowledgeManagement and New Media Technology, Graz, Aus-tria.
Nunes, M.A. Cerri,S.A. Blanc,N., 2008. Towards User Psy-chological Profile. In: IHC ’08 Proceedings of theVIII Brazilian Symposium on Human Factors in Com-puting Systems. ACM Pages 196-203.
Nunes,M.A.,2008. Recommender Systems based on Person-ality Traits. PhD Thesis, University of MONTPEL-LIER 2.
Marshall, C., 2010. Reading and Writing the ElectronicBook.. Editor Gary Marchionini, University of NorthCarolina, Chapel Hill.
Plimmer, B. Hsiao-Heng Chang, S. Doshi, M. Laycock,L.Seneviratne,N., 2010. iAnnotate: Exploring Multi-User Ink Annotation in Web Browsers. In: Proceed-ings of the 11th Australasian User Interface Confer-ence (AUIC). ACM Pages 52-60.
Peabody, D. De Raad, B., 2002. The Substantive Natureof Psycholexical Personality Factors: A ComparisonAcross Languages. Journal of Personality and SocialPsychology, vol 83, issu 10; Pages 983-997.
Roshchina, A. Cardiff, J. Rosso, P., 2011. User ProfileConstruction in the TWIN Personality-based Recom-mender System.. In: Proceedings of the Workshopon Sentiment Analysis where AI meets Psychology(SAAIP), IJCNLP. Pages 7379.
Ryckman,R. M., 2008. Theories of Personality. EditorThomson Wadsworth USA.
Schmitt, D. Allik, J. McCrae, R. Benet-Martinez,V., 2007.The geographic distribution of Big Five personalitytraits: Patterns and profiles of human self-descriptionacross 56 nations. Journal of Cross-Cultural Psychol-ogy, vol 38, Pages 173-212.
Tkalcic, M. Kunaver, M. Tasic, J. Kosir,A., 2009. Per-sonality based user similarity measure for a col-laborative recommender system. In: Proceedings ofthe 5th Workshop on Emotion in Human-ComputerInteraction-Real world challenges, Cambridge, UK.Pages 30-37.
The iMarkup Annotation Tool: a Commer-cial tool, viewed 13 September 2013,http://www.bplogix.com/support/imarkup-client.aspx
Prediction�of�Human�Personality�Traits�From�Annotation�Activities
269
Towards Automatic Building of Learning Pathways
Patrick Siehndel1, Ricardo Kawase1, Bernardo Pereira Nunes2 and Eelco Herder1
1 L3S Research Center, Leibniz University Hannover, Hannover, Germany2 Department of Informatics, PUC-Rio, Rio de Janeiro, RJ, Brazilfsiehndel, kawase, [email protected], [email protected]
Keywords: Learning Support, Learning Pathways, Digital Libraries.
Abstract: Learning material usually has a logical structure, with a beginning and an end, and lectures or sections thatbuild upon one another. However, in informal Web-based learning this may not be the case. In this paper,we present a method for automatically calculating a tentative order in which objects should be learned basedon the estimated complexity of their contents. Thus, the proposed method is based on a process that enrichestextual objects with links to Wikipedia articles, which are used to calculate a complexity score for each object.We evaluated our method with two different datasets: Wikipedia articles and online learning courses. ForWikipedia data we achieved correlations between the ground truth and the predicted order of up to 0.57 whilefor subtopics inside the online learning courses we achieved correlations of 0.793.
1 INTRODUCTION
When learning about a new topic, especially in a do-main that is new to the learner, it is not always di-rectly clear in which order relevant resources can bestbe read or learned, ensuring that the basic conceptsare introduced first, followed by more advanced ma-terial that elaborates on these concepts. This is com-monly known as Learning pathway. In fact, a learningpathway is described as the chosen route, taken by alearner through a range of learning activities, whichallows them to build knowledge progressively(Jih,1996).
Our approach exploits latent concepts insidelearning objects and, according to the estimated com-plexity of these concepts, provides a tentative order-ing for a set of learning objects. The results providelearners with an ordered learning script to follow, sim-ilar to a course in which lectures are arranged in aspecific order.
For our method, we exploit information fromWikipedia, which we use as an external knowledgebase. Wikipedia contains over 4 million articles (con-cepts) that virtually cover all concepts that are rele-vant for referencing. Further, each Wikipedia articlecontains links to reference articles and it is manuallycategorized. We exploit a set of features extractedfrom Wikipedia and its category graph to estimate thecomplexity of a given text. Our methods are based onthe assumptions that:
� Wikipedia categories contain a useful link struc-ture for ordering objects based on their difficulty;
� Concepts that are mentioned inside Wikipedia ar-ticles provide useful background knowledge forunderstanding the meaning of an article.
Our method uses the Wikipedia Miner1 toolkit fordetecting concepts in the analyzed learning objects.The detected concepts are basically text snippets thatcan be related to a Wikipedia article. All Wikipediaarticles belong to one or more categories, and thesecategories are organized in a graph structure. We usethis graph structure for identifying categories that aremore general and therefore supposedly known by auser.
The main aspect of our work is to help learnersto identify a meaningful order of given learning ma-terial. An example: in mathematics, it is obviousthat learning basic principles like summing or divid-ing should come before starting with topics such as‘curve sketching’. Essentially, the problem we aim tosolve can be summarized as follows: given a set oflearning objects, we bring them into a reasonable or-der, to help learners finding a good starting point aswell as a good way through the provided material.
The rest of the paper is organized as follows: InSection 2, we discuss related work on the topics oflearning object recommendation and ordering. Theproposed method is explained in detail in Section 3.
1http://wikipedia-miner.cms.waikato.ac.nz/
270
The experimental evaluation of the whole process ispresented in Section 4, where we used two differentdata sets to analyze the performance of our method:Wikipedia articles and online learning courses fromKhan Academy. We conclude the paper in Section 5by summarizing our main contributions.
2 RELATED WORK
A dynamic course generator is presented by Farrellet al. (Farrell et al., 2004). The course is assembledbased on keyword queries and the metadata of learn-ing objects contained in a given repository. The se-quence relies on the relationships that are manuallyassigned to each learning object and its classifica-tion (e.g. introduction, methodology or conclusion).Hence, the objects are selected and reordered accord-ing to a user query and its classification. Chen (Chen,2008) present an evolutionary approach that uses agenetic algorithm to generate a learning plan. Thegenetic approach is based on a pretest performed bystudents, where missed concepts help in creating newlearning plans, according to concepts and levels ofdifficulty of the learning objects. Our approach fol-lows the dynamic nature of these approaches, sincewe only need an input concept to determine a learn-ing object sequence.
Ullrich and Melis (Ullrich and Melis, 2009) or-der learning objects according to the learning goal ofeach student. For this, they classify objects into dif-ferent classes, such as illustrate or discover, where thecourse is assembled by a sequence of examples or indepth.
In the areas of Intelligent Tutoring Systems andAdaptive Hypermedia the adaptive sequencing iscommon technique (Brusilovsky and Millan, 2007).In scenarios where metadata for the given learningobjects is available systems like PASER (Kontopou-los et al., 2008) allow the calculation of a learningpath. In our scenario we address informal learningsituations in which this metadata is not available.
Another perspective on the sequencing of learn-ing objects is discussed by Kickmeier-Rust etal. (Kickmeier-Rust et al., 2011), where they use acombination of a storytelling model and competencestructures to identify the learning state of a student ingames. By identifying the state of the student, theypropose a new sequence of learning objects, whilekeeping the story lines. Limongelli et al. (Limongelliet al., 2009) present a framework to create personal-ized courses. The sequencing of learning objects isgenerated taking into account the cognitive state ofthe student and her learning style. Sequences change
according to the results obtained by the students, inorder to cover a concept not understood. Missedconcepts are identified through exercises during thelearning process. Instead of discovering the learningstate of students, we focus on a general applicable ap-proach. Our approach identifies which topics are nec-essary to understand a topic independent of the stu-dent. On the one hand, we do not provide personal-ized learning paths; on the other hand, we overcomethe cold-start problem where there is no a priori infor-mation of the students.
Champaign and Cohen (Champaign and Cohen,2010) introduce a work based on student developmentafter consuming a given learning object. Each studentis assessed and the most successful sequence of learn-ing objects is selected and recommended to studentswith similar profiles. Similarly, Knauf et al. (Knaufet al., 2010) focus on similar profiles to recommendsimilar learning paths. However, the similarity be-tween students is based on learning models that de-scribe the abilities of each student. A path taken bya successful student is recommended to another onewith similar characteristics. In contrast, the goal ofour approach is to recommend learning objects fol-lowing the learning goals of a student; as the studentselected a topic to learn, the sequencing is determinedby knowledge and concepts needed to understand alearning object.
3 METHOD
Our method for ordering learning objects and provid-ing background links is divided into two main steps.The first step is the annotation of the content withlinks to relevant Wikipedia articles. This step is de-scribed in more detail in Section 3.1. The second stepexploits detected topics and Wikipedia as a knowl-edge base to calculate the order of learning objectsin a given set.
3.1 Annotation and Features
For annotating the content of the given learning ob-jects, we used the Wikipedia-Miner Toolkit (Milneand Witten, 2008). The tool annotates a text (linksterms to articles) in the same way a human would doit in Wikipedia. With this information, based on thedetected topics inside a given learning object, we cal-culate a set of features that indicate the complexityand relevance of a topic. The features we use for or-dering the given objects are:
1. Number of inlinks: the number of Wikipedia arti-cles that link to the detected topics.
Towards�Automatic�Building�of�Learning�Pathways
271
2. Number of outlinks: the number of links to otherarticles contained by detected topics.
3. Text Length of Linked Articles: the length of thedetected articles.
4. Average Word Length of Linked Articles: the av-erage length of the words in the detected articles.
5. Average Word Length of Learning Object: the av-erage length of the words in the learning object.
6. Distance to Root of Linked Articles: the averagedistance to the root categories of the articles.
7. TF/IDF Score of Words in Linked Articles: theTF/IDF values of the words inside the detected ar-ticles.
8. TF/IDF Score of Words in Learning Object: theTF/IDF values of the words inside the learning ob-ject.
The first two features are chosen based on the as-sumption that the number of inlinks and outlinks areindicators of the generality of a Wikipedia article: ifmany articles link to one page, it indicates that thisconcept is a basic (popular) concept. As in (Kampsand Koolen, 2009), inlinks and outlinks are deemed tobe good indicators of an article’s relevance to a giventopic.
We also assume that the text length and the aver-age words length are good indicators about how com-plex a topic is. Another important feature is the aver-age distance of the related categories to the root nodeof the category tree. This feature is based on the as-sumption that more complex topics inside Wikipediaare deeper down in the category graph and is compa-rable to the generality feature in (Milne and Witten,2012). The TF/IDF feature represents the assumptionthat words that rarely appear inside our corpus arerelated to more complex topics. All of our featuresare represented in four ways: we use the minimum,maximum, mean and standard deviation of each ofthese features to represent one learning object, whichgives us a 32-dimensional float vector representingone learning object.
3.2 Learning to Order Objects
Our ordering approach is based on machine learningalgorithms. The given features are used to generatea model that calculates a score for every learning ob-ject. This score indicates the estimated complexity ofthe concepts within the learning object. In our ex-periments, we used four different machine learningalgorithms to produce the models. Two of these algo-rithms create a tree structure based on the given train-ing data. In addition, we used a regression model and
a Support Vector Machine for regression to calculatethe order of the given objects.
Note that the score is based on a comparison oflearning objects, and this only makes sense if thelearning objects cover related topics from a single do-main. For example, answering the question if oneshould learn a topic like ‘European History’ beforelearning ‘Linear functions’ is out of the scope of thispaper. Due to the different nature of different learningdomains, the quality of the generated order is higherwhen only a single domain is considered. Our ap-proach can help users to decide which object in agiven set might be useful to be learned first, assum-ing that the objects are related per se.
4 EXPERIMENTAL EVALUATION
In this section we evaluate the performance of theproposed method by analyzing the quality of thepredicted order of different sets of learning objects.We performed our evaluations with two differentdatasets: Wikipedia articles from different domainsand a large set of online learning courses from theKhan Academy2. We chose these datasets, as theycontain elements that can be used as a ground truththat indicates how complex a given element is. Forthe Wikipedia articles, we chose the distance from theroot node as an indicator for complexity. For the on-line course dataset, we exploited its hierarchical struc-ture, which also indicates an order in which the ele-ments should be learned.
4.1 Ordering Evaluation withWikipedia Data
In this section, we describe the outcomes of our ex-periments with Wikipedia data. We show that thereare useful correlations between the depth of a conceptin the Wikipedia tree and other features that we use todefine the complexity of a topic. For Wikipedia arti-cles there is no predefined order that defines which ar-ticle one should read first. We decided to take the dis-tance to the root node of an article as an indicator forthe complexity of the given topic. Every Wikipediaarticle belongs to at least one category, and based onthe conventions how articles are added to categories,the articles should be added to the most specific cat-egory. Due to this, articles that belong to lower levelcategories cover in most cases more specific topics.
2https://www.khanacademy.org/
WEBIST�2014�-�International�Conference�on�Web�Information�Systems�and�Technologies
272

Figure 1: Correlation between features and distance to root of Wikipedia articles.
Table 1: Average distance to the root of articles from different categories.
Category Arts Culture Geography HistoryAvg. Distance 4.329 5.468 5.726 4.436
Category Humanities Mathematics Science AverageAvg. Distance 4.869 3.321 4.1 4.06
4.1.1 Dataset
In order to understand how the different featurescorrelate and to get a first overview, we analyzedsets containing 500 articles from different WikipediaMain Topics. The main topic is defined by followingthe category graph up to the first level of categories.The categories we chose to analyze are: ‘Arts’, ‘Cul-ture’, ‘Geography’, ‘History’, ‘Humanities’, ‘Math-ematics’ and ‘Science’. All of the mentioned cate-gories also have a relation to topics taught in schooland are therefore of special interest.
4.1.2 Ordering Wikipedia Articles
For learning an order inside the Wikipedia articles,we started by analyzing the distance to the root of arti-cles belonging to different categories. As results show
in Table 1, different categories have different averagedistances to the root node. This is caused by the sin-gular link and category structures inside the differentcategories. In comparison to ‘Mathematics’, whichseems to have a relative flat category graph, we seethat the average distance to the root for ‘Geography’articles is much higher. Due to the large differencesbetween the different categories, we decided to alsoanalyze the correlations between the distance to theroot and the calculated features for each category sep-arately. The results for 6 of the features we analyzedis shown in Figure 1.
Overall we analyzed the correlations between 33different features gathered from an article and its dis-tance from the root of the category graph. Since ourprimary goal is to calculate an optimal order in whichitems should be learned, we analyzed how our fea-
Towards�Automatic�Building�of�Learning�Pathways
273

Table 2: Results of predicted distance to root for Wikipedia articles using Machine Learning Algorithms.
SMOReg M5P Additive Regression BaggingAll Articles 0.4878 0.5004 0.4422 0.5054Arts 0.3587 0.4019 0.3611 0.3836Culture 0.5253 0.509 0.5076 0.5213Geography 0.0502 0.0027 0.3591 0.3835History 0.2819 0.2516 0.267 0.2056Humanities 0.0076 0.213 0.1777 0.2373Mathematics 0.0907 0.4225 0.306 0.4313Science 0.074 0.5704 0.5309 0.5478
tures correlate with the complexity of the Wikipediaarticles. We divided the articles in two groups,based on their positions inside the category graph ofWikipedia. The first group consists of basic articles(distance<4), while the second group consists of ad-vanced articles (distance>=4). Figure 1 shows thecorrelations between these groups and six features.The singularities between the different categories in-dicate that learning objects of each category may re-quire different strategies.
It is noteworthy to mention that the feature “Dis-tance to Root (Article)” is the most important feature.This feature is calculated based on the links to otherarticles inside the article that we want to rank. Thepositive correlations of maximum, minimum, and av-erage show that articles that are already deep insidethe Wikipedia category graph tend to have links to ar-ticles that are also deep inside this graph.
Another noteworthy fact is that the average wordlength inside the ranked articles has a negative cor-relation with the group index. This indicates thatlonger words (on average) tend to be in articles thatare higher in the tree; this was not expected, as we ex-pected to find longer words in articles that are deeperin the category tree.
The correlations found between the distance to theroot of an article and the several features that we ex-tracted from the articles indicate that it is possible tocalculate an order for learning objects. To further ana-lyze how well these features can be used to predict thecomplexity of a given text, we used machine learningalgorithms to predict the actual distance to the rootof a given article based on all the extracted features.The algorithms used are all integrated in Weka33(Hallet al., 2009). We used SMOreg (Shevade et al., 2000),which is as implementation of a Support Vector Ma-chine for regression, M5P (Quinlan, 1992)(Wang andWitten, 1997), which implements algorithms for cre-ating M5 Model trees and rules, AdditiveRegres-sion (Friedman and (y X)-values, 1999), which is animproved regression-based classifier, and a Bagging-
3http://www.cs.waikato.ac.nz/ml/weka/
Algorithm (Breiman, 1996) based on a RepTree algo-rithm.
We predicted the distance for every category onits own and for all articles of the different categoriestogether. The results are based on a 10-fold cross val-idation and shown in Table 2. We see that, for differ-ent categories, different algorithms produce the bestresult. On average, the Bagging-based approach pro-duced the best results. Additionally, this algorithmshows a very low standard deviation over the differentcategories. In general, we see that the distance to theroot for articles of the topics ‘Arts’, ‘Humanities’ and‘Geography’ is harder to predict than in the cases ofarticles from ‘Science’, ‘Mathematics’ and ‘Culture’.
In summary, our first set of experiments showsthat it is possible to predict a meaningful order forWikipedia articles based on features extracted fromWikipedia’s link structure and the textual featureswithin these articles.
4.2 Evaluation with Online LearningData
In addition to the evaluation on Wikipedia Data, weperformed an analysis of the proposed method on areal world dataset of learning courses. While theoutcomes of the first experiments proved that the as-sumption that features gathered from text snippets andrelated Wikipedia articles can be used to calculate thecomplexity of given texts (by means of the distanceof the article to the root node), we now use the givenorder of a set of learning objects as ground truth.
4.2.1 Dataset
The dataset used for this series of experiments was ex-tracted from the online courses of Kahn Academy 4.We analyzed the text of 2508 different lectures relatedto the main topics ‘Math’, ‘Science’ and ‘Humani-ties’. These items are organized in a three-level hier-archy: the first level is a general category like ‘Sci-
4https://www.khanacademy.org/
WEBIST�2014�-�International�Conference�on�Web�Information�Systems�and�Technologies
274

Figure 2: Correlation between features and learning object locations inside a course.
ence’; inside this category, there are different groupslike ‘Chemistry’ or ‘Biology’. Below this level arethe actual courses, like ‘Cell division’ or ‘Oxidationreduction’. The learning objects within a course aremanually ordered in a meaningful way, representingthe order in which a student is supposed to learn.Overall, we analyzed 110 different learning courses.Statistics on these courses are shown in Table 3
We chose to take the given order of the objectsinside a course as ground truth for evaluating our ap-proach. Calculating an order for a higher level doesnot make sense for all the given objects. For exam-ple, it is hard to say that ‘Biology’ should be learnedbefore ‘Chemistry’, or that the ‘Industrial Revolution’has to be learned before ‘Art History’, but when learn-ing about matrices it seems to be useful to learn ‘Ma-trix multiplication’ before ‘Determinant calculation’.
4.2.2 Ordering Learning Objects
We started the analysis of learning objects in the sameway as we did for Wikipedia articles: by analyzingcorrelations between the order of objects and the cal-culated features. The results showed us that the orderof these items follows a more complex structure thatis hard to grasp by just taking into account the lin-ear relations between the order of the objects and thevalues of the calculated features.
Figure 2 displays the correlation values betweenlearning objects and different features. We can seethat with the shown features we do not obtain thesame correlations for all kind of topics as we got forthe Wikipedia articles. A closer look at the anno-
tated articles revealed that this is most likely causedby noise inside the transcripts of the online courses.This noise origins from the fact that the transcriptsonly represent the spoken content of the video lec-tures, which is hard to understand without the wholecontent of the video. Combined with a fair numberof non-relevant remarks that were still included in thetranscript, the quality of the extracted articles is notas good as in the previous experiment. Despite thisdrawback, for many of the features there are clear re-lations between the features and the location insidethe course. We decided to perform the same tests asbefore to calculate the actual position of the learningobjects inside the courses.
The results of this series of experiments are dis-played in Table 4. The results were produced using allmentioned features using a 10-fold cross validation.
The highest overall achieved correlation betweenthe actual position and the calculated position was at0.554, when the algorithm is applied on all availablelearning objects. When training and testing on subcat-egories of the data, we achieve results of up to 0.793.The results differ strongly between the different do-mains of the online courses. For the elements of thedomain ‘Humanities’ none of the tested algorithmsachieved good results, while the order of ‘Science’-related elements was relatively well calculated by allalgorithms. We also see that not all different algo-rithms are in the same way suitable for predicting theactual rank of the items. On average, the best resultswere achieved using the Bagging approach.
Towards�Automatic�Building�of�Learning�Pathways
275

Table 3: Statistics on the Learning Object Dataset.
Main Category #Groups #Courses Avg. Items per CourseHumanities 2 18 30.92Mathematics 5 40 33.38Science 4 47 10.76
Table 4: Results of predicted positions of learning objects using Machine Learning Algorithms.
SMOReg M5P Additive Regression BaggingAll LOs 0.292 0.338 0.408 0.554Mathematics 0.094 0.365 0.397 0.416Science 0.357 0.779 0.71 0.793Humanities 0.056 0.141 0.135 0.127Wikipedia 0.488 0.500 0.442 0.505
4.3 Discussion
The series of conducted experiments shows that theproposed method can be used for calculating the com-plexity of a given topic, based on text features and fea-tures extracted from Wikipedia. Additionally, thereare evidences that for some categories it is harder topredict its complexity than for others. Especially con-tent from the area of Humanities seems to be harderto order than content from disciplines like Mathemat-ics or Science. This might be due to a more com-plex structure of the underlying content: in Mathe-matics, the order in which elements need to be learnedis much clearer, due to the fact that concepts build upon one another. By contrast, in disciplines like His-tory, this is in most cases not true.
5 CONCLUSION
In this paper, we presented a method for orderinglearning objects based on the complexity of the cov-ered content. The proposed method is based on fea-tures that are extracted from the original items, as wellas from the knowledge stored in Wikipedia. By usingWikipedia, we exploit a knowledge base that is con-stantly updated and freely available. We analyzed theperformance of the method on two different datasets,and achieved correlations between the ground truthand the predicted values of up to 0.793 for specialtopics of learning courses. The results show that text-based learning material can automatically be sorted ina meaningful order. However, the quality varies, de-pending on the domain and the textual quality of theelements. For example, written text from Wikipediais easier to order than noisy video transcripts.
The results of the experiments also showed thatthe proposed method works better with domains likeMathematics or Science compared to domains like
Humanities or History. In general it seems to beuseful to train different models for different domainssince the values of some features vary over differentdomains.
The proposed order, as provided by our method,can help learners to find a good starting point for theirlearning pathways inside a set of learning resources.Also, it might help them to choose how to continuetheir learning process once a lesson has been learnedor a resource has been visited. In addition, the meth-ods may help teachers to analyze how the complexityof their courses evolves over time, which may helpthem to find a more suitable order for the elementsthey are teaching. A big advantage of the proposedmethod is that no metadata is required for calculat-ing an order. This allows to incorporate every kind oftextual resource into the learning process.
As future work we plan to build a model thatcan identify prerequisite knowledge for given learn-ing courses. This will allow teachers and learnersto better build a background knowledge for teach-ing/learning activities.
ACKNOWLEDGEMENT
This work has been partially supported by the Euro-pean Commission under ARCOMEM (ICT 270239)and QualiMaster (ICT 619525).
REFERENCES
Breiman, L. (1996). Bagging predictors. Machine learning,24(2):123–140.
Brusilovsky, P. and Millan, E. (2007). User models foradaptive hypermedia and adaptive educational sys-tems. In The adaptive web, pages 3–53. Springer-Verlag.
WEBIST�2014�-�International�Conference�on�Web�Information�Systems�and�Technologies
276
Champaign, J. and Cohen, R. (2010). A model for con-tent sequencing in intelligent tutoring systems basedon the ecological approach and its validation throughsimulated students. In Guesgen, H. W. and Murray,R. C., editors, FLAIRS Conference. AAAI Press.
Chen, C.-M. (2008). Intelligent web-based learning systemwith personalized learning path guidance. Computers& Education, 51(2):787 – 814.
Farrell, R. G., Liburd, S. D., and Thomas, J. C. (2004). Dy-namic assembly of learning objects. In Proceedingsof the 13th international World Wide Web conferenceon Alternate track papers & posters, WWW Alt. ’04,pages 162–169, New York, NY, USA. ACM.
Friedman, J. H. and (y X)-values, O. K. (1999). Stochasticgradient boosting. Computational Statistics and DataAnalysis, 38:367–378.
Hall, M., Frank, E., Holmes, G., Pfahringer, B., Reutemann,P., and Witten, I. (2009). The WEKA data mining soft-ware: an update. Special Interest Group on Knowl-edge Discovery and Data Mining Explorer Newslet-ter, 11(1):10–18.
Jih, H. J. (1996). The impact of learners’ pathways on learn-ing performance in multimedia computer aided learn-ing. J. Netw. Comput. Appl., 19(4):367–380.
Kamps, J. and Koolen, M. (2009). Is wikipedia link struc-ture different? In Proceedings of the Second ACMInternational Conference on Web Search and DataMining, WSDM ’09, pages 232–241, New York, NY,USA. ACM.
Kickmeier-Rust, M., Augustin, T., and Albert, D. (2011).Personalized storytelling for educational computergames. In Ma, M., Fradinho Oliveira, M., andMadeiras Pereira, J., editors, Serious Games Develop-ment and Applications, volume 6944 of Lecture Notesin Computer Science, pages 13–22. Springer BerlinHeidelberg.
Knauf, R., Sakurai, Y., Takada, K., and Tsuruta, S.(2010). Personalizing learning processes by data min-ing. In Advanced Learning Technologies (ICALT),2010 IEEE 10th International Conference on, pages488 –492.
Kontopoulos, E., Vrakas, D., Kokkoras, F., Bassiliades, N.,and Vlahavas, I. (2008). An ontology-based planningsystem for e-course generation. Expert Systems withApplications, 35(1):398–406.
Limongelli, C., Sciarrone, F., Temperini, M., and Vaste, G.(2009). Adaptive learning with the ls-plan system: Afield evaluation. Learning Technologies, IEEE Trans-actions on, 2(3):203 –215.
Milne, D. and Witten, I. H. (2008). Learning to link withwikipedia. In Proceedings of the 17th ACM con-ference on Information and knowledge management,CIKM ’08, pages 509–518, New York, NY, USA.ACM.
Milne, D. and Witten, I. H. (2012). An open-source toolkitfor mining wikipedia. Artificial Intelligence.
Quinlan, J. R. (1992). Learning with continuous classes.In Proceedings of the 5th Australian joint Conferenceon Artificial Intelligence, volume 92, pages 343–348.Singapore.
Shevade, S. K., Keerthi, S. S., Bhattacharyya, C., andMurthy, K. R. K. (2000). Improvements to the SMOalgorithm for SVM regression. Neural Networks,IEEE Transactions on, 11(5):1188–1193.
Ullrich, C. and Melis, E. (2009). Pedagogically foundedcourseware generation based on htn-planning. ExpertSystems with Applications, 36(5):9319 – 9332.
Wang, Y. and Witten, I. H. (1997). Inducing model treesfor continuous classes. In Poster Papers of the 9thEuropean Conference on Machine Learning (ECML97), pages 128–137. Prague, Czech Republic.
Towards�Automatic�Building�of�Learning�Pathways
277

A Survey on Challenges and Methods in News Recommendation
Ozlem Ozgobek1;2, Jon Atle Gulla1 and R. Cenk Erdur2
1Department of Computer and Information Science, NTNU, Trondheim, Norway2Department of Computer Engineering, Ege University, Izmir, Turkey
fozlemo, [email protected], [email protected]
Keywords: Recommender Systems, News Recommendation, Challenges.
Abstract: Recommender systems are built to provide the most proper item or information within the huge amount of dataon the internet without the manual effort of the users. As a specific application domain, news recommendersystems aim to give the most relevant news article recommendations to users according to their personal inter-ests and preferences. News recommendation have specific challenges when compared to the other domains.From the technical point of view there are many different methods to build a recommender system. Thus, whilegeneral methods are used in news recommendation, researchers also need some new methods to make propernews recommendations. In this paper we present the different approaches to news recommender systems andthe challenges of news recommendation.
1 INTRODUCTION
The increasing amount of data on the internet makesharder to find what we are really looking for. Eventhough the technologies like search engines and RSSreaders help us, it is still hard to find the informationwe really want to get. On the other hand, we are notalways sure about what we want to get. We can onlysearch for what we know and we try to find some con-nections to the new information. But this approach offinding an item that the user will like mostly dependson the coincidences, the attention of the user to in-spect the search results and it requires a lot of effort.Still there is a high possibility that the user could notfinding the most suitable item for herself at the end.
Recommender systems are built to help us to eas-ily find the most proper information on the inter-net. Unlike the search engines recommender systemsbring the information to the user without any man-ual search effort. This is achieved by using the simi-larities between users and/or items. There are manymethods to build a recommender system and thesemethods can be applied to many specific domains likeshopping (e.g. Amazon), movies (e.g. Netflix) andmusic (e.g. Pandora Radio). Since each applicationdomain has its own specific needs, the method usedfor recommendations differs.
As people are beginning to read news online moreand more, it became a challenge to find the interest-ing news articles. Most of the users spend a lot of
time to find an interesting article on a single websiteor they just read the front page news which is not ad-equate. When we consider the different news sourceson the internet, one can spend plenty of time just read-ing the news. News recommender systems aim to givethe most relevant article recommendations to users ac-cording to their personal interests and preferences.
Recommending news articles is one of the mostchallenging recommendation tasks. The news domaindiffers from other domains in many ways. For ex-ample; the popularity and recency of news articleschanges so fast over time. So focusing on the re-cency issue becomes more challenging than it is inother domains. Also some news articles may be con-nected with each other that the user may want to readthe previous news items related to the one she alreadyreads or she may want to keep informed about. Onlylearning user preferences can be an unsatisfactory so-lution to news recommendation. This is because theuser may want to read a news article when she is notreally interested in the subject but she thinks it is im-portant. For example; wanting to read the news aboutelections even if she is not generally interested in pol-itics. Also considering the high number of new arti-cles published every hour increases the complexity ofother challenges.
In this paper, we summarize the advances in thisvery special application domain of recommender sys-tems which is news recommender systems. The paperis structured as follows: Section 2 gives an overview
278

of recommender systems. Section 3 summarizes allthe challenges of recommender systems in news do-main which includes some common challenges withgeneral recommender systems. Section 4 discussesthe different approaches of news recommender sys-tems for particular challenges. Section 5, gives thediscussions. And in section 6 the conclusions are pro-vided.
2 RECOMMENDATIONTECHNIQUES
There are different methods for recommending anitem. Most commonly they are grouped into threecategories: Content-based filtering, collaborative fil-tering and hybrid. It is possible to categorize therecommendation techniques differently. For exam-ple in (Burke, 2002) five categories are proposed forrecommendation techniques. These are: Collabora-tive, content-based, demographic, utility-based andknowledge-based techniques. This categorization ofrecommendation methods is based on the backgrounddata included in the system, input data gathered fromonline user interaction and the algorithm used forthe recommendation. Since the first categorization ismore widely used we will discuss these three cate-gories. There is also an alternative semantic approach(Cantador et al., 2008), in which semantic representa-tions are added on top of other methods, we will notgo into the details of this work in the rest of the paper.
2.1 Content-based Filtering
In content-based recommendations, the properties ofitems are used to make recommendations. Itemswhich have similar properties with the user’s previ-ous preferences are recommended to the user. Thus,for this technique it is important to find the similaritiesbetween items. For example; to recommend a movieto the user, the content-based system should knowabout the user’s past movie preferences and the simi-larity between movies. As discussed in (Adomaviciusand Tuzhilin, 2005) this approach has its roots in in-formation filtering and information retrieval. Some-times information filtering is used in the same mean-ing as content-based filtering (Lee and Park, 2007).
2.2 Collaborative Filtering
In collaborative filtering, recommendations are doneby using the other people’s preferences which aresimilar to the user’s past preferences. Collaborative
filtering method can be divided into three as memory-based, model-based and hybrid methods. In memory-based (also called the neighborhood-based, user-based, heuristic-based) collaborative filtering method,user ratings are used to compute similarities betweenusers/items. By using the statistical techniques it isaimed to find a similar user to the targeted user. Af-ter the similarities found the recommendations can bedone by using different algorithms. In the model-based (also called item-based) method, a model iscreated for each user by using data mining and ma-chine learning algorithms. Probabilistic methods canbe used for recommendation predictions. Methodslike Bayesian network and clustering are included inthis method (Sarwar et al., 2001). The Hybrid col-laborative filtering method uses both model-based andmemory-based methods.
2.3 Hybrid Approach
These approaches use both content-based and collab-orative filtering. Generally the aim of these kindsof approaches is to come up with solutions to theproblems which occur with the use of a single ap-proach. There may be different combinations of us-ing the two methods together. (Burke, 2002) groupsthe hybridization methods into seven and defines howdifferent methods can be joined.
3 PARTICULAR CHALLENGESIN NEWSRECOMMENDATIONS
For many people building a recommender system canbe perceived as an easy task at first sight. But find-ing the proper item to recommend can be a tedioustask that requires access to information about the user,the items and the general context. Personal prefer-ences and interests tend to vary on the basis of age,culture, gender and personality, and they also changeover time. A successful recommender system needsto address a number of intrinsic challenges that eachconstitute a research field. In the news domain, be-cause of the dynamic properties of news items somechallenges have more importance than the others. Thechallenges we explain in this section are all relatedbut not completely specific to news domain. Mostof these challenges are the general challenges of rec-ommender systems where some of the specific chal-lenges (e.g. recency) may not be an issue in otherdomains.
� Cold-start (First Rater, Ramp Up, Early
A�Survey�on�Challenges�and�Methods�in�News�Recommendation
279
Rater) Problem: The first-rater problem is oneof the most common problems in recommendersystem collaborative filtering applications. Basi-cally, it is the problem that the system cannot rec-ommend new items if they do not have any clicksfrom other users. Or when there is no data aboutthe completely new user then it is not possible tomake recommendations for her.
� Data Sparsity: The matrices used for collabora-tive filtering can be very sparse when there arenot enough ratings from users. The possibility ofdata sparsity increases if the number of columnsor rows is much higher than the other. For exam-ple; if the number of items is much more than thenumber of users then it requires too many ratingsto fill the item-user matrix. Data sparsity causes adecrease in the performance of the system.
� Recency: Recency is one the most impor-tant challenges in news recommendation domain.Most of the users want to read fresh news insteadof old dated articles. So the importance of newsitems decreases in time. On the other hand, somenews articles may be connected with each otherthat the user may want to read the previous newsitems related to the one she already reads or he/shemay want to keep informed about that subject (Liet al., 2011).
� Implicit User Feedback: User feedbacks arequite important to make more precise recommen-dations. Without explicit feedbacks it may not bepossible to understand if the user liked the arti-cle she read or not (Fortuna et al., 2010). But itis not practical for the system to interact with theuser continuously. So the system should be ableto collect implicit feedbacks effectively while pro-tecting the user privacy.
� Changing Interests of Users: Another key chal-lenge is predicting the future interests of users forbetter recommendations because people may havechanging interests (Liu et al., 2010). For some do-mains like movie or book recommendations, thechange of user interest happens more slowly. Butfor the news domain it is really hard to predict thechanges. Also some people may read the newsnot because he/she interested in the topic in gen-eral but because she found it important.
� Scalability: Recommender systems are aimed toserve many users, sometimes millions of users(Das et al., 2007) at a time. Also the numberof items to be recommended can be very high.To build a really useful recommender system itis needed the system to be fast. In different newssources on the internet it is possible to find tens of
new headlines within an hour. So in this dynamicenvironment of news, the news recommender sys-tem should have a fast and real time processingcapabilities (Li et al., 2011). Independent fromwhich approach is used, scalability is one the mostimportant problems of recommender systems.
� Unstructured Content: For the systems whichrequire content information, it is hard to analyzethe content, especially for the news domain. Forbetter news recommendations, news items shouldbe structured and machine readable (Saranya.K.Gand Sadhasivam, 2012).
� User Modeling/profiling (Knowledge of UserPreferences): User profiling is an important com-ponent of recommender systems. To make moreindividual specific recommendations it is neededto construct a user profile. As it is stated in (Liuet al., 2010), (Das et al., 2007), (Saranya.K.G andSadhasivam, 2012) there are many different ap-proaches for user profiling.
� Gray Sheep Problem: Since collaborative fil-tering recommends items according to the user’scommon interests with other users, it is not pos-sible to recommend proper items to people whosepreferences do not consistently agree or disagreewith any group of people (Su and Khoshgoftaar,2009). When the total number of users increases,the possibility of this problem occuring decreases(Borges and Lorena, 2010).
� Serendipity (Over-specialization, Portfolio)Problem: This is the problem when the systemrecommends similar or the same items withthe already recommended ones. For the newsdomain, a news item written differently in dif-ferent news sources may be recommended bythe recommender system as different articles. Itis obvious that the users would not be happy toget the same or similar recommendations. Thesystem should always be able to discover newitems to recommend by avoiding the same items.In (Iaquinta et al., 2008) the problem is discussedin detail for content-based systems but it is alsoa problem for collaborative filtering systems(Borges and Lorena, 2010).
� Privacy Problems: To make proper recommen-dations to a user, the system should know aboutthe users’ past preferences, interests and even therelations with other people. This requires the stor-age of detailed data about the user and the analysisof this data that can cause privacy issues (Garcinet al., 2013).
� Neighbor Transitivity: Neighbor transitivity oc-curs when the database is very sparse. Even if
WEBIST�2014�-�International�Conference�on�Web�Information�Systems�and�Technologies
280

there are two users who have similar interests, thesystem cannot detect them because of the lack ofratings they have on similar items (Su and Khosh-goftaar, 2009).
� Synonymy: Same items can be named differentlyby separate resources and it is not possible for ma-chines to understand that they refer the same item.For example; even if the “children’s movie” and“children’s film” have the same meaning, they canbe treated as different items by the recommendersystem (Su and Khoshgoftaar, 2009).
4 APPROACHES OF NEWSRECOMMENDER SYSTEMS
In this section we explain the different approaches tothe most addressed challenges of news recommendersystems. Some of these challenges are not completelyspecific to the news domain. But in most of the pre-vious works about news recommender systems thesechallenges are prioritized and mostly addressed. Thesummary of which approach addresses to solve whichparticular challenge can be seen in Table 1. The termN/A is used for defining that particular challenge isnot addressed or it is unknown if the challenge is ad-dressed or not in that work.
4.1 Cold-Start Problem
Since collaborative filtering finds similarities betweendifferent users’ and makes recommendations by usingthe different preferences of similar users, it is impos-sible to recommend a new item which is not evalu-ated yet. Another aspect of this problem is that it isimpossible to recommend any items for completelynew users. Cold-start problem is the most commonproblem for the applications that use collaborative fil-tering. As it is mentioned in (Liu et al., 2010) forsome researchers it is one the most important disad-vantages of collaborative filtering approach. To solvethis problem (Liu et al., 2010), (Fortuna et al., 2010)and (Lin et al., 2012) are proposed a hybrid methodusing the collaborative filtering and content-based fil-tering together. In (Liu et al., 2010), it is proposed touse the personalization for recommending new arti-cles which is building a profile for the user’s genuineinterests. In (Lin et al., 2012), to handle the cold-startproblem, the system includes the opinions of chosenexperts (who uses the social networks have significantinfluence on new users). So that the system can makerecommendations to a new user. By using the TF-IDFmethod new items can also be recommended. In (For-tuna et al., 2010), it is proposed another approach that
is grouping the users as an old or a new user accordingto the number of articles they read. For each group ofusers, a separate model is trained for predicting themost interesting news category. And the top new arti-cle from each filtered category is recommended to theuser. (Tavakolifard et al., 2013) proposes an archi-tecture which considers the users’ long term prefer-ences, short term preferences and the current context.So that cold start problem can be eliminated by us-ing the current contextual information for first recom-mendations. In (Lee and Park, 2007) it is checked thatif the user is new or not. If it is a new user than she istemporarily placed in a similar segment on the basisof demographics and the first recommendations doneaccording to the preferences of that demographic seg-ment. (Garcin et al., 2013) proposes a system whichworks for anonymous users. When a user starts toread a news item the system generates recommenda-tions and during the session of the user the system up-dates the model and makes better recommendations.
4.2 Recency
We see that nearly in all the works done on news rec-ommendation the importance of recency is addressed.In (Yeung and Yang, 2010) recency mentioned as animportant property of a recommender system and it isproposed a proactive news recommender system formobile devices. Since the environment for a mobileuser is highly dynamic it is a challenge to deliver themost proper and recent information to the user. Inthe proposed system a Hybrid P2P system is used todeliver the just-in-time information to users’ mobiledevice. A pure P2P system is not suitable for mobiledevices since it requires lots of communication withother devices. In the proposed architecture, mobiledevice connects one of the servers in the network andsends the context information. Recommendation isdone by the server (which gets the recent news articlesconstantly from RSS) by using this context informa-tion of the user which includes user profile, location,usage patterns, peer ratings etc. As a different ap-proach, (Wen et al., 2012) includes the time factor inrecommendation process. In this approach, to recom-mend a news item, time factor is taken into account asa coefficient in addition to the user interest and pref-erence models. Similarly, in (Lee and Park, 2007)weights of articles is calculated by the degree of im-portance and recency of that article. In (Fortuna et al.,2010), news categories are determined for each useraccording to the user’s preferences and the newest ar-ticle of each category is selected for recommendation.On the other hand, in (Li et al., 2011) it is constructeda news profile for news items which includes dynamic
A�Survey�on�Challenges�and�Methods�in�News�Recommendation
281

Table 1: Different works on news recommendation with the challenges they addresses to solve.
Cold-start Recency Implicit Changing User Scalability DataFeedback Interest Sparsity
(Yeung and Yang, 2010) N/A X X X N/A X(Wen et al., 2012) N/A X X X N/A N/A(Liu et al., 2010) X X X X N/A N/A(Resnick et al., 1994) N/A X N/A N/A X N/A(Lee and Park, 2007) X X X X N/A N/A(Li et al., 2011) X X X N/A X N/A(Das et al., 2007) N/A X X X X N/A(Fortuna et al., 2010) X X X N/A N/A N/A(Tavakolifard et al., 2013) X X X X N/A N/A(Saranya.K.G and Sadhasi-vam, 2012)
N/A X X X X X
(Garcin et al., 2013) X X X X X N/A(Lin et al., 2012) X N/A N/A N/A N/A X
characteristics like recency and popularity. (Liu et al.,2010) considers the news trends to make proper rec-ommendations. Since news trends mostly composedof recent news it can also be taken as a challenge ofrecency.
4.3 Implicit Feedback
To predict the future interests of a user and to makeproper recommendations, the system needs to knowthe past interests of the user. There are two ways oflearning about the past interests of a user: Explicit andimplicit feedbacks. To collect explicit feedbacks it isneeded to interact with the user continuously and askif the user liked the item or not, how much she likedit and maybe other questions about the system in gen-eral. Both for the users and for the system it is notpractical to continuously interact with the user. Espe-cially in mobile devices it is hard to manually collectpersonal information (especially textual information)from the user. (Yeung and Yang, 2010) So it is desiredto make user profiling and filtering automatically. Thesystem should be able to collect implicit feedbacks ef-fectively while protecting the user privacy. In (Garcinet al., 2013), it is stated that to overcome the lack ofdata about the users most systems require the usersto have logged in the system which can cause privacyissues. Implicit feedbacks are mostly taken from thelog analysis of users’ history. In (Liu et al., 2010), topredict the future user interests, a large-scale log anal-ysis is done over the registered users’ history data andthe change of user interests are observed. Similarly in(Wen et al., 2012) user’s interest and preference mod-els are constructed by using the user’s navigationaldata. Also in (Tavakolifard et al., 2013) the user’sbehaviors are used for detecting some preferences ofthe user. In (Lee and Park, 2007) regular analysis isdone over the history of the user and the system learns
about various preferences.
4.4 Changing User Interest
It is known that as time passes the interests of peoplechange. The preferences of people about movies, mu-sic or books generally show a slight difference withinshort periods of time. But in the news domain it isagain very different from other domains. The newsreading preferences of people can be affected by ongoing circumstances in the world as well as their age,cultural level and even their mood. So, predictingfuture interests of users can be a real challenge fornews recommendation. (Liu et al., 2010) addressesthis challenge and proposes an architecture to predictthe future user interests. To do this a hybrid newsrecommender system is proposed where a large-scalelog analysis is done over the registered users’ past ac-tivities. Click distribution over different news cate-gories is computed both for individuals and groups ina monthly basis and the change of user interests areobserved. For prediction of user interests, Bayesianframework is used. Then the predictions are used ininformation filtering method. To make proper rec-ommendations it is combined with the existing col-laborative filtering method. In (Lee and Park, 2007),the change of user interests are tracked by observingand comparing the long-term and short-term prefer-ences. The comparison of coefficients of long-termand short-term preferences changes the weight of cat-egory preferences. So if there is a change in the cat-egory preference of a user over time, it can be usedfor making proper recommendations. (Wen et al.,2012) creates a model for the user’s degree of inter-est to a specific topic by analyzing the navigationaldata (frequently visiting a web page related with aspecific topic shows the user is interested in that sub-ject) and then it is updated as the user keeps browsing
WEBIST�2014�-�International�Conference�on�Web�Information�Systems�and�Technologies
282

web pages. To keep track of the changing user in-terest (Saranya.K.G and Sadhasivam, 2012) proposestwo kinds of user profiles: Static and dynamic userprofiles. Static user profile includes the user’s sign upinformation like user name and favorite topic wherethe dynamic user profile is constructed by using theimplicit user data in every session.
4.5 Scalability
Since scalability problem applies to every computerrelated system it is also one of the most importantchallenges in recommender systems. If we want tobuild a useful recommender system it is obvious thatit must be scalable. In news domain, scalability prob-lem combines with other challenges which makes thenews recommenders more challenging to build. In (Liet al., 2011) it is aimed a scalable news recommenda-tion system by clustering the news articles and elim-inating the unnecessary similarity computations. Sothat the system spends less time for computation andcan response faster. In (Das et al., 2007) to be able toserve millions of users they proposed a new MinHash(a probabilistic clustering method) based user clus-tering algorithm, redesigned the PLSI (ProbabilisticLatent Semantic Indexing, a model for performingcollaborative filtering) as a MapReduce (a model forcomputing large scale data on clusters) computationand used item covisitation technique (a method fordetermining the user-item relations) for a more scal-able system. (Saranya.K.G and Sadhasivam, 2012)discusses the need of scalability in efficient recom-mender systems. And the Hadoop framework handlesthe issues like reliability and scalability in their ap-plications. Another different approach for news rec-ommendation includes context trees. In (Garcin et al.,2013), it is discussed the scalability problem does notoccurs within this approach since it requires only onetree and the tree structure is very limited because ofthe applied context constraints.
4.6 Data Sparsity
Even though it is one of the most important chal-lenges of collaborative filtering method, data sparsityis not addressed in most of the news recommendersystem approaches. Data sparsity occurs when thenumber of users or items are much higher than theother one. In this case when the user-item matrixis constructed, the matrix would be very sparse. In(Yeung and Yang, 2010), it is discussed that usingBayesian Network makes it easy to eliminate the datasparsity. On the other hand in (Saranya.K.G and Sad-hasivam, 2012) HBASE (a non-relational distributed
database) is used to store the data where it can pro-vide fault tolerant storage for sparse data. Anothersolution for data sparsity is to use the hybrid approach(Lin et al., 2012).
5 DISCUSSION
News recommendation is a specific domain in rec-ommender systems which has special challenges andcharacteristics. Even though some of the challengesare shared with recommender systems in general, oth-ers may require different approaches to solve. As itis seen in Table 1, different works addresses to solveparticular challenges. We see that all the approachestry to come up with solutions to as much challengesas possible. Some of them highlights one or two chal-lenges and addresses the others as secondary chal-lenges.
Since they are addressed and solved nearly in allof the works, recency and implicit feedback chal-lenges seem the easiest ones to solve. For recency,most approaches prefer to recommend the latest head-lines. Calculating the recency by using a coefficientwhich decreases in time is also another commonlyused solution (Wen et al., 2012), (Lee and Park,2007). Implicit feedback is also one of the most ad-dressed challenges. It highly depends on the data ex-traction from users’ navigational history or log anal-ysis. The analysis and storage of this huge amountof data about users can cause privacy issues when itis required the users to log in to the system (Garcinet al., 2013). Also it reduces the scalability which isanother important challenge. As we can see in Table1, nearly all approaches have solutions for these twochallenges. On the other hand, we see that scalabilityand data sparsity are the challenges which less solu-tions are offered. For some approaches like (Tavako-lifard et al., 2013) data sparsity challenge is not avail-able since it is a problem only for collaborative filter-ing method. It is also possible to eliminate the prob-lems which belong to only one of methods by usinghybrid systems.
As we can see in Table 2, some of the methodshave minor differences but even though there are sim-ilarities between methods some approaches like con-text tree approach (Garcin et al., 2013) really differfrom others. Some approaches include only one ofthe filtering methods where others include both ofthem (hybrid methods). In approaches that use hybridmethod, it is possible to see that they use or proposedifferent algorithms. (Yeung and Yang, 2010) pro-poses a new method for news ranking which is calledAHP (Analytic Hierarchy Process) model. AHP of-
A�Survey�on�Challenges�and�Methods�in�News�Recommendation
283

Table 2: Methods used in different news recommender systems.
Type Algorithm LogAnalysis
(Yeung and Yang, 2010) Hybrid Bayesian Network, AHP X(Wen et al., 2012) Hybrid TF-IDF, Naive Bayes Model X(Liu et al., 2010) Hybrid Bayesian framework X(Resnick et al., 1994) Collaborative
filteringMatrix Correlation -
(Lee and Park, 2007) Collaborativefiltering
Specific equations used for calculations X
(Li et al., 2011) Hybrid LSH (Locality Sensitive Hashing) MinHash, NLP,LDA (Latent Dirichlet Allocation)
X
(Das et al., 2007) Collaborativefiltering
For model-based - Item covisitation, for memory-based - PLSI and MinHash
X
(Fortuna et al., 2010) Hybrid For model-based - SVM (Support Vector Machine) X(Tavakolifard et al., 2013) Content-
based filteringTF-IDF, NLP, NER (Named Entity Recognition) X
(Saranya.K.G and Sadhasi-vam, 2012)
Hybrid Adaptive user profiling, dynamic neighborhood cal-culation, document ranking calculation
X
(Garcin et al., 2013) Hybrid Context tree, BVMM, LDA (Latent Dirichlet Allo-cation)
X
(Lin et al., 2012) Hybrid TF-IDF, probabilistic matrix factorization models -
fers a solution to assign weights for different rankingfactors. (Fortuna et al., 2010) proposes an SVM (Sup-port Vector Machine) (a machine learning model)based news recommender system. (Saranya.K.G andSadhasivam, 2012) proposes calculation methods foradaptive user profiling, dynamic neighborhood calcu-lation and document ranking calculation.
Using context trees for news recommendation isproposed in (Garcin et al., 2013) where it is used to-gether with LDA (Latent Dirichlet Allocation) andBVMM (Bayesian Variable-order Markov Model) al-gorithms and defined as a scalable and effective so-lution to most of the challenges. LDA is also usedin (Li et al., 2011) for the representation of topicdistributions in a text. Bayesian Network is themost widely used technique to model user interests(Yeung and Yang, 2010), (Wen et al., 2012), (Liuet al., 2010). Another technique used for user profil-ing is NLP (Natural Language Processing) (Li et al.,2011), (Tavakolifard et al., 2013). There are differenttools used for NLP technique like GATE and ApacheOpenNLP library. For news items clustering LSH(Locality Sensitive Hashing) and MinHash (a prob-abilistic clustering method, a scheme for LSH (Daset al., 2007)) techniques are used in (Li et al., 2011).MinHash is used together with PLSI (ProbabilisticLatent Semantic Indexing) in (Das et al., 2007). Incontent based filtering TF-IDF (Term FrequencyIn-verse Document Frequency) is one of the mostlyused techniques. In addition to TF-IDF, (Tavakolifardet al., 2013) uses NER (Named Entity Recognition)model to identify the names and location.
In Table 2 we can see that nearly in all of the worksit is done log (or click) analysis over the usage data.Most systems require to users log in to the system.They gather data both from the sign up process andfrom the actions of the user while she is using thesystem. The approach in (Garcin et al., 2013) doesnot require any log in to the system, thus it makesrecommendations only for the active session withoutdetermining who the user is. The other systems learnabout users and they make recommendations basedon the long term preferences of the user. By using loganalysis it is also possible to track the change of userinterests.
As the number of researches grow in recom-mender systems and specifically in news recommen-dation domain, we see that the number of hybrid sys-tems increases. Recent evaluations show that hybridsystems tend to outperform other systems.
Evaluation and quantitative comparison of differ-ent recommender systems are other challenging as-pects of recommender system research. Even thoughthere are several evaluation methods for measuringthe performance of the system, it is hard to measurethe qualitative aspects like user satisfaction. There aresome reasons which makes the quantitative compari-son of the references we addressed in this paper notpossible for us. First, they use different evaluationmetrics which are not comparable. Second, becauseof the challenges they solve are different, the systemsare not identical to each other to make quantitativecomparisons.
WEBIST�2014�-�International�Conference�on�Web�Information�Systems�and�Technologies
284

6 CONCLUSIONS
Beginning from the first half of 90’s, recommendersystem research continues to grow in different appli-cation domains. Nowadays it is not hard to see a rec-ommender system working in the background of theweb site you have visited and recommends you musicor shopping items. Even though these useful appli-cations of recommender systems exist, there are stillmany challenges for a true personalized recommendersystem. As the number of online news sources in-creases it becomes harder for an end user to find whatshe is looking for. Thus the need for a news recom-mender system increases.
In this paper, the challenges and different meth-ods of news recommendation domain are presented. Itis pointed out which approaches solve different chal-lenges and how they do this. Our current frame-work for comparing recommender systems in newsdomain deals with content-based, collaborative andhybrid recommendation approaches, though we in-tend to expand it with recent results from semanticallybased recommender systems. Including semantic rep-resentations in the recommendation process helps usto understand user needs and news content and canbe valuable when several of the challenges above areaddressed.
REFERENCES
Adomavicius, G. and Tuzhilin, A. (2005). Toward thenext generation of recommender systems: A survey ofthe state-of-the-art and possible extensions. Knowl-edge and Data Engineering, IEEE Transactions on,17(6):734–749.
Borges, H. L. and Lorena, A. C. (2010). A survey on rec-ommender systems for news data. In Smart Infor-mation and Knowledge Management, pages 129–151.Springer.
Burke, R. (2002). Hybrid recommender systems: Surveyand experiments. User modeling and user-adapted in-teraction, 12(4):331–370.
Cantador, I., Bellogın, A., and Castells, P. (2008).News@hand: A semantic web approach to recom-mending news. In Proceedings of the 5th interna-tional conference on Adaptive Hypermedia and Adap-tive Web-Based Systems, AH ’08, pages 279–283,Berlin, Heidelberg. Springer-Verlag.
Das, A., Datar, M., Garg, A., and Rajaram, S. (2007).Google news personalization: Scalable online collab-orative filtering. In WWW ’07 Proceedings of the 16thinternational conference on World Wide Web, pages271–280.
Fortuna, B., Fortuna, C., and Mladenic, D. (2010). Real-time news recommender system. In ECML PKDD’10
Proceedings of the 2010 European conference on Ma-chine learning and knowledge discovery in databases:Part III, pages 583–586.
Garcin, F., Dimitrakakis, C., and Faltings, B. (2013). Per-sonalized news recommendation with context trees.CoRR, abs/1303.0665.
Iaquinta, L., Gemmis, M. D., Lops, P., Semeraro, G., Filan-nino, M., and Molino, P. (2008). Introducing serendip-ity in a content-based recommender system. In Hy-brid Intelligent Systems, 2008. HIS’08. Eighth Inter-national Conference on, pages 168–173. IEEE.
Lee, H. and Park, S. J. (2007). Moners: A news recom-mender for the mobile web. Expert Systems with Ap-plications, 32(1):143–150.
Li, L., Wang, D., Li, T., Knox, D., and Padmanabhan, B.(2011). Scene : A scalable two-stage personalizednews recommendation system. In SIGIR ’11 Pro-ceedings of the 34th international ACM SIGIR con-ference on Research and development in InformationRetrieval, pages 125–134.
Lin, C., Xie, R., Li, L., Huang, Z., and Li, T. (2012).Premise: personalized news recommendation via im-plicit social experts. In Proceedings of the 21st ACMinternational conference on Information and knowl-edge management, pages 1607–1611. ACM.
Liu, J., Dolan, P., and Pedersen, E. R. (2010). Personalizednews recommendation based on click behavior. In IUI’10 Proceedings of the 15th international conferenceon Intelligent user interfaces, pages 31–40.
Resnick, P., Iacovou, N., Suchak, M., Bergstrom, P., andRiedl, J. (1994). Grouplens: an open architecture forcollaborative filtering of netnews. In Proceedings ofthe 1994 ACM conference on Computer supported co-operative work, pages 175–186. ACM.
Saranya.K.G and Sadhasivam, G. (2012). A personalizedonline news recommendation system. InternationalJournal of Computer Applications, 57(18):6–14.
Sarwar, B., Karypis, G., Konstan, J., and Riedl, J. (2001).Item-based collaborative filtering recommendation al-gorithms. In Proceedings of the 10th internationalconference on World Wide Web, pages 285–295.ACM.
Su, X. and Khoshgoftaar, T. M. (2009). A survey of col-laborative filtering techniques. Advances in artificialintelligence, 2009:4.
Tavakolifard, M., Gulla, J. A., Almeroth, K. C., Ingvaldesn,J. E., Nygreen, G., and Berg, E. (2013). Tailored newsin the palm of your hand: a multi-perspective transpar-ent approach to news recommendation. In Proceed-ings of the 22nd international conference on WorldWide Web companion, pages 305–308. InternationalWorld Wide Web Conferences Steering Committee.
Wen, H., Fang, L., and Guan, L. (2012). A hybrid approachfor personalized recommendation of news on the web.Expert Systems with Applications, 39(5):5806–5814.
Yeung, K. F. and Yang, Y. (2010). A proactive personal-ized mobile news recommendation system. In De-velopments in E-systems Engineering, pages 207–212.IEEE.
A�Survey�on�Challenges�and�Methods�in�News�Recommendation
285
Combining Learning-to-Rank with Clustering
Efstathios Lempesis and Christos Makris 1Department of Computer Engineering and Informatics, University of Patras, Patras, Greece
{lebesis, makri}@ceid.upatras.gr
Keywords: Ranking, Learning-to-Rank, Clustering, Relational Ranking, Web Information Filtering and Retrieval, Searching and Browsing, Text Mining.
Abstract: This paper aims to combine learning-to-rank methods with an existing clustering underlying the entities to be ranked. In recent years, learning-to-rank has attracted the interest of many researchers and a large number of algorithmic approaches and methods have been published. Existing learning-to-rank methods have as goal to automatically construct a ranking model from training data. Usually, all these methods don't take into consideration the data's structure. Although there is a novel task named “Relational Ranking” which tries to make allowances for the inter-relationship between documents, it has restrictions and it is difficult to be applied in a lot of real applications. To address this problem, we create a per query clustering using state of the art algorithms from our training data. Then, we experimentally verify the effect of clustering on them.
1 INTRODUCTION
Nowadays, due to the evolution of the web it is common knowledge that it is difficult to find the desired information, so it is important to have search engines intelligent enough to meet our demands. As the user issues queries, we deem the ranking problem for information retrieval as the demand to order the stored set of documents by relevance to these queries. Ranking appears in many information retrieval problems, such as web search retrieval, collaborative filtering, entity ranking, sentiment analysis and text summarization. There are two types of ranking problems: ranking creation and ranking aggregation (Li, 2011). Ranking creation exploits the content of the document (as it appears as a set of features) in order to create a ranked list of documents, while ranking aggregation fuses multiple ranking lists, in order to create a unified ranked list.
The ranking module is responsible for matching between queries and indexed documents. A well-defined ranking module processes incoming queries and provides a matching score between them and the stored documents. Due to the fast development of the web and the flood of information, it is also as important as ever to have efficient and effective rankers that can rank this glut of information according to the users' queries.
In recent years (Liu, 2011; Li, 2011) it has become possible to embrace machine learning
technologies in order to build effective rankers, exploiting the large number of available training data. This embracement initiated a new research area called learning to rank, that combines traditional rankers with machine learning techniques; this area has become one of the most active in the area of web information retrieval.
Learning to rank or machine-learned ranking (MLR) automatically constructs ranking models from training data in terms of a loss function; it can be phrased in different types of supervised or semi-supervised machine learning problems. The ranking model has as purpose to produce a proper ranked list in new queries by exploiting the training data lists of items with each list providing some partial order between its items. To grant this order either numerical scores, ordinal scores or binary judgments (degree of relevance) are provided. Its methods can be categorized as: the pointwise approach, the pairwise approach, and the listwise approach (Liu, 2011). These approaches differ according to the loss functions they employ. Regarding the pointwise approach, which can be considered as a classification or regression problem by learning the rank values of the documents, the input space consists of a feature vector for each discrete document and the output space consists of the relevance grades. The input space of the pairwise approach, which treats the pair of documents as independent quantities and learns a classification or
286

regression model to correctly order these pairs, consists of feature vectors of pairs of documents and the output space consists of the pairwise preference {+1,−1} between each pair of documents. The input space of the listwise approach consists of a corpus of documents related to a single query and considers them as a training example. Its output space contains the ranked list of the documents. The main problem with the pointwise and pairwise approaches is that their loss functions are associated with particular documents while most evaluation metrics of information retrieval compute the ranking quality for individual queries and not for documents. The goal of the listwise approach is to maximize the evaluation metrics such as NDCG and MAP.
A lot of the real ranking procedures actually think of the relationship between the documents, but all of the proposed learning-to-rank algorithms, which belong to any of the above approaches, do not take this into account. We could imagine this connection as the relationships between the clusters, the parent-child hierarchy etc.
Similar to the toy example in Kurland's PhD thesis (Kurland, 2006), let q = {computer, printer} be a query, and consider the documents:
d1 = computer, company, employ, salary d2 = computer, investment, employer, company d3 = taxes, printer, salary, company, employer d4 = computer, printer, disk, tape, hardware d5 = disk, tape, hardware, laptop d6 = disk, tape, floppy, cd rom, hardware
Both the documents and the query are represented using a vector space representation (Baeza-Yates and Ribeiro-Neto, 2011) and the weight for each term in a vector is its frequency within the corresponding document (or query). If we rank the documents regarding q, we may get the following ranking:
Ranked list = d4, d1, d2, d3, d5, d6 (d4 is the top retrieved document. )
However, since it is more rational to suppose that the fundamental topic of the query is “computer hardware” rather than “business”, we would like to have d5 and d6 ranked as high as possible in the list. Clustering the documents using the scheme, where each document belongs to exactly one cluster, into two clusters, could result in the following clusters: A = {d1, d2, d3}, B = {d4, d5, d6}. If we took this clustering into account and applied the cluster hypothesis then d5 and d6 would be ranked higher than d1, d2 and d3. That is the desirable outcome, since d5 and d6, though not containing any of the terms that occur in q are more close to the query's
topic(computer hardware), than d1, d2 and d3, which contain one query term, but do not seem to discuss the query topic.
As another sign of the significance of clustering in (Zeng et al., 2004) it has been mentioned that existing search engines such as Google (www.google.com), Yahoo (http://search.yahoo. com/) and Bing (www.bing.com) often return a long list of search results, ranked by their relevancies to the given query. As a consequence, Web users must sequentially seek the list and examine the titles and snippets to discern their desired results. Undoubtedly, this is a time consuming procedure when multiple sub-topics of the given query are mingled together. They propose that a possible solution to this problem is to (online) cluster search results into different groups, and to enable users to recognize their required group.
Carrot2 (http://search.carrot2.org/stable/search) is a real illustration of this approach.
The aim of present work is to investigate whether it is possible or not to integrate into the learning-to-rank algorithm's procedure, without user intervention, the information that we gain by clustering following the well known cluster hypothesis of the information retrieval area (Kurland, 2006; Gan, Ma and Wu, 2007; van Rijsbegen 1984) and examine the results of this venture. Hence, after the off-line building of the clusters and during the algorithm's function we provide to each document the bonus that corresponds to its cluster. Through this procedure we build on the assumption that a document, which belongs to one cluster, will be near the other documents of its cluster at the ranked list. In a narrow sense, we estimate that the documents, which belong to the best cluster, will be at the top of the ranked list and as a consequence we will have better ranked lists and better measure metrics.
Before concluding the introduction we describe some basic notions:
The BM25 weighting scheme (Robertson et al., 2004) is a ranking function used by search engines to rank matching documents according to their relevance to a given search query.
Mean Average Precision (MAP) (Baeza-Yates and Ribeiro-Neto, 2011) for a set of queries q1, ...qs is the mean of the average precision scores for each query.
DCG (Baeza-Yates and Ribeiro-Neto, 2011) measures the usefulness, or gain, of a document based on its position in the result list. The gain is accumulated from the top to the bottom of the result list with each result’s gain being discounted at lower
Combining�Learning-to-Rank�with�Clustering
287

positions. Precision (Baeza-Yates and Ribeiro-Neto, 2011)
is defined as the fraction of the retrieved documents that are relevant. These values are typically evaluated at a given cut-off rank, considering only the topmost results; in this case it is called precision at k or P@k.
Finally, the paper is organized as follows. The algorithms under examination are presented in Section 2. In Section 3, we present our ideas and how we implemented them, while in Section 4 we present the clusters' creation and our key findings. In Section 5 we conclude our results and discuss open problems and future work.
2 ALGORITHMS UNDER EXAMINATION
The learning-to-rank algorithm, that we enhnces in order to perform the experiments are AdaRank (Xu and Li, 2007), RankBoost (Freund, Iyer, Schapire, Singer, 2003) and RankNet (Burges, Shaked, Renshaw, Lazier, Deeds, Hamilton and Hullender, 2005).
RankBoost is a pairwise learning-to-rank algorithm and like all the boosting algorithms it operates in rounds. On each round, RankBoost calls the weak learner with a view to producing a weak ranking. Also, RankBoost holds a distribution, which is selected to accentuate different parts of the training data, which is passed on each round to the weak learner. If a pair of instances is assigned with a high weight, it indicates a great importance that the weak learner orders that pair correctly. The final ranking is a weighted sum of the weak rankings.
AdaRank is a listwise learning-to-rank algorithm and similarly like all the boosting algorithms it operates in rounds. AdaRank uses a training set as input and takes the performance measure function and the number of iterations as parameters. AdaRank runs rounds and at each round, it retains a distribution of weights over the queries in the training data, it creates a weak ranker. Initially, AdaRank defines equal weights to the queries and then at each round it increases the weights of those queries that are not ranked properly. As a result, the learning at the next round concentrates on the generation of a weak ranker that is able to work on the ranking of those ‘hard’ queries. Finally, it outputs a ranking model by linearly combining the weak rankers. The AdaRank's characteristic attribute is that for the computation of the distribution of the weights over the queries it uses the evaluation of the
documents' labels of the ranked list and not the documents' values directly.
RankNet is a pairwise learning-to-rank algorithm where the loss function, as it is obvious, is defined on a pair of documents, but the hypothesis is defined with the use of a scoring function. The target probability is defined based on the ground truth labels of the given two documents related to a training query. Thereafter, the difference between the scores of these two documents given by the scoring function is used to construct the modelled probability and the cross entropy between the target probability and the modelled probability is used as the loss function. A neural network is used as the model and gradient descent as the optimization algorithm to learn the scoring function.
3 OUR APPROACH
Intuitively, the basic insight behind our idea is centered around the hypothesis that the quality of ranking, which is the result of the learning-to-rank process, can be improved if we take into account the auxiliary information provided by the multi-way inter-relationship between all the documents.
A novel task named “Relational Ranking” (Liu, 2011) for learning-to-rank, apart from the properties of each individual document in the ranking procedure, also makes allowances for the inter-relationship between the documents. The kind of this connection determines the targeted application; for example measures of disjointedness (overlap minimization) are applied to search result diversification, while measures of content similarity for topic extraction/distillation. Generally, the ranked lists are generated by sorting the documents according to their scores output by the learned model. However, it is common sense that in some practical cases we should allow for the relationships between the documents, and it is not adequate to define the scoring function exclusively on discrete documents. The existing works on relational ranking do not only use a matrix or a graph, which must be predefined by experts, to model the relationship, but also are based on pairwise relationship. The pairwise relationship, either similarity, dissimilarity, or preference, is very restrictive and so it is very difficult to use relational ranking in a lot of real applications. For example (Liu, 2011), all the webpages in the same website have a inter-relationship. It is more rational to use a hypergraph to model such inter-relationships.
We try to cope with the above restrictions and to
WEBIST�2014�-�International�Conference�on�Web�Information�Systems�and�Technologies
288
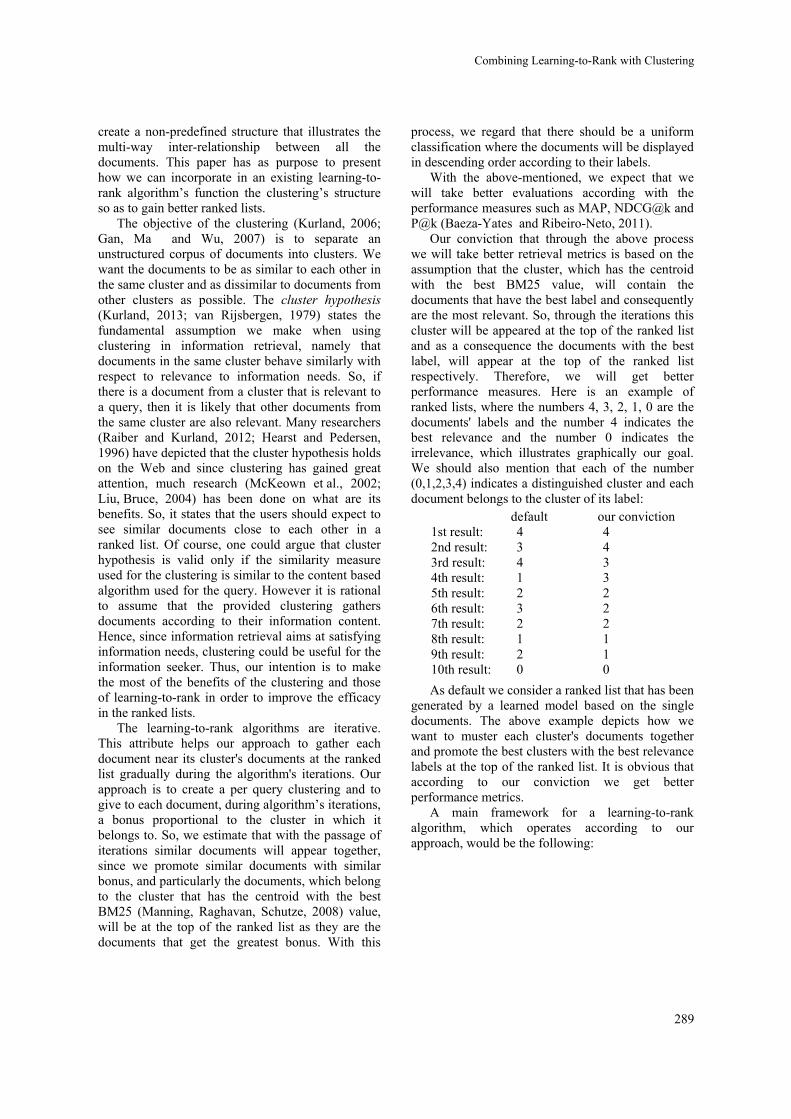
create a non-predefined structure that illustrates the multi-way inter-relationship between all the documents. This paper has as purpose to present how we can incorporate in an existing learning-to-rank algorithm’s function the clustering’s structure so as to gain better ranked lists.
The objective of the clustering (Kurland, 2006; Gan, Ma and Wu, 2007) is to separate an unstructured corpus of documents into clusters. We want the documents to be as similar to each other in the same cluster and as dissimilar to documents from other clusters as possible. The cluster hypothesis (Kurland, 2013; van Rijsbergen, 1979) states the fundamental assumption we make when using clustering in information retrieval, namely that documents in the same cluster behave similarly with respect to relevance to information needs. So, if there is a document from a cluster that is relevant to a query, then it is likely that other documents from the same cluster are also relevant. Many researchers (Raiber and Kurland, 2012; Hearst and Pedersen, 1996) have depicted that the cluster hypothesis holds on the Web and since clustering has gained great attention, much research (McKeown et al., 2002; Liu, Bruce, 2004) has been done on what are its benefits. So, it states that the users should expect to see similar documents close to each other in a ranked list. Of course, one could argue that cluster hypothesis is valid only if the similarity measure used for the clustering is similar to the content based algorithm used for the query. However it is rational to assume that the provided clustering gathers documents according to their information content. Hence, since information retrieval aims at satisfying information needs, clustering could be useful for the information seeker. Thus, our intention is to make the most of the benefits of the clustering and those of learning-to-rank in order to improve the efficacy in the ranked lists.
The learning-to-rank algorithms are iterative. This attribute helps our approach to gather each document near its cluster's documents at the ranked list gradually during the algorithm's iterations. Our approach is to create a per query clustering and to give to each document, during algorithm’s iterations, a bonus proportional to the cluster in which it belongs to. So, we estimate that with the passage of iterations similar documents will appear together, since we promote similar documents with similar bonus, and particularly the documents, which belong to the cluster that has the centroid with the best BM25 (Manning, Raghavan, Schutze, 2008) value, will be at the top of the ranked list as they are the documents that get the greatest bonus. With this
process, we regard that there should be a uniform classification where the documents will be displayed in descending order according to their labels.
With the above-mentioned, we expect that we will take better evaluations according with the performance measures such as MAP, NDCG@k and P@k (Baeza-Yates and Ribeiro-Neto, 2011).
Our conviction that through the above process we will take better retrieval metrics is based on the assumption that the cluster, which has the centroid with the best BM25 value, will contain the documents that have the best label and consequently are the most relevant. So, through the iterations this cluster will be appeared at the top of the ranked list and as a consequence the documents with the best label, will appear at the top of the ranked list respectively. Therefore, we will get better performance measures. Here is an example of ranked lists, where the numbers 4, 3, 2, 1, 0 are the documents' labels and the number 4 indicates the best relevance and the number 0 indicates the irrelevance, which illustrates graphically our goal. We should also mention that each of the number (0,1,2,3,4) indicates a distinguished cluster and each document belongs to the cluster of its label:
default our conviction 1st result: 4 4 2nd result: 3 4 3rd result: 4 3 4th result: 1 3 5th result: 2 2 6th result: 3 2 7th result: 2 2 8th result: 1 1 9th result: 2 1 10th result: 0 0
As default we consider a ranked list that has been generated by a learned model based on the single documents. The above example depicts how we want to muster each cluster's documents together and promote the best clusters with the best relevance labels at the top of the ranked list. It is obvious that according to our conviction we get better performance metrics.
A main framework for a learning-to-rank algorithm, which operates according to our approach, would be the following:
Combining�Learning-to-Rank�with�Clustering
289

Figure 1: Learning-to-Rank algorithm’s framework using our approach.
Observing the above framework we notice that the innovative idea, which stands out from the common learning-to-rank algorithms, is the clusters' creation and the bonus insertion as the algorithms' function is intact.
For all of our experiments, we chose that the given bonus should contain the BM25 value. We made this choice, because the BM25 value has been used quite widely and quite successfully across a wide range of experiments and it has been shown to be the best of the known probabilistic weighting schemes. Furthermore, it is evident that the BM25 value can completely depict the degree of correlation between the cluster and the query.
As bonus for AdaRank-CC algorithm we use the product (b/s)*f(x) where b is the BM25 value of the cluster's centroid in which the document belongs to, s is the sum of the bm25 values of the clusters' centroids that correspond to the specific query and f(x) is the document's value from the algorithm.
We decided to divide the BM25 value with the s value so as to give to each document a normalized bonus in relation to the other clusters' BM25 values.
So, before the algorithm starts we create the clustering and at the end of each iteration, after the algorithm's function is complete, we update the value of each document as following
/ ∗ (1)
As bonus for the RankBoost-CC algorithm we have experimented with many values, following the same reasoning as before, but none of these improved the efficiency of RankBoost algorithm. So, we did not get an indicative type of bonus. However, the most successful formula was (b/s)*f(x) where b is the BM25 value of the cluster's centroid in which the document belongs to, s is the sum of the bm25 values of the clusters' centroids that correspond to the specific query and f(x) is the document's value from the algorithm. The values are the same as in AdaRank-CC algorithm, but without having the desired results.
In the following we present the AdaRank-CC
and RankBoost-CC algorithms which follow the same philosophy.
AdaRank-CC/RankBoost-CC Algorithm: Clustering:clusters' creation Initialization:AdaRank's/RankBoost's
initialization For AdaRank's/RankBoost's function For each document
◦ Find the cluster in which document belongs to and get its BM25 value
◦ Update the value of the document using the above BM25 value
End for End for Output:AdaRank-CC's/RankBoost-CC's
output
As bonus for the RankNet-CC algorithm we use (b/104)*fvalue(x) where b is the BM25 value of the cluster's centroid in which the document belongs to and fvalue(x) is a document's feature value from the algorithm. At this algorithm, we use the documents' vectors updating their feature values at each iteration instead of the documents' values as we did before.
We decided to divide the BM25 value with the number 10000, because through the experiments we got the best results.
So, before the algorithm starts we create the clustering and at the end of each iteration, after the algorithm's function is complete, we update the elements of the documents' vectors as follows:
/10∗
(2)
The RankNet-CC algorithm follows the AdaRank-CC's and RankBoost-CC's philosophy, but, instead of updating the documents' value, it updates each element of the documents' feature vector.
So in contrast to the AdaRank-CC and RankBoost-CC algorithms, the RankNet-CC algorithm, based on the theory that better feature vectors provide better results, tries to update the documents' feature vectors at each iteration, promoting the documents that belong to the clusters with the best BM25 value. With the above-mentioned, at each iteration we provide better feature values at the documents' vectors, which belong to the best clusters, targeting the neural network to provide better values to these documents.
WEBIST�2014�-�International�Conference�on�Web�Information�Systems�and�Technologies
290
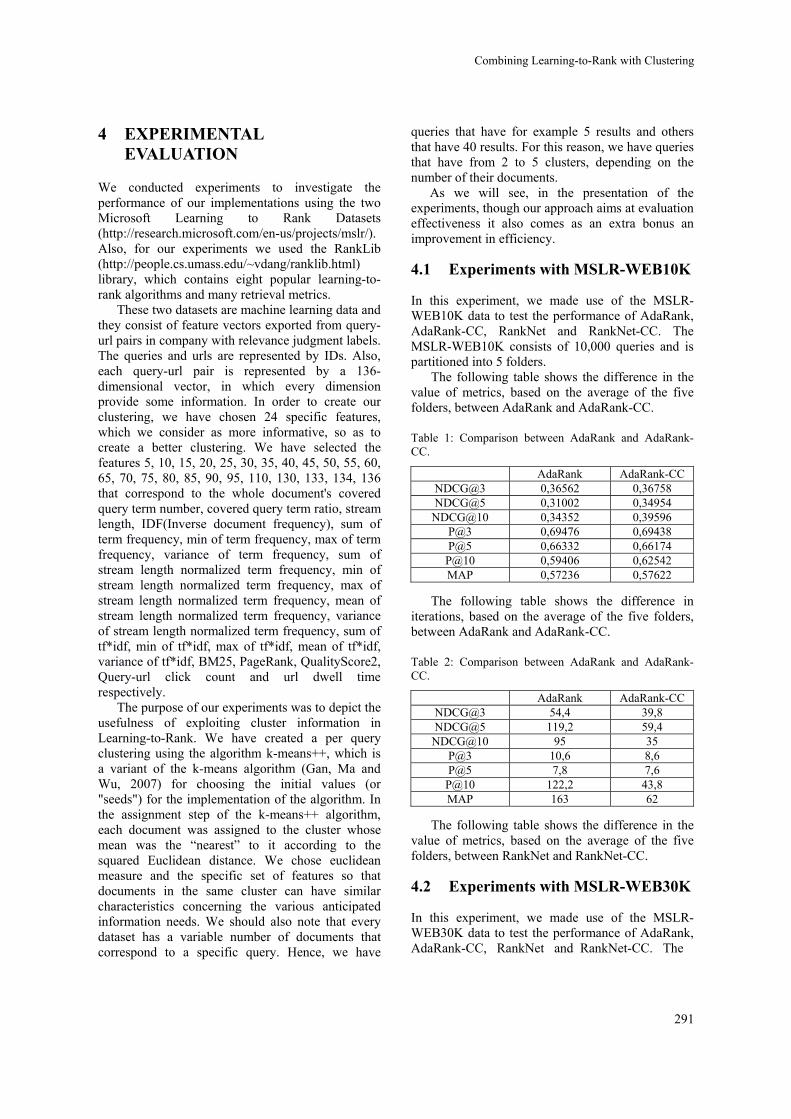
4 EXPERIMENTAL EVALUATION
We conducted experiments to investigate the performance of our implementations using the two Microsoft Learning to Rank Datasets (http://research.microsoft.com/en-us/projects/mslr/). Also, for our experiments we used the RankLib (http://people.cs.umass.edu/~vdang/ranklib.html) library, which contains eight popular learning-to-rank algorithms and many retrieval metrics.
These two datasets are machine learning data and they consist of feature vectors exported from query-url pairs in company with relevance judgment labels. The queries and urls are represented by IDs. Also, each query-url pair is represented by a 136-dimensional vector, in which every dimension provide some information. In order to create our clustering, we have chosen 24 specific features, which we consider as more informative, so as to create a better clustering. We have selected the features 5, 10, 15, 20, 25, 30, 35, 40, 45, 50, 55, 60, 65, 70, 75, 80, 85, 90, 95, 110, 130, 133, 134, 136 that correspond to the whole document's covered query term number, covered query term ratio, stream length, IDF(Inverse document frequency), sum of term frequency, min of term frequency, max of term frequency, variance of term frequency, sum of stream length normalized term frequency, min of stream length normalized term frequency, max of stream length normalized term frequency, mean of stream length normalized term frequency, variance of stream length normalized term frequency, sum of tf*idf, min of tf*idf, max of tf*idf, mean of tf*idf, variance of tf*idf, BM25, PageRank, QualityScore2, Query-url click count and url dwell time respectively.
The purpose of our experiments was to depict the usefulness of exploiting cluster information in Learning-to-Rank. We have created a per query clustering using the algorithm k-means++, which is a variant of the k-means algorithm (Gan, Ma and Wu, 2007) for choosing the initial values (or "seeds") for the implementation of the algorithm. In the assignment step of the k-means++ algorithm, each document was assigned to the cluster whose mean was the “nearest” to it according to the squared Euclidean distance. We chose euclidean measure and the specific set of features so that documents in the same cluster can have similar characteristics concerning the various anticipated information needs. We should also note that every dataset has a variable number of documents that correspond to a specific query. Hence, we have
queries that have for example 5 results and others that have 40 results. For this reason, we have queries that have from 2 to 5 clusters, depending on the number of their documents.
As we will see, in the presentation of the experiments, though our approach aims at evaluation effectiveness it also comes as an extra bonus an improvement in efficiency.
4.1 Experiments with MSLR-WEB10K
In this experiment, we made use of the MSLR-WEB10K data to test the performance of AdaRank, AdaRank-CC, RankNet and RankNet-CC. The MSLR-WEB10K consists of 10,000 queries and is partitioned into 5 folders.
The following table shows the difference in the value of metrics, based on the average of the five folders, between AdaRank and AdaRank-CC.
Table 1: Comparison between AdaRank and AdaRank-CC.
AdaRank AdaRank-CC NDCG@3 0,36562 0,36758 NDCG@5 0,31002 0,34954
NDCG@10 0,34352 0,39596 P@3 0,69476 0,69438 P@5 0,66332 0,66174 P@10 0,59406 0,62542 MAP 0,57236 0,57622
The following table shows the difference in iterations, based on the average of the five folders, between AdaRank and AdaRank-CC.
Table 2: Comparison between AdaRank and AdaRank-CC.
AdaRank AdaRank-CC NDCG@3 54,4 39,8 NDCG@5 119,2 59,4
NDCG@10 95 35 P@3 10,6 8,6 P@5 7,8 7,6 P@10 122,2 43,8 MAP 163 62
The following table shows the difference in the value of metrics, based on the average of the five folders, between RankNet and RankNet-CC.
4.2 Experiments with MSLR-WEB30K
In this experiment, we made use of the MSLR-WEB30K data to test the performance of AdaRank, AdaRank-CC, RankNet and RankNet-CC. The
Combining�Learning-to-Rank�with�Clustering
291

Table 3: Comparison between RankNet and RankNet -CC.
RankNet RankNet -CC NDCG@3 0,1573 0,1531 NDCG@5 0,1683 0,1665
NDCG@10 0,2002 0,2038 P@3 0,4716 0,4711 P@5 0,4480 0,4410 P@10 0,4431 0,4415 MAP 0,4421 0,4446
MSLR-WEB30K consists of 30,000 queries and is partitioned into 5 folders.
The following table shows the difference in the value of metrics, based on the average of the five folders, between AdaRank and AdaRank-CC.
Table 4: Comparison between AdaRank and AdaRank-CC.
AdaRank AdaRank-CC NDCG@3 0,38562 0,34059 NDCG@5 0,30028 0,33694
NDCG@10 0,34796 0,39516 P@3 0,69632 0,69736 P@5 0,66686 0,66588 P@10 0,60698 0,63182 MAP 0,57822 0,58574
The following table shows the difference in iterations, based on the average of the five folders, between AdaRank and AdaRank-CC.
Table 5: Comparison between AdaRank and AdaRank-CC.
AdaRank AdaRank-CC NDCG@3 39,2 64,8 NDCG@5 110,2 62,6
NDCG@10 84,8 31 P@3 9,1 8 P@5 18,8 6,8 P@10 86,6 46,6 MAP 169 51,8
The following table shows the difference in the value of metrics, based on the average of the five folders, between RankNet and RankNet-CC.
Table 6: Comparison between RankNet and RankNet -CC.
RankNet RankNet -CC NDCG@3 0,1558 0,1593 NDCG@5 0,1686 0,1690
NDCG@10 0,2019 0,2043 P@3 0,4706 0,4718 P@5 0,4475 0,4433 P@10 0,4422 0,4410 MAP 0,4435 0,4467
4.3 Inference from the Experiments
Regarding the AdaRank-CC, which is an algorithm that doesn't use directly the documents' values with the additional bonus in its function, is that exploiting the clustering and the bonus to each document during the iterations, we can get better results considering the NDCG@k, MAP and P@k metrics simultaneously in fewer iterations. More precisely, observing the graphs we understand that for NDCG@3 and P@3 we have approximately the same results between the default AdaRank and AdaRank-CC. But, for NDCG@5, P@5 and especially for NDCG@10, P@10 and MAP we observe that the AdaRank-CC provides better results. This observation confirms our conviction that through the bonus during the iterations we will direct the documents of the best clusters at the top of the ranked list and this also shows that we gather the documents with the best labels at the top 10 positions and as result we have better evaluation.
Hence, we conclude that our approach to combine learning-to-rank with an existing clustering can be integrated with positive results in fewer iterations at an algorithm such as the AdaRank which is positively affected by the additional bonus that are given to the documents. We infer this algorithm's improvement to the additional bonus observing the calculation of distribution at each iteration. The distribution's calculation is the following (Li, 2011):
exp ,∑ exp ,
(3)
where E(π,y) is the evaluation conducted at the list level, t is the number of iteration, π is the ranked list of documents, y is the list of documents' labels and i is the number of query.
So, the distribution's calculation is based on the evaluation of the documents' labels and not on the documents' values, given by the scoring function of the algorithm, in which we put the additional bonus.
In contrast to the above conclusions, regarding the Rank-Boost-CC, for which the documents' values have an important role in algorithm's distribution determination, we don't get better evaluation. More precisely, we can understand the effect of the documents' value, observing how the distribution is calculated. At each iteration the distribution is calculated using this formula (Liu, 2011):
,, exp
(4)
WEBIST�2014�-�International�Conference�on�Web�Information�Systems�and�Technologies
292
where Zt is a normalization factor, t is the number of iteration, x is a document, at is a parameter and h(x) is the document's value.
So, the distribution's calculation is based on the documents' values which contain the additional bonus. It is clear that, in contrast to the AdaRank as it uses the documents' labels evaluation, the documents' value plays a significant role to the distribution's value. Since, we don't get better result using the additional bonus for this kind of distribution calculation, we can deduce that the additional bonus adversely affects these algorithms such as RankBoost as it adversely distorts the calculation of the distribution.
Regarding the RankNet-CC, for which at the end of each iteration we update the elements of the documents' vectors in order to create better vectors and as consequence better results, from the results we can observe that the metrics between RankNet and RankNet-CC are approximately equal and so we can not infer reliable conclusions. Slightly better results in favour of RankNet-CC we can observe for the metrics NDCG@10 and P@10 and this remark agrees with the observation that we made for the AdaRank-CC concerning the above two metrics.
5 CONCLUSIONS
In this paper we have proposed new versions of the AdaRank, RankBoost and RankNet learning to rank algorithms, referred to as AdaRank-CC, RankBoost-CC and RankNet-CC respectively. In contrast to existing methods, AdaRank-CC, RankBoost-CC and RankNet-CC take into consideration the multi-way inter-relationship between all documents, since we have separated the unstructured set of documents into clusters using the k-Means++ algorithm.
Our basic finding in this work is that algorithms such as AdaRank-CC, for which the additional bonus doesn't affect the computation of the distribution of weights over the queries, can indeed improve both effectiveness and efficiency, as we can get better overall quality according to the well known evaluation metrics (NDCG, MAP, various levels of precision) and simultaneously decrease the number of iterations. As future work, it could be interesting to further investigate how we can get the similar results to those of the AdaRank-CC and the other algorithms that use directly the documents' values with the additional bonus in their function and consequently they are affected by them.
ACKNOWLEDGEMENTS
This research has been co-financed by the European Union (European Social Fund – ESF) and Greek national funds through the Operational Program "Education and Lifelong Learning" of the National Strategic Reference Framework (NSRF) - Research Funding Program: Thales. Investing in knowledge society through the European Social Fund.
REFERENCES
Baeza-Yates R., and Ribeiro-Neto B., (2011) Modern Information Retrieval: the concepts and technology behind search. Addison Wesley, Essex.
Burges C., Shaked T., Renshaw E., Lazier A., Deeds M., Hamilton N. and Hullender G., (2005) Learning to Rank using Gradient Descent, ICML 2005: 89-96.
Freund Y., Iyer R., Schapire R. E, Singer Y., An Efficient Boosting Algorithm for Combining Preferences. In Journal of Machine Learning Research 4 (2003), 933-969.
Gan G., Ma C. and Wu J. (2007). Data Clustering: Theory, Algorithms, and Applications.
DOI=http://dx.doi.org/10.1137/1.9780898718348. Hearst A. M., Pedersen J. O., Reexamining the Cluster
Hypothesis: Scatter/Gather on Retrieval Results, In Proceedings of ACM SIGIR '96, August, 1996, Zurich.
Kurland O., Inter-Document similarities, language models, and ad-hoc information retrieval. Ph.D. Thesis (2006).
Kurland O., The Cluster Hypothesis in Information Retrieval, SIGIR 2013 tutorial (2013).
http://iew3.technion.ac.il/~kurland/clustHypothesisTutorial.pdf.
Li H., Learning to Rank for Information Retrieval and Natural Language Processing. (2011) Morgan & Claypool.
Liu T. Y., Learning to Rank for Information Retrieval. (2011) Springer.
Liu, X, and W. Bruce C. 2004. Cluster-based retrieval using language models. In Proc. SIGIR, pp. 186-193. ACM Press. DOI: doi.acm.org/10.1145/ 1008992.1009026.
Manning C. D., Raghavan P., Schutze H., (2008) Introduction to Information Retrieval, Cambridge University Press, pp. 232-234.
McKeown et al. (2002), Tracking and Summarizing News on a Daily Basis with Columbia’s Newsblaster, In Proc. Human Language Technology Conference.
Raiber F., Kurland O. (2012), Exploring the Cluster Hypothesis, and Cluster-Based Retrieval, over the Web, ACM CIKM: 2507-2510.
Robertson, S., Zaragoza, H., Taylor, M. (2004) Simple BM25 extension to multiple weighted fields.. In CIKM 2004: Proceedings of the thirteenth ACM International Conference on Information and Knowledge Management, pages 42-49.
Combining�Learning-to-Rank�with�Clustering
293

van Rijsbergen, C. J.: Information Retrieval, 2nd edn., Butterworths (1979).
Xu J. and Li H., (2007) AdaRank: A Boosting Algorithm for Information Retrieval, SIGIR 2007: 391-398.
Zeng H.-J., He Q.-C., Chen Z., Ma W.-Y., Ma J. (2004), Learning to Cluster Web Search Results. SIGIR 2004: 210-21.
WEBIST�2014�-�International�Conference�on�Web�Information�Systems�and�Technologies
294

Automated Identification of Web Queries using Search Type Patterns
Alaa Mohasseb1, Maged El-Sayed2 and Khaled Mahar1 1College of Computing & Information Technology, Arab Academy for Science, Technology & Maritime Transport,
Alexandria, Egypt 2Department of Information Systems & Computers, Alexandria University, Alexandria, Egypt
{alaamohasseb, khmahar}@aast.edu, [email protected]
Keywords: Information Retrieval, User Intent, Web Queries, Web Searching, Search Engines, Query Classification.
Abstract: The process of searching and obtaining information relevant to the information needed have become increasingly challenging. A broad range of web queries classification techniques have been proposed to help in understanding the actual intent behind a web search. In this research, we are introducing a new solution to automatically identify and classify the user's queries intent by using Search Type Patterns. Our solution takes into consideration query structure along with query terms. Experiments show that our approach has a high level of accuracy in identifying different search types.
1 INTRODUCTION
The main goal of any information retrieval system is to obtain information relevant to information needs. Search engines can better help the user to find his/her needs if they can understand the intent of the user. Identifying such intent remains very difficult; one major task in identifying the intent of the search engine users is the classification of the query type.
There are many different proposed classifications of web queries (Morrison, et al., 2001, Broder, 2002, Kellar, et al., 2006, Baeza-yates, et al., 2006, Ashkan, et al., 2009, Lewandowski, et al., 2012, Bhatia, et al., 2012). Broder’s classification of web queries (Broder, 2002) is one of the most commonly used classifications. It classifies web queries to three main types: Informational queries, Navigational queries and Transactional queries.
Some researches (Choo, et al. 2000, Morrison, et al., 2001, Broder, 2002, Rose, et al., 2004, Kellar, et al., 2006) used different manual methods to classify users’ queries like surveys and field studies. Other researches used automated classification techniques like supervised learning, SVM…etc. (Lee, et al., 2005, Beitzel, et al., 2005, Baeza-yates, et al., 2006, Liu, et al., 2006, Ashkan, et al., 2009, Mendoza, et al., 2009, Jansen, et al., 2010, Kathuria, et al., 2010).
One drawback of the solutions that were introduced so far is that they do not take into consideration the structure of the queries. Queries submitted to search engines are usually short and
ambiguous and most of the queries might have more than one meaning, therefore using only the terms to identify search intents is not enough, two queries might have exactly the same set of terms but may reflect two totally different intents, therefore classifying web queries using the structure of the query in addition to terms and characteristics may help in making the classification of queries more accurate.
In our research, we propose a solution that automatically identifies and classifies user's queries using Search Type Patterns. Such Search Type Patterns are created from studying different web queries classification proposals and from the examination of various web logs. A Web Search Pattern is constructed from one or more terms, such terms are categorised and introduced in the form of taxonomy of search query terms.
We have developed a prototype to test the accuracy of our solution. Experimental results show that our solution accurately identified different search types.
The rest of the paper is organized as follows: Section 2 highlights the different proposed classification techniques used in web query identification. Section 3 provides detailed explanation of the extended classification of web search queries and the different type of each category. Section 4 provides a detailed description of the proposed solution. Section 5 covers experiments and results and finally Section 6 gives
295

conclusion and future work.
2 PREVIOUS WORK
2.1 Search Types
According to (Broder, 2002) web searches could be classified according to user's intent into three categories: Navigational, Informational and Transactional. Many researches (Liu, et al., 2006, Jansen, et al., 2008, 2010, Mendoza, et al., 2009, Kathuria, et al., 2010, Hernandez, et al., 2012) have based their work on Broder’s classification of user query intent. Others like (Lee, et al., 2005) used navigational and informational queries only due to lack of consensus on transactional query and to make classification task more manageable.
Rose, et al., (2004) and (Jansen, et al., 2008) extended the classification of Informational, Navigational and Transactional queries by adding level two and level three sub-categories.
Lewandowski, et al., (2012) proposed two new query intents, Commercial and Local. According to their work, the query might have a Commercial potential like the query: "commercial offering" or the user might search for information near his current location.
Bhatia, et al., (2012) classified queries to four classes: Ambiguous, Unambiguous but Underspecified, Information Browsing and Miscellaneous.
Calderon-Benavides, et al., (2010) and Ashkan, et al., (2009) proposed other classification of queries that classified user intent into dimensions and facets. These dimensions and facets are extracted from user’s queries to help the identification of user intent when searching for information on the web like Genre, objective, specificity, scope, topic, task, authority sensitivity, spatial sensitivity and time sensitivity (Calderon-Benavides, et al., 2010).
Ashkan, et al., (2009) classified query intent into two dimensions, Commercial and Non-commercial and Navigational and Informational.
Kellar, et al., (2006) classified web informational task based on three main informational goals, Information Seeking, Information Exchange and Information Maintenance.
Baeza-yates, et al., (2006) established three categories for user search goal, Informational, Not Informational and Ambiguous. Informational query when the user’s interest is to obtain information available on the web. Not Informational include specific transactions or resources like "buy",
"download"...etc. Ambiguous queries include queries that can’t be identified directly because the user interest is not clear.
Morrison, et al., (2001) classified search goals into Find, Explore, Monitoring and Collect, this classification focus on three variables: the purpose of the search, the method used to find information and the contents of searched information.
2.2 Classification Methods and Techniques
Researchers have used different manual and automated classification methods and techniques to identify users query intent.
Broder, (2002) classified user’s query manually by using a survey of AltaVista users as one of the methods to determine the type of queries, the survey was done online and users were selected randomly. Users were asked to describe the purpose of their search, queries that were neither Transactional nor Navigational were assumed to be Informational, the final results of the survey showed that 24.5% of the queries were Navigational, Informational queries accounted for 39% of the queries and transactional accounted for 36% of the queries. In addition Broder has analysed a random set of 1000 queries from the daily AltaVista log, queries that were neither Transactional nor Navigational were assumed to be Informational, results showed that 20% of queries were Navigational, 48% were Informational and 30% were Transactional.
Choo, et al., (2000) and Kellar, et al., (2006) used questionnaire survey for manual classification of queries and since participants in this kind of classification were low in number, the results can’t be considered reliable.
In addition to the questionnaire survey (Kellar, et al., 2006) conducted one-week field study to classify data using a custom web browsing and analysed the data for only 21 participants.
Rose, et al., (2004) argued that user goals can be deduced from looking at user behaviour available to the search engine like the query itself, result clicked…etc. This approach has limitation that the goal-inferred from the query may not be the user actual goal.
Lewandowski, et al., (2012) analysed click-through data to determine Commercial and Navigational queries and used crowdsourcing approach to classify a large number of search queries.
Liu, et al., (2006) also used click-through data for query type identification. Queries were randomly
WEBIST�2014�-�International�Conference�on�Web�Information�Systems�and�Technologies
296

selected and manually classified by three assessors using voting to decide queries category. This work relied on decision tree algorithm and used precision and recall to test effectiveness of the query type identification.
Lee, et al., (2005) proposed two types of features, past user click behaviour and Anchor-link distribution. Results showed that the combination of these two techniques could correctly identify the goals for 90% of the queries.
Hernandez, et al., (2012) introduced a solution that automatically classifies queries using only the text included in the query, based on the feature and characteristics described by (Broder 2002, Jansen, et al., 2008, Dayong, et al., 2010). More than 1692 queries were manually classified then two machine-learning algorithms, naïve Bayes and Support Vector Machine (SVM), were used. Results showed that the two machine-learning algorithms suited more Informational and Transactional queries; results of Navigational queries were very low with naïve Bayes and null with SVM. These Results indicate that using only the content of words in the queries is not sufficient to find all user intents.
Ashkan, et al., (2009) classified 1700 queries and manually labelled the selected queries then used ads click-through and query features to determine the query intent.
Beitzel, et al., (2005) and Baeza-Yates, et al., (2006) used supervised learning to determine query intents. In addition to supervised learning (Baeza-Yates, et al., 2006) applied unsupervised learning then combined both techniques to identify user search goal.
Jansen, et al., (2008) developed a software application that automatically classified queries using web search engine log of over a million and a half queries. Results showed that more than 80% of web queries were Informational, Navigational and Transactional queries each represent about 10% of web queries. To validate their approach 400 queries from Dogpile transaction log were randomly selected and manually coded, 74% of the queries were successfully classified and the remaining 25% were vague or multi-faceted queries.
Kathuria, et al., (2010) automatically classified queries using k-means clustering, results for this technique showed that more than 75% of web queries are Informational in nature and 12% each for navigational and transactional queries.
3 BACKGROUND
3.1 Web Search Queries Classification
The following sections describe in details each of the categories we considered in our work. These categories are based on work done by (Broder, 2002, Rose, et al., 2004 and Jansen, et al., 2008).
3.1.1 Informational Searching
Informational Searching has five sub-categories: a) Informational - Directed (I, D): the goal of
this category is to learn something in particular about a certain topic, or to answer a specific question, both open and closed ended. This category has level two sub-categories:
a.1) Informational - Directed - Open (I, D, O): this category may take many forms either a question to get an answer for an open-ended question or one with unconstrained depth or to find information about two or more topics. Examples: "why are metals shiny?" and "honeybee communication".
a.2) Informational - Directed - Closed (I, D, C): queries in this category can be a question to find one specific or unambiguous answer or to find information about one specific topic. Examples: "capital of Brazil" and "what is a prime number?"
b) Informational - Undirected (I, U): the purpose of this category is to know anything and everything about a topic, most queries in this type are related to science, medicine, history and news and celebrities (Rose, et al., 2004). Examples: "Shawn Johnson", "Vietnam war” and “hypertension".
c) Informational - List (I, L): plural query terms are a highly reliable indicator of this category (Rose, et al., 2004), the goal of this type of queries is to find a list of suggested websites or candidates or list of suggestions for further research. Examples: "list of Disney movies", "London universities", and "things to do in Atlanta".
d) Informational - Find (I, F): the goal of this category is to find or locate something in the real world like a product or service. Most product or shopping queries have the locate goal (Rose, et al., 2004), for example: "apple store location in New Jersey" and "cheap apple MacBook pro".
e) Informational - Advice (I, A): the goal of this category is to get ideas, suggestions, advice or instructions about something and may take many forms like a question. Examples: "How to download iTunes" and "writing a book".
Automated�Identification�of�Web�Queries�using�Search�Type�Patterns
297
3.1.2 Navigational Searching
Navigational Searching has two sub-categories: a) Navigational to Transactional (N, T): the
URL or website user is searching for is a transactional site. Examples: “amazon.com” and “ebay.com”.
b) Navigational to Informational (N, I): the URL or website user is searching for is an informational site. Examples: “google.com” and“yahoo.com”.
3.1.3 Transactional Searching
Transactional Searching has the following sub-categories:
a) Transactional - Obtain (T, O): the goal of this type of queries is to obtain specific resource or object, not to learn some information but just to use the resource itself. This category has the following level two sub-categories:
a.1) Transactional - Obtain - Online (T, O, O): the resources of this type of queries will be obtained online, meaning that the user might search for something to just look at it on the screen. Examples: "meatloaf recipes" and "Adele Songs lyrics".
a.2) Transactional - Obtain - Offline (T, O, F): the resources of this type of queries will be obtained offline and may require additional actions by the user, meaning that the user might search for something to print or save to use it later offline. Examples: "Bon Jovi wallpapers" and "windows 7 screensavers".
b) Transactional - Download (T, D): the resource of this type of query is something that needs to be installed on a computer or other electronic device to be useful like finding a file to download. This category has level two sub-categories:
b.1) Transactional - Download - Free (T, D, F): the downloadable file is free. Examples: "free online games" and "free mp3 downloads".
b.2) Transactional - Download - Not Free (T, D, N): the downloadable file is not necessarily free. Examples: "safe haven book download" and "Kelly Clarkson songs download".
c) Transactional - Interact (T, I): this type of queries occurs when the intended result of the search is a dynamic web service, and requires further interaction with a program or a resource. Examples: "currency converter", "stock quote”, “buy cell phones", and "weather".
d) Transactional - Results Page (T, R): the goal of this category is to obtain a resource that can be printed, saved, or read from the search engine
results page. This category has level two sub-categories:
d.1) Transactional - Results Page - Links (T, R, L): the resources of this kind of queries appear in the title, summary, or URL of the search engine results page. Example: “searching for title of a conference paper to locate the page numbers”.
d.2) Transactional - Results Page - Other (T, R, O): the resources of this kind of queries does not appear on the search engine results page but somewhere else on the search engine results page. Example: “spelling check of a certain term”.
3.2 Characteristics of Web Search Queries
3.2.1 Informational Search Characteristics
One of the major characteristics of Informational Searching is the use of natural language phrases (Jansen, et al., 2008). Queries for such search may consist of informational terms like "list" and "playlist"…etc., question words like "who", "what", "when"…etc. Searches related to Advice, help and guidelines like "FAQs" or "how to"…etc., ideas and suggestions terms, recent information and news like "weather".
Some queries consisting of multimedia like videos are considered informational like "how-to-do" videos. Topics related to science, medicine, history, news and celebrities are also considered informational, (Rose, et al., 2004).
3.2.2 Navigational Search Characteristics
Navigational Searching queries contain organization, business, company and universities name, domain suffixes like ".com",".org"…etc. also prefixes such as "www" or "http" and “web” as the source. Some Navigational queries contain URLs or parts of URLs (Jansen, et al., 2008).
Most queries consisting of people names, including celebrities, are not considered navigational. According to (Rose, et al., 2004) a search for a celebrity such as “Justin Timberlake” will result in a fan or media sites, and usually the goal or objective of searching for a celebrity is not just visiting a specific site.
3.2.3 Transactional Search Characteristics
According to (Jansen, et al., 2008) queries in Transactional Searching is related to obtaining terms like "lyrics", "recipes", "patterns"…etc., download terms like, "software"…etc. Also queries containing
WEBIST�2014�-�International�Conference�on�Web�Information�Systems�and�Technologies
298

"audio", "video" and "images” are considered to be transactional.
Queries related to entertainment terms like "pictures", "games"…etc., and e-commerce. Interact terms such as "buy", "chat", "book", "order”…etc., and file extensions like “jpeg”, “zip…etc., (Jansen, et al., 2008).
4 PROPOSED SOLUTION
Our solution mainly relies on Search Type Patterns (STPs). These patterns generalize web search queries of different types and could be used in identifying the query class and hence the user's intent. We have constructed 1182 different Search Type Patterns. Examples of these patterns are given in sections 4.1 and 4.2. Due to space limitation we couldn’t give a comprehensive listing of these patterns.
Our proposed Search Type Patterns cover all categories discussed in section 3.1 above except Navigational search sub-categories and the Transactional-Results page category. The reason of excluding these categories is because it is not possible to determine the intent of the query without performing the search and monitoring the user’s interaction with the result, which falls outside the scope of our work since our solution is not based on processing the search results. For example, if a user searches for: “UCLA University”, he might be interested in browsing the site to know more information (Navigational-to-Informational) or to register a course (Navigational-to-Transactional).
Each Search Type Pattern (STP) is composed of a sequence of term categories (tc). STP = <tc1, tc2,…, tcn>. Each term category tci contains a list of terms. The categorization of terms in our solution is mainly based on the seven major word classes in English: Verb, Noun, Determiner, Adjective, Adverb, Preposition and Conjunction. In addition to that we added a category for question words that contains the six main question words: How, who, when, where, what and which. We further extended this classification by adding two super-categories: Domain Suffixes and Prefixes. We also added sub-categories where a category may have one or more sub-categories.
Term sub-categorization is built in a way that enables the preservation of uniqueness of each Search Type Pattern. In other words, no two Search Type Patterns will have exactly the same sequence of term categories. Section 4.1 will discuss in details
how term categorization and Search Type Patterns were constructed.
Table 1 shows detail of all term categories in our solution and Figure 1 shows the taxonomy organization of these categories.
Table 1: List of Term Categories.
Category Name Abbreviation Terms Action Verb-Interact terms
AV_I Buy, Reserve, Order…etc.
Action Verb-Locate AV_L Locate, Find. Action Verb-Locate & Interact terms
AV_IL All Locate & Interact terms.
Action Verb-Download
AV_D Download
Action Verbs AV Write, create, drive…etc.
Auxiliary Verb AuxV Can, may, will…etc.
Linking Verbs LV Is, are, was…etc. Verbs V All Verbs Adjective Free Adj_F Free Adjective Online Adj_O Online Adjective Free & Online
Adj_OF Free & Online
Adjective Adj All Adjectives
Adverb Adv Almost, barely, highly…etc.
Determiners D A, An, The…etc. Conjunction Conj And, as, but…etc.
Ordinal Numbers NN_O 1st, second, 70th…etc.
Cardinal Numbers NN_C 1, 50, ten...etc. Numeral Numbers NN All numbers
Celebrities Name PN_C Phil Collins, Clint Eastwood, The Beatles…etc.
Entertainment PN_Ent Specific name of a song, movie, game…etc.
Newspapers, Magazines, Documents, Books...etc.
PN_BDN
Specific name of a Newspapers, Magazines, Documents, Books...etc.
Events PN_E Cannes film festival…etc.
Celebrities, Events, Newspapers, Entertainment…etc.
PN_BCEE All PN_C, PN_BDN, PN_Ent & PN_E
Companies Name PN_CO IBM, Microsoft, Intel...etc.
Geographical Areas PN_G London, Europe, Nile River…etc.
Places and Buildings PN_PB Eiffel Tower, National park…etc.
Automated�Identification�of�Web�Queries�using�Search�Type�Patterns
299

Table 1: List of Term Categories. (Cont.)
Category Name Abbreviation Terms Institutions, Associations, Clubs, Parties, Foundations and Organizations
PN_IOG Yale university, Warren middle school…etc.
Companies, Geographical Areas, Institutions, Places…etc.
PN_CGIP All PN_CO, PN_G, PN_PB & PN_IOG
Celebrities, Entertainment, Companies…etc.
PN_BCC All PN_BCEE & PN_CGIP
Brand Names PN_BN Coach, Pepsi, Gucci…etc.
Software & Applications
PN_SA uTorrent, Photoshop, Skype…etc.
Products PN_P iPad, Oreo cookie…etc.
Brand, Products, Software…etc.
PN_BSP All PN_BN, PN_P and PN_SA
Brand, Products, Entertainment, Companies…etc.
PN_BBC All PN_BCC & PN_BSP
History and News PN_HN Revolutionary war, American Civil war…etc.
Religious Terms PN_R Christian, Muslim, God, Allah…etc.
Holidays, Days, Months
PN_HMD Christmas, Saturday, November…etc.
Religious Terms, Holidays, Days, Months
PN_HR All PN_R & PN_HMD
Health Terms PN_HLT Specific Terms related to health & medicine.
Science Terms PN_S Specific Terms related to Science.
Health & Science Terms
PN_HS All PN_S & PN_HLT
Proper Noun PN All Proper Nouns
Database and Servers CN_DBS Weather, Dictionary…etc.
Advice CN_A Advice, ideas, instruction, suggestion, tips.
Download CN_D Download, Software
Entertainment CN_Ent Music, Movie, Sport, Picture, Game…etc.
File Type CN_File MP3, PDF…etc.
Informational Terms CN_IFT List, Playlist…etc.
Table 1: List of Term Categories. (Cont.)
Category Name Abbreviation Terms
Info. Terms, File & Entertainment
CN_EFI All CN_Ent, CN_File & CN_IFT
Obtain Offline CN_OF Wallpapers, documents…etc.
Obtain Online CN_OO Lyrics, Recipes…etc.
Obtain CN_OB Obtain Online & Offline
File, Entertainment, Informational & Obtain Terms
CN_OBEF All CN_EFI & CN_OB
History & News CN_HN History, News, War, Rumour.
Interact terms CN_I Translation, reservation…etc.
Locate CN_L Location
Site, Website, URL CN_SWU Site, Website, URL, Webpage.
Common Noun –Other- Singular
CN_OS All singular common nouns
Common Noun- Other- Plural
CN_OP All plural common nouns
Common Noun- Other
CN_O Other Common Nouns
Common Noun CN All Common Nouns
Pronoun Pron. I, Me, You…etc. Noun N All Nouns
Domain Suffix DS .com, .org, .us…etc.
Prefixes DP http, www.
Preposition PP For, of, about…etc.
How QW_How How, How far, How many, How much, How often
What QW_What What When QW_When When Where QW_Where Where Who QW_Who Who Which QW_Which Which
Question Words QW All question words
4.1 Constructing Search Type Patterns and Term Category Taxonomy
In order to construct Search Type Patterns and term categories we have used 80,000 randomly selected queries from AOL 2006 datasets. We have taken the following steps:
Step 1- parsing the 80,000 queries and automatically extracting terms in the queries.
WEBIST�2014�-�International�Conference�on�Web�Information�Systems�and�Technologies
300
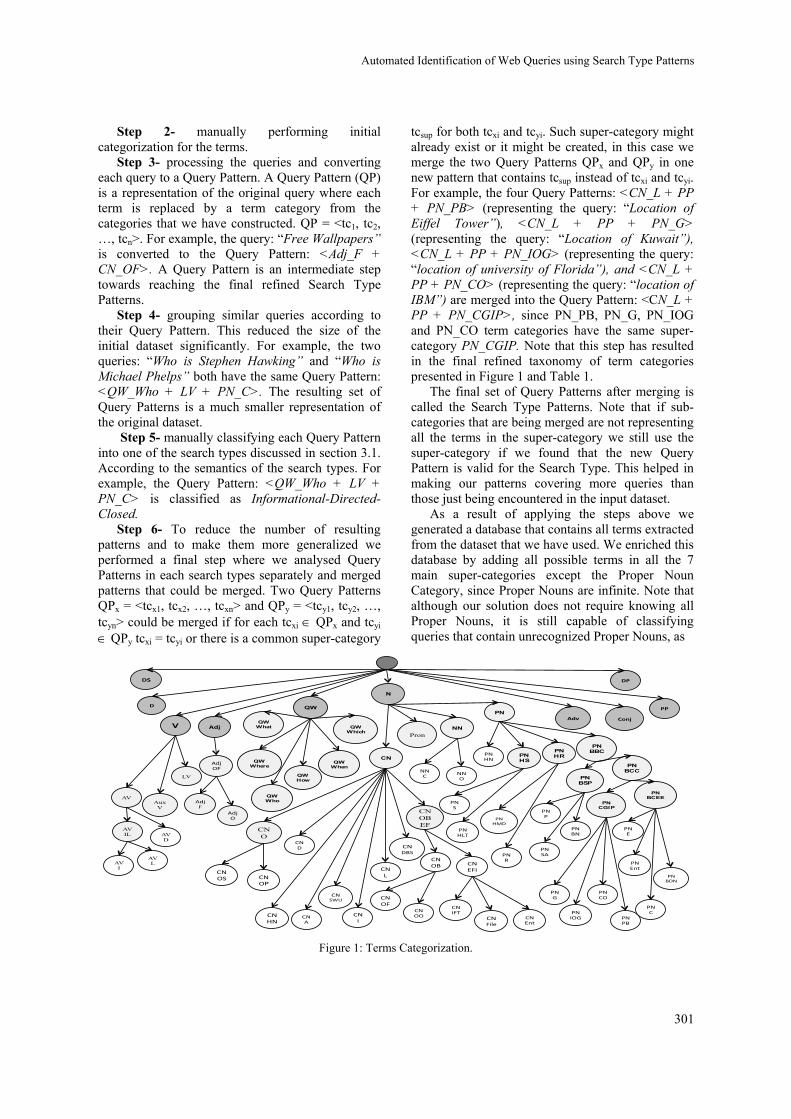
Step 2- manually performing initial categorization for the terms.
Step 3- processing the queries and converting each query to a Query Pattern. A Query Pattern (QP) is a representation of the original query where each term is replaced by a term category from the categories that we have constructed. QP = <tc1, tc2, …, tcn>. For example, the query: “Free Wallpapers” is converted to the Query Pattern: <Adj_F + CN_OF>. A Query Pattern is an intermediate step towards reaching the final refined Search Type Patterns.
Step 4- grouping similar queries according to their Query Pattern. This reduced the size of the initial dataset significantly. For example, the two queries: “Who is Stephen Hawking” and “Who is Michael Phelps” both have the same Query Pattern: <QW_Who + LV + PN_C>. The resulting set of Query Patterns is a much smaller representation of the original dataset.
Step 5- manually classifying each Query Pattern into one of the search types discussed in section 3.1. According to the semantics of the search types. For example, the Query Pattern: <QW_Who + LV + PN_C> is classified as Informational-Directed-Closed.
Step 6- To reduce the number of resulting patterns and to make them more generalized we performed a final step where we analysed Query Patterns in each search types separately and merged patterns that could be merged. Two Query Patterns QPx = <tcx1, tcx2, …, tcxn> and QPy = <tcy1, tcy2, …, tcyn> could be merged if for each tcxi QPx and tcyi QPy tcxi = tcyi or there is a common super-category
tcsup for both tcxi and tcyi. Such super-category might already exist or it might be created, in this case we merge the two Query Patterns QPx and QPy in one new pattern that contains tcsup instead of tcxi and tcyi. For example, the four Query Patterns: <CN_L + PP + PN_PB> (representing the query: “Location of Eiffel Tower”), <CN_L + PP + PN_G> (representing the query: “Location of Kuwait”), <CN_L + PP + PN_IOG> (representing the query: “location of university of Florida”), and <CN_L + PP + PN_CO> (representing the query: “location of IBM”) are merged into the Query Pattern: <CN_L + PP + PN_CGIP>, since PN_PB, PN_G, PN_IOG and PN_CO term categories have the same super-category PN_CGIP. Note that this step has resulted in the final refined taxonomy of term categories presented in Figure 1 and Table 1.
The final set of Query Patterns after merging is called the Search Type Patterns. Note that if sub-categories that are being merged are not representing all the terms in the super-category we still use the super-category if we found that the new Query Pattern is valid for the Search Type. This helped in making our patterns covering more queries than those just being encountered in the input dataset.
As a result of applying the steps above we generated a database that contains all terms extracted from the dataset that we have used. We enriched this database by adding all possible terms in all the 7 main super-categories except the Proper Noun Category, since Proper Nouns are infinite. Note that although our solution does not require knowing all Proper Nouns, it is still capable of classifying queries that contain unrecognized Proper Nouns, as
Figure 1: Terms Categorization.
V
AV
LV
AuxV
AV I
AV D
AV L
Adj
Adj F
AdjO
N
CN
NN
PN
NN C NN
O
CN A
CN I
CN DBS
CN L
CN Ent
CN File
CN IFT
CN OF
CN SWU
PN P
PN PB
PN CO
PNG
PN C PN
IOG
PN SA
PN HN
QW
QW Where
QW How
QW Which
QW Who
QW When
QW What
Pron
CN HN
CN D
CN OO
PP
Adv
D
Conj
DS DP
PN Ent
PN BDN
PN R
PN HMD
PNE
PN HLT
PN BN
PNS
Adj OF
AV IL
CNO
CN OS CN
OP
CNOBEF
CN OB CN
EFI
PN BBC PN
HR PN HS
PN BSP
PN BCC
PN CGIP
PN BCEE
Automated�Identification�of�Web�Queries�using�Search�Type�Patterns
301
we are going to illustrate in the next Section. The resulting database contains 10,440 terms classified into the classes shown in Table 1.
In addition to the term categories, we were able to identify 1182 Search Type Patterns. Table 1 and Table 2 show the distribution of these patterns by search type.
We validated our Search Type Patterns using a dataset containing 1953 queries from AOL that were manually classified and used in (Mendoza, et al., 2009).
Table 2: level 1 Search Type Patterns Distribution.
Type of search Total Informational 838 Transactional 336 Navigational 8
Table 3: Level 2 and Level 3 Search Type Patterns Distribution.
Type of search Total Informational -List 155 Informational -Find 164 Informational -Advice 121 Informational -Undirected 51 Informational -Directed -Open 113 Informational -Directed -Closed 234 Transactional -Obtain - Online 59 Transactional -Obtain -Offline 76 Transactional -Interact 28 Transactional -Download –Free 104 Transactional -Download -not Free 69
4.2 Classifying Search Engine Queries
Our solution automatically identifies and classifies user's queries by utilizing the Search Type Patterns and the term categories taxonomy presented in Figure 1. The proposed solution has three phases as shown in Figure 2:
Figure 2: Proposed System Framework.
Phase 1- query parsing: this step is mainly responsible for extracting user’s query terms. Unlike most other ir solutions, our solution does not destroy the query structure by removing stop-words and wh-question words. Such important query components are exploited in determining the query type. The system simply takes the user’s query and parses it to facilitate the mapping of each word to the right category. For example given the two queries: query 1: “what is the capital of romania?” And query 2: “list of movies by steven spielberg” as inputs, the system extracts the following terms from query 1: “what”, “is”, “the”, ”capital”, "of", “romania”, and extracts the following terms from query 2: “list”, “of”, “movies”, ”by”, “steven spielberg”.
Phase 2- Query Pattern Formulation: the system converts the query to a Query Pattern by mapping terms in the query to corresponding term categories. First the system checks for compound terms (phrases) and then it processes single terms. The system maps each term to the most specific sub-category. If a term is not found in the terms database, the system assumes that the term is a Proper Noun, since Proper Nouns are infinite and we do not maintain an exhaustive list of them. After determining term category for all terms in the user query we then process consecutive terms that were identified as Proper Nouns. We convert such sequence of Proper Nouns to a single Proper Noun since no Search Type Pattern contains consecutive independent Proper Nouns.
The result of applying step 2 to query 1 is: "What"QW_What, "is"LV, "the"D, "capital"CN_OS, "of"PP, "Romania"PN_G. As a result, the Query Pattern for query 1 is: <QW_What + LV + D + CN_OS + PP + PN_G>. For query 2, if the terms database contains "Steven Spielberg”, the system will be able to identify "Steven Spielberg” as a phrase and to determine its type as PN_C, hence the system will generate this Query pattern for query 2: <CN_IFT + PP + CN_Ent + PP + PN_C>. If "Steven Spielberg” was not contained in the terms database, the system assigned "Steven”PN and “Spielberg”PN, since both were not identified as any other type. The system then constructs this initial Query Pattern for query 2: <CN_IFT + PP + CN_Ent + PP + PN + PN> then it is modified to <CN_IFT + PP + CN_Ent + PP + PN> by merging the two consecutive Proper Nouns into a single Proper Noun.
Phase 3- Query Type Classification: In this step the system attempts to match the Query Pattern generated in step 2 with the most appropriate Search
Term Category
Search Type
Patterns
Query Parsing
Query Pattern Formulation
Query Type Classification
User’s Query Query Type
! " #! #
! " #! $#
! " #%&#
! "' #
! " #%#
! " #(&' #
! " #) *#
! " #+, ‐#
! " #$. " #
! "+#
! " #$" #
PN BBC
PN BSP
PN BCC
PN CGIP
PN BCEE
Term Taxonomy
WEBIST�2014�-�International�Conference�on�Web�Information�Systems�and�Technologies
302

Type Patterns to determine the Query type. For some Query Patterns, like the Query Pattern of query 1, this will be straightforward. This Query Pattern matches a Search Type Pattern in the Search Type Informational-Directed-Closed.
For other queries, like query 2, the Query Type does not fully match any Search Type Pattern. In this case we retrieve all Search Type Patterns that partially match the Query Pattern and we use the term categories taxonomy to determine which Search Type Patterns better match the Query Pattern. For example the Query Pattern <CN_IFT + PP + CN_Ent + PP + PN> of query 2 partially matches the Search Type Pattern <CN_IFT + PP + CN_Ent + PP + PN_C> from the Informational-List search type. And since PN_C is a sub-category of PN, the system classifies query 2 as Informational-List. Note that if the Query Pattern partially maps to a single search type, we can use this as a knowledge-learning step as the system might automatically add the new ambiguous term to the term categories database. This enriches the database of the system and reduces the cases of term ambiguity and partial query type matching in the future. If the Query Pattern partially maps to multiple search types, the system classify the query to more than one search types. This is a better treatment than considering the query totally vague and discarding it, as done by other solutions. This could be used to reduce the size of search engine result as we can provide the user with a very limited number of options that would reflects his/her intention.
5 EXPERIMENTS
We developed a prototype in Java to test our proposed solution. Our prototype utilizes the 1182 different Search Type Patterns that we have constructed and also use the taxonomy of term categories shown in Figure 1 and Table 1. This taxonomy of term categories contains 10,440 different terms and types.
To test the accuracy of our solution, 10,000 queries were randomly selected from AOL 2006 dataset and tested using the system. The selected queries are different from those used in constructing the Search Query Patterns. Results of the experiment show that our solution had identified and classified 7754 of the queries. After examining the remaining unclassified 2246 queries, we found that 927 of them were not identified due to vagueness or mistakes. This make the accuracy of the classification 85.5% of the queries without mistakes.
Table 4, shows classification detail by search type. Informational queries have the highest frequency with 4245 queries then transactional queries with 2783 queries. Navigational queries have the lowest frequency with only 726 queries. Table 5 shows the breakdown of the result to sub-categories.
Our experiments show that 944 out of the 1182 different Search Type Patterns were used in classifying the 10,000 queries that were used in our experiment.
Table 4: Query Classification Results.
Type of search Total Informational 4245 Transactional 2783 Navigational 726
Table 5: Extended Classification Results.
Type of search Total Informational -List 1117 Informational -Find 875 Informational -Advice 351 Informational -Undirected 986 Informational -Directed -Open 283 Informational -Directed -Closed 633 Transactional -Obtain -Online 860 Transactional -Obtain -Offline 726 Transactional -Interact 94 Transactional -Download -Free 548 Transactional -Download -not free 555
6 CONCLUSIONS
In this research, we have introduced a framework to automatically identify and classify search engine user queries. Unlike other solutions, our solution relies on both query terms and query structure in order to determine the user intent. We have categorized search queries through introducing Search Type Patterns. Our framework consists of three main steps: (1) parsing user’s query, (2) formulating Query Patterns, and (3) Classifying query type.
Experiments show that our solution has achieved high accuracy in classifying queries. As a future work we will examine and analyze more queries from different search engine datasets in order to extend the ability of our system to identify more queries. We also plan to conduct more experiments on larger datasets and compare our results to results obtained from other approaches.
Automated�Identification�of�Web�Queries�using�Search�Type�Patterns
303

REFERENCES
Ashkan, A., Clarke, C. L.,Agichtein, E., &Guo, Q., 2009. Classifying and characterizing query intent.InAdvances in Information Retrieval (pp. 578-586).Springer Berlin Heidelberg.
Broder, A., 2002.A taxonomy of web search.In ACM Sigir forum (Vol. 36, No. 2, pp. 3-10). ACM.
Bhatia, S., Brunk, C., &Mitra, P., 2012. Analysis and automatic classification of web search queries for diversification requirements. Proceedings of the American Society for Information Science and Technology, 49(1), 1-10.
Baeza-Yates, R., Calderón-Benavides, L., & González-Caro, C., 2006.The intention behind web queries.InString processing and information retrieval (pp. 98-109).Springer Berlin Heidelberg.
Beitzel, S. M., Jensen, E. C., Frieder, O., Grossman, D., Lewis, D. D., Chowdhury, A., &Kolcz, A., 2005. Automatic web query classification using labeled and unlabeled training data. In Proceedings of the 28th annual international ACM SIGIR conference on Research and development in information retrieval (pp. 581-582). ACM.
Choo, C. W., Detlor, B., & Turnbull, D., 2000. Information seeking on the Web: An integrated model of browsing and searching. firstmonday, 5(2).
Calderón-Benavides, L., Gonzalez-Caro, C., & Baeza-Yates, R., 2010. Towards a deeper understanding of the user's query intent. In SIGIR 2010 Workshop on Query Representation and Understanding (pp. 21-24).
Hernández, D. I., Gupta, P., Rosso, P., & Rocha, M. A., 2012.Simple Model for Classifying Web Queries by User Intent.
Jansen, B. J., & Booth, D., 2010. Classifying web queries by topic and user intent. In CHI'10 Extended Abstracts on Human Factors in Computing Systems (pp. 4285-4290). ACM.
Jansen, B. J., Booth, D. L., & Spink, A., 2008. Determining the informational, navigational, and transactional intent of Web queries. Information Processing & Management, 44(3), 1251-1266.
Kathuria, A., Jansen, B. J., Hafernik, C., &Spink, A., 2010. Classifying the user intent of web queries using k-means clustering. In Internet Research, 20(5), 563-581.
Kellar, M., Watters, C., & Shepherd, M., 2006.A Goal-based Classification of Web Information Tasks.Proceedings of the American Society for Information Science and Technology, 43(1), 1-22.
Liu, Y., Zhang, M., Ru, L., & Ma, S., 2006. Automatic query type identification based on clickthrough information. In Information Retrieval Technology (pp. 593-600).Springer Berlin Heidelberg.
Lee, U., Liu, Z., & Cho, J., 2005.Automatic identification of user goals in web search.InProceedings of the 14th international conference on World Wide Web (pp. 391-400). ACM.
Lewandowski, D., 2006. Query types and search topics of German Web search engine users. Information
Services and Use, 26(4), 261-269. Lewandowski, D., Drechsler, J., & Mach, S., 2012.
Deriving query intents from web search engine queries. Journal of the American Society for Information Science and Technology, 63(9), 1773-1788.
Mendoza, M., & Zamora, J., 2009. Identifying the intent of a user query using support vector machines. In String Processing and Information Retrieval (pp. 131-142). Springer Berlin Heidelberg.
Morrison, J. B., Pirolli, P., & Card, S. K., 2001, March. A taxonomic analysis of what World Wide Web activities significantly impact people's decisions and actions. In CHI'01 extended abstracts on Human factors in computing systems (pp. 163-164). ACM.
Rose, D. E., Levinson, D., 2004. Understanding user goals in web search. In Proceedings of the 13th international conference on World Wide Web (pp. 13-19). ACM.
Wu, D., Zhang, Y., Zhao, S., & Liu, T., 2010. Identification of Web Query Intent Based on Query Text and Web Knowledge. In Pervasive Computing Signal Processing and Applications (PCSPA), 2010 First International Conference on (pp. 128-131). IEEE.
WEBIST�2014�-�International�Conference�on�Web�Information�Systems�and�Technologies
304
A Domain Independent Double Layered Approach to KeyphraseGeneration
Dario De Nart and Carlo TassoArtificial Intelligence Lab, Department of Mathematics and Computer Science, University of Udine, Udine, Italy
fdario.denart, [email protected]
Keywords: Keyphrase Extraction, Keyphrase Inference, Information Extraction, Text Classification, Text Summarization.
Abstract: The annotation of documents and web pages with semantic metatdata is an activity that can greatly increase theaccuracy of Information Retrieval and Personalization systems, but the growing amount of text data available istoo large for an extensive manual process. On the other hand, automatic keyphrase generation, a complex taskinvolving Natural Language Processing and Knowledge Engineering, can significantly support this activity.Several different strategies have been proposed over the years, but most of them require extensive trainingdata, which are not always available, suffer high ambiguity and differences in writing style, are highly domain-specific, and often rely on a well-structured knowledge that is very hard to acquire and encode. In order toovercome these limitations, we propose in this paper an innovative domain-independent approach that consistsof an unsupervised keyphrase extraction phase and a subsequent keyphrase inference phase based on looselystructured, collaborative knowledge such as Wikipedia, Wordnik, and Urban Dictionary. This double layeredapproach allows us to generate keyphrases that both describe and classify the text.
1 INTRODUCTION
The tremendous and constant growth of the amountof text data available on the web has lead, in the lastyears, to an increasing demand for automatic summa-rization and information filtering systems. Such sys-tems, in order to be effective and efficient, need meta-data capable of representing text contents in a com-pact, yet detailed way.
As broadly discussed in literature and proven byweb usage analysis (Silverstein et al., 1999), is par-ticularly convenient for such metadata to come in theform of KeyPhrases(KP), since they can be very ex-pressive (much more than single keywords), straight-forward in their meaning, and have a high cognitiveplausibility, because humans tend to think in terms ofKPs rather than single keywords. In the rest of thispaper we will refer to KP generation as the processof associating a meaningful set of KPs to a given text,regardless to their origin, while we will call KP ex-traction the act of selecting a set of KP from the textand KP inference the act of associating to the text a setof KP that may not be found inside it. KP generationis a trivial and intuitive task for humans, since any-one can tell at least the main topics of a given text, ordecide whether it belongs to a certain domain (newsitem, scientific literature, narrative, etc., ...) or not,
but it can be extremely hard for a machine since mostof the documents available lack any kind of semantichint.
Over the years several authors addressed this is-sue proposing different approaches towards both KPextraction and inference, but, in our opinion, eachone of them has severe practical limitations that pre-vent massive employment of automatic KP generationin Information Retrieval, Social Tagging, and Adap-tive Personalization. Such limitations are the needof training data, the impossibility of associating to agiven text keyphrases which are not already includedin that text, the high domain specificity, and the needof structured, detailed, and extensive domain knowl-edge coded in the form of a thesaurus or an ontology.We claim that, in order to match the KP generationperformances of a human expert, automatic KP gen-eration systems should both extract and infer KPs,moreover such systems should be unsupervised anddomain independent in order to be extensively used,since training data and domain ontologies are hard toobtain.
In order to support our claim we propose here anunsupervised KP generation method that consists oftwo layers of analysis: a KP Extraction phase anda KP inference one, based on Ontology Reasoningupon knowledge sources that though not being for-
305

mal ontologies can be seen as loosely structured ones.The first phase provides KPs extracted from the text,describing its content in detail, while the second pro-vides more general KPs, chosen from a controlled dic-tionary, categorizing the text, rather than describing it.
The rest of the paper is organized as follows: inSection 2 we briefly introduce some related works; inSection 3 we present our keyphrase extraction tech-nique; in Section 4 we illustrate our keyphrase infer-ence technique; in Section 5 we discuss some exper-imental results and, finally, in Section 6 we concludethe paper.
2 RELATED WORK
Many works over the past few years have discusseddifferent solutions for the problem of automaticallytagging documents and Web pages as well as the pos-sible applications of such technologies in the fieldsof Personalization and Information Retrieval in orderto significantly reduce information overload and in-crease accuracy. Both keyphrase extraction and infer-ence have been widely discussed in literature. Sev-eral different keyphrase extraction techniques havebeen proposed, which usually are structured into twophases:
� a candidate phrase identification phase, in whichall the possible phrases are detected in the text;
� a selection phase in which only the most sig-nificant of the above phrases are chosen askeyphrases.
The wide span of proposed methods can be roughlydivided into two distinct categories:
� Supervised approaches: the underlying idea ofthese methods is that KP Extraction can be seen asa classification problem and therefore solved witha sufficient amount of training data (manually an-notated) and machine learning algorithms (Tur-ney, 2000). Several authors addressed the prob-lem in this direction (Turney, 1999) and many sys-tems that implement supervised approaches areavailable, such as KEA (Witten et al., 1999),Extractor2, and LAKE (DAvanzo et al., 2004). Allthe above systems can be extremely effective and,as far as reliable data sets are available, can beflawlessly applied to any given domain (Marujoet al., 2013), however requiring training data inorder to work properly, implies two major draw-backs: (i) the quality of the extraction process re-lies on the quality of training data and (ii) a modeltrained on a specific domain just won’t fit anotherapplication domain unless is trained again.
� Unsupervised approaches: this second class ofmethods eliminates the need for training data byselecting candidate KP according to some rank-ing strategy. Most of the proposed systems relyon the identification of noun phrases, i.e. phrasesmade of just nouns and then proceed with a furtherselection based on heuristics such as frequencyof the phrase (Barker and Cornacchia, 2000) orupon phrase clustering (Bracewell et al., 2005).A third approach proposed by (Mihalcea and Ta-rau, 2004) and (Litvak and Last, 2008), exploitsa graph-based ranking model algorithm, bearingmuch similarity to the notorious Page Rank al-gorithm, in order to select significant KPs andidentify related terms that can be summarized bya single phrase. All the above techniques sharethe same advantage over the supervised strategies,that is being truly domain independent, since theyrely on general principles and heuristics and there-fore there is no need for training data.
Hybrid approaches have been proposed as well, in-corporating semi-supervised domain knowledge in anotherwise unsupervised extraction strategy (Sarkar,2013), but still remain highly domain-specific.Keyphrase extraction, however, is severely limited bythe fact it can ultimately return only words containedin the input document, which are highly prone to am-biguity and subject to the nuances of different writingstyles (e.g: an author can write “mining frequent pat-terns” where another one would write “frequent pat-tern mining” ). Keyphrase inference can overcomethese limitations and has been widely explored in lit-erature as well, spanning from systems that simplycombine words appearing in the text in order to con-struct rather than extract phrases (Danilevsky et al.,2013) to systems that assign KPs that may built withterms that never appear in the document. In the lattercase, KPs come from a controlled dictionary, possi-bly an ontology; in such case, a classifier is trained inorder to find which entries of the exploited dictionarymay fit the text (Dumais et al., 1998). If the dictionaryof possible KPs is an ontology, its structure can beexploited in order to provide additional evidence forinference (Pouliquen et al., 2006) and, by means ofontological reasoning, evaluate relatedness betweenterms (Medelyan and Witten, 2006). In (Pudota et al.,2010) is discussed a KP inference technique basedon a very specific domain ontology, written in theOWL language, in the context of a vast framework forpersonalized document annotation that combines bothKP Extraction and inference. KP inference based ondictionaries, however, is strongly limited by the size,the domain coverage, and the specificity level of theconsidered dictionary.
WEBIST�2014�-�International�Conference�on�Web�Information�Systems�and�Technologies
306

3 SYSTEM OVERVIEW
In order to test our approach and to support our claimswe developed a new version of the system presentedin (Pudota et al., 2010). We introduce a new double-layered architecture and an original innovation, i.e.the exploitation of a number of generalist online Ex-ternal Knowledge Sources, rather than a formal do-main specific ontology, in order to improve extractionquality, to infer meaningful KPs not included in theinput text and to preserve domain independence.
In Figure 1 the overall organization of the pro-posed system is presented. It is constituted by thefollowing main components:
� A KP Extraction Module (KPEM), devoted toanalyse the text end extract from it meaningfulKPs. It is supported by some linguistic resources,such as a POS tagger (for the English Lan-guage) and a Stopwords Database and it accessessome online External Knowledge Sources (EKSs)mainly exploited in order to provide support to thecandidate KPs identified in the text (as explainedin the following section). The KPEM receives ininput an unstructured text and it produces in out-put a ranked list of KPs, which is stored in an Ex-tracted Keyphrases Data Base(EKPDB).
� A KP Inference Module (KPIM), which works onthe KP list produced by the KPEM and it is de-voted to infer new KPs, not already included inthe input text. It relies on some ontological rea-soning based on the access to the External Knowl-edge Sources, exploited in order to identify newconcepts which are related to the ones referred toby the KPs previously extracted by the KPEM.Inferred KPs are stored in the Inferred KP DataBase (IKPDB).
The access to the online External KnowledgeSources is provided by a Generalized KnowledgeGateway (GKG). The system is organized in the formof a Web service, allowing easy access to the KP Gen-eration service to all kinds of clients.The workflow of the system is intended as a simu-lation of the typical cognitive process that happenswhen we are asked to summarize or classify a text. Atthe beginning all of the text is read, then the KPEMidentifies and ranks concepts included in the text, fi-nally, the KPIM precesses the identified concepts inorder to infer from them other concepts that may betightly related or implied. The result of the process isa set of KPs that appear or do not appear in the text,thus mixing explicit and tacit knowledge.
4 PHRASE EXTRACTION
KPEM is an enhanced version of DIKPE, the un-supervised, domain independent KP extraction ap-proach described in (Pudota et al., 2010) and (Fer-rara and Tasso, 2013). In a nutshell, DIKPE generatesa large set of candidate KPs; the exploited approachthen merges different types of knowledge in order toidentify meaningful concepts in a text, also trying tomodel a human-like KP assignment process. In par-ticular we use: Linguistic Knowledge (POS tagging,sentence structure, punctuation); Statistical Knowl-edge (frequency, tf/idf,...); knowledge about the struc-ture of a document (position of the candidate KP inthe text, title, subtitles, ...); Meta-knowledge providedby the author (html tags,...); knowledge coming fromonline external knowledge sources, useful for validat-ing candidate keyphrases which have been sociallyrecognized, for example, in collaborative wikis (e.g.Wikipedia, Wordnik, and other online resources).By means of the above knowledge sources, each can-didate phrase, is characterized by a set of features,such as, for example:
� Frequency: the frequency of the phrase in the text;
� Phrase Depth: at which point of the text thephrase occurs for the first time: the sooner it ap-pears, the higher the value;
� Phrase Last Occurrence: at which point of thetext the phrase occurs for the last time: the later itappears, the higher the value;
� Life Span: the fraction of text between the firstand the last occurrence of the phrase;
� POS Value: a parameter taking into account thegrammatical composition of the phrase, exclud-ing some patterns and assigning higher priority toother patterns (typically, for example but not ex-clusively, it can be relevant to consider the numberof nouns in the phrase over the number of wordsin the phrase).
� WikiFlag: a parameter taking into account thefact that the phrase is or is not an entry ofonline collaborative external knowledge sources(EKSs); the WikiFlag provides evidence of the so-cial meaningfulness for a KP and therefore can beconsidered a feature based on general knowledge.
A weighted linear combination of the above features,called Keyphraseness is then computed and the KPsare sorted in descending keyphraseness order. Theweight of each feature can be tuned in order to fitparticular kinds of text, but, usually, a generalistpreset can be used with good results. The topmost nKPs are finally suggested.
A�Domain�Independent�Double�Layered�Approach�to�Keyphrase�Generation
307

Figure 1: Architecture of the System.
In this work, we extended the DIKPE system with theGKG module, allowing access to multiple knowledgesources at the same time. We also added a moregeneral version of the WikiFlag feature. This featureis computed as follows: if the phrase matches anentry in at least one of the considered external knowl-edge sources, then its value is set to 1, otherwise thephrase is split into its constituents and the WikiFlagvalue is set to the percentage corresponding to thenumber of terms that have a match in at least oneof the considered external knowledge sources. Bydoing so, a KP that does not match as phrase, but isconstituted by terms that match as single words, stillgets a high score, but lower than a KP that features aperfect match. The WikiFlag feature is processed asall the other features, contributing to the computationof the keyphraseness and therefore influencing theranking of the extracted KPs. The rationale of thischoice is that a KP is important insofar it representsa meaningful concept or entity, rather than a randomcombination of words, and matching a whole phraseagainst a collaborative human-made knowledgesource (as the EKSs are) guarantees that it makesbetter sense, providing a strong form of human/socialvalidation. However, the WikiFlag does not preventterms and phrases that are not validated by externalknowledge to be suggested as KPs if they appear withsignificant frequency in significant parts of the doc-ument, which may be the case of newly introducedterminology or highly specific jargon. Exploiting theWikiflag actually helps in reducing the tendency ofthe system to suggest typos, document parsing errors,random combinations of frequent non-stopwordsterms, and other kinds of false positives.
Another improvement over the original DIKPEapproach is represented by the fact that, instead ofsuggesting the top n KPs extracted, the new sys-tem evaluates the decreasing trend of Keyphrasenessamong ordered KPs, it detects the first significantdownfall (detected by evaluation of the derivativefunction) in the keyphraseness value, and it suggestsall the KPs occurring before that (dynamic) threshold.By doing so, the system suggests a variable number ofhigh-scored KPs, while the previous version suggestsa fixed number of KPs, that could have been either toosmall or too large for the given text.
5 PHRASE INFERENCE
The KP Inference Module (KPIM), as well as theknowledge-based WikiFlag feature described in theprevious section, rely on a set of external knowledgesources that are accessed via web. In the following wecall entity any entry present in one or more EKSs; en-tities may have a complex structure, as well as includedifferent kinds of data (e.g: text, pictures, videos, ...),however we are interested in the relationships occur-ring between entities rather than their content. EKsmay be online databases, such as Wordnet, linked dataor traditional web resources as long as a dense linkstructure with some well-recognizable semantics isavailable. We assume that (i) there is a way to matchextracted KPs with entities described in EKSs (e.g.:querying the exploited service using the KP as searchkey) and (ii) each one of the EKSs considered is orga-nized according to some kind of hierarchy. Such hier-archy may be loose, but it must include some kind ofis-a and is-related relationships, allowing us to infer,
WEBIST�2014�-�International�Conference�on�Web�Information�Systems�and�Technologies
308
for each entity, a set of parent and a set of related en-tities. Such sets may be void, since we do not assumeeach entity being necessarily linked to at least anotherone, nor the existence of a root entity that is ancestorof all the other entities in the ontology.
Even if such structure is loose, assuming itsexistence is nowadays not trivial at all; however,along with the growth of semantic web resources,an increasing number of collaborative resources al-low users to classify and link together knowl-edge items, generating an increasing number ofpseudo-ontologies. Clear examples of this trend areWikipedia, where almost any article contains linksto other articles and many articles are grouped intocategories, and Wordnik, an online collaborative dic-tionary where any word is associated to a set of hy-pernyms, synonyms, hyponyms, and related terms.Recently also several entertainment sites, like UrbanDictionary, have begun to provide these possibilities,making them eligible knowledge sources for our ap-proach. Knowledge sources may be either generalist(like Wikipedia), or specific (like the many domain-specific wikis hosted on wikia.com) and several dif-ferent EKSs can be exploited at the same time in orderto provide better results.
In the case of Wikipedia, parent entities are givenby the categories, that are thematic groups of articles(i.e.: “Software Engineering” belongs to the “Engi-neering Disciplines” category). An entry may belongto several categories, for example the entry on “TheWho” belongs to the “musical quartets” category aswell as to the “English hard rock musical groups” oneand the “Musical groups established in 1964” one.Related entities, instead, can be derived from linkscontained in the page associated to the given entity:such links can be very numerous and heterogeneous,but the most closely related ones are often groupedinto one or more templates, that are the thematic col-lections of internal Wikipedia links usually displayedon the bottom of the page, as shown in Figure 2. Forinstance, in a page concerning a film director, it isvery likely to find a template containing links to theall movies he directed or the actors he worked with.
Wordnik, instead, provides hierarchical informa-tion explicitly by associating to any entity lists of hy-pernyms (parent entities) and synonyms (related enti-ties).
The inference algorithm considers the topmosthalf of the extracted KPs, that typically is still a sig-nificantly larger set than the one presented as output,and, for each KP that can be associated to an entity, re-trieves from each EKS a set of parent entities and a setof related entities. If a KP corresponds to more thanone entity on one or more EKSs, all of the retrieved
entities are taken into account. The sets associated tosingle KPs are then merged into a table of related en-tities and a table of parent entities for the whole text.Each retrieved entity is scored accordingly to the sumof the Keyphraseness value of the KPs from which ithas been derived and then it is sorted by descendingscore. The top entries of such tables are suggested asmeaningful KPs for the input document.
By doing so, we select only entities which are re-lated to or parent of a significant number of hi-scoredKPs, addressing the problem of polysemy amongthe extracted KP. For instance, suppose we extracted“Eiffel” and “Java Language” from the same text:they both are polysemic phrases since the first mayrefer to a ISO-standardized OO language as well as toa French civil engineer and architect and the latter tothe programming language or to the language spokenin the island of Java. However, since they appear to-gether, and they are both part of the “Object-OrientedProgramming Languages” category in Wikipedia, itcan be deduced that the text is about computer sciencerather than architecture or Indonesian languages.
6 EVALUATION
Formative tests were performed in order to test theaccuracy of the inferred KPs and their ability to addmeaningful information to the set of extracted KPs,regardless of the domain covered by the input text.Several data sets, dealing with different topics, wereprocessed, article by article, with the same featureweights and exploiting Wikipedia and Wordnik as Ex-ternal Knowledge Source. For each article a list ofextracted KPs and one of inferred KPs were gener-ated, then the occurrences of each KP were counted,in order to evaluate which portion of the data set iscovered by each KP. We call set coverage the fractionof the data set labelled with a single KP. Since the top-ics covered in the texts included in each data set areknown a-priori, we expect the system to generate KPsthat associate the majority of the texts in the data setto their specific domain topic.
The first data set contained 113 programming tu-torials, spanning from brief introductions publishedon blogs and forums to extensive articles taken frombooks and journals, covering both practical and the-oretical aspects of programming. A total of 776 KPswere extracted and 297 were inferred. In Table 1 arereported the most frequently extracted and inferredKPs. As expected, extracted KPs are highly specificand tend to characterize a few documents in the set(the most frequent KP covers just the 13% of thedata set), while inferred ones provide an higher level
A�Domain�Independent�Double�Layered�Approach�to�Keyphrase�Generation
309

Figure 2: The lowest section of a Wikipedia page, containing templates (the “Engineering” template has been expanded) andcategories (bottom line).
Table 1: The most frequently extracted and inferred KPs from the “programming tutorials” data set.
Extracted Keyphrase Set coverage Inferred Keyphrase Set Coverageprogram 0,13 Mathematics 0,47use 0,12 Programming language 0,26function 0,12 move 0,25type 0,10 Computer science 0,22programming language 0,10 Set (mathematics) 0,17programming 0,08 Data types 0,15functions 0,07 Aristotle 0,16class 0,07 Function (mathematics) 0,14code 0,06 C (programming language) 0,14COBOL 0,06 Botanical nomenclature 0,12chapter 0,05 C++ 0,11variables 0,05 Information 0,08number 0,05 Java (programming language) 0,08
Table 2: The most frequently extracted and inferred KPs from the “album reviews” data set.
Extracted Keyphrase Set coverage Inferred Keyphrase Set Coveragemetal 0,23 Music genre 1album 0,21 Record label 0,97death metal 0,17 Record producer 0,54black metal 0,17 United States 0,48band 0,16 Studio album 0,16bands 0,08 United Kingdom 0,11death 0,08 Bass guitar 0,09old school 0,07 Single (music) 0,08sound 0,06 Internet Movie Database 0,07albums 0,05 Heavy metal music 0,07power metal 0,05 Allmusic 0,06
of abstraction, resulting in an higher coverage overthe considered data set. However some Inferred KPsare not accurate, such as “ Botanical nomenclature “that clearly derive from the presence of terms suchas “tree”, “branch”, “leaf”, and “forest” that are fre-quently used in Computer Science, and “Aristotele”which comes from the frequent references to Logic,
which Wikipedia frequently associates with the Greekphilosopher.
Another data set contained reviews of 211 heavymetal albums published in 2013. Reviews were writ-ten by various authors, both professionals and non-professionals, and combine a wide spectrum of writ-ing styles, from utterly specific, almost scientific, to
WEBIST�2014�-�International�Conference�on�Web�Information�Systems�and�Technologies
310

highly sarcastic, with many puns and popular culturereferences.
In Table 2 are reported the most frequently ex-tracted and inferred KPs. All the documents in the setwere associated with the Inferred KP “Music Genre”and the 97% of them with “Record Label”, whichclearly associates the texts with the music domain.Evaluation and development are still ongoing and newknowledge sources, such as domain-specific wikisand Urban Dictionary, are being considered.
7 CONCLUSIONS AND FUTUREWORK
In this paper we proposed a truly domain independentapproach to both KP extraction and inference, ableto generate significant semantic metadata with twodifferent layers of abstraction (phrase extraction andphrase inference) for any given text without need fortraining. The KP extraction part of the system pro-vides a very fine level of detail, producing KPs thatmay not be found in a controlled dictionary (such asWikipedia), but characterize the text. Such KPs areextremely valuable for the purpose of summarizationand provide great accuracy when used as search keys.However, they are not widely shared, meaning, froman information retrieval point of view, a very poor re-call. On the other hand, the KP inference part gener-ates only KPs taken from a controlled dictionary (theunion of the considered EKSs) that are more likely tobe general, widely known and used, and, therefore,shared among a significant number of texts.
As shown in the previous section, our approachcan annotate a set of documents with meaningful KPs,however, a few unrelated KPs may be inferred, mostlydue to ambiguities of the text and to the general-ist nature of the exploited online external knowledgesources. This unrelated terms, fortunately, tend to ap-pear in a limited number of cases and to be clearlyunrelated not only to the majority of the generatedKPs, but also to each other. In fact, our next step inthis research will be precisely to identify such falsepositives by means of an estimate of the Semantic Re-latedness (Strube and Ponzetto, 2006), (Ferrara andTasso, 2012) between terms in order to identify, foreach generated KP, a list of related concepts and de-tect concept clusters in the document.
The proposed KP generation technique can be ap-plied both in the Information Retrieval domain and inthe Adaptive Personalization one. The previous ver-sion of the DIKPE system has already been integratedwith good results in RES (De Nart et al., 2013), a per-sonalized content-based recommender system for sci-
entific papers that suggests papers accordingly to theirsimilarity with one or more documents marked as in-teresting by the user, and in the PIRATES framework(Pudota et al., 2010) for tag recommendation and au-tomatic document annotation. We expect this ex-tended version of the system to provide an even moreaccurate and complete KP generation and, therefore,to improve the performance of these existing systems,in this way supporting the creation of new SemanticWeb Intelligence tools.
REFERENCES
Barker, K. and Cornacchia, N. (2000). Using noun phraseheads to extract document keyphrases. In Advances inArtificial Intelligence, pages 40–52. Springer.
Bracewell, D. B., Ren, F., and Kuriowa, S. (2005). Mul-tilingual single document keyword extraction for in-formation retrieval. In Natural Language Process-ing and Knowledge Engineering, 2005. IEEE NLP-KE’05. Proceedings of 2005 IEEE International Con-ference on, pages 517–522. IEEE.
Danilevsky, M., Wang, C., Desai, N., Guo, J., and Han, J.(2013). Kert: Automatic extraction and ranking oftopical keyphrases from content-representative docu-ment titles. arXiv preprint arXiv:1306.0271.
DAvanzo, E., Magnini, B., and Vallin, A. (2004).Keyphrase extraction for summarization purposes:The lake system at duc-2004. In Proceedings of the2004 document understanding conference.
De Nart, D., Ferrara, F., and Tasso, C. (2013). Personalizedaccess to scientific publications: from recommenda-tion to explanation. In User Modeling, Adaptation,and Personalization, pages 296–301. Springer.
Dumais, S., Platt, J., Heckerman, D., and Sahami, M.(1998). Inductive learning algorithms and represen-tations for text categorization. In Proceedings of theseventh international conference on Information andknowledge management, pages 148–155. ACM.
Ferrara, F. and Tasso, C. (2012). Integrating semantic relat-edness in a collaborative filtering system. In Mensch& Computer Workshopband, pages 75–82.
Ferrara, F. and Tasso, C. (2013). Extracting keyphrasesfrom web pages. In Digital Libraries and Archives,pages 93–104. Springer.
Litvak, M. and Last, M. (2008). Graph-based keyword ex-traction for single-document summarization. In Pro-ceedings of the workshop on multi-source multilingualinformation extraction and summarization, pages 17–24. Association for Computational Linguistics.
Marujo, L., Gershman, A., Carbonell, J., Frederking, R.,and Neto, J. P. (2013). Supervised topical keyphrase extraction of news stories using crowdsourc-ing, light filtering and co-reference normalization.arXiv preprint arXiv:1306.4886.
Medelyan, O. and Witten, I. H. (2006). Thesaurus based au-tomatic keyphrase indexing. In Proceedings of the 6th
A�Domain�Independent�Double�Layered�Approach�to�Keyphrase�Generation
311

ACM/IEEE-CS joint conference on Digital libraries,pages 296–297. ACM.
Mihalcea, R. and Tarau, P. (2004). Textrank: Bringing or-der into texts. In Proceedings of EMNLP, volume 4.Barcelona, Spain.
Pouliquen, B., Steinberger, R., and Ignat, C. (2006). Auto-matic annotation of multilingual text collections witha conceptual thesaurus. arXiv preprint cs/0609059.
Pudota, N., Dattolo, A., Baruzzo, A., Ferrara, F., andTasso, C. (2010). Automatic keyphrase extractionand ontology mining for content-based tag recommen-dation. International Journal of Intelligent Systems,25(12):1158–1186.
Sarkar, K. (2013). A hybrid approach to extractkeyphrases from medical documents. arXiv preprintarXiv:1303.1441.
Silverstein, C., Marais, H., Henzinger, M., and Moricz, M.(1999). Analysis of a very large web search enginequery log. In ACm SIGIR Forum, volume 33, pages6–12. ACM.
Strube, M. and Ponzetto, S. P. (2006). Wikirelate! comput-ing semantic relatedness using wikipedia. In AAAI,volume 6, pages 1419–1424.
Turney, P. D. (1999). Learning to extract keyphrases fromtext. national research council. Institute for Informa-tion Technology, Technical Report ERB-1057.
Turney, P. D. (2000). Learning algorithms for keyphraseextraction. Information Retrieval, 2(4):303–336.
Witten, I. H., Paynter, G. W., Frank, E., Gutwin, C., andNevill-Manning, C. G. (1999). Kea: Practical au-tomatic keyphrase extraction. In Proceedings of thefourth ACM conference on Digital libraries, pages254–255. ACM.
WEBIST�2014�-�International�Conference�on�Web�Information�Systems�and�Technologies
312
A Methodology to Measure the Semantic Similarity between Words based on the Formal Concept Analysis
Yewon Jeong, Yiyeon Yoon, Dongkyu Jeon, Youngsang Cho and Wooju Kim Department of Information & Industiral Engineering, Yonsei University, Seoul, Korea
[email protected], [email protected], [email protected], {y.cho, wkim}@yonsei.ac.kr
Keywords: Query Expansion, Formal Concept Analysis, Semantic Similarity, Keyword-based Web Documents.
Abstract: Recently, web users feel difficult to find the desired information on the internet despite a lot of useful information since it takes more time and effort to find it. In order to solve this problem, the query expansion is considered as a new alternative. It is the process of reformulating a query to improve retrieval performance in information retrieval operations. Although there are a few techniques of query expansion, synonym identification is one of them. Therefore, this paper proposes the method to measure the semantic similarity between two words by using the keyword-based web documents. The formal concept analysis and our proposed expansion algorithm are used to estimate the similarity between two words. To evaluate the performance of our method, we conducted two experiments. As the results, the average of similarity between synonym pairs is much higher than random pairs. Also, our method shows the remarkable performance in comparison with other method. Therefore, the suggested method in this paper has the contribution to find the synonym among a lot of candidate words.
1 INTRODUCTION
Recently, the useful information on the internet has been increasing due to the rapid development of web. However, users feel difficult to find the desired information on the internet because it takes more time and efforts. In order to solve this problem, the query expansion is considered as a new alternative. It helps user to find the desired results and improve the effectiveness of retrieval. As the process of reformulating a query, the query expansion improves retrieval performance in information retrieval operations (Vechtomova and Wang, 2006). Thus, in the search engines, it involves evaluating a user's input and expanding the search query to match additional documents. Even if there are a few techniques of the query expansion, the synonym identification is one of them.
Finding synonym on the basis of subjective intuitions is considered as a daunting task. This is the reason of that it is hard to define the synonym due to a property that has no clear-cut boundaries (Baroni and Bisi, 2004). Therefore, this paper proposes the method to automatically measure how much two words have the semantically similar relation by using keyword-based web documents.
There are a lot of web documents which have tagged words like papers. Therefore, this paper applied the paper keywords to calculate the similarity between two words through the formal concept analysis (FCA).
The next section introduces the related work of the formal concept analysis and other similarity measurements. The section 3 provides a detailed explanation of methodology to measure similarity between two words. The section 4 presents the result of experiments to evaluate performance of our method. Finally, we draw the conclusion and suggest future work in the section 5.
2 RELATED WORKS
2.1 Formal Concept Analysis
The formal concept analysis is a mathematical approach which is used for conceptual data analysis (Ganter et al., 2005). It has been studied in diverse fields such as data mining, conceptual modelling, software engineering, social networking and the semantic web (Alqadah and Bhatnagar, 2011). It is good to analyse and manage structured data
313

(Wormuth and Becker, 2004). Thus, it helps user to structure an interest domain (Ganter et al., 1997, Wille, 2009). It models the world of data through the use of objects and attributes (Cole and Eklund, 1999). Ganter et al.(1999) applied the concept lattice from the formal concept analysis. This approach has an advantage that users can refine their query by searching well-structured graphs. These graphs, known as formal concept lattice, are composed of a set of documents and a set of terms. Effectively, it reduces the task of setting bound restrictions for managing the number of documents to be retrieved required (Tam, 2004).
2.2 Related Works of Similarity Measure between Two Words
Traditionally, a number of approaches to find synonym have been published. The methodology to automatically discover synonym from large corpora have been popular topic in a variety of language processing (Sánchez and Moreno, 2005, Senellart and Blondel, 2008, Blondel and Senellart, 2011, Van der Plas and Tiedemann, 2006). There are two kinds of approaches to identify synonyms.
The first kind of approaches uses a general dictionary (Wu and Zhou, 2003). In the area of synonym extraction, it is common to use lexical information in dictionary (Veronis and Ide, 1990). In dictionary-based case, a similarity is decided on definition of each word in a dictionary. This kind of approaches is conducted through learning algorithm based on information in the dictionary (Lu et al., 2010, Vickrey et al., 2010). Wu and Zhou (2003) proposed a method of synonym identification by using bilingual dictionary and corpus. The bilingual approach works on as follows: Firstly, the bilingual dictionary is used to translate the target word. Secondly, the authors used two bilingual corpora that mean precisely the same. And then, they calculated the probability of the coincidence degree. The result of the bilingual method is remarkable in comparison with the monolingual cases. Another research builds a graph of lexical information from a dictionary. The method to compute similarity for each word is limited to nearby words of graph. This similarity measurement was evaluated on a set of related terms (Ho and Fairon, 2004).
The second kind of approaches to identity synonym considers context of the target word and computes a similarity of lexical distributions from corpus (Lin, 1998). In the case of distributional approaches, a similarity is decided on context. Thus, it is important to compute how much similar words
are in a corpus. The approach of distributional similarity for synonym identification is used in order to find related words (Curran and Moens, 2002). There has been many works to measure similarity of words, such as distributional similarity (Lin et al., 2003). Landauer and Dumais (1997) proposed a similarity measurement to solve TOEFL tests of synonym by using latent semantic analysis (Landauer and Dumais, 1997). Lin (1998) proposed several methodologies to identify the most probable candidate among similar words by using a few distance measures. Turney (2001) presented PMI and IR method which is calculated by data from the web. He evaluated this measure on the TOEFL test in which the system has to select the most probable candidate of the synonym among 4 words. Lin et al. (2003) proposed two ways of finding synonym among distributional related words. The first way is looking over the overlap in translated texts of semantically similar words in multiple bilingual dictionaries. The second is to look through designed patterns so as to filter out antonyms.
There are a lot of researches for measuring similarity to identify the synonym. However, the use of dictionary has been applied to a specific task or domain(Turney, 2001). Hence, these existing researches are hard to be applied in the changeable web. And, the context-based similarity method deals with unstructured web documents and it takes much time to analysis since it needs to pre-treatment such as morphological analysis. Therefore, this paper proposes a methodology to automatically measure the semantically similar relation between two words by using keyword-based structured data from web.
3 METHOD TO MEASURE SIMILARITY
In this section, we demonstrate the method to measure semantic similarity between two distinct words. This paper defined the ‘query’ as the target word that we would like to compute the semantic similarity. A pair of queries is defined as , which is the set of two different words
and . The overall procedure to estimate semantic
similarity between two queries of Q is composed of three phases as shown in the Figure 1; preprocessing, analysis and calculation phase. In the preprocessing phase, base data for the analysis are collected and refined on each query. Let us assume that the query pair is Q=(contamination, pollution). The set of web
WEBIST�2014�-�International�Conference�on�Web�Information�Systems�and�Technologies
314

Figure 1: The overall procedure to calculate the semantic similarity between two queries.
documents for each queries contamination and pollution are collected respectively. The formal context for each query is constructed based on the set of collected web documents, tags and binary relations. Finally, the generated formal contexts are refined according to two rules which are introduced in the section 3.1.2. In the analysis phase, we apply FCA and expansion algorithm to each refined formal context. Implicit concepts from formal concept are derived through the expansion algorithm which helps us to compare queries in-depth. In the final phase, we calculate the semantic similarity of the pair of queries. On the basis of expanded formal concepts, we can examine how many concepts are duplicated by considering the matching concepts.
3.1 Preprocessing Phase
In order to measure the similarity between two queries, web documents which have the keywords should be collected on each query. And the keywords of collected documents should include the query. From these documents, we can get information about relation between documents and tagged words and also can make the formal context.
3.1.1 Generation of the Formal Context
A formal context is represented through a
two-dimensional matrix X. In general, the column and row of X indicate objects and attributes respectively. An object is a collected web document and an attribute is one of the tagged words. Table 1 shows the example of the formal context given the Q = (contamination, pollution). The checkmarks in the table mean whether the object contains attributes or not. In the case of , as shown in Table 1, the document has four attributes such as contamination, insulators, solutions and flashover. The each set of attributes and objects are defined as follows:
{contamination, insulators, humidity,
solutions, flashover, power lines}
iqA (1)
1 2 3 4 5{ , , , , }iqO d d d d d (2)
{pollution, insulators, etching,
solutions, falshover, iron}
jqA (3)
1 2 3 4 5{ , , , , }jqO d d d d d (4)
is the set of attributes and is the set of objects when is given. is composed of tags from the collected documents and consists of the documents which is represented .
A�Methodology�to�Measure�the�Semantic�Similarity�between�Words�based�on�the�Formal�Concept�Analysis
315

Table 1: Examples of formal contexts.
= contamination
contamination
Insulators
humidity
solutions
flashover
power lines
d √ √ √ √ d √ √ √ d √ √ √ d √ √ √ √
d √ √ √ √
= pollution
pollution
Insulators
etching solution
s flashov
er iron
d √ √ √ d √ √ √ d √ √ √ d √ √ √
d √ √ √ √
3.1.2 Refinement of the Formal Context
After two formal contexts are generated, the refinement procedure is required for two reasons. Our research supposes that the more semantically similar relation two queries have, the more matching tagged words they have. This study ultimately wants to know how many words are matched between tagged words from two queries. Therefore, the attribute which is the same with query is unnecessary in this comparison procedure. The first refinement rule is to remove ‘query’ from attribute set A, and then, the second rule is to remove attributes which are contained in less than two documents. The reason is that these attributes have relatively weak effects to this method, and also it is helpful to save the process time and system cost by reducing the size of formal context. The summary of refinement procedure is as follows:
1. Removing the query from (the set of attributes). 2. Removing the attributes contained in less than
two web documents.
Table 2 is an example of refined context when the query is contamination and pollution. Because the contamination is given by , the attribute contamination is removed by rule 1. For the same reason, the attribute pollution is also removed. Since the number of web documents contained in etching is less than 2, the attribute etching is removed by rule 2.
Table 2: Examples of refined formal contexts.
= contamination
insulators humidity solutions flashover power lines
d √ √ √ d √ √ d √ √ d √ √ √
d √ √ √
= pollution
insulators solutions flashover iron d √ d √ √ d √ √ d √ √
d √ √ √
3.2 Analysis Phase
In this section, we introduce the analysis phase of this method. First, the formal concept analysis is conducted based on each formal context on and
. However, a concept from the formal concept analysis has only a few implicit concepts. Thus, we expand the formal concepts through our proposed expansion algorithm.
3.2.1 Formal Concept Analysis
To measure the similarity between the two queries, formal concept analysis should be performed on each formal context of and . According to these analysis procedures, two sets of formal concepts are generated by using formal concept analysis (Ganter et al., 1997). When the query is given, a set of formal concepts is generated by formal concept analysis as follows:
1 2, , ,
1, ,
i i i iq q q qk nS FC FC FC FC
where k n
(5)
In this equation, S is the set of formal concepts and is the k th formal concept. And, n is the number of formal concepts from the formal context. A formal concept is composed of an intent and extent as demonstrated in (6):
, 1, ,i i iq q qk k kFC I E where k n (6)
In this formula, is an intent of the and is an extent. The intent is subset of the attribute set which is the keyword set. And, extent is subset of
WEBIST�2014�-�International�Conference�on�Web�Information�Systems�and�Technologies
316
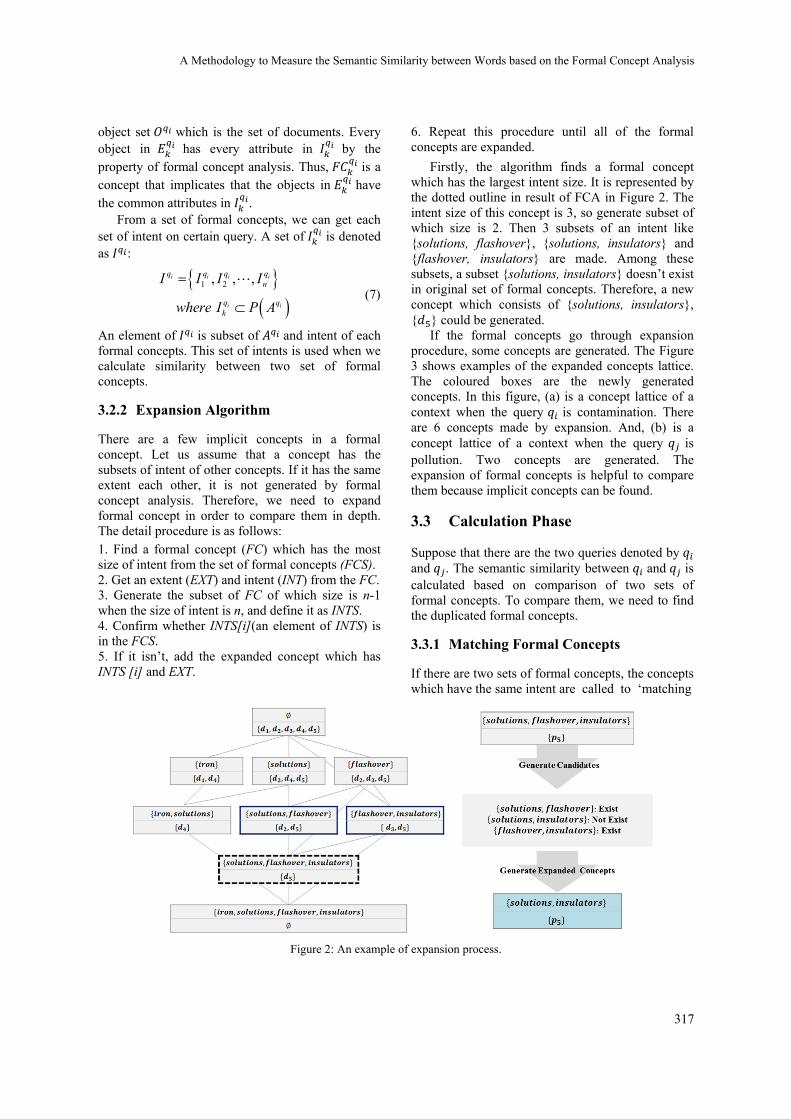
object set which is the set of documents. Every object in has every attribute in by the property of formal concept analysis. Thus, is a concept that implicates that the objects in have the common attributes in .
From a set of formal concepts, we can get each set of intent on certain query. A set of is denoted as :
1 2, , ,i i i i
i i
q q q qn
q qk
I I I I
where I P A
(7)
An element of is subset of and intent of each formal concepts. This set of intents is used when we calculate similarity between two set of formal concepts.
3.2.2 Expansion Algorithm
There are a few implicit concepts in a formal concept. Let us assume that a concept has the subsets of intent of other concepts. If it has the same extent each other, it is not generated by formal concept analysis. Therefore, we need to expand formal concept in order to compare them in depth. The detail procedure is as follows:
1. Find a formal concept (FC) which has the most size of intent from the set of formal concepts (FCS). 2. Get an extent (EXT) and intent (INT) from the FC. 3. Generate the subset of FC of which size is n-1 when the size of intent is n, and define it as INTS. 4. Confirm whether INTS[i](an element of INTS) is in the FCS. 5. If it isn’t, add the expanded concept which has INTS [i] and EXT.
6. Repeat this procedure until all of the formal concepts are expanded.
Firstly, the algorithm finds a formal concept which has the largest intent size. It is represented by the dotted outline in result of FCA in Figure 2. The intent size of this concept is 3, so generate subset of which size is 2. Then 3 subsets of an intent like {solutions, flashover}, {solutions, insulators} and {flashover, insulators} are made. Among these subsets, a subset {solutions, insulators} doesn’t exist in original set of formal concepts. Therefore, a new concept which consists of {solutions, insulators}, { } could be generated.
If the formal concepts go through expansion procedure, some concepts are generated. The Figure 3 shows examples of the expanded concepts lattice. The coloured boxes are the newly generated concepts. In this figure, (a) is a concept lattice of a context when the query is contamination. There are 6 concepts made by expansion. And, (b) is a concept lattice of a context when the query is pollution. Two concepts are generated. The expansion of formal concepts is helpful to compare them because implicit concepts can be found.
3.3 Calculation Phase
Suppose that there are the two queries denoted by and . The semantic similarity between and is calculated based on comparison of two sets of formal concepts. To compare them, we need to find the duplicated formal concepts.
3.3.1 Matching Formal Concepts
If there are two sets of formal concepts, the concepts which have the same intent are called to ‘matching
Figure 2: An example of expansion process.
A�Methodology�to�Measure�the�Semantic�Similarity�between�Words�based�on�the�Formal�Concept�Analysis
317

concepts’. In other word, it means that concepts
have the same intent from and respectively. In Figure 3, the concepts marked as bold outline are the matching concepts. When two queries, and , are given, the set of matching concepts is as follows:
1 2( ) , , ,ij ij ij ijq q q qz cS MC MC MC MC (8)
is a set of matching concepts and
is the z th matching concept. And, c is the number of matching concepts. A matching concept is composed of an intent and two extents as follows:
*** , ,ij jiq qqz z z zMC I E E (9)
∗ is the intersection of and . ∗ is the extent when the intent is ∗ and the is given. Also,
∗ is the extent when the intent is also ∗
and the is given. The function MapFunc is a function to find an extent corresponding with a certain intent given query. The formulas are as follows:
* ji qqI I I (10)
* *( , )iqz z iE MapFunc I q (11)
3.3.2 Calculation of Semantic Similarity
If we gain the set of matching concepts, we can estimate the similarity between two queries, and
. A measure of similarity is defined as:
*** *
1
1 1
( , )
100
ji
j ji i
i j
cqq
z z z zzn m
q qq qx x y y
x y
Similarity q q
I E I E
I E I E
(12)
It is the measure to calculate how many concepts are duplicated. In this formula, we multiply the number of intent elements by the number of extent elements because the concepts that have the bigger size of an intent or extent have a great effect on measure. This similarity has range from zero to 100. If the all concepts are the same the similarity is 100. And if
Figure 3: An example of expansion and matching concepts.
WEBIST�2014�-�International�Conference�on�Web�Information�Systems�and�Technologies
318
there are not duplicated concepts, the result would be zero.
4 EMPIRICAL EVALUATION
In order to evaluate the effectiveness of our method, we had the two performance evaluations. Firstly, we compared the similarity between two types of query pairs; one is the set of synonym pairs and the other is based on the randomly selected pairs. Secondly, we used the type of TOEFL synonym questions to verify the performance of this method.
4.1 Synonym Pairs Vs. Random Pairs
We prepared the 20 word pairs composed of 10 synonym pairs and 10 random pairs. In order to make formal contexts about queries, we collected papers tagged by each query from the IEEE Xplore website.
This paper shows the result of 10 experiments based on synonym pairs. The result of evaluation is shown in Table 3. The best resulted synonym pair scored as 5.22 is (optimization, optimisation). This pair has six matched formal concepts. We could know that it has the same meaning and significantly similar relation. The worst resulted synonym pair scored as 0.59 is (validation, verification) and has three matching formal concepts. This pair has weak similarity relation.
Table 3: The results of experiment (synonym pairs).
No. Synonym pairs Similarity
( , )
1 partition partitioning 0.60
2 optimization optimisation 5.22
3 classification categorization 4.13
4 cryptography steganography 1.71
5 reliability dependability 1.17
6 cluster clustering 4.95
7 contamination pollution 0.87
8 validation verification 0.59
9 encoding encryption 1.45
10 experiment experimentation 3.93
Average 2.46
In addition, we have experiment with 10 random pairs. The result is shown in Table 4. The average of all of the random pairs is approximately 0.37. The best resulted random pair scored as 0.99 is
(normalization, segmentation). It has six matching formal concepts. Although this query pair is not synonym, we can understand that they have a little relevant relation. There are the three worst results scored as zero and this pairs are composed of completely unrelated tags. (integration, forecasting), (lifetime, authorization) and (correlation, evolution) are unrelated pairs of experiment results. They don’t have any common concepts each other and we could know that they don’t have any semantic relations between them.
Table 4: The results of experiment (random pairs).
No.Random pairs Similarity
( , )
1 aggregation android 0.62
2 calibration internet 0.25
3 transportation biometrics 0.35
4 context innovation 0.99
5 integration forecasting 0.00
6 lifetime authorization 0.00
7 visualization entropy 0.61
8 correlation evolution 0.00
9 normalization segmentation 0.67
10 sorting authentication 0.16
Average 0.37
While the average of similarity between synonym pairs is about 2.46, the average of random pairs is about 0.37. And it shows the remarkable difference between two types of pairs. Therefore, the method to measure similarity relation has the contribution to find the synonym among a lot of candidates.
4.2 TOEFL Synonym Test
We prepared the 9 TOEFL synonym questions to find the synonym of the target word. One question is composed of a target word and four candidate words. And, we measured the similarity between the target word and each candidate word. In order to compare the performance with the related works, we used the AVMI(Baroni and Bisi, 2004) and cosine similarity to compute similarity. In order to make contexts, we also collect papers from the IEEE Xplore website. And the result of experiments is shown as the Table 5. Our method has the 100 percentage of correct answers, but the AVMI and cosine similarity had the 78%, 89% performance respectively. It is a remarkable result in comparison with existing researches.
A�Methodology�to�Measure�the�Semantic�Similarity�between�Words�based�on�the�Formal�Concept�Analysis
319

Table 5: Result of TOEFL Synonym Test.
Target word Candidate words Our
method AVMI
Cosine similarit
y
partition
partitioning 0.597 -3.94 0.114 dependability 0.454 −∞ 0.037
android 0.000 -5.10 0.028 transportation 0.213 -7.17 0.033
optimization
optimisation 5.217 -4.16 0.065 calibration 0.542 -4.47 0.079
internet 0.000 -4.16 0.010 innovation 0.000 -6.24 0.007
classification
categorization 4.134 -4.49 0.405 transportation 0.135 -3.96 0.033
biometrics 0.675 -6.23 0.046 calibration 1.241 -5.11 0.058
cryptography
steganography 1.712 -2.54 0.202 context 0.408 -4.37 0.035
innovation 0.000 -7.23 0.010 android 0.662 -7.20 0.096
reliability
dependability 1.173 −∞ 0.157 integration 0.483 -3.11 0.023 forecasting 0.192 -5.71 0.051
context 0.317 -5.44 0.048
cluster
clustering 4.952 -4.09 0.080 dependability 1.724 −∞ 0.070 authorization 0.000 -5.14 0.056 correlation 0.000 -4.94 0.049
contamination
pollution 0.871 -3.50 0.056 visualization 0.068 -6.02 0.021
entropy 0.000 −∞ 0.020 sorting 0.000 −∞ 0.007
encoding
encryption 1.452 -4.34 0.058 normalization 0.367 -4.79 0.050 segmentation 0.288 -4.65 0.025
lifetime 0.412 −∞ 0.026
experiment
experimentation 3.928 -4.92 0.186 sorting 0.000 -5.19 0.012
authentication 0.000 −∞ 0.009 aggregation 0.000 -5.02 0.037
5 CONCLUSIONS
This paper has presented a new method to measure the similarity between two queries. The experiment for evaluation shows that the effectiveness of this method is quite persuasive by comparing the semantic similarity of synonym and random pairs and finding the synonym among four candidate words. This method could be used to automatically find synonym from a lot of candidate words. It could cope with the changeable web since it uses the web data.
In the future research, the more experiments based on the larger sized dataset should be conducted. Moreover, we will devise the methodology to automatically generate candidate words to find the correct synonym.
ACKNOWLEDGEMENTS
This research was supported by Basic Science Research Program through the National Research Foundation of Korea (NRF) funded by the Ministry of Education, Science and Technology(2010-0024532)
REFERENCES
Alqadah, F. & Bhatnagar, R. 2011. Similarity Measures In Formal Concept Analysis. Annals Of Mathematics And Artificial Intelligence, 61, 245-256.
Baroni, M. & Bisi, S. Using Cooccurrence Statistics And The Web To Discover Synonyms In A Technical Language. Lrec, 2004.
Blondel, V. D. & Senellart, P. P. 2011. Automatic Extraction Of Synonyms In A Dictionary. Vertex, 1, X1.
Cole, R. & Eklund, P. W. 1999. Scalability In Formal Concept Analysis. Computational Intelligence, 15, 11-27.
Curran, J. R. & Moens, M. Improvements In Automatic Thesaurus Extraction. Proceedings Of The Acl-02 Workshop On Unsupervised Lexical Acquisition-Volume 9, 2002. Association For Computational Linguistics, 59-66.
Ganter, B., Stumme, G. & Wille, R. 2005. Formal Concept Analysis: Foundations And Applications, Springer.
Ganter, B., Wille, R. & Franzke, C. 1997. Formal Concept Analysis: Mathematical Foundations, Springer-Verlag New York, Inc.
Ho, N.-D. & Fairon, C. Lexical Similarity Based On Quantity Of Information Exchanged-Synonym Extraction. Rivf, 2004. Citeseer, 193-198.
Landauer, T. K. & Dumais, S. T. 1997. A Solution To Plato's Problem: The Latent Semantic Analysis Theory Of Acquisition, Induction, And Representation Of Knowledge. Psychological Review, 104, 211.
Lin, D. Automatic Retrieval And Clustering Of Similar Words. Proceedings Of The 17th International Conference On Computational Linguistics-Volume 2, 1998. Association For Computational Linguistics, 768-774.
Lin, D., Zhao, S., Qin, L. & Zhou, M. Identifying Synonyms Among Distributionally Similar Words. Ijcai, 2003. 1492-1493.
Lu, Z., Liu, Y., Zhao, S. & Chen, X. Study On Feature Selection And Weighting Based On Synonym Merge In Text Categorization. Future Networks, 2010. Icfn'10. Second International Conference On, 2010. Ieee, 105-109.
S Nchez, D. & Moreno, A. Automatic Discovery Of Synonyms And Lexicalizations From The Web. Ccia, 2005. 205-212.
Senellart, P. & Blondel, V. D. 2008. Automatic Discovery
WEBIST�2014�-�International�Conference�on�Web�Information�Systems�and�Technologies
320

Of Similarwords. Survey Of Text Mining Ii. Springer. Tam, G. K. Focas–Formal Concept Analysis And Text
Similarity. Proceedings Of The 2nd International Conference On Formal Concept Analysis, 2004.
Turney, P. 2001. Mining The Web For Synonyms: Pmi-Ir Versus Lsa On Toefl.
Van Der Plas, L. & Tiedemann, J. Finding Synonyms Using Automatic Word Alignment And Measures Of Distributional Similarity. Proceedings Of The Coling/Acl On Main Conference Poster Sessions, 2006. Association For Computational Linguistics, 866-873.
Vechtomova, O. & Wang, Y. 2006. A Study Of The Effect Of Term Proximity On Query Expansion. Journal Of Information Science, 32, 324-333.
Veronis, J. & Ide, N. M. Word Sense Disambiguation With Very Large Neural Networks Extracted From Machine Readable Dictionaries. Proceedings Of The 13th Conference On Computational Linguistics-Volume 2, 1990. Association For Computational Linguistics, 389-394.
Vickrey, D., Kipersztok, O. & Koller, D. An Active Learning Approach To Finding Related Terms. Proceedings Of The Acl 2010 Conference Short Papers, 2010. Association For Computational Linguistics, 371-376.
Wille, R. 2009. Restructuring Lattice Theory: An Approach Based On Hierarchies Of Concepts, Springer.
Wormuth, B. & Becker, P. Introduction To Formal Concept Analysis. 2nd International Conference Of Formal Concept Analysis February, 2004.
Wu, H. & Zhou, M. Optimizing Synonym Extraction Using Monolingual And Bilingual Resources. Proceedings Of The Second International Workshop On Paraphrasing-Volume 16, 2003. Association For Computational Linguistics, 72-79.
A�Methodology�to�Measure�the�Semantic�Similarity�between�Words�based�on�the�Formal�Concept�Analysis
321

A Recommendation System for Specifying and Achieving S.M.A.R.T.Goals
Romain Bardiau, Magali Seguran, Aline Senart and Ana Maria Tuta OsmanBusiness Intelligence Advanced Development, Sophia Antipolis, SAP Labs, Paris, France
{firstname, lastname}@sap.com
Keywords: Recommendation System, S.M.A.R.T. Goals, Forecast.
Abstract: Businesses and public organizations are typically goal-oriented trying to maximize their performance. Goalsare today set arbitrarily and are given without hints on how to achieve them. There are many applications thatallow setting up goals and sub-goals but the process is still manual. In this paper, we present a recommendationsystem that helps the user specify S.M.A.R.T. goals and monitor the progress towards these goals. Givena main goal on a metric, the system recommends specific sub-goals or indicators based on the forecast ofhistorical data. These recommended indicators are the most probable to have a higher contribution in helpingthe user to reach his main goal. The user can additionally monitor its progress with a visualization over time.We show how this system can be used in a business scenario for sales.
1 INTRODUCTION
Businesses and public organizations are looking fornew ways to maximize their precious resources whileminimizing costs, especially in difficult economiccontexts. Companies’ focus is typically on build-ing sustainable competitive advantages around theirstrategic resources to increase their profit and rev-enue, regardless the size of their business. Public or-ganizations top concerns are, on the other hand, toimprove their service, maximize the use of their re-sources, and cut expenses.
One effective tool for making progress towardsthese desired results is to set up goals. Unfortunately,goals are today set arbitrarily and given without hintson how to achieve them. For example, a sale managermay give a goal to his team members like ”increasecustomer satisfaction by 5 points” without any indica-tion on where the effort should be taken, i.e., whetherit should be on some specific products or on specificlocations. It is up to the employee to find out how hewill be able to achieve the goal by digging into andanalyzing operational information.
Many applications today can be used for set-ting, tracking and ultimately achieving goals (Harris,2013). The user can list his goals and associated tasks,set how often he wants to be reminded of them andcan share them with his friends on social networks.However, the process to set up these goals is manualand there is no automated help provided to track their
completeness. Some systems go a step further by dy-namically suggesting goal optimizations but they aredomain specific and mainly based on user monitoring(Digital, 2013).
In this paper, we present a recommendation sys-tem that helps the user specify a S.M.A.R.T. (Specific,Measurable, Assignable, Realistic, Time-related) goal(Meyer, 2003) and monitor the progress towards thisgoal. The system automatically recommends sub-goals or indicators to the user with minimal inter-action. These recommended indicators are the mostprobable to have a higher contribution in helping theuser to reach his main goal. To do so, the systemforecasts how the company or organization is likelyto perform for several activities based on past opera-tional data and identifies where the effort should betaken to improve the forecasted situation.
The user can additionally monitor the progress ofthe indicators over time with a visualization widget.This monitoring helps the user discover at a glancethe performance achieved. When progress suggeststhat the goal will unlikely be reached, adjustments ofthe goal can be made prior to the point in time whenthe goal should be accomplished.
To illustrate our recommendation system, we willdevelop a business scenario throughout this paper. Wewill consider Bob who is a sales representative inSpain. Given the low growth in sales last year fortablets, Bob decides to target a 10% increase in thefirst trimester of the coming year. We will show how
322

our solution will recommend indicators to help himreach his goal and will provide him with a widget thathe can include on his favorite web page to monitor theprogress.
The paper is organized as follows. Section 2presents the related work. Section 3 presents the rec-ommendation system, while Section 4 describes thearchitecture and implementation. Finally, Section 5presents conclusions and future work.
2 RELATED WORK
Recommendation systems are usually using differentfiltering techniques to find the most interesting itemsfor a user in a large space of possible options (Asanov,2011). Content filtering techniques take into accountthe content of items to filter the ones that better matchthe user’s preferences or profile (Kalles et al., 2003).Collaborative filtering is another technique that iden-tifies what items might be of interest for a particularuser by looking at the interest of similar users (Sarwaret al., 2001; Herlocker et al., 2004). There are somehybrid works that employs user-based and item-basedprediction to guess the rating that a user is going toprovide for an item. For example (Papagelis and Plex-ousakis, 2004) leverages the logged history of ratingsand content associated with users and items.
For goal setting, there are many applications thatlet the user manually set up goals, define sub-goalsand monitor the progress from one sub-goal to an-other sub-goal (Gregory, 2010; GoalScape, 2013;Milestone Planner, 2013) but very few that providerecommendations to the user. Bridgeline Digital(Digital, 2013) proposes a Smart RecommendationEngine that dynamically suggests ways to optimizecontent for e-commerce. The recommendation en-gine helps to reach critical campaign goals throughweb analytics and user monitoring. They have a list ofpre-established issues for each goal on which they arerunning functionality tests (e.g., download link/pagenot good, landing page does not drive to download).
In comparison, our solution does not need userprofiling, logged history (which might lead to pri-vacy issues), or predefined recommendations thatusually cannot cover all the possible current and fu-ture goals for any domain. Our solution is based onpast operational data to generate forecasts from whichS.M.A.R.T. recommendations are made. Past opera-tional data might originate from multiple sources andusually designs low-level data such as transactionsand prices. To our knowledge, there is no prior workin the literature that uses prediction techniques in or-der to make recommendations based on forecasted
operational data.
3 RECOMMENDATION SYSTEM
In the rest of the paper, we will assume to be in a busi-ness context where operational data is stored in datawarehouses. In a data warehouse, data is organizedhierarchically according to measures and dimensions.A measure is a numerical fact on operational data. Ex-amples of measures for specific product sales data in-clude quantity sold, revenue, and profit margin. Eachmeasure can be categorized into one or more dimen-sions. Dimensions define categories of stored data.Examples of dimensions include time, location, andproduct. Each dimension can have one or more sub-dimensions. For example, the time dimension can in-clude sub-dimensions of year, quarter, month, week,and so on.
3.1 Business Workflow
This section presents the business workflow detailingthe different steps that are followed to generate goalrecommendations.
3.1.1 Main Goal Setting
The user first defines a goal for a target measure byproviding input to a GUI, as depicted in Figure 1. Aquantitative value as point or percentage target needsto be entered for the goal. The user then selectsthe orientation of the defined goal (e.g., increase, de-crease, maintain) from a drop down menu and spec-ifies the time frame by selecting the dates in a cal-endar. The user finally selects a measure and possi-bly dimensions for the goal. The measures can beretrieved and ranked according to contextual data re-trieved from a user profile (e.g., job, title, location)or with collaborative filtering techniques on histori-cal data associated with the user (Liu et al., 2012).The user can alternatively select one measure from theset of all available measures in the data warehouse.The dimensions will act as filters and will restrict thescope of the selected measure.
Within the example business scenario discussedabove, Bob can provide user input to define a goal forincreasing sales growth by 10% from January 2014to March 2014. More particularly, Bob can selectthe measure ”sales growth” from the recommendedmeasures, input ”10” for the percentage target, select”increase” and set start and end dates. In Figure 1,the measures ”margins”, ”revenue” and ”total sales”
A�Recommendation�System�for�Specifying�and�Achieving�S.M.A.R.T.�Goals
323

Figure 1: Goal Setting.
were also available for selection in the ”financial” cat-egory of the data warehouse. After providing his in-put, Bob can select the ”Next” button to progress torecommended indicators.
3.1.2 Recommended Indicators
Once the user has defined his main goal, the sys-tem finds and recommends dimensions and sub-dimensions for the selected measure and associatedfilters. Figure 2 depicts an example GUI for display-ing these recommendations and for enabling user se-lection of one or more recommendations. These rec-ommendations are ranked based on the risk of the goalto be reached as it will be later explained in Section3.2.
The user can select a dimension from the rec-ommended dimensions selection menu and/or fromthe all dimensions menu. The dimensions listedin the latter menu include all available dimensionsin the data warehouse. In the scenario, the rec-ommended dimensions include dimension and sub-dimension ”city¿Barcelona” having a rank of 4.4 andother dimensions and sub-dimensions with a lowerrank.
The combination of the selected measures, filtersand dimensions define the indicator, which can bemonitored over the selected time frame to assist theuser in achieving the defined goal.
3.1.3 Goal Monitoring
Once an indicator has been fully specified by the user,the system generates a software widget that monitors
Figure 2: Selection of a Recommended Indicator.
the progress of the selected indicator towards reach-ing the goal (see Figure 3). A widget is a visual ap-plication or component comprising portable code in-tended to be used on different platforms. In addition,alerts are automatically set to inform the user whenthe trend has an undesired direction or reach a criticallevel, depending on user’s preferences. The alert cansupport the user to perform an action at a critical timein the timeframe to decrease the risk not to reach thegoal. Note that the recommendation of actions is outof the scope of this paper.
In our scenario, if the user has selected”City¿Barcelona” as indicator, then the system cre-ates a widget to monitor the trend of the sales growthin Barcelona over time with alerts when the growthdecreases. Bob adds the widget on his portal and en-terprise blog to track the sales growth and share it withhis colleagues.
3.2 Recommendation Model
Our recommendation model is based on a small set ofconcepts that are defined in this section.
First, we define risk as the probability of the rec-ommended indicators to be above or below a certainthreshold in the future. A forecast of operational datais performed to determine this risk. The threshold canbe based on one or more known trends associated with
WEBIST�2014�-�International�Conference�on�Web�Information�Systems�and�Technologies
324

Figure 3: Widget alert.
a measure. For example, the threshold can be the min-imum value or a maximum value that is establishedfor an indicator. In our case, the threshold is the valueassociated with the goal defined by the user (e.g., 10%in our scenario). The risk can be determined using acumulative distribution function (CDF) based on thepredicted trend and the threshold as follows:
risk =CDF( f utureTrend, threshold) (1)
We define the contribution of an indicator as therelative importance of the indicator in reaching theselected goal. The contribution can be specified man-ually by setting weights for indicators, or it can beautomatically calculated. In our system, the contribu-tion is calculated based on a predicted trend and oneor more known trends:
contribution =( f utureTrend − pastTrend)
∑( f utureTrend − pastTrend)(2)
Finally, the rank of an indicator can be determinedbased on a level of risk associated with the indicatorand the contribution in reaching the defined goal:
rank = risk ∗ contribution (3)
4 IMPLEMENTATION
In this section, we will present the general architec-ture and then how it has been implemented on SAPHANA Appliance product (Farber et al., 2011).
4.1 Architecture
Figure 4 depicts the general architecture of the solu-tion that is composed of three layers: a GUI layer,an engine layer, and a database layer. The GUI layeron the client-side provides interfaces from Section3.1 that can be displayed on any computing devices(desktop, laptop, smartphones, etc.). The engine layerand the database layer are hosted on one or moreservers. Communication between the client and theservers is over HTTP.
4.1.1 GUI Layer
The user interacts with a GUI of the GUI layer to gen-erate input data that is provided to the engine layer.User input includes at least an operational goal, atimeframe, an orientation, a measure and a dimension.
4.1.2 Engine Layer
The engine layer contains the following components:an engine for storing user input, a forecast engine, arisk calculator, a contribution calculator, and a rankcalculator. Data is automatically retrieved (e.g. atparticular intervals) or selectively retrieved by one ormore engines of the engine layer from one or moresources, processed and stored in the database layer.
Store User Input. This component receives datathat has been input through the GUI and provides thedata for storage in the user input data store. The userinput data will be later consumed by several enginesof the engine layer.
Forecast Engine This component receives user in-put data and past operational data (e.g., stored in thepast operational data store). Based on a predictionalgorithm, it processes the user input data and thepast operational data to generate a forecast that willbe stored in the forecast data store.
Risk Calculator. This component determines a riskassociated with the forecast based on the goal and ori-entation provided from the user input. The risk isstored in the dictionary data store.
Contribution Calculator. This component receivesuser input data and forecast data and processes thecontribution associated with a respective indicator.The contribution is stored in the dictionary data store.
A�Recommendation�System�for�Specifying�and�Achieving�S.M.A.R.T.�Goals
325
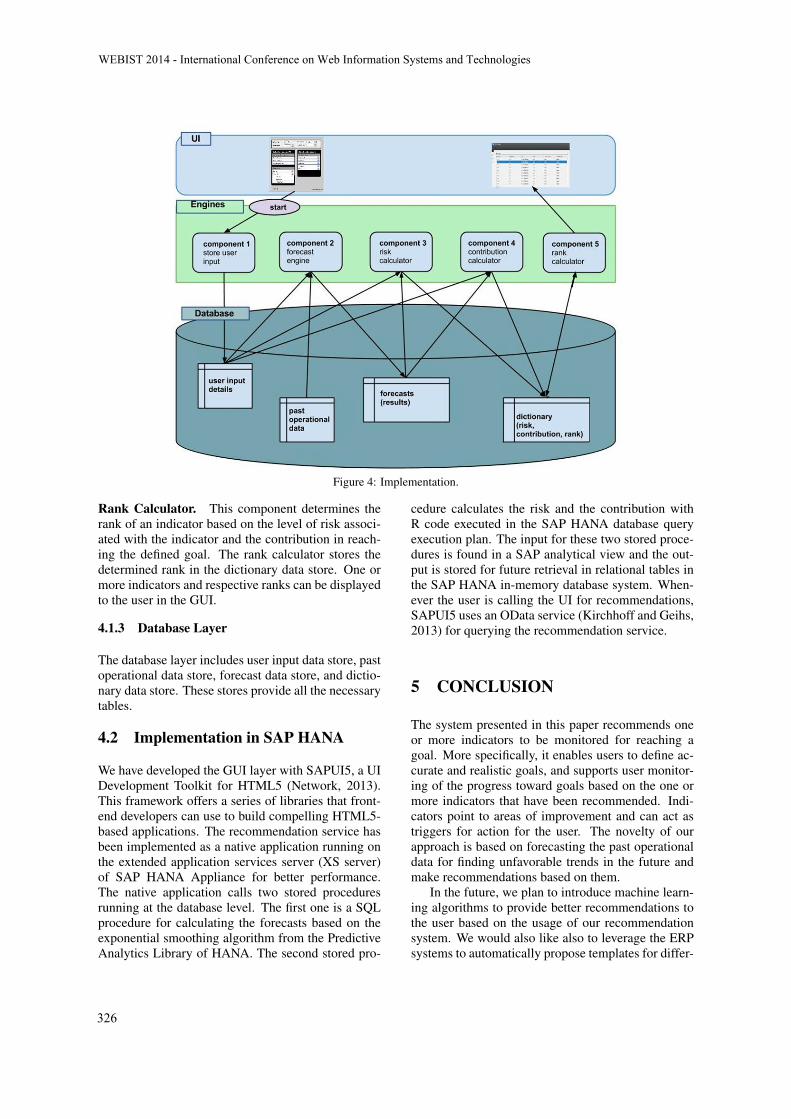
Figure 4: Implementation.
Rank Calculator. This component determines therank of an indicator based on the level of risk associ-ated with the indicator and the contribution in reach-ing the defined goal. The rank calculator stores thedetermined rank in the dictionary data store. One ormore indicators and respective ranks can be displayedto the user in the GUI.
4.1.3 Database Layer
The database layer includes user input data store, pastoperational data store, forecast data store, and dictio-nary data store. These stores provide all the necessarytables.
4.2 Implementation in SAP HANA
We have developed the GUI layer with SAPUI5, a UIDevelopment Toolkit for HTML5 (Network, 2013).This framework offers a series of libraries that front-end developers can use to build compelling HTML5-based applications. The recommendation service hasbeen implemented as a native application running onthe extended application services server (XS server)of SAP HANA Appliance for better performance.The native application calls two stored proceduresrunning at the database level. The first one is a SQLprocedure for calculating the forecasts based on theexponential smoothing algorithm from the PredictiveAnalytics Library of HANA. The second stored pro-
cedure calculates the risk and the contribution withR code executed in the SAP HANA database queryexecution plan. The input for these two stored proce-dures is found in a SAP analytical view and the out-put is stored for future retrieval in relational tables inthe SAP HANA in-memory database system. When-ever the user is calling the UI for recommendations,SAPUI5 uses an OData service (Kirchhoff and Geihs,2013) for querying the recommendation service.
5 CONCLUSION
The system presented in this paper recommends oneor more indicators to be monitored for reaching agoal. More specifically, it enables users to define ac-curate and realistic goals, and supports user monitor-ing of the progress toward goals based on the one ormore indicators that have been recommended. Indi-cators point to areas of improvement and can act astriggers for action for the user. The novelty of ourapproach is based on forecasting the past operationaldata for finding unfavorable trends in the future andmake recommendations based on them.
In the future, we plan to introduce machine learn-ing algorithms to provide better recommendations tothe user based on the usage of our recommendationsystem. We would also like also to leverage the ERPsystems to automatically propose templates for differ-
WEBIST�2014�-�International�Conference�on�Web�Information�Systems�and�Technologies
326
ent business lines.
REFERENCES
Asanov, D. (2011). Algorithms and Methods in Recom-mender Systems. Berlin Institute of Technology.
Digital, B. (Accessed in 2013). iAPPS Ana-lyzer. http://www.bridgelinedigital.com/website-management/web-analytics-solutions.
Farber, F., Cha, S. K., Primsch, J., Bornhovd, C., Sigg, S.,and Lehner, W. (2011). SAP HANA Database: DataManagement for Modern Business Applications. InSIGMOD Rec., volume 40, pages 45–51.
GoalScape (Accessed in 2013). GoalScape: Visual GoalManagement Software. http://www.goalscape.com.
Gregory, A. (2010). Goal Setting tracking tools.http://www.sitepoint.com/goal-setting-tracking-tools.
Harris, J. (Accessed in 2013). Cru-cial tools for business goal setting.http://www.paydayhr.com/1/post/2013/02/3-crucial-tools-for-business-goal-setting.html.
Herlocker, J. L., Konstan, J. A., Terveen, L. G., and Riedl,J. T. (2004). Evaluating collaborative filtering recom-mender systems. ACM Transactions on InformationSystems, 22:5–53.
Kalles, D., Papagelis, A., and Zaroliagis, C. (2003). Algo-rithmic aspects of web intelligent systems. In Zhong,N., Liu, J., and Yao, Y., editors, Web Intelligence,pages 323–344. Springer Berlin Heidelberg.
Kirchhoff, M. and Geihs, K. (2013). Semantic descrip-tion of odata services. In Proceedings of the FifthWorkshop on Semantic Web Information Manage-ment, number 2 in SWIM 13, pages 2:1–2:8, NewYork, NY, USA. ACM.
Liu, Q., Chen, E., Xiong, H., Ding, C., and Chen, J. (2012).Enhancing collaborative filtering by user interest ex-pansion via personalized ranking. IEEE Transactionson Systems, Man, and Cybernetics, Part B: Cybernet-ics, 42(1):218–233.
Meyer, P. J. (2003). Attitude Is Everything: If You Want toSucceed Above and Beyond. Meyer Resource Group,Incorporated.
Milestone Planner (Accessed in 2013). Mile-stone Planner: Powerfully Simple Planning.http://milestoneplanner.com.
Network, S. C. (Accessed in 2013). UI Devel-opment Toolkit for HTML5 Developer Cen-ter. http://scn.sap.com/community/developer-center/front-end.
Papagelis, M. and Plexousakis, D. (2004). Qualitative anal-ysis of user-based and item-based prediction algo-rithms for recommendation agents. In Cooperative In-formation Agents VIII, volume 3191 of Lecture Notesin Computer Science, pages 152–166. Springer BerlinHeidelberg.
Sarwar, B., Karypis, G., Konstan, J., and Riedl, J. (2001).Item-based collaborative filtering recommendation al-gorithms. In Proceedings of the 10th InternationalConference on World Wide Web, pages 285–295, NewYork, NY, USA.
A�Recommendation�System�for�Specifying�and�Achieving�S.M.A.R.T.�Goals
327
An Self-configuration Architecture for Web-API of Internet of Things
Eric Bernardes Chagas Barros and Admilson de Ribamar L. Ribeiro Computing Department, Universidade Federal de Sergipe, Aracaju, Brazil
[email protected], [email protected]
Keywords: IoT, Web-APIs, Self-configurable, Internet of Things, Web of Things, WoT, Self-configuration, REST, Mote.
Abstract: The internet of things (IoT) is the paradigm that will dominate the computing world in the coming years. In this way, studies should be conducted in such way to ensure its enhancement and in the quest for that improvement is necessary to use the already existing technologies that apply to IoT. This paper's purpose is to unite different technologies like REST, cloud computing and embedded operating system in order to obtain mechanisms capable of self-configuration. Thus, it was possible to conclude that the architecture proposed would increase useful techniques for the implementation of systems that want to run the self-configuration as well as assist in setting up networks of computers that work with wireless sensors and IoT.
1 INTRODUCTION
Internet of Things (IoT) is the paradigm that until 2025 will dominate the world of computing (Atzori, 2010). The ubiquity of the Internet in less than 20 years almost connected all people in the world and has generated new demands for space. Now people not only need to exchange information and services, but also objects. Although for this to occur it is still necessary that both, the technology and society are prepared.
The Things which refers to this paradigm are related to devices or motes that are arranged in an environment and have their own characteristics, how to measure a temperature, check if the light is on, if a window is open, the amount of milk in a refrigerator, among many other possibilities. By capturing the information for which they were programmed, these devices send data through existing Internet's services to let user become aware that these data are stored and can provide some useful information to him. The use of existing resources on the web by these motes can be done through APIs and can be characterized by the use of cloud computing, when this happens it is customary to call these APIs of Web-APIs (Zeng, 2011).
The configuration and installation of devices that will integrate a large and complex systems within the IoT is a challenge that is time consuming and error prone, even for the great specialists (Kephart,
2003). Moreover, the large growth of network nodes made with different technologies and different platforms can result in a hard and repetitive work.
Therefore, to facilitate the use of such devices, and applications' development, the use of techniques that enables the system to adapt itself to the environment and self-configure is a great need. However, the Web-APIs that exists in nowadays has not yet incorporated these concepts yet.
This paper aims to introduce a mechanism of self-configuration for the Internet of Things, where the main idea is to make easier the configuration of devices and Web-APIs that will control the environment.
This paper aims to introduce a mechanism of self-configuration for the Internet of Things, where the main idea is to make easier the configuration of devices and Web-APIs that will control the environment.
The remainder of this paper is organized as follows. In section 2, will be shown on the existing requirements nowadays and that contribute to the development of Web-APIs. Section 3 talks about the Web-APIs that exists in the market and the summary of its main characteristics. Finally, in Section 4, the proposed architecture will be explained and a possible mechanism architecture that can be used in the development of self-configurable Web APIs. Conclusion and future research hints are given in Section 5.
328
2 REQUIREMENTS OF WEB-APIS IN INTERNET OF THINGS
Currently, the existing Web-APIs have a set of basic characteristics that are used to carry out the communication of devices with the Internet or for needs of these motes due to its limitations. These fundamental features are described in this article in order to enumerate some of the concepts that can be used to serve as basis for self configuration mechanism, such as the form of communication with Rest (Zeng, 2011), storage and standardization communication through the use of markup data languages (XML, YAML, JSON) (Xively 2013).
2.1 Open-source
Although this characteristic is not a specific functionality that help directly the devices, it was regarded as important for that in the future people will work on top of existing Web-APIs and make your code to be improved and become Customer self-configurable.
This term refers to the so-called free software, where to be held a consolidated distribution, is also distributed its source code for that can be freely used, modified and shared by its users.
2.2 Rest
The REST-based architecture is considered "the true architecture of the Web" (Zeng, 2011), it is based on the concept that everything is modeled as resource using the HTTP URI. Thus, customers can identify the resources they need through the URI, manipulating them through traditional HTTP commands like: PUT, GET, POST and DELETE. The PUT and DELETE.
Moreover, it has self-descriptive messages, i.e, the resources are free to make their own representations of data format. Obviously, end-systems must agree with this representation so that communication can take place properly. In this way, it is possible to use HTML, XML, text, PDF and images as the format of data to be sent.
Another important feature is that REST works with stateless requests, treating each request independently, and this may not require a server to store session information or the status as is each of the multiple acquisitions. However, statefull interactions can be supported in REST through the use of hyperlinks, so the states of the resources can
be transferred by means of URIs for cookies or hidden fields (Zeng, 2011).
2.3 Standardization
As the APIs and the devices are usually developed in different languages, it must be pre-established a format of data communication between the receiver and transmitter and how they will exchange messages to inform how the data is separated and what the content within it represent. Consistently, to earn this type of representation the IoT sought markup languages known data, such as XML, JSON, YAML or CSV.
These languages are very portable because it does not depend on hardware or software platforms to work and any databases can communicate with each other through them. By having the ability to self define data, as well as having the characteristics described above, these languages are used for interoperable networks, allowing objects of different characteristics understand each other.
2.4 Centralized Architecture
Due to the limitations of the devices many of the activities more robust need to be sent to a server that has capacity to perform a greater load of processing and storage. Therefore currently the Web-APIs, tend to be centered on a server that is able perform this type of activity. Thus, a network IoT using these Web-APIs tend to use the REST to communicate with a server that is receiving data and managing the devices in the network.
2.5 Security
When the term security is mentioned, the first word illustrated is identification. In IoT, recognition of each device with the use of traditional IPs. Despite this, only a network identification is not sufficient to ensure the safety, it is necessary a profile control to inform if this equipment has access to the service that it is requesting. As in IoT these services are provided by APIs, the controls of inflows are usually made by API-Keys.
Within the API-Key are encapsulated three types of permissions that operate in a hierarchical manner: object key (the general key of the API), object permissions and the permissions of features of objects, the latter being optional. The general permissions objects keys are created for your applications to have access to APIs. Each application may ask how many objects keys you
An�Self-configuration�Architecture�for�Web-API�of�Internet�of�Things
329
need. An object key can have multiple objects
permissions (it is mandatory at least one) and each acquiescence of object contains a set of different permissions. For example, a key can be created to allow a read-only access to the entire public resource available, in the same way, can allow a write access to a resource responsible for supply of data by means of a specific IP (Xively, 2013). There are still the feature permissions that serve to restrict access to a given resource. These permissions, as were elucidated above, are optional.
In addition to the API-Keys which grants the security level of access control, there is the HTTPS that provides security at the level of sending and receiving data throughout an encrypted and secured channel. As the APIs’ principal way of communication focus on HTTP (REST and SOAP) the use of HTTPS helps to prevent the attacks of type man-in-the-middle, seen that the HTTPS is the implementation of HTTP on top of the SSL/TLS protocol to provide authentication of hosts purposes and encrypted communication between them.
2.6 Self-configuration
With the advance of network technologies, devices shipped and software tools, the growth of heterogeneous nodes, of great complexity and extremely dynamic that pass to operate within the Internet becomes something that cannot be easily administered.
The autonomic computing is inspired in the human being’s nervous system. Its main objective is to develop applications that can self-according to guidelines imposed by human beings at a high level. Thus with the policies established at a high level it is possible to make the systems self-reliant to self-configure, self-healing, self-optimization and the self-protection (Kephart, 2003).
The self-configuration is responsible for automated configuration of system components, with it the system will automatically adjust and it always will adjust based on policies of self-configuration. The self-optimizing components and systems continually seeking opportunities to improve their own performance and efficiency. Self-healing the system automatically detects, diagnoses and repairs problems of software and hardware located. The Self-Protection system automatically if defends against malicious attacks or cascading failures. It uses earlier warnings to anticipate and prevent failures in the entire system (Kephart, 2003).
2.7 Code-source Device
As each device needs to communicate with the Web-API through the REST, many of these offer codes-sources for which the user copy and paste in Integrated Development Environment (IDE) responsible for programming the device. In this way it is possible to at least have an example that how to program a device and if it is possible already find a code that is applicable to the device that will enter the network.
However it is important to realize that although there may be a useful source code available for the used equipment perform the copy and paste codes for multiple appliances can be an arduous task and subject to errors even for the great specialists, once that may exist dozens of these to be configured in a single environment.
2.8 Storage
The storage of data in IoT is an interesting area of study, once the majority of devices that exist in a network of this type do not have large storage capacity. In contrast, the data used in the communication are stored in a central device that has the characteristics necessary for the recording of relevant data to the system.
As the WEB-APIs are on a server that contains high processing power and storage capacity, they are usually responsible for the storage of data that is captured and transmitted by devices. For this reason, it is used the concept of Feeds (system risers). These feeders are a specific part of the API that works with the reading and writing of data from the system.
Each Feed is a set of channels (datastream) that enables the exchange of data between the APIs and authorized devices. These channels are designed by programmers to separate the data by specific characteristics. In view of this, it is possible to create public and private channels. The first are those that can be viewed and changed by all according to the BCC License, already the second, it is those whose access is permitted only to developers and those whose admission is granted. Within channels there is the concept of DataPoint which is the representation of the data in a given time (timestamp) (Xively, 2013).
3 RELATED WORK
In this section will be elucidated the main existing Web-APIs and what features they have. These
WEBIST�2014�-�International�Conference�on�Web�Information�Systems�and�Technologies
330
features are related to the requirements that were previously seen.
3.1 ThingSpeak
ThingSpeak is an API for "Internet of Things" open-source that stores and retrieves data from devices using the Hypertext Transfer Protocol (HTTP) over the Internet or simply of a LAN (Local Area Network). With this API (Application Programming Interface) it is possible to create applications in sensors for data records in a given environment, tracking, location and social networks of "things" (ThingSpeak, 2013). The data manipulation occurs by means of its channels, which have eight fields to be fed with data numeric and alphanumeric pagers, in addition to fields such as latitude and longitude, elevation and status.
3.2 NimBits
It is a collection of software components designed to record data of time series, such as for example, the changes in temperature read by a given sensor (NimBits, 2013). This API has the drive of events (triggers) during the recording of data. In This way, it is possible to perform calculations or trigger alerts along with your receipt.
Another advantage is that it was designed to be the first historian of world data, which means that you can download it and install it on any server, local or in the cloud, so that it is used the Linux Ubuntu and Google App Engine. This approach allows all instances of API to relate being possible to find other feeders (feeds) of data and make possible a connection with them (NimBits, 2013).
3.3 Open.sen
Currently in beta stage, this tool allows a rich visualization of results, so that by SenseBoard, you can see the incoming data in real time. The SenseBoard is powered by applications that are developed and installed within the API itself. These applications are independent but can be easily integrated with feeder (feeds) devices (Open.sen., 2013). These feeders communicate with the API through channels that are connected to devices. Even so, it is possible to capture information from other applications, not needing a direct contact with the device.
3.4 Cosm
This tool (formerly called Pachube) was developed to be a platform as a service (PaaS) for the Internet of things. With it, you can manage multiple devices through the RESTful resources, thus it is possible to deal with all the components of the API (Feeds, triggers, datastreams and datapoint) using commands via HTTP URLs, as already seen, PUT, GET, DELETE, POST. PUT is used to change the data, GET to reading, DELETE to erase and POST to create resources to communication or control (Xively, 2013).
3.5 SensorCloud
The SensorCloud is a tool storage for sensors "things". SensorCloud provides a Rest API to allow the upload of data to the server. The API implementation is based on patterns of HTTP commands. Soon, it is easily adapted to any platform (SensorCloud, 2013).
The communication between the tool and the sensors is totally on top of HTTPS, which means the entire communication between the channels and the devices are encrypted.
The format for sending and receiving data is the XDR (External Data Representation), it is not yet possible to use the templates known JSON and XML. The purpose of not using the formats standards of delivery is due to the fact that the XDR is not text but binary mode and with this it is possible that sensors for low processing power are able to send larger amounts of data than the standards based on text (SensorCloud, 2013).
Their components are divided hierarchically, where the device is at a higher level and contains the sensors that are divided into channels and these have the data.
3.6 Evrythng
It is a platform for powering applications or services directed by dynamic information about physical objects. Your goal is that all things must be connected, thus sets a world where all 'Thng' have a digital presence of assets on the Internet, even in social networks if desired, allowing the rapid development of Web applications using real-time information flowing from, any object in the world (Evrythng 2013).
An�Self-configuration�Architecture�for�Web-API�of�Internet�of�Things
331
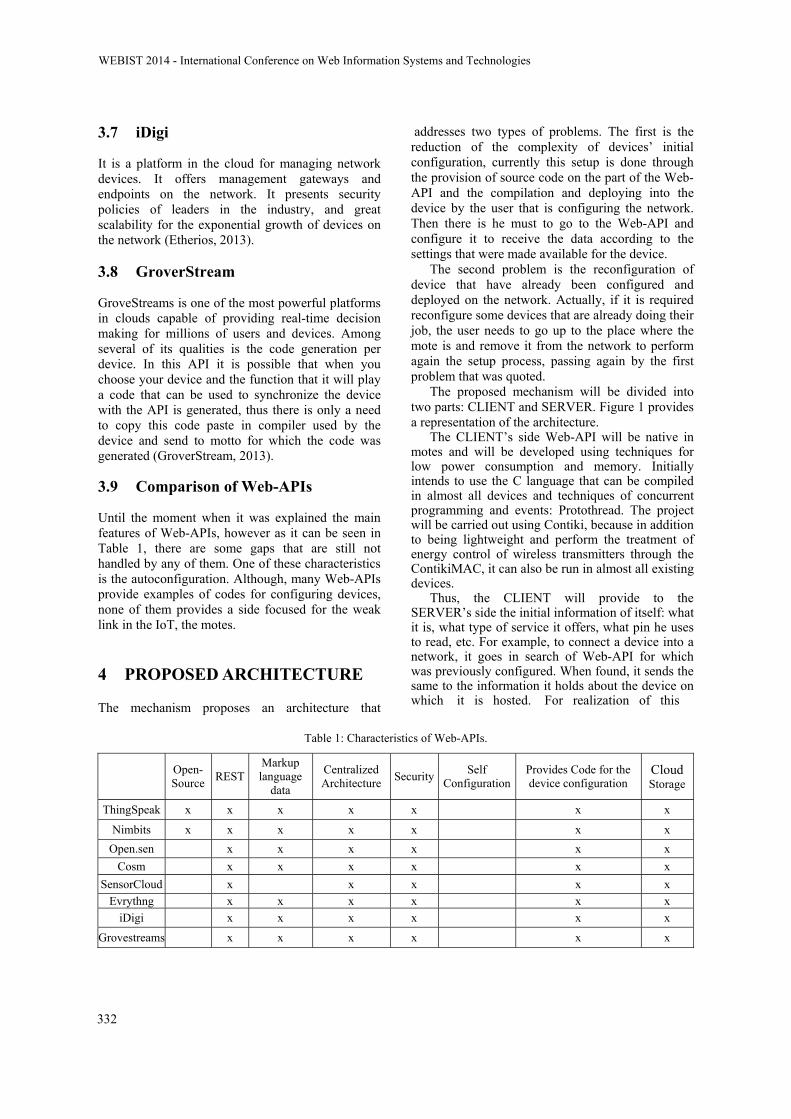
3.7 iDigi
It is a platform in the cloud for managing network devices. It offers management gateways and endpoints on the network. It presents security policies of leaders in the industry, and great scalability for the exponential growth of devices on the network (Etherios, 2013).
3.8 GroverStream
GroveStreams is one of the most powerful platforms in clouds capable of providing real-time decision making for millions of users and devices. Among several of its qualities is the code generation per device. In this API it is possible that when you choose your device and the function that it will play a code that can be used to synchronize the device with the API is generated, thus there is only a need to copy this code paste in compiler used by the device and send to motto for which the code was generated (GroverStream, 2013).
3.9 Comparison of Web-APIs
Until the moment when it was explained the main features of Web-APIs, however as it can be seen in Table 1, there are some gaps that are still not handled by any of them. One of these characteristics is the autoconfiguration. Although, many Web-APIs provide examples of codes for configuring devices, none of them provides a side focused for the weak link in the IoT, the motes.
4 PROPOSED ARCHITECTURE
The mechanism proposes an architecture that
addresses two types of problems. The first is the reduction of the complexity of devices’ initial configuration, currently this setup is done through the provision of source code on the part of the Web-API and the compilation and deploying into the device by the user that is configuring the network. Then there is he must to go to the Web-API and configure it to receive the data according to the settings that were made available for the device.
The second problem is the reconfiguration of device that have already been configured and deployed on the network. Actually, if it is required reconfigure some devices that are already doing their job, the user needs to go up to the place where the mote is and remove it from the network to perform again the setup process, passing again by the first problem that was quoted.
The proposed mechanism will be divided into two parts: CLIENT and SERVER. Figure 1 provides a representation of the architecture.
The CLIENT’s side Web-API will be native in motes and will be developed using techniques for low power consumption and memory. Initially intends to use the C language that can be compiled in almost all devices and techniques of concurrent programming and events: Protothread. The project will be carried out using Contiki, because in addition to being lightweight and perform the treatment of energy control of wireless transmitters through the ContikiMAC, it can also be run in almost all existing devices.
Thus, the CLIENT will provide to the SERVER’s side the initial information of itself: what it is, what type of service it offers, what pin he uses to read, etc. For example, to connect a device into a network, it goes in search of Web-API for which was previously configured. When found, it sends the same to the information it holds about the device on which it is hosted. For realization of this
Table 1: Characteristics of Web-APIs.
Open-Source
RESTMarkup language
data
Centralized Architecture
SecuritySelf
ConfigurationProvides Code for the device configuration
Cloud Storage
ThingSpeak x x x x x x x
Nimbits x x x x x x x
Open.sen x x x x x x
Cosm x x x x x x
SensorCloud x x x x x
Evrythng x x x x x x
iDigi x x x x x x
Grovestreams x x x x x x
WEBIST�2014�-�International�Conference�on�Web�Information�Systems�and�Technologies
332
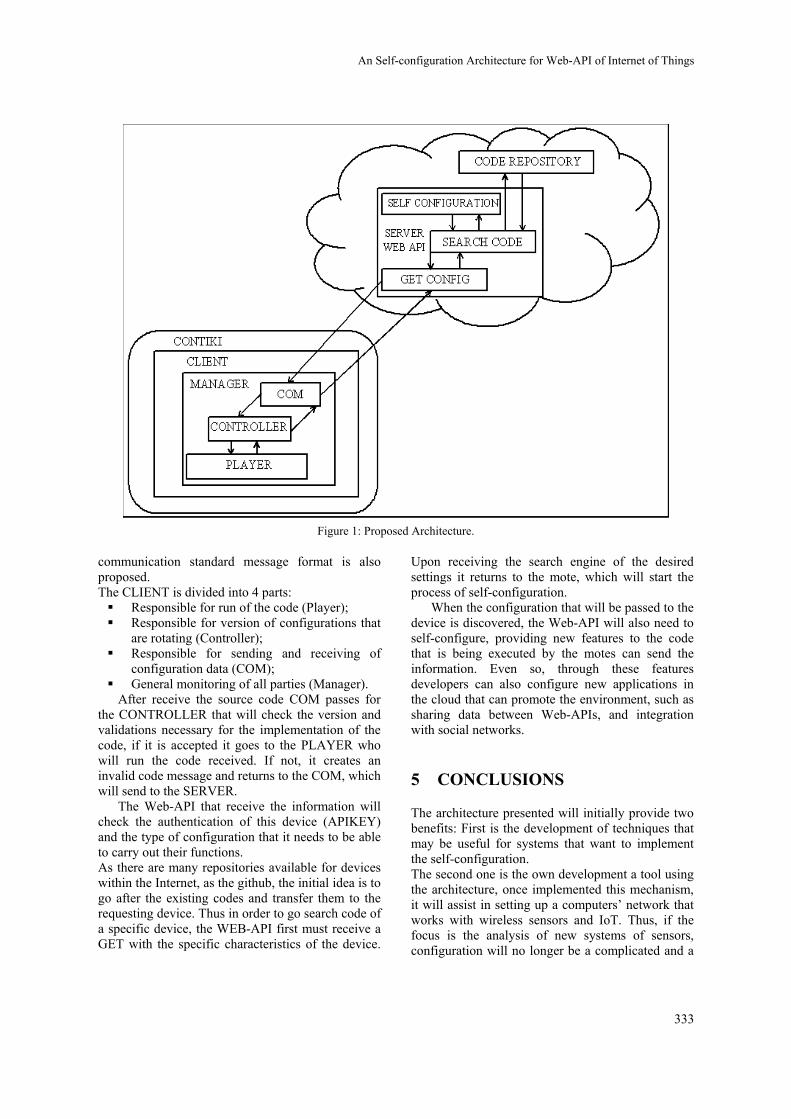
Figure 1: Proposed Architecture.
communication standard message format is also proposed. The CLIENT is divided into 4 parts: Responsible for run of the code (Player); Responsible for version of configurations that
are rotating (Controller); Responsible for sending and receiving of
configuration data (COM); General monitoring of all parties (Manager).
After receive the source code COM passes for the CONTROLLER that will check the version and validations necessary for the implementation of the code, if it is accepted it goes to the PLAYER who will run the code received. If not, it creates an invalid code message and returns to the COM, which will send to the SERVER.
The Web-API that receive the information will check the authentication of this device (APIKEY) and the type of configuration that it needs to be able to carry out their functions. As there are many repositories available for devices within the Internet, as the github, the initial idea is to go after the existing codes and transfer them to the requesting device. Thus in order to go search code of a specific device, the WEB-API first must receive a GET with the specific characteristics of the device.
Upon receiving the search engine of the desired settings it returns to the mote, which will start the process of self-configuration.
When the configuration that will be passed to the device is discovered, the Web-API will also need to self-configure, providing new features to the code that is being executed by the motes can send the information. Even so, through these features developers can also configure new applications in the cloud that can promote the environment, such as sharing data between Web-APIs, and integration with social networks.
5 CONCLUSIONS
The architecture presented will initially provide two benefits: First is the development of techniques that may be useful for systems that want to implement the self-configuration. The second one is the own development a tool using the architecture, once implemented this mechanism, it will assist in setting up a computers’ network that works with wireless sensors and IoT. Thus, if the focus is the analysis of new systems of sensors, configuration will no longer be a complicated and a
An�Self-configuration�Architecture�for�Web-API�of�Internet�of�Things
333
time consuming step, letting all the attention be directed to the main objective of the research.
For future work there is the possibility of developing the proposed architecture using existing Web-APIs, stated that work like ThingSpeak and Nimbits are great candidates for this development since they have available for IoT good features and they are open-source.
Another challenge is the development of a Web-Api that will provide the self-configuration for other existing Web-APIs. With this, besides the implementation of the proposed architecture for IoT, will need to draw up a technical architecture and interoperability for the Web-APIs of the Internet of Things and the clouds.
REFERENCES
Atzori, L; Iera, A; Morabito, G. The Internet of Things: A survey. Computer Networks, 2010. Computer Network.
Bandyopadhyay, S. A. Survey of Middleware for Internet of Things. International Journal of Computer Science & Engineering. Survey (IJCSES), 2011.
Zeng D., Guo S, and Cheng Z. The Web of Things: A Survey. Journal of Communications, vol. 6, setembro 2011.
https://xively.com/dev/docs/api/security/keys/ last accessed October 14, 2013.
http://www.json.org/ last accessed October 14, 2013. http://www.w3.org/XML/ last accessed October 14, 2013. http://www.computerworld.com/s/article/43487/Applicatio
n_Programming_Interface last accessed October 14, 2013.
https://www.thingspeak.com/ last accessed October 14, 2013.
http://www.nimbits.com/ last accessed October 14, 2013. http://open.sen.se/apps/29/ last accessed October 14, 2013. http://www.sensorcloud.com/sites/default/files/SensorClou
d_Open_Data_API.pdf last accessed October 14, 2013.
https://grovestreams.com/ last accessed October 14, 2013. http://www.etherios.com// last accessed October 14, 2013. http://www.contiki-os.org/ last accessed October 14, 2013. Ruane, Laure. Protothread. UserGuide.
https://code.google.com/p/protothread/wiki/UsersGuide. 2013 last accessed October 14, 2013.
Parachar M, Hariri S. Autonomic Computing: An Overview. Springer Berlin Heidelberg. 2005.
Kephart, Jeffrey O. The vision of Autonomic Computing. IEEE Computer Society. 2003.
http://www.evrythng.com/ last accessed October 14, 2013.
WEBIST�2014�-�International�Conference�on�Web�Information�Systems�and�Technologies
334

A Comparison of Three Pre-processing Methods for Improving MainContent Extraction from Hyperlink Rich Web Documents
Moheb Ghorbani1, Hadi Mohammadzadeh2 and Abdolreza Nazemi3
1Faculty of Engineering, University of Tehran, Tehran, Iran2Institute of Applied Information Processing, University of Ulm, Ulm, Germany
3School of Economics and Business Engineering, Karlsruhe Institute of Technology (KIT), Karlsruhe, [email protected], [email protected], [email protected]
Keywords: Main Content Extraction, Pre-processing Algorithms, Hyperlink Rich Web Documents.
Abstract: Most HTML web documents on the World Wide Web contain a lot of hyperlinks in the body of main con-tent area and additional areas. As extraction of the main content of such hyperlink rich web documents israther complicated, three simple and language-independent pre-processing main content extraction methodsare addressed in this paper to deal with the hyperlinks for identifying the main content accurately. To evaluateand compare the presented methods, each of these three methods is combined with a prominent main con-tent extraction method, called DANAg. The obtained resultsshow that one of the methods delivers a higherperformance in term of effectiveness in comparison with theother two suggested methods.
1 INTRODUCTION
A huge volume of web pages being mainly text isplaced on the web every day. A significant proportionof this data is published in news websites like CNNand Spiegel as well as information websites such asWikipedia and Encyclopedia. Generally speaking, ev-ery web page of the news/information websites in-volves a main content (MC) and there is a great in-terest to extract it at a high accuracy because the MCcan be saved, printed, sent to friends and etc. there-after.
In spite of the numerous studies which have beendone during the recent decade on extraction of theMC from the web pages and especially from the newswebsites, and although many algorithms with an ac-ceptable accuracy have been implemented, they haverarely paid attention to two critical issues, namelypre-processing and post-processing. Thus, these MCalgorithms were not fully successful in some cases.Particularly, the MC extraction algorithms have oftenfailed to extract the MC from the web pages whichcontain a great number of hyperlinks like for exampleWikipedia. This paper will introduce and comparethree different methods which can be used for pre-processing of the MC extraction algorithms based onHTML source code elements. Each of the three pre-sented methods is combined with a DANAg (Moham-madzadeh et al., 2013) algorithm as a pre-processor
in order to be able to compare them with each other.The obtained results show that one of the suggestedmethods is very accurate.
This paper is organized as follows: Section 2reviews the related work briefly, while the pre-processing approaches are discussed in Section 3.The data sets and experiments are explained in Sec-tion 4, and Section 5 makes some conclusions.
2 RELATED WORK
Algorithms and tools which are implemented for maincontent extraction usually employ an “HTML DOMtree structure” or “HTML source code elements” orin simple words HTML tags. Algorithms can also bedivided into three categories based on the HTML tagsincluding “character and token-based” (Finn et al.,2001), “block-based” (Kohlschutter et al., 2010), and“line-based”. Most of these algorithms need to knowwhether the characters in an HTML file are compo-nents of content characters or non-content characters.For this purpose, a parser is usually used to recognizewhich type of the component they are. Character andtoken-based algorithms take an HTML file as a se-quence of characters (tokens) which certainly containthe main content in a part of this sequence. Havingexecuted the algorithms of this section, a sequence
335

of characters (tokens) is labeled as the main contentand is provided to the user. BTE (Finn et al., 2001)and DSC (Pinto et al., 2002) are two of the state-of-the-art algorithms in this category. Block-based maincontent extraction algorithms, e.g. boilerplate detec-tion using shallow text features (Kohlschutter et al.,2010), divide an HTML file into a number of blocks,and then look for those blocks which contain the maincontent. Therefore, the output of these algorithmsis comprised of some blocks which probably con-tain the main content. Line-based algorithms suchas CETR (Weninger et al., 2010), Density (Morenoet al., 2009), and DANAg (Mohammadzadeh et al.,2013), consider each HTML file as a continuous se-quence of lines. Taking into account the applied logic,they introduce those lines of the file which are ex-pected to contain the main content. Then, the maincontent is extracted and provided to the user from theselected lines. Most of the main content extractionalgorithms benefit from some simple pre-processingmethods which remove all JavaScript codes, CSScodes, and comments from an HTML file (Weningeret al., 2010) (Moreno et al., 2009) (Mohammadzadehet al., 2013) (Gottron, 2008). There are two major rea-sons for such an observation: (a) they do not directlycontribute to the main text content and (b) they do notnecessarily affect content of the HTML document atthe same position where they are located in the sourcecode. In addition some algorithms (Mohammadzadehet al., 2013) (Weninger et al., 2010) normalize lengthof the line and, thus render the approach independentfrom the actual line format of the source code.
3 PRE-PROCESSING METHODS
In this section, all kinds of the pre-processing meth-ods are explained in detail. Hereafter, these meth-ods are referred to as Filter 1, Filter 2, and Filter3, for further simplicity. In this contribution, onlythe presented pre-processing methods are combinedwith one of the line-based algorithms which is calledDANAg (Mohammadzadeh et al., 2013).
3.1 Filter 1
Algorithm 1 shows the simple logic used in Filter 1.It can be seen that one just needs to remove all theexisting hyperlinks in an HTML file which is done atline 4 of this algorithm. The only disadvantage of thispre-processing method is that by removing the hyper-links, the anchor texts are also removed. As a result,this will cause the hyperlinks in the extracted maincontent to be lost. Thus, their anchor texts, which
must be seen in the main content, will no longer existin the final main content. Consequently, the applica-tion of Filter 1 will reduce either the accuracy or theamount of recall (Gottron, 2007). In the ACCB algo-rithm (Gottron, 2008), as an adapted version of CCB,all the anchor tags are removed from the HTML filesduring the pre-processing stage, i.e. Filter 1.
Algorithm 1: Filter 1.
1: Hyper = {h1,h2, ...,hn}2: i = 13: while i <= n do4: hi.remove()5: i = i+16: end while
3.2 Filter 2
The idea behind Filter 2 which is shown in Algo-rithm 2 implies that the all attributes of each anchortag are removed. With respect to Algorithm 2, whichshows the pseudocodes of Filter 2, one can understandthat an anchor tag contains only an anchor text.
<a>anchor text</a>
An advantage of Filter 2 over Filter 1 is that someanchor texts related to the anchor tags, which are lo-cated in the main content area, can be extracted by us-ing Filter 2. In other words, the amount of recall (Got-tron, 2007) yielded from application of Filter 2 wouldbe greater than the one obtained from Filter 1.
Algorithm 2: Filter 2.
1: Hyper = {h1,h2, ...,hn}2: i = 13: while i <= n do4: for each attribute o f hi do5: hi.remove(attribute)6: end for7: i = i+18: end while
3.3 Filter 3
In the third pre-processing method, called Filter 3, allthe HTML hyperlinks are normalized. In other words,the purpose of this method is to normalize the ratio ofcontent and code characters representing the hyper-links. Filter 3 is addressed in the AdDANAg (Mo-hammadzadeh et al., 2012) algorithm.
For further simplification and better compre-hension, the underlying approach of Filter 3is described using a typical example. In thefollowing HTML code, the only attribute ishref="http://www.spiegel.de/".
WEBIST�2014�-�International�Conference�on�Web�Information�Systems�and�Technologies
336

<a href="http://www.spiegel.de/">Spiegel Web
Site</a>
Now, length of the anchor text is calculated andsaved for each hyperlink (in this example:SpiegelWeb Site) into a variable calledlength. Then, theattribute part of the opening tag is substituted witha string of space characters () with a length of(length−7) where the value 7 comes from the lengthof <a></a>. Therefore, the new hyperlink for this ex-ample should be as below:
<a >Spiegel Web Site</a>
The above-mentioned explanations of Filter 3 aresummarized in Algorithm 3. As can be observed inthis algorithm, thewhile loop which is repeated forntimes calculates the length of the anchor text relatedto each hyperlink and stores in the LT variable. Then,a string of LT-7 length is made from the space char-acter and then is inserted into a string variable “Str”.Finally, the attribute part of the hyperlink is replacedwith the Str string.
Algorithm 3: Filter 3.
1: Hyper = {h1,h2, ...,hn}2: i = 13: while i <= n do4: length = Length(hi.anchor text)5: String Str = new String(“ ” , length−7)6: substitute(hi.attributes,Str)7: i = i+18: end while
4 DATA SETS AND RESULTS
To evaluate all the three pre-processing algorithms,two suitable data sets are introduced by (Gottron,2008) and (Mohammadzadeh et al., 2013). Compo-sition and size of the evaluation data sets are given inTables 1 and 2.
The first dataset contains 2,166 web documentsin Arabic, Farsi, Pashto, and Urdu and has been col-lected from 10 different web sites for evaluation ofthe main content extraction in right-to-left languageweb documents. The second corpus contains 9,101web pages in English, German, and Italian from 12different web sites and has been established for eval-uation of the main content extraction in western lan-guage web documents.
Tables 3 and 4 list the obtained results, i.e. recall,precision and F1 score (Gottron, 2007), from combin-ing each of the filters introduced in this paper with theDANAg algorithm. Tables 3 and 4 are again dividedinto three parts: the first part contains 4 rows and
Table 1: Evaluation corpus of 2,166 web pages.
web site size languages
BBC 598 Farsi
Hamshahri 375 Farsi
Jame Jam 136 Farsi
Al Ahram 188 Arabic
Reuters 116 Arabic
Embassy of 31 Farsi
Germany, Iran
BBC 234 Urdu
BBC 203 Pashto
BBC 252 Arabic
Wiki 33 Farsi
Table 2: Evaluation corpus of 9,101 web page.
web site size languages
BBC 1,000 English
Economist 250 English
Golem 1,000 German
Heise 1,000 German
Manual 65 German, English
Republica 1,000 Italian
Slashdot 364 English
Spiegel 1,000 German
Telepolis 1,000 German
Wiki / 1,000 English
Yahoo 1,000 English
Zdf 422 German
compares the recalls; whereas the second part com-pares the precision; and finally, the third section com-pares the F1 scores. By looking at Tables 3 and 4, onecan make the following conclusions:
• As seen in the third part of both Tables 3 and 4,Filter 3 has acquired a better F1 score in compar-ison with the other two filters in most of the 18cases. In contrast, Filter 2 has obtained the mini-mum amount of F1 score as compared to Filters 1and 3.
• Based on the first part of Tables 3 and 4, it canbe observed that Filter 3 has the maximum recallonly in 11 web sites out of the total number of 22web sites, while Filter 3 attains the maximum F1score in 18 web sites.
• In web sites where the values of recall obtainedfrom Filter 2 or 3 are equal to that of Filter 1, onemay judge that the web site does not have any hy-perlink in its MC. For example, it can be seen onEconomics and ZDF web sites that the recall isequal for all the three filters.
• When Filter 1 has a recall equal to the one in aweb site such as Reuters, it can be argued that theweb site certainly includes no hyperlink in its MC,thus the other two pre-processors of Filters 2 and
A�Comparison�of�Three�Pre-processing�Methods�for�Improving�Main�Content�Extraction�from�Hyperlink�Rich�WebDocuments
337

Table 3: Comparison between Recall, Precision and F1 on the corpus in Table 1.
AlA
hra
m
BB
CA
rabi
c
BB
CP
ash
to
BB
CP
ers
ian
BB
CU
rdu
Em
bass
y
Ha
msh
ahr
i
Jam
eJa
m
Re
ute
rs
Wik
ipe
dia
reca
ll
DANAg 0.942 0.990 0.959 0.997 0.999 0.949 0.993 0.963 1.0 0.613
Filter 1 0.942 0.987 0.961 0.997 0.999 0.953 0.953 0.963 1.0 0.853
Filter 2 0.942 0.989 0.961 0.997 0.999 0.953 0.942 0.963 1.0 0.886
Filter 3 0.942 0.987 0.959 0.997 0.999 0.949 0.993 0.97 1.0 0.81
pre
cisi
on
DANAg 0.970 0.988 0.929 0.994 0.999 0.902 0.989 0.970 0.897 0.912
Filter 1 0.969 0.952 0.929 0.973 0.999 0.833 0.611 0.97 0.897 0.869
Filter 2 0.969 0.691 0.918 0.961 0.999 0.831 0.498 0.97 0.897 0.852
Filter 3 0.969 0.987 0.929 0.994 0.999 0.902 0.989 0.976 0.897 0.915
F1
DANAg 0.949 0.986 0.944 0.995 0.999 0.917 0.991 0.966 0.945 0.699
Filter 1 0.949 0.969 0.944 0.985 0.999 0.884 0.716 0.966 0.945 0.852
Filter 2 0.949 0.804 0.939 0.979 0.999 0.883 0.624 0.966 0.945 0.861
Filter 3 0.949 0.985 0.944 0.996 0.999 0.917 0.991 0.973 0.945 0.852
Table 4: Comparison between Recall, Precision and F1 on the corpus in Table 2.
BB
C
Eco
nom
ist
Zdf
Gol
em
He
ise
Re
publ
ica
Spi
ege
l
Tele
polis
Ya
hoo
Wik
ipe
dia
Ma
nua
l
Sla
shdo
t
reca
ll
DANAg 0.893 0.966 0.963 0.997 0.945 0.997 0.942 0.979 0.955 0.578 0.680 0.318
Filter 1 0.913 0.967 0.963 0.993 0.976 0.995 0.946 0.979 0.954 0.810 0.687 0.399
Filter 2 0.922 0.967 0.963 0.745 0.965 0.994 0.946 0.979 0.952 0.760 0.690 0.440
Filter 3 0.890 0.967 0.963 0.999 0.964 0.996 0.941 0.980 0.953 0.787 0.686 0.372
pre
cisi
on
DANAg 0.991 0.855 0.882 0.963 0.945 0.955 0.969 0.919 0.950 0.782 0.359 0.174
Filter 1 0.991 0.830 0.880 0.941 0.900 0.872 0.943 0.914 0.948 0.927 0.355 0.208
Filter 2 0.935 0.732 0.812 0.707 0.830 0.792 0.938 0.914 0.944 0.882 0.356 0.192
Filter 3 0.991 0.855 0.880 0.989 0.911 0.954 0.974 0.919 0.948 0.927 0.357 0.197
F1
DANAg 0.924 0.990 0.912 0.979 0.955 0.970 0.949 0.932 0.952 0.645 0.401 0.209
Filter 1 0.939 0.884 0.910 0.965 0.931 0.914 0.938 0.930 0.950 0.856 0.403 0.248
Filter 2 0.916 0.827 0.871 0.724 0.884 0.865 0.937 0.930 0.948 0.809 0.404 0.239
Filter 3 0.922 0.900 0.910 0.994 0.931 0.970 0.951 0.932 0.950 0.840 0.404 0.236
3 have calculated the recall value as one.
• When Filter 2 has a higher recall and a lower pre-cision than the other two filters, it can be con-cluded that a major part of the extraneous itemshas been selected as the MC. It is well known thatthe menus are regarded as one of the additionalitems in the web pages and each item in the menuis usually built by an anchor tag. Therefore, by ap-plication of Filter 2, it would be possible to con-sider menus as the MC in some of the web sitessuch as BBC Arabic. However, the value of recallis equal to 0.989 in the web site of BBC Arabic,which is excellent. On the other hand, the valueof precision is reported to be 0.804 which is ratherpoor and indicates existence of some words in thefinal MC which can hardly be taken as a part ofMC.
5 CONCLUSIONS AND FUTUREWORKS
In this paper, three simple pre-processing methodsare proposed which can be combined with the line-based main content extraction methods. These meth-ods have been compared with each other and the re-sults show that Filter 3 yields better output values.Especially on hyperlink rich web documents such asWikipedia, Filter 3 clearly outperforms to the other 2pre-processing methods.
For the future work, it is recommended to com-bine the already introduced pre-processing meth-ods with some other state-of-the-art main contentextraction approaches, such as CETR (Weningeret al., 2010), Density (Moreno et al., 2009), andACCB (Gottron, 2008).
WEBIST�2014�-�International�Conference�on�Web�Information�Systems�and�Technologies
338
ACKNOWLEDGEMENTS
We would like to thank Thomas Gottron for providingus the dataset which was used in the evaluation of thiswork.
REFERENCES
Finn, A., Kushmerick, N., and Smyth, B. (2001). Fact or fic-tion: Content classification for digital libraries. InDE-LOS Workshop: Personalisation and RecommenderSystems in Digital Libraries.
Gottron, T. (2007). Evaluating content extraction on HTMLdocuments. InITA ’07: Proceedings of the 2nd In-ternational Conference on Internet Technologies andApplications, pages 123 – 132, Wrexham, Wales, UK.
Gottron, T. (2008). Content code blurring: A new approachto content extraction. InDEXA’08: 19th InternationalWorkshop on Database and Expert Systems Applica-tions, pages 29 – 33, Turin, Italy. IEEE Computer So-ciety.
Kohlschutter, C., Fankhauser, P., and Nejdl, W. (2010).Boilerplate detection using shallow text features. InProceedings of the third ACM international confer-ence on Web search and data mining, WSDM ’10,pages 441–450, New York, NY, USA. ACM.
Mohammadzadeh, H., Gottron, T., Schweiggert, F., andNakhaeizadeh, G. (2012). The impact of source codenormalization on main content extraction. InWE-BIST’12: 8th International Conference on Web Infor-mation Systems and Technologies, pages 677 – 682,Porto, Portugal. SciTePress.
Mohammadzadeh, H., Gottron, T., Schweiggert, F., andNakhaeizadeh, G. (2013). Extracting the main con-tent of web documents based on character encodingand a naive smoothing method. InSoftware and DataTechnologies, CCIS Series, Springer, pages 217 – 236.Springer-Verlag Berlin Heidelberg.
Moreno, J., Deschacht, K., and Moens, M. (2009). Lan-guage independent content extraction from web pages.In Proceeding of the 9th Dutch-Belgian InformationRetrieval Workshop, pages 50 – 55.
Pinto, D., Branstein, M., Coleman, R., Croft, W. B., King,M., Li, W., and Wei, X. (2002). QuASM: a systemfor question answering using semi-structured data. InJCDL ’02: Proceedings of the 2nd ACM/IEEE-CSjoint conference on Digital libraries, pages 46 – 55,New York, NY, USA. ACM Press.
Weninger, T., Hsu, W. H., and Han, J. (2010). CETR: con-tent extraction via tag ratios. InProceedings of the19th International Conference on World Wide Web,pages 971 – 980. ACM Press.
A�Comparison�of�Three�Pre-processing�Methods�for�Improving�Main�Content�Extraction�from�Hyperlink�Rich�WebDocuments
339
Detection of Semantic Relationships between Terms with a NewStatistical Method
Nesrine Ksentini, Mohamed Tmar and Faıez GargouriMIRACL: Multimedia, InfoRmation Systems and Advanced Computing Laboratory
University of Sfax, Higher Institute of Computer Science and Multimedia of Sfax, Sfax, [email protected], {mohamed.tmar, faiez.gargouri}@isimsf.rnu.tn
Keywords: Semantic Relatedness, Least Square Method, Information Retrieval, Query Expansion.
Abstract: Semantic relatedness between terms plays an important rolein many applications, such as information re-trieval, in order to disambiguate document content. This latter is generally studied among pairs of terms and isusually presented in a non-linear way. This paper presents anew statistical method for detecting relationshipsbetween terms called Least Square Mehod which defines these relations linear and between a set of terms.The evaluation of the proposed method has led to optimal results with low error rate and meaningful relation-ships. Experimental results show that the use of these relationships in query expansion process improves theretrieval results.
1 INTRODUCTION
With the increasing volume of textual data on the in-ternet, effective access to semantic information be-comes an important problem in information retrievaland other related domains such as natural languageprocessing, Text Entailment and Information Extrac-tion.
Measuring similarity and relatedness betweenterms in the corpus becomes decisive in order to im-prove search results (Agirre et al., 2009). Earlier ap-proaches that have been investigating the latter ideacan be classiffied into two main categories: thosebased on pre-available knowledge (ontology such aswordnet, thesauri, etc) (Agirre et al., 2010) and thoseinducing statistical methods (Sahami and Heilman,2006),(Ruiz-Casado et al., 2005).
WordNet is a lexical database developed by lin-guists in the Cognitive Science Laboratory at Prince-ton University (Hearst, 1998). Its purpose is to iden-tify, classify and relate in various ways the semanticand lexical content of the English language. WordNetversions for other languages exist, but the English ver-sion, however, is the most comprehensive to date.Information in wordnet ;such as nouns, adjectives,verbs and adverbs; is grouped into synonyms setscalled synsets. Each group expresses a distinct con-cept and it is interlinked with lexical and conceptual-semantic relations such as meronymy, hypernymy,causality, etc.
We represent WordNet as a graphG = (V,E) asfollows: graph nodes represent WordNet concepts(synsets) and dictionary words; undirected edges rep-resent relations among synsets; and directed edgesrepresent relations between dictionary words andsynsets associated to them. Given a pair of wordsand a graph of related concepts, wordnet computes inthe first time the personalized PageRank over Word-Net for each word, giving a probability distributionover WordNet synsets. Then, it compares how similarthese two probability distributions are by presentingthem as vectors and computing the cosine between thevectors (Agirre et al., 2009).
For the second category, many previous studiesused search engine collect co-occurrence betweenterms. In (Turney, 2001), author calculate the Point-wise Mutual Information (PMI) indicator of syn-onymy between terms by using the number of re-turned results by a web search engine.
In (Sahami and Heilman, 2006), the authors pro-posed a new method for calculating semantic similar-ity. They collected snippets from the returned resultsby a search engine and presented each of them as avector. The semantic similarity is calculated as theinner product between the centroids of the vectors.
Another method to calculate the similarity of twowords was presented by (Ruiz-Casado et al., 2005)it collected snippets containing the first word from aWeb search engine, extracted a context around it, re-placed it with the second word and checked if context
340
is modified in the Web.However, all these methods measure relatedness
between terms in pairs and cannot express them in alinear way. In this paper, we propose a new methodwhich defines linear relations between a set of termsin a corpus based on their weights.
The paper is organized as follows, section 2 is de-voted to detailing the proposed method followed bythe evaluation in section 3. Finally, section 4 drawsthe conclusions and outlines future works.
2 PROPOSED METHOD
Our method is based on the extraction of relation-ships between terms(t1, t2, · · · , tn) in a corpus of doc-uments. Indeed, we try to find a linear relationshipthat may possibly exist between them with the fol-lowing form:
ti = f (t1, t2, · · · , ti−1, ti+1, · · · , tn) (1)
Least square method (Abdi., 2007), (Miller, 2006) is afrequently used method for solving this kind of prob-lems in an approximate way. It requires some calculusand linear algebra.In fact, this method seeks to highlight the connectionbeing able to exist between an explained variable(y)and explanatory variables(x). It is a procedure to findthe best fit line(y = ax+ b) to the data given that thepairs(xi,yi) are observed fori ∈ 1, · · · ,n.
The goal of this method is to find values ofa andb that minimize the associated error (Err).
Err =n
∑i=1
(yi − (axi+ b))2 (2)
Using a matrix form for then pairs(xi,yi):
A = (XT ×X)−1
×XT ×Y (3)
whereA represents vector of values(a1,a2, · · · ,an)andX represents the coordinate matrix ofn pairs.
In our case, let term (ti) the explained vari-able and the remaining terms of the corpus(t1, t2, · · · , ti−1, ti+1, · · · , tn) the explanatory variables.We are interesting in the linear models; the relationbetween these variables is done by the following:
ti ≈ α1t1+α2t2+ · · ·+αi−1ti−1+αi+1ti+1
+ · · ·+αntn + ε = ∑i−1j=1(α jt j)+∑n
j=i+1(α jt j)+ ε(4)
Whereα are real coefficients of the model and presentthe weights of relationships between terms andε rep-resents the associated error of the relation.
We are looking for a model which enables us toobtain an exact solution for this problem.Therefore, we proceed to calculate this relation foreach document in the collection and define after thatthe final relationship between these terms in the wholecollection. For that,m measurements are made forthe explained and the explanatory variables to calcu-late the appropriateα1,α2, · · · ,αn with m representthe number of documents in the collection.
t1i ≈ α1.t1
1 +α2.t12 + · · ·+αn.t1
nt2i ≈ α1.t2
1 +α2.t22 + · · ·+αn.t2
n...tmi ≈ α1.tm
1 +α2.tm2 + · · ·+αn.tm
n
(5)
Wheret ji is the Tf-Idf weight of termi in documentj.
By using the matrix notations the system becomes:
t1i
t2i...
tmi
︸ ︷︷ ︸
ti
≈
t11 t1
2 · · · t1n
t21 t2
2 · · · t2n
......
. . ....
tm1 tm
2 · · · tmn
︸ ︷︷ ︸
X
×
α1α2...
αn
︸ ︷︷ ︸
A(6)
whereX is a TF-IDF (Term Frequency-Inverse Doc-ument Frequency) matrix whose rows represent thedocuments and columns represent the indexing terms(lemmas).Thus, we seekA = (α1, · · · ,αn) such asX ×A is morenear possible toti. Rather than solving this system ofequations exactly, least square method tries to reducethe sum of the squares of the residuals. Indeed, it triesto obtain a low associated error (Err) for each relation.
We notice that the concept of distance appears.We expect thatd(X ×A, ti)is minimal , which is writ-ten:
min || X ×A− ti || (7)To determine the vectorA for each term in a corpus,we applied the least square method on the matrix Xfor each one.
∀i = 1, . . . ,n.
Ai = (X iT ×X i)−1
×XT [i, .]× ti (8)Where X i is obtained by removing the row of thetermi in matrix X andn is the number of terms in acorpus.XT [i, .] represents the transpose of the line weight oftermi in all documents.
3 EXPERIMENTS
In this paper, we use our method to improve informa-
Detection�of�Semantic�Relationships�between�Terms�with�a�New�Statistical�Method
341
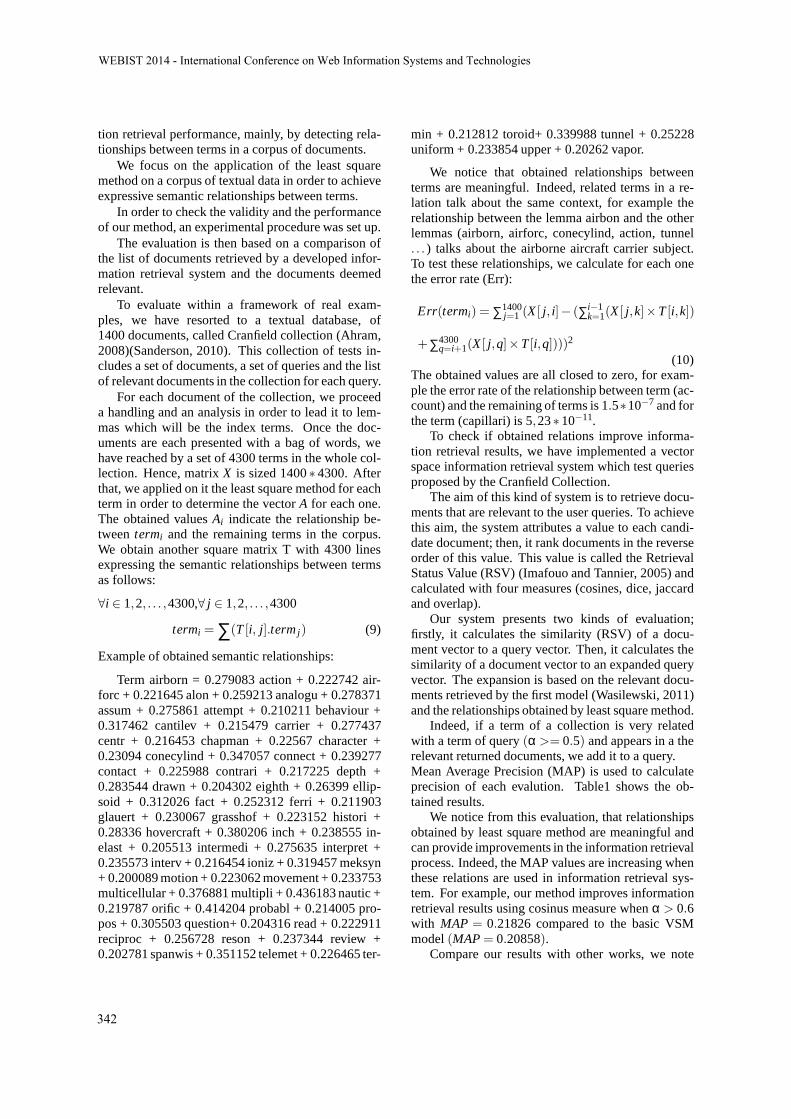
tion retrieval performance, mainly, by detecting rela-tionships between terms in a corpus of documents.
We focus on the application of the least squaremethod on a corpus of textual data in order to achieveexpressive semantic relationships between terms.
In order to check the validity and the performanceof our method, an experimental procedure was set up.
The evaluation is then based on a comparison ofthe list of documents retrieved by a developed infor-mation retrieval system and the documents deemedrelevant.
To evaluate within a framework of real exam-ples, we have resorted to a textual database, of1400 documents, called Cranfield collection (Ahram,2008)(Sanderson, 2010). This collection of tests in-cludes a set of documents, a set of queries and the listof relevant documents in the collection for each query.
For each document of the collection, we proceeda handling and an analysis in order to lead it to lem-mas which will be the index terms. Once the doc-uments are each presented with a bag of words, wehave reached by a set of 4300 terms in the whole col-lection. Hence, matrixX is sized 1400∗4300. Afterthat, we applied on it the least square method for eachterm in order to determine the vectorA for each one.The obtained valuesAi indicate the relationship be-tweentermi and the remaining terms in the corpus.We obtain another square matrix T with 4300 linesexpressing the semantic relationships between termsas follows:
∀i ∈ 1,2, . . . ,4300,∀ j ∈ 1,2, . . . ,4300
termi = ∑(T [i, j].term j) (9)
Example of obtained semantic relationships:
Term airborn = 0.279083 action + 0.222742 air-forc + 0.221645 alon + 0.259213 analogu + 0.278371assum + 0.275861 attempt + 0.210211 behaviour +0.317462 cantilev + 0.215479 carrier + 0.277437centr + 0.216453 chapman + 0.22567 character +0.23094 conecylind + 0.347057 connect + 0.239277contact + 0.225988 contrari + 0.217225 depth +0.283544 drawn + 0.204302 eighth + 0.26399 ellip-soid + 0.312026 fact + 0.252312 ferri + 0.211903glauert + 0.230067 grasshof + 0.223152 histori +0.28336 hovercraft + 0.380206 inch + 0.238555 in-elast + 0.205513 intermedi + 0.275635 interpret +0.235573 interv + 0.216454 ioniz + 0.319457 meksyn+ 0.200089 motion + 0.223062 movement + 0.233753multicellular + 0.376881 multipli + 0.436183 nautic +0.219787 orific + 0.414204 probabl + 0.214005 pro-pos + 0.305503 question+ 0.204316 read + 0.222911reciproc + 0.256728 reson + 0.237344 review +0.202781 spanwis + 0.351152 telemet + 0.226465 ter-
min + 0.212812 toroid+ 0.339988 tunnel + 0.25228uniform + 0.233854 upper + 0.20262 vapor.
We notice that obtained relationships betweenterms are meaningful. Indeed, related terms in a re-lation talk about the same context, for example therelationship between the lemma airbon and the otherlemmas (airborn, airforc, conecylind, action, tunnel. . . ) talks about the airborne aircraft carrier subject.To test these relationships, we calculate for each onethe error rate (Err):
Err(termi) = ∑1400j=1 (X [ j, i]− (∑i−1
k=1(X [ j,k]×T [i,k])
+∑4300q=i+1(X [ j,q]×T [i,q])))2
(10)The obtained values are all closed to zero, for exam-ple the error rate of the relationship between term (ac-count) and the remaining of terms is 1.5∗10−7 and forthe term (capillari) is 5,23∗10−11.
To check if obtained relations improve informa-tion retrieval results, we have implemented a vectorspace information retrieval system which test queriesproposed by the Cranfield Collection.
The aim of this kind of system is to retrieve docu-ments that are relevant to the user queries. To achievethis aim, the system attributes a value to each candi-date document; then, it rank documents in the reverseorder of this value. This value is called the RetrievalStatus Value (RSV) (Imafouo and Tannier, 2005) andcalculated with four measures (cosines, dice, jaccardand overlap).
Our system presents two kinds of evaluation;firstly, it calculates the similarity (RSV) of a docu-ment vector to a query vector. Then, it calculates thesimilarity of a document vector to an expanded queryvector. The expansion is based on the relevant docu-ments retrieved by the first model (Wasilewski, 2011)and the relationships obtained by least square method.
Indeed, if a term of a collection is very relatedwith a term of query(α >= 0.5) and appears in a therelevant returned documents, we add it to a query.Mean Average Precision (MAP) is used to calculateprecision of each evalution. Table1 shows the ob-tained results.
We notice from this evaluation, that relationshipsobtained by least square method are meaningful andcan provide improvements in the information retrievalprocess. Indeed, the MAP values are increasing whenthese relations are used in information retrieval sys-tem. For example, our method improves informationretrieval results using cosinus measure whenα > 0.6with MAP = 0.21826 compared to the basic VSMmodel(MAP = 0.20858).
Compare our results with other works, we note
WEBIST�2014�-�International�Conference�on�Web�Information�Systems�and�Technologies
342

Table 1: Variation of MAP values.
VSM VSM with expanded queryα > 0.8 α > 0.7 α > 0.6 α > 0.5
Cosinus 0.20858 0.20654 0.21273 0.21826 0.21822Dice 0.20943 0.20969 0.21529 0.21728 0.22060
Jaccard 0.20943 0.21043 0.21455 0.21341 0.20642Overlap 0.12404 0.12073 0.12366 0.12311 0.12237
that this new statistical method (least square) im-proves search results. In (Ahram, 2008), experimen-tal results from cranfield documents collection gavean average precision of 0.1384 which is less than thatfound in our work (0.21826 with cosinus measure,0.22060 with dice measure).
4 SUMMARY AND FUTUREWORKS
We present in this paper a new method for detect-ing semantic relationships between terms. The pro-posed method (least square) defines meaningful rela-tionships in a linear way and between a set of termsusing weights of each one which represent the distri-bution of terms in the corpus.These relationships give a low error rate. Indeed, theyare used in the query expansion process for improvinginformation retrieval results.As future works, firstly, we will intend to participatein the competition TREC to evaluate our method ona large test collection. Secondly, we will look forhow to use these relations in the process of weightingterms and the definition of terms-documents matrix toimprove information retrieval results. Finally, we alsowill investigate these relations to induce the notion ofcontext in the indexing process.
REFERENCES
Abdi., H. (2007). The method of least squares.Agirre, E., Alfonseca, E., Hall, K., Kravalova, J., Pasca,
M., and Soroa, A. (2009). A study on similar-ity and relatedness using distributional and wordnet-based approaches. InProceedings of Human Lan-guage Technologies: The 2009 Annual Conference ofthe North American Chapter of the Association forComputational Linguistics, NAACL ’09, pages 19–27, Stroudsburg, PA, USA. Association for Compu-tational Linguistics.
Agirre, E., Cuadros, M., Rigau, G., and Soroa, A. (2010).Exploring knowledge bases for similarity. In Chair),N. C. C., Choukri, K., Maegaard, B., Mariani, J.,Odijk, J., Piperidis, S., Rosner, M., and Tapias,D., editors,Proceedings of the Seventh International
Conference on Language Resources and Evaluation(LREC’10), Valletta, Malta. European Language Re-sources Association (ELRA).
Ahram, T. Z. (2008). Information retrieval performanceenhancement using the average standard estimatorand the multi-criteria decision weighted set of perfor-mance measures. PhD thesis, University of CentralFlorida Orlando, Florida.
Hearst, M. (1998). WordNet: An electronic lexical databaseand some of its applications. In Fellbaum, C., edi-tor, Automated Discovery of WordNet Relations. MITPress.
Imafouo, A. and Tannier, X. (2005). Retrieval status val-ues in information retrieval evaluation. InString Pro-cessing and Information Retrieval, pages 224–227.Springer.
Miller, S. J. (2006). The method of least squares.Ruiz-Casado, M., Alfonseca, E., and Castells, P. (2005).
Using context-window overlapping in synonym dis-covery and ontology extension. InInternational Con-ference on Recent Advances in Natural Language Pro-cessing (RANLP 2005), Borovets, Bulgaria.
Sahami, M. and Heilman, T. D. (2006). A web-based ker-nel function for measuring the similarity of short textsnippets. InProceedings of the 15th international con-ference on World Wide Web, WWW ’06, pages 377–386, New York, NY, USA. ACM.
Sanderson, M. (2010).Test collection based evaluation ofinformation retrieval systems. Now Publishers Inc.
Turney, P. D. (2001). Mining the web for synonyms: Pmi-irversus lsa on toefl. InProceedings of the 12th Euro-pean Conference on Machine Learning, EMCL ’01,pages 491–502, London, UK, UK. Springer-Verlag.
Wasilewski, P. (2011). Query expansion by semantic mod-eling of information needs.
Detection�of�Semantic�Relationships�between�Terms�with�a�New�Statistical�Method
343
An Approach to Detect Polarity Variation Rules for Sentiment Analysis
Pierluca Sangiorgi1;2, Agnese Augello 1 and Giovanni Pilato1
1ICAR, Istituto di Calcolo e Reti ad Alte Prestazioni, CNR, Consiglio Nazionale delle Ricerche,Viale delle Scienze - Edificio 11, 90128, Palermo, Italy
2INAF, Istituto di Astrofisica Spaziale e Fisica Cosmica - Palermo, via U. La Malfa 153, 90146, Palermo, Italyfsangiorgi, augello, [email protected]
Keywords: Subjectivity Analysis, Sentiment Analysis, Opinion Mining, Machine Learning.
Abstract: Sentiment Analysis is a discipline that aims at identifying and extract the subjectivity expressed by authorsof information sources. Sentiment Analysis can be applied at different level of granularity and each of themstill has open issues. In this paper we propose a completely unsupervised approach aimed at inducing a setof words patterns that change the polarity of subjective terms. This is a very important task because, whilesentiment lexicons are valid tools that can be used to identify the polarity at word level, working at differentlevel of granularity they are no longer sufficient, because of the various aspects to consider like the context,the use of negations and so on that can change the polarity of subjective terms.
1 INTRODUCTION
In recent years, with the advent of blogs, forums, so-cial communities, product rating platforms and so on,users have become more active in production of largeamount of information. Starting from news as well asproducts reviews and any other information systemsthat allow on-line user interaction in terms of con-tents, users provide information through their contri-butions in the form of opinions, discussions, reviewsand so on.
Companies and organizations are increasingly in-terested in this type of information because it can beused as knowledge resource for operations of marketsurvey, political behavior and, in general, measure-ment of satisfaction.
Information produced by network users usuallyregards what is known as their ”private states”: theiropinions, emotions, sentiments, evaluations and be-liefs (Quirk et al., 1985) (Banea et al., 2011). Theterm subjectivity is usually used in literature as a lin-guistic expression of private state (Banea et al., 2011).
One of the latest and most challenging researchtask is the automatic detection of subjectivity pres-ence in text, which is named subjectivity analysis.The task to also identifying, where possible, its po-larity, by classifying it as neutral, positive or negativeis defined in literature as sentiment analysis.
Sentiment analysis may be realized at several lev-els of granularity, like word, sentence, phrase or doc-
ument level. Usually each level of analysis exploitsthe results obtained by the underlying layers.
What makes these tasks hard to achieve is the am-biguity of words, the context-sensitivity of subjec-tive terms, the need of appropriate linguistic resourcesfor different languages, the presence of negations, thepresence of irony, and so on (Montoyo et al., 2012).
In this paper we propose an approach to auto-matically discover several sequential patterns (i.e.a sequence of tokens in the sentence) in a specificlanguage that change the polarity of subjective words.The novelty of the approach is that it is completelyunsupervised, requiring only the use of one singlelinguistic resource: a sentiment lexicon, which isspecific for the language under consideration. Thiscan be done in order to build a polarity variationdetector to be used in sentiment analysis applications.
2 RELATED WORKS
In sentiment analysis, the comprehension of sen-tences polarities is a complex task, which involvesthe analysis of the composition of the words in thesentences, considering their prior polarities. Severalsentiment lexicons (Wilson et al., 2005a), (Stone andHunt, 1963), (Baccianella et al., 2010), (Strapparavaand Valitutti, 2004), can be accessed in order to ex-amine the polarity at a “word-level”; in some cases
344

these lexicons can be obtained trough machine learn-ing approaches (which cluster terms according to theirdistributional similarity (Turney and Littman, 2003)),or by means of bootstrapping methodologies startingfrom few term-seeds (Banea et al., 2011)(Pitel andGrefenstette, 2008).
Polarity of words is highly dependent on the do-main in which they are used, so that adjectives withpositive polarity could have an opposite or a neutralpolarity in another domain. Moreover, especially inthe context of product reviews users often adopt ab-breviations and idioms; therefore methods for the au-tomatic creation of lexicons may be very useful in thiscontext also to improve existing dictionaries.
At a ”sentence-level” it is necessary consider thecomposition of the word, with their prior polarities,into the phrase. Different compositional models havebeen proposed in (Yessenalina and Cardie, 2011),(Wu et al., 2011) and (Chardon et al., 2013). In(Hu and Liu, 2004) a set of adjective words (opinionswords) is identified using a natural language process-ing method in order to decide the opinion orientationof a sentence: for each opinion word its semantic ori-entation is determined, and the opinion orientation isthen predicted by analyzing the predominance of pos-itive or negative words. In (Moilanen and Pulman,2007) a composition model based on a syntactic treerepresentation has been proposed. Many other factorshave to be considered, especially the presence of po-larity influencers (Wilson et al., 2005b) (Polanyi andZaenen, 2006). In (Wilson et al., 2005b) a study onthe most important features for recognizing contex-tual polarity has been performed, and the performanceof these features has been evaluated by using severaldifferent machine learning algorithms. In (Tan et al.,2012) it has been proposed an automatic approach todetect polarity pattern rules, based on the extractionof typed dependency bi-grams of sentences and theuse of Class Sequential Rules (CSRs) to derive po-larity class rules from sequential patterns within thebi-grams. In (Tromp and Pechenizkiy, 2013) is pro-posed an algorithm for polarity detection based on theuse of different heuristic rules.
3 AN APPROACH TO DETECTPOLARITY VARIATION RULES
The proposed approach is thought to work in an unsu-pervised manner. It can be run just one time in orderto define the rules. A subsequent re-run of this ap-proach is not required, excepted for an extension ofthe number of rules using other data sets as inputs.The process can be viewed as a black box that pro-
duces, given a set of documents as input, a set of rulesin a specific structure that will be described below.The entire process can be decomposed in a sequenceof steps as reported in figure 1.
Figure 1: The architecture of the proposed approach.
The main idea is to extract several user reviewsexpressed in English language from an on-line mar-ket store which implements a star rating system. Eachone of the reviews represents a short document, usu-ally a sentence, that can be classified as having pos-itive or negative polarity according to the number ofstars that are compulsorily inserted by the users in or-der to publish a review.
Given these two classes of documents, after a sim-ple pre-processing through a tokenizer used for split-ting their content into words, we scan each word byexploiting a sentiment lexicon in English language.If in a document with a given polarity is detected aword with a different one, the three words to its leftand those to its right are saved in a list.
Repeating this process for all the extracted re-views, we obtain a collection of words typically sur-rounding subjective words that, “for some reason”,are probably responsible for the variation of the po-larity of the subjective words.
Without concerning why these rules change wordspolarity, we can study them in terms of frequency,support and confidence and select the most promisingones.
The collection of these sequential patterns willform a set of polarity variation rules. These rulescould be integrated in a polarity variation detector inorder to check, during other sentiment analysis appli-cations, if a given sentence matches one of these newrules and therefore a different polarity for the termshould be considered.
In a nutshell, the approach is based on four mainsteps:
An�Approach�to�Detect�Polarity�Variation�Rules�for�Sentiment�Analysis
345
1. extraction of a large amount of user reviews fromon-line market store with star rating system;
2. sentiment analysis at word level using sentimentlexicons;
3. extraction of the left and right context of a subjec-tive word with inverted polarity respect to that ofthe sentence;
4. identification of the sequential patterns rules thatchange the polarity;It might seem that an approach like this could be
replaced by a set of rules manually written by pro-fessional linguists, but this is not completely true.This because a linguist can define rules based on thegrammar of the language that not always fits the “lan-guage” generally used by people on the social media.Furthermore, this approach can be potentially appliedto any language of interest, since the polarity variationdetection depends only on the tools used.
4 FORMALIZATION OF THEPROPOSED APPROACH
In our approach three main elements can be identified:1. the input resources which consist of on-line user
reviews that we want to analyze;2. the processing chain;3. the output which consist of linguistic patterns that
cause the change of polarity of subjective terms.We define reviews as input as an ordered sequence ofvariable length of words, punctuation and symbols zi:
ri = fz1, z2, z3, ..., zng
and the desired output as two lists P+ = fpi+g and
P� = fpi�g, respectively for positive and negative
sentences, of sequential patterns:
pi = [n1, n2, n3, n4, n5, n6]
composed by an experimentally fixed number ofterms, some of which empty, that represent thesequence of three terms that are present before (n1,n2, n3) and after (n4, n5, n6) a subjective term, whichcan cause its polarity variation.The details of the entire processing chain will bedescribed in the next subsections.
4.1 Acquisition and Data Preparation
The first step of the processing chain accomplishesthe task of collecting reviews in order to create the
knowledge resource, rich of subjective terms, fromwhich to extract the polarity variation rules.
To this aim we consider the on-line user reviewsas information sources, this because this type oftext carries out opinions and sentiments expressed bythe users, containing subjectivity terms with an highprobability.
In particular, we are considering to retrieve the re-views from the Google Play market store, Amazon,Itunes or other on-line market shop.
This choice is motivated by a fundamental featurecharacterizing this kind of stores: they implement astar rating system, with scores usually from one tofive, that must be inserted by the users in order to pub-lish a review. This feature allows us to extract reviewsas classified in terms of opinion (bad or good) ex-pression. We make the supposition that reviews withhigher value of stars express positive sentiments ofusers while reviews with lower value of stars expressnegative sentiments.
The result of this step is to extract several reviewswith their associated stars values for different prod-ucts and group them by positive or negative expressedopinion in two large class of documents R+= fri
+gand R�= fri
�g, considering only the stars values.Once the classes of documents are built, they passthrough a tokenizer chain to split the content of re-views in separated terms. The splitting must bedone considering space character as well as punc-tuation, maintaining every remaining alphanumericterms without filtering.
No other text pre-processing, like stopwords re-moval, must be done, this because we are interestedto all terms that compose the reviews and could be de-terminant in the rules definition despite they not carryout particular information. For example think aboutterms like ”but”, ”not” and so on.
The result of this process is that every review iscleaned from spaces, punctuation and symbols. Thislead to a review ri composed only by terms ti:
ri = ft1, t2, t3, ..., tng
4.2 Identification of the VariationNeighborhood Lists
Given the i-th review with positive polarity ri+,
composed by a sequence of terms t j:
ri+ = ft1, t2, t3, t4, t5, t6, t7, t8, t9, ...g
every j-th term t j is checked through a senti-ment lexicon, and whenever the term is detected asbeing subjective with negative polarity, the term is
WEBIST�2014�-�International�Conference�on�Web�Information�Systems�and�Technologies
346

marked and its neighbor terms are stored in an arrayNi
+ of predetermined size:Ni
+ = [n j�3, n j�2, n j�1, n j+1, n j+2, n j+3]where
n = t (if t is a valid terms)or
n = ” ” (if t is empty).
We define as “Variation Neighborhood List” a setof sequential patterns of fixed size composed by theterms in the left and in the right context of the sub-jective terms with discordant polarity, and in this caseNi
+ is an element of the Variation Neighborhood ListL+ = fNi
+g relative to the positive reviews.This operation is executed for both positive and
negative reviews. Generally speaking, we state thatwhenever a discordance between the prior polarity ofa subjective term with the polarity of the review thatthe term belongs to is detected, a new element of theVariation Neighborhood List is built.
In order to clarify this statement, let us consider,for example, three negative reviews after the tok-enizer process:
r1� = fthis, app, is, good, when, it, works, but,
ninety, percent, of, the, time, it, will, not, even, open,on, my, phoneg
r2� = fmy, previous, review, was, good, as, i,
was, satisfied, with, the, app, but, now, feel, that, its,the, worst, app, everg
r3� = fnot, good, needs, to, be, fixedg
All the three reviews contain the subjectiveterm good that have positive prior polarity, whichis however discordant with the overall sentimentexpressed by the reviews.In this case we build the three arrays:
N1� = [this, app, is, when, it, works]
N2� = [previous, review, was, as, i, was]
N3� = [ , , not, needs, to, be]
Note that the subjective term is discarded and notstored in the array, this because we are interested toits context which can affect its polarity as well as thecontext of other subjective terms.
The only restriction is to consider only an evennumber of terms for each context in order to have al-ways patterns with the first half of terms referring tothe left context of subjective terms and the second half
to the right.
4.3 Rules Extractor
Once the two Neighborhood Lists L+ and L� respec-tively for positive and negative reviews are built, theyare singularly processed in order to extract the twofinal set of polarity variation rules.
In order to reach this goal, the list is expandedadding all possible combinations of terms of the orig-inal sequential patterns extracted in the previews step.Considering the sequential pattern N2
� of the aboveexample, this means create additional sequential pat-terns N2;k with k 2 [1, 62], like:
N2;32� = [previous, , , , , ]
N2;16� = [ , review, , , , ]
N2;8� = [ , , was, , , ]
N2;39� = fprevious, , , as, i, wasg
and so on.The k-th sequential pattern is built considering the
binary encoding of k that leave the original terms inthe positions with value equal to 1 and replace theterms with ” ” in the positions with value equal to 0.k=0 and k=63 are not considered because they are re-spectively the empty pattern and the original pattern.Note that 63 is the maximum number of sequentialpatterns for each polarity variation detected, but theycould be less if the original pattern have empty ele-ments (” ”).
After the expansion process, the next step is tocompare all the sequential patterns of the expandedlist, remove all the duplicates and saving for each pat-tern its value of frequency.
Since a pattern with few empty elements is strongand representative of polarity variation, but not prob-able to occur many times, instead of its frequency weconsider a weight value w associated to each pattern;w is defined as:
w = ( f -1)*l
where l is the number of non empty elements ofthe pattern (l 2 [1, 6]) and f is the frequency of thepattern in the list.
In this way patterns that occur only once in thelist have weight w equal to 0 and therefore they arediscarded. Patterns with higher value of l, have anhigh confidence, but a very low support.
Considering only the frequency does not work: forexample, let us consider that a pattern Ni;62 with a fre-quency value of 2, implies the existence of 6 patternswith the same frequency but l=1 (Ni;1, Ni;2, Ni;4, Ni;8,Ni;16, Ni;32), as well as the other ”sub-patterns” withall value of l generated from the expansion procedureof the pattern with l=6.
An�Approach�to�Detect�Polarity�Variation�Rules�for�Sentiment�Analysis
347

Once the weight value w is calculated, for eachpatterns for the two Neighborhood Lists, using an ap-propriate value of threshold we remove all the pat-terns with a value lower than a given threshold .
All the patterns remaining from the cut-off phaserepresent the polarity variation rules we are lookingfor and stored as elements pi in the two list of rulesP+ = fpi
+g and P� = fpi�g.
They are expressed as vector of 6 terms, someoneof which may be empty. These vectors, if used in sen-timent analysis tasks, indicate, with a grade of proba-bility, which terms must be present before and/or aftera subjective term to cause its polarity variation.
5 CONCLUSIONS AND FUTUREWORK
We think that the work proposed in this paper couldbe a plausible approach to determine and solve thepolarity variation problem in sentiment analysis ap-plications. We are thus interested to develop this ap-proach and we are working in this direction consider-ing Google Play market store as resource for reviewsand SentiWordNet, a lexical resource for opinion min-ing created by manual assignment of polarity to eachsynset of Wordnet, as sentiment checker. This will letus to define a set of valid rules to be integrated in acomputer aided system for real time detection of po-larity variation as support for other systems.
The choice to work in this direction, in fact, is notcasual and arises from a real necessity occurred dur-ing other sentiment analysis works were we are in-volved. Just for example, during a sentiment anal-ysis process done at word level on a large collec-tion of Google Play market reviews, we have noticedthat SentiWordNet found more positive than negativewords inside reviews classified as negative with thestar rating system. Find any discordant polarity termsinside a sentence it’s a typical situation, but not in thenumbers we found in our collection. This promptedus to investigate and define a valid approach to solvethe problem.
ACKNOWLEDGEMENTS
This work has been partially supported by the POR2007/2013 - Regione Siciliana - Misura 4.1.1.1. - IDS(Innovative Document Sharing) Research Project andby the PON01 01687 - SINTESYS (Security and IN-TElligence SYSstem) Research Project.
REFERENCESBaccianella, S., Esuli, A., and Sebastiani, F. (2010). Senti-
wordnet 3.0: An enhanced lexical resource for sen-timent analysis and opinion mining. In Chair), N.C. C., Choukri, K., Maegaard, B., Mariani, J., Odijk,J., Piperidis, S., Rosner, M., and Tapias, D., editors,Proceedings of the Seventh International Conferenceon Language Resources and Evaluation (LREC’10),Valletta, Malta. European Language Resources Asso-ciation (ELRA).
Banea, C., Mihalcea, R., and Wiebe, J. (2011). MultilingualSentiment and Subjectivity Analysis. ACL 2012.
Chardon, B., Benamara, F., Mathieu, Y., Popescu, V., andAsher, N. (2013). Sentiment composition using aparabolic model. In Proceedings of the 10th In-ternational Conference on Computational Semantics(IWCS 2013) – Long Papers, pages 47–58, Potsdam,Germany. Association for Computational Linguistics.
Hu, M. and Liu, B. (2004). Mining and summariz-ing customer reviews. In Proceedings of the TenthACM SIGKDD International Conference on Knowl-edge Discovery and Data Mining, KDD ’04, pages168–177, New York, NY, USA. ACM.
Moilanen, K. and Pulman, S. (2007). Sentiment composi-tion. In Proceedings of Recent Advances in NaturalLanguage Processing (RANLP 2007), pages 378–382.
Montoyo, A., Martınez-Barco, P., and Balahur, A. (2012).Subjectivity and sentiment analysis: An overview ofthe current state of the area and envisaged develop-ments. Decision Support Systems, 53(4):675 – 679.
Pitel, G. and Grefenstette, G. (2008). Semi automatic build-ing method for a multidimensional affect dictionaryfor a new language. In LREC. European LanguageResources Association.
Polanyi, L. and Zaenen, A. (2006). Contextual valenceshifters. In Shanahan, J., Qu, Y., and Wiebe, J., ed-itors, Computing Attitude and Affect in Text: Theoryand Applications, volume 20 of The Information Re-trieval Series, pages 1–10. Springer Netherlands.
Quirk, R., Greenbaum, S., Leech, G., and Svartvik, J.(1985). A comprehensive grammar of the English lan-guage. Longman, London.
Stone, P. J. and Hunt, E. B. (1963). A computer ap-proach to content analysis: studies using the generalinquirer system. In Proceedings of the May 21-23,1963, spring joint computer conference, AFIPS ’63(Spring), pages 241–256, New York, NY, USA. ACM.
Strapparava, C. and Valitutti, A. (2004). Wordnet affect:an affective extension of wordnet. In In Proceedingsof the 4th International Conference on Language Re-sources and Evaluation, pages 1083–1086.
Tan, L.-W., Na, J.-C., Theng, Y.-L., and Chang, K. (2012).Phrase-level sentiment polarity classification usingrule-based typed dependencies and additional com-plex phrases consideration. Journal of Computer Sci-ence and Technology, 27(3):650–666.
Tromp, E. and Pechenizkiy, M. (2013). Rbem: A rule basedapproach to polarity detection. In Proceedings of theSecond International Workshop on Issues of SentimentDiscovery and Opinion Mining, WISDOM ’13, pages8:1–8:9, New York, NY, USA. ACM.
WEBIST�2014�-�International�Conference�on�Web�Information�Systems�and�Technologies
348

Turney, P. D. and Littman, M. L. (2003). Measuring praiseand criticism: Inference of semantic orientation fromassociation. ACM Trans. Inf. Syst., 21(4):315–346.
Wilson, T., Hoffmann, P., Somasundaran, S., Kessler, J.,Wiebe, J., Choi, Y., Cardie, C., Riloff, E., and Pat-wardhan, S. (2005a). Opinionfinder: A system forsubjectivity analysis. In HLT/EMNLP. The Associa-tion for Computational Linguistics.
Wilson, T., Wiebe, J., and Hoffmann, P. (2005b). Rec-ognizing contextual polarity in phrase-level sentimentanalysis. In Proceedings of the Conference on Hu-man Language Technology and Empirical Methods inNatural Language Processing, HLT ’05, pages 347–354, Stroudsburg, PA, USA. Association for Compu-tational Linguistics.
Wu, Y., Zhang, Q., Huang, X., and Wu, L. (2011). Struc-tural opinion mining for graph-based sentiment rep-resentation. In Proceedings of the Conference onEmpirical Methods in Natural Language Process-ing, EMNLP ’11, pages 1332–1341, Stroudsburg, PA,USA. Association for Computational Linguistics.
Yessenalina, A. and Cardie, C. (2011). Compositionalmatrix-space models for sentiment analysis. In Pro-ceedings of the Conference on Empirical Methods inNatural Language Processing, EMNLP ’11, pages172–182, Stroudsburg, PA, USA. Association forComputational Linguistics.
An�Approach�to�Detect�Polarity�Variation�Rules�for�Sentiment�Analysis
349

A General Evaluation Framework for Adaptive Focused Crawlers
Fabio Gasparetti, Alessandro Micarelli and Giuseppe SansonettiDepartment of Engineering, Roma Tre University, Via della Vasca Navale 79, Rome, Italy
{gaspare, micarel, gsansone}@dia.uniroma3.it
Keywords: Adaptive Focused Crawling, Evaluation Framework.
Abstract: Focused crawling is increasingly seen as a solution to increase the freshness and coverage of local repositoryof documents related to specific topics by selectively traversing paths on the web. The adaptation is a peculiarfeature that makes it possible to modify the search strategies according to the particular environment, itsalterations and its relationships with the given input parameters during the search. This paper introduces ageneral evaluation framework for adaptive focused crawlers.
1 INTRODUCTION
Due to the limited bandwidth, storage and resourcesof traditional computational systems and the rapidgrowth of the web, focused crawlers aim at build-ing small high-quality and up-to-date repositories oftopic-specific pages. Deep analyses of the retrievedpages have also the chance to better address growingdynamic contents, such as news or financial data andpromptly alerting about relevant alterations of the re-trieved pages.
Pages related to the same topics tend to be neigh-bours of each other is the fundamental assumptionthat is often namedtopic locality (Davison, 2000).Thus, the objective of the crawlers is to stay focused,that is, remaining within the neighbourhood in whichtopic-specific pages have been identified.
In this context, an evaluation methodology is alogical description of the processes and connected el-ements to be followed to help one better understand aquality evaluation. By following this process, a com-puter scientist or practitioner can learn what he or sheneeds to know to determine the level of a performanceof a search strategy in a specific context. This paperis geared toward a definition of a evaluation method-ology for the adaptive focused crawlers.
At present, focused crawling evaluations that alsoinclude adaptivity analysis are not available. One ofthe reasons could be the difficulty to measure the re-action of crawlers to user needs refinements or al-terations of the environment. How long does it taketo adapt the crawl to a user relevance feedback andprovide new interesting documents? How many envi-ronment alterations are tolerable before the crawling
performance falls below a given threshold? Standardmethodologies to assess those characteristics, thus al-lowing comparing different search strategies are yetto be developed.
The aim of this paper is twofold. First, we sum-marise the different evaluation approaches that havebeen proposed in the literature, critically discussingthe testbed settings and the evaluation metrics. Afterhaving identified the most relevant factors to be in-cluded in a general framework, we give an accountof the fundamental elements for the definition of anevaluation methodology regardingadaptivefocusedcrawling systems.
The paper is organized as follows. We first presentthe most relevant input data that distinguish a spe-cific evaluation in Sections 3.1 and 3.2. Section 3.3deals with the approaches proposed for the definitionof relevance measures of the retrieved pages. In Sec-tion 3.4, we consider the resource constraints, whileSect. 3.5 is focused on the measures that better char-acterise the effectiveness of the search strategies dur-ing the crawl. Section 3.6 introduces the evaluationapproaches based on comparative analysis, while 3.7specifically dwells on the assessment of the adaptivebehaviour of the crawlers. The following section dis-cusses the related work in the literature. The last sec-tion is a conclusion.
2 RELATED WORK
The foremost exploratory research activity on theevaluation of adaptive focused crawlers has been pro-posed by Menczeret al. in (Menczer et al., 2004).
350
In particular, they compare several crawlers based onmachine learning techniques in order to assess boththe obtained general performance and some charac-teristics of adaptivity. The authors’ principal goalwas to evaluate the benefits of the machine learn-ing versus other approaches. While machine learn-ing has the chance to play a key role in the de-velopment of focused crawlers able to automaticallyadapt their search strategies to the peculiar charac-teristics of the topics and environment, the proposedframework misses to cover scenarios when the ap-proaches are subjected to continuous updates in theinput data (i.e., topics and environment alterations).In this case, adaptivity can be performed either incre-mentally by continuous update or by retraining usingrecent batches of data, either new or already visitedpages subjected to updates. In this scenario, the re-lation between the input data and the target variablechanges over time.
Several other frameworks have been pro-posed (Menczer et al., 2001; Chau and Chen,2003; Srinivasan et al., 2005; Pant and Srinivasan,2005), but none of them explicitly include adaptivebehaviour analysis.
3 AN EVALUATIONFRAMEWORK FOR ADAPTIVEFOCUSED CRAWLERS
Defining an evaluation methodology for astandardcrawler does not require a great effort. Once a sub-set of the web is available, it is possible to run an in-stance of the crawl on a workstation and monitor themost important parameters to measure its effective-ness (Cho et al., 1998). The proactivity and auton-omy characteristics of the search strategies of focusedcrawlers, which potentially allow them to explore re-gions of the web far from the starting points, call fordifferent evaluation approaches.
In addition to that, if the focused crawlers havesome sort of adaptivity behaviour w.r.t changes inthe environment or the current topics, the evaluationframework should keep track of changes of the per-formances and behaviour when one of both of theseaspects are being altered. Good adaptivity is char-acterised by changes of unconstructive or disruptivebehaviour, often caused by external stimuli, to some-thing more constructive, which is able to fulfil thegoal of the search activity.
In the following sections we define the parametersand the most relevant elements that form the evalua-tion methodology, to be assessed and reported during
the experiments with adaptive focused crawlers.
3.1 Corpus
There are two broad classes of evaluations, systemevaluations and user-centred evaluations. The lattermeasure the user’s satisfaction with the system, whilethe former focuses on how well the system is able toretrieve and rank documents. Several researchers ac-cept that evaluators of adaptive systems should adopta user-centred evaluation approach because users areboth the main source of information and the main tar-get of the application, but manually finding all the rel-evant documents in a large collections of billion ofdocuments is not practical. User-based evaluation isextremely expensive and difficult to do correctly. Aproper designed user-based evaluation must use a suf-ficiently large, representative sample of potential top-ics. Such considerations lead researchers to use theless expensive system evaluations.
Of course, technical issues must be addressed inorder to construct a collection that is a good sampleof the web (Bailey et al., 2003). Nevertheless, “bold”focused crawlers have the chance to take decisionson many different paths and visit pages far from theseed sets, with more chances to end up towards pathsof pages not being included in the initial collection.For this reason, standard or predefined collections arerarely employed.
All, or almost all, of the focused crawling evalu-ations in the literature do not employ any corpus butallow the crawlers to access any document on the web.Web pages continue to change even after they are ini-tially published by their authors and, consequently, itis almost impossible to make comparisons from re-sults obtained by different search strategies, as dis-cussed in Sect. 3.6.
The adaptivity behaviour allows crawlers to dy-namically adjust the search strategies to several differ-ent and unexpected external alterations. Its evaluationis therefore a complex activity going through the iden-tification and assessment of several variables, some-times in mutual relationship one another. It is rea-sonable that a sound evaluation has to consider com-plex and long-lasting test evaluations to identify thoserelationships as a function of controlled variations inthe input data. A static and large corpus of web doc-uments is the only requirement that guarantees thevalid comparison of several outcomes obtained at dif-ferent times.
3.2 Seeds
A good selection of seed pages guarantees that
A�General�Evaluation�Framework�for�Adaptive�Focused�Crawlers
351

enough pages from different communities related tothe current topic will be sampled and the crawler ex-ploits the topical locality for finding additional pagesin comparison with crawl starting from random seeds.For instance, Daneshpajouhet al. (Daneshpajouhet al., 2008) compared various community-based al-gorithms for discovering good seeds from previouslycrawled web graphs and discovered that HITS-basedranking is a good approach for this task. Of course,the seed page identification should not be too ex-pensive in terms of computational time. If web cor-pora are not available, valid sources of seeds may behuman-generated directories such as Open DirectoryProject (ODP)1, where each category contains linksto pages about similar topics.
Of course, seed pages related to the interestingtopics make the search for related pages much eas-ier because of the topical locality phenomenon. Srini-vasanet al. (Srinivasan et al., 2005) provide an in-teresting mechanism to control the level of difficultyof the crawl tasks by means of the hypertext structureamong pages. Once a subset of target pages, that ispages relevant to a topic, is identified, it is possible tocollect pages linking to the specified targets by query-ing one of the online services such as Mozscape2. Byiterating thisbacklinkprocedure, it is possible to col-lect several paths, a subset of them bringing to thetarget pages. The last pages to be collected are theones that will be included in the seed set.
The number of iterationsI match the level of diffi-culty of the crawling task. Particularly difficult taskshave a few relevant pages far away form the seed sets.If the crawler is able to find those targets, its edgesearch strategy has boldness traits favouring the ex-ploration on various different paths. The opposite be-haviour of the greedy strategies encourages the ex-ploitation of the current good pages sticking the ex-ploration to their vicinity. An adaptive selection ofbold and greedy strategies may rely on the current ac-quired evidence. For example, once a number of rele-vant websites have been found, the exploration can befocused on the near linked pages, while bold strate-gies are valid when no evidence is fruitful and newpaths have to be verified. At present, focused crawlersdo not explicitly include this form of search strategyadaptivity.
The above-mentioned backlink procedure is theonly one that allows the framework to include the re-call measure of performance discussed in Sect. 3.5.1.As a matter of fact, the procedure builds up a smallcorpus of pages, where the good ones are clearly iden-tified.
1http://www.dmoz.org2http://moz.com
3.3 Topic Affinity
Ideal focused crawlers retrieve the highest numberof relevant pages while simultaneously traversing theminimal number of irrelevant pages. This leads to sig-nificant savings in hardware and network resources,and helps keep the crawl more up-to-date.
One of the first evaluation parameters to take intoconsideration is the soundness of the retrieved docu-ments’ content. The traditional crawlers’ goal is todownload as many resources as possible, whereas afocused crawler should be able to filter out the doc-uments that are not deemed related to the topics ofinterest. Focused crawlers respond to the particularinformation need expressed by topical queries or in-terest profiles.
Besides monitoring the exploration results, theevaluation of the relatedness of the retrieved docu-ments is also fundamental for the selection of the bestroutes to follow. For this reason, focused crawlersroutinely compute these measures for assigning thepriorities to the queued URLs during the exploration.A formal description for the topic of interests is fun-damental for effectively driving the crawling to a sub-set of paths and, of course, it is strictly correlated tothe definition of the relatedness measure. Singulardomains may also define ad-hoc measures of effec-tiveness, such as novelty and diversity of page con-tents (Barbosa and Bangalore, ).
In the following sections, we give an account ofthe most relevant approaches for evaluating the relat-edness of the retrieved documents.
3.3.1 Topic Selection
Information searchingis the intent that usually moti-vates the queries driving the focused crawling. Usersare willing to locate documents and multimedia con-cerning a particular topic in order to address an in-formation need or perform a fact-finding or generalexploratory activity. These topics can be along a spec-trum from very precise to very vague.
A long-lasting research activity aiming at defininga comprehensive classification of user intents for websearching (e.g., (Jansen et al., 2008)) and related IRevaluations (e.g., (Sakai, 2012)) is largely available.
In contrast to search engines, topics submitted tofocused crawling are defined by expert users able toaccurately select a good representation of their in-tents. At the same time, those intents can still assumeboth a broad (e.g., “Find information about Windows9”) or specific scopes (e.g., “Find stocks of DNA se-quencing companies”).
While automatic approaches to select broad-topicqueries are available (see Sect. 3.3.3), specific scope
WEBIST�2014�-�International�Conference�on�Web�Information�Systems�and�Technologies
352
queries are usually human-generated or extractedfrom real scenarios (Gasparetti et al., 2014). In spiteof that, general evaluation frameworks should takeinto account both of the typologies in order to assessthe benefits of different strategies and adaptivity tech-niques in the two scenarios.
3.3.2 “Plain” Matching
Several focused crawlers use text similarity measuresfor comparing the content extracted from the crawledpages and a representation of the topic that drives thesearch.
If both topics and contents are described by key-words, the relevance between them can be calculatedby one of the well-known approaches proposed in theIR, such as:
VSM. Vector Space Model (e.g., (Hersovicia et al.,1998))
NB. Naive Bayes classifiers trained on a subset ofdocuments related to the topic (e.g, (Chakrabartiet al., 1999; Chakrabarti et al., 2002))
SVM. Support Vector Machine (e.g., (Ehrig andMaedche, 2003; Choi et al., 2005; Luong et al.,2009))
NN. Neural networks (e.g., (Menczer and Monge,1999; Chau and Chen, 2003))
LSI. Latent Semantic Indexing (e.g., (Hao et al.,2011))
The output is usually any real number between 0 and1:
fm : DxT → [0,1]. (1)
whereD andT are the representations of the docu-ment and topic, respectively.
A comparative evaluation shows how NB classi-fiers are weak choices for guiding a focused crawlerwhen compared with SVM or NN (Pant and Srini-vasan, 2005).
3.3.3 Taxonomy-based Matching
In order to more accurately drive the crawl, some fo-cused crawlers use hierarchical structures for classify-ing pages (Chakrabarti et al., 1999; Chen et al., 2008).There are several complex hierarchical taxonomiesand ontologies available, e.g., Medical Subject Head-ings, U.S. Patents, ODP and CIDOC Conceptual Ref-erence Model for cultural heritage. Instead of binaryclassifiers, where each category or class is treated sep-arately, hierarchical categorisation may drop a docu-ment into none, one, or more than one category. Usersinstantiate a crawl by selecting one or more topics inthe given taxonomy.
Imagine a hierarchy with two top-level cate-gories, e.g.,Computers and Recreation, and sev-eral subcategories, such asComputers/Hacking,Computers/Software and Computers/Emulators.In a non-hierarchical model, a word likecomputerisnot very discriminating since it is associated with sev-eral categories related to computers. In a hierarchicalmodel, more specialized words could be used as fea-tures within the top-levelComputer category to betterchoose the right one for a given a document.
Chakrabartiet al. (Chakrabarti et al., 1999) de-termine the relevance of one page analysing its an-cestor categories. If one of those ancestors is in thesubset of topics selected by the user, the page is fur-ther analysed because it covers more detailed topics.The same approach can be employed in an evaluationframework so that relevant documents are not ignoredbecause they do not ideally match the user topic.
Text descriptions of the descendants in the taxon-omy can be used to improve the representation of thetopic of interests (Chen et al., 2008). Cross-languagehierarchical taxonomies can also be employed to al-low focused crawlers analyse pages in different lan-guages.
Menczeret al. propose to use the ODP taxon-omy to automatically generate topics for the evalua-tions (Menczer et al., 2004). Leaves with five or morelinks are extracted and used as potential topics. In par-ticular, the text corresponding to the title of the cate-gory and the anchors of the external links become atext description of each topic.
Hierarchical categorisation with SVM has beenproven to be an efficient and effective technique forthe classification of web content (Dumais and Chen,2000). Other relevant approaches are based on the se-mantic analysis of the content, e.g., (Limongelli et al.,2011; Gentili et al., 2003; Biancalana et al., 2013).
3.3.4 Predicate-based Matching
A focused crawler estimates the likelihood that eachcandidate link will lead to further relevant content.Evidence such as links’ anchor text, URL words andsource page relevance are typically exploited in esti-mating link value comparing the text against the cur-rent topic of interest.
Aggarawalet al. (Aggarwal et al., 2001) proposethe definition of arbitrary predicates in order to betterperform the resource discovery. Besides simple key-words, predicates may extend to peculiar characteris-tics of the retrieved pages or properties of the link-age topology. By analysing the characteristics of thecollected pages and the values of their predicates, itis possible to understand the statistical relationshipbetween the predicates and the best candidate pages.
A�General�Evaluation�Framework�for�Adaptive�Focused�Crawlers
353

For instance, Diligentiet al. (Diligenti et al., 2000)use the context-graph idea to learn the characteristicsof the best routes examining features collected frompaths leading up to the relevant nodes.
Besides sets of keywords, predicates give usersthe chance to represent the features that the retrievedpages must own in order to be judged relevant. Forexample, opinion and discourse analysis on contentsspread out on a sequence of connected pages mightunveil valuable information that strict keyword-basedrelevance measures on single documents might miss.
While predicates are shown to be fundamen-tal improvements in developing adaptive focusedcrawlers (Micarelli and Gasparetti, 2007), there arenot attempts to use user-defined predicates to evalu-ate the performance of the crawlers. Predicates areusually very context-dependent, therefore they arestrongly affected by the specific goal, situation, do-main, task or problem under examination. None ofthe predicate-based approaches proposed in the liter-ature propose a formal methodology for the definitionof those predicates. User-defined predicates are sub-jective by nature, for this reason they are less suitablefor being included in general evaluation frameworks.
3.3.5 Authoritativeness
The overwhelming amount of information on the webrelated to a potential topic of interest may hinder theability to make important decisions. One of the ad-vantages of focused crawlers, that is the reduction ofthe information overload, is only partially achievedwhen the topics of interest is too general or vague.
Focused crawlers use topic distillation for findinggood hubs, i.e., pages containing large numbers oflinks to relevant pages for updating the current queueof URLs to visit (Kleinberg, 1998; Chakrabarti et al.,1999). The purpose of topic distillation is to increasethe precision of the crawl, even if there is no trace ofthe topic keywords in them. Pages and links form agraph structure and connectivity analysis algorithmsbased on a mutual reinforcement approach is able toextract hubs and authority pages, that is relevant pagespointed by hubs. Different topics may show differenttopologies of interconnections between web pages.Menczeret al. (Menczer et al., 2004) state how iter-ative algorithms such as HITS and PageRank able toextract meaning from link topology permit the searchto adapt to different kinds of topics.
While focused crawlers use hubs for finding newseeds during the crawl, authority measures can beused to evaluate the importance of the retrievedpages. Despite similar performances, different fo-cused crawlers may cover subspaces on the web withlow overlap. Due to dissimilar topologies, authority
measures better unveil different outputs and searchstrategies.
A clear limitation of these measures in an evalua-tion framework is that they are computed on a partialweb graph built by extracting the links from the col-lected documents obtaining a rough approximation oftheir values. The use of a static large corpus (e.g.,CommonCrawl) can overcome this obstacle.
3.4 Resource Contraints
Focused crawling identifies relevant documents re-ducing the computational resources required by thistask. The principal computational resources are com-putation time, network bandwidth and memory space.While the processing speed and memory capacity costunit have been constantly reduced in recent years, net-work bandwidth poses strong limits on the number ofdocuments that can be downloaded and evaluated.
Focused crawlers based on iterative algorithmssuch as HITS, e.g., (Cho et al., 1998; Chakrabartiet al., 1999; Rungsawang and Angkawattanawit,2005) are expected to reduce the rate of page down-loads when the set of hypertext documents is large.Most of the current evaluations ignore experimentsthat extend over 10 thousands of documents andhence they just ignore this issue. Comparative anal-ysis of focused crawlers that include iterative algo-rithms should clearly state the asymptotic estimatesof the complexity, therefore ignoring the efficacy al-teration due to potential different implementations ofthe same algorithms.
In practice, a simple heuristic to determine theCPU usage is monitoring the time elapsed beforereaching a given limit of retrieved documents. Resultsshould generally be averaged over several tests andstatistical significance values have to be computed inorder to reduce the effects of temporary Internet slow-downs and prove the soundness of the evaluation.
3.5 Behaviour Analysis
An evaluation framework of focused crawling strate-gies has to provide provable guarantees about theirperformance assessments. However, an algorithm thatworks well in one practical domain might performpoorly in another. Trend analysis on each topic basedon the information accumulated over a period of crawlactivity would permit to understand the variations ofthe performances as a function of explicit or implicitvariables. The complexity of the topic, the amountof links in the visited web graph or the unreachablepages are only some of the variables that may stronglyalter the behaviour of the focused crawlers. While
WEBIST�2014�-�International�Conference�on�Web�Information�Systems�and�Technologies
354

an average on several tests may reduce the influenceof these variables on the final results, analysing somemeasures during the crawl gives the chance to get dif-ferent views on the performance and better charac-terise the benefits and drawbacks of various strategiesin various contexts.
3.5.1 Precision, Recall and Harvest Rate
Precision and recall are two popular performancemeasures defined in automated IR, well defined forsets. The formerPr corresponds to the fraction of topr ranked documents that are relevant to the query overthe total number of retrieved documents, interestingand not.
Pr =f ound
f ound+ f alse alarm(2)
while recallRr is the proportion of the total numberof relevant documents retrieved in the topr (cutoff)over the total number of relevant documents availablein the environment:
Rr =f ound
f ound+miss(3)
Precision and recall are virtually independent bythe relatedness measure definition, therefore it is pos-sible to employ one of the above-mentioned measuresin order to identify relevant and irrelevant documents.
As pointed out in (Chakrabarti et al., 1999), therecall indicator is hard to measure because it is im-possible to clearly derive the total number of docu-ments relevant to a topic due to the vastness of theweb, unless the backlink procedure for the seed se-lection discussed in Sect. 3.2 is chosen.
If the precision of the fetched pages is computedduring the crawl, the curve ofharvest rate hr(n) fordifferent time slices of the crawl is obtained, wherenis the current number of fetched pages (Chakrabartiet al., 1999). This measure indicates if the crawlergets lost during the search or if it is able to constantlykeep the search over the relevant documents. The har-vest rate becomes a critical measures for analysing thebehaviour of the crawlers after alterations of the envi-ronment or topics of interests (see Sect.3.7).
3.5.2 Deep Web Strategies
On a different note, most search engines cover what isreferred to as the publicly indexable Web but a largeportion of the Internet is dynamically generated andsuch content typically requires users to have prior au-thorisation, fill out forms, or register (Raghavan andGarcia-Molina, 2001). Other information refers toTwitter or Facebook posts, links buried many layers
down in a structured website, or results that sit sofar down the standard search results that typical userswill never find them. This covert side of the Internetis commonly referred to as the hidden/deep/invisibleweb. Hidden web content often corresponds to pre-cious information stored in specialised databases. Fo-cused crawlers have the chance to include novel deepweb crawling strategies in order to find out additionalrelevant documents (Zheng et al., 2013). A feasiblemeasure to assess the effectiveness of these strategiesis based on the comparison of the retrieved pages withthe collection of pages retrieved by popular search en-gines. A large subset of relevant documents that doesnot overlap with the search engines’ collections is ex-pected for good deep web strategies.
While these strategies are golden features usefulin several contexts and, therefore, required to be eval-uated during the crawl, a very few attempts have beenproposed, and all of them limit the scope of their tech-niques to strategies for specific portions of websites(Bergholz and Chidlovskii, 2003; Liakos and Ntoulas,2012).
3.6 Comparative Analyses
Section 3.1 discussed how focused crawling can beseen as a particular instance of the IR task, whichgoal is selecting a subset of documents from a largecollection relevant to a given topic. For this reason,the long-lasting research activity in the IR evaluationhas the chance to support new frameworks for focusedcrawlers.
Several IR experiments are designed following theCranfield paradigm, where same sets of documents,topics and measures are used for various approachesthat are considered in isolation, freed as far as possi-ble from the contamination of operational variables.The experimental design calls for same corpus of hy-pertext documents and same topics, with the com-putation of the same effectiveness measures in orderto directly compare different approaches’ outcomes.A performance comparison between adaptive, non-adaptive and unfocused crawlers (e.g., breadth-first,random strategy) can be easily obtained.
While hypertext test collections have been oftenused in the IR domain (e.g., the ones provided bythe Text Retrieval Conference TREC), they show sev-eral drawbacks in the focused crawling as discussedin Par.3.1.
Current focused crawling evaluations (e.g., (Srini-vasan et al., 2005; Menczer et al., 2004)) follow a hy-brid approach, where each round of tests are based onthe same topic and measures but each single strategyis evaluated allowing the crawler to directly access the
A�General�Evaluation�Framework�for�Adaptive�Focused�Crawlers
355
web. The authors make the assumption that the webis not being altered between two evaluations. Exceptif the evaluations take place very quickly one after an-other, this assumption is clearly wrong.
A partial workaround consists in caching the ac-cessed pages so that future requests and evaluationsfor that data can be served ignoring potential occurredalterations. Due to the locality reference of crawlers,it is also possible to cache pages that are connectedby the ones that have been retrieved during the crawl(i.e., prefetching). While caching can simulate sim-ilar testbeds between evaluations of different searchstrategies, it fails to maintain consistency between thecache’s intermediate storage and the location wherethe data resides. For example, home pages of newswebsites such as CNN.com are usually altered sev-eral times a day while other sections are not. Cachingtechniques that store only part of these websites can-not reproduce a valid image of their hypertext struc-ture and reachable content. Once again, a large snap-shot of the web is the only feasible way to guaran-tee the same platform for experimentation for varioussearch strategies.
3.7 Adaptivity
Menczeret al. associateadaptivityto the approachesthat include any sort of machine learning techniquesfor guiding search (Menczer et al., 2004). Adap-tive techniques are basically seen as means to betterunderstand the environment and its peculiar relation-ships with the topic. The environment and the topicsare perceived as static features.
On a different note, Micarelli and Gasparetti (Mi-carelli and Gasparetti, 2007) extend the definition ofadaptive focused crawlers to the ones able to addresspotential variations in the environment or in the topicdefinition. As a matter of fact, two relevant adaptivecrawlers (Menczer and Monge, 1999; Gasparetti andMicarelli, 2003) show both adaptive behaviour imple-menting multi-agent evolutionary or optimisation al-gorithms. For this reason, we should like to proposea methodology and measures to effectively assess thisform of adaptation, whatever technology is chosen forthe implementation of the focused crawlers.
3.7.1 Domain Adaptivity
Empirical analysis of web page changes combinedwith estimates of the size of the web states how anmount close to 5% of the indexable web must be sub-jected to re-index daily by search engines to keepthe collection up-to-date (Brewington and Cybenko,2000). Several statistical approaches aim at predict-ing whether a page will change based on the change
frequency for the same page observed over somepast historical window (Radinsky and Bennett, 2013).Nevertheless to our knowledge, there is not any fo-cused crawler that implements a scheduling policy forrevisiting web pages and adaptively alters its searchstrategy accordingly. Tight restrictions on the net-work bandwidth do not allow to allocate enough re-sources for collecting evidence about change rates ofpages. Without these data, robust computation of tem-poral change patterns and prediction activity are notpossible.
Singular exceptions are focused crawlers based ongenetic or ant paradigm approaches (Gasparetti andMicarelli, 2003; Menczer et al., 2004). In both the ap-proaches, a population of autonomous agents are ableto visit the environment collecting evidence aboutpotential alterations of content and hypertext struc-ture. In spite of that, the authors have not includedthe domain adaptivity characteristic in the evaluationof their approaches, nor have not future comparativestudies done.
At the same time, estimating the importance ofeach page during the discovery of the web graphis one of the goals of the focused crawlers (Abite-boul et al., 2003). In some circumstances, such asstock market news, the importance is affected by thefreshness of the published content. Efficient focusedcrawling strategies call for a better understanding ofthis relationship and adaptively change the behaviourof search for uncover the largest number of importantresources.
A feasible approach for evaluating these aspectsis by empirically measuring the time requested to re-visit a carefully defined set of pages that have beensubjected of alterations in their content. In particular,once a large set of cached pages have been collectedby previous evaluations, it is possible to identify thesubsetWa of these pages that have been altered sincethe beginning of the tests. By randomly choosing asubsetW′
a ⊆ Wa that satisfies a given percentage ofunique changes (e.g., 5%) and, at the same time, isrelated to the current topics, new evaluations are per-formed. Good adaptive strategies will access to thesepagesW′
a sooner keeping the available computationalresources the same (see Par. 3.4).
3.7.2 Topic Adaptivity
A more subtle form of adaptivity regards the topic thatguides the crawl. Queries or interest profiles might bealtered during the crawl in various ways:
• Generalisation: A similar or new topic seekingmore general information than the previous one;
• Specialisation: A similar or new topic seeking
WEBIST�2014�-�International�Conference�on�Web�Information�Systems�and�Technologies
356

more specific information than the previous one;
• Reformulation: A new topic that can be viewed asneither a generalisation nor a specialisation, but areformulation of the topic.
While traditional IR approaches consider each queryindependently one another, focused crawlers have thechance to exploit collected evidence during previouscrawls to drive future exploratory activities on similartopics saving computational resources.
Generalisation and specialisation are two formsof topic alterations that can be easily automated byemploying a taxonomy-based representation of top-ics, as discussed in Sect. 3.3.3. Lower levels of theseforms of topic organisations correspond to speciali-sation while upper levels to generalisation. Duringcomparative analysis, several search strategies may beaffected by the same topic alteration. By monitoringthe impact of this alteration on the performance mea-sures (e.g., average topic affinity of pages) it is pos-sible to identify the approaches that better exploit thecollected evidence being able to promptly adapt theexploration.
4 CONCLUSIONS
The major contribution of the present position paperis to propose an extended evaluation framework forfocused crawlers able to take into consideration adap-tivity behaviours. A developed discussion on the lim-itations of the current approaches allowed us to iden-tify relevant features that have currently been ignoredin the literature. Moreover, using the lessons learnedfrom the previous crawler evaluation studies, the pro-posed framework makes explicit reference to the mea-sures proven to be fundamental so far.
We are currently planning to apply the describedmethodology in a real scenario, where a compara-tive analysis will analyse the performance of the mostpopular adaptive focused crawlers.
REFERENCES
Abiteboul, S., Preda, M., and Cobena, G. (2003). Adaptiveon-line page importance computation. InProceed-ings of the 12th International Conference on WorldWide Web, WWW ’03, pages 280–290, New York,NY, USA. ACM.
Aggarwal, C. C., Al-Garawi, F., and Yu, P. S. (2001). Intel-ligent crawling on the world wide web with arbitrarypredicates. InProceedings of the 10th InternationalConference on World Wide Web, WWW ’01, pages96–105, New York, NY, USA. ACM.
Bailey, P., Craswell, N., and Hawking, D. (2003). Engineer-ing a multi-purpose test collection for web retrievalexperiments.Inf. Process. Manage., 39(6):853–871.
Barbosa, L. and Bangalore, S. In Macdonald, C., Ounis,I., and Ruthven, I., editors,CIKM, pages 755–764.ACM.
Bergholz, A. and Chidlovskii, B. (2003). Crawling fordomain-specific hidden web resources. InProceed-ings of the Fourth International Conference on WebInformation Systems Engineering, WISE ’03, pages125–, Washington, DC, USA. IEEE Computer Soci-ety.
Biancalana, C., Gasparetti, F., Micarelli, A., and Sansonetti,G. (2013). Social semantic query expansion.ACMTrans. Intell. Syst. Technol., 4(4):60:1–60:43.
Brewington, B. E. and Cybenko, G. (2000). How dy-namic is the web? InProceedings of the 9th In-ternational World Wide Web Conference on Com-puter Networks : The International Journal of Com-puter and Telecommunications Netowrking, pages257–276, Amsterdam, The Netherlands, The Nether-lands. North-Holland Publishing Co.
Chakrabarti, S., Punera, K., and Subramanyam, M. (2002).Accelerated focused crawling through online rele-vance feedback. InWWW ’02: Proceedings of the11th international conference on World Wide Web,pages 148–159, New York, NY, USA. ACM Press.
Chakrabarti, S., van den Berg, M., and Dom, B. (1999).Focused crawling: A new approach to topic-specificweb resource discovery. InProceedings of the 8thWorld Wide Web Conference (WWW8), pages 1623–1640, Toronto, Canada.
Chau, M. and Chen, H. (2003). Comparison of three verticalsearch spiders.Computer, 36(5):56–62.
Chen, Z., Ma, J., Han, X., and Zhang, D. (2008). An ef-fective relevance prediction algorithm based on hier-archical taxonomy for focused crawling. In Li, H.,Liu, T., Ma, W.-Y., Sakai, T., Wong, K.-F., and Zhou,G., editors,Information Retrieval Technology, volume4993 of Lecture Notes in Computer Science, pages613–619. Springer Berlin Heidelberg.
Cho, J., Garcia-Molina, H., and Page, L. (1998). Efficientcrawling through url ordering.Computer Networksand ISDN Systems, 30(1–7):161–172.
Choi, Y., Kim, K., and Kang, M. (2005). A focused crawl-ing for the web resource discovery using a modifiedproximal support vector machines. In Gervasi, O.,Gavrilova, M., Kumar, V., Lagan, A., Lee, H., Mun,Y., Taniar, D., and Tan, C., editors,ComputationalScience and Its Applications ICCSA 2005, volume3480 of Lecture Notes in Computer Science, pages186–194. Springer Berlin Heidelberg.
Daneshpajouh, S., Nasiri, M. M., and Ghodsi, M. (2008).A fast community based algorithm for generating webcrawler seeds set. In Cordeiro, J., Filipe, J., and Ham-moudi, S., editors,WEBIST (2), pages 98–105. IN-STICC Press.
Davison, B. D. (2000). Topical locality in the web. InSIGIR ’00: Proceedings of the 23rd annual interna-tional ACM SIGIR conference on Research and devel-opment in information retrieval, pages 272–279, NewYork, NY, USA. ACM Press.
A�General�Evaluation�Framework�for�Adaptive�Focused�Crawlers
357
Diligenti, M., Coetzee, F., Lawrence, S., Giles, C. L., andGori, M. (2000). Focused crawling using contextgraphs. InVLDB ’00: Proceedings of the 26th Inter-national Conference on Very Large Data Bases, pages527–534, San Francisco, CA, USA. Morgan Kauf-mann Publishers Inc.
Dumais, S. and Chen, H. (2000). Hierarchical classifi-cation of web content. InProceedings of the 23rdAnnual International ACM SIGIR Conference on Re-search and Development in Information Retrieval, SI-GIR ’00, pages 256–263, New York, NY, USA. ACM.
Ehrig, M. and Maedche, A. (2003). Ontology-focusedcrawling of web documents. InSAC ’03: Proceedingsof the 2003 ACM symposium on Applied computing,pages 1174–1178, New York, NY, USA. ACM Press.
Gasparetti, F. and Micarelli, A. (2003). Adaptive websearch based on a colony of cooperative distributedagents. In Klusch, M., Ossowski, S., Omicini, A.,and Laamanen, H., editors,Cooperative Informa-tion Agents, volume 2782, pages 168–183. Springer-Verlag.
Gasparetti, F., Micarelli, A., and Sansonetti, G. (2014). Ex-ploiting web browsing activities for user needs iden-tification. In International Conference on Computa-tional Science and Computational Intelligence (CSCI2014). IEEE Computer Society Conference Publish-ing Services.
Gentili, G., Micarelli, A., and Sciarrone, F. (2003). In-foweb: An adaptive information filtering system forthe cultural heritage domain.Applied Artificial Intel-ligence, 17(8-9):715–744.
Hao, H.-W., Mu, C.-X., Yin, X.-C., Li, S., and Wang, Z.-B. (2011). An improved topic relevance algorithm forfocused crawling. InSystems, Man, and Cybernet-ics (SMC), 2011 IEEE International Conference on,pages 850–855.
Hersovicia, M., Jacovia, M., Maareka, Y. S., Pellegb, D.,Shtalhaima, M., and Ura, S. (1998). The shark-searchalgorithm an application: tailored web site mapping.In Proceedings of the 7th World Wide Web Confer-ence(WWW7), Brisbane, Australia.
Jansen, B. J., Booth, D. L., and Spink, A. (2008). Deter-mining the informational, navigational, and transac-tional intent of web queries.Inf. Process. Manage.,44(3):1251–1266.
Kleinberg, J. (1998). Authoritative sources in a hyperlinkedenvironment. InProceedings of the 9th annual ACM-SIAM symposium on Discrete algorithms, pages 668–677, San Francisco, CA, USA.
Liakos, P. and Ntoulas, A. (2012). Topic-sensitive hidden-web crawling. InProceedings of the 13th Interna-tional Conference on Web Information Systems En-gineering, WISE’12, pages 538–551, Berlin, Heidel-berg. Springer-Verlag.
Limongelli, C., Sciarrone, F., and Vaste, G. (2011). Per-sonalized e-learning in moodle: The moodle-ls sys-tem. Journal of E-Learning and Knowledge Society,7(1):49–58.
Luong, H. P., Gauch, S., and Wang, Q. (2009). Ontology-based focused crawling. InInformation, Process, andKnowledge Management, 2009. eKNOW ’09. Interna-tional Conference on, pages 123–128.
Menczer, F. and Monge, A. E. (1999). Scalable web searchby adaptive online agents: An infospiders case study.In Klusch, M., editor,Intelligent Information Agents,pages 323–340. Springer-Verlag, Berlin, Germany.
Menczer, F., Pant, G., and Srinivasan, P. (2004). Topicalweb crawlers: Evaluating adaptive algorithms.ACMTrans. Internet Technol., 4(4):378–419.
Menczer, F., Pant, G., Srinivasan, P., and Ruiz, M. E.(2001). Evaluating topic-driven web crawlers. InPro-ceedings of the 24th Annual International ACM SIGIRConference on Research and Development in Informa-tion Retrieval, SIGIR ’01, pages 241–249, New York,NY, USA. ACM.
Micarelli, A. and Gasparetti, F. (2007). Adaptive focusedcrawling. In Brusilovsky, P., Kobsa, A., and Nejdl, W.,editors,The Adaptive Web, volume 4321 ofLectureNotes in Computer Science, pages 231–262. SpringerBerlin Heidelberg.
Pant, G. and Srinivasan, P. (2005). Learning to crawl: Com-paring classification schemes.ACM Trans. Inf. Syst.,23(4):430–462.
Radinsky, K. and Bennett, P. N. (2013). Predicting con-tent change on the web. InProceedings of the SixthACM International Conference on Web Search andData Mining, WSDM ’13, pages 415–424, New York,NY, USA. ACM.
Raghavan, S. and Garcia-Molina, H. (2001). Crawling thehidden web. InVLDB ’01: Proceedings of the 27thInternational Conference on Very Large Data Bases,pages 129–138, San Francisco, CA, USA. MorganKaufmann Publishers Inc.
Rungsawang, A. and Angkawattanawit, N. (2005). Learn-able topic-specific web crawler.J. Netw. Comput.Appl., 28(2):97–114.
Sakai, T. (2012). Evaluation with informational and navi-gational intents. InProceedings of the 21st Interna-tional Conference on World Wide Web, WWW ’12,pages 499–508, New York, NY, USA. ACM.
Srinivasan, P., Menczer, F., and Pant, G. (2005). A generalevaluation framework for topical crawlers.Informa-tion Retrieval, 8(3):417–447.
Zheng, Q., Wu, Z., Cheng, X., Jiang, L., and Liu, J. (2013).Learning to crawl deep web.Inf. Syst., 38(6):801–819.
WEBIST�2014�-�International�Conference�on�Web�Information�Systems�and�Technologies
358
A Domotic Ecosystem Driven by a Networked Intelligence
Luca Ferrari, Matteo Gioia, Gian Luca Galliani and Bruno ApolloniDepartment of Computer Science, University of Milano, Milan, Italy
fferrari, gioia, galliani, [email protected]
Keywords: Advanced Domotic, Internet of Things, MQTT Protocols, Learning Algorithms.
Abstract: We describe a diffuse control system for household appliances rooted in an Internet of Thing network em-powered by a cognitive system. The key idea is that these appliances constitute an ecosystem populated by aplenty of devices with common features, yet called to satisfy in an almost repetitive way needs that may bevery diversified, depending on the user preferences. This calls for a network putting them in connection and acognitive system that is capable to interpret the user requests and translate them into instructions to be trans-mitted to the appliances. This in turn requires a proper architecture and efficient protocols for connecting theappliances to the network, as well as robust algorithms that concretely challenge cognitive and connectionisttheories to produce the instructions ruling the appliances. We discuss both aspects from a design perspectiveand exhibit a mockup where connections and algorithms are implemented.
1 INTRODUCTION
Control theory, as an offspring of cybernetics, isdeeply rooted in the concept of feedback (Wiener,1948) since the forties of the previous century. Inthe same period of time a different notion of controlin terms of self adapting systems emerged with thefirst modern hypotheses of the brain computing facil-ities within the connectionist framework (Rosenblatt,1958). These two ways of controlling a dynamic sys-tem ran in parallel up until the nineties, when hybridcontrol systems began exploiting synergies by con-ventional controls and by either recurrent neural net-works (Ku and Lee, 1995) or reinforcement learn-ing algorithms (Sutton and Barto, 1998). The Inter-net of Things paradigm suggests a renewed synergybetween the two approaches. Namely, the networkconnecting things on the Web enjoys many propertiesof a neural network in terms of both connectivity andelementariness of the messages normally exchangedbetween the devices and their huge number. How-ever, rather than distributed as in the connectionistparadigm, computations are expected to be more ef-ficient if they are performed in a centralized way, yetexploiting the capillarity of the information the net-work may bring them – hence we call it networkedintelligence. Per se, the machine where computationsare done is immaterial, so that we may assume themto be carried out (and possibly distributed too) every-where in the cloud. However, as with the multilayerperceptron (Haykin, 1994), the information manage-
ment is dealt with better through a hierarchical archi-tecture than through a distributed one.
This is the idea we pursue in our ecosystem.Namely, we are devising a system constituted by anensemble of household appliances ruled by a socialnetwork which is from time to time committed by auser to operate them optimally with respect to a giventask. For instance, the user asks the network to havetrousers perfectly washed by his washing machine. Inreply, the network sends directly to the machine a se-quence of instructions, call it recipe, such as “chargewater, heat water to 35 degrees”, etc., which drive themachine to carry out a perfect washing. On the onehand this a typical procedure we are used to expectfrom our personal devices. On the other one, the wayof implementing the procedure is rather hard. In aextreme synthesis we need:
1. electronics allowing the network to communicatewith the machine, possibly overriding its micro-controller logic;
2. a logic able to produce recipes that are optimalin respect to many criteria, from user preferencesall the way to ecological goals such as water orelectricity saving. The logic must learn how toreach these objectives from the feedback comingboth from devices and from users. Hence it is acognitive system.
3. an architecture and protocols vehiculating signalsbetween devices and the networked intelligence ina safe and efficient way.
359
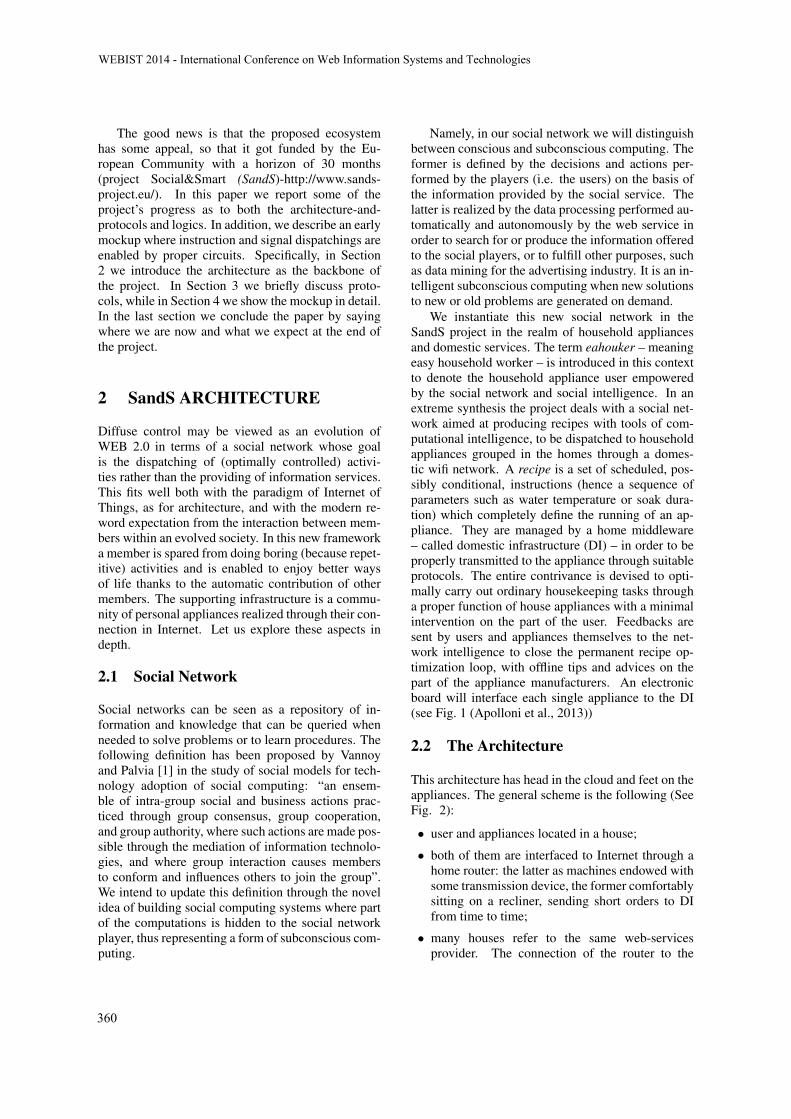
The good news is that the proposed ecosystemhas some appeal, so that it got funded by the Eu-ropean Community with a horizon of 30 months(project Social&Smart (SandS)-http://www.sands-project.eu/). In this paper we report some of theproject’s progress as to both the architecture-and-protocols and logics. In addition, we describe an earlymockup where instruction and signal dispatchings areenabled by proper circuits. Specifically, in Section2 we introduce the architecture as the backbone ofthe project. In Section 3 we briefly discuss proto-cols, while in Section 4 we show the mockup in detail.In the last section we conclude the paper by sayingwhere we are now and what we expect at the end ofthe project.
2 SandS ARCHITECTURE
Diffuse control may be viewed as an evolution ofWEB 2.0 in terms of a social network whose goalis the dispatching of (optimally controlled) activi-ties rather than the providing of information services.This fits well both with the paradigm of Internet ofThings, as for architecture, and with the modern re-word expectation from the interaction between mem-bers within an evolved society. In this new frameworka member is spared from doing boring (because repet-itive) activities and is enabled to enjoy better waysof life thanks to the automatic contribution of othermembers. The supporting infrastructure is a commu-nity of personal appliances realized through their con-nection in Internet. Let us explore these aspects indepth.
2.1 Social Network
Social networks can be seen as a repository of in-formation and knowledge that can be queried whenneeded to solve problems or to learn procedures. Thefollowing definition has been proposed by Vannoyand Palvia [1] in the study of social models for tech-nology adoption of social computing: “an ensem-ble of intra-group social and business actions prac-ticed through group consensus, group cooperation,and group authority, where such actions are made pos-sible through the mediation of information technolo-gies, and where group interaction causes membersto conform and influences others to join the group”.We intend to update this definition through the novelidea of building social computing systems where partof the computations is hidden to the social networkplayer, thus representing a form of subconscious com-puting.
Namely, in our social network we will distinguishbetween conscious and subconscious computing. Theformer is defined by the decisions and actions per-formed by the players (i.e. the users) on the basis ofthe information provided by the social service. Thelatter is realized by the data processing performed au-tomatically and autonomously by the web service inorder to search for or produce the information offeredto the social players, or to fulfill other purposes, suchas data mining for the advertising industry. It is an in-telligent subconscious computing when new solutionsto new or old problems are generated on demand.
We instantiate this new social network in theSandS project in the realm of household appliancesand domestic services. The term eahouker – meaningeasy household worker – is introduced in this contextto denote the household appliance user empoweredby the social network and social intelligence. In anextreme synthesis the project deals with a social net-work aimed at producing recipes with tools of com-putational intelligence, to be dispatched to householdappliances grouped in the homes through a domes-tic wifi network. A recipe is a set of scheduled, pos-sibly conditional, instructions (hence a sequence ofparameters such as water temperature or soak dura-tion) which completely define the running of an ap-pliance. They are managed by a home middleware– called domestic infrastructure (DI) – in order to beproperly transmitted to the appliance through suitableprotocols. The entire contrivance is devised to opti-mally carry out ordinary housekeeping tasks througha proper function of house appliances with a minimalintervention on the part of the user. Feedbacks aresent by users and appliances themselves to the net-work intelligence to close the permanent recipe op-timization loop, with offline tips and advices on thepart of the appliance manufacturers. An electronicboard will interface each single appliance to the DI(see Fig. 1 (Apolloni et al., 2013))
2.2 The Architecture
This architecture has head in the cloud and feet on theappliances. The general scheme is the following (SeeFig. 2):
� user and appliances located in a house;
� both of them are interfaced to Internet through ahome router: the latter as machines endowed withsome transmission device, the former comfortablysitting on a recliner, sending short orders to DIfrom time to time;
� many houses refer to the same web-servicesprovider. The connection of the router to the
WEBIST�2014�-�International�Conference�on�Web�Information�Systems�and�Technologies
360

Figure 1: A SandS project synopsis. eahouker is a combi-nation of the words easierly and houseworker.
Figure 2: SandS domotic system.
provider is per usual, the internal networking ofthe communication is committed to a special pro-tocol and a concentrator board if necessary;
� services are delivered in the frame of a social net-work.
With respect to this consolidated scenario, the pe-culiarities of our system are:
1. We look for a system as uninvasive as possible.This entails that extra-hardware must be reducedto the minimum; hence: the appliances to be asusual supplied by the stores plus the interfacingchip (Arduino board in the provisional solutionwe propose); no need for having a computer on,no set-top box.
2. We look for a system as undemanding as possi-ble. This calls for plug&play procedures whenan appliance is installed in or removed from thehome. Analogously, the need for user input ofdata must be kept to a minimum; likewise the ba-sic commands for activating the appliances. The
way of inputting data is immaterial; for instanceby smartphone, tablet, pc or other specific gadget.
3. we look for extremely adaptive services/recipes.This passes through two functional blocks: a so-cial network which issues recipes on demand tothe single user and a DI which administers therecipe according to rules on a home-by-home ba-sis.
4. We look for a system that is transparent to theuser. Hence, by definition, the DI is on the cloud,as is the social network. Transparency binds theentire chain from user to social network and back.
5. We look for an intelligent system. Here the in-telligence of social network members is involvedfirst when a service is initialized and then regu-larly when the user sends fuzzy feedbacks. Whilethis is insufficient for creating a true intelligentsystem, we can fill up this task with a series ofalgorithms on a proper eahouker database (EDB)that constitute the Networked Intelligence (NI) inthe core of the social network that is assigned toissuing recipes.
2.3 A Functional Layout
Fig. 3 gives an intuitive representation of the inter-actions between the system elements (Grana et al.,2013). The SandS Social Network mediates the in-teraction between a population of users (the eahouk-ers – hence ESN the name of the social network),each one with his/her own set of appliances. ESNhas a repository of tasks that have been posed by theeahoukers and a repository of recipes for the use ofappliances. These two repositories are related by amap between (to and from) tasks and recipes. Thismap does not need to be one-to-one. Blue dashed ar-rows correspond to the path followed by the eahoukerqueries, which are used to interrogate the databaseof known/solved tasks. If the task is already known,then the corresponding recipe can be returned to theeahouker appliance (solid black arrows). The ea-houker can express his/her satisfaction with the re-sults (dashed blue arrows). When the queried task isunknown and unsolved then the social network willrequest a solution from the SandS Networked Intelli-gence that will consists in a new recipe deduced frompast knowledge stored in the recipe repository. Thisnew solution will be generated by intelligent systemreasoning. The repository of recipes solving specifictasks can be loaded by the eahoukers while comment-ing among themselves on specific cases, or by the ap-pliance manufacturing companies as an example ofuse to foster sales by offering customer additional ap-pealing services. These situations correspond to the
A�Domotic�Ecosystem�Driven�by�a�Networked�Intelligence
361
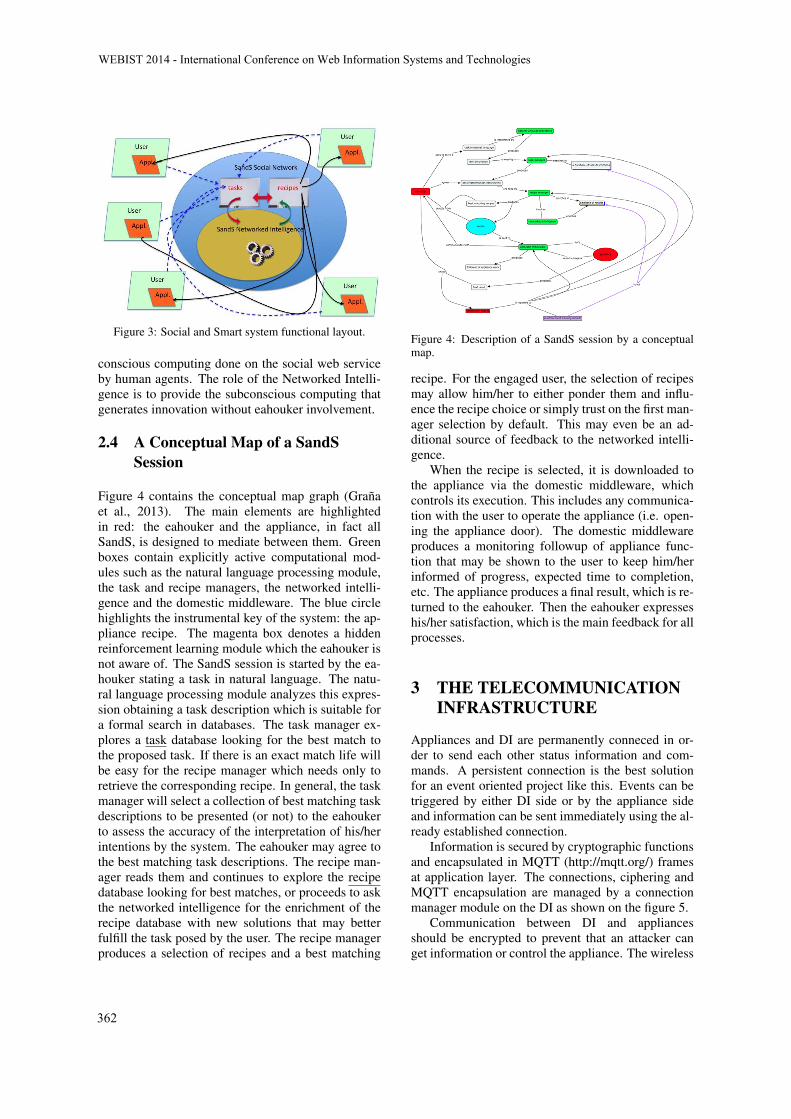
Figure 3: Social and Smart system functional layout.
conscious computing done on the social web serviceby human agents. The role of the Networked Intelli-gence is to provide the subconscious computing thatgenerates innovation without eahouker involvement.
2.4 A Conceptual Map of a SandSSession
Figure 4 contains the conceptual map graph (Granaet al., 2013). The main elements are highlightedin red: the eahouker and the appliance, in fact allSandS, is designed to mediate between them. Greenboxes contain explicitly active computational mod-ules such as the natural language processing module,the task and recipe managers, the networked intelli-gence and the domestic middleware. The blue circlehighlights the instrumental key of the system: the ap-pliance recipe. The magenta box denotes a hiddenreinforcement learning module which the eahouker isnot aware of. The SandS session is started by the ea-houker stating a task in natural language. The natu-ral language processing module analyzes this expres-sion obtaining a task description which is suitable fora formal search in databases. The task manager ex-plores a task database looking for the best match tothe proposed task. If there is an exact match life willbe easy for the recipe manager which needs only toretrieve the corresponding recipe. In general, the taskmanager will select a collection of best matching taskdescriptions to be presented (or not) to the eahoukerto assess the accuracy of the interpretation of his/herintentions by the system. The eahouker may agree tothe best matching task descriptions. The recipe man-ager reads them and continues to explore the recipedatabase looking for best matches, or proceeds to askthe networked intelligence for the enrichment of therecipe database with new solutions that may betterfulfill the task posed by the user. The recipe managerproduces a selection of recipes and a best matching
Figure 4: Description of a SandS session by a conceptualmap.
recipe. For the engaged user, the selection of recipesmay allow him/her to either ponder them and influ-ence the recipe choice or simply trust on the first man-ager selection by default. This may even be an ad-ditional source of feedback to the networked intelli-gence.
When the recipe is selected, it is downloaded tothe appliance via the domestic middleware, whichcontrols its execution. This includes any communica-tion with the user to operate the appliance (i.e. open-ing the appliance door). The domestic middlewareproduces a monitoring followup of appliance func-tion that may be shown to the user to keep him/herinformed of progress, expected time to completion,etc. The appliance produces a final result, which is re-turned to the eahouker. Then the eahouker expresseshis/her satisfaction, which is the main feedback for allprocesses.
3 THE TELECOMMUNICATIONINFRASTRUCTURE
Appliances and DI are permanently conneced in or-der to send each other status information and com-mands. A persistent connection is the best solutionfor an event oriented project like this. Events can betriggered by either DI side or by the appliance sideand information can be sent immediately using the al-ready established connection.
Information is secured by cryptographic functionsand encapsulated in MQTT (http://mqtt.org/) framesat application layer. The connections, ciphering andMQTT encapsulation are managed by a connectionmanager module on the DI as shown on the figure 5.
Communication between DI and appliancesshould be encrypted to prevent that an attacker canget information or control the appliance. The wireless
WEBIST�2014�-�International�Conference�on�Web�Information�Systems�and�Technologies
362

Figure 5: Information exchange between DI and appliance.
network of the user would be secured with a WPA2system, and so an attack from someone not authen-ticated on the network will be prevented. However,a possible attack could come from someone who hasillegitimately accessed and authenticated on the net-work. To prevent this and also to prevent possibleattacks on the channel between the users router andthe DI an additional security layer is inttorduced (seeFig. 6) by adding a Transport Layer Security (TLS–http://www.ietf.org/rfc/rfc2246.txt) to the communi-cation loop.
Figure 6: TLS and Wifi encryption.
TLS also allows the use of a certificate to con-firm that DI is really DI (and not an attacker supplant-ing the DI). Even encrypting the communication anattacker could just resend some previously recordedframes in order to send orders to the appliance.
4 AN ENABLING MOCKUP
We have set up a first mockup in the ComputerScience Department labs of University of Milano.From a purely operational perspective, it consistsof two - three white goods wifi connected to Inter-net, each with its own Arduino board, in order toexecute recipes and send back status signals. Forthe moment only a washing machine (wm) is be-ing tested (see Fig. 7). We use an Arduino MEGAADK board, an Arduino WIFI SHIELD (see Fig. 8)and a Sitecom wifi router connected to the univer-sity network. On this hardware we implement a com-munication protocol solving, albeit in a preliminaryway, problems both of security and of exact messageaddressing from middleware to appliance and back,within a MQTT-like service (MQTTstandard, ) thatis sketched in a next section. The protocol is event
Figure 7: A early SandS mockup.
Figure 8: The Arduino interface.
driven, so messages are sent only if state variableschange value. The appliance detection is realized inplug&play mode. The management of the appliance,in terms of specification and recipe requests, is donevia a browser on any mobile or fixed device. Theappliance is located on the ground floor of the Com-puter Science Department, while the consolle is on thethird floor of the same building. A distance of around300 m is covered by ethernet wiring, while the last 10m (including two concrete walls) are gapped via wificonnection. A sketch of the parameters managed bythe browser is reported in fig. 9. In the following wepropose early considerations on the various parts ofthe mockup.
4.1 Computational Requirements to theInterfacing Board
Quite simply, we ask to the Arduino board to act asa transducer: in input an instruction to the wm actu-ators, in output the corresponding signal to be trans-
A�Domotic�Ecosystem�Driven�by�a�Networked�Intelligence
363
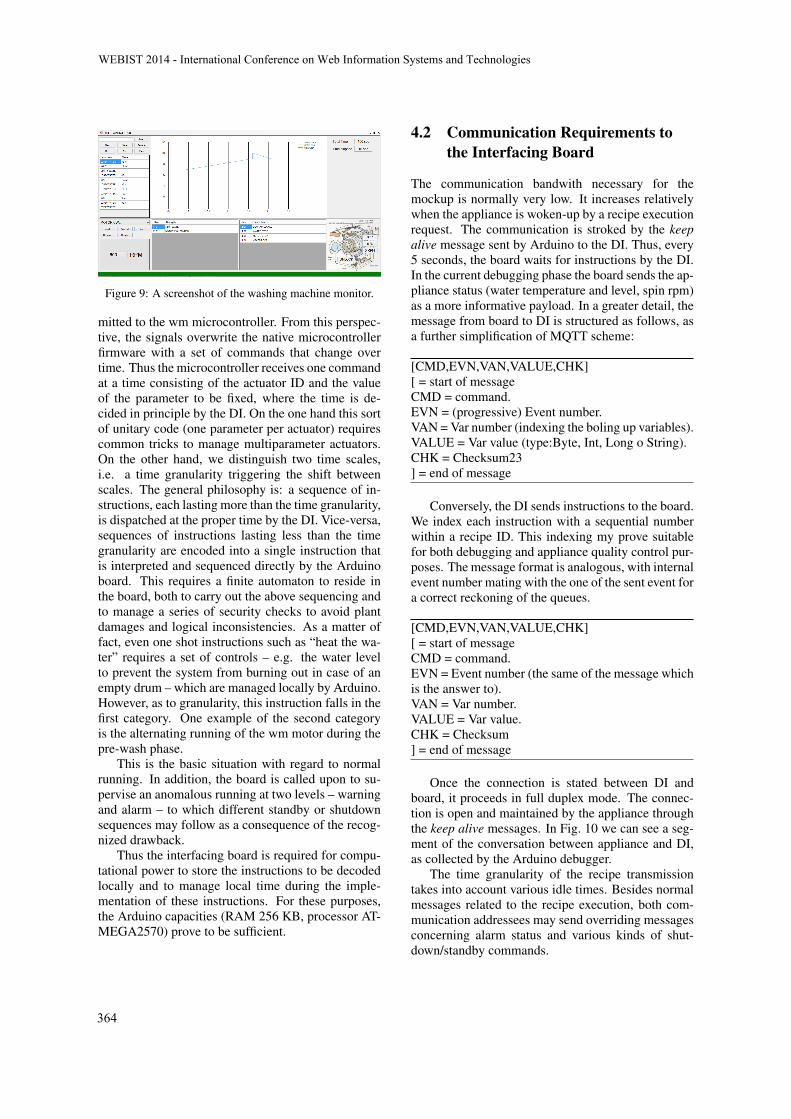
Figure 9: A screenshot of the washing machine monitor.
mitted to the wm microcontroller. From this perspec-tive, the signals overwrite the native microcontrollerfirmware with a set of commands that change overtime. Thus the microcontroller receives one commandat a time consisting of the actuator ID and the valueof the parameter to be fixed, where the time is de-cided in principle by the DI. On the one hand this sortof unitary code (one parameter per actuator) requirescommon tricks to manage multiparameter actuators.On the other hand, we distinguish two time scales,i.e. a time granularity triggering the shift betweenscales. The general philosophy is: a sequence of in-structions, each lasting more than the time granularity,is dispatched at the proper time by the DI. Vice-versa,sequences of instructions lasting less than the timegranularity are encoded into a single instruction thatis interpreted and sequenced directly by the Arduinoboard. This requires a finite automaton to reside inthe board, both to carry out the above sequencing andto manage a series of security checks to avoid plantdamages and logical inconsistencies. As a matter offact, even one shot instructions such as “heat the wa-ter” requires a set of controls – e.g. the water levelto prevent the system from burning out in case of anempty drum – which are managed locally by Arduino.However, as to granularity, this instruction falls in thefirst category. One example of the second categoryis the alternating running of the wm motor during thepre-wash phase.
This is the basic situation with regard to normalrunning. In addition, the board is called upon to su-pervise an anomalous running at two levels – warningand alarm – to which different standby or shutdownsequences may follow as a consequence of the recog-nized drawback.
Thus the interfacing board is required for compu-tational power to store the instructions to be decodedlocally and to manage local time during the imple-mentation of these instructions. For these purposes,the Arduino capacities (RAM 256 KB, processor AT-MEGA2570) prove to be sufficient.
4.2 Communication Requirements tothe Interfacing Board
The communication bandwith necessary for themockup is normally very low. It increases relativelywhen the appliance is woken-up by a recipe executionrequest. The communication is stroked by the keepalive message sent by Arduino to the DI. Thus, every5 seconds, the board waits for instructions by the DI.In the current debugging phase the board sends the ap-pliance status (water temperature and level, spin rpm)as a more informative payload. In a greater detail, themessage from board to DI is structured as follows, asa further simplification of MQTT scheme:
[CMD,EVN,VAN,VALUE,CHK][ = start of messageCMD = command.EVN = (progressive) Event number.VAN = Var number (indexing the boling up variables).VALUE = Var value (type:Byte, Int, Long o String).CHK = Checksum23] = end of message
Conversely, the DI sends instructions to the board.We index each instruction with a sequential numberwithin a recipe ID. This indexing my prove suitablefor both debugging and appliance quality control pur-poses. The message format is analogous, with internalevent number mating with the one of the sent event fora correct reckoning of the queues.
[CMD,EVN,VAN,VALUE,CHK][ = start of messageCMD = command.EVN = Event number (the same of the message whichis the answer to).VAN = Var number.VALUE = Var value.CHK = Checksum] = end of message
Once the connection is stated between DI andboard, it proceeds in full duplex mode. The connec-tion is open and maintained by the appliance throughthe keep alive messages. In Fig. 10 we can see a seg-ment of the conversation between appliance and DI,as collected by the Arduino debugger.
The time granularity of the recipe transmissiontakes into account various idle times. Besides normalmessages related to the recipe execution, both com-munication addressees may send overriding messagesconcerning alarm status and various kinds of shut-down/standby commands.
WEBIST�2014�-�International�Conference�on�Web�Information�Systems�and�Technologies
364
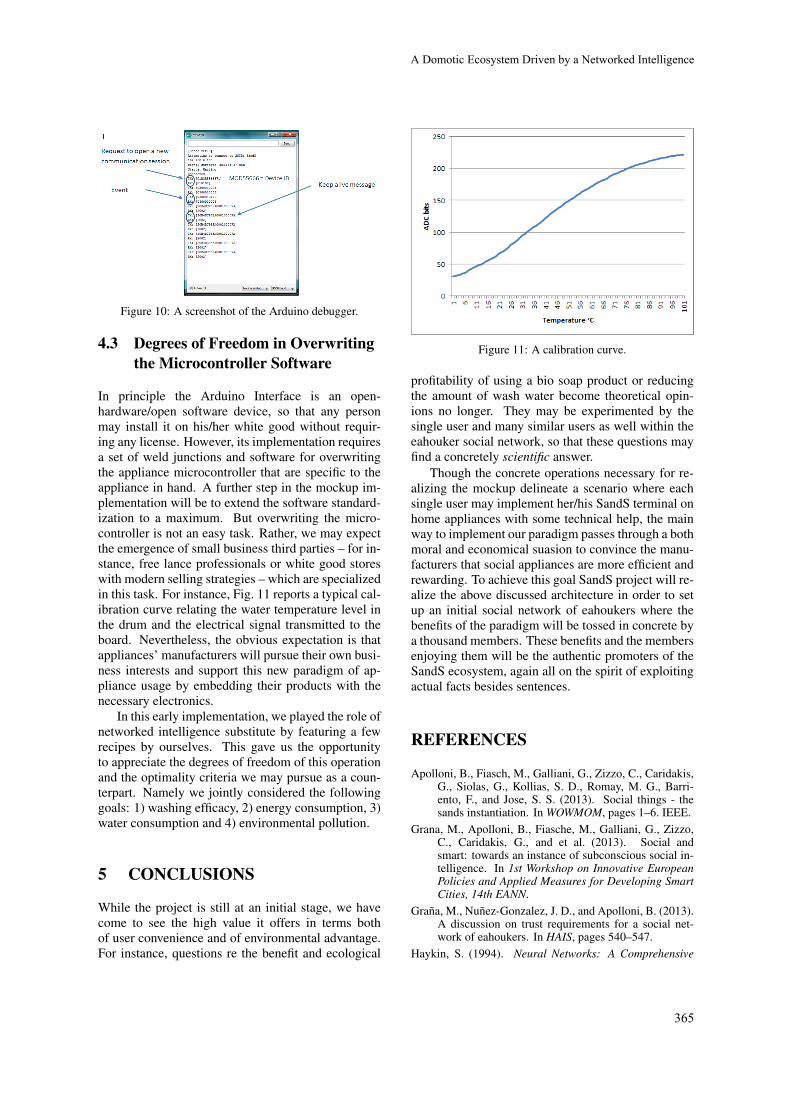
Figure 10: A screenshot of the Arduino debugger.
4.3 Degrees of Freedom in Overwritingthe Microcontroller Software
In principle the Arduino Interface is an open-hardware/open software device, so that any personmay install it on his/her white good without requir-ing any license. However, its implementation requiresa set of weld junctions and software for overwritingthe appliance microcontroller that are specific to theappliance in hand. A further step in the mockup im-plementation will be to extend the software standard-ization to a maximum. But overwriting the micro-controller is not an easy task. Rather, we may expectthe emergence of small business third parties – for in-stance, free lance professionals or white good storeswith modern selling strategies – which are specializedin this task. For instance, Fig. 11 reports a typical cal-ibration curve relating the water temperature level inthe drum and the electrical signal transmitted to theboard. Nevertheless, the obvious expectation is thatappliances’ manufacturers will pursue their own busi-ness interests and support this new paradigm of ap-pliance usage by embedding their products with thenecessary electronics.
In this early implementation, we played the role ofnetworked intelligence substitute by featuring a fewrecipes by ourselves. This gave us the opportunityto appreciate the degrees of freedom of this operationand the optimality criteria we may pursue as a coun-terpart. Namely we jointly considered the followinggoals: 1) washing efficacy, 2) energy consumption, 3)water consumption and 4) environmental pollution.
5 CONCLUSIONS
While the project is still at an initial stage, we havecome to see the high value it offers in terms bothof user convenience and of environmental advantage.For instance, questions re the benefit and ecological
Figure 11: A calibration curve.
profitability of using a bio soap product or reducingthe amount of wash water become theoretical opin-ions no longer. They may be experimented by thesingle user and many similar users as well within theeahouker social network, so that these questions mayfind a concretely scientific answer.
Though the concrete operations necessary for re-alizing the mockup delineate a scenario where eachsingle user may implement her/his SandS terminal onhome appliances with some technical help, the mainway to implement our paradigm passes through a bothmoral and economical suasion to convince the manu-facturers that social appliances are more efficient andrewarding. To achieve this goal SandS project will re-alize the above discussed architecture in order to setup an initial social network of eahoukers where thebenefits of the paradigm will be tossed in concrete bya thousand members. These benefits and the membersenjoying them will be the authentic promoters of theSandS ecosystem, again all on the spirit of exploitingactual facts besides sentences.
REFERENCES
Apolloni, B., Fiasch, M., Galliani, G., Zizzo, C., Caridakis,G., Siolas, G., Kollias, S. D., Romay, M. G., Barri-ento, F., and Jose, S. S. (2013). Social things - thesands instantiation. In WOWMOM, pages 1–6. IEEE.
Grana, M., Apolloni, B., Fiasche, M., Galliani, G., Zizzo,C., Caridakis, G., and et al. (2013). Social andsmart: towards an instance of subconscious social in-telligence. In 1st Workshop on Innovative EuropeanPolicies and Applied Measures for Developing SmartCities, 14th EANN.
Grana, M., Nunez-Gonzalez, J. D., and Apolloni, B. (2013).A discussion on trust requirements for a social net-work of eahoukers. In HAIS, pages 540–547.
Haykin, S. (1994). Neural Networks: A Comprehensive
A�Domotic�Ecosystem�Driven�by�a�Networked�Intelligence
365

Foundation. Prentice Hall PTR, Upper Saddle River,NJ, USA, 1st edition.
Ku, C.-C. and Lee, K. Y. (1995). Diagonal recurrent neuralnetworks for dynamic systems control. IEEE Trans.Neural Netw. Learning Syst., 6(1):144–156.
MQTTstandard. http://mqtt.org/.Rosenblatt, F. (1958). The perceptron: A probabilistic
model for information storage and organization in thebrain. Psychological Review, 65(6):386–408.
Sutton, R. S. and Barto, A. G. (1998). Introduction to Re-inforcement Learning. MIT Press, Cambridge, MA,USA, 1st edition.
Wiener, N. (1948). Cybernetics, Or Control and Commu-nication in the Animal and the Machine. Wiley, NewYork.
WEBIST�2014�-�International�Conference�on�Web�Information�Systems�and�Technologies
366

SPECIAL SESSION ON BUSINESS APPS


FULL PAPERS

Towards Process-driven Mobile Data Collection ApplicationsRequirements, Challenges, Lessons Learned
Johannes Schobel, Marc Schickler, Rudiger Pryss, Fabian Maier and Manfred ReichertInstitute of Databases and Information Systems,University of Ulm, James-Franck-Ring, Ulm, Germanyfjohannes.schobel, marc.schickler, ruediger.pryss, fabian.maier, [email protected]
Keywords: Process-aware Information System, Electronic Questionnaire, Mobile Business Application.
Abstract: In application domains like healthcare, psychology and e-learning, data collection is based on specificallytailored paper & pencil questionnaires. Usually, such a paper-based data collection is accomplished by amassive workload regarding the processing, analysis, and evaluation of the data collected. To relieve domainexperts from these manual tasks and to increase the efficiency of the data collection process, we developed ageneric approach for realizing process-driven smart mobile device applications based on process managementtechnology. According to this approach, the logic of a questionnaire is described in terms of an explicitprocess model whose enactment is driven by a generic process engine. Our goal is to demonstrate that such aprocess-aware design of mobile business applications is useful with respect to mobile data collection. Hence,we developed a generic architecture comprising the main components of mobile data collection applications.Furthermore, we used these components for developing mobile electronic questionnaires for psychologicalstudies. The paper presents the challenges identified in this context and discusses the lessons learned. Overall,process management technology offers promising perspectives for developing mobile business applications ata high level of abstraction.
1 INTRODUCTION
Recently, smart mobile applications have been in-creasingly used in a business context. Examples in-clude simple applications (e.g., task management),but also sophisticated analytic business applications.In particular, smart mobile devices can be used for en-abling flexible mobile data collection as well (Prysset al., 2013). Thereby, data can be collected withsensors (e.g., pulse sensor), communicating with thesmart mobile device (Schobel et al., 2013), or withsmart form-based applications (Pryss et al., 2012).Examples of applications requiring such a mobile datacollection include clinical trials, psychological stud-ies, and quality management surveys.
Developing a mobile data collection applicationrequires specific knowledge on how to implementsmart mobile applications. Furthermore, it requiresdomain-specific knowledge, usually not available tothe programmers of these applications. Hence, toavoid a gap between business needs and IT solutions,continuous and costly communication between do-main and IT experts becomes necessary. To improvethis situation, a framework for rapidly developing andevolving mobile data collection applications is indis-
pensable. In particular, respective business applica-tions should be easy to maintain for non-computer(i.e., domain) experts as well. Our overall vision is toenable domain experts to develop mobile data collec-tion applications at a high level of abstraction. Specif-ically, this paper focuses on the process-driven de-sign, implementation, and enactment of mobile ques-tionnaire applications, which support domain expertswith their daily data collection tasks.
As application domain for demonstrating the ben-efits of our approach we choose psychological stud-ies. Here, domain experts mostly use paper-basedquestionnaires for collecting required data from sub-jects. However, such a paper-based data collectionshows several drawbacks, e.g., regarding the struc-ture and layout of a questionnaire (e.g., questions maystill be answered, even if they are no longer rele-vant or needed), or the later analysis of the answers(e.g., errors might occur when transferring the col-lected paper-based data to electronic worksheets).
To cope with these issues and to understand thesubtle differences between paper-based and electronicquestionnaires in a mobile context, first of all, weimplemented several questionnaire applications forsmart mobile devices and applied them in real and
371

sophisticated application settings (Liebrecht, 2012;Schindler, 2013). In particular, we were able todemonstrate that electronic questionnaires relieve do-main experts from costly manual tasks, like the trans-fer, transformation and analysis of the collected data.As a major drawback, the first applications we hadimplemented were hard-coded and required consid-erable communication with domain experts. As aconsequence, these applications were neither easy tomaintain nor extensible. However, in order to avoida gap between the domain-specific design of a ques-tionnaire and its technical implementation enacted onsmart mobile devices, an easy to handle, flexible andgeneric questionnaire system is indispensable.
From the insights we gained during the practi-cal use of the above mentioned mobile applicationsas well as from lessons learned when implementingother kinds of mobile applications (Robecke et al.,2011), we elicited the requirements for electronicquestionnaire applications that enable a flexible mo-bile data collection. In order to evaluate whether theuse of process management technology contributesto the satisfaction of these requirements, we mappedthe logic of a complex questionnaire from psychol-ogy to a process model, which was deployed to a pro-cess engine. It then served as basis for driving theexecution of questionnaire instances at realtime. Inparticular, this mapping allows us to overcome manyof the problems known from paper-based question-naires. In turn, the use of a process modeling compo-nent as well as a process execution engine in the givencontext, raised additional challenges, e.g., related tothe process-driven execution of electronic question-naires on and the mobile data collection with smartmobile devices. The implemented questionnaire runson a mobile device and communicates with a remoteprocess engine to enact psychological questionnaires.As a major lesson, we learned that process manage-ment technology may not only be applied in the con-text of business process automation, but also providesa promising approach for generating mobile data col-lection applications. In particular, a process-drivenapproach enables non-computer experts to developelectronic questionnaires for smart mobile devices aswell as to deploy them on respective devices in orderto collect data with them.
In detail, the contributions of this paper are as fol-lows:
� We discuss fundamental problems of paper-basedquestionnaires and present requirements regard-ing their transfer to smart mobile devices.
� We provide a mental model for mapping question-naires to process models. Further, we illustratethis mental model through a real-world applica-
tion scenario from the psychological domain.
� We present a generic architecture for applicationsrunning on smart mobile devices that can be usedto model, visualize and enact electronic question-naires. This approach relies on the provided men-tal model and uses process models to define andcontrol the flow logic of a questionnaire.
� We share fundamental insights we gathered dur-ing the process of implementing and evaluatingthe mobile data collection application.
The remainder of this paper is structured as fol-lows: Section 2 discusses issues related to paper-based questionnaires. Further, it elicitates the re-quirements that emerge when transferring a paper-based questionnaire to an electronic version runningon smart mobile devices. Section 3 describes themental model we suggest for meeting these require-ments. In Section 4, we present the basic architectureof our approach for developing mobile data collectionapplications. Section 5 provides a detailed discussion,while Section 6 presents related work. Finally, Sec-tion 7 concludes the paper with a summary and out-look.
2 CASE STUDY
In a case study with 10 domain experts, we analyzedmore than 15 paper-based questionnaires from dif-ferent domains, particularly questionnaires used inthe context of psychological studies. Our goal wasto understand the issues that emerge when transfer-ring paper-based questionnaires to smart mobile de-vices. Section 2.1 discusses fundamental issues re-lated to paper & pencil questionnaires. Then, Section2.2 elicitates fundamental requirements for their elec-tronic mobile support.
2.1 Paper-based Questionnaires
We analyzed 15 paper-based questionnaires from psy-chology and medicine. In this context, a variety ofissues emerged. First, in the considered domains, aquestionnaire must be valid. This means that it shouldhave already been applied in several studies, and sta-tistical evaluations have proven that the results ob-tained from the collected data are representive. Inaddition, the questions are usually presented in a neu-tral way in order to not affect or influence the subject(e.g., patient). Creating a valid instrument is one ofthe main goals when setting up a psychological ques-tionnaire. In particular, reproducible and conclusive
WEBIST�2014�-�International�Conference�on�Web�Information�Systems�and�Technologies
372
results must be guaranteed. Furthermore, a question-naire may be used in two different modes. In the in-terview mode, the subject is interviewed by a supervi-sor who also fills in the questionnaire; i.e., the super-visor controls which questions he is going to ask orskip. This mode usually requires a lot of experiencesince the interviewer must also deal with questionsthat might be critical for the subject. The other modewe consider is self-rating. In this mode, the question-naire is handed out to the subject who then answersthe respective questions herself; i.e., no supervision isprovided in this mode
Another challenging issue of paper-based ques-tionnaires concerns the analysis of the data collected.Gathered answers need to be transfered to electronicworksheets, which constitutes a time-consuming anderror-prone task. In particular, note that during theinterviews or the self-filling of a questionnaire, typo-graphical errors or wrong interpretations of given an-swers might occur. In general, both sources of error(i.e., errors occuring during the interviews and errorsoccuring during the transcription) decrease the qual-ity of the data collected, which further underlines theneed of an electronic support for flexible and mobiledata collection.
In numerous interviews we conducted with 10 do-main experts from psychology, additional issues haveemerged. Psychological studies are often performedin developing countries, e.g., surveying of child sol-diers in rural areas in Africa (Crombach et al., 2013;Liebrecht, 2012). Political restrictions regarding datacollection further require attention and influence theway in which interviews and assessments may beperformed by domain experts (i.e., psychologists).Since in many geographic regions the available in-frastructure is not well developed, data collected withpaper-based questionnaires is usually digitalized inthe home country of the scientists responsible for thestudy. Taking these issues into account, it is not sur-prising that psychological studies last from severalweeks up to several months. From a practical pointof view, this raises the problem of allocating enoughspace in luggage to transfer the paper-based question-naires safely to the home country of the respective re-searcher.
Apart from these logistic problems, we revealedissues related to the interview procedure itself. In par-ticular, it has turned out that questionnaires must oftenbe adapted to a particular application context (e.g.,changing the language of a questionnaire or adding/ deleting selected questions). Such adaptations (byauthorized domain experts) must be propagated to allother interviewers and smart mobile devices respec-tively in order to keep the results valid and compara-
ble.Considering these issues, we had additional dis-
cussions with domain experts from psychology,which revealed several requirements discussed in thenext section.
2.2 Requirements
In the following, we discuss basic requirements forthe mobile support of electronic questionnaires. Wederived these requirements in the context of case stud-ies, literature analyses, expert interviews, and hands-on experiences regarding the implementation of mo-bile data collection applications (Crombach et al.,2013; Ruf-Leuschner et al., 2013; Isele et al., 2013).Especially, when interviewing domain experts, fun-damental requirements could be elicitated. The sameapplies to the various paper & pencil questionnaireswe analyzed.
The major requirements are as follows:R1 (Mobility). The process of collecting data should
be highly flexible and usually requires extensiveinteractions. Data may have to be collected eventhough no PC is available at the place the ques-tionnaire should be filled in. For example, con-sider data collection at the bedside of a patient ina hospital or interviews conducted by psycholo-gists in a meeting room. PCs are often disturbingin such situations, particularly if the interviewer is“hiding” himself behind a screen. To enable flexi-ble data collection, the device needs to be portableinstead. Further, it should not distract the partic-ipating actors in communicating and interactingwith each other.
R2 (Multi-User Support). Since different users mayinteract with a mobile questionnaire, multi-usersupport is crucial. In addition, it must be pos-sible to distinguish between different user roles(e.g., interviewers and subjects) involved in theprocessing of an electronic questionnaire. Finally,a particular user may possess different roles. Forexample, an actor could be interviewer in the con-text of a specific questionnaire, but subject in thecontext of another one.
R3 (Support of Different Questionnaire Modes).Generally, a questionnaire may be used in twodifferent modes: interview and self-rating mode(cf. Section 2.1). These two modes of question-ing diverge in the way the questions are posed,the possible answers that may be given, the or-der in which the questions are answered, and theadditional features provided (e.g., freetext notes).In general, mobile electronic questionnaire appli-cations should allow for both modes. Note, that
Towards�Process-driven�Mobile�Data�Collection�Applications�-�Requirements,�Challenges,�Lessons�Learned
373

this requirement is correlated with R2 as the con-sidered roles determine the modes available for aquestionnaire.
R4 (Multi-Language Support). The contents ofa questionnaire (e.g., questions and field labels)may have to be displayed in different languages(e.g., when conducting a psychological studyglobally in different countries). The actor access-ing the questionnaire should be allowed to chooseamong several languages.
R5 (Skeuomorphism and Paper-based Style). Tofoster the comprehensibility of an electronic ques-tionnaire and to ensure its validity, the lattershould be designed in the same style (i.e., sameorder and structure) as the corresponding paper-based version. For example, this means, that thestructuring of a questionnaire in different pagesmust be kept.
R6 (Native Application Style). Any mobile supportof electronic questionnaire application must con-sider different mobile operating systems (e.g., An-droid or iOS). In this context, standard control el-ements of the respective mobile operating systemshould be used to ensure familiarity of users withthe elements of the questionnaire when runningthe latter on their preferred smart mobile device.
R7 (Self-Explaning User Interface). The user in-terface should be easy to understand and provideintuitive interaction facilities. Furthermore, usersshould be guided through the process of collectingdata with their smart mobile devices.
R8 (Maintainability). Questionnaires evolve overtime and hence may have to be changed occasion-ally. Therefore, it should be possible to quicklyand easily change the structure and content of anelectronic questionnaire; e.g., to add a question,to edit the text of a question, to delete a question,or to change the order of questions. In particular,no programming skills should be required in thiscontext; i.e., domain experts (e.g., psychologists)should be able to introduce respective changes ata high level of abstraction.
Especially, requirement R8 constitutes a majorchallenge, which necessitates a high level of abstrac-tion when defining and changing electronic question-naires, which may then be enacted on a variety ofsmart mobile devices. To cope with this challenge,we designed a specific mental model for electronicquestionnaires, which will be presented in Section 3.
3 MENTAL MODEL
To transfer paper-based questionnaires into electronicones and to meet the requirements discussed, we de-signed a mental model for the support of mobile elec-tronic questionnaires (cf. Figure 1). According to thismodel, the logic of a paper-based questionnaire is de-scribed in terms of a process model, which is thendeployed to a process management system. The latterallows creating and executing process (i.e., question-naire) instances.
Generally, a process model serves as templatefor specifying and automating well defined processesbased on process management technology. In addi-tion, adaptive process management systems allow fordynamic process changes of instances to handle un-planned exceptional situations as well (Reichert andWeber, 2012). In the following, we show that process-awareness is useful for realizing applications otherthan business process automation as well. Applyingthe process paradigm and process management tech-nology in the context of mobile data collection, how-ever, raises additional challenges (cf. Section 5). Wewill show how to realize a process-aware approachthat guides users in filling in electronic questionnairesbased on process management technology.
3.1 Process Model and Instances
As opposed to traditional information systems,process-aware information systems (PAIS) separateprocess logic from application code. This is accom-plished based on process models, which provide theschemes for executing the respective processes (We-ber et al., 2011). In addition, a process model al-lows for a visual (i.e., graph-based) representation ofthe corresponding process, comprising activities (i.e.,process steps) as well as the relations (i.e., control anddata flow) between them. For control flow model-ing, both control edges and gateways (e.g., ANDsplit,XORsplit) are provided.
A process model P is represented as a directed,structured graph, which consists of a set of nodesN (of different types NT ) and directed edges E (ofdifferent types ET ) between them. We assume thata process model has exactly one start node (NT =StartFlow) and one end node (NT = EndFlow). Fur-ther, a process model must be connected; i.e., eachnode n can be reached from the start node. In turn,from any node n of a process model, the end node canbe reached. In this paper, we solely consider block-structured process models. Each branching (e.g. par-allel or alternative branching) has exactly one en-try and one exit node. Further, such blocks may be
WEBIST�2014�-�International�Conference�on�Web�Information�Systems�and�Technologies
374

Figure 1: Mental model.
nested, but are not allowed to overlap (Reichert andDadam, 2009). In turn, data elements D correspond toglobal variables, which are connected with activitiesthrough data flow edges (ET DataFlow). These dataelements can either be read (ReadAccess) or written(WriteAccess) by an activity (Reichert and Dadam,1998) from the process model. Figure 3 shows an ex-ample of such a process model.
In turn, a process instance I represents a concretecase that is executed based on a process model P. Ingeneral, multiple instances of a process model maybe created and then concurrently executed. Thereby,the state of an instance is defined by the marking ofits nodes and edges as well as the values of its dataelements. Altogether, respective information corre-sponds to the execution history of an instance. Theprocess engine has a set of execution rules which de-scribe the conditions under which a node may be ac-tivated (Reichert and Dadam, 1998). If its end node isreached, a process instance terminates. An exampleof how to map a questionnaire to a process model isprovided in Section 3.2.
3.2 Mapping a Questionnaire to aProcess Model
Our mental model enabling a process-driven enact-ment of questionnaires is as follows: We define boththe contents and the logic of a questionnaire in termsof a process model. Thereby, pages of the ques-tionnaire logically correspond to process activities,whereas the flow between these activities specifies thelogic of the questionnaire. The questions themselvesare mapped to process data elements, which are con-nected with the respective activity. There are separateelements containing the text of a question, which canbe read by the activity. Moreover, there are data el-ements that can be written by the activity. The latterare used to store the given answers for a specific ques-tion. Figure 2 gives an overview of the mapping of theelements of a questionnaire to the ones of a processmodel.
To illustrate the process-driven modeling of elec-tronic questionnaires, we present a scenario from psy-chology. Consider the process-centric questionnairemodel from Figure 3. Its process logic is described in
Figure 2: Mapping a Questionnaire Model to a ProcessModel.
terms of BPMN 2.0 (Business Process Model and No-tation) (Business Process Model, 2011). To establishthe link between process and questionnaire model, weannotated the depicted graph with additional labels.
The processing of the questionnaire starts with theexecution of activity Page Intro, which presents an in-troductory text for the participant interacting with theelectronic questionnaire. This introduction includes,for example, instructions on how to fill in the ques-tionnaire or how to interact with the smart mobile de-vice. After completing this first step, activity PageGeneral becomes enabled. In this form-based activ-ity, data elements Cigarettes, Drugs and Alcohol arewritten. More precisely, the values of these data ele-ments correspond to the answers given for the ques-tions displayed on the respective page of the ques-tionnaire. For example, the question correspondingto data element Cigarettes is as follows: “Do yousmoke?” (with the possible answers “yes / no”). Af-ter completing activity Page General, an AND gate-way (ANDsplit) becomes enabled. In turn, all outgo-ing paths of this ANDsplit (i.e., parallel split node)become enabled and are then executed concurrently.In the given application scenario, each of these pathscontains an XOR Gateway (XORsplit), which readsone of the aforementioned data elements to make achoice among its outgoing paths. For example, as-sume that in Page General the participant has an-
Towards�Process-driven�Mobile�Data�Collection�Applications�-�Requirements,�Challenges,�Lessons�Learned
375
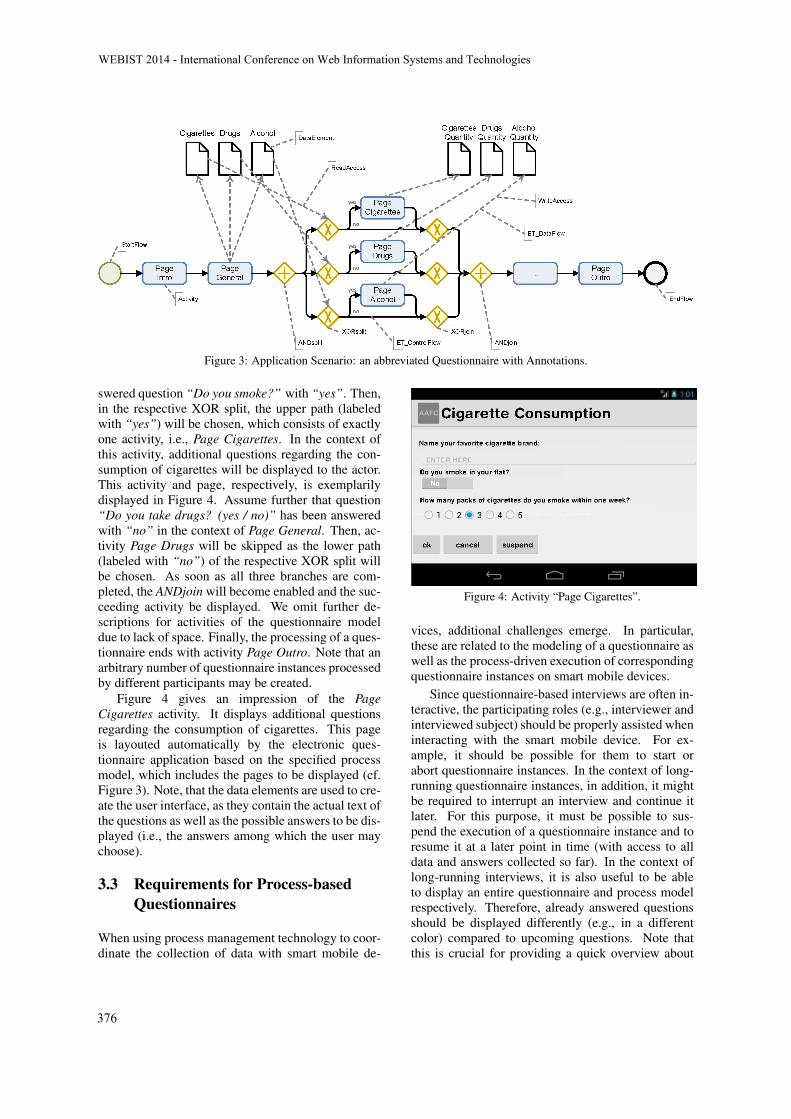
Figure 3: Application Scenario: an abbreviated Questionnaire with Annotations.
swered question “Do you smoke?” with “yes”. Then,in the respective XOR split, the upper path (labeledwith “yes”) will be chosen, which consists of exactlyone activity, i.e., Page Cigarettes. In the context ofthis activity, additional questions regarding the con-sumption of cigarettes will be displayed to the actor.This activity and page, respectively, is exemplarilydisplayed in Figure 4. Assume further that question“Do you take drugs? (yes / no)” has been answeredwith “no” in the context of Page General. Then, ac-tivity Page Drugs will be skipped as the lower path(labeled with “no”) of the respective XOR split willbe chosen. As soon as all three branches are com-pleted, the ANDjoin will become enabled and the suc-ceeding activity be displayed. We omit further de-scriptions for activities of the questionnaire modeldue to lack of space. Finally, the processing of a ques-tionnaire ends with activity Page Outro. Note that anarbitrary number of questionnaire instances processedby different participants may be created.
Figure 4 gives an impression of the PageCigarettes activity. It displays additional questionsregarding the consumption of cigarettes. This pageis layouted automatically by the electronic ques-tionnaire application based on the specified processmodel, which includes the pages to be displayed (cf.Figure 3). Note, that the data elements are used to cre-ate the user interface, as they contain the actual text ofthe questions as well as the possible answers to be dis-played (i.e., the answers among which the user maychoose).
3.3 Requirements for Process-basedQuestionnaires
When using process management technology to coor-dinate the collection of data with smart mobile de-
Figure 4: Activity “Page Cigarettes”.
vices, additional challenges emerge. In particular,these are related to the modeling of a questionnaire aswell as the process-driven execution of correspondingquestionnaire instances on smart mobile devices.
Since questionnaire-based interviews are often in-teractive, the participating roles (e.g., interviewer andinterviewed subject) should be properly assisted wheninteracting with the smart mobile device. For ex-ample, it should be possible for them to start orabort questionnaire instances. In the context of long-running questionnaire instances, in addition, it mightbe required to interrupt an interview and continue itlater. For this purpose, it must be possible to sus-pend the execution of a questionnaire instance and toresume it at a later point in time (with access to alldata and answers collected so far). In the context oflong-running interviews, it is also useful to be ableto display an entire questionnaire and process modelrespectively. Therefore, already answered questionsshould be displayed differently (e.g., in a differentcolor) compared to upcoming questions. Note thatthis is crucial for providing a quick overview about
WEBIST�2014�-�International�Conference�on�Web�Information�Systems�and�Technologies
376
Figure 5: Startable Activities for a Specific Actor.
the progress of an interview.Since domain experts might not be familiar with
existing process modeling notations like BPMN 2.0,an easy-to-understand, self-explaining, and domain-specific process notation is needed. In addition, theroles participating in a questionnaire should be pro-vided with specific views on the process model (i.e.,questionnaire), e.g., hiding information not requiredfor this role (Kolb and Reichert, 2013). For exam-ple, a subject may not be allowed to view subsequentquestions in order to ensure credibility of the givenanswers.
Regarding the execution of the activities of a ques-tionnaire (i.e., pages) additional challenges emerge.
The questions of a (psychological) questionnairemay have to be answered by different actors each ofthem possessing a specific role. For example, follow-up questions related to the subject involved in a psy-chological questionnaire might have to be answeredby a psychologist and not by the subject itself. Conse-quently, the electronic questionnaire application mustensure that only those questions are displayed to anactor intended for him or her. Figure 5 shows thestartable activities, currently available for a specificactor using the smart mobile device.
In many scenarios, the questions of an electronicquestionnaire may have to be displayed together withpossible answers. In order to avoid bad quality of thedata collected, actors should be further assisted wheninteracting with the smart mobile device; e.g., througherror messages, help texts, or on-the-fly validations ofentered data.
To foster the subsequent analysis of the data col-lected, the latter needs to be archived in a centralrepository. Furthermore, additional information (e.g.,the time it took the subject to answer a particularquestion) should be recorded in order to increasethe expressiveness of the data collected. Finally,
anonymization of this data might have to be ensuredas questionnaires often collect personal data and pri-vacy constitutes a crucial issue. In certain cases, itmight also become neccessary to dismiss the resultsof an already answered question.
Taking these general requirements into account,we designed an architecture for an electronic ques-tionnaire application.
4 ARCHITECTURE ANDIMPLEMENTATION
This section introduces the architecture we developedfor realizing mobile electronic questionnaires. In par-ticular, the latter run on smart mobile devices and in-teract with a remote process engine. This architectureis presented in Section 4.1. Since this paper focuseson the requirements, challenges and lessons learnedwhen applying state-of-the-art process managementtechnology to realize electronic questionnaires, wewill not describe the architecture of the process man-agement system (and its process engine) in detail; see(Dadam and Reichert, 2009; Reichert et al., 2009) forrespective work. The general architecture of our elec-tronic questionnaire application is depicted in Figure6.
4.1 Electronic QuestionnaireApplication
The electronic questionnaire application is dividedinto three main packages, which are related to the userinterface 1 , the communication 2 with the externalprocess engine, and useful tools for interacting withthe client 3 .
The user interface representing a particular pageof the questionnaire is represented by an ActivityTem-plate 4 , which provides basic methods for the ques-tionnaire (e.g., to start or stop an activity). In turn,the LoginView 5 is used to query the user creden-tial and to select an available role for this actor (e.g.,name = JohnDoe, role = Interviewer). Furthermore,the MainView 6 provides a list (e.g., worklist) withthe pages currently available for the user interactingwith the questionnaire. These list items are repre-sented using the ProcessAdapter 7 . Since the userinterface of a questionnaire is generated dynamicallydepending on the underlying process model deployedon the process engine at runtime, a user interface gen-erator is needed. This service is provided by the Ac-tivityView 8 . To interact with the device, differentclasses of the Input 9 elements used within a ques-
Towards�Process-driven�Mobile�Data�Collection�Applications�-�Requirements,�Challenges,�Lessons�Learned
377

Figure 6: Architecture of the questionnaire application.
tionnaire are provided. These classes provide the nec-essary logic to interact with the input elements aswell as the corresponding graphical representation ofthis element. As certain input elements are platform-specific (e.g., there is no spinning wheel for standarddesktop applications), missing input elements mightbe rendered differently, depending on the underlyingplatform (e.g., the spinning wheel on the iOS platformcould be rendered as a dropdown element on a normalcomputer).
The complete communication with the externalprocess engine should be handled by a Proxy 10 ser-vice. The latter is capable of generating the necessaryrequest messages, which are then converted to SOAPrequest messages by the Communication 11 serviceand sent to the process engine. The response mes-sages (e.g., the next page to display) sent by the pro-cess engine are then received by the Communicationand decomposed by the Proxy. Afterwards, the datawithin this message is visualized in the ActivityView,which includes the already mentioned user interfacegenerator as well.
4.2 Proof-of-Concept Prototype
To validate the feasibility of the described architec-ture as well as to be able to apply it in a real setting,we implemented a proof-of-concept prototype for theAndroid platform. We decided to use the latter, sinceit is easier to generate and handle SOAP (Curberaet al., 2002) calls within the application comparedto iOS. The prototype application was then used toverify the prescribed mental model (cf. Section 3),and to detail the requirements regarding the execu-tion of process-aware questionnaires. Furthermore,
Figure 7: Different question types and their visualizationwithin the questionnaire client application.
additional insights into the practical use of this elec-tronic questionnaire application by domain experts inthe context of their studies could be gathered. Wewere able to meet the requirements presented in Sec-tion 2.2 when implementing the questionnaire clientapplication, even though certain drawbacks still exist.To enable domain experts, who usually have no pro-gramming skills, to create a mobile electronic ques-tionnaire, we implemented a fully automated user in-terface generator for the mobile application itself. Inaddition, we were able to provide common types forquestions used within a questionnaire (e.g., likert-scale, free-text, or yes-no-switches). These types areautomatically mapped to appropriate input elementsvisualized within the application. Figure 7 gives animpression of the input elements implemented.
5 DISCUSSION
This section discusses our approach and reflects onthe experiences we gained when applying state-of-the-art process management technology to supportmobile data collection with electronic questionnaires.Since we applied an implemented questionnaire in apsychological study, we were also able to gain addi-
WEBIST�2014�-�International�Conference�on�Web�Information�Systems�and�Technologies
378

tional insights into practical issues.The presented approach has focused on the devel-
opment of smart mobile device applications enablingflexible data collection rather than on the design ofa development framework. Therefore, we have usedan existing process modeling editor for defining theprocess logic of electronic questionnaires. However,since the domain experts using our questionnaire ap-plication have been unfamiliar with the BPMN 2.0modeling notation, a number of training sessions wererequired to make them familiar with BPMN 2.0. Af-terwards, they were able to create their own question-naires. In particular, the abstraction introduced by theuse of process models for specifying the logic of ques-tionnaires was well understood by domain experts.However, the training sessions have shown that thereis a need for a more user-friendly, domain-specificmodeling notation, enabling domain experts to de-fine questionnaires on their own. In particular, such adomain-specific modeling language needs to be self-explaining and easy to use. Further, it should hidemodeling elements not required in the given use case.Note that BPMN 2.0 provides many elements notneeded for defining the logic of electronic question-naires. Consider, for example, the AND-gateways,which allow modeling the parallel execution. Regard-ing the use case of mobile data collection, it doesnot matter which path is going to be evaluated first.On the other hand, elements used for modeling thequestionnaire should have a meaningful and expres-sive representation. Thus, an activity should be rep-resented as page-symbol to add more context-awareinformation to the questionnaire model.
As we further learned in our case study, the cre-ation and maintenance of a questionnaire constitutesa highly interactive, flexible and iterative task. In gen-eral, the editing of already existing, but not yet pub-lished questionnaires, should be self-explaining. Ba-sic patterns dealing with the adaptation of the logic ofa questionnaire (e.g., moving a question to anotherposition or adding a new question) should be inte-grated in a modeling editor to provide tool-support forcreating and managing questionnaires.
As discussed in Section 3.3, we use process man-agement technology for modeling and enacting elec-tronic questionnaires. Accordingly the created ques-tionnaire model needs to be deployed on a processengine. Regarding the described client server archi-tecture (cf. Section 4.1), all process (i.e., question-naire) models are stored and executed on the serverrunning the process engine. Keeping in mind that mo-bile questionnaires might be also used in areas with-out stable internet connection, any approach requiringa permanent internet connection between the mobile
client and the process engine running on an externalserver will not be accepted. In order to cope with thisissue, a light-weight process engine is required, whichcan run on the smart mobile device. We have startedworking in this direction as well; e.g., see (Pryss et al.,2010a; Pryss et al., 2010b).
Since the user interface of the electronic question-naire is automatically generated based on the pro-vided process model, the possibilities to customizethe layout of a questionnaire are rather limited. Fromthe feedback we had obtained from domain experts,however, it became clear that an expressive layoutcomponent is needed that allows controlling the vi-sual appearance of a questionnaire running on smartmobile devices. Among others, different text styles(e.g., bold), spacing between input elements (e.g.,bottom spacing), and absolute positioning of elementsshould be supported. In addition, the need for inte-grating images has been expressed several times.
Since we use process-driven electronic question-naires for collecting data with smart mobile devices,the answers provided by the actors filling in the ques-tionnaire could be directly transferred to the server.This will relieve the actors from time-consumingmanual tasks. Furthermore, as there exists a pro-cess model describing the flow logic of the question-naire as well as comprehensive instance data (e.g., in-stance execution history), process mining techniquesfor analyzing questionnaire instances may be applied(van der Aalst et al., 2007). In addition, Business In-telligence Systems (Anandarajan et al., 2003) couldreveal further interesting aspects with respect to thedata collected in order to increase the expressivenessof the analysis. Such systems would allow for a fasterevaluation and relieve domain experts from manualtasks such as transferring the collected data into elec-tronic worksheets.
Finally, we have experienced a strong acceptanceamong all participating actors (e.g., interviewers, do-main experts, and subjects) regarding the practicalbenefits of electronic questionnaire applications onsmart mobile devices. Amongst others this wasreflected by a much higher willingness to fill outan electronic questionnaire compared to the respec-tive paper-based version (Ruf-Leuschner et al., 2013;Isele et al., 2013). Furthermore, a higher motivationto complete the questionnaire truthfully could be ob-served. Of course, this acceptance partly results fromthe modern and intuitive way to interact with smartmobile devices.
Towards�Process-driven�Mobile�Data�Collection�Applications�-�Requirements,�Challenges,�Lessons�Learned
379
6 RELATED WORK
There exists a variety of questionnaire systems avail-able on the market. In general, these systems can beclassified into two groups: online services (Survey-Monkey, 2013) and standalone applications (ElectricPaper Evaluationssysteme, 2013). Due to the fact thata questionnaire might contain sensitive information(e.g., the mental status of a subject or personal de-tails), online surveys are often not appropriate for thistype of data collection applications. As another limi-tation of online systems, local authorities do often notallow third-party software systems to store the infor-mation of a subject. However, these applications alsomust deal with privacy issues. Standalone applica-tions usually offer possibilities to create a question-naire, but do not deal with the requirements discussedin this paper. Furthermore, they lack a flexible andmobile data collection. Usually, respective question-naires are displayed as web applications, which can-not be used when no internet connection is available.
To the best of our knowledge, the process-awareenactment of questionnaires on smart mobile deviceshas not been considered comprehensively by othergroups so far. In previous studies, we identifiedcrucial issues regarding the implementation of psy-chological questionnaires on smart mobile devices(Liebrecht, 2012; Schindler, 2013). In these stud-ies, we aimed at preserving the validity of psychologi-cal instruments, which is a crucial point when replac-ing paper-based questionnaires with electronic ones.Although the implemented applications have alreadyshown several advantages in respect to data collec-tion and analysis, they have not been fully suitablefor realizing psychological questionnaires in the largescale yet. In particular, maintenance efforts for do-main experts and other actors were considerably high.More precisely, changes of an implemented question-naire (or its structure) still had to be accomplished bycomputer scientists, since its implementation is hard-coded. Therefore aim at the integration of a process-aware information system to overcome this limitation.
Focusing on the complete lifecycle of paper-basedquestionnaires and supporting every phase with mo-bile technology has actually not been considered byother groups so far. However, there exists some workrelated to mobile data collection. In particular, mo-bile process management systems, as described in(Pryss et al., 2013; Wakholi et al., 2011; Kunze et al.,2007), could be used to realize electronic question-naires. However, this use case has not been consid-ered by respective mobile process engines so far.
The QuON platform (Paul et al., 2013) providesa web-based survey system, which provides a variety
of different input types for the questions used withina questionnaire. QuON does not use a model-basedrepresentation to specify a questionnaire as in our ap-proach. Another distinctive characteristic of QuON isthe webbased-only approach. Especially in psycho-logical field studies, the latter will result in problemsas the QuON platform does not use responsive web-design.
Movilitas (Movilitas, 2013) applies SAP SybaseUnwired Platform to enable mobile data collection forbusiness scenarios. The Sybase Unwired Platform isa highly adaptive implementation framework for mo-bile applications, which directly interacts with a back-end, providing all required business data. Further re-search is required to show, whether this approach canbe used to realize mobile electronic questionnaires indomains like psychology or health care as well.
Finally, (Kolb et al., 2012) present a set of pat-terns for for expressing user interface logic based onthe same notation as used for business process mod-eling. In particular, a transformation method is intro-duced, which applies these patterns to automaticallyderive user interfaces by establishing a bidirectionalmapping between process model and user interface.
7 SUMMARY & OUTLOOK
In this paper, limitations of paper-based question-naires for data collection were discussed. To dealwith these limitations, we derived characteristic re-quirements for electronic questionnaire applications.In order to meet these requirements, we suggested theuse of process management technology. According tothe mental model introduced, a questionnaire and itslogic can be described in terms of a process model at ahigher level of abstraction. To evaluate our approach,a sophisticated application scenario from the psycho-logical domain was considered. We have shown howa questionnaire can be mapped to a process model.
In the interviews we conducted with domain ex-perts as well as from other implemented businessapplications we elaborated general requirements forflexible mobile data collection on smart mobile de-vices. These cover major aspects such as the secureand encrypted communication. Note that the latteris crucial, especially in the medical and psychologi-cal domains, which both deal with sensitive informa-tion of the subjects involved. We further presentedan architecture enabling such mobile data collectionapplications based on a smart mobile device and aprocess engine. As another contribution, we demon-strated the feasibility of our proof-of-concept appli-cation. Several features as well as problems regard-
WEBIST�2014�-�International�Conference�on�Web�Information�Systems�and�Technologies
380
ing the implementation and communication with theserver component, hosting the process engine, havebeen highlighted. Finally, we discussed the benefitsof using process-aware questionnaire application formobile data collection.
In future work, we plan to extend our approachwith additional features. First, we will provide a mo-bile process engine running on the smart mobile de-vice itself. This will enable a process-driven enact-ment of questionnaire instances even if no permanentinternet connection is available. We consider this as afundamental feature for enabling flexible data collec-tion applications on smart mobile devices. However,this will be accompanied with other problems, suchas the proper synchronization among multiple devices(e.g., if changes were made to the model of the ques-tionnaire) in order to keep the devices at the samelevel of information. In addition, we want to concep-tualize a generic questionnaire system, which is ableto support the complete lifecycle of a questionnaire.To disseminate this system among domain experts be-ing unfamiliar and unaware of modeling process logicwith standard notations, in addition, an easy to under-stand, but still precise notation for defining process-aware questionnaires is needed. To further enhancedata analysis capabilities (e.g., further analysis of thegiven answers), we have started to integrate sensorsmeasuring vital signs in order to gather other informa-tion about subjects during interviews (Schobel et al.,2013). As a major benefit of the framework, we ex-pect higher data quality, shorter evaluation cycles anda significant decrease in workload. In particular, it en-ables a high level of abstraction in defining electronicquestionnaires that may run on smart mobile devices.
ACKNOWLEDGEMENT
Supported by funds from the program Research initia-tives, intrastructure, network and transfer plattformsin the framework of the DFG Excellence Initiative -Third Funding Line.
REFERENCES
Anandarajan, M., Anandarajan, A., and Srinivasan, C. A.(2003). Business intelligence techniques: a perspec-tive from accounting and finance. Springer.
Business Process Model (2011). Business Process Modeland Notation (BPMN) Version 2.0. OMG Specifica-tion, Object Management Group.
Crombach, A., Nandi, C., Bambonye, M., Liebrecht, M.,Pryss, R., Reichert, M., Elbert, T., and Weierstall, R.
(2013). Screening for mental disorders in post-conflictregions using computer apps - a feasibility study fromburundi. In XIII Congress of European Society ofTraumatic Stress Studies (ESTSS) Conference.
Curbera, F., Duftler, M., Khalaf, R., Nagy, W., Mukhi, N.,and Weerawarana, S. (2002). Unraveling the Webservices web: an introduction to SOAP, WSDL, andUDDI. IEEE, Internet Computing, 6(2):86–93.
Dadam, P. and Reichert, M. (2009). The ADEPT Project: ADecade of Research and Development for Robust andFlexible Process Support - Challenges and Achieve-ments. Computer Science - Research and Develop-ment, 23(2):81–97.
Electric Paper Evaluationssysteme (2013). EvaSys.http://www.evasys.de/. last visited: 05. November2013.
Isele, D., Ruf-Leuschner, M., Pryss, R., Schauer, M., Re-ichert, M., Schobel, J., Schindler, A., and Elbert, T.(2013). Detecting adverse childhood experiences witha little help from tablet computers. In XIII Congress ofEuropean Society of Traumatic Stress Studies (ESTSS)Conference.
Kolb, J., Hubner, P., and Reichert, M. (2012). Automati-cally Generating and Updating User Interface Compo-nents in Process-Aware Information Systems. In 20thInt’l Conference on Cooperative Information Systems,number 7565 in LNCS, pages 444–454. Springer.
Kolb, J. and Reichert, M. (2013). A flexible approach forabstracting and personalizing large business processmodels. Applied Computing Review, 13(1):6–17.
Kunze, C. P., Zaplata, S., and Lamersdorf, W. (2007). Mo-bile processes: Enhancing cooperation in distributedmobile environments. Journal of Computers, 2(1):1–11.
Liebrecht, M. (2012). Technische Konzeption und Re-alisierung einer mobilen Anwendung fur den Kon-stanzer Index zur Erhebung von psychosozialen Be-lastungen wahrend der Schwangerschaft. DiplomaThesis, University of Ulm.
Movilitas (2013). Movilitas Consulting AG.http://www.movilitas.com/. last visited: 04. Novem-ber 2013.
Paul, D., Wallis, M., Henskens, F., and Nolan, K. (2013).QuON: A Generic Platform for the Collation andSharing of Web Survey Data. International Confer-ence on Web Information Systems and Technologies.
Pryss, R., Langer, D., Reichert, M., and Hallerbach, A.(2012). Mobile Task Management for Medical WardRounds - The MEDo Approach. In 1st Int’l Workshopon Adaptive Case Management (ACM’12), BPM’12Workshops, number 132 in LNBIP, pages 43–54.Springer.
Pryss, R., Musiol, S., and Reichert, M. (2013). Collabo-ration Support Through Mobile Processes and Entail-ment Constraints. In 9th IEEE Int’l Conference onCollaborative Computing: Networking, Applicationsand Worksharing. IEEE Computer Society Press.
Pryss, R., Tiedeken, J., Kreher, U., and Reichert, M.(2010a). Towards flexible process support on mobile
Towards�Process-driven�Mobile�Data�Collection�Applications�-�Requirements,�Challenges,�Lessons�Learned
381

devices. In Proc CAiSE’10 Forum - Information Sys-tems Evolution, number 72 in LNBIP, pages 150–165.Springer.
Pryss, R., Tiedeken, J., and Reichert, M. (2010b). Man-aging Processes on Mobile Devices: The MARPLEApproach. In CAiSE’10 Demos.
Reichert, M. and Dadam, P. (1998). ADEPTflex-SupportingDynamic Changes of Workflows Without Losing Con-trol. Journal of Intelligent Information Systems,Special Issue on Workflow Management Systems,10(2):93–129.
Reichert, M. and Dadam, P. (2009). Enabling AdaptiveProcess-aware Information Systems with ADEPT2. InCardoso, J. and van der Aalst, W., editors, Handbookof Research on Business Process Modeling, pages173–203. Information Science Reference, Hershey,New York.
Reichert, M., Dadam, P., Rinderle-Ma, S., Jurisch, M., Kre-her, U., and Goeser, K. (2009). Architecural Princi-ples and Components of Adaptive Process Manage-ment Technology. In PRIMIUM - Process Innova-tion for Enterprise Software, number P-151 in LectureNotes in Informatics (LNI), pages 81–97.
Reichert, M. and Weber, B. (2012). Enabling Flexibilityin Process-Aware Information Systems: Challenges,Methods, Technologies. Springer, Berlin-Heidelberg.
Robecke, A., Pryss, R., and Reichert, M. (2011).DBIScholar: An iPhone Application for PerformingCitation Analyses. In CAiSE Forum-2011, volumeVol-73 of Proc CAiSE’11 Forum. CEUR WorkshopProceedings.
Ruf-Leuschner, M., Pryss, R., Liebrecht, M., Schobel, J.,Spyridou, A., Reichert, M., and Schauer, M. (2013).Preventing further trauma: KINDEX mum screen -assessing and reacting towards psychosocial risk fac-tors in pregnant women with the help of smartphonetechnologies. In XIII Congress of European Society ofTraumatic Stress Studies (ESTSS) Conference.
Schindler, A. (2013). Technische Konzeption und Real-isierung des MACE-Tests mittels mobiler Technolo-gie. Bachelor Thesis, University of Ulm.
Schobel, J., Schickler, M., Pryss, R., Nienhaus, H., andReichert, M. (2013). Using Vital Sensors in MobileHealthcare Business Applications: Challenges, Ex-amples, Lessons Learned. In 9th Int’l Conference onWeb Information Systems and Technologies (WEBIST2013), Special Session on Business Apps, pages 509–518.
SurveyMonkey (2013). SurveyMonkey: Free on-line survey software & questionnaire tool.http://www.surveymonkey.com/. last visited: 14.May 2013.
van der Aalst, W. M., Reijers, H. A., Weijters, A. J., vanDongen, B. F., Alves de Medeiros, A., Song, M., andVerbeek, H. (2007). Business process mining: An in-dustrial application. Information Systems, 32(5):713–732.
Wakholi, P., Chen, W., and Klungsøyr, J. (2011). Work-flow support for mobile data collection. In Enterprise,Business-Process and Information Systems Modeling,pages 299–313. Springer.
Weber, B., Reichert, M., Mendling, J., and Reijers, H.(2011). Refactoring large process model repositories.Computers in Industry, 62(5):467–486.
WEBIST�2014�-�International�Conference�on�Web�Information�Systems�and�Technologies
382

Location-based Mobile Augmented Reality ApplicationsChallenges, Examples, Lessons Learned
Philip Geiger, Marc Schickler, Rudiger Pryss, Johannes Schobel and Manfred ReichertInstitute of Databases and Information Systems, University of Ulm, James-Franck-Ring, Ulm, Germanyfphilip.geiger, marc.schickler, ruediger.pryss, johannes.schobel, [email protected]
Keywords: Smart Mobile Applications, Location-based Mobile Augmented Reality.
Abstract: The technical capabilities of modern smart mobile devices more and more enable us to run desktop-like appli-cations with demanding resource requirements in mobile environments. Along this trend, numerous concepts,techniques, and prototypes have been introduced, focusing on basic implementation issues of mobile applica-tions. However, only little work exists that deals with the design and implementation (i.e., the engineering) ofadvanced smart mobile applications and reports on the lessons learned in this context. In this paper, we giveprofound insights into the design and implementation of such an advanced mobile application, which enableslocation-based mobile augmented reality on two different mobile operating systems (i.e., iOS and Android).In particular, this kind of mobile application is characterized by high resource demands since various sensorsmust be queried at run time and numerous virtual objects may have to be drawn in realtime on the screen ofthe smart mobile device (i.e., a high frame count per second be caused). We focus on the efficient implemen-tation of a robust mobile augmented reality engine, which provides location-based functionality, as well as theimplementation of mobile business applications based on this engine. In the latter context, we also discuss thelessons learned when implementing mobile business applications with our mobile augmented reality engine.
1 INTRODUCTION
Daily business routines increasingly require access toinformation systems in a mobile manner, while re-quiring a desktop-like feeling of mobile applicationsat the same time. However, the design and implemen-tation of mobile business applications constitutes achallenging task (Robecke et al., 2011). On one hand,developers must cope with limited physical resourcesof smart mobile devices (e.g., limited battery capac-ity or limited screen size) as well as non-predictableuser behaviour (e.g., mindless instant shutdowns). Onthe other, mobile devices provide advanced technicalcapabilities, including motion sensors, a GPS sensor,and a powerful camera system. Hence, new typesof business applications can be designed and imple-mented in the large scale. Integrating sensors andutilizing the data recorded by them, however, is anon-trivial task when considering requirements likerobustness and scalability as well. Moreover, mobilebusiness applications have to be developed for differ-ent mobile operating systems (e.g., iOS and Android)in order to allow for their widespread use. Hence,developers of mobile business applications must alsocope with the heterogeneity of existing mobile oper-ating systems, while at the same time utilizing their
technical capabilities. In particular, if mobile applica-tion users shall be provided with the same function-ality in the context of different mobile operating sys-tems, new challenges may emerge when consideringscalability and robustness. This paper deals with thedevelopment of a generic mobile application, whichenables location-based mobile augmented reality forrealizing advanced business applications. We discussthe core challenges emerging in this context and re-port on the lessons learned when applying it to imple-ment real-world mobile business applications. Exist-ing related work has been dealing with location-basedmobile augmented reality as well (Frohlich et al.,2006; Carmigniani et al., 2011; Paucher and Turk,2010; Reitmayr and Schmalstieg, 2003). To the bestof our knowledge, they do not focus on aspects re-garding the efficient integration of location-based mo-bile augmented reality with real-world mobile busi-ness applications.
1.1 Problem Statement
The overall purpose of this work is to show how to de-velop the core of a location-based mobile augmentedreality engine for the mobile operating systems iOS5.1 (or higher) and Android 4.0 (or higher). We de-
383
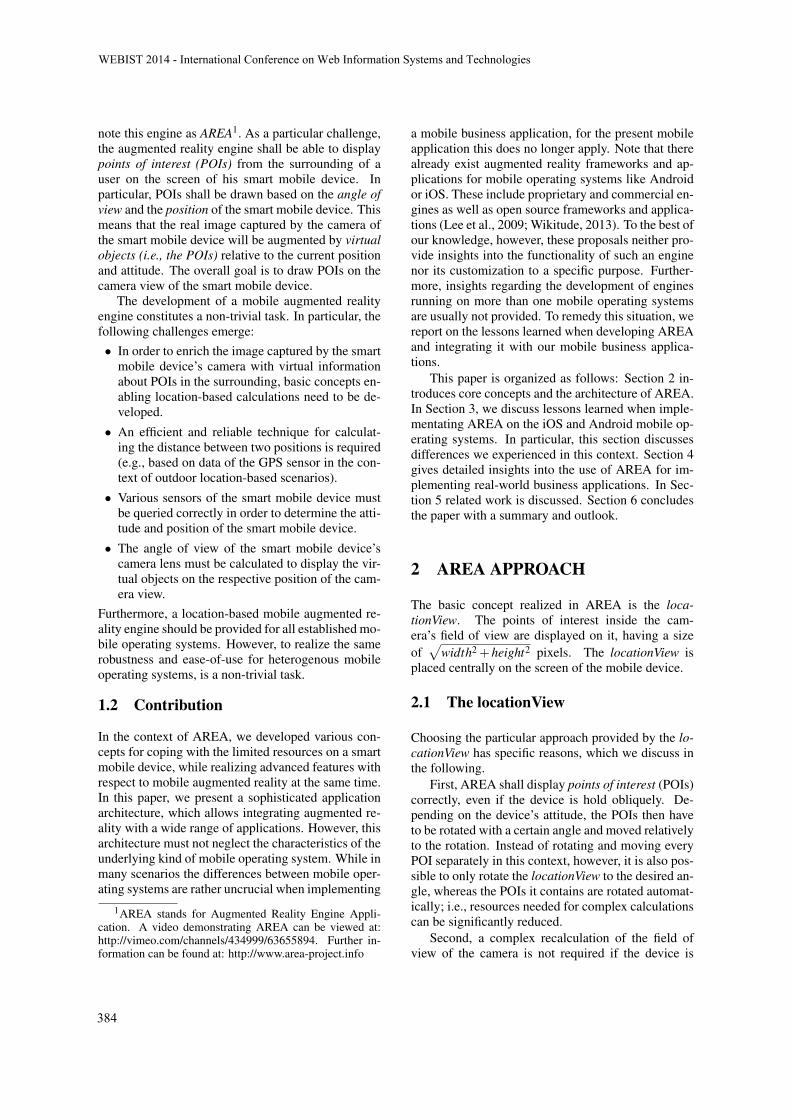
note this engine as AREA1. As a particular challenge,the augmented reality engine shall be able to displaypoints of interest (POIs) from the surrounding of auser on the screen of his smart mobile device. Inparticular, POIs shall be drawn based on the angle ofview and the position of the smart mobile device. Thismeans that the real image captured by the camera ofthe smart mobile device will be augmented by virtualobjects (i.e., the POIs) relative to the current positionand attitude. The overall goal is to draw POIs on thecamera view of the smart mobile device.
The development of a mobile augmented realityengine constitutes a non-trivial task. In particular, thefollowing challenges emerge:� In order to enrich the image captured by the smart
mobile device’s camera with virtual informationabout POIs in the surrounding, basic concepts en-abling location-based calculations need to be de-veloped.
� An efficient and reliable technique for calculat-ing the distance between two positions is required(e.g., based on data of the GPS sensor in the con-text of outdoor location-based scenarios).
� Various sensors of the smart mobile device mustbe queried correctly in order to determine the atti-tude and position of the smart mobile device.
� The angle of view of the smart mobile device’scamera lens must be calculated to display the vir-tual objects on the respective position of the cam-era view.
Furthermore, a location-based mobile augmented re-ality engine should be provided for all established mo-bile operating systems. However, to realize the samerobustness and ease-of-use for heterogenous mobileoperating systems, is a non-trivial task.
1.2 Contribution
In the context of AREA, we developed various con-cepts for coping with the limited resources on a smartmobile device, while realizing advanced features withrespect to mobile augmented reality at the same time.In this paper, we present a sophisticated applicationarchitecture, which allows integrating augmented re-ality with a wide range of applications. However, thisarchitecture must not neglect the characteristics of theunderlying kind of mobile operating system. While inmany scenarios the differences between mobile oper-ating systems are rather uncrucial when implementing
1AREA stands for Augmented Reality Engine Appli-cation. A video demonstrating AREA can be viewed at:http://vimeo.com/channels/434999/63655894. Further in-formation can be found at: http://www.area-project.info
a mobile business application, for the present mobileapplication this does no longer apply. Note that therealready exist augmented reality frameworks and ap-plications for mobile operating systems like Androidor iOS. These include proprietary and commercial en-gines as well as open source frameworks and applica-tions (Lee et al., 2009; Wikitude, 2013). To the best ofour knowledge, however, these proposals neither pro-vide insights into the functionality of such an enginenor its customization to a specific purpose. Further-more, insights regarding the development of enginesrunning on more than one mobile operating systemsare usually not provided. To remedy this situation, wereport on the lessons learned when developing AREAand integrating it with our mobile business applica-tions.
This paper is organized as follows: Section 2 in-troduces core concepts and the architecture of AREA.In Section 3, we discuss lessons learned when imple-mentating AREA on the iOS and Android mobile op-erating systems. In particular, this section discussesdifferences we experienced in this context. Section 4gives detailed insights into the use of AREA for im-plementing real-world business applications. In Sec-tion 5 related work is discussed. Section 6 concludesthe paper with a summary and outlook.
2 AREA APPROACH
The basic concept realized in AREA is the loca-tionView. The points of interest inside the cam-era’s field of view are displayed on it, having a sizeof
pwidth2 +height2 pixels. The locationView is
placed centrally on the screen of the mobile device.
2.1 The locationView
Choosing the particular approach provided by the lo-cationView has specific reasons, which we discuss inthe following.
First, AREA shall display points of interest (POIs)correctly, even if the device is hold obliquely. De-pending on the device’s attitude, the POIs then haveto be rotated with a certain angle and moved relativelyto the rotation. Instead of rotating and moving everyPOI separately in this context, however, it is also pos-sible to only rotate the locationView to the desired an-gle, whereas the POIs it contains are rotated automat-ically; i.e., resources needed for complex calculationscan be significantly reduced.
Second, a complex recalculation of the field ofview of the camera is not required if the device is
WEBIST�2014�-�International�Conference�on�Web�Information�Systems�and�Technologies
384
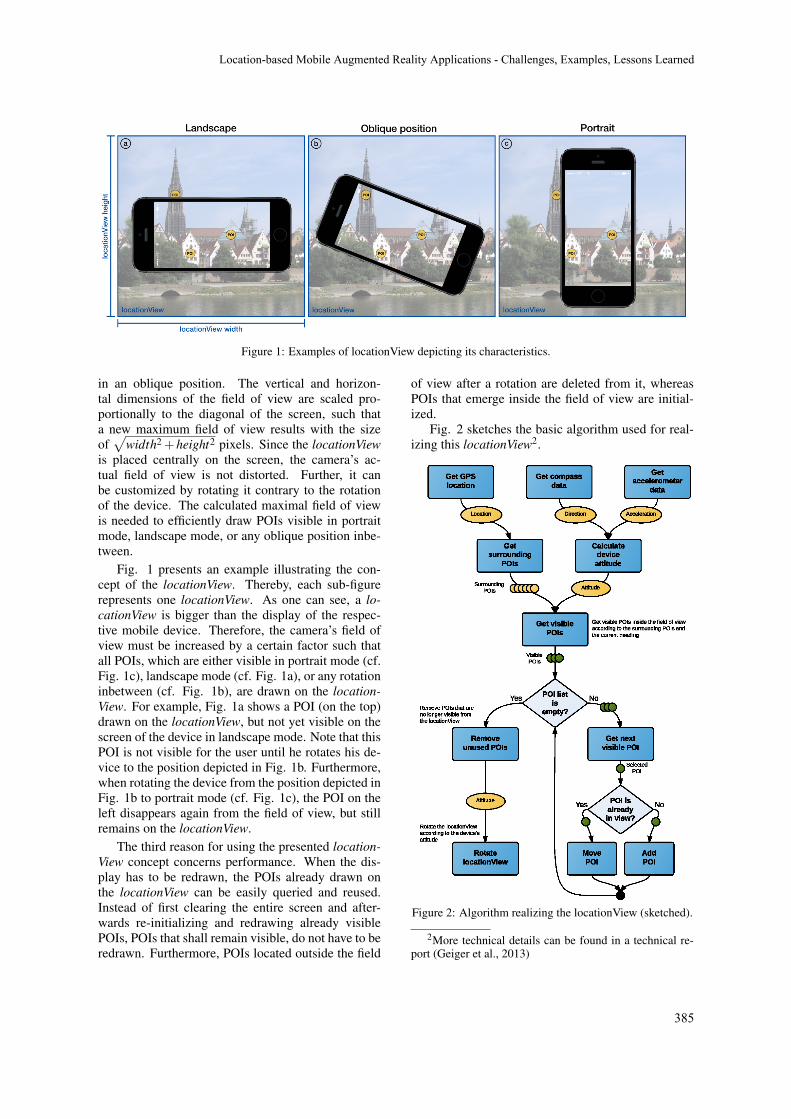
Figure 1: Examples of locationView depicting its characteristics.
in an oblique position. The vertical and horizon-tal dimensions of the field of view are scaled pro-portionally to the diagonal of the screen, such thata new maximum field of view results with the sizeof
pwidth2 +height2 pixels. Since the locationView
is placed centrally on the screen, the camera’s ac-tual field of view is not distorted. Further, it canbe customized by rotating it contrary to the rotationof the device. The calculated maximal field of viewis needed to efficiently draw POIs visible in portraitmode, landscape mode, or any oblique position inbe-tween.
Fig. 1 presents an example illustrating the con-cept of the locationView. Thereby, each sub-figurerepresents one locationView. As one can see, a lo-cationView is bigger than the display of the respec-tive mobile device. Therefore, the camera’s field ofview must be increased by a certain factor such thatall POIs, which are either visible in portrait mode (cf.Fig. 1c), landscape mode (cf. Fig. 1a), or any rotationinbetween (cf. Fig. 1b), are drawn on the location-View. For example, Fig. 1a shows a POI (on the top)drawn on the locationView, but not yet visible on thescreen of the device in landscape mode. Note that thisPOI is not visible for the user until he rotates his de-vice to the position depicted in Fig. 1b. Furthermore,when rotating the device from the position depicted inFig. 1b to portrait mode (cf. Fig. 1c), the POI on theleft disappears again from the field of view, but stillremains on the locationView.
The third reason for using the presented location-View concept concerns performance. When the dis-play has to be redrawn, the POIs already drawn onthe locationView can be easily queried and reused.Instead of first clearing the entire screen and after-wards re-initializing and redrawing already visiblePOIs, POIs that shall remain visible, do not have to beredrawn. Furthermore, POIs located outside the field
of view after a rotation are deleted from it, whereasPOIs that emerge inside the field of view are initial-ized.
Fig. 2 sketches the basic algorithm used for real-izing this locationView2.
Figure 2: Algorithm realizing the locationView (sketched).
2More technical details can be found in a technical re-port (Geiger et al., 2013)
Location-based�Mobile�Augmented�Reality�Applications�-�Challenges,�Examples,�Lessons�Learned
385

2.2 Architecture
The AREA architecture has been designed with thegoal to be able to easily exchange and extend its com-ponents. The design comprises four main modulesorganized in a multi-tier architecture and complyingwith the Model View Controller pattern (cf. Fig. 3).Lower tiers offer their services and functions by inter-faces to upper tiers. In particular, the red tier (cf. Fig.3) will be described in detail in Section 3, when dis-cussing the differences regarding the development ofAREA on the iOS and Android platforms. Based onthis architectural design, modularity can be ensured;i.e., both data management and various elements (e.g.,the POIs) can be customized and extended on de-mand. Furthermore, the compact design of AREAenables us to build new mobile business applicationsbased on it as well as to easily integrate it with exist-ing applications.
The lowest tier, called Model, provides modulesand functions to exchange the POIs. In this context,we use both an XML- and a JSON-based interface tocollect and parse POIs. In turn, these POIs are thenstored in a global database. Note that we do not relyon the ARML schema (ARML, 2013), but use our ownXML schema. In particular, we will be able to ex-tend our XML-based format in the context of futureresearch on AREA. Finally, the JSON interface uses alight-weight, easy to understand, and extendable for-mat with which developers are familiar.
The next tier, called Controller, consists of twomain modules. The Sensor Controller is responsi-ble for culling the sensors necessary to determine thedevice’s location and orientation. The sensors to beculled include the GPS sensor, the accelerometer, andthe compass sensor. The GPS sensor is used to deter-mine the position of the device. Since we currently fo-cus on location-based outdoor scenarios, GPS coordi-nates are predominantly used. In future work, we ad-dress indoor scenarios as well. Note that the architec-ture of AREA has been designed to easily change theway coordinates will be obtained. Using the GPS co-ordinates and its corresponding altitude, we can cal-culate the distance between mobile device and POI,the horizontal bearing, and the vertical bearing. Thelatter is used to display a POI higher or lower on thescreen, depending on its own altitude. In turn, theaccelerometer provides data for determining the cur-rent rotation of the device, i.e., the orientation of thedevice (landscape, portrait, or any other orientationinbetween) (cf. Fig. 1). Since the accelerometer isused to determine the vertical viewing direction, weneed the compass data of the mobile device to deter-mine the horizontal viewing direction of the user as
well. Based on the vertical and horizontal viewing di-rections, we are able to calculate the direction of thefield of view as well as its boundaries according tothe camera angle of view of the device. The Point ofInterest Controller (cf. Fig. 3) uses data of the Sen-sor Controller in order to determine whether a POIis inside the vertical and horizontal field of view. Fur-thermore, for each POI it calculates its position on thescreen taking the current field of view and the cameraangle of view into account.
The uppermost tier, called View, consists of vari-ous user interface elements, e.g., the locationView, theCamera View, and the specific view of a POI (i.e., thePoint of Interest View). Thereby, the Camera Viewdisplays the data captured by the device’s camera.Right on top of the Camera View, the locationViewis placed. It displays POIs located inside the currentfield of view at their specific positions as calculatedby the Point of Interest Controller. To rotate the lo-cationView, the interface of the Sensor Controller isused. The latter allows to determining the orienta-tion of the device. Furthermore, a radar can be usedto indicate the direction in which invisible POIs arelocated (cf. Fig. 9 shows an example of the radar).Finally, AREA make use of libraries of the mobiledevelopment frameworks themselves, which provideaccess to core functionality of the underlying oper-ating system, e.g., sensor access and screen drawingfunctions (cf. Native Frameworks in Fig. 3).
3 EXPERIENCES WITHIMPLEMENTING AREA ONEXISTING MOBILEOPERATING SYSTEMS
The kind of business application we consider uti-lizes the various sensors of smart mobile devices, andhence provides new kinds of features compared to tra-ditional business applications. However, this signifi-cantly increases complexity for application develop-ers as well. This complexity further increases if themobile application shall be provided for different mo-bile operating systems.
Picking up the scenario of mobile augmented re-ality, this section gives insights into ways for effi-ciently handling the POIs, relevant for the location-View of our mobile augmented reality engine. In thiscontext, the implementation of the Sensor Controllerand the Point of Interest Controller are most interest-ing regarding the subtle differences one must considerwhen developing such an engine on different mobileoperating systems (i.e., iOS and Android).
WEBIST�2014�-�International�Conference�on�Web�Information�Systems�and�Technologies
386

Figure 3: Multi-tier architecture of AREA.
In order to reach a high efficiency when displayingor redrawing POIs on the screen, we choose a nativeimplementation of AREA on the iOS and Androidmobile operating systems. Thus, we can make useof provided built-in APIs of these operating systems,and can call native functions without any translationas required in frameworks like Phonegap (Systems,2013). Note that efficiency is very crucial for mo-bile business applications (Corral et al., 2012) sincesmart mobile devices rely on battery power. There-fore, to avoid high battery usage by expensive frame-work translations, only a native implementation is ap-propriate in our context. Apart from this, most cross-platform development frameworks do not provide aproper set of functions to work with sensors (Schobelet al., 2013). In the following, we present the imple-mentation of AREA on both the iOS and the Androidmobile operating systems.
3.1 iOS Mobile Operating System
The iOS version of AREA has been implemented us-ing the programming language Objective-C and iOS
Version 7.0 on Apple iPhone 4S. Furthermore, for de-veloping AREA, the Xcode environment (Version 5)has been used.
3.1.1 Sensor Controller
The Sensor Controller is responsible for culling thenecessary sensors in order to correctly position thePOIs on the screen of the smart mobile device. Toachieve this, iOS provides the CoreMotion and Core-Location frameworks. We use the CoreLocationframework to get notified about changes of the lo-cation as well as compass heading. Since we wantto be informed about every change of the compassheading, we adjusted the heading filter of the CoreLo-cation framework accordingly. When the frameworksends us new heading data, its data structure containsa real heading as well as a magnetic one as floats. Thereal heading complies to the geographic north pole,whereas the magnetic heading refers to the magneticnorth pole. Since our coordinates corresponds to GPScoordinates, we use the real heading data structure.Note that the values of the heading will become (very)inaccurate and oscillate when the device is moved. Tocope with this, we apply a lowpass filter (Kamenetsky,2013) to the heading in order to obtain smooth and ac-curate values, which can then be used to position thePOIs on the screen. Similar to the heading, we canadjust how often we want to be informed about loca-tion changes. On one hand, we want to get notifiedabout all relevant location changes; on the other, ev-ery change requires a recalculation of the surroundingPOIs. Thus, we deciced to get notified only if a dif-ference of at least 10 meters occurs between the oldand the new location. Note that this is generally ac-ceptable for the kind of applications we consider (cf.Section 4.1). Finally, the data structure representinga location contains GPS coordinates of the device indegrees north and degrees east as decimal values, thealtitude in meters, and a time stamp.
In turn, the CoreMotion framework provides in-terfaces to cull the accelerometer. The accelerometeris used to calculate the current rotation of the deviceas well as to determine in which direction the smartmobile device is pointing (e.g., in upwards or down-wards direction). As opposed to location and headingdata, accelerometer data is not automatically pushedby the iOS CoreMotion framework to the application.Therefore, we had to define an application loop thatis polling this data every 1
90 seconds. On one hand,this rate is fast enough to obtain smooth values; onthe other, it is low enough to save battery power. Asillustrated by Fig. 4, the data the accelerometer de-livers consists of three values, i.e., the accelerationsin x-, y-, and z-direction ((Apple, 2013)). Since grav-
Location-based�Mobile�Augmented�Reality�Applications�-�Challenges,�Examples,�Lessons�Learned
387
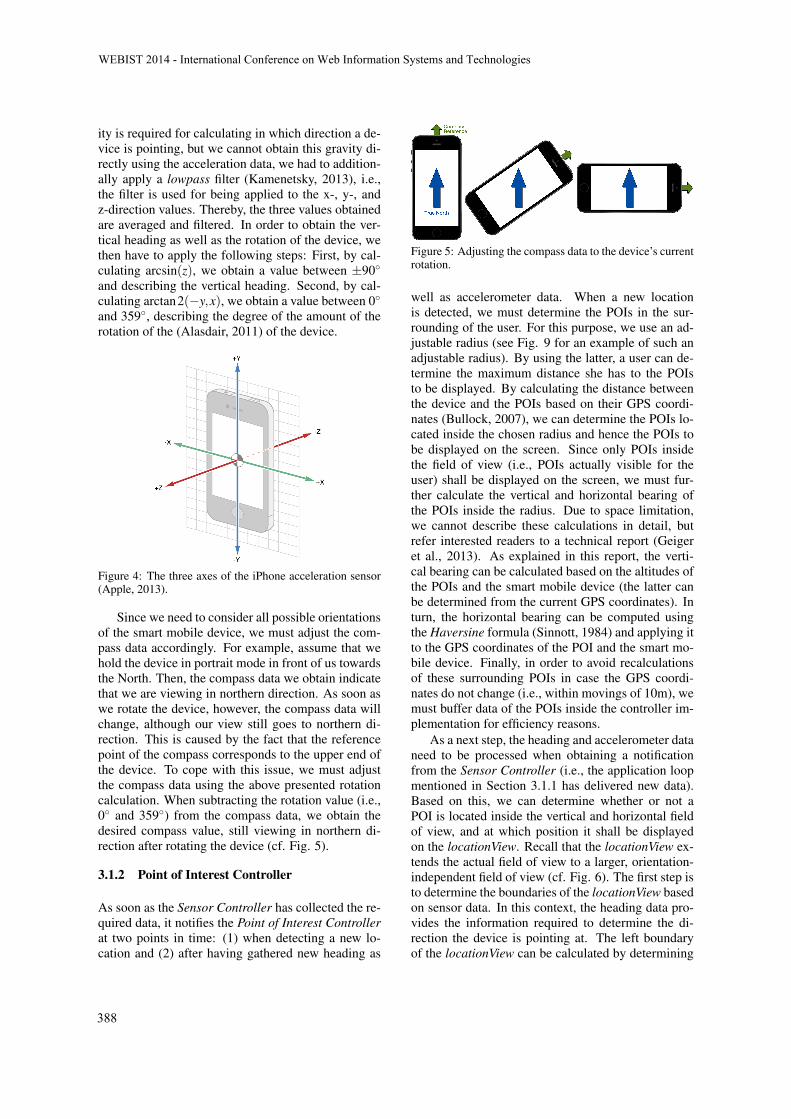
ity is required for calculating in which direction a de-vice is pointing, but we cannot obtain this gravity di-rectly using the acceleration data, we had to addition-ally apply a lowpass filter (Kamenetsky, 2013), i.e.,the filter is used for being applied to the x-, y-, andz-direction values. Thereby, the three values obtainedare averaged and filtered. In order to obtain the ver-tical heading as well as the rotation of the device, wethen have to apply the following steps: First, by cal-culating arcsin(z), we obtain a value between �90�
and describing the vertical heading. Second, by cal-culating arctan2(�y;x), we obtain a value between 0�
and 359�, describing the degree of the amount of therotation of the (Alasdair, 2011) of the device.
Figure 4: The three axes of the iPhone acceleration sensor(Apple, 2013).
Since we need to consider all possible orientationsof the smart mobile device, we must adjust the com-pass data accordingly. For example, assume that wehold the device in portrait mode in front of us towardsthe North. Then, the compass data we obtain indicatethat we are viewing in northern direction. As soon aswe rotate the device, however, the compass data willchange, although our view still goes to northern di-rection. This is caused by the fact that the referencepoint of the compass corresponds to the upper end ofthe device. To cope with this issue, we must adjustthe compass data using the above presented rotationcalculation. When subtracting the rotation value (i.e.,0� and 359�) from the compass data, we obtain thedesired compass value, still viewing in northern di-rection after rotating the device (cf. Fig. 5).
3.1.2 Point of Interest Controller
As soon as the Sensor Controller has collected the re-quired data, it notifies the Point of Interest Controllerat two points in time: (1) when detecting a new lo-cation and (2) after having gathered new heading as
Figure 5: Adjusting the compass data to the device’s currentrotation.
well as accelerometer data. When a new locationis detected, we must determine the POIs in the sur-rounding of the user. For this purpose, we use an ad-justable radius (see Fig. 9 for an example of such anadjustable radius). By using the latter, a user can de-termine the maximum distance she has to the POIsto be displayed. By calculating the distance betweenthe device and the POIs based on their GPS coordi-nates (Bullock, 2007), we can determine the POIs lo-cated inside the chosen radius and hence the POIs tobe displayed on the screen. Since only POIs insidethe field of view (i.e., POIs actually visible for theuser) shall be displayed on the screen, we must fur-ther calculate the vertical and horizontal bearing ofthe POIs inside the radius. Due to space limitation,we cannot describe these calculations in detail, butrefer interested readers to a technical report (Geigeret al., 2013). As explained in this report, the verti-cal bearing can be calculated based on the altitudes ofthe POIs and the smart mobile device (the latter canbe determined from the current GPS coordinates). Inturn, the horizontal bearing can be computed usingthe Haversine formula (Sinnott, 1984) and applying itto the GPS coordinates of the POI and the smart mo-bile device. Finally, in order to avoid recalculationsof these surrounding POIs in case the GPS coordi-nates do not change (i.e., within movings of 10m), wemust buffer data of the POIs inside the controller im-plementation for efficiency reasons.
As a next step, the heading and accelerometer dataneed to be processed when obtaining a notificationfrom the Sensor Controller (i.e., the application loopmentioned in Section 3.1.1 has delivered new data).Based on this, we can determine whether or not aPOI is located inside the vertical and horizontal fieldof view, and at which position it shall be displayedon the locationView. Recall that the locationView ex-tends the actual field of view to a larger, orientation-independent field of view (cf. Fig. 6). The first step isto determine the boundaries of the locationView basedon sensor data. In this context, the heading data pro-vides the information required to determine the di-rection the device is pointing at. The left boundaryof the locationView can be calculated by determining
WEBIST�2014�-�International�Conference�on�Web�Information�Systems�and�Technologies
388
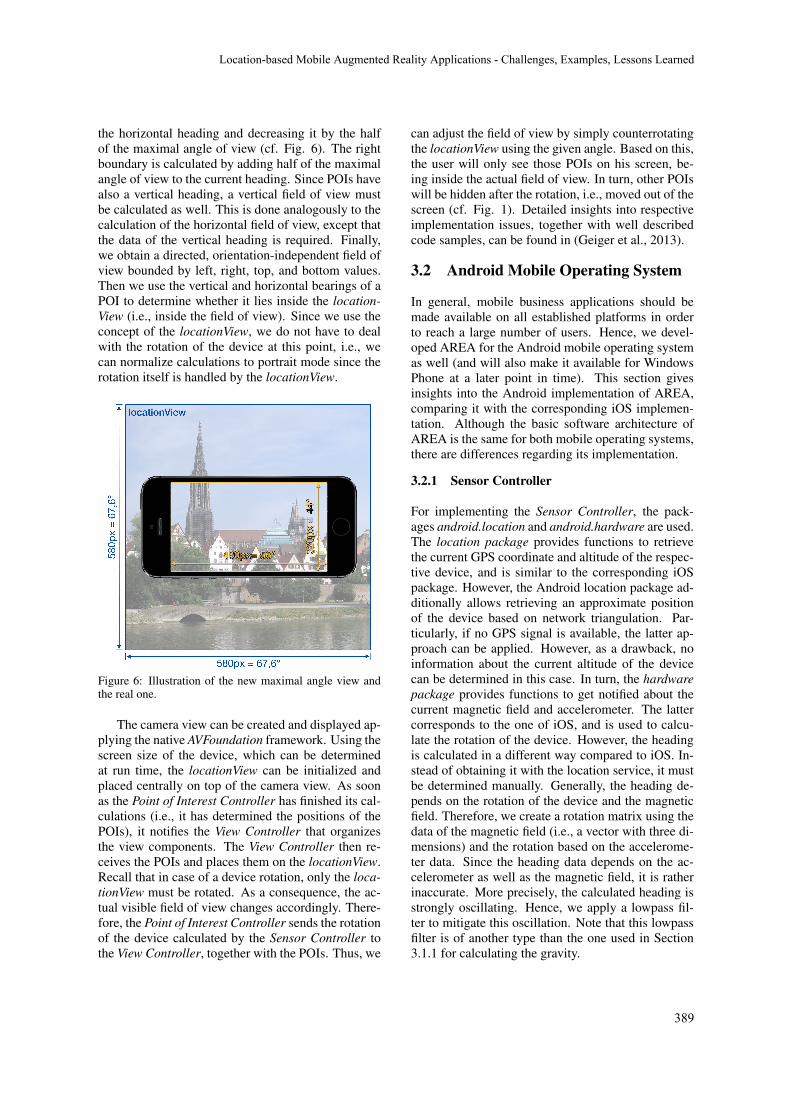
the horizontal heading and decreasing it by the halfof the maximal angle of view (cf. Fig. 6). The rightboundary is calculated by adding half of the maximalangle of view to the current heading. Since POIs havealso a vertical heading, a vertical field of view mustbe calculated as well. This is done analogously to thecalculation of the horizontal field of view, except thatthe data of the vertical heading is required. Finally,we obtain a directed, orientation-independent field ofview bounded by left, right, top, and bottom values.Then we use the vertical and horizontal bearings of aPOI to determine whether it lies inside the location-View (i.e., inside the field of view). Since we use theconcept of the locationView, we do not have to dealwith the rotation of the device at this point, i.e., wecan normalize calculations to portrait mode since therotation itself is handled by the locationView.
Figure 6: Illustration of the new maximal angle view andthe real one.
The camera view can be created and displayed ap-plying the native AVFoundation framework. Using thescreen size of the device, which can be determinedat run time, the locationView can be initialized andplaced centrally on top of the camera view. As soonas the Point of Interest Controller has finished its cal-culations (i.e., it has determined the positions of thePOIs), it notifies the View Controller that organizesthe view components. The View Controller then re-ceives the POIs and places them on the locationView.Recall that in case of a device rotation, only the loca-tionView must be rotated. As a consequence, the ac-tual visible field of view changes accordingly. There-fore, the Point of Interest Controller sends the rotationof the device calculated by the Sensor Controller tothe View Controller, together with the POIs. Thus, we
can adjust the field of view by simply counterrotatingthe locationView using the given angle. Based on this,the user will only see those POIs on his screen, be-ing inside the actual field of view. In turn, other POIswill be hidden after the rotation, i.e., moved out of thescreen (cf. Fig. 1). Detailed insights into respectiveimplementation issues, together with well describedcode samples, can be found in (Geiger et al., 2013).
3.2 Android Mobile Operating System
In general, mobile business applications should bemade available on all established platforms in orderto reach a large number of users. Hence, we devel-oped AREA for the Android mobile operating systemas well (and will also make it available for WindowsPhone at a later point in time). This section givesinsights into the Android implementation of AREA,comparing it with the corresponding iOS implemen-tation. Although the basic software architecture ofAREA is the same for both mobile operating systems,there are differences regarding its implementation.
3.2.1 Sensor Controller
For implementing the Sensor Controller, the pack-ages android.location and android.hardware are used.The location package provides functions to retrievethe current GPS coordinate and altitude of the respec-tive device, and is similar to the corresponding iOSpackage. However, the Android location package ad-ditionally allows retrieving an approximate positionof the device based on network triangulation. Par-ticularly, if no GPS signal is available, the latter ap-proach can be applied. However, as a drawback, noinformation about the current altitude of the devicecan be determined in this case. In turn, the hardwarepackage provides functions to get notified about thecurrent magnetic field and accelerometer. The lattercorresponds to the one of iOS, and is used to calcu-late the rotation of the device. However, the headingis calculated in a different way compared to iOS. In-stead of obtaining it with the location service, it mustbe determined manually. Generally, the heading de-pends on the rotation of the device and the magneticfield. Therefore, we create a rotation matrix using thedata of the magnetic field (i.e., a vector with three di-mensions) and the rotation based on the accelerome-ter data. Since the heading data depends on the ac-celerometer as well as the magnetic field, it is ratherinaccurate. More precisely, the calculated heading isstrongly oscillating. Hence, we apply a lowpass fil-ter to mitigate this oscillation. Note that this lowpassfilter is of another type than the one used in Section3.1.1 for calculating the gravity.
Location-based�Mobile�Augmented�Reality�Applications�-�Challenges,�Examples,�Lessons�Learned
389

Moreover, as soon as other magnetic devices arelocated nearby the actual mobile device, the headingwill be distorted. In order to notify the user aboutthe presence of such a disturbed magnetic field, lead-ing to false heading values, we apply functions of thehardware package. Another difference between iOSand Android concerns the way the required data canbe obtained. Regarding iOS, location-based data ispushed, whereas sensor data must be polled. As op-posed to iOS, on Android all data is pushed by theframework, i.e., application programmers rely on An-droid internal loops and trust the up-to-dateness ofthe data provided. Note that such subtle differencesbetween mobile operating systems and their develop-ment frameworks should be well understood by thedevelopers of advanced mobile business applications.
3.2.2 Point of Interest Controller
Figure 7: Android specific rotation of POI and field of view.
Regarding Android, the Point of Interest Controllerworks the same way as the one of iOS. However,when developing AREA we had to deal with one par-ticular issue. The locationView manages the visiblePOIs as described above. Therefore, it must be able toadd child views (e.g., every POI generating one childview). As described in Section 3.1, on iOS we simplyrotate the locationView to actually rotate the POIs andthe field of view. In turn, on Android, a layout con-taining child views cannot be rotated in the same way.Thus, when the Point of Interest Controller receivessensor data from the Sensor Controller, the x- and y-coordinates of the POIs must be determined in a dif-ferent way. Instead of placing the POIs independentlyof the current rotation of the device, we make use ofthe degree of rotation provided by the Sensor Con-troller. Following this, the POIs are rotated aroundthe centre of the locationView and we also rotate thePOIs about their centres (cf. Fig. 7). Using this ap-proach, we can still add all POIs to the field of view
Figure 8: AREA’s user interface for iOS and Android.
of the locationView. Finally, when rotating the POIs,they will automatically leave the device’s actual fieldof view.
3.3 Comparison
This section compares the two implementations ofAREA on iOS and Android. First of all, it is note-worthy that the features and functions of the two im-plementations are the same. Moreover, the user inter-faces realized for AREA on iOS and Android, respec-tively, are the same (see Fig. 8).
3.3.1 Realizing the LocationView
The developed locationView with its specific featuresdiffers between the Android and iOS implementationsof AREA. Regarding the iOS implementation, wecould realize the locationView concept as describedin Section 2.1. On the Android operating system,however, not all features of this concept worked prop-erly. More precisely, extending the actual field ofview of the device to the bigger size of the location-View worked well. Furthermore, determining whetheror not a POI is inside the field of view, independent ofthe rotation of the device, worked also well. By con-trast, rotating the locationView with its POIs to adjustthe visible field of view as well as moving invisiblePOIs out of the screen did not work as easy on An-droid as expected. As particular problem in the givencontext, a simple view on Android must not containany child views. Therefore, on Android we had touse the layout concept for realizing the described lo-cationView. However, simply rotating a layout doesnot work on all Android devices. For example, ona Nexus 4 device this worked well by implementingthe algorithm in exactly the same way as on iOS. In
WEBIST�2014�-�International�Conference�on�Web�Information�Systems�and�Technologies
390
turn, on a Nexus 5 device this led to failures regard-ing the redraw process. When rotating the layout onthe Nexus 5, the locationView is clipped by the cam-era surface view, which is located behind our loca-tionView. As a consequence, to ensure that AREA iscompatible with a wider set of Android devices, run-ning Android 4.0 or later, we made the adjustmentsdescribed in Section 4.2.
3.3.2 Accessing Sensors
Using sensors on the two mobile operating systemsis different as well. The latter concerns the accessto the sensors as well as their preciseness and relia-bility. Regarding iOS, the location sensor is offeringthe GPS coordinates as well as the compass heading.This data is pushed to the application by the underly-ing service offered by iOS. Concerning Android, thelocation sensor only provides data of the current lo-cation. Furthermore, this data must be polled by theapplication. The heading data, in turn, is calculated bythe fusion of several motion sensors, including the ac-celerometer and magnetometer. The accelerometer isused on both platforms to determine the current orien-tation of the device. However, the preciseness of dataprovided differs significantly. Running and compilingthe AREA engine on iOS with iOS 6 results in veryreliable compass data with an interval of one degree.Running and compiling the AREA engine with iOS 7,however, leads to different results compared to iOS 6.As advantage, iOS 7 enables a higher resolution of thedata intervals provided by the framework due to theuse of floating point data instead of integers. In turn,the partial unreliability of the delivered compass datais disadvantageous. Regarding iOS 7, compass datastarted to oscillate within an interval when moving thedevice. Therefore, we needed to apply a stronger low-pass filter in order to compensate this oscillating data.In turn, on Android the internal magnetometer, whichis necessary for calculating the heading, is vulnera-ble to noisy sources (e.g., other devices, magnets, orcomputers). Thus, it might happen that the delivereddata is unreliable and the application must wait untilmore reliable sensor data becomes available.
Furthermore, for each sensor the correspondingdocumentation on the respective operating systemshould be studied in detail in order to operate withthem efficiently. In particular, the high number ofdifferent devices running Android constitutes a chal-lenge when deploying AREA on the various hard-ware and software configurations of manufacturers.Finally, we learned that Android devices are often af-fected by distortions of other electronic hardware and,therefore, the delivered data might be unreliable aswell.
Overall, the described differences demonstratethat developing advanced mobile business applica-tions, which make use of the technical capabilities ofmodern smart mobile devices, is far from being trivialfrom the viewpoint of application developers.
4 VALIDATION
This section deals with the development of businessapplications with AREA and the lessons learned inthis context.
4.1 Developing Business Applicationswith AREA
AREA has been integrated with several business ap-plications. For example, one company uses AREAfor its application LiveGuide (CMCityMedia, 2013).A LiveGuide can be used to provide residents andtourists of a German city with the opportunity to ex-plore their surrounding by displaying points of inter-ests stored for that city (e.g., public buildings, parks,places of events, or companies). When realizing suchbusiness applications on top of AREA, it turned outthat their implementation benefits from the modulardesign and extensibility of AREA. Furthermore, anefficient implementation could be realized. In partic-ular, when developing the LiveGuide application type,only the following two steps were required: First, theappearance of the POIs was adapted to meet the userinterface requirements of the respective customers.Second, the data model of AREA was adapted to analready existing one. On the left side of Fig. 9, weshow user interface elements we made in the contextof the LiveGuide applications. In turn, on the rightside of Fig. 9, we show the user interface elementsoriginally implemented for AREA.
4.2 Lessons Learned
This section discusses issues that emerged when de-veloping business applications (e.g., LiveGuide) ontop of AREA. Note that we got many other practi-cal insights from the use of AREA. However, to set afocus, we restrict ourselves to two selected issues.
4.2.1 Updates of Mobile Operating Systems
As known, the iOS and Android mobile operatingsystems are frequently updated. In turn, respectiveupdates must be carefully considered when devel-oping and deploying an advanced mobile businessapplication like AREA. Since the latter depends on
Location-based�Mobile�Augmented�Reality�Applications�-�Challenges,�Examples,�Lessons�Learned
391

Figure 9: Typical adapted user interface provided by aLiveGuide application.
Figure 10: SENSOR STATUS UNRELIABLE change inAndroid 4.3.
the availability of accurate sensor data, fundamentalchanges of the respective native libraries might af-fect the proper execution of AREA. As example, con-sider the following issue we had to cope with in thecontext of an update of the Android operating sys-tem (i.e., the switch from Android Version 4.2 to Ver-sion 4.3). In the old version, the sensor frameworknotifies AREA when measured data becomes unre-liable. However, with the new version of the mo-bile operating system, certain constants (e.g., SEN-SOR STATUS UNRELIABLE) we had used were nolonger known on respective devices (cf. Fig. 10).To deal with this issue, the respective constant hadto be replaced by a listener (cf. Fig. 10 onAccuracy-Changed). As another example consider the releaseof iOS 7, which led to a change of the look and feel ofthe entire user interface. In particular, some of thecustomized user interface elements in the deployedversion of the LiveGuide applications got hidden fromone moment to the other or did not react to user in-teractions anymore. Thus, the application had to befixed. Altogether, we learned that adjusting mobileapplications due to operating system updates mightcause considerable efforts.
4.2.2 POI Data Format
Using our own proprietary XML schema insteadof applying and adapting the open source schemaARML has its pros and cons. On one hand, we cansimply extend and modify this schema, e.g., to ad-dress upcoming issues in future work. On the other,when integrating AREA with the LiveGuide applica-tion, we also revealed drawbacks of our approach. Inparticular, the data format of POIs, stored in externaldatabases, differs due to the use of a non-standardizedformat. Thus, the idea of ARML (ARML, 2013) ispromising. Using such a standardized format for rep-resenting POIs from different sources should be pur-sued. Therefore, we will adapt AREA to support thisstandard with the goal to allow for an easy integrationof AREA with other business applications.
5 RELATED WORK
Previous research related to the development of alocation-based augmented reality application, whichis based on GPS coordinates and sensors running onhead-mounted displays, is described in (Feiner et al.,1997) and (Kooper and MacIntyre, 2003). In turn, asimple smart mobile device, extended by additionalsensors, has been applied by (Kahari and Murphy,2006) to develop an augmented reality system. An-other application using augmented reality is describedin (Lee et al., 2009). Its purpose is to share me-dia data and other information in a real-world envi-ronment and to allow users to interact with this datathrough augmented reality. However, none of theseapproaches addresses location-based augmented real-ity on smart mobile devices as AREA does. In par-ticular, these approaches do not give insights into thedevelopment of such business applications.
The increasing size of the smart mobile devicemarket as well as the technical maturity of smartmobile devices has motivated software vendors torealize augmented reality software development kits(SDKs). Example of such SDKs included Wikitude(Wikitude, 2013), Layar (Layar, 2013), and Junaio(Junaio, 2013). Besides these SDKs, there are popu-lar applications like Yelp (Yelp, 2013), which use ad-ditional features of augmented reality to assist userswhen interacting with their surrounding.
Only little work can be found, which deals withthe development of augmented reality systems in gen-eral. As an exception, (Grubert et al., 2011) validatesexisting augmented reality browsers. However, nei-ther commercial software vendors nor scientific re-sults related to augmented reality provide any insight
WEBIST�2014�-�International�Conference�on�Web�Information�Systems�and�Technologies
392

into how to develop a location-based mobile aug-mented reality engine.
6 SUMMARY & OUTLOOK
The purpose of this paper was to give insights into thedevelopment of the core framework of an augmentedreality engine for smart mobile devices. We have fur-ther shown how business applications can be imple-mented based on the functionality of this mobile en-gine. As demonstrated along selected implementationissues, such a development is very challenging. Firstof all, a basic knowledge about mathematical calcu-lations is required, i.e., formulas to calculate the dis-tance and heading of points of interest on a sphere inthe context of outdoor scenarios. Furthermore, deepknowledge about the various sensors of the smart mo-bile device is required from application developers,particularly regarding the way the data provided bythese sensors can be accessed and processed. Anotherimportant issue concerns resource and energy con-sumption. Since smart mobile devices have limitedresources and performance capabilities, the points ofinterest should be displayed in an efficient way andwithout delay. Therefore, the calculations required tohandle sensor data and to realize the general screendrawing that must be implemented as efficient as pos-sible. The latter has been accomplished through theconcept of the locationView, which allows increasingthe field of view and reusing already drawn points ofinterest. In particular, the increased size allows theAREA engine to easily determine whether or not apoint of view is inside the locationView without con-sidering the current rotation of the smart mobile de-vice. In addition, all displayed points of interest canbe rotated easily.
We argue that an augmented reality engine likeAREA must provide a sufficient degree of modular-ity to enable a full and easy integration with existingapplications as well as to implement new applicationson top of it. Finally, it is crucial to realize a properarchitecture and class design, not neglecting the com-munication between the components. We have fur-ther demonstrated how to integrate AREA in a real-world business applications (i.e., LiveGuide) and howto make use of AREA’s functionality. In this context,the respective application has been made available inthe Apple App and Android Google Play Stores. Inparticular, the realized application has shown high ro-bustness. Finally, we have given insights into the dif-ferences between Apple’s and Google’s mobile oper-ating systems when developing AREA.
Future research on AREA will address the chal-
lenges we identified during the implementation of theLiveGuide business application. For example, in cer-tain scenarios the POIs located in the same directionoverlap each other, making it difficult for users to pre-cisely touch POIs. To deal with this issue, we areworking on algorithms for detecting clusters of POIsand offering a way for users to interact with theseclusters. In (Feineis, 2013), a component for on-the-trail navigation in mountainous regions has been de-veloped on top of AREA, which is subject of cur-rent research as well. Furthermore, we are develop-ing a marker-based augmented reality component inorder to integrate marker based with location basedaugmented reality. Since GPS is only available foroutdoor location, but AREA should also for indoorscenarios, we are working towards this direction aswell. In the latter context, we use Wi-Fi triangulationto determine the device’s indoor position (Bachmeier,2013). Second, we are experiencing with the iBea-cons approach introduced by Apple.
Finally, research on business process managementoffers flexible concepts, which are useful for enablingproper exception handling in the context of mobileapplications as well (Pryss et al., 2012; Pryss et al.,2013; Pryss et al., 2010). Since mobile augmentedreality applications may cause various errors (e.g.,sensor data is missing), adopting these concepts ispromising.
REFERENCES
Alasdair, A. (2011). Basic Sensors in iOS: Programmingthe Accelerometer, Gyroscope, and More. O’ReillyMedia.
Apple (2013). Event handling guide for iOS: Motion events.[Online; accessed 10.12.2013].
ARML (2013). Augmented reality markup language.http://openarml.org/wikitude4.html. [Online; ac-cessed 10.12.2013].
Bachmeier, A. (2013). Wi-fi based indoor navigation in thecontext of mobile services. Master Thesis, Universityof Ulm.
Bullock, R. (2007). Great circle distances and bearings be-tween two locations. [Online; accessed 10.12.2013].
Carmigniani, J., Furht, B., Anisetti, M., Ceravolo, P., Dami-ani, E., and Ivkovic, M. (2011). Augmented realitytechnologies, systems and applications. MultimediaTools and Applications, 51(1):341–377.
CMCityMedia (2013). City liveguide. http://liveguide.de.[Online; accessed 10.12.2013].
Corral, L., Sillitti, A., and Succi, G. (2012). Mobilemultiplatform development: An experiment for per-formance analysis. Procedia Computer Science,10(0):736 – 743.
Location-based�Mobile�Augmented�Reality�Applications�-�Challenges,�Examples,�Lessons�Learned
393

Feineis, L. (2013). Development of an augmented realitycomponent for on the trail navigation in mountainousregions. Master Thesis, University of Ulm, Germany.
Feiner, S., MacIntyre, B., Hollerer, T., and Webster, A.(1997). A touring machine: Prototyping 3d mobileaugmented reality systems for exploring the urban en-vironment. Personal Technologies, 1(4):208–217.
Frohlich, P., Simon, R., Baillie, L., and Anegg, H. (2006).Comparing conceptual designs for mobile access togeo-spatial information. Proc of the 8th Conf onHuman-computer Interaction with Mobile Devicesand Services, pages 109–112.
Geiger, P., Pryss, R., Schickler, M., and Reichert, M.(2013). Engineering an advanced location-based aug-mented reality engine for smart mobile devices. Tech-nical Report UIB-2013-09, University of Ulm, Ger-many.
Grubert, J., Langlotz, T., and Grasset, R. (2011). Aug-mented reality browser survey. Technical report, In-stitute for Computer Graphics and Vision, Graz Uni-versity of Technology, Austria.
Junaio (2013). Junaio. http://www.junaio.com/. [Online;accessed 11.06.2013].
Kahari, M. and Murphy, D. (2006). Mara: Sensor basedaugmented reality system for mobile imaging device.5th IEEE and ACM Int’l Symposium on Mixed andAugmented Reality.
Kamenetsky, M. (2013). Filtered audio demo.http://www.stanford.edu/�boyd/ee102/conv demo.pdf.[Online; accessed 17.01.2013].
Kooper, R. and MacIntyre, B. (2003). Browsing the real-world wide web: Maintaining awareness of virtual in-formation in an AR information space. Int’l Journalof Human-Computer Interaction, 16(3):425–446.
Layar (2013). Layar. http://www.layar.com/. [Online; ac-cessed 11.06.2013].
Lee, R., Kitayama, D., Kwon, Y., and Sumiya, K. (2009).Interoperable augmented web browsing for exploringvirtual media in real space. Proc of the 2nd Int’l Work-shop on Location and the Web, page 7.
Paucher, R. and Turk, M. (2010). Location-based aug-mented reality on mobile phones. IEEE ComputerSociety Conf on Computer Vision and Pattern Recog-nition Workshops (CVPRW), pages 9–16.
Pryss, R., Langer, D., Reichert, M., and Hallerbach, A.(2012). Mobile task management for medical wardrounds - the MEDo approach. Proc BPM’12 Work-shops, 132:43–54.
Pryss, R., Musiol, S., and Reichert, M. (2013). Collabora-tion support through mobile processes and entailmentconstraints. Proc 9th IEEE Int’l Conf on Collabora-tive Computing (CollaborateCom’13).
Pryss, R., Tiedeken, J., Kreher, U., and Reichert, M. (2010).Towards flexible process support on mobile devices.Proc CAiSE’10 Forum - Information Systems Evolu-tion, (72):150–165.
Reitmayr, G. and Schmalstieg, D. (2003). Location basedapplications for mobile augmented reality. Proc of theFourth Australasian user interface conference on Userinterfaces, pages 65–73.
Robecke, A., Pryss, R., and Reichert, M. (2011).Dbischolar: An iphone application for performing ci-tation analyses. Proc CAiSE’11 Forum at the 23rdInt’l Conf on Advanced Information Systems Engi-neering, (Vol-73).
Schobel, J., Schickler, M., Pryss, R., Nienhaus, H., andReichert, M. (2013). Using vital sensors in mobilehealthcare business applications: Challenges, exam-ples, lessons learned. Int’l Conf on Web InformationSystems and Technologies, pages 509–518.
Sinnott, R. (1984). Virtues of the haversine. Sky and tele-scope, 68:2:158.
Systems, A. (2013). Phonegap. http://phonegap.com. [On-line; accessed 10.12.2013].
Wikitude (2013). Wikitude. http://www.wikitude.com.[Online; accessed 11.06.2013].
Yelp (2013). Yelp. http://www.yelp.com. [Online; accessed11.06.2013].
WEBIST�2014�-�International�Conference�on�Web�Information�Systems�and�Technologies
394

SHORT PAPER


Alternative Communication System for Emergency Situations
I. Santos-González, A. Rivero-García, P. Caballero-Gil and C. Hernández-Goya Department of Computing, University of La Laguna, Tenerife, Spain
[email protected], [email protected], {pcaballe, mchgoya}@ull.es
Keywords: Wi-Fi Direct, Security, Mobile Communications, Android, SNOW 3G.
Abstract: Nowadays, many different technologies can be used for wireless communication in various types of situations. However, most of them depend on network infrastructures like mobile communication antennas, which can be unavailable due to distinct problems such as natural disasters, terrorist attacks or huge people agglomerations in massive events like demonstrations, concerts or sport events. This paper presents a solution to this problem, which is based on a new communication system that uses the Wi-Fi Direct technology to deploy secure communications independently of the network infrastructure.
1 INTRODUCTION
In the last years, many mobile devices like smartphones, laptops, printers, personal computers, tablet PCs, etc. have included among their technical features a new wireless technology called Wi-Fi Direct, which is a standard that allows Wi-Fi devices to establish a connection with no need of an access point. This technology manages that Wi-Fi Direct devices can transfer data between them directly, with a configuration that is much easier than the one required doing it with the traditional Wi-Fi technology.
The variety of advantages that Wi-Fi Direct technology offers, and the fact that it does not require any additional infrastructure, make that this technology can be very useful in emergency situations. Due to this, and to the fact that very often the usual infrastructures can be unavailable in this kind of situations; this paper proposes a new wireless communication system based on this technology.
Furthermore, since new smartphones include in their technical features the Wi-Fi Direct technology, the use of the proposed wireless communication system based on this technology is possible simply by using devices that are very common nowadays.
The proposed communication system pays special attention to the deployment of secure communications in emergency or natural disaster situations by using different cryptographic algorithms and protocols. Moreover, the described system allows users to send automatically their
geographic coordinates in each message if they wish. This feature makes it possible that emergency services can provide evacuation and rescues in a more efficient way.
The described system is already available to users through the development and publication of an Android application that allows them to deploy secure communications automatically over Wi-Fi Direct technology.
This work is organized as follows. Section 2 gives a brief description of Wi-Fi Direct technology. Afterwards, Section 3 introduces several concepts related to security, which are necessary for the definition of the mobile application called Wi-Fi Direct Locator, described in Section 4. Finally, Section 5 closes the paper with some conclusions and open questions
2 WI-FI DIRECT TECHNOLOGY
Wi-Fi Direct is a new wireless technology developed by the Wi-Fi Alliance with the goal of establishing Peer TO Peer (P2P) communications between users using the Wi-Fi technology (Wi-Fi Alliance, 2013).
Traditionally, P2P systems can be deployed in two different ways.
On the one hand, the so-called ad hoc mode consists of two devices that are interconnected, forming a point-to-point network. In this mode, each device plays the roles of client and access point simultaneously. This configuration is known as Independent Basic Service Set (IBSS) (Ilyas, 2010)
397
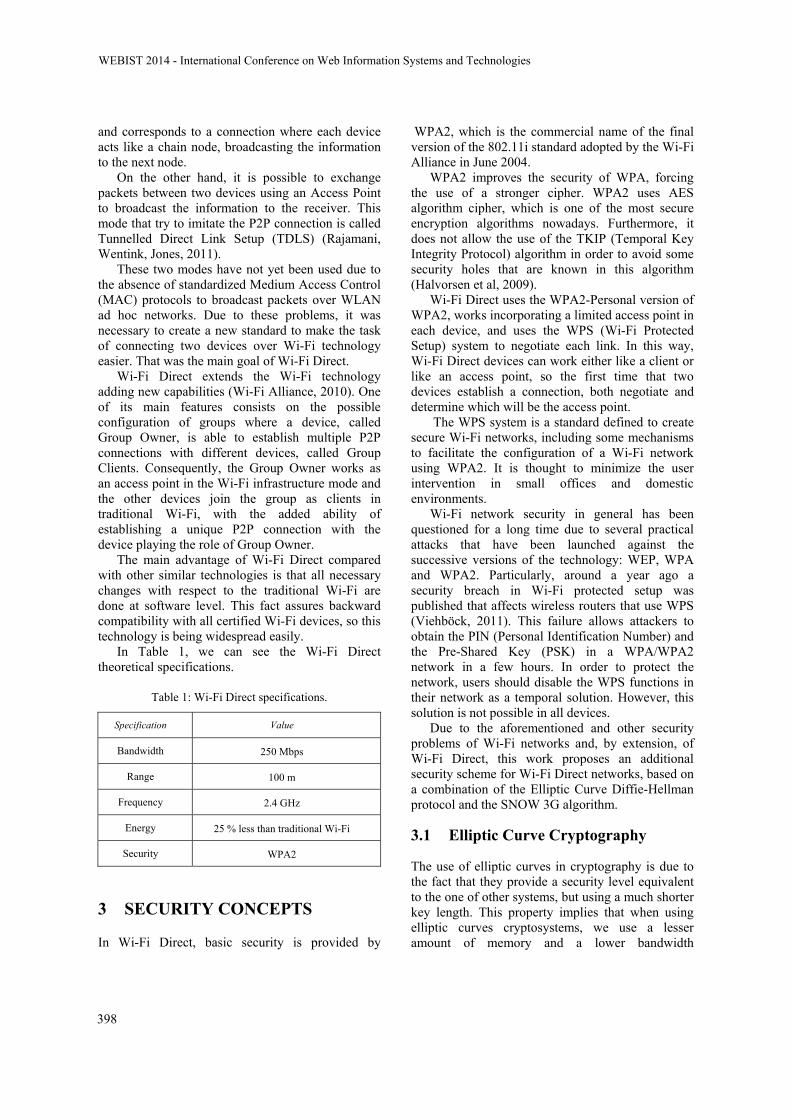
and corresponds to a connection where each device acts like a chain node, broadcasting the information to the next node.
On the other hand, it is possible to exchange packets between two devices using an Access Point to broadcast the information to the receiver. This mode that try to imitate the P2P connection is called Tunnelled Direct Link Setup (TDLS) (Rajamani, Wentink, Jones, 2011).
These two modes have not yet been used due to the absence of standardized Medium Access Control (MAC) protocols to broadcast packets over WLAN ad hoc networks. Due to these problems, it was necessary to create a new standard to make the task of connecting two devices over Wi-Fi technology easier. That was the main goal of Wi-Fi Direct.
Wi-Fi Direct extends the Wi-Fi technology adding new capabilities (Wi-Fi Alliance, 2010). One of its main features consists on the possible configuration of groups where a device, called Group Owner, is able to establish multiple P2P connections with different devices, called Group Clients. Consequently, the Group Owner works as an access point in the Wi-Fi infrastructure mode and the other devices join the group as clients in traditional Wi-Fi, with the added ability of establishing a unique P2P connection with the device playing the role of Group Owner.
The main advantage of Wi-Fi Direct compared with other similar technologies is that all necessary changes with respect to the traditional Wi-Fi are done at software level. This fact assures backward compatibility with all certified Wi-Fi devices, so this technology is being widespread easily.
In Table 1, we can see the Wi-Fi Direct theoretical specifications.
Table 1: Wi-Fi Direct specifications.
Specification Value
Bandwidth 250 Mbps
Range 100 m
Frequency 2.4 GHz
Energy 25 % less than traditional Wi-Fi
Security WPA2
3 SECURITY CONCEPTS
In Wi-Fi Direct, basic security is provided by
WPA2, which is the commercial name of the final version of the 802.11i standard adopted by the Wi-Fi Alliance in June 2004.
WPA2 improves the security of WPA, forcing the use of a stronger cipher. WPA2 uses AES algorithm cipher, which is one of the most secure encryption algorithms nowadays. Furthermore, it does not allow the use of the TKIP (Temporal Key Integrity Protocol) algorithm in order to avoid some security holes that are known in this algorithm (Halvorsen et al, 2009).
Wi-Fi Direct uses the WPA2-Personal version of WPA2, works incorporating a limited access point in each device, and uses the WPS (Wi-Fi Protected Setup) system to negotiate each link. In this way, Wi-Fi Direct devices can work either like a client or like an access point, so the first time that two devices establish a connection, both negotiate and determine which will be the access point.
The WPS system is a standard defined to create secure Wi-Fi networks, including some mechanisms to facilitate the configuration of a Wi-Fi network using WPA2. It is thought to minimize the user intervention in small offices and domestic environments.
Wi-Fi network security in general has been questioned for a long time due to several practical attacks that have been launched against the successive versions of the technology: WEP, WPA and WPA2. Particularly, around a year ago a security breach in Wi-Fi protected setup was published that affects wireless routers that use WPS (Viehböck, 2011). This failure allows attackers to obtain the PIN (Personal Identification Number) and the Pre-Shared Key (PSK) in a WPA/WPA2 network in a few hours. In order to protect the network, users should disable the WPS functions in their network as a temporal solution. However, this solution is not possible in all devices.
Due to the aforementioned and other security problems of Wi-Fi networks and, by extension, of Wi-Fi Direct, this work proposes an additional security scheme for Wi-Fi Direct networks, based on a combination of the Elliptic Curve Diffie-Hellman protocol and the SNOW 3G algorithm.
3.1 Elliptic Curve Cryptography
The use of elliptic curves in cryptography is due to the fact that they provide a security level equivalent to the one of other systems, but using a much shorter key length. This property implies that when using elliptic curves cryptosystems, we use a lesser amount of memory and a lower bandwidth
WEBIST�2014�-�International�Conference�on�Web�Information�Systems�and�Technologies
398

consumption to save and to transmit the key respectively.
In cryptography, elliptic curves defined over finite fields K = Zp, being p a prime number, offer several interesting features.
A finite field is a finite set of elements with the addition and multiplication operations satisfying the associative, commutative and distributive properties, and having an additive inverse and a neutral element both for the sum and for the multiplication (Blake, Seroussi, Smart, 1999).
In elliptic curves defined over finite fields of high dimensions, the computation of a multiple of a point is very difficult. This is known as the Elliptic Curve Discrete Logarithm Problem and it is a problem similar to that of computing the discrete logarithm in a finite multiplicative group.
The security of cryptographic procedures based on elliptic curves depends on the complexity of the calculation of the elliptic logarithm. Such a complexity, when using non-supersingular curves, what is usual in cryptography, is . This value is much greater than the complexity of the factorization problem or the discrete logarithm problem (Smart, 1999).
Some of the properties of the elliptic curves defined over finite fields allow us to say that when we work with integer numbers sufficiently large, the use of the elliptic logarithm can be more secure than the use of factorization or of discrete logarithm. This fact is shown in Table 2.
Table 2: Elliptic curve security.
Key length
Cryptosystem Operations
(cipher)
Break Time (PC 109 FLOPS)
30 RSA 9,0 * 102 0.3 seconds
30 Elliptic curves 2,7 * 104 11 days
50 RSA 2,5 * 103 2 minutes
50 Elliptic curves 1,2 * 105 3,0 * 103
years
100 RSA 1,0 * 104 28 days
100 Elliptic curves 1,0 * 105 ---
200 RSA 4,0 * 104 3,8 * 106
years
200 Elliptic curves 8,0 * 105 ---
3.2 Elliptic Curve Diffie-Hellman Protocol
The Elliptic Curve Diffie-Hellman (ECDH) Protocol
is a variation of the original Diffie-Hellman protocol, which uses the properties of the elliptic curves defined over finite fields (Koblitz, 1987) (Miller, 1985).
In this way, the two users agree beforehand on the use of a prime number p, an elliptic curve E
defined over Zp and a point P ∈ E. Then, the users A and B choose as secret keys
two random numbers belonging to Zp, being these
a∈ Zp and b∈ Zp. Later, they obtain their public keys multiplying
their secret keys by the point P previously agreed. The next step is the exchange of their public keys
in order to compute later the shared key by multiplying their private key by the public key of the other user, obtaining both the same shared key.
The strength of this protocol lies on the difficulty to solve the Elliptic Curve Discrete Logarithm Problem.
However, since this protocol derives from the original Diffie-Hellman protocol, it is susceptible to suffer the same attacks.
3.3 SNOW 3G Algorithm
SNOW 3G is the stream cipher algorithm designated in 2006 as base for the integrity protection and encryption of the UMTS technology.
Thanks to the fact that the algorithm satisfies all the requirements imposed by the 3GPP (3rd Generation Partnership Project) with respect to time and memory resources, it was selected as base of the UMTS Encryption Algorithm 2 (UEA2) and UMTS Integrity Algorithm 2 (UIA2) algorithms (IA UEA2&UIA, 2006).
The SNOW 3G algorithm derives from the SNOW 2 algorithm, and uses 128-bit keys and an initialization vector in order to generate in each iteration 32 bits of keystream.
The LFSR used in this algorithm has 16 stages denoted s0, s1, s2… s15 with 32 bits each one.
On the other hand, the used FSM (Finite State Machine) is based on three 32-bit records denoted R1, R2 and R3 and uses two Substitution-boxes called S1 and S2.
The combination operation uses a XOR and an addition module 232.
Figure 1 shows the general scheme of this algorithm.
This algorithm has two execution modes: the initialization mode and the keystream mode. First, the initialization mode is executed without producing any keystream. Then, the keystream mode is executed. In particular, the number of iterations of
Alternative�Communication�System�for�Emergency�Situations
399
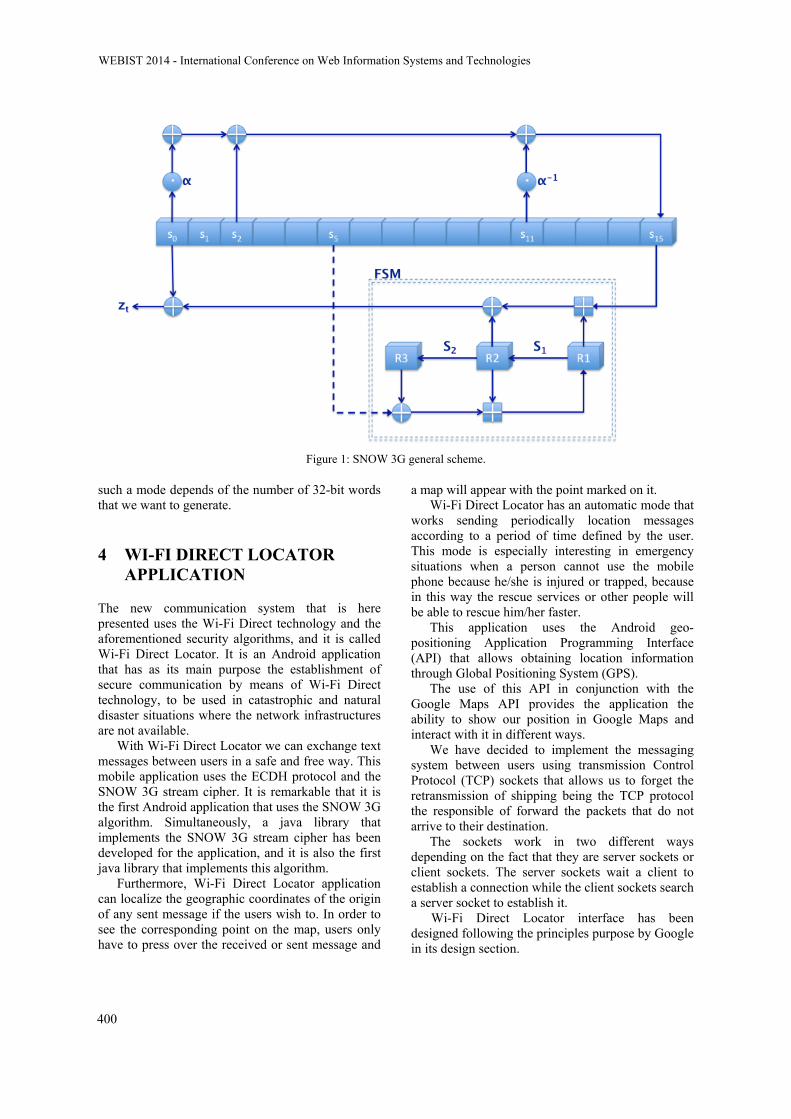
Figure 1: SNOW 3G general scheme.
such a mode depends of the number of 32-bit words that we want to generate.
4 WI-FI DIRECT LOCATOR APPLICATION
The new communication system that is here presented uses the Wi-Fi Direct technology and the aforementioned security algorithms, and it is called Wi-Fi Direct Locator. It is an Android application that has as its main purpose the establishment of secure communication by means of Wi-Fi Direct technology, to be used in catastrophic and natural disaster situations where the network infrastructures are not available.
With Wi-Fi Direct Locator we can exchange text messages between users in a safe and free way. This mobile application uses the ECDH protocol and the SNOW 3G stream cipher. It is remarkable that it is the first Android application that uses the SNOW 3G algorithm. Simultaneously, a java library that implements the SNOW 3G stream cipher has been developed for the application, and it is also the first java library that implements this algorithm.
Furthermore, Wi-Fi Direct Locator application can localize the geographic coordinates of the origin of any sent message if the users wish to. In order to see the corresponding point on the map, users only have to press over the received or sent message and
a map will appear with the point marked on it. Wi-Fi Direct Locator has an automatic mode that
works sending periodically location messages according to a period of time defined by the user. This mode is especially interesting in emergency situations when a person cannot use the mobile phone because he/she is injured or trapped, because in this way the rescue services or other people will be able to rescue him/her faster.
This application uses the Android geo-positioning Application Programming Interface (API) that allows obtaining location information through Global Positioning System (GPS).
The use of this API in conjunction with the Google Maps API provides the application the ability to show our position in Google Maps and interact with it in different ways.
We have decided to implement the messaging system between users using transmission Control Protocol (TCP) sockets that allows us to forget the retransmission of shipping being the TCP protocol the responsible of forward the packets that do not arrive to their destination.
The sockets work in two different ways depending on the fact that they are server sockets or client sockets. The server sockets wait a client to establish a connection while the client sockets search a server socket to establish it.
Wi-Fi Direct Locator interface has been designed following the principles purpose by Google in its design section.
WEBIST�2014�-�International�Conference�on�Web�Information�Systems�and�Technologies
400

Figure 2: Screenshots of Wi-Fi Direct Locator.
During the application development we have focused on some specific details to improve the user’s experience.
First, we have reduced the number of navigation screens to do the user’s navigation easier and we use images buttons instead of traditional buttons to capture the user’s attention.
We have also endeavoured to do our application similar to the system application look. For this reason, Android defines three specific themes, and we use one of these (Holo Dark) to do our application visually similar to the predetermined system applications.
Wi-Fi Direct Locator is available in Google Play market and it has been downloaded by many people in different countries to communicate in emergency situations without the need of network infrastructures.
Figure 2 shows the user’s interface by means of a series of images of different navigation screens.
5 CONCLUSIONS
This paper describes a new communication system based on the Wi-Fi Direct technology to deploy secure communications that are useful in situations when network infrastructures are unavailable. Thus, the proposal is especially useful under conditions such as natural disasters, terrorist attacks or simply huge agglomerations of people in massive events like demonstrations, concerts or sport events. Among the main features of the proposal, security is the most remarkable because cryptographic algorithms based on elliptic curve
cryptography and stream ciphers are used. The proposed system is already available to users
through an Android application. However, there are still many open problems such as the study of attacks resistance and a wider automation of the application.
ACKNOWLEDGEMENTS
Research supported by the Spanish MINECO and the European FEDER Funds under projects TIN2011-25452 and IPT-2012-0585-370000.
REFERENCES
Blake, I. F., Seroussi, G., Smart, N., 1999. Elliptic curves in cryptography, Vol. 265. Cambridge university press.
Halvorsen, F.M., Haugen, O., Eian, M., Mjølsnes, S.F., 2009. An improved attack on TKIP. Identity and Privacy in the Internet Age, pp. 120-132. Springer Berlin Heidelberg.
IA UEA2&UIA, 2006. Specification of the 3gpp confidentiality and integrity algorithms UEA2 & UIA2. Document 2: Snow 3g specifications. version: 1.1. etsi.
Ilyas, M., 2010. The handbook of ad hoc wireless networks, Vol. 29. CRC press.
Koblitz, N., 1987. Elliptic curve cryptosystems. Mathematics of Computation 48(177), pp. 203–209.
Miller, V., 1985. Use of elliptic curves in cryptography. Advances in Cryptology—CRYPTO’85, pp. 417-426.
Rajamani, K., Wentink, M. M., Jones, V. K., 2011. Wireless display discovery and operation with tdls. U.S. Patent Application 13/240,852.
Alternative�Communication�System�for�Emergency�Situations
401

Smart, N. P., 1999. The discrete logarithm problem on elliptic curves of trace one. Journal of Cryptology, 12(3), pp. 193–196.
Viehböck, S., 2011. Brute forcing wi-fi protected setup. http://sviehb. files. wordpress. com/2011/12/ viehboeck_wps. pdf.
Wi-Fi Alliance, 2010. Wi-fi certified wi-fi direct. http://www.wi-fi.org/news_articles.php.
Wi-Fi Alliance, 2013. http://www.wi-fi.org/.
WEBIST�2014�-�International�Conference�on�Web�Information�Systems�and�Technologies
402
AUTHOR INDEX
Abdel-Hafez, A. . . . . . . . . . . . . . . . . . . . . . . .184Adán, R. . . . . . . . . . . . . . . . . . . . . . . . . . . . . . . . 57Ahuja, A. . . . . . . . . . . . . . . . . . . . . . . . . . . . . . . 14Apolloni, B. . . . . . . . . . . . . . . . . . . . . . . . . . . 359Arrue, M. . . . . . . . . . . . . . . . . . . . . . . . . . . . . . . 65Augello, A. . . . . . . . . . . . . . . . . . . . . . . . . . . . 344Baazaoui-Zghal, H. . . . . . . . . . . . . . . . . . . . . 123Balík, M. . . . . . . . . . . . . . . . . . . . . . . . . . . . . . 107Bardiau, R. . . . . . . . . . . . . . . . . . . . . . . . . . . . 322Barrera, L. . . . . . . . . . . . . . . . . . . . . . . . . . . . . . 82Barrios, A. . . . . . . . . . . . . . . . . . . . . . . . . . . . . . 57Barros, E. . . . . . . . . . . . . . . . . . . . . . . . . . . . . .328Bartuskova, A. . . . . . . . . . . . . . . . . . . . . . . . . 143Bergamaschi, S. . . . . . . . . . . . . . . . . . . . . . . . 172Bobed, C. . . . . . . . . . . . . . . . . . . . . . . . . . . . . . . 41Borobia, J. . . . . . . . . . . . . . . . . . . . . . . . . . . . . . 41Boyer, A. . . . . . . . . . . . . . . . . . . . . . . . . . . . . . 205Bsaïes, K. . . . . . . . . . . . . . . . . . . . . . . . . . . . . 205Buey, M. . . . . . . . . . . . . . . . . . . . . . . . . . . . . . 161Caballero-Gil, P. . . . . . . . . . . . . . . . . . . . . . . 397Carrillo-Ramos, A. . . . . . . . . . . . . . . . . . . . . . 82Chen, W. . . . . . . . . . . . . . . . . . . . . . . . . . . . . . . 74Cheng, X. . . . . . . . . . . . . . . . . . . . . . . . . . . . . 131Chiru, C. . . . . . . . . . . . . . . . . . . . . . . . . . . . . . 255Cho, Y. . . . . . . . . . . . . . . . . . . . . . . . . . . . . . . . 313Chou, W. . . . . . . . . . . . . . . . . . . . . . . . . . . . . . . 74Chunhong, Z. . . . . . . . . . . . . . . . . . . . . . . . . . 247Ciotec, S. . . . . . . . . . . . . . . . . . . . . . . . . . . . . . 255Decker, S. . . . . . . . . . . . . . . . . . . . . . . . . . . . . . 99Devlin, K. . . . . . . . . . . . . . . . . . . . . . . . . . . . . . . .5Diamanti, K. . . . . . . . . . . . . . . . . . . . . . 231, 231El-Sayed, M. . . . . . . . . . . . . . . . . . . . . . . . . . .295Erdur, R. . . . . . . . . . . . . . . . . . . . . . . . . . . . . . 278Escudero, S. . . . . . . . . . . . . . . . . . . . . . . . . . . 161Ferrari, L. . . . . . . . . . . . . . . . . . . . . . . . . . . . . 359Florez-Valencia, L. . . . . . . . . . . . . . . . . . . . . . 82Gaggi, O. . . . . . . . . . . . . . . . . . . . . . . . . . . . . . . 91Galliani, G. . . . . . . . . . . . . . . . . . . . . . . . . . . . 359Garcia, V. . . . . . . . . . . . . . . . . . . . . . . . . . . . . . . 27García, J. . . . . . . . . . . . . . . . . . . . . . . . . . . . . . . 57Gargouri, F. . . . . . . . . . . . . . . . . . . . . . . . . . . . 340Garrido, A. . . . . . . . . . . . . . . . . . . . . . . . . 41, 161Gasparetti, F. . . . . . . . . . . . . . . . . . . . . . . . . . .350Geiger, P. . . . . . . . . . . . . . . . . . . . . . . . . . . . . . 383Ghezala, H. . . . . . . . . . . . . . . . . . . . . . . . . . . . 123
Ghorbani, M. . . . . . . . . . . . . . . . . . . . . . . . . . 335Gioia, M. . . . . . . . . . . . . . . . . . . . . . . . . . . . . . 359Goncalves, N. . . . . . . . . . . . . . . . . . . . . . . . . . 193González, M. . . . . . . . . . . . . . . . . . . . . . . . . . 115Grove, R. . . . . . . . . . . . . . . . . . . . . . . . . . . . . . . 33Gulla, J. . . . . . . . . . . . . . . . . . . . . . . . . . . . . . . 278HadjKacem, A. . . . . . . . . . . . . . . . . . . . . . . . .263Hanrahan, B. . . . . . . . . . . . . . . . . . . . . . . . . . . . 14Hausenblas, M. . . . . . . . . . . . . . . . . . . . . . 99, 99Herder, E. . . . . . . . . . . . . . . . . . . . . . . . . . . . . 270Hernández-Goya, C. . . . . . . . . . . . . . . . . . . . 397Hu, C. . . . . . . . . . . . . . . . . . . . . . . . . . . . . . . . . 131Ilarri, S. . . . . . . . . . . . . . . . . . . . . . . . . . . . . . . 161Jelínek, I. . . . . . . . . . . . . . . . . . . . . . . . . . . . . . 107Jeon, D. . . . . . . . . . . . . . . . . . . . . . . . . . . . . . . 313Jeong, Y. . . . . . . . . . . . . . . . . . . . . . . . . . . . . . 313Ji, Y. . . . . . . . . . . . . . . . . . . . . . . . . . . . . .239, 247Jia, L. . . . . . . . . . . . . . . . . . . . . . . . . . . . . . . . . 131Josang, A. . . . . . . . . . . . . . . . . . . . . . . . . . . . . 184Juanes, G. . . . . . . . . . . . . . . . . . . . . . . . . . . . . . 57Kalboussi, A. . . . . . . . . . . . . . . . . . . . . . . . . . 263Kanavos, A. . . . . . . . . . . . . . . . . . . . . . . 231, 231Karagoz, P. . . . . . . . . . . . . . . . . . . . . . . . . . . . 215Karnstedt, M. . . . . . . . . . . . . . . . . . . . . . . . 99, 99Kawase, R. . . . . . . . . . . . . . . . . . . . . . . . . . . . 270Kim, W. . . . . . . . . . . . . . . . . . . . . . . . . . . . . . . 313Kluth, W. . . . . . . . . . . . . . . . . . . . . . . . . . . . . . 149Kolas, D. . . . . . . . . . . . . . . . . . . . . . . . . . . . . . . 33Krejcar, O. . . . . . . . . . . . . . . . . . . . . . . . . . . . .143Krempels, K. . . . . . . . . . . . . . . . . . . . . . . . . . .149Ksentini, N. . . . . . . . . . . . . . . . . . . . . . . . . . . .340Lempesis, E. . . . . . . . . . . . . . . . . . . . . . . . . . . 286Li, L. . . . . . . . . . . . . . . . . . . . . . . . . . . . . . . . . . . 74Li, Y. . . . . . . . . . . . . . . . . . . . . . . . . . . . . 131, 184Liu, X. . . . . . . . . . . . . . . . . . . . . . . . . . . . . . . . 131Mahar, K. . . . . . . . . . . . . . . . . . . . . . . . . . . . . .295Maier, F. . . . . . . . . . . . . . . . . . . . . . . . . . . . . . .371Makris, C. . . . . . . . . . . . . . . . . . . . 223, 231, 286Martínez, P. . . . . . . . . . . . . . . . . . . . . . . . . . . . 115Mattila, A. . . . . . . . . . . . . . . . . . . . . . . . . . . . . 137Mazhoud, O. . . . . . . . . . . . . . . . . . . . . . . . . . . 263Medeiros, C. . . . . . . . . . . . . . . . . . . . . . . . . . . . 49Medina, L. . . . . . . . . . . . . . . . . . . . . . . . . . . . . . 57Mejia-Molina, N. . . . . . . . . . . . . . . . . . . . . . . . 82Mena, E. . . . . . . . . . . . . . . . . . . . . . . . . . . 41, 161
403

AUTHOR INDEX (CONT.)
Micarelli, A. . . . . . . . . . . . . . . . . . . . . . . . . . . 350Mikkonen, T. . . . . . . . . . . . . . . . . . . . . . . . . . 137Mohammadzadeh, H. . . . . . . . . . . . . . . . . . . 335Mohasseb, A. . . . . . . . . . . . . . . . . . . . . . . . . . 295Moreno, L. . . . . . . . . . . . . . . . . . . . . . . . . 65, 115Nart, D. . . . . . . . . . . . . . . . . . . . . . . . . . . . . . . 305Nazemi, A. . . . . . . . . . . . . . . . . . . . . . . . . . . . 335Nunes, B. . . . . . . . . . . . . . . . . . . . . . . . . . . . . . 270Omheni, . . . . . . . . . . . . . . . . . . . . . . . . . . . . . . 263Onal, K. . . . . . . . . . . . . . . . . . . . . . . . . . . . . . . 215Osman, A. . . . . . . . . . . . . . . . . . . . . . . . . . . . . 322Özgöbek, Ö. . . . . . . . . . . . . . . . . . . . . . . . . . . 278Panagopoulos, P. . . . . . . . . . . . . . . . . . . . . . . 223Pavlich-Mariscal, J. . . . . . . . . . . . . . . . . . . . . . 82Peiro, A. . . . . . . . . . . . . . . . . . . . . . . . . . . . . . .161Pérez-Quiñones, M. . . . . . . . . . . . . . . . . . . . . .14Pilato, G. . . . . . . . . . . . . . . . . . . . . . . . . . . . . . 344Po, L. . . . . . . . . . . . . . . . . . . . . . . . . . . . . . . . . 172Pryss, R. . . . . . . . . . . . . . . . . . . . . . . . . . 371, 383Rakhmawati, N. . . . . . . . . . . . . . . . . . . . . . . . . 99Rebedea, T. . . . . . . . . . . . . . . . . . . . . . . . . . . . 255Regazzo, M. . . . . . . . . . . . . . . . . . . . . . . . . . . . 91Reichert, M. . . . . . . . . . . . . . . . . . . . . . . 371, 383Ribeiro, A. . . . . . . . . . . . . . . . . . . . . . . . . . . . .328Rivero-García, A. . . . . . . . . . . . . . . . . . . . . . 397Rodrigues, R. . . . . . . . . . . . . . . . . . . . . . . . . . . 27Rojas-Valduciel, H. . . . . . . . . . . . . . . . . . . . . . 65Roussanaly, A. . . . . . . . . . . . . . . . . . . . . . . . . 205Samsel, C. . . . . . . . . . . . . . . . . . . . . . . . . . . . . 149Sangiorgi, P. . . . . . . . . . . . . . . . . . . . . . . . . . . 344Sansonetti, G. . . . . . . . . . . . . . . . . . . . . . . . . . 350Santanchè, A. . . . . . . . . . . . . . . . . . . . . . . . . . . 49Santos-González, I. . . . . . . . . . . . . . . . . . . . . 397Schickler, M. . . . . . . . . . . . . . . . . . . . . . 371, 383Schobel, J. . . . . . . . . . . . . . . . . . . . . . . . 371, 383Seguran, M. . . . . . . . . . . . . . . . . . . . . . . . . . . .322Seipp, K. . . . . . . . . . . . . . . . . . . . . . . . . . . . . . . . 5Senart, A. . . . . . . . . . . . . . . . . . . . . . . . . . . . . .322Shi, J. . . . . . . . . . . . . . . . . . . . . . . . . . . . . . . . . 131Siehndel, P. . . . . . . . . . . . . . . . . . . . . . . . . . . . 270Silva, C. . . . . . . . . . . . . . . . . . . . . . . . . . . . . . . . 27Sorrentino, S. . . . . . . . . . . . . . . . . . . . . . . . . . 172Souza, R. . . . . . . . . . . . . . . . . . . . . . . . . . . . . . . 27Systä, K. . . . . . . . . . . . . . . . . . . . . . . . . . . . . . 137Tasso, C. . . . . . . . . . . . . . . . . . . . . . . . . . . . . . 305
Tian, N. . . . . . . . . . . . . . . . . . . . . . . . . . . . . . . 184Ticha, S. . . . . . . . . . . . . . . . . . . . . . . . . . . . . . .205Tmar, M. . . . . . . . . . . . . . . . . . . . . . . . . . . . . . 340Tokis, T. . . . . . . . . . . . . . . . . . . . . . . . . . . . . . . 231Valencia, X. . . . . . . . . . . . . . . . . . . . . . . . . . . . . 65Videira, A. . . . . . . . . . . . . . . . . . . . . . . . . . . . . 193Vilar, B. . . . . . . . . . . . . . . . . . . . . . . . . . . . . . . . 49Voutilainen, J. . . . . . . . . . . . . . . . . . . . . . . . . . 137Wang, Z. . . . . . . . . . . . . . . . . . . . . . . . . . . . . . . .74Wiegand, N. . . . . . . . . . . . . . . . . . . . . . . . . . . . 33Wilson, J. . . . . . . . . . . . . . . . . . . . . . . . . . . . . . . 33Xianlei, S. . . . . . . . . . . . . . . . . . . . . . . . . . . . . 247Xu, Y. . . . . . . . . . . . . . . . . . . . . . . . . . . . . . . . . 184Yanes, P. . . . . . . . . . . . . . . . . . . . . . . . . . . . . . . . 57Yang, J. . . . . . . . . . . . . . . . . . . . . . . . . . . 239, 247Yoon, Y. . . . . . . . . . . . . . . . . . . . . . . . . . . . . . . 313Zhang, C. . . . . . . . . . . . . . . . . . . . . . . . . . . . . . 239Zhang, J. . . . . . . . . . . . . . . . . . . . . . . . . . . . . . 131Zhu, Y. . . . . . . . . . . . . . . . . . . . . . . . . . . . . . . . 239
404