
THE SUBSTANTIVE NATURE OF PERFORMANCE VARIABILITY: PREDICTING INTERINDIVIDUAL DIFFERENCES IN...
43
PERSONNEL PSYCHOLOGY 1998.51 THE SUBSTANTIVE NATURE OF PERFORMANCE VARIABILITY: PREDICTING INTERINDIVIDUAL DIFFERENCES IN INTRAINDIVIDUALPERFORMANCE ROBERT E. PLOYHART Michigan State University MILTON D. HAKEL Bowling Green State University The nature of intraindividual performance variability over time, along with individual difference predictors of such variability, was examined using latent growth curve methodology. Quarterly sales performance for a sample of securities analysts (n = 303) was measured at 8 times. Average intraindividual performance approximated a basic ‘‘learning’’ curve, although there were considerable individual differences in each of the latent performance growth parameters. Individual difference predictors from a biodata inventory were moderately related to these latent growth parameters. Theoretical and practical implications of performance variability for personnel selection are also discussed. Questions about the nature of job performance have been investi- gated for decades (Austin & Villanova, 1992). Loosely termed the “cri- terion problem,” several researchers have called for greater understand- ing of criterion measures and better theories of job performance (e.g., Binning & Barrett, 1989; Campbell, McCloy, Oppler, & Sager, 1993; James, 1973; Nagle, 1953; Smith, 1976; Toops, 1944; Wallace, 1965). Despite the fundamental importance of job performance to industrial- organizational (1-0) psychology, relatively little research attention has been directed toward understanding it (Campbell, 1990). However, one issue that has received considerable attention has been the examination of the stability of job performance measures, or what has been termed dynamic criteria (Austin, Villanova, Kane, & Bernardin, 1991; Barrett, Caldwell, & Alexander, 1985; Campbell, Gasser, & Oswald, 1996). Al- though some research has examined whether criteria are dynamic or static (i.e., stable) over time, we still know relatively little about the We thank Neal Schmitt and Alexander von Eye for helpful discussionsabout aspects of this study, and especially Rick DeShon and Lynn McFarland for providing valuable feed- back on earlier drafts of this paper. The help from these individuals is greatly appreciated. Correspondenceand requestsfor reprints should be addressed to Robert Ployhart, De- partment of Psychology, Michigan State University, East Lansing, MI 48824-11 17; ploy- [email protected]. COPYRIGHT Q 1998 PERSONNEL PSYCHOLOGY, INC. 859
Transcript of THE SUBSTANTIVE NATURE OF PERFORMANCE VARIABILITY: PREDICTING INTERINDIVIDUAL DIFFERENCES IN...
PERSONNEL PSYCHOLOGY 1998.51
THE SUBSTANTIVE NATURE OF PERFORMANCE VARIABILITY: PREDICTING INTERINDIVIDUAL DIFFERENCES IN INTRAINDIVIDUAL PERFORMANCE
ROBERT E. PLOYHART Michigan State University
MILTON D. HAKEL Bowling Green State University
The nature of intraindividual performance variability over time, along with individual difference predictors of such variability, was examined using latent growth curve methodology. Quarterly sales performance for a sample of securities analysts (n = 303) was measured at 8 times. Average intraindividual performance approximated a basic ‘‘learning’’ curve, although there were considerable individual differences in each of the latent performance growth parameters. Individual difference predictors from a biodata inventory were moderately related to these latent growth parameters. Theoretical and practical implications of performance variability for personnel selection are also discussed.
Questions about the nature of job performance have been investi- gated for decades (Austin & Villanova, 1992). Loosely termed the “cri- terion problem,” several researchers have called for greater understand- ing of criterion measures and better theories of job performance (e.g., Binning & Barrett, 1989; Campbell, McCloy, Oppler, & Sager, 1993; James, 1973; Nagle, 1953; Smith, 1976; Toops, 1944; Wallace, 1965). Despite the fundamental importance of job performance to industrial- organizational (1-0) psychology, relatively little research attention has been directed toward understanding it (Campbell, 1990). However, one issue that has received considerable attention has been the examination of the stability of job performance measures, or what has been termed dynamic criteria (Austin, Villanova, Kane, & Bernardin, 1991; Barrett, Caldwell, & Alexander, 1985; Campbell, Gasser, & Oswald, 1996). Al- though some research has examined whether criteria are dynamic or static (i.e., stable) over time, we still know relatively little about the
We thank Neal Schmitt and Alexander von Eye for helpful discussions about aspects of this study, and especially Rick DeShon and Lynn McFarland for providing valuable feed- back on earlier drafts of this paper. The help from these individuals is greatly appreciated.
Correspondence and requests for reprints should be addressed to Robert Ployhart, De- partment of Psychology, Michigan State University, East Lansing, MI 48824-11 17; ploy- [email protected].
COPYRIGHT Q 1998 PERSONNEL PSYCHOLOGY, INC.
859
860 PERSONNEL PSYCHOLOGY
nature of criterion change over time, the latent nature of performance variability, and the implications of this variability for predictive relation- ships.
This study examines each of these questions for the job of securities analyst: (a) is performance dynamic or static, (b) if performance is dy- namic, what is the form of intraindividual performance over time (i.e., can it be modeled), and (c) are traditional predictor constructs related to interindividual differences in intraindividual performance? To an- swer these questions we use an integrated latent growth curve (Willett & Sayer, 1994) and individual growth curve (e.g., Hofmann, Jacobs, & Baratta, 1993; Hofmann, Jacobs, & Gerras, 1992; Rogosa, 1995; Rogosa, Brandt, & Zimowski, 1982) approach. Such a technique provides a flex- ible and unified framework for the study of interindividual differences in intraindividual performance.
Controversy and Research on the Stability of Criteria
Despite long-standing conceptions about the dynamic nature of cri- teria, i t has only been within the last 20 years that the question of stability has been critically investigated. A critique by Barrett et al. (1985) sug- gested there was little empirical data to show that criteria are dynamic. By examining research on dynamic criteria as it had been conceptualized (i.e., changes in average group criterion measures over time, changes in validity over time, and changes in rank order on criterion measures over time), they concluded that criterion unreliability and range restric- tion were the most likely reasons for criterion instability. Their critique spawned a series of studies to address the dynamic criteria question more directly (e.g., Deadrick & Madigan, 1990; Hanges, Schneider, & Niles, 1990; Henry & H u h , 1987; H u h , Henry, & Noon, 1990; Hofmann et al., 1992, Hofmann et al., 1993). Most of these studies concluded that cri- teria are dynamic, which in turn created further controversy (e.g., Acker- man, 1989; Barrett & Alexander, 1989; but see also Austin, Humphreys, & H u h , 1989; Henry & Hulin, 1989). This debate has been detailed elsewhere and will not be described here (see Austin & Villanova, 1992; Austin et al., 1991).
Given the theoretical and practical implications of dynamic criteria, it is not surprising that such a debate ensued. The notion that criteria are dynamic presents several difficulties for applied researchers. For example, if the rank-order of individuals’ criterion measures changes over time, individuals who are perhaps high-performing initially may be low-performing later. If rank-orders change on criterion measures rela- tive to predictors, predictive relationships will not be temporally invari- ant, thus requiring continued re-assessment of validity (e.g., Wernimont
PLOYHART AND HAKEL 861
& Campbell, 1968). Finally, temporally unstable criteria make already controversial utility estimates that much more questionable (e.g., Henry & Hulin, 1987; H u h et al., 1990 ).
Although some debate still exists, the published literature would sug- gest evidence for the existence of dynamic criteria. Conceptually, Mur- phy (1989) has provided a model for the instability of job performance (and thus criteria). Drawing on the work of Ackerman (1987), Murphy noted how jobs may be characterized by transition stages and mainte- nance stages. Transition stages occur when the individual’s task is novel, whereas maintenance stages occur when the task becomes automatized. Murphy suggests that cognitive ability should be most predictive dur- ing transition stages but less so during maintenance stages; on the other hand, dispositional measures should be more predictive during mainte- nance stages than transition stages. This reasoning is consistent with re- cent theoretical work on expertise ( e g , Ericsson & Smith, 1991) and with other research on changing job or ability models of task perfor- mance and work behavior (e.g., Ackerman, 1986,1987; Alvares & H u h , 1972, 1973; Fleishman, 1957).
Empirical evidence has also mounted in favor of dynamic criteria. For example, Deadrick and Madigan (1990), Henry and Hulin (1987), Hofmann et al. (1992, 1993), and Hulin et al. (1990) have all found evi- dence indicating that the rank-order correlation of individuals on crite- rion measures changes with time. Most of these studies find a simplex pattern (e.g., Guttman, 1955; Humphreys, 1960) of criterion intercor- relations, which indicates that measures closer in time (e.g., time T and T+1) are more highly correlated than measures more distant (e.g., time T and T+5). The simplex pattern has been found with different types of jobs and settings: sewing machine operators (Deadrick & Madigan, 1990), baseball players (Henry & Hulin, 1987; Hofmann et al., 1992), and insurance salespersons (Hofmann et al., 1993). Hulin et al. (1990) describes several studies that demonstrate criteria are dynamic, ranging from short time intervals to several years. However, there have been a few studies that find criteria are stable. Hanges et al. (1990) did find gen- eral support that teacher ratings were stable, although it is not certain if such ratings are sensitive enough to capture change (e.g., Epstein, 1980). In a similar fashion, Schmidt, Hunter, Outerbridge, and Goff (1988) ex- amined top and bottom scoring individuals and found that each respec- tive group’s criterion measures did not converge over 5 years time, in- dicating considerable stability. The cross-sectional nature of their study weakens these findings, however. Thus, to date most studies find that criteria are dynamic.
However, the fact that most studies find a simplex pattern of criterion intercorrelations provides only weak support for criterion dynamism and
862 PERSONNEL PSYCHOLOGY
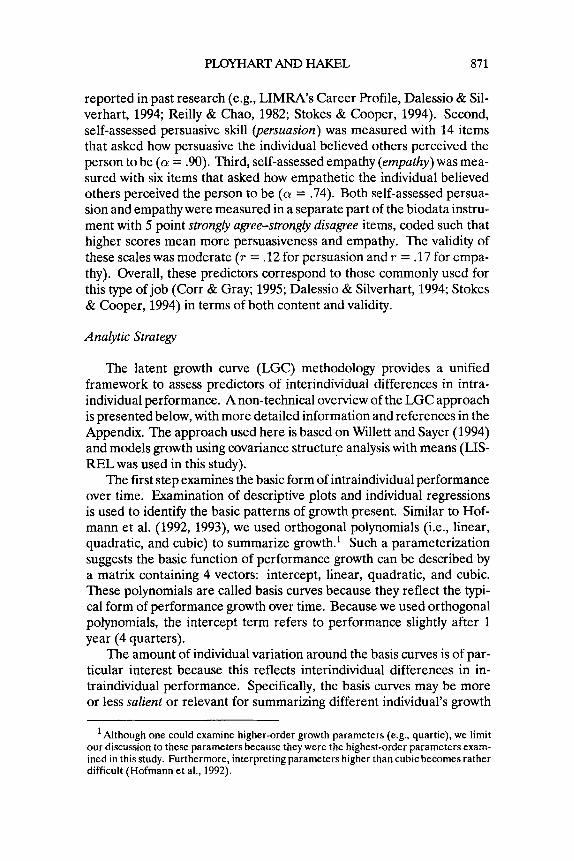
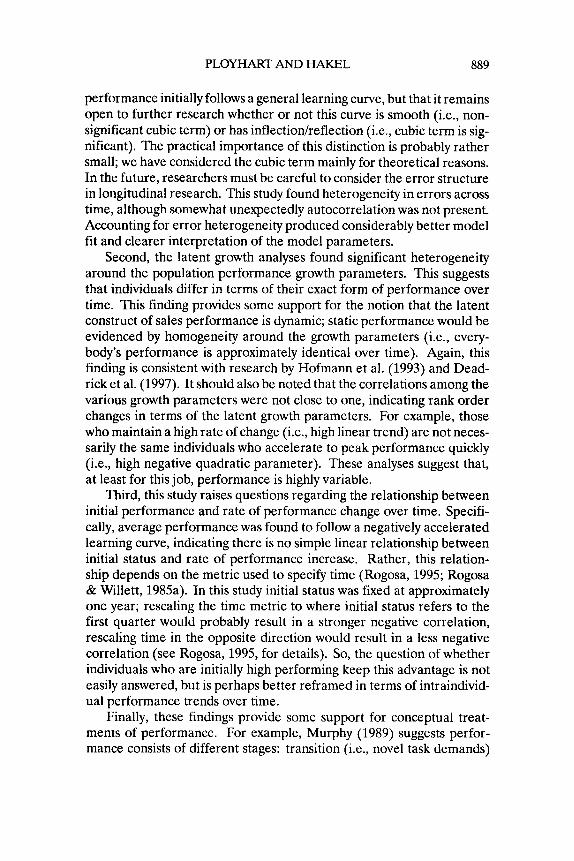
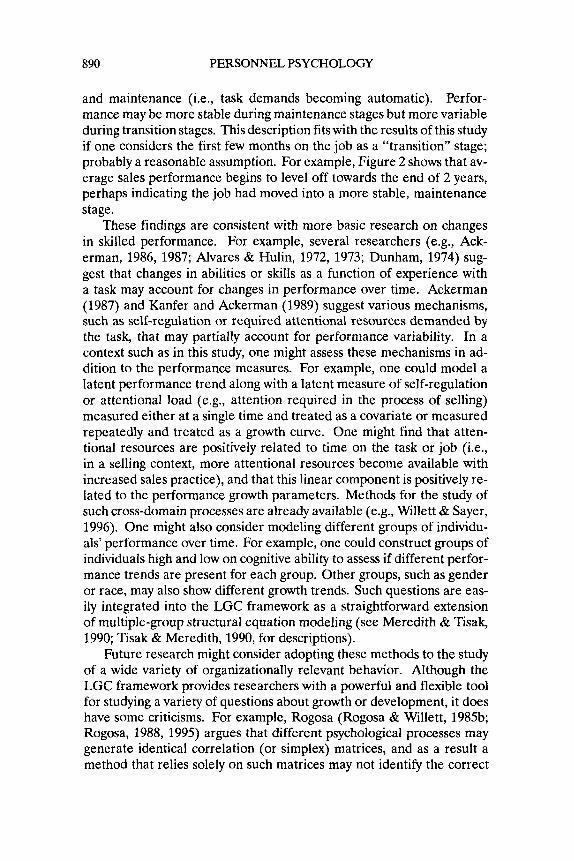
tells us little about the nature of intraindividual change in either the cri- terion measure or the latent performance construct (Rogosa, 1988,1995; Rogosa & Willett, 1985b). For example, consider Figure 1. In Figure la , maintenance of rank orders says nothing about how individuals change over time, as some individuals might start very high with a flat trend over time, whereas others start low but nearly catch up. In Figure lb , rank orders change but the form of change is now quadratic. Such differences may be of theoretical interest in that they suggest different people have different types of development, and may be of practical interest in that they require different types of predictor constructs or that (as in Figure la) it makes little difference over time who is selected. Changing rank orders may be due to a variety of factors such as changes in the job or random fluctuations (e.g., Barrett et al., 1985; Murphy, 1989). As Hof- mann et al. (1993) note:
Given that the real question regarding dynamic criteria has to d o with change, and interindividual differences in intraindividual change, one must adopt methodological tools appropriate for investigating these types of questions (p. 196).
By examining only correlations one does not know the form or nature of change over time, and changes in absolute scores (e.g., increasing or decreasing scores) cannot be identified. What is needed is a methodol- ogy that directly assesses questions of intraindividual change (Rogosa et al., 1982). Several researchers (e.g., Austin et al., 1991; Austin & Vil- lanova, 1992; Hofmann et al., 1992; 1993) have suggested an individual growth (performance) curve approach is required to fully understand the nature of criterion and performance variability over time. Such an approach assesses not only changes in rank order but also changes in absolute performance (i.e., increasing or decreasing) over time.
Modeling Intraindividual Per$ormance Varia bility
Developing models of intraindividual change (i.c., change within an individual over time), and interindividual differences in such change, re- quires a method that explicitly analyzes within-person change; this is the focus of the individual growth curve methodology (Rao, 1958; Rogosa et al., 1982). This approach considers the individual over time as the basic unit of analysis. That is, an individual’s growth (i.c., criterion measures or latent performance trend over time) is examined. Such an approach avoids the possibly erroneous conclusions based solely on analysis of the group means at each time period (Estes, 1956; Tucker, 1958,1966). The individual growth curve approach allows one to “compare the mean curve, not the mean of the data” (Thissen & Bock, 1990, p. 292).

PLOYHART AND HAKEL
1 2 3 4 5
Time
Figure la: Example of Perfect Stability With Mean Change
~~~
1 2 3 4 5
Time
Figure Ib: Example of Moderate Correlation With Quadratic Growth
863
864 PERSONNEL PSYCHOLOGY
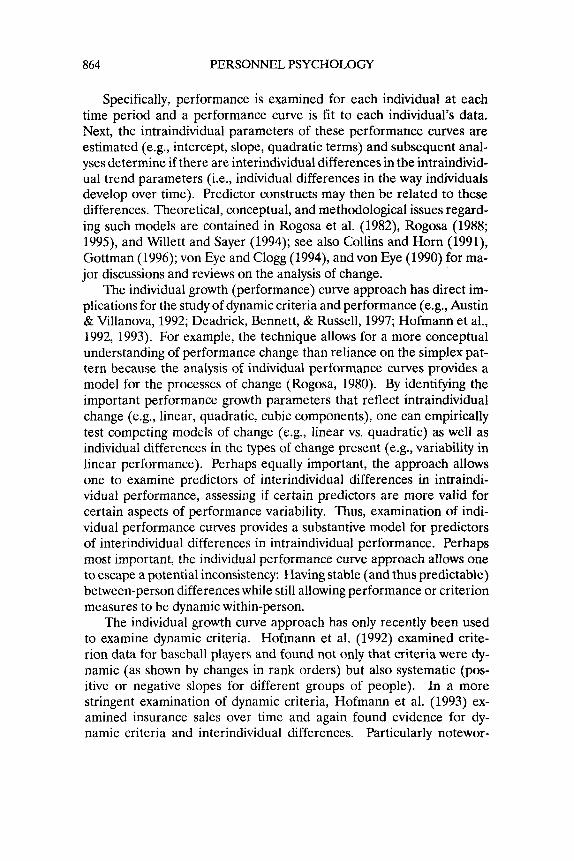
Specifically, performance is examined for each individual at each time period and a performance curve is fit to each individual’s data. Next, the intraindividual parameters of these performance curves are estimated (e.g., intercept, slope, quadratic terms) and subsequent anal- yses determine if there are interindividual differences in the intraindivid- ual trend parameters (i.e., individual differences in the way individuals develop over time). Predictor constructs may then be related to these differences. Theoretical, conceptual, and methodological issues regard- ing such models are contained in Rogosa et al. (1982), Rogosa (1988; 1995), and Willett and Sayer (1994); see also Collins and Horn (1991), Gottman (1996); von Eye and Clogg (1994), and von Eye (1990) for ma- jor discussions and reviews on the analysis of change.
The individual growth (performance) curve approach has direct im- plications for the study of dynamic criteria and performance (e.g., Austin & Villanova, 1992; Deadrick, Bennett, & Russell, 1997; Hofmann et al., 1992, 1993). For example, the technique allows for a more conceptual understanding of performance change than reliance on the simplex pat- tern because the analysis of individual performance curves provides a model for the processes of change (Rogosa, 1980). By identifying the important performance growth parameters that reflect intraindividual change (e.g., linear, quadratic, cubic components), one can empirically test competing models of change (e.g., linear vs. quadratic) as well as individual differences in the types of change present (e.g., variability in linear performance). Perhaps equally important, the approach allows one to examine predictors of interindividual differences in intraindi- vidual performance, assessing if certain predictors are more valid for certain aspects of performance variability. Thus, examination of indi- vidual performance curves provides a substantive model for predictors of interindividual differences in intraindividual performance. Perhaps most important, the individual performance curve approach allows one to escape a potential inconsistency: Having stable (and thus predictable) between-person differences while still allowing performance or criterion measures to be dynamic within-person.
The individual growth curve approach has only recently been used to examine dynamic criteria. Hofmann et al. (1992) examined crite- rion data for baseball players and found not only that criteria were dy- namic (as shown by changes in rank orders) but also systematic (pos- itive or negative slopes for different groups of people). In a more stringent examination of dynamic criteria, Hofmann et al. (1993) ex- amined insurance sales over time and again found evidence for dy- namic criteria and interindividual differences. Particularly notewor-

PLOYHART AND HAKEL 865
thy was the finding of both linear and quadratic criterion trends for dif- ferent individuals. Finally, Deadrick et al. (1997) found significant vari- ability around a linear trend for sewing machine production. Together, these studies show not only that criteria are dynamic, but also that the parameters of criterion variability (e.g., intercept, linear, and quadratic components in the Hofmann et al., 1993 study) are substantively interest- ing (i.e., they provide information about how individual criterion mea- sures change over time).
Although these studies have demonstrated that individual perfor- mance changes are meaningful, little is known about how this perfor- mance variability might influence predictive relationships in a growth curve framework. Hofmann et al. (1993) found that age was unrelated to performance variability and the month of starting employment yielded mixed results. Deadrick et al. (1997) found modest relations between cognitive ability, psychomotor ability, and experience predictors and growth in sewing production. Although both studies provide a valuable examination of how predictors might relate to performance variability, both studies have limitations. First, the short time span (24 weeks) and relatively physical nature of the sewing operator job in the Deadrick et al. study may not fully capture how performance variability influences predictive relationships over longer periods of time in more cognitively- demanding jobs. Second, both studies used a traditional error structure in the modeling of intraindividual performance, which may not be ten- able in many longitudinal designs (e.g., autocorrelation; Willett & Sayer, 1994). Neglecting factors such as autocorrelation or heterogeneity will bias the significance tests (e.g., Cohen & Cohen, 1983). This study ad- dresses these questions by adopting a latent growth curve approach (e.g., McArdle & Epstein, 1987; Meredith & Tisak, 1990; Tisak & Meredith, 1990; Willett & Sayer, 1994) to study predictors of interindividual dif- ferences in intraindividual sales performance. This approach extends the individual growth curve method by focusing on predictors of latent intraindividual performance variability, and also allows one to model the error terms explicitly for more accurate significance tests. Note that this method can also assess each of the traditional ways of examining dynamic criteria (i.e., changing group criterion measures, changing va- lidity, and changing criterion intercorrelations; Barrett et al., 1985). The latent growth curve technique is developed more fully in the Appendix, but first an examination of the sales performance construct and interindi- vidual difference predictors of sales performance is considered.
866 PERSONNEL PSYCHOLOGY
Present Study: Individual Differences and the Stability of Sales Perjormance
This study examines the intraindividual variability of sales commis- sions (i.e., gross sales dollars) for securities salespersons over 8 con- secutive quarters (i.e., 2 years), and how well a biodata predictor and personality-type measures can predict interindividual differences in in- traindividual performance growth over time. Note that this paper does not advocate one side or the other in the dynamic criteria debate, but rather attempts to better understand criteria and latent performance variability (Wallace, 1965). Much like other similar jobs (e.g., Corr & Gray, 1995; Dalessio & Silverhart, 1994), the nature of the salesperson job in the organization we had access to is such that the first few years of employment are marked by considerable turnover, variability, and change. Individuals hired into this job are essentially left to their own abilities to prospect new clients and sales. These jobs often consist of re- peated rejections, which only add to the stress created by having a large percentage of salary being based on commissions. These demands are evident in the high turnover rate among insurance salespersons (as high as 80% over two years; Corr & Gray, 1995). Because of the demands of generating new clients and being able to handle repeated rejections, dispositional types of predictors (e.g., personality) are often used (Corr & Gray, 1995). In general, dispositional predictors have been suggested (e.g., Murphy, 1996) as necessary to adequately cover many performance domains.
In this study the manifest criterion measures of gross quarterly sales commissions (in dollars) were used to assess the latent sales performance construct over time (see Analytic Strategies section and Appendix). Us- ing the latent growth curve methodology, we could assess the nature and variability of the latent performance growth parameters (i.e., intercept, linear, quadratic, cubic). We are aware of no published research that has examined performance in a latent growth curve framework, which provides for the assessment of latent constructs and the ability to model the error terms directly. In addition, we sought to identify factors that might predict the latent performance growth parameters. This orga- nization had used a biodata inventory for many years, allowing us ac- cess to different measures of background characteristics (i.e., a compos- ite measure of income-related variables) and personality-type variables (i.e., self-assessed persuasive ability and empathy). How these measures relate to past research on sales performance and predictors of sales per- formance is discussed next.
Past research on sales performance. Little research on sales perfor- mance has been longitudinal. However, one very relevant study that
PLOYHART AND HAKEL 867
examined sales criteria is that by Hofmann et al. (1993). As mentioned earlier, the quarterly sales of insurance salespersons was analyzed us- ing an individual growth curve approach (i.e., hierarchical linear mod- eling and regression). Both a linear and quadratic trend were found, suggesting the mean quarterly sales followed a negatively accelerated trend or a “learning curve.” They also found considerable interindivid- ual differences in intraindividual change. Overall, their study suggests that intraindividual change was reliable and there was interindividual variability in the types of change present.
The prediction of sales pe~ormance. Not surprisingly, there is more research on predictors of sales performance. As mentioned earlier, the demands of sales jobs (e.g., handling rejection) require individuals with particular dispositional qualities, thus dispositional types of predictors are often used (e.g., Corr & Gray, 1995). In particular, biodata inven- tories are often used to predict sales success and generally have high validities (T’S FX .30-.40) with sales criteria (Mumford & Owens, 1987; Owens, 1976; Reilly & Chao, 1982; Schmitt, Gooding, Noe, & Kirsch, 1984; Stokes & Cooper, 1994). Constructs typically assessed with bio- data include empathy, interpersonal skills, communication ability, goals, time management, and resilience (e.g., Corr & Gray, 1995; Dalessio & Silverhart, 1994; Stokes & Cooper, 1994); these constructs help in prospecting new clients (e.g., Corr & Gray, 1995). Other measures such as income or career expectations, past income, or general intelligence are also commonly used (e.g., Corr & Gray, 1995; Dalessio & Silver- hart, 1994; Stokes & Cooper, 1994). Note, however, that these studies are typically cross-sectional, so little is known how valid biodata predic- tors are across different time periods for the same individuals.
In this study, we examined the extent to which the predictor mea- sures used by this organization accounted for interindividual differences in intraindividual performance. We also examined the stability of the predictors’ validity with the performance measures over time. The pre- dictor constructs used in this study were originally derived from a job analysis, had been used by the organization for many years, and are con- sistent with past research examining predictors of sales performance. First, the Past Sales Commission and Sales Potential (PSCSP) measure assesses salary expectations and past earnings and is similar to other bio- data predictors used for selecting insurance salespersons (e.g., Brown, 1978; Brown, Stout, Dalessio, & Crosby, 1988; Dalessio & Silverhart, 1994). In particular, Tanofslq, Shepps, and O’Neil (1969) found that prior income was predictive of insurance sales. The PSCSP is also sim- ilar to the salary expectations and past work history dimensions of the Career Profile developed by LIMRA, which has been used successfully
868 PERSONNEL PSYCHOLOGY
for many years in selecting insurance salespersons (e.g., Dalessio & Sil- verhart, 1994; Thayer, 1977). In addition to being derived from a job analysis and used by this organization for many years (i.e., demonstrated predictive validity, see Measures section), the PSCSP is consistent with past research using biodata measures to predict sales success.
The other two predictors, persuasion and empathy, were based on separate self-report portions of the biodata form. Both scales tap as- pects of the interpersonal nature of insurance sales and appear to be re- quired for working with clients and understanding their needs (e.g., Corr & Gray, 1995). For example, the job analysis performed in this company suggested that persuasion was an important skill for both making con- tacts and closing a final sale. In addition, empathy has been described as an important skill in understanding the needs of clients and is included on some existing predictors of sales performance (e.g., Poppleton and Allen Sales Aptitude Test; see Corr & Gray, 1995). Both of these mea- sures used in this study were self-reports, but had been used effectively by this organization in the past (see Measures section) and are similar to constructs measured in past research (Corr & Gray, 1995; Dalessio & Silverhart, 1994; Stokes & Cooper, 1994).
To summarize, this study examines predictors (i.e., PSCSP, self- assessed persuasion, and self-assessed empathy) of interindividual dif- ferences in intraindividual sales performance. We seek to answer three main questions. First, are the manifest criterion measures of perfor- mance dynamic or static? Second, if the manifest measures are dynamic, what is the latent nature, form, and interindividual variability of intrain- dividual sales performance? Finally, do traditional predictor constructs relate to latent interindividual differences in intraindividual sales per- formance? To examine these processes we use the latent growth curve methodology (e.g., Willett & Sayer, 1994) to examine the latent perfor- mance growth and predictor constructs.
Method
Participants
Participants were hired by a national securities brokerage before 1994, and performance data between 1994 and 1996 (N = 2,113) was ob- tained. However, many in the group were missing considerable criterion data (e.g., had only 1 month of performance); accordingly, we attempted to maximize the number of months of data relative to the sample size. Our criteria for inclusion included having 8 quarters of complete perfor- mance data (see Measures section) and complete predictor data. Eight quarters was the best compromise between sample size and number of
PLOYHART AND HAKEL 869
quarters. We also eliminated five individuals who had extreme criterion scores ( f 3 SD) on the majority of the quarters. Including these individ- uals would have had a negative influence on the properties of the crite- rion distributions (e.g., skewness) and resulted in inaccurate parameter estimates (i.e., biased upwards). The final sample (n = 303) was mainly Caucasian (93.7%), male (92.1%), and young (M = 34). The charac- teristics of this sample were nearly identical to the full sample: 92.5% Caucasian, 87.6% male, and mean age of 33. Due to the small num- ber of minority and female participants, we did not examine subgroup differences.
Measures
Criterion. The criterion measure was originally composed of monthly gross sales commissions (in dollars). As with most longitudinal designs, this study had to contend with missing data. However, due to the nature of the criterion there were also problems with normality. Specifically, examination of the univariate and multivariate descriptive statistics for each month found a strong positive skew to the measures. This was not surprising, as there is a lower limit to the criterion (i.e., cannot have neg- ative sales) but no upper limit. Most individuals had small commissions during the first few months, but soon after began to increase rapidly and fan apart. There were also wide variations from month to month; in this job it was possible for individuals to have a phenomenal month with one large sale and then to fall back into a more average commission the next month (the opposite was also possible, where individuals would have one extremely poor month). Consequently, the data were char- acterized by strong skewness, kurtosis, and considerable “shock” from month to month.
Clearly such data violate the multivariate normality assumption needed to perform our analyses (as well as univariate normality). To make the data interpretable we performed a square root transforma- tion on each monthly performance measure, as recommended by several methodologists (e.g., Schumaker & Lomax, 1996; Tabachnik & Fidell, 1996; West, Finch, & Curran, 1995). This type of transformation elim- inates the long tail of the skewed distribution, and although this trans- formation is nonlinear, there are no rank order changes between the raw and transformed data. Examination of the descriptive plots found that this transformation approximately normalized the uni- and multi- variate distributions to more acceptable levels. However, there were still problems of small amounts of missing data and occasional “shocks” from month to month. Similar to Hofmann et al. (1993), we converted the monthly data to quarterly data (i.e., first quarter equal to average of
870 PERSONNEL PSYCHOLOGY
first 3 months, etc.). This type of averaging has also been performed by Hofmann et al. (1992) and Deadrick and Madigan (1990), and is similar to what is known as “detrending” with time-series methods (e.g., Chat- field, 1975). Finally, the quarterly averaging allowed more subjects to be included because missing data (although random and relatively minor) were sometimes present in a given month; the result of the averaging was that no missing data were present for any individuals (note that we had not set missing data as equal to zero, as it was possible for an individual to have zero sales dollars for a particular month). All analyses reported in this study are based on the transformed data.
One final note is that although the transformations used in this study were necessary and statistically recommended (e.g., Schumaker & Lo- max, 1996; Tabachnik & Fidell, 1996; West et al., 1995), one must assess what they mean substantively. We first compared (e.g., descriptive plots) the transformed and raw data to ensure the transformation did not arti- factually influence the types of trends present; these analyses suggested it did not. We then examined plots of performance over time for ev- ery individual’s raw and transformed data. These plots showed that the effect of the square root transformation was to bring extremely high per- formers’ trend lines closer to the rest of the group. However, the form of each person’s trend line essentially did not change. Therefore, the substantive meaning of the square root transformation is that the eleva- tion between individuals’ trend lines is smaller, but their relative rank orders and form of the trend remains the same as the raw data. This is important, as we are examining individual growth curves. The substan- tive meaning of averaging the monthly commissions to quarterly sales is that there are smaller fluctuations from time period to time period (i.e., a smoother trend), although again individuals’ relative rank orders re- main essentially the same as the raw data. Accordingly, the raw data and transformed data have substantively the same interpretation.
Predictor constructs. The biographical inventory was derived from a job analysis and had been used by this organization for many years. It was based on a partly empirical, partly rational scoring key and contained questions about past experiences, activities, and preferences. Unfortu- nately, for most of the scales or items there was missing data, so we used the three scales that had complete data for the 303 participants. First, past sales commission and salary potential (PSCSP) assessed individuals’ self-reported past salary and future expected earnings. The PSCSP uses an empirical scoring algorithm, and the final composite is then converted to T-scores. This instrument had demonstrated acceptable validity (T = .34) in the past, being keyed on the average of 18 months sales com- mission. The content and validity of the PSCSP is similar to measures
PLOYHART AND HAKEL 871
reported in past research (e.g., LIMRA's Career Profile, Dalessio & Sil- verhart, 1994; Reilly & Chao, 1982; Stokes & Cooper, 1994). Second, self-assessed persuasive skill (persuasion) was measured with 14 items that asked how persuasive the individual believed others perceived the person to be (a = .90). Third, self-assessed empathy (empathy) was mea- sured with six items that asked how empathetic the individual believed others perceived the person to be (a = .74). Both self-assessed persua- sion and empathy were measured in a separate part of the biodata instru- ment with 5 point strongly agree-strongly disagree items, coded such that higher scores mean more persuasiveness and empathy. The validity of these scales was moderate (T = .12 for persuasion and T = .17 for empa- thy). Overall, these predictors correspond to those commonly used for this type of job (Corr & Gray; 1995; Dalessio & Silverhart, 1994; Stokes & Cooper, 1994) in terms of both content and validity.
Analytic Strategy
The latent growth curve (LGC) methodology provides a unified framework to assess predictors of interindividual differences in intra- individual performance. A non-technical overview of the LGC approach is presented below, with more detailed information and references in the Appendix. The approach used here is based on Willett and Sayer (1994) and models growth using covariance structure analysis with means (LIS- REL was used in this study).
The first step examines the basic form of intraindividual performance over time. Examination of descriptive plots and individual regressions is used to identify the basic patterns of growth present. Similar to Hof- mann et al. (1992, 1993), we used orthogonal polynomials (i.e., linear, quadratic, and cubic) to summarize gr0wth.l Such a parameterization suggests the basic function of performance growth can be described by a matrix containing 4 vectors: intercept, linear, quadratic, and cubic. These polynomials are called basis curves because they reflect the typi- cal form of performance growth over time. Because we used orthogonal polynomials, the intercept term refers to performance slightly after 1 year (4 quarters).
The amount of individual variation around the basis curves is of par- ticular interest because this reflects interindividual differences in in- traindividual performance. Specifically, the basis curves may be more or less salient or relevant for summarizing different individual's growth
'Although one could examine higher-order growth parameters (e.g., quartic), we limit our discussion to these parameters because they were the highest-order parameters exam- ined in this study. Furthermore, interpreting parameters higher than cubic becomes rather difficult (Hofmann et al., 1992).
872 PERSONNEL PSYCHOLOGY
(e.g., the linear component captures one individual’s growth but a quad- ratic component is required for another’s). The LGC method esti- mates the saliences for each individual’s growth, and provides the mean and variance for each latent growth parameter (i.e., intercept, linear, quadratic, cubic) across individuals. As performance growth is summa- rized in these parameters (Deadrick et al., 1997; Hofmann, 1992,1993), it is important that they are interpreted correctly. First, the intercept parameter refers to the amount of performance when the linear trend is equal to zero. As noted above, the intercept term refers to perfor- mance shortly after 4 quarters. Second, the linear parameter refers to the amount or rate of performance growth given a change from time T to T+1. A linear form of growth is shown in Figure la . Assessing a separate linear performance trend for each person would provide the mean (i.e., average intercept and rate of change) and variance (indicating individual differences) of the performance growth parameters. Note that a positive (negative) mean for the linear parameter suggests increasing (decreas- ing) performance over time. Third, the quadratic parameter refers to the amount of curvature or bend in the linear trend over time. A simple lin- ear trend would not accurately capture the type of growth present in Fig- ure l b a because the individual trajectories are curved. In this instance the quadratic term represents acceleration (above a straight linear line) to some asymptotic level. The mean and variance of the quadratic pa- rameter may be interpreted respectively as the average amount and in- dividual variation in acceleration (i.e., bend or curvature above a linear trend) over time. Holding the linear parameter positive, negative values for the quadratic parameter indicate negative acceleration (as in a learn- ing curve, see Figure lb), positive values will indicate positive acceler- ation, and values close to zero will indicate little curvature (i.e., linear trend). More negative (positive) values indicate faster (slower) accel- eration to asymptote. Fourth, the cubic parameter refers to the degree of inflection/reflection in the performance trend over time beyond that represented by the quadratic term. If the trend is not a smooth and mono- tonically increasing/decreasing function, a cubic term will often provide a better fit. For example, if the data manifest an “S” shaped curve, a quadratic term will not be adequate and a cubic term will be required. Unfortunately, the description of the cubic term is dependent on the nature of the linear and quadratic components (i.e., whether they are positive or negative), thus it is not easy to demonstrate in abstract terms what a positive or negative cubic component refers to. However, when interpreting the results of this study we offer substantive interpretations of the cubic term.
The second step in LGC analysis is to examine and model the error structure for accurate significance tests (e.g., Willett & Sayer, 1994). The
PLOYHART AND HAKEL 873
final step involves predicting the latent growth parameters by regressing the latent growth parameters on the predictor constructs (i.e., PSCSP, self-assessed persuasion, self-assessed empathy). This analysis directly addresses the question of how well traditional predictors relate to indi- vidual differences in intraindividual performance. Finally, we provide power estimates for tests of close fit in all LGC analyses using a method based on MacCallum, Browne, and Sugawara (1996).
Results
Are Sales Criteria Dynamic or Static?
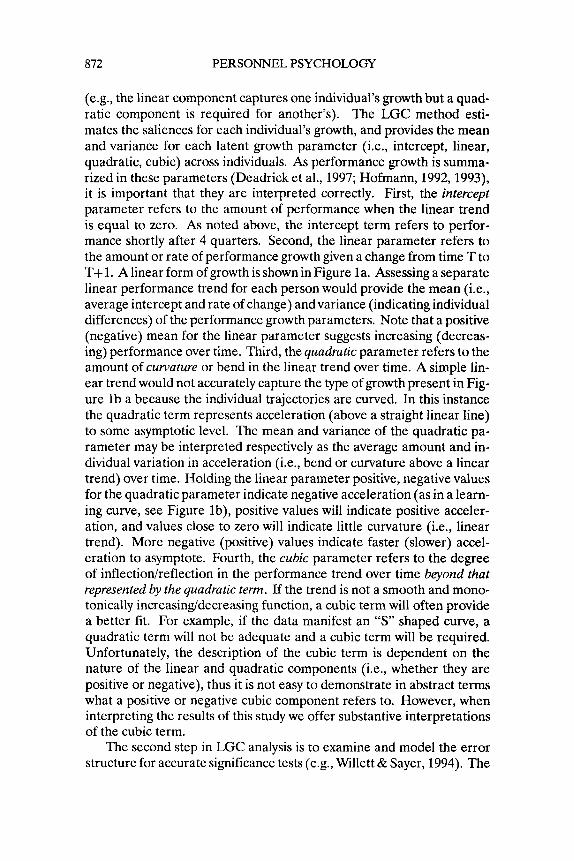
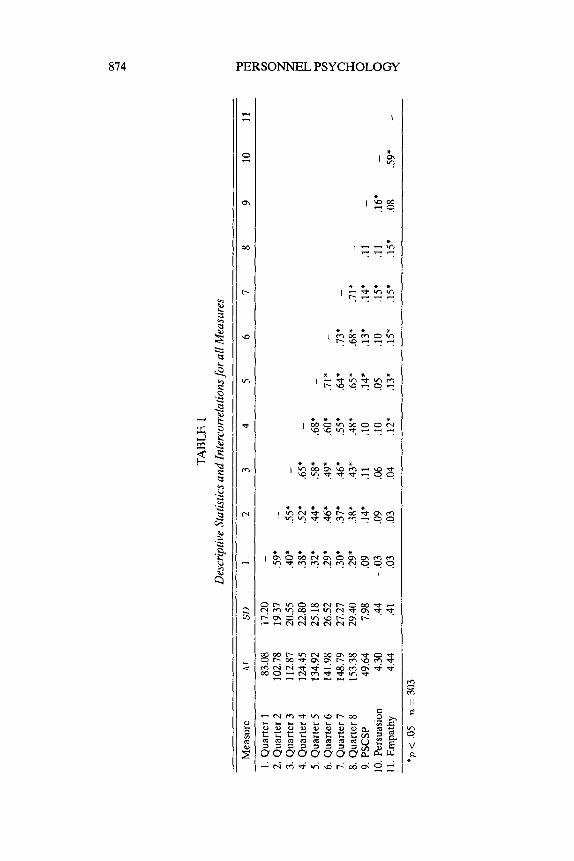
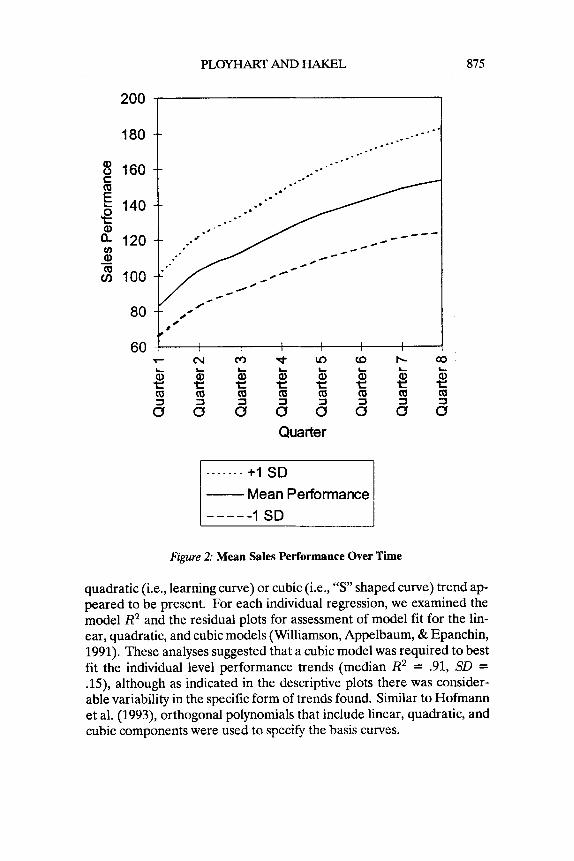
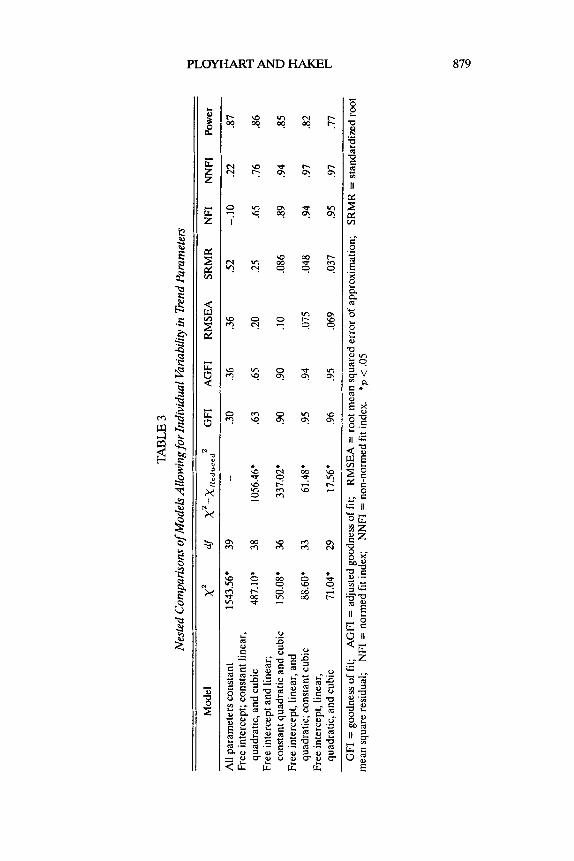
Table 1 shows the descriptive statistics for the measures. Notice the increasing mean performance over time, as well as the increasing stan- dard deviations. As shown in Figure 2, it appears the data follow a nega- tively accelerated curve (similar to a learning curve). It also appears that there is considerable and increasing variance around this average perfor- mance curve, indicating possible heterogeneity in errors. Our first re- search question asked whether sales criteria are dynamic or static. This question might be examined in terms of changes in criterion rank order correlations or changes in predictive relationships (Barrett et al., 1985). Table 1 shows the criterion measures exhibit a nearly perfect simplex pattern, supporting the presence of dynamic criteria as it has been tradi- tionally studied in 1 - 0 psychology. However, changes in predictive rela- tionships provides less conclusive evidence. Although it appears that the predictor-criterion relationships vary across time, these variations are within the range one might expect by chance (i.e., the variability in va- lidities falls within a 95% confidence interval). Thus, these data suggest that although the criterion measures appear to be dynamic (i.e., changing rank orders over time), this has a questionable influence on predictive relationships.
We proceeded to examine the nature of intraindividual performance over time. These analyses would provide the form for the basis curves to be used in the LGC approach. As Hofmann et al. (1993) had found a “learning curve” for sales performance over time, we expected a sim- ilar finding here. Descriptive plots of individual sales over time and individual-level regressions (i.e., each person’s performance vector re- gressed on the matrix of orthogonal polynomials) were computed, Again, this step is critical because these analyses describe the basic form of in- traindividual change over time (Burchinal & Appelbaum, 1991; Wil- lett & Sayer, 1994). The descriptive plots showed there was substan- tial variability in the exact type of trend found, although in general a
TABL
E 1
Des
crip
tive
Stat
istic
s and
Inte
rcor
rela
tions
for a
ll M
easu
res
3 P z 7.
Qua
rter
7
148.
19
27.2
7 .3
0*
.37*
.4
6*
.55*
.6
4*
.13*
-
s 8.
Qua
rter
8
153.
38
29.4
0 .2
9*
.38*
.4
3*
.48*
.6
5*
.68*
.7
1*
- rl @ 2
10
I1
Mea
sure
i\
I SD
1
2 3
4 5
6 7
8 9
1. Q
uart
er 1
83
.08
17.2
0 -
2. Q
uart
er 2
10
2.78
19
.37
.59*
-
3. Q
uart
er 3
11
2.87
20
.55
.40*
.5
5*
- 4.
Qua
rter
4
124.
45
22.8
0 .3
8*
.52*
.6
5*
-
5. Q
uart
er 5
13
4.92
25
.18
.32*
.4
4*
.58*
.68*
6.
Qua
rter
6
141.
98
26.5
2 .2
9*
.46*
.4
9*
.60*
.7
1*
- -
9. P
SCSP
49
.64
1.98
.0
9 .1
4*
.I1
.10
.14*
.1
3*
.14*
.I
1 -
10. P
ersu
asio
n 4.
30
.44
-.03
.09
.06
.I0
.05
.I0
,158
.l
I .1
6*
-
0
11. E
mpa
thy
4.44
.4
1 .0
3 .0
3 .0
4 .1
2*
.13*
.1
5*
.15*
.1
5*
.08
.59*
-
*p
< .0
5 n
=3
03
PLOYHART AND HAKEL
80
875
,- @
200
180
8 160
140
a 120
c a
$ v) Q) - 2 100
60 r
I I t 1 I I I I I I I I
b 5 6
5 lz a 6 Quarter
b lz a 6
- - . . . . . +1 SD Mean Performance 1 SD - - - - -
Figure 2: Mean Sales Performance Over Time
quadratic (i.e., learning curve) or cubic (i.e., “S” shaped curve) trend ap- peared to be present. For each individual regression, we examined the model R2 and the residual plots for assessment of model fit for the lin- ear, quadratic, and cubic models (Williamson, Appelbaum, & Epanchin, 1991). These analyses suggested that a cubic model was required to best fit the individual level performance trends (median R2 = .91, SD = .15), although as indicated in the descriptive plots there was consider- able variability in the specific form of trends found. Similar to Hofmann et al. (1993), orthogonal polynomials that include linear, quadratic, and cubic components were used to specify the basis curves.
876 PERSONNEL PSYCHOLOCX
m a t is the Form of Intraindividual Perj6ormance Over Time?
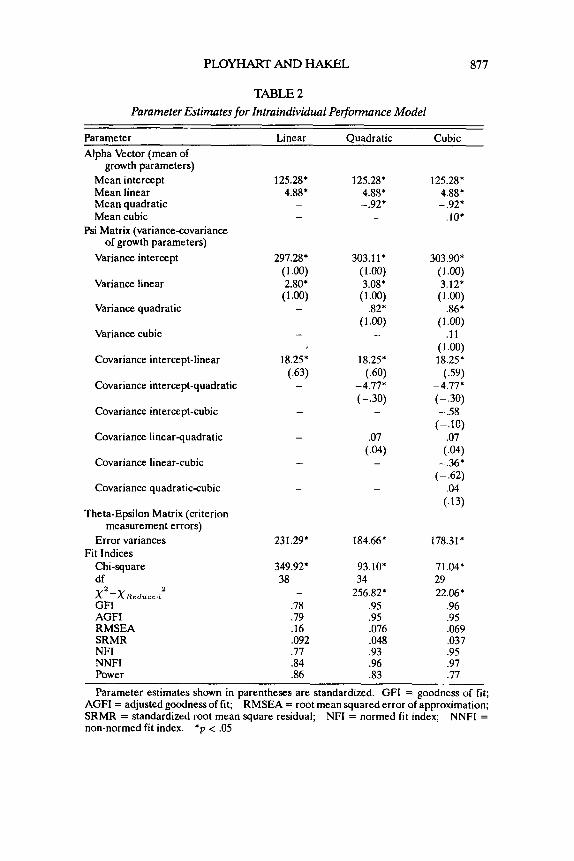
All analyses of the latent growth curves used LISREL 8 (Joreskog & Sorbom, 1993) with maximum likelihood estimation. We first performed a series of nested comparisons using the orthogonal polynomials to spec- ify the basis curves. As the polynomials are uncorrelated, we could ex- amine the relative improvement in model fit by adding a higher order polynomial in each subsequent analyses. Specifically, we first tested a no-growth model (ie., intercept only), then a linear change model (i.e., intercept and linear terms), followed by a quadratic growth model (i.e., intercept, linear, and quadratic terms), and finally a cubic growth model (intercept, linear, quadratic, and cubic terms). Each analysis thus pro- vides a statistical test about the form of latent performance present. Ta- ble 2 presents the parameter estimates for these model^.^
Substantively, the linear model found that average sales performance follows a positive trend, indicating that sales performance increases over time. This model also suggests that there are individual differences in the type of linear trend found, as the variance associated with the in- tercept and linear parameters was highly significant. Such a model sug- gests not every individual’s performance increases linearly to the same degree over time. The quadratic model indicates performance not only increases over time (as shown by the linear trend) but does so in a curvi- linear fashion-sales performance rises quickly in the first few quarters and then begins to slow in later quarters (as shown by the significant and negative quadratic parameter). This suggests a “learning curve” is present, and that there are individual differences (significant variance) in how quickly individuals accelerate to higher performance. Finally, the cubic model indicates that this “learning curve” is not a smoothly in- creasing function. As shown in Figure 2, the slope of the average curve decreases (i.e., inflects) at the third quarter and to a lesser extent at the sixth quarter. Thus, a modest S-shaped curve appears to be present, and the cubic term functions to model these inflections.
As can be seen by the fit indices in Table 2, the cubic model provides the best fitting average performance trend, x 2 (29) = 71.04, p < .001;
’Note that in all tables unstandardized and standardized latent parameter estimates are provided. Standardizing the manifest variables destroys the ability to examine change be- cause the standardization equates the means and variances (Rovine & von Eye, 1991; Tisak & Meredith, 1990; Tucker, 1966). Therefore, we present the unstandardized estimates (as IS most typical in this type of research). However, due to large differences in variances and means in the latent parameters, we also provide estimates where the manifest variables are unstandardized and the latent variances are scaled to one (referred to as a “standardized solution” in LISREL terminology, see Joreskog & Sorbom, 1993, p. 152).
PLOYHART AND HAKEL 877
TABLE 2 Parameter Estimates for Intraindividual Performance Model
Parameter Linear Quadratic Cubic Alpha Vector (mean of
growth parameters) Mean intercept Mean linear Mean quadratic Mean cubic
Psi Matrix (variance-covariance of growth parameters)
Variance intercept
Variance linear
Variance quadratic
Variance cubic
Covariance intercept-linear
Covariance intercept-quadratic
Covariance intercept-cubic
Covariance linear-quadratic
Covariance linear-cubic
Covariance quadratic-cubic
Theta-Epsilon Matrix (criterion measurement errors)
Error variances
Chi-square df
Fit Indices
x2 -x Ilndncer12
GFI AGFI RMSEA SRMR NFI NNFI Power
125.28' 4.88* -
-
297.28'
2.80' (1 .OO)
(1 .OO) -
-
18.25' (.63) -
-
-
-
-
231.29*
349.92' 38
- .78 .79 .16 .092 .77 .84 .86
125.28' 4.88* -.92*
-
303.11'
3.08*
.82*
(1.00)
(1 .OO)
(1 .OO) -
18.25' (.60)
-4.77' (- .30)
-
.07 (.04) -
-
184.66*
93.10' 34
256.82' .95 .95 ,076 ,048 .93 .96 .83
125.28' 4.88' -.92*
.lo*
303.90'
3.12'
.86*
.11
18.25'
-4.77' ( - .30) - .58
.07
(1.00)
(1 .OO)
(1 .OO)
(1 .OO)
(59)
(-.lo)
(.04) -.36'
( - .62) .04
(.131
178.31'
71.04' 29 22.06'
.96
.95
.069
.037
.95
.91
.77
Parameter estimates shown in parentheses are standardized. GFI = goodness of fit; RMSEA = root mean squared error of approximation;
NNFI = AGFI = adjusted goodness of fit; SRMR = standardized root mean square residual; non-normed fit index. *p < .05
NFI = normed fit index;
878 PERSONNEL PSYCHOLOGY
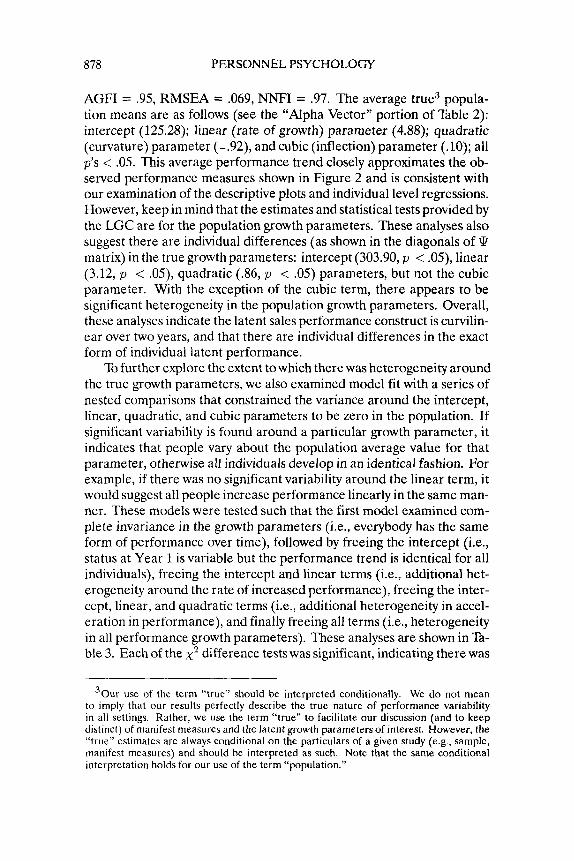
AGFI = .95, RMSEA = .069, NNFI = .97. The average true3 popula- tion means are as follows (see the “Alpha Vector” portion of Table 2): intercept (125.28); linear (rate of growth) parameter (4.88); quadratic (curvature) parameter (-.92), and cubic (inflection) parameter (.lo); all p’s < .05. This average performance trend closely approximates the ob- served performance measures shown in Figure 2 and is consistent with our examination of the descriptive plots and individual level regressions. However, keep in mind that the estimates and statistical tests provided by the LGC are for the population growth parameters. These analyses also suggest there are individual differences (as shown in the diagonals of 9 matrix) in the true growth parameters: intercept (303.90, p < .05), linear (3.12, p < .05), quadratic (.86, p < .05) parameters, but not the cubic parameter. With the exception of the cubic term, there appears to be significant heterogeneity in the population growth parameters. Overall, these analyses indicate the latent sales performance construct is curvilin- ear over two years, and that there are individual differences in the exact form of individual latent performance.
To further explore the extent to which there was heterogeneity around the true growth parameters, we also examined model fit with a series of nested comparisons that constrained the variance around the intercept, linear, quadratic, and cubic parameters to be zero in the population. If significant variability is found around a particular growth parameter, it indicates that people vary about the population average value for that parameter, otherwise all individuals develop in an identical fashion. For example, if there was no significant variability around the linear term, it would suggest all people increase performance linearly in the same man- ner. These models were tested such that the first model examined com- plete invariance in the growth parameters (i.e., everybody has the same form of performance over time), followed by freeing the intercept (i.e., status at Year 1 is variable but the performance trend is identical for all individuals), freeing the intercept and linear terms (i.e., additional het- erogeneity around the rate of increased performance), freeing the inter- cept, linear, and quadratic terms (i.e., additional heterogeneity in accel- eration in performance), and finally freeing all terms (i.e., heterogeneity in all performance growth parameters). These analyses are shown in Ta- ble 3. Each of the x’ difference tests was significant, indicating there was
3 0 u r use of the term “true” should be interpreted conditionally. We d o not mean to imply that our results perfectly describe the true nature of performance variability in all settings. Rather, we use the term “true” to facilitate our discussion (and to keep distinct) of manifest measures and the latent growth parameters of interest. However, the “true” estimates are always conditional on the particulars of a given study (e.g., sample, manifest measures) and should be interpreted as such. Note that the same conditional interpretation holds for our use of the term “population.”
PLOYHART AND HAKEL 879
r - W I A N r - 0 9 0 9 0 9 0 9 ’ :
o m o m w ‘ ? \ s o ‘ ? ?
880 PERSONNEL PSYCHOLOGY
a significant improvement in model fit as a result of allowing interindi- vidual heterogeneity around the population intraindividual performance parameters. As a result, it appears that there are individual differences in the exact type of performance trend shown by each person. Note that these analyses reach different conclusions from those presented earlier regarding the heterogeneity around the cubic term. We chose to “sus- pend judgment” (Keppel, 1991) about the significance of heterogeneity around the cubic term until we had examined the error structure.
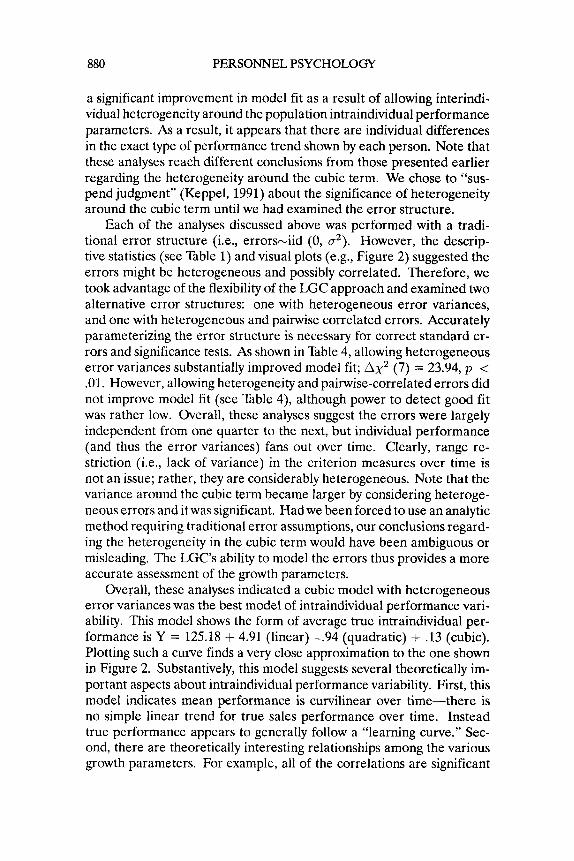
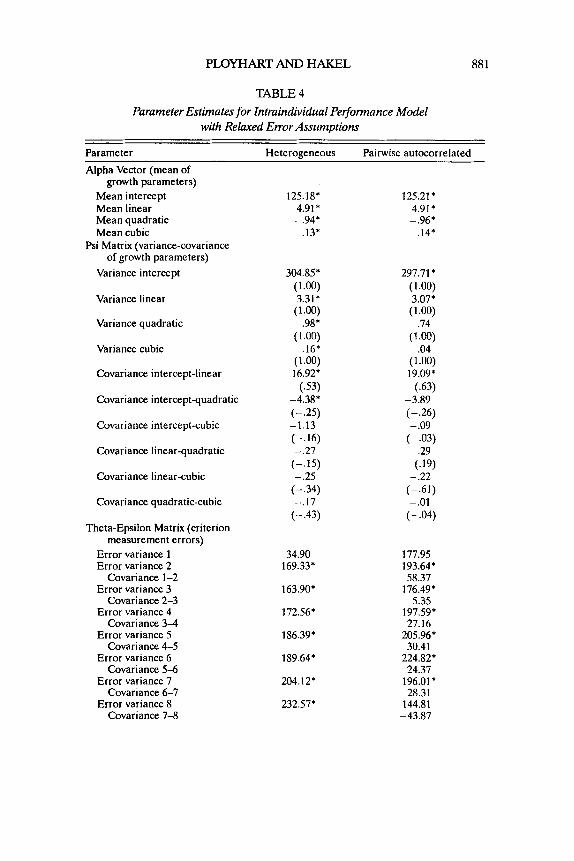
Each of the analyses discussed above was performed with a tradi- tional error structure (ie., errors-iid (0, c2). However, the descrip- tive statistics (see Table 1) and visual plots (e.g., Figure 2) suggested the errors might be heterogeneous and possibly correlated. Therefore, we took advantage of the flexibility of the LGC approach and examined two alternative error structures: one with heterogeneous error variances, and one with heterogeneous and pairwise correlated errors. Accurately parameterizing the error structure is necessary for correct standard er- rors and significance tests. As shown in Table 4, allowing heterogeneous error variances substantially improved model fit; Ax2 (7) = 23.94, p < .01. However, allowing heterogeneity and pairwise-correlated errors did not improve model fit (see Table 4), although power to detect good fit was rather low. Overall, these analyses suggest the errors were largely independent from one quarter to the next, but individual performance (and thus the error variances) fans out over time. Clearly, range re- striction (i.e., lack of variance) in the criterion measures over time is not an issue; rather, they are considerably heterogeneous. Note that the variance around the cubic term became larger by considering heteroge- neous errors and it was significant. Had we been forced to use an analytic method requiring traditional error assumptions, our conclusions regard- ing the heterogeneity in the cubic term would have been ambiguous or misleading. The LGC’s ability to model the errors thus provides a more accurate assessment of the growth parameters.
Overall, these analyses indicated a cubic model with heterogeneous error variances was the best model of intraindividual performance vari- ability. This model shows the form of average true intraindividual per- formance is Y = 125.18 + 4.91 (linear) -.94 (quadratic) + .13 (cubic). Plotting such a curve finds a very close approximation to the one shown in Figure 2. Substantively, this model suggests several theoretically im- portant aspects about intraindividual performance variability. First, this model indicates mean performance is curvilinear over time-there is no simple linear trend for true sales performance over time. Instead true performance appears to generally follow a “learning curve.” Sec- ond, there are theoretically interesting relationships among the various growth parameters. For example, all of the correlations are significant
PLOYHART AND HAKEL 881
TABLE 4 Parameter Estimates for Intraindividual Performance Model
with Relaxed Error Assumptions
Parameter Heterogeneous Painvise autocorrelated Alpha Vector (mean of
. growth parameters) Mean intercept Mean linear Mean quadratic Mean cubic
Psi Matrix (variance-covariance of growth parameters)
Variance intercept
Variance linear
Variance quadratic
Variance cubic
Covariance intercept-linear
Covariance intercept-quadratic
Covariance intercept-cubic
Covariance linear-quadratic
Covariance linear-cubic
Covariance quadratic-cubic
Theta-Epsilon Matrix (criterion measurement errors)
Error variance 1 Error variance 2
Error variance 3
Error variance 4
Error variance 5
Error variance 6
Error variance 7
Error variance 8
Covariance 1-2
Covariance 2-3
Covariance 3-4
Covariance 4-5
Covariance 5-6
Covariance 6-7
Covariance- 7-8
125.1 8* 4.91 * -.94*
.13*
304.85*
3.31 *
.98*
.16*
16.92*
-4.38* (-.25) -1.13 (-.16) -.27
-.25
-.17
(1 .OO)
(1.00)
(1 .OO)
( 1 .00)
(53)
(-.IS)
(-.34)
(- .43)
34.90 169.33*
163.90*
I72.56*
186.39*
189.64:
204.12*
232.57*
125.21 * 4.91 * -.96*
.14*
297.71 *
3.07*
.74
.04
19.09*
(1 .OO)
(1 .OO)
(1.00)
( 1 .00)
(53) -3.89 (-.26) - .09 (- .03)
.29
-.22 (-.61) -.01 (- .04)
(.19)
177.95 193.64* 58.37
176.49* 5.35
197.59: 27.16
205.96* 30.41
224.82* 24.37
196.01 * 28.31
144.81 -43.87
882 PERSONNEL PSYCHOLOGY
TABLE 4 (continued)
Parameter Heterogeneous Pairwise autocorrelated
Fit Indices Chi-square 47.10* 35.99
X Z - X , l ~ d r r < < r l Z 23.94*” 11.11 df 22 15
GFI .98 .99 AGFI .96 .97 RMSEA ,061 ,068 SRMR ,028 .023 NFI .97 .97 NNFI .98 .97 Power .67 .54
“xz from cubic model in Table 2. Parameter estimates shown in parentheses are standardized. GFI = goodness of fit;
AGFI = adjusted goodness of fit; RMSEA = root mean squared error of approximation; SRMR = standardized root mean square residual; NNFI = non-normed fit index. * p < .OS
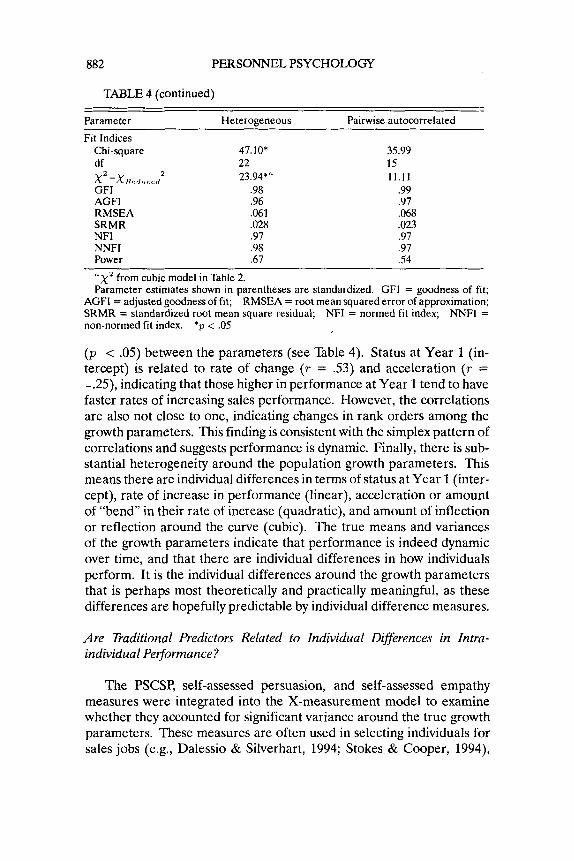
( p < .05) between the parameters (see Table 4). Status at Year 1 (in- tercept) is related to rate of change (T = .53) and acceleration (T = -.25), indicating that those higher in performance at Year 1 tend to have faster rates of increasing sales performance. However, the correlations are also not close to one, indicating changes in rank orders among the growth parameters. This finding is consistent with the simplex pattern of correlations and suggests performance is dynamic. Finally, there is sub- stantial heterogeneity around the population growth parameters. This means there are individual differences in terms of status at Year 1 (inter- cept), rate of increase in performance (linear), acceleration or amount of “bend” in their rate of increase (quadratic), and amount of inflection or reflection around the curve (cubic). The true means and variances of the growth parameters indicate that performance is indeed dynamic over time, and that there are individual differences in how individuals perform. It is the individual differences around the growth parameters that is perhaps most theoretically and practically meaningful, as these differences are hopefully predictable by individual difference measures.
NFI = normed fit index;
Are Traditional Predictors Related to Individual Differences in Intra- individual Peqormance?
The PSCSP, self-assessed persuasion, and self-assessed empathy measures were integrated into the X-measurement model to examine whether they accounted for significant variance around the true growth parameters. These measures are often used in selecting individuals for sales jobs (e.g., Dalessio & Silverhart, 1994; Stokes & Cooper, 1994),
PLOYHART AND HAKEL 883
TABLE 5 Correlation Matrix of Latent Growth Parameters Eta (q)
and Latent Predictors Kii (6) 1 2 3 4 5 6 7
I . Intercept - 2. Linear .53* - 3. Quadratic -.25* -.16* - 4. Cubic -.17* -.34* -.46* -
5. PSCSP .16* .08 -.04 -.04 - 6. Persuasion .12* .15* -.04 .lo* .16* - 7. Empathy .17* .21* -.03 -.15* .09 .72* -
Values in matrix derived from latent variance-covariance matrix of individual growth parameters and predictor constructs. * p < .05 n = 303
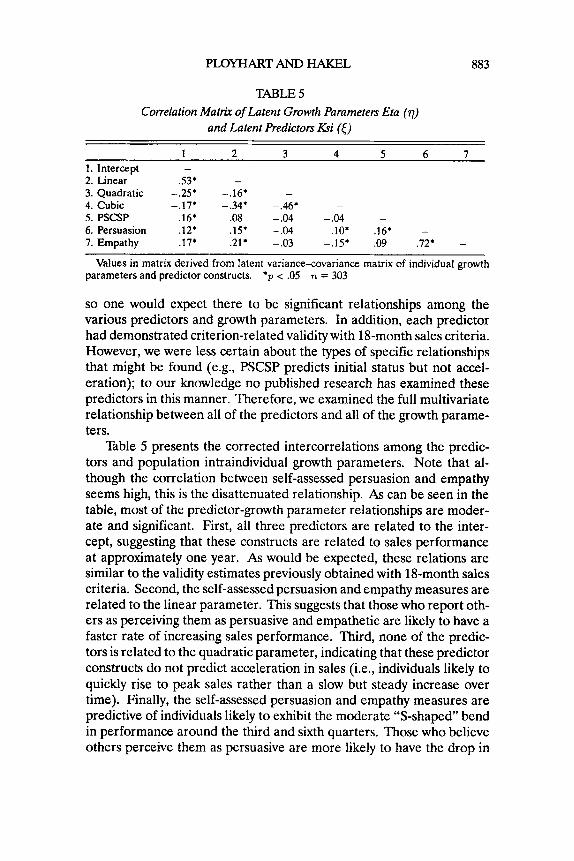
so one would expect there to be significant relationships among the various predictors and growth parameters. In addition, each predictor had demonstrated criterion-related validity with 18-month sales criteria. However, we were less certain about the types of specific relationships that might be found (e.g., PSCSP predicts initial status but not accel- eration); to our knowledge no published research has examined these predictors in this manner. Therefore, we examined the full multivariate relationship between all of the predictors and all of the growth parame- ters.
Table 5 presents the corrected intercorrelations among the predic- tors and population intraindividual growth parameters. Note that al- though the correlation between self-assessed persuasion and empathy seems high, this is the disattenuated relationship. As can be seen in the table, most of the predictor-growth parameter relationships are moder- ate and significant. First, all three predictors are related to the inter- cept, suggesting that these constructs are related to sales performance at approximately one year. As would be expected, these relations are similar to the validity estimates previously obtained with 18-month sales criteria. Second, the self-assessed persuasion and empathy measures are related to the linear parameter. This suggests that those who report oth- ers as perceiving them as persuasive and empathetic are likely to have a faster rate of increasing sales performance. Third, none of the predic- tors is related to the quadratic parameter, indicating that these predictor constructs do not predict acceleration in sales (i.e., individuals likely to quickly rise to peak sales rather than a slow but steady increase over time). Finally, the self-assessed persuasion and empathy measures are predictive of individuals likely to exhibit the moderate “S-shaped” bend in performance around the third and sixth quarters. Those who believe others perceive them as persuasive are more likely to have the drop in
884 PERSONNEL PSYCHOLOGY
TABLE 6 Full Model Assessing Predictors of Interindividual
Diflerences in Intraindividual Performance
Unstandardized Standardized parameter parameter
Parameter estimates estimates Alpha Vector (mean of
growth parameters) Mean intercept Mean linear Mean quadratic Mean cubic
Psi Matrix (conditional variance-covariance of growth parameters)
Variance intercept Variance linear Variance quadratic Variance cubic Covariance intercept-linear Covariance intercept-quadratic Covariance intercept-cubic Covariance linear-quadratic Covariance linear-cubic Covariance quadratic-cubic
of growth parameters Unconditional variance-covariance
Variance intercept Variance linear Variance quadratic Variance cubic Covariance intercept-linear Covariance intercept-quadratic Covariance intercept-cubic Covariance linear-quadratic Covariance linear-cubic Covariance quadratic-cubic
Gamma Matrix (regression wt.) PSCSP-intercept PSCSP-linear PSCSPquadratic PSCSP-cubic Persuasion-intercept Persuasion-linear Persuasionquadratic Persuasion-cubic Empathy-intercept Empathy-linear Empathyquadratic Empathy-cubic
125.18* 4.92* -.95*
.13*
290.1 1 ' 3.16*
.98' ' .I4 15.49*
-4.23' - .92 - .28 - .22t -.18t
305.67 3.31
.98
.16 16.90
-4.42 -1.18 - .29 - .25 -.I8
.33*
.01
.oo
.oo - 1.78 -.09 - .07
9.28 1.13t
.43t
- .03 -.53t
- - - -
,958 .95'
1.00' .88 ,498
-.24' -.13 -.I5 -.30t -.46t
- - - - - - - - - -
.IS'
.06 - .04 - .07 -.04 -.02 - .03
.45t
.22t
-.47t
.I9
-.01
PLOYHART AND HAKEL 885
TABLE 6 (continued)
Unstandardized Standardized parameter parameter
Parameter estimates estimates Phi Matrix (predictor variances-
covariances) Variance PSCSP 63.63' - Variance persuasion .17* -
Variance empathy .12* - Covariance PSCSP-persuasion .54* -
Covariance PSCSP-empathy .25 - Covariance persuasion-empathy .I 1 * -
Theta-Epsilon Matrix (criterion measurement errors)
Error variance 1 31.29 - Error variance 2 168.90* - Error variance 3 164.30* - Error variance 4 173.61 * - Error variance 5 186.20* - Error variance 6 190.26* - Error variance 7 205.71 * - Error variance 8 240.07: -
Fit Indices Chi-square 60.21 * - df 34 -
GFI .98 -
AGFI .95 - RMSEA .051 - SRMR .024 - NFI .96 - NNFI .97 - Power .83 - GFI = goodness of fit; AGFI = adjusted goodness of fit; RMSEA = root mean
SRMR = standardized root mean square residual; squared error of approximation; NFI = normed fit index;
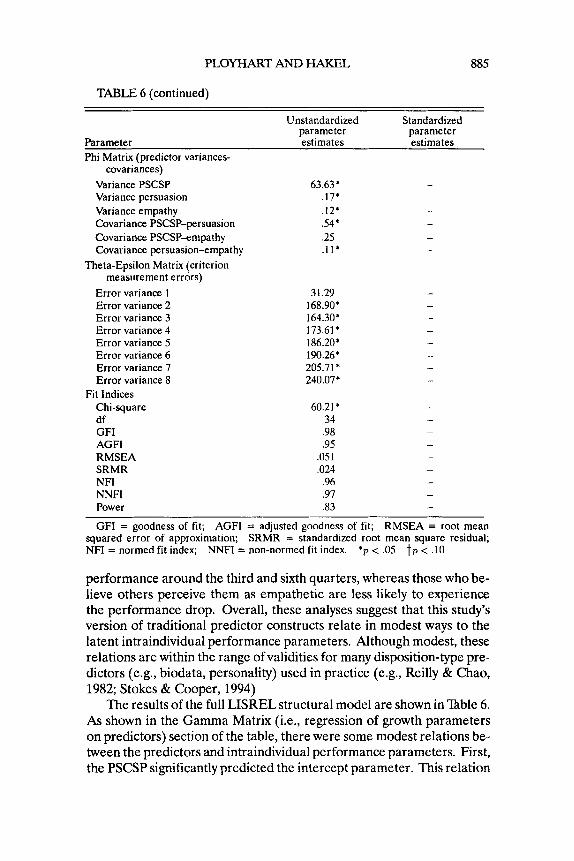
performance around the third and sixth quarters, whereas those who be- lieve others perceive them as empathetic are less likely to experience the performance drop. Overall, these analyses suggest that this study's version of traditional predictor constructs relate in modest ways to the latent intraindividual performance parameters. Although modest, these relations are within the range of validities for many disposition-type pre- dictors (e.g., biodata, personality) used in practice (e.g., Reilly & Chao, 1982; Stokes & Cooper, 1994)
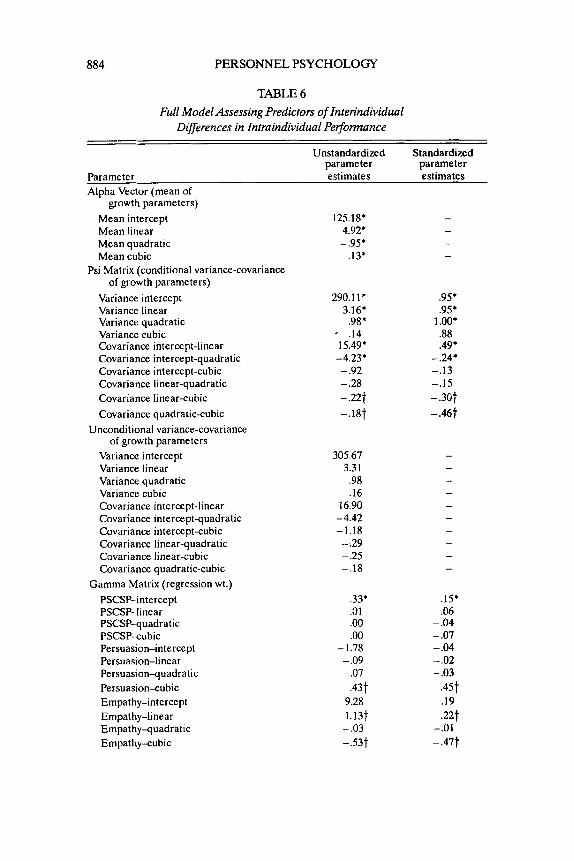
The results of the full LISREL structural model are shown in Table 6. As shown in the Gamma Matrix (i.e., regression of growth parameters on predictors) section of the table, there were some modest relations be- tween the predictors and intraindividual performance parameters. First, the PSCSP significantly predicted the intercept parameter. This relation
NNFI = non-normed fit index. * p < .05 t p < .I0
886 PERSONNEL PSYCHOLOGY
may reflect the fact that the PSCSP is a measure of past and expected future performance, thus one might expect the PSCSP to account for variance in performance around the first year but not in changes in per- formance over time. Second, self-assessed persuasion was moderately related to the cubic parameter. As noted above, this indicates that those who believe others perceive them as persuasive appear to show small performance decrements along an otherwise steadily increasing perfor- mance trend. Third, self-assessed empathy was moderately related to the linear and cubic parameters. Those who believe others see them as more empathetic are more likely to increase sales performance than those who do not share these beliefs, and are less likely to experience a performance decrement at various times. As found previously, the quadratic parameter was not related to any of the predictors. If one compares the variances in the conditional (on the predictors) and un- conditional growth parameters, the amount of variance accounted for by the predictors can be estimated: R2’s = 105, .05, .OO, and .12 respec- tively for the intercept, linear, quadratic, and cubic components. There is still variability around the population growth parameters, although it appears there is not a significant amount of explainable variability in the population heterogeneity of the cubic parameter (i.e., the variance with the cubic parameter is no longer significant). Although there is clearly room for improved prediction of the variability of sales performance, these predictors do appear to relate to some of the growth parameters in substantively interesting ways.
Discussion
This study examined the substantive nature of performance vari- ability by assessing interindividual differences in intraindividual perfor- mance, along with potential relationships between traditional predictor constructs and performance variability. The findings in this study extend the existing literature by examining predictors of interindividual differ- ences in latent intraindividual performance. They also contribute to ex- isting research by providing information about average changes in per- formance, changes in validities over time, and changes in criterion inter- correlations over time (e.g., Barrett et al., 1985). Overall, results found that (a) criteria are relatively dynamic over time, (b) latent sales per- formance approximates a learning curve with considerable interindivid- ual variability around the population performance growth parameters, and (c) traditional measures of predictor constructs account for mod- est amounts of variance in latent performance variability. We discuss each research question in more detail, but first we note some cautions to consider when interpreting these results.
PLOYHART AND HAKEL 887
Cautions
Several cautions must be considered when interpreting the findings of this study. First, one must be careful to consider the nature of the criterion. The use of objective sales criteria may not be optimal for the study of psychological individual difference predictors of intraindividual performance. Sales performance is likely to be influenced by situational factors (e.g., sales territory, market changes) and may not be entirely un- der the control of the individual (e.g., Campbell, 1994; Campbell et al., 1996). This study found considerable variability around the basis curves which may partially reflect these situational factors. However, based on the situational data we had access to (e.g., region), we found no relation- ships between these situational factors and any of the dependent mea- sures or growth parameters. Second, the sample examined in this study was a subset of a larger group of employees. As noted above, individuals were excluded because of missing criterion or predictor data. In the data we had access to, many individuals were missing several quarters of crite- rion data. Although this was usually due to participants having only been recently hired, there were individuals who had left the organization or job. Therefore, the sample used in this study might be considered to be those individuals who were successful salespersons. Although this limits the generalizability of this study to those who are successful in similar sales positions, it might be noted that these are the individuals the orga- nization is most interested in identifying. Third, one might find different forms of growth or more stability across extended periods of time. As shown in Figure 2, sales criteria approached an asymptote towards the end of 2 years. It is quite likely that the first few months on the job are what Murphy (1989) refers to as “transition” periods, and that perhaps after learning key skills individuals will enter a “maintenance” stage. It seems reasonable that performance stabilizes after a few years on the job (e.g., a salesperson has an established group of clients). Finally, one should be cautious about extending the findings from this study to other jobs. The job of securities salesperson is somewhat unique in that the job entails high turnover and repeated rejection (e.g., Corr & Gray, 1995). Other jobs that are more stable may demonstrate different forms of per- formance variability and growth. Keeping these cautions in mind, we now discuss theoretical implications in terms of the three research ques- tions.
The Stability of Criteria
Barrett et al. (1985) noted three ways to demonstrate dynamic crite- ria: changes in group average performance over time, changes invalidity
888 PERSONNEL PSYCHOLOGY
over time, and changes in rank order on criterion measures over time. This study provides information on all three. First, as shown in Figure 2, group average sales followed a learning curve-type trend. A second and more stringent examination found that the criterion measures exhibited a simplex pattern over time, with temporally close criterion measures exhibiting higher correlations than temporally distant measures. This is consistent with the majority of past research on dynamic criteria (e.g., Deadrick & Madigan, 1990; Henry & Hulin, 1987; Hofmann et al., 1992, 1993). Note that in this study the criterion measures increased in vari- ability over time, so range restriction in the criterion measures is less of a problem than in some past research (however, there is likely range restriction in terms of the sample examined). Finally, the relationships between the predictors and criteria were variable but generally within the range of what one might expect by chance. Although these rela- tions were modest, i t does suggest at least some degree of consistency to predictive relationships. Overall, these findings suggest some degree of criterion dynamism, as the criterion intercorrelations decreased over time. However, it also appears this instability did not greatly influence the bivariate predictive validities.
The Nature of Intraindividual Pei$ormance
To examine the substantive nature of intraindividual performance variability, we used a latent growth curve approach to directly examine the key parameters of latent intraindividual performance growth (i.e., intercept, linear, quadratic, and cubic parameters). The latent growth parameters represent population values for intraindividual performance variability. This approach also provides the flexibility of modeling the error terms, which enables this study to provide a more thorough analysis of the latent nature of intraindividual performance variability. Several interesting findings were obtained.
First, tests of the growth parameters revealed the average form of performance growth approximates a learning curve. Such a finding is similar to Hofmann et al. (1992, 1993). However, unlike Hofmann et al. (1993) this curve is not a smooth monotonic increasing function, as the significant cubic term indicates inflection or performance decrements along this curve. Hofmann et al. had used traditional error structures for their analyses, but this study found that even with a traditional error structure the model fit better by including the cubic term. One possi- ble difference is that the cubic term in Hofmann et al. (1993) may not have had enough variability to be reliable (e.g., Willett, 1989). In ad- dition, the difference in performance curves might simply be a function of different samples. At this point one may tentatively suggest that sales
PLOYHART AND HAKEL 889
performance initially follows a general learning curve, but that it remains open to further research whether or not this curve is smooth (i.e., non- significant cubic term) or has inflection/reflection (i.e., cubic term is sig- nificant). The practical importance of this distinction is probably rather small; we have considered the cubic term mainly for theoretical reasons. In the future, researchers must be careful to consider the error structure in longitudinal research. This study found heterogeneity in errors across time, although somewhat unexpectedly autocorrelation was not present. Accounting for error heterogeneity produced considerably better model fit and clearer interpretation of the model parameters.
Second, the latent growth analyses found significant heterogeneity around the population performance growth parameters. This suggests that individuals differ in terms of their exact form of performance over time. This finding provides some support for the notion that the latent construct of sales performance is dynamic; static performance would be evidenced by homogeneity around the growth parameters (i.e., every- body’s performance is approximately identical over time). Again, this finding is consistent with research by Hofmann et al. (1993) and Dead- rick et al. (1997). It should also be noted that the correlations among the various growth parameters were not close to one, indicating rank order changes in terms of the latent growth parameters. For example, those who maintain a high rate of change (i.e., high linear trend) are not neces- sarily the same individuals who accelerate to peak performance quickly (i.e., high negative quadratic parameter). These analyses suggest that, at least for this job, performance is highly variable.
Third, this study raises questions regarding the relationship between initial performance and rate of performance change over time. Specifi- cally, average performance was found to follow a negatively accelerated learning curve, indicating there is no simple linear relationship between initial status and rate of performance increase. Rather, this relation- ship depends on the metric used to specify time (Rogosa, 1995; Rogosa & Willett, 1985a). In this study initial status was fixed at approximately one year; rescaling the time metric to where initial status refers to the first quarter would probably result in a stronger negative correlation, rescaling time in the opposite direction would result in a less negative correlation (see Rogosa, 1995, for details). So, the question of whether individuals who are initially high performing keep this advantage is not easily answered, but is perhaps better reframed in terms of intraindivid- ual performance trends over time.
Finally, these findings provide some support for conceptual treat- ments of performance. For example, Murphy (1989) suggests perfor- mance consists of different stages: transition (i.e., novel task demands)
890 PERSONNEL PSYCHOLOGY
and maintenance (i.e., task demands becoming automatic). Perfor- mance may be more stable during maintenance stages but more variable during transition stages. This description fits with the results of this study if one considers the first few months on the job as a “transition” stage; probably a reasonable assumption. For example, Figure 2 shows that av- erage sales performance begins to level off towards the end of 2 years, perhaps indicating the job had moved into a more stable, maintenance stage.
These findings are consistent with more basic research on changes in skilled performance. For example, several researchers (e.g., Ack- erman, 1986, 1987; Alvares & Hulin, 1972, 1973; Dunham, 1974) sug- gest that changes in abilities or skills as a function of experience with a task may account for changes in performance over time. Ackerman (1987) and Kanfer and Ackerman (1989) suggest various mechanisms, such as self-regulation or required attentional resources demanded by the task, that may partially account for performance variability. In a context such as in this study, one might assess these mechanisms in ad- dition to the performance measures. For example, one could model a latent performance trend along with a latent measure of self-regulation or attentional load (e.g., attention required in the process of selling) measured either at a single time and treated as a covariate or measured repeatedly and treated as a growth curve. One might find that atten- tional resources are positively related to time on the task or job (i.e., in a selling context, more attentional resources become available with increased sales practice), and that this linear component is positively re- lated to the performance growth parameters. Methods for the study of such cross-domain processes are already available (e.g., Willett & Sayer, 1996). One might also consider modeling different groups of individu- als’ performance over time. For example, one could construct groups of individuals high and low on cognitive ability to assess if different perfor- mance trends are present for each group. Other groups, such as gender or race, may also show different growth trends. Such questions are eas- ily integrated into the LGC framework as a straightforward extension of multiple-group structural equation modeling (see Meredith & Tisak, 1990; Tisak & Meredith, 1990, for descriptions).
Future research might consider adopting these methods to the study of a wide variety of organizationally relevant behavior. Although the LGC framework provides researchers with a powerful and flexible tool for studying a variety of questions about growth or development, it does have some criticisms. For example, Rogosa (Rogosa & Willett, 1985b; Rogosa, 1988, 1995) argues that different psychological processes may generate identical correlation (or simplex) matrices, and as a result a method that relies solely on such matrices may not identify the correct
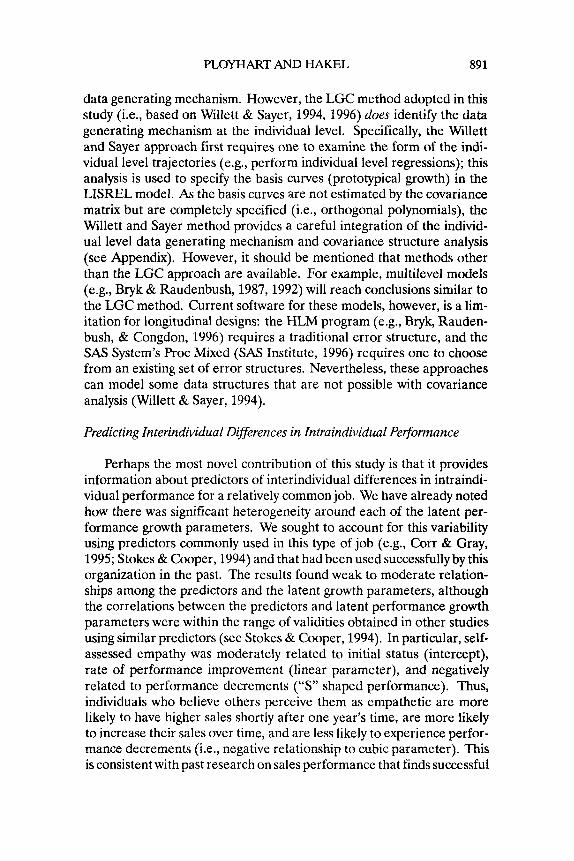
PLOYHART AND HAKEL 891
data generating mechanism. However, the LGC method adopted in this study (i.e., based on Willett & Sayer, 1994, 1996) does identify the data generating mechanism at the individual level. Specifically, the Willett and Sayer approach first requires one to examine the form of the indi- vidual level trajectories (e.g., perform individual level regressions); this analysis is used to specify the basis curves (prototypical growth) in the LISRELmodel. As the basis curves are not estimated by the covariance matrix but are completely specified (i.e., orthogonal polynomials), the Willett and Sayer method provides a careful integration of the individ- ual level data generating mechanism and covariance structure analysis (see Appendix). However, it should be mentioned that methods other than the LGC approach are available. For example, multilevel models (e.g., Bryk & Raudenbush, 1987,1992) will reach conclusions similar to the LGC method. Current software for these models, however, is a lim- itation for longitudinal designs: the HLM program (e.g., Bryk, Rauden- bush, & Congdon, 1996) requires a traditional error structure, and the SAS System’s Proc Mixed (SAS Institute, 1996) requires one to choose from an existing set of error structures. Nevertheless, these approaches can model some data structures that are not possible with covariance analysis (Willett & Sayer, 1994).
Predicting Interindividual Differences in Intraindividual Performance
Perhaps the most novel contribution of this study is that it provides information about predictors of interindividual differences in intraindi- vidual performance for a relatively common job. We have already noted how there was significant heterogeneity around each of the latent per- formance growth parameters. We sought to account for this variability using predictors commonly used in this type of job (e.g., Corr & Gray, 1995; Stokes & Cooper, 1994) and that had been used successfully by this organization in the past. The results found weak to moderate relation- ships among the predictors and the latent growth parameters, although the correlations between the predictors and latent performance growth parameters were within the range of validities obtained in other studies using similar predictors (see Stokes & Cooper, 1994). In particular, self- assessed empathy was moderately related to initial status (intercept), rate of performance improvement (linear parameter), and negatively related to performance decrements (“S” shaped performance). Thus, individuals who believe others perceive them as empathetic are more likely to have higher sales shortly after one year’s time, are more likely to increase their sales over time, and are less likely to experience perfor- mance decrements (i.e., negative relationship to cubic parameter). This is consistent with past research on sales performance that finds successful
892 PERSONNEL PSYCHOLOGY
salespersons are able to relate and understand their clients’ needs (e.g., Corr 8i Gray, 1995). Self-assessed persuasion demonstrated similar, al- though weaker, relationships with initial status and rate of performance improvement (i.e., linear parameter). However, self-assessed persua- sion was positively related to the cubic parameter, which suggests that those who acknowledge their persuasive abilities are actually less likely to consistently increase or maintain sales. Perhaps their use of persua- sive tactics has the unintended effect of alienating potential clients. Fi- nally, the PSCSP was moderately related to initial status. As initial status indicates performance at slightly after one year, this finding might be ex- pected because the PSCSP was keyed on 18-month sales criteria. This relationship suggests those who have greater past earningshalary expec- tations have higher performance at slightly after 4 quarters time. Such a finding is consistent with considerable past research using biodata as a predictor for sales performance (e.g., Corr & Gray, 1995; Dalessio & Sil- verhart, 1994; Tanofsky et al., 1969; see Stokes & Cooper, 1994; Thayer, 1977). It is also clear that changes in intraindividual performance are not completely explained by a relatively traditional biodata measure.
These bivariate relations were generally found in the full structural model, where the latent performance growth parameters were regressed on the latent predictor constructs; however, these relations were some- what weaker. Although the PSCSP was still related to initial status, self- assessed persuasion was modestly related to the cubic parameter and self-assessed empathy was moderately related to rate of performance improvement (i.e., linear parameter) and negatively related to the cubic parameter. The squared multiple correlations of these predictors sug- gested some interindividual variance in the intraindividual performance growth parameters was accounted for by the predictors; the magnitude of the explained variance is consistent with other research (Deadrick et al., 1997). Although modest, the predictive relationships do suggest psy- chological constructs can relate substantively to performance variabil- ity. One might find even stronger relations between different kinds of predictor constructs. For example, the self-assessed nature of the per- suasion and empathy measures may be particularly susceptible to faking; stronger relationships might be found for different measures or disposi- tional constructs.
Note that the quadratic parameter, which reflects the amount of acceleration in performance beyond that captured by a straight linear trend, was not related to any of the predictors examined in this study. What constructs might be related to such acceleration depends on the meaning of the parameter. One might speculate that cognitive ability should relate to fast acceleration to maximal performance. This is con-
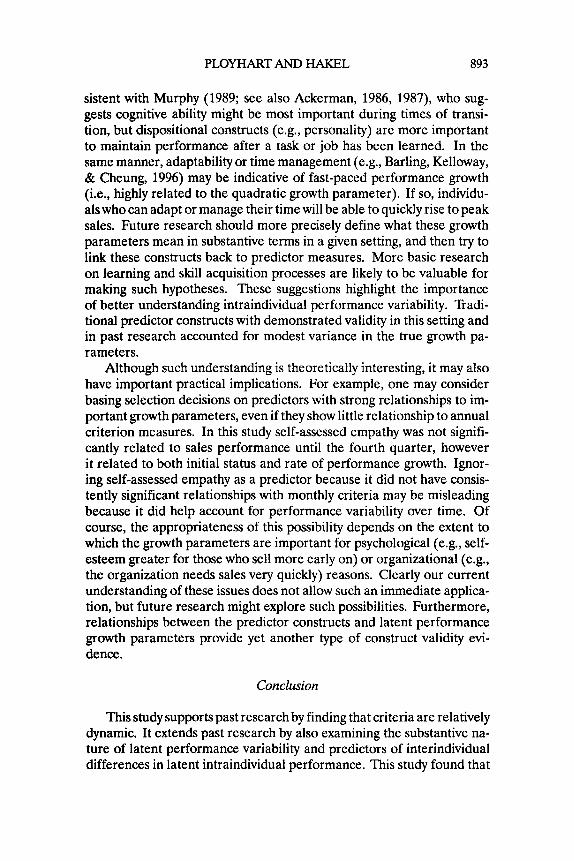
PLOYHART AND HAKEL 893
sistent with Murphy (1989; see also Ackerman, 1986, 1987), who sug- gests cognitive ability might be most important during times of transi- tion, but dispositional constructs (e.g., personality) are more important to maintain performance after a task or job has been learned. In the same manner, adaptability or time management ( e g , Barling, Kelloway, & Cheung, 1996) may be indicative of fast-paced performance growth (i.e,, highly related to the quadratic growth parameter). If so, individu- als who can adapt or manage their time will be able to quickly rise to peak sales. Future research should more precisely define what these growth parameters mean in substantive terms in a given setting, and then try to link these constructs back to predictor measures. More basic research on learning and skill acquisition processes are likely to be valuable for making such hypotheses. These suggestions highlight the importance of better understanding intraindividual performance variability. Tradi- tional predictor constructs with demonstrated validity in this setting and in past research accounted for modest variance in the true growth pa- rameters.
Although such understanding is theoretically interesting, it may also have important practical implications. For example, one may consider basing selection decisions on predictors with strong relationships to im- portant growth parameters, even if they show little relationship to annual criterion measures. In this study self-assessed empathy was not signifi- cantly related to sales performance until the fourth quarter, however it related to both initial status and rate of performance growth. Ignor- ing self-assessed empathy as a predictor because it did not have consis- tently significant relationships with monthly criteria may be misleading because it did help account for performance variability over time. Of course, the appropriateness of this possibility depends on the extent to which the growth parameters are important for psychological (e.g., self- esteem greater for those who sell more early on) or organizational (e.g., the organization needs sales very quickly) reasons. Clearly our current understanding of these issues does not allow such an immediate applica- tion, but future research might explore such possibilities. Furthermore, relationships between the predictor constructs and latent performance growth parameters provide yet another type of construct validity evi- dence.
Conclusion
This study supports past research by finding that criteria are relatively dynamic. It extends past research by also examining the substantive na- ture of latent performance variability and predictors of interindividual differences in latent intraindividual performance. This study found that
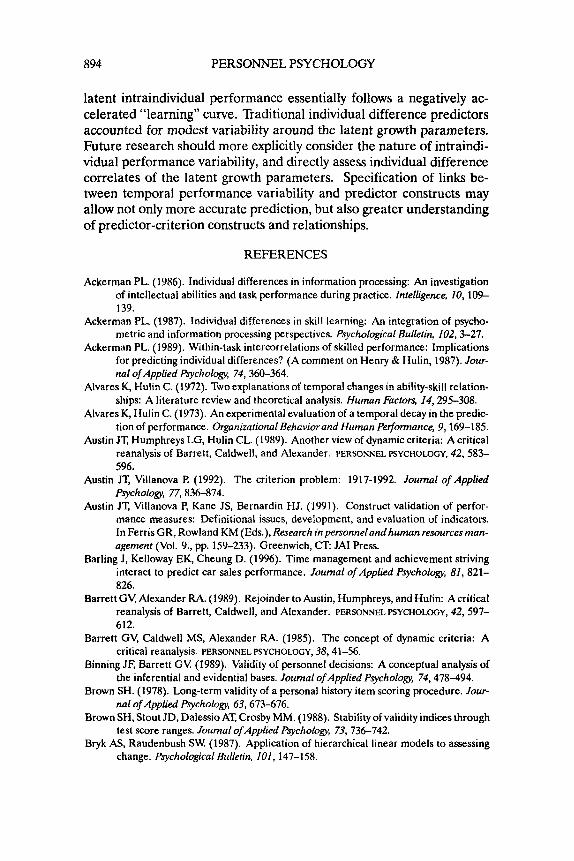
894 PERSONNEL PSYCHOLOGY
latent intraindividual performance essentially follows a negatively ac- celerated “learning” curve. Traditional individual difference predictors accounted for modest variability around the latent growth parameters. Future research should more explicitly consider the nature of intraindi- vidual performance variability, and directly assess individual difference correlates of the latent growth parameters. Specification of links be- tween temporal performance variability and predictor constructs may allow not only more accurate prediction, but also greater understanding of predictor-criterion constructs and relationships.
REFERENCES
Ackerman PL. (1986). Individual differences in information processing: An investigation of intellectual abilities and task performance during practice. Intelligence, 10,109- 139.
Ackerman PL. (1987). Individual differences in skill learning: An integration of psycho- metric and information processing perspectives. Psychological Bulletin, 102,3-27.
Ackerman PL. (1989). Within-task intercorrelations of skilled performance: Implications for predicting individual differences? (A comment on Henry & H u h , 1987). Jour- nal of Applied Psychology, 74, 360-364.
Alvares K, Hulin C. (1972). Two explanations of temporal changes in ability-skill relation- ships: A literature review and theoretical analysis. Human Factors, 14,295-308.
Alvares K, H u h C. (1973). An experimental evaluation of a temporal decay in the predic- tion of performance. Organizational Behavior and Human Performance, 9,169-185.
Austin JT, Humphreys LG, Hulin CL. (1989). Another view of dynamic criteria: A critical reanalysis of Barrett, Caldwell, and Alexander. PERSONNEL PSYCHOLOGY, 42,583- 596.
Austin JT, Villanova P. (1992). The criterion problem: 1917-1992. Journal of Applied Pychology, 77,836-874.
Austin JT, Villanova P, Kane JS, Bernardin HJ. (1991). Construct validation of perfor- mance measures: Definitional issues, development, and evaluation of indicators. In Ferris GR, Rowland KM (Eds.), Research in personnelandhuman resourcesman- agement (Vol. 9., pp. 159-233). Greenwich, CT: JAI Press.
Barling J, Kelloway EK, Cheung D. (1996). Time management and achievement striving interact to predict car sales performance. Journal of Applied Psychology, 81, 821- 826.
Barrett GV, Alexander RA. (1989). Rejoinder to Austin, Humphreys, and Hulin: Acritical reanalysis of Barrett, Caldwell, and Alexander. PERSONNEL PSYCHOLOGY, 42, 597- 61 2.
Barrett GV, Caldwell MS, Alexander RA. (1985). The concept of dynamic criteria: A critical reanalysis. PERSONNEL PSYCHOLOGY, 38,41-56.
Binning JF, Barrett GV (1989). Validity of personnel decisions: A conceptual analysis of the inferential and evidential bases. Journal ofApplied Pvchology, 74,478-494.
Brown SH. (1978). Long-term validity of a personal history item scoring procedure. Jour- nal of Applied Psychology, 63,673676.
Brown SH, Stout JD, Dalessio AT, Crosby MM. (1988). Stability of validity indices through test score ranges. Journal ofApplied Pvchology, 73, 736-742.
Bryk AS, Raudenbush SW. (1987). Application of hierarchical linear models to assessing change. Psychological Bulletin, 101,147-1 58.
PLOYHART AND HAKEL 895
Bryk AS, Raudenbush SW. (1992). Hierarchical linear models: Applications and data anal- ysis methods. Newbury Park, CA: Sage.
Bryk AS, Raudenbush SW, Congdon RT (1996). HLM: Hierarchical linear modeling with the HLMI2L and HLM/3Lprograms. Chicago, IL: Scientific Software International.
Burchinal M, Appelbaum MI. (1991). Estimating individual developmental functions: Methods and their assumptions. Child Development, 62,23-43.
Campbell Jl? (1990). Modeling the performance prediction problem in industrial and organizational psychology. In Dunnette MD, Hough LM (Eds.), Handbook of industrial and organizationalpsychology (2nd ed.; Vol 1, pp. 687-732). Palo Alto, CA: Consulting Psychologists Press.
Campbell JF! (1994). Alternative models of performance and their implications for selec- tion and classification. In Rumsey MG, Walker CB, Harris JH (Eds.), Personnel selection and classification (pp. 33-52). Hillsdale, NJ: Erlbaum.
Campbell JP, Gasser MB, Oswald FL. (1996). The substantive nature of job performance variability. In Murphy KR (Ed.), Individual difserences and behavior in organizations (pp. 258-299). San Francisco, CA: Jossey-Bass.
Campbell JP, McCloy RA, Oppler SH, Sager CE. (1993). A theory of performance. In Schrnitt N, Borman WC (Eds.), Personnel selection in organizations (pp. 35-70). San Francisco: Jossey-Bass.
Chatfield C. (1975). The analysis of time series: Theory and practice. London: Chapman and Hall.
Cohen J, Cohen l? (1983). Applied multiple regressionlcorelation analysis for the behavioral sciences. Hillsdale, NJ: Erlbaum.
Collins LM, Horn JL. (1991). Best methodsfor the analysis of change: Recent advances, unanswered questions, future directions. Washington, DC: American Psychological Association.
Corr PJ, Gray JA. (1995). Attributional style, socialization and cognitive ability as predic- tors of sales success: A predictive validity study. Personality and Individual Differ- ences, 18,241-252.
Dalessio AT, Silverhart TA. (1994). Combining biodata test and interview information: Predicting decisions and performance criteria. PERSONNEL PSYCHOLOGY, 47, 303- 31 5.
Deadrick DL, Bennett N, Russell CJ. (1997). Using hierarchical linear modeling to exam- ine dynamic performance criteria over time. Journal of Management, 23,745-757.
Deadrick DL, Madigan RM. (1990). Dynamic criteria revisited: A longitudinal study of performance stability and predictive validity. PERSONNELPSYCHOLOGY, 43,717-743.
Dunham RB. (1974). Ability-skill relationships: An empirical explanation of change over time. Organizational Behavior and Human Performance, 12,372-382.
Epstein S . (1980). The stability of behavior 11: Implications for psychological research. Psychological Bulletin, 35, 790-806.
Ericsson KA, Smith J. (1991). Toward a general theory of expertise: Prospects and limits. Cambridge: Cambridge University Press.
Estes WK. (1956). The problem of inference from curves based on group data. Psycholog- ical Bulletin, 53, 134-140.
Fleishman E. (1957). A comparative study of the aptitude patterns unskilled and skilled psychomotor performance. Journal of Applied Psychology, 41,263-272.
Gottman JM. (1996). The analysb of change. Mahwah, NJ: Erlbaum. Guttman LA. (1955). A generalized simplex for factor analysis. Psychometrika, 20, 173-
Hanges PJ, Schneider B, Niles K. (1990). Stability of performance: An interactionist 192.
perspective. Journal of Applied Psychology, 75,658-667.
896 PERSONNEL PSYCHOLOGY
Henry RA, Hulin CL. (1987). Stability of skilled performance across time: Some general-
Henry RA, Hulin CL. (1989). Changing validities: Ability-performance relations and
Hofmann DA, Jacobs R, Baratta JE. (1993). Dynamic criteria and the measurement of change. Journal of Applied Psychology, 78, 194-204. Hofmann DA, Jacobs R, Gerras SJ. (1992). Mapping individual performance across time. Journal ofApplied Psychology, 77,185-195.
H u h CL, Henry RA, Noon SL. (1990). Adding a dimension: Time as a factor in the generalizability of predictive relationships. Psychological Bulletin, 107, 328-340.
Humphreys LG. (1960). Investigations of the simplex. Psychometrih, 25,313-323. James LR. (1973). Criterion models and construct validity for criteria. Psychological
Bulletin, 80, 75-83. Joreskog K, Sorbom D. (1993). LISREL 8: Structural equation modeling with the SIMPLIS
command language. Hillsdale, NJ: Erlbaum. Kanfer R, Ackerman PL. (1989). Motivation and cognitive abilities: An integrative/
aptitude-treatment interaction approach to skill acquisition. Journal ofApplied Psy- chology, 74,657-690.
Keppel G. (1991). Design and analysis: A researcher’s handbook. New Jersey: Prentice Hall.
MacCallum RC, Browne MW, Sugawara HM. (I 996). Power analysis and determination of sample size for covariance structure modeling. Psychological Methods, I, 130-149.
McArdle JJ, Epstein D. (1987). Latent growth curves within developmental structural equation models. Child Development, 58, 110-133.
Meredith W, Tisak J. (1990). Latent curve analysis. Psychometrika, 55, 107-122. Mumford MD, Owens WA. (1987). Methodology review: Principles, procedures, and
findings in the application of background data measures. Applied Psychological Measurement, II,1-31.
Murphy KR. (1989). Is the relationship between cognitive ability and job performance stable over time? Human Performance, 2,183-200.
Murphy KR. (1996). Individual differences and behavior in organizations: Much more than g. In Murphy KR (Ed.), Individual differences and behavior in oKanizations (pp. 3-30). San Francisco: Jossey-Bass.
izations and limitations on utilities. Journal ofApplied Psychology, 72,457-462.
es. Journal of Applied Psychology, 54,365-367.
Nagle BF. (1953). Criterion development. PERSONNEL PSYCHOLOGY, 6,271-289. Owens W. (1976). Background data. In Dunnette MD (Ed.), Handbook of industrial and
organizationalpsychology (pp. 609-644). Chicago: Rand McNally. Rao CR. (1958). Some statistical methods for comparison of growth curves. Biomehics,
14, 1-17. Reilly RR, Chao GT. (1982). Validity and fairness of some alternative employee selection
procedures. PERSONNEL PSYCHOLOGY, 35,162. Rogosa DR. (1980). A critique of cross-lagged correlations. Psychological Bulletin, 88,
245-258. Rogosa DR. (1988). Myths about longitudinal research. In Schaie KW, Campbell RT
Meredith W, Rawlings SC (Eds.), Merhodological issues in aging research (pp. 171- 209). New York Springer.
Rogosa DR. (1995). Myths and methods: “Myths about longitudinal research” plus sup- plemental questions. In Gottman JM (Ed.), Theanalysbofchange (pp. 3-66). Mah- wah, NJ: Lawrence Erlbaum Associates, Inc.
Rogosa DR, Brandt D, Zimowski M. (1982). Agrowth curve approach to the measurement of change. Psychological Bulletin, 90, 726-748.
Rogosa DR, Saner H. (1995). Longitudinal data analysis examples with random coefficient models. Journal of Educational and Behavioral Statistics, 20, 149-1 70.
PLOYHART AND HAKEL 897
Rogosa DR, Willett JB. (1985a). Understanding correlates of change by modeling individ-
Rogosa DR, Willett JB. (1985b). Satisfying a simplex structure is simpler than it should
Rovine MJ, von Eye A. (1991). Applied computational statistics in longitudinal research.
SAS Institute. (1996). SAS systemfor mixed models. Cary, NC: SAS Institute. Schmidt FL, Hunter JE, Outerbridge AN, Goff S. (1988). Joint relation of experience
and ability with job performance: Test of three hypotheses. Journal of Applied Psychology, 73,4657.
Schmitt N, Gooding RZ, Noe RA, Kirsch M. (1984). Meta-analyses of validity studies published between 1964 and 1982 and the investigation of study characteristics. PERSONNEL PSYCHOLOGY, 37,407-422.
Schumaker RE, Lomax RG. (1996). A beginner’s guide to structural equation modeling. Mahwah, NJ: Erlbaum.
Smith PC. (1976). Behaviors, results, and organizational effectiveness: The problem of criteria. In Dunnette MD (Ed.), Handbook ofindustrial and organizationalpsychot- 00. Chicago: Rand McNally.
Stokes GS, Cooper LA. (1994). Selection using biodata: Old notions revisited. In Stokes GS, Mumford MD, Owens WA (Eds.), Biodata handbook (pp. 311-349). Palo Aka, CA: Consulting Psychologists Press.
Stoolmiller M. (1995). Using latent growth curve models to study developmental pro- cesses. In Gottman JM (Ed.), The analysis ofchange (pp. 103-138). Mahwah, NJ: Erlbaum.
Sujan H, Sujan M, Bettman JR. (1988). Knowledge structure differences between more effective and less effective salespeople. Journal ofMarketing Research, 25,8146.
Tabachnik BG, Fidell LS. (1996). Using multivariate stafistics (pp. 57-125). New York: HarperCollins College.
Tanofsky R, Shepps RR, O’Neill PJ. (1969). Pattern analysis of biographical predictors of success as an insurance salesman. Journal of Applied Psychology, 53,136-139.
Thayer Pw. (1977). Somethings old, somethings new. PERSONNEL PSYCHOLOGY, 30, 513- 524.
Thissen D, Bock RD. (1990). Linear and nonlinear curve fitting. In von Eye A (Ed.), Statistical methods in longitudinal research (Vol2, pp. 289-318). Boston: Academic Press.
Tisak J, Meredith W. (1990). Descriptive and associated developmental models. In von Eye A (Ed.), Statistical methods in longitudinal research (Vol. 2, pp. 387406). San Diego, CA: Academic Press.
Toops HA. (1944). The criterion. Educational and PsychologicalMeasurement, 4,271-297. Tucker LR. (1958). Determination of parameters of a functional relation by factor analysis.
Psychometrika, 23, 19-23. Tucker LR. (1966). Learning theory and multivariate experiment: Illustration of gener-
alized learning curves. In Cattell RB (Ed.), Handbook of multivariate experimental psychology (pp. 476-501). Chicago: Rand McNally.
von Eye A. (1990). Statistical methods in longitudinal research (Vol 1 and 2). Boston: Academic Press.
von Eye A, Clogg CC. (1994). Latent variables analysis: Applications for developmental research. Thousand Oaks, CA: Sage.
Wallace SR. (1965). Criteria for what? American Psychologist, 20,411-417. Wernimont P, Campbell JP. (1968). Signs, samples, and criteria. Journal of Applied Psy-
ual differences in growth. Psychometrih, 50,203-208.
be. Journal of Educational Statistics, 10,99-107.
Cambridge, MA: Academic Press.
chology, 52,372-376.
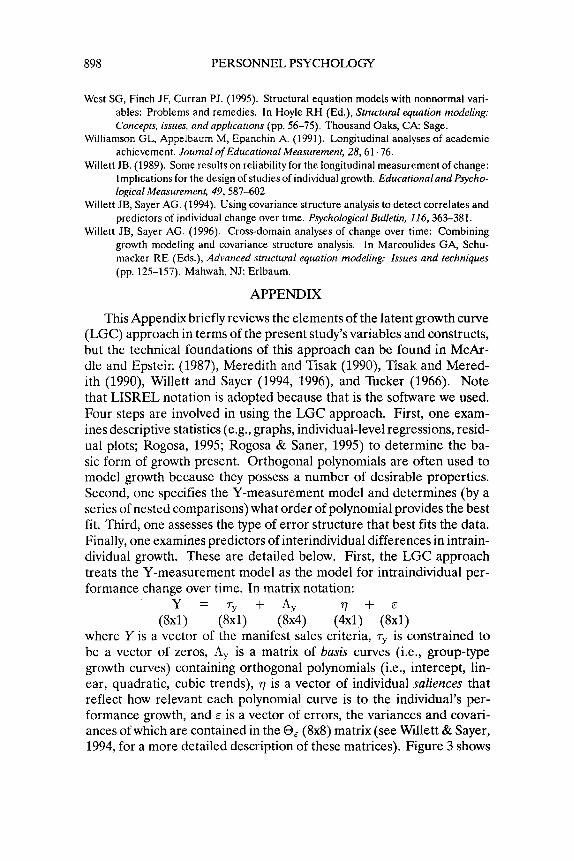
898 PERSONNEL PSYCHOLOGY
West SG, Finch JF, Curran PJ. (1995). Structural equation models with nonnormal vari- ables: Problems and remedies. In Hoyle RH (Ed.), Stmctural equation modeling: Concepts, issues, and applications (pp. 56-75). Thousand Oaks, CA: Sage.
Williamson GL, Appelbaum M, Epanchin A. (1991). Longitudinal analyses of academic achievement. Journal of Educational Measurement, 28,61-76.
Willett JB. (1989). Some results on reliability for the longitudinal measurement of change: Implications for the design of studies of individual growth. Educationaland Psycho- logical Measurement, 49,587402
Willett JB, Sayer AG. (1994). Using covariance structure analysis to detect correlates and predictors of individual change over time. Psychological Bulletin, 116,363-381.
Willett JB, Sayer AG. (1996). Cross-domain analyses of change over time: Combining growth modeling and covariance structure analysis. In Marcoulides GA, Schu- macker RE (Eds.), Advanced structural equation modeling: Issues and techniques (pp. 125-157). Mahwah, NJ: Erlbaum.
APPENDIX
This Appendix briefly reviews the elements of the latent growth curve (LGC) approach in terms of the present study’s variables and constructs, but the technical foundations of this approach can be found in McAr- dle and Epstein (1987), Meredith and Tisak (1990), Tisak and Mered- ith (1990), Willett and Sayer (1994, 1996), and Tucker (1966). Note that LISREL notation is adopted because that is the software we used. Four steps are involved in using the LGC approach. First, one exam- ines descriptive statistics (e.g., graphs, individual-level regressions, resid- ual plots; Rogosa, 1995; Rogosa & Saner, 1995) to determine the ba- sic form of growth present. Orthogonal polynomials are often used to model growth because they possess a number of desirable properties. Second, one specifies the Y-measurement model and determines (by a series of nested comparisons) what order of polynomial provides the best fit. Third, one assesses the type of error structure that best fits the data. Finally, one examines predictors of interindividual differences in intrain- dividual growth. These are detailed below. First, the LGC approach treats the Y-measurement model as the model for intraindividual per- formance change over time. In matrix notation:
Y = TY + A, 7 7 + & (8x1) (8x1) (8x4) (4x1) (8x1)
where Y is a vector of the manifest sales criteria, T,, is constrained to be a vector of zeros, A, is a matrix of basis curves (i.e., group-type growth curves) containing orthogonal polynomials (i.e., intercept, lin- ear, quadratic, cubic trends), 77 is a vector of individual saliences that reflect how relevant each polynomial curve is to the individual’s per- formance growth, and E is a vector of errors, the variances and covari- ances of which are contained in the 0, (8x8) matrix (see Willett & Sayer, 1994, for a more detailed description of these matrices). Figure 3 shows
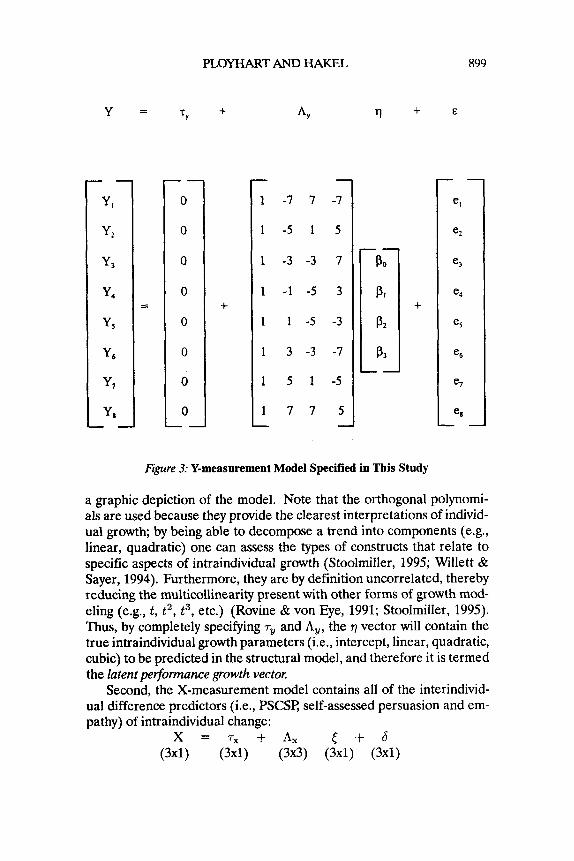
PLOYHART AND HAKEiL
Y = f, 3- AY
- - 0
0
0
0
0
0
0
0 - -
c
- - 1 -7 7 -7
1 - 5 1 5
1 -3 -3 7
1 -1 -5 3
1 1 -5 -3
1 3 -3 -7
1 5 1 - 5
1 7 7 5 - -
899
q + E
Figure 3: Y-measurement Model Specified in This Study
a graphic depiction of the model. Note that the orthogonal polynomi- als are used because they provide the clearest interpretations of individ- ual growth; by being able to decompose a trend into components (e.g., linear, quadratic) one can assess the types of constructs that relate to specific aspects of intraindividual growth (Stoolmiller, 1995; Willett & Sayer, 1994). Furthermore, they are by definition uncorrelated, thereby reducing the multicollinearity present with other forms of growth mod- eling ( e g , t , t2, t3, etc.) (Rovine & von Eye, 1991; Stoolmiller, 1995). Thus, by completely specifying 7, and A,, the r] vector will contain the true intraindividual growth parameters (i.e., intercept, linear, quadratic, cubic) to be predicted in the structural model, and therefore it is termed the latent performance growth vector.
Second, the X-measurement model contains all of the interindivid- ual difference predictors (i.e., PSCSP, self-assessed persuasion and em- pathy) of intraindividual change:
X = r , + h , [ + S (3x1) (3x1) (3x3) (3x1) (3x1)
900 PERSONNEL PSYCHOLOGY
where Xis a vector of manifest predictor measures, T~ is a vector of pre- dictor means, A, is a matrix of factor loadings (i.e., each manifest predic- tor variable regressed on its respective latent construct), t is a vector of the latent predictor constructs, and 6 is a vector of errors. Note that we fixed the diagonal elements (i.e., error variances) of the 0 6 matrix to 1 (i.e., no error) for the PSCSP and to [( 1-a)(variance)] for the persuasion and empathy scales. Given the nature of the PSCSP (i.e., past salary and salary expectations), this variable is probably measured with little error. However, we did correct for the unreliability in the multi-item scales by fixing the error variances as mentioned above (see Joreskog & Sorbom, 1993). This was done mainly for parsimony: The persuasion measure contained 14 items and the empathy measure contained 6 items. Includ- ing all of these items would have required a 29 x 29 matrix (plus the means). The approach used here allows one to model the unreliability without having to consider the 20 items composing the scales (and all of the additional parameters, e.g., 20 error variances). Note that there is not likely to be much error in sales dollars, so no reliability correction was made for the criterion measures.
Finally, the structural model (using mean structures) contains the means, variances, and covariances of the individual latent performance growth and predictor parameters. This is shown as follows:
v = o + r < + B q + c (4x1) (4x1) (4x3) (3x1) (4x4) (4x1) (4x1)
where q is the latent performance growth vector, a! is a mean vector of the latent performance growth parameters (i.e., average values for in- tercept, linear, quadratic, and cubic parameters), r is a matrix of coef- ficients resulting from regressing the latent intraindividual performance growth parameters on the predictors, is a vector of the latent predictor constructs, B is a matrix of zeros (because there are no endogenous vari- ables predicting other endogenous variables), and c is a vector of resid- uals of which the matrix Q contains the residual variances-covariances (i.e., the variances of the intraindividual performance growth parame- ters and their covariances).
The LGC approach provides a very flexible and unified structure. Specifically, one can (a) examine intraindividual and interindividual change simultaneously, (b) test a series of nested models by fixing or freeing specific parameters, (c) account for measurement error, (d) al- low variability around the basis curves, and (e) model the error terms ex- plicitly (e.g., Meredith & Tisak, 1990; Willett & Sayer, 1994). However, one may question how a method that analyzes a covariance matrix (with means) can provide information about within-person growth. That is, we have already suggested limitations with past research for only examining correlation matrices (see also Rogosa & Willett, 1985b), yet that is the
PLOYHART AND HAKEL 901
basis for the LCG methodology. As noted by Willett and Sayer (1994), the LCG approach is capable of modeling individual growth because one is essentially comparing an implied covariance matrix derived from a hy- pothesized model to an observed covariance matrix of the actual data. If one has correctly parameterized the model (i.e., correctly specified the correct form of intraindividual growth), the implied covariance matrix will closely approximate the observed covariance matrix, and the tra- ditional fit indices (e.g., x2, RMSEA) will indicate a close fit. If the hypothesized model is a poor approximation, the covariance matrix will be very different and the fit indices will be poor. Consequently, the key to the LCG methodology is correct specification of the basic functional form of intraindividual growth over time. In the LCG model, this refers to proper specification of the basis curves. Note that the basis curves re- fer only to the basic function of growth within individuals, but inclusion of the 17 vector (i.e., intraindividual performance growth vector) in the Y-measurement model allows individual differences in intraindividual growth (i.e., variance about the basis curves). If all individuals maintain very similar forms of performance over time, there will be little variance around the basis curves (latent intraindividual growth parameters will have little variance as shown in diagonals of Q matrix). If there are indi- vidual differences in performance over time there will be considerable variance around the basis curves (i.e., diagonals of P will be large).