
The Structure of Wages: An International Comparison: Wage Mobility and Dynamics in Italy in the...
29
This PDF is a selection from a published volume from the National Bureau of Economic Research Volume Title: The Structure of Wages: An International Comparison Volume Author/Editor: Edward P. Lazear and Kathryn L. Shaw, editors Volume Publisher: University of Chicago Press Volume ISBN: 0-226-47050-4; 978-0-226-47050-4 Volume URL: http://www.nber.org/books/laze08-1 Conference Date: Publication Date: January 2009 Chapter Title: Wage Mobility and Dynamics in Italy in the 1990s Chapter Author: Bruno Contini, Roberto Leombruni, Lia Pacelli, Claudia Villosio Chapter URL: http://www.nber.org/chapters/c2375 Chapter pages in book: (p. 373 - 400)
-
Upload
laboratoriorevelli -
Category
Documents
-
view
5 -
download
0
Transcript of The Structure of Wages: An International Comparison: Wage Mobility and Dynamics in Italy in the...
This PDF is a selection from a published volume from the National Bureau of Economic Research
Volume Title: The Structure of Wages: An International Comparison
Volume Author/Editor: Edward P. Lazear and Kathryn L. Shaw, editors
Volume Publisher: University of Chicago Press
Volume ISBN: 0-226-47050-4; 978-0-226-47050-4
Volume URL: http://www.nber.org/books/laze08-1
Conference Date:
Publication Date: January 2009
Chapter Title: Wage Mobility and Dynamics in Italy in the 1990s
Chapter Author: Bruno Contini, Roberto Leombruni, Lia Pacelli, Claudia Villosio
Chapter URL: http://www.nber.org/chapters/c2375
Chapter pages in book: (p. 373 - 400)
10.1 Macroeconomic Conditions and Long-Term Trends in Employment, Wages, and Mobility
10.1.1 Employment
From the end of the 1970s to the early 2000s, the employment cycle inItaly had two long periods of growth, from 1983 to 1990 and from 1994 totoday, interrupted by a strong recession from 1991 to 1993. The first phasewas marked by steady gross domestic product (GDP) growth accompaniedby a very modest increase in employment, with 3 to 4 percentage points dif-ference in 1984 to 1989 (it was described as “jobless growth”; see figure10.1). In the early 1990s, Italy was hit by the most severe recession since the Second World War in terms of job losses. During the crisis of the early1960s, which put an end to the so-called economic miracle, total employ-ment declined by 640,000 full-time equivalent units; in the early 1990s, thecumulative fall reached 1,080,000 units (Brandolini et al. 2006). The highdrop in employment was not mitigated by job creation in the public admin-istration, nor in state-owned companies. Moreover, layoffs were easier—
373
10Wage Mobility and Dynamics in Italy in the 1990s
Bruno Contini, Roberto Leombruni, Lia Pacelli, and Claudia Villosio
Bruno Contini is professor at the University of Turin and director of the LABORatorio R.Revelli, Centre for Employment Studies at Collegio Carlo Alberto. Roberto Leombruni is assistant professor at the University of Turin and a research fellow at LABORatorio R. Revelli, Centre for Employment Studies at Collegio Carlo Alberto. Lia Pacelli is an assistantprofessor of economics and finance at the University of Turin and a research fellow atLABORatorio R. Revelli, Centre for Employment Studies at Collegio Carlo Alberto. ClaudiaVillosio is partner at Research and Projects (R&P; Ricerche e Progetti) and senior researcherat LABORatorio R. Revelli, Centre for Employment Studies at Collegio Carlo Alberto.
Very valuable research assistance has been provided by Matteo Morini and Roberto Qua-ranta. Thanks to Jennifer Chubinski for her careful reading of the text.

thanks to the 1991 reform of collective dismissals (see section 10.2)—and adrastic restructuring process continued until 1995.
The subsequent recovery, in contrast with what was observed in the firstgrowth phase, was marked by strong trends in employment—which tookadvantage of a period of salary moderation and labor market reforms—and a modest increase in GDP. Figure 10.1 shows that from 1996 on, em-ployment started increasing again, with growth rates similar to the GDP.Beginning in 2000, this trend inverted, and the employment growth rate ex-ceeded GDP growth—which, while positive, was clearly in decline. Theelasticity of employment to GDP in the years post-1994 was about 0.7 per-cent, almost double with respect to the 0.38 percent that characterized thephase of jobless growth.
Employment growth since the 1980s is almost completely attributed towomen (see figure 10.2). Female employment increased between 1979 and2003 by 43 percent, while male employment was nearly stagnant.
The unemployment rate constantly increased until the end of the 1980s.After three years of modest decrease between 1989 and 1991, it increasedagain until 1996—when it reached, according to the old definition,1 a peak
374 Bruno Contini, Roberto Leombruni, Lia Pacelli, and Claudia Villosio
1. In table 10.1, two unemployment series are reported, before and after the revision of theLabour Force Survey methodology and definitions occurred in 1992. In the old definition, thecriteria by which an individual was classified as a job seeker were looser. Job seekers includedindividuals who completed inactive search actions and whose last search action took placemore than four weeks prior to the interview. In line with International Labor Organization(ILO) definitions, these individuals are currently classified as inactive, belonging to the so-
Fig. 10.1 Growth rates of GDP, employment, and Bank of Italy’s coincidentindicator of the business cycleSource: Contini and Trivellato (2005).

of nearly 16 percent. It then began to decrease during the years of intenseemployment growth, which brought it slightly above 10 percent in 2004(see table 10.1).
Expansion of the service sector occurred mostly in the 1980s and 1990s,following, with some delay, the physiological pattern of industrialized coun-tries. The service sector, 43 percent of total employment in 1970, swells to66 percent in 2003, still below the EU average.
A profound transformation in the employment structure has beendriven by population aging, which is currently proceeding at a pace morepronounced than in most other OECD countries (OECD 2006). After the“baby boom” of the 1960s and early 1970s, the fertility rate declinedsteeply: it fell below the replacement rate of 2.1 at the beginning of the1980s, reaching 1.24 in 2000. At the same time, life expectancy is rising rap-idly. Even though a slight recovery in fertility rates is expected in the com-ing years, the transition process to the new demographic regime is having,and will have, a profound impact on the economy. In the next two decades,the baby boom generations will reach retirement age and will be replacedby new cohorts roughly half in size. By 2050, more than one in three Ital-ians will be over the age of sixty-five.2
Aging affects companies in different ways because the mature workforce
Wage Mobility and Dynamics in Italy in the 1990s 375
Fig. 10.2 Index numbers of employment by gender, 1979 to 2003 (1979 = 100)Source: Contini and Trivellato (2005).
called potential labor force. There is evidence, however, that their characteristics and behav-iors are more similar to the unemployed than to the inactive (see Brandolini, Cipollone, andViviano 2006; Battistin, Rettore, and Trivellato 2007).
2. See the population projections produced by the Italian Statistical Office (ISTAT), “cen-tral” scenario (http://demo.istat.it/index.html).

concentrates in larger firms. The shift in the age distribution of employ-ment, though, has been remarkable in all firm sizes: between 1988 and1998, the mode of the distribution among smaller firms shifted markedlyfrom the twenty to twenty-four age group to the twenty-five to twenty-ninegroup; among larger firms, the shift is toward a bimodal distribution, withone hump at age thirty to thirty-four and the other at age forty-five to forty-nine (see figure 10.3).
376 Bruno Contini, Roberto Leombruni, Lia Pacelli, and Claudia Villosio
Table 10.1 Macroeconomic conditions
Unemployment rateGDP Change in GDP
Before LFS After LFS (billion euros,Year revision 1992 revision 1992 1995 prices) 1 year 2 year 5 year
1970 5.3 4861971 5.3 495 1.91972 6.3 511 3.2 5.11973 6.2 544 6.5 9.91974 5.3 573 5.3 12.21975 5.8 561 –2 3.1 15.51976 6.6 598 6.5 4.3 20.71977 7.0 612 2.4 9 19.81978 7.1 634 3.7 6.1 16.51979 7.5 669 5.5 9.4 16.81980 7.5 693 3.5 9.2 23.41981 8.3 698 0.8 4.3 16.81982 9.0 703 0.6 1.4 14.81983 10.0 711 1.2 1.9 12.11984 10.7 731 2.8 4 9.21985 11.0 753 3 5.8 8.61986 11.5 772 2.5 5.6 10.51987 12.3 795 3 5.6 13.11988 12.4 826 3.9 7.1 16.11989 12.4 850 2.9 6.9 16.31990 11.3 867 2 4.9 15.11991 10.9 879 1.4 3.4 13.91992 11.5 885 0.8 2.2 11.41993 13.7 10.3 877 –0.9 –0.1 6.21994 15.0 11.2 897 2.2 1.3 5.51995 15.7 11.8 923 2.9 5.2 6.51996 15.9 12.0 933 1.1 4 6.21997 15.9 12.1 952 2 3.1 7.51998 15.7 12.3 969 1.8 3.9 10.41999 15.2 11.8 985 1.7 3.5 9.92000 14.4 11.0 1015 3 4.7 102001 12.4 9.7 1033 1.8 4.8 10.72002 11.8 9.3 1037 0.4 2.2 8.92003 11.1 9.0 1040 0.3 0.6 7.32004 10.2 7.4 1052 1.2 1.5 6.8

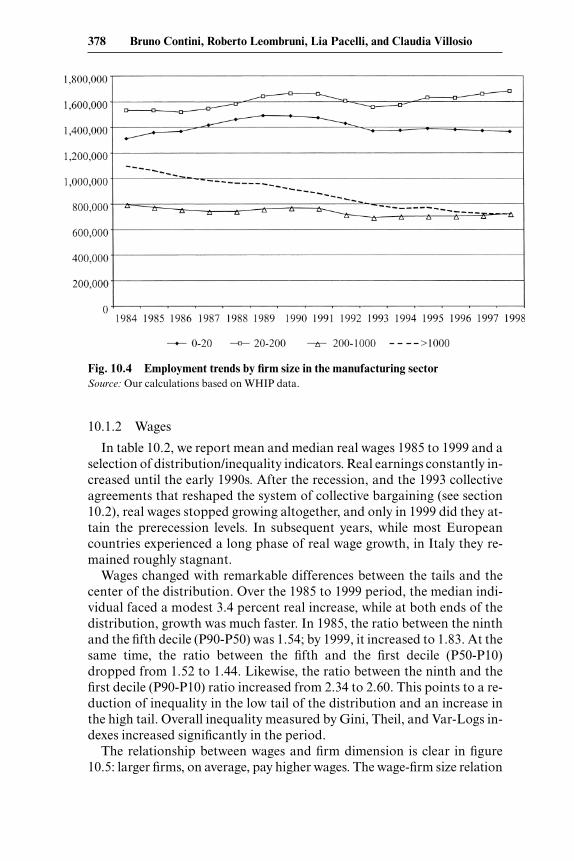
The distribution of dependent employment by firm size did not changemuch over the last fifteen years: the share of firms with less than twenty em-ployees held steady at around 40 percent of total employment, the share oflarge firms (> 1,000 workers) dropped by almost 4 percentage points, andthat of small-medium firms (20 to 100 workers) increased in proportion. Inmanufacturing, the shift was huge (see figure 10.4), with the share of firms> 1000 declining from 23 percent in the early 1980s to 16 percent in 1998.Large manufacturers went through a profound restructuring process thatcaused the loss of about 380,000 jobs, only partially reabsorbed by smalland medium firms: the overall employment loss in manufacturing wasabout 250,000 workers.
Wage Mobility and Dynamics in Italy in the 1990s 377
Fig. 10.3 Workforce age distribution by firm size, 1988 and 1998Source: Our calculations based on WHIP data, 1988 and 1998.
10.1.2 Wages
In table 10.2, we report mean and median real wages 1985 to 1999 and aselection of distribution/inequality indicators. Real earnings constantly in-creased until the early 1990s. After the recession, and the 1993 collectiveagreements that reshaped the system of collective bargaining (see section10.2), real wages stopped growing altogether, and only in 1999 did they at-tain the prerecession levels. In subsequent years, while most Europeancountries experienced a long phase of real wage growth, in Italy they re-mained roughly stagnant.
Wages changed with remarkable differences between the tails and thecenter of the distribution. Over the 1985 to 1999 period, the median indi-vidual faced a modest 3.4 percent real increase, while at both ends of thedistribution, growth was much faster. In 1985, the ratio between the ninthand the fifth decile (P90-P50) was 1.54; by 1999, it increased to 1.83. At thesame time, the ratio between the fifth and the first decile (P50-P10)dropped from 1.52 to 1.44. Likewise, the ratio between the ninth and thefirst decile (P90-P10) ratio increased from 2.34 to 2.60. This points to a re-duction of inequality in the low tail of the distribution and an increase inthe high tail. Overall inequality measured by Gini, Theil, and Var-Logs in-dexes increased significantly in the period.
The relationship between wages and firm dimension is clear in figure10.5: larger firms, on average, pay higher wages. The wage-firm size relation
378 Bruno Contini, Roberto Leombruni, Lia Pacelli, and Claudia Villosio
Fig. 10.4 Employment trends by firm size in the manufacturing sectorSource: Our calculations based on WHIP data.

Table 10.2 Real wage distribution
Percentiles ratios Inequality measures
Year Median Mean P90/P50 P50/P10 P90/P10 Gini Theil var-logs
1985 1424 1532 1.54 1.52 2.34 199 (0.6) 71 (0.5) 133 (0.8)1986 1407 1529 1.55 1.52 2.36 203 (0.7) 74 (0.6) 136 (0.8)1987 1427 1569 1.61 1.53 2.45 214 (0.7) 82 (0.6) 147 (0.9)1988 1424 1572 1.63 1.52 2.47 216 (0.7) 83 (0.6) 149 (0.8)1989 1435 1620 1.68 1.42 2.38 219 (0.7) 87 (0.6) 146 (0.8)1990 1449 1671 1.73 1.42 2.46 233 (0.8) 102 (0.8) 160 (0.9)1991 1503 1712 1.70 1.45 2.46 227 (0.7) 96 (0.6) 156 (0.8)1992 1498 1719 1.72 1.43 2.47 229 (0.7) 97 (0.7) 156 (0.9)1993 1499 1724 1.72 1.42 2.44 227 (0.8) 96 (0.7) 152 (0.9)1994 1484 1711 1.73 1.42 2.46 228 (0.8) 98 (0.8) 153 (1.0)1995 1444 1672 1.77 1.42 2.52 229 (0.7) 97 (0.7) 155 (0.9)1996 1433 1673 1.79 1.41 2.52 233 (0.7) 101 (0.7) 159 (0.8)1997 1461 1710 1.79 1.42 2.54 237 (0.7) 105 (0.7) 164 (0.9)1998 1470 1723 1.80 1.45 2.60 244 (0.8) 112 (0.8) 170 (1.0)1999 1473 1768 1.83 1.44 2.63 257 (0.9) 134 (1.2) 187 (1.1)
Percent change1985–1999 3.4 15.4 19.4 –5.7 12.6 28.9 89.7 41.1
Source: Devicienti (2006).Notes: Wages are monthly wages at 1999 prices, private sector only. Part-time monthly wages have beenconverted into full-time equivalents. Numbers in parentheses are standard errors.
Fig. 10.5 Firm size distribution (P10, median, and P90) by wage deciles—1999Note: Size in log scale.Source: Our calculations on WHIP data.

also explains the wage dynamics of job changes: workers switching fromsmall to large firms earn wage premiums, while job switches in the oppo-site direction often lead to wage losses (see Contini and Villosio [2003] andtable 10.3).
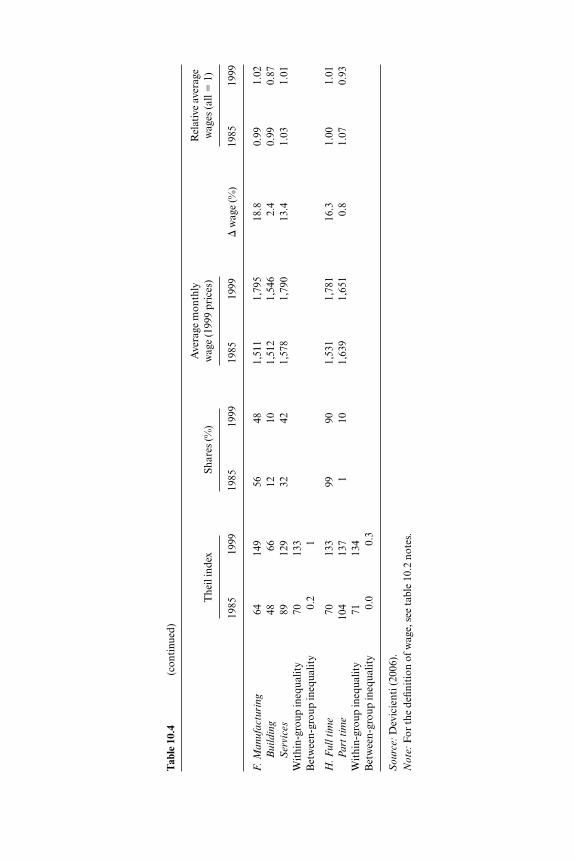
Table 10.4 displays the results of a decomposition exercise: for all parti-tions, inequality is predominantely explained by its within-group component.
The between-group component is negligible except for age and occupa-tion partitions. In the former, the between component accounts for about12 to 14 percent of aggregate inequality, while in the latter, it explains aboutone-fourth. This is consistent with a collective wage-setting process that re-lies on seniority (here proxied by age) and occupation.
10.1.3 Mobility
Gross worker turnover (GWT) in Italy—the ratio of yearly flows of en-gagements and separations on average employment—hovered about 60percent (see table 10.5), indicating that labor force mobility is higher thanthat of most European countries (Leombruni and Quaranta 2002, 2005).This may appear at odds with the view that Italian labor market legislationis among the most rigid: we will address this point in section 10.2.
As theory suggests (Blanchard and Diamond 1990), GWT appears tomove procyclically, with peaks in the expansionary phases and a troughduring the recession culminated in 1993.
The GWT, like most mobility indicators, reflects worker age and firmsize (Davis and Haltiwanger 1999). Young workers are the most mobile:the search for a “good job” translates into many flows in and out of jobs.Worker flows are much higher in small firms, for a variety of reasons:higher entry and exit rates, limited internal mobility, and few firing con-straints due to looser institutional constraints and to the limited presenceof unions. Figure 10.6 displays GWT as a function of both variables. Mo-bility as a function of age is U-shaped in all size classes. In small firms, it isnotably shifted upward compared to the large companies and has a flattershape. Most notably, the “small firm” effect dominates the age factor in de-termining mobility: individuals aged fifty and over working in small firms
380 Bruno Contini, Roberto Leombruni, Lia Pacelli, and Claudia Villosio
Table 10.3 Monthly wages in 1986 and 1991 and wage growth rate 1986–1991 formovers and stayers
Movers Stayers
N Mean SD N Mean SD
Wage 1986 9,641 1,731.2 548.2 20,526 1,906.7 604.2Wage 1991 9,641 2,805.2 1,138.3 20,526 3,042.3 1,184.5Wage growth rate 9,641 1.6 0.4 20,526 1.6
Source: Contini and Villosio (2003).

Tab
le 1
0.4
Ineq
ualit
y de
com
posi
tion
s by
pop
ulat
ion
subg
roup
s, 1
985
and
1996
Ave
rage
mon
thly
R
elat
ive
aver
age
The
il in
dex
Shar
es (%
)w
age
(199
9 pr
ices
)w
ages
(all
�1)
1985
1999
1985
1999
1985
1999
�w
age
(%)
1985
1999
A. A
ll71
134
100
100
1,53
21,
768
15.4
11
B. M
ale
s67
138
7166
1,62
81,
864
14.5
1.06
1.05
Fem
ale
s61
115
2934
1,29
81,
579
21.6
0.85
0.89
Wit
hin-
grou
p in
equa
lity
6613
1B
etw
een-
grou
p in
equa
lity
53
C. A
pp
ren
tice
4990
56
899
1,00
311
.60.
590.
57B
lue
coll
ar
4386
6560
1,43
11,
540
7.6
0.93
0.87
Whit
e co
llar
7111
529
331,
828
2,21
221
.01.
191.
25M
anage
rs36
340.
60.
84,
044
6,39
358
.12.
643.
62W
ithi
n-gr
oup
ineq
ualit
y53
97B
etw
een-
grou
p in
equa
lity
1837
D. N
ort
h68
133
6061
1,53
51,
797
17.0
1.00
1.02
Cen
ter
7414
019
191,
550
1,77
314
.41.
011.
00S
outh
7412
821
201,
508
1,66
910
.70.
980.
95W
ithi
n-gr
oup
ineq
ualit
y71
133
Bet
wee
n-gr
oup
ineq
ualit
y0.
00.
4
E. A
ge 1
5–24
5179
2316
1,17
91,
244
5.5
0.77
0.70
Age
25–34
4787
2835
1,50
11,
613
7.5
0.98
0.91
Age
35–
49
6813
335
361,
716
1,98
415
.61.
111.
12A
ge 5
0–
64
7516
814
131,
721
2,24
430
.41.
121.
27W
ithi
n-gr
oup
ineq
ualit
y60
118
Bet
wee
n-gr
oup
ineq
ualit
y10
16(c
on
tin
ued
)
F. M
anufa
cturi
ng
6414
956
481,
511
1,79
518
.80.
991.
02B
uil
din
g48
6612
101,
512
1,54
62.
40.
990.
87S
ervi
ces
8912
932
421,
578
1,79
013
.41.
031.
01W
ithi
n-gr
oup
ineq
ualit
y70
133
Bet
wee
n-gr
oup
ineq
ualit
y0.
21
H. F
ull
tim
e70
133
9990
1,53
11,
781
16.3
1.00
1.01
Part
tim
e10
413
71
101,
639
1,65
10.
81.
070.
93W
ithi
n-gr
oup
ineq
ualit
y71
134
Bet
wee
n-gr
oup
ineq
ualit
y0.
00.
3
So
urc
e:D
evic
ient
i (20
06).
No
te:
For
the
defin
itio
n of
wag
e, s
ee ta
ble
10.2
not
es.
Tab
le 1
0.4
(con
tinu
ed)
Ave
rage
mon
thly
R
elat
ive
aver
age
The
il in
dex
Shar
es (%
)w
age
(199
9 pr
ices
)w
ages
(all
�1)
1985
1999
1985
1999
1985
1999
�w
age
(%)
1985
1999

(ten to nineteen employees) have a 50 percent overall turnover, while indi-viduals aged twenty-five to twenty-nine employed in large firms (1000+)slightly exceed 30 percent.
Blue-collar workers are much more mobile than white-collar workers,who in turn are more mobile than managers (but the probability of a directjob-to-job change conditional to a move is much higher for managers thanfor any of the other categories). Moreover, the difference in mobility ofblue-collar workers with respect to white-collars has widened noticeablyover the years (Leombruni and Quaranta 2005). While GWT for white-collars has been stable at about 41 percent in the period, that for blue-collarsincreased from 69 percent in 1987–1989 to 78 percent in 1997–1999.
Wage Mobility and Dynamics in Italy in the 1990s 383
Table 10.5 Yearly worker flows, four subperiods, Italy
GrossSeparation Association worker Business
rate rate turnover cycle
1986–1990 29.86 32.53 62.39 Expansion1991–1993 28.77 28.01 56.78 Recession1994–1996 29.68 29.01 58.69 Recovery1997–1999 33.00 35.00 68.00 Expansion
Note: Percentage values, authors’ calculations based on WHIP data.
Fig. 10.6 Gross worker turnover by worker age and firm size, 1987 to 1999Source: Leombruni and Quaranta (2005).

10.2 Institutional Aspects of the Italian Labor Market
For many years, and at least through the late 1990s, Italy has beenrenowned as the European country with the most rigid labor market legis-lation. The OECD has widely contributed to this view. It may, therefore,appear strange, to say the least, that the magnitude of job and workerturnover in Italy (as reported in the previous paragraph and, in more de-tail, in section 10.3.3) has been among the highest in Europe, second onlyto the United Kingdom.
There can be no question that Italy’s labor legislation has been (and stillis today) swamped by a huge number of laws and bylaws, sometimespatently contradictory. Labor jurists sometimes refer to a peculiar di-chotomy between the “law in the books” and the “law in action.” This di-chotomy undoubtedly applies to Italy. Be it because of its internal con-tradictions, dubious interpretation, fragility of the system of controls,unapplied or inapplicable sanctions, illegal practices, and so on, the degreeof labor turnover in Italy by far exceeds what might be reasonably expectedunder its current legislative apparatus. The magnitude of Italy’s labor mar-ket flows is, to some extent, counterbalanced by the relative rigidity of thewage structure throughout the 1980s. One might say that the former is aconsequence of the latter, because quantities adjust when prices cannot.Also on the wage front, however, there have been interesting innovations inthe last decade, as witnessed by the trends toward rapidly increasing dif-ferentials of the 1990s (reported in section 10.3 of this report).
What follows is a summary of the most salient features of the institu-tional aspects of Italy’s labor market and its major changes in the lasttwenty-five years. The data we are presenting in this chapter end with 1998:they are, nevertheless, representative of the abnormal features of the Ital-ian labor market from the preceding perspective. In more recent years—since 2002—Italy’s labor legislation has undergone a vast deregulatoryprocess, as in many other European countries.
The early 1980s witnessed the most rigid “snapshot” of Italian labor mar-ket legislation that can be taken. It was characterized by centralized bar-gaining, by an egalitarian mechanism of wage increases, and by severe re-strictions both on hirings and firings. Nominal wages were indexed to pricesthrough an automatic mechanism known as scala mobile (escalator clause),whose rules were uniform across sectors. Indexation took place quarterly.Hirings involved almost exclusively open-end contracts. Manual workerswere selected almost exclusively from the unemployment workers’ lists heldby the public employment service, and not via direct selection mechanisms.Individual firings in firms with fifteen or more employees were admissibleonly under a “just cause” rule: workers dismissed without justifiable reasonhad the right to reinstatement. This rule, given the diffusion of small firmsin Italy, actually was not enforceable for about 35 percent of dependent em-
384 Bruno Contini, Roberto Leombruni, Lia Pacelli, and Claudia Villosio
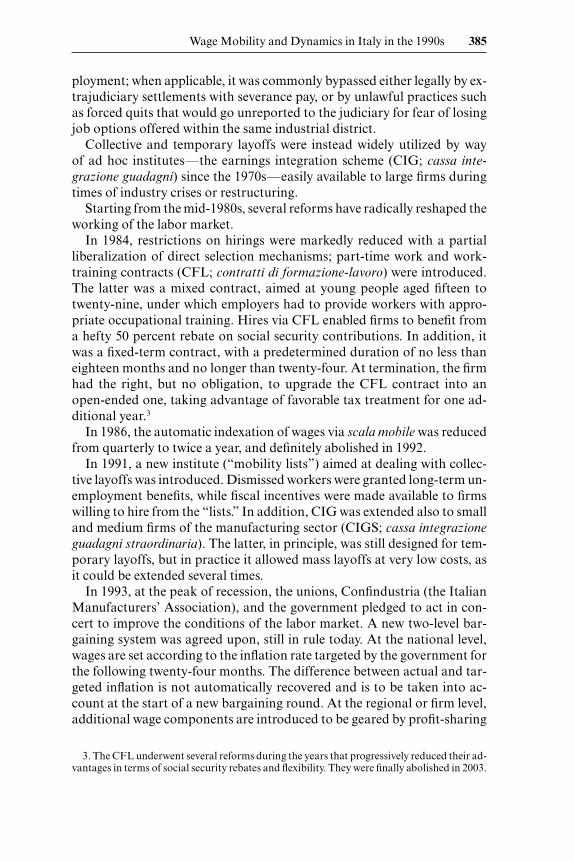
ployment; when applicable, it was commonly bypassed either legally by ex-trajudiciary settlements with severance pay, or by unlawful practices suchas forced quits that would go unreported to the judiciary for fear of losingjob options offered within the same industrial district.
Collective and temporary layoffs were instead widely utilized by way of ad hoc institutes—the earnings integration scheme (CIG; cassa inte-
grazione guadagni) since the 1970s—easily available to large firms duringtimes of industry crises or restructuring.
Starting from the mid-1980s, several reforms have radically reshaped theworking of the labor market.
In 1984, restrictions on hirings were markedly reduced with a partial liberalization of direct selection mechanisms; part-time work and work-training contracts (CFL; contratti di formazione-lavoro) were introduced.The latter was a mixed contract, aimed at young people aged fifteen totwenty-nine, under which employers had to provide workers with appro-priate occupational training. Hires via CFL enabled firms to benefit froma hefty 50 percent rebate on social security contributions. In addition, itwas a fixed-term contract, with a predetermined duration of no less thaneighteen months and no longer than twenty-four. At termination, the firmhad the right, but no obligation, to upgrade the CFL contract into anopen-ended one, taking advantage of favorable tax treatment for one ad-ditional year.3
In 1986, the automatic indexation of wages via scala mobile was reducedfrom quarterly to twice a year, and definitely abolished in 1992.
In 1991, a new institute (“mobility lists”) aimed at dealing with collec-tive layoffs was introduced. Dismissed workers were granted long-term un-employment benefits, while fiscal incentives were made available to firmswilling to hire from the “lists.” In addition, CIG was extended also to smalland medium firms of the manufacturing sector (CIGS; cassa integrazione
guadagni straordinaria). The latter, in principle, was still designed for tem-porary layoffs, but in practice it allowed mass layoffs at very low costs, asit could be extended several times.
In 1993, at the peak of recession, the unions, Confindustria (the ItalianManufacturers’ Association), and the government pledged to act in con-cert to improve the conditions of the labor market. A new two-level bar-gaining system was agreed upon, still in rule today. At the national level,wages are set according to the inflation rate targeted by the government forthe following twenty-four months. The difference between actual and tar-geted inflation is not automatically recovered and is to be taken into ac-count at the start of a new bargaining round. At the regional or firm level,additional wage components are introduced to be geared by profit-sharing
Wage Mobility and Dynamics in Italy in the 1990s 385
3. The CFL underwent several reforms during the years that progressively reduced their ad-vantages in terms of social security rebates and flexibility. They were finally abolished in 2003.
considerations. In a few years, firm-level bargaining spread in the majorityof large firms, while it was still negligible in the small-firm sector.
The new catchphrase of subsequent policies was “increasing flexibilityon all fronts.” As a matter of fact, most of the action took place in the la-bor market, while little was achieved in terms of product market flexibility.
In 1996, the so-called pacchetto Treu extended the range of possible workcontracts by introducing temporary work, by extending the applicability ofpart-time and fixed-term contracts, and by regulating the so-called para-
subordinato contract, a form of disguised self-employment. The portfolioof available contracts was further extended into twenty-one different ty-pologies in 2003, including job sharing, project work, and staff leasing.
As a consequence, from 1996 on, the standard open-end contracts lostimportance in favor of atypical ones, which began to represent the mostwidespread channel for entry into the labor market. In 2002, the share ofworkers with a fixed-term contract already accounted for 10 percent of to-tal employment—against an EU15 average of 13 percent (European Com-mission 2003).
10.3 Results
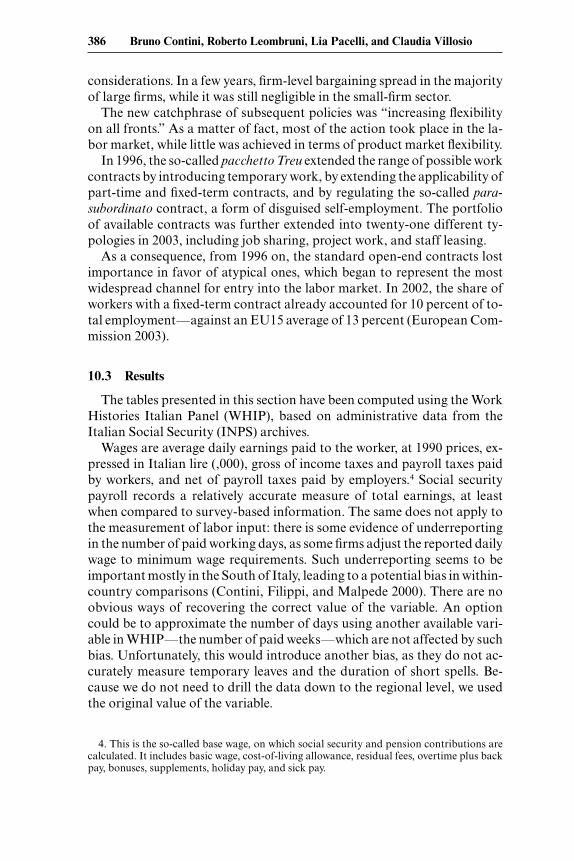
The tables presented in this section have been computed using the WorkHistories Italian Panel (WHIP), based on administrative data from theItalian Social Security (INPS) archives.
Wages are average daily earnings paid to the worker, at 1990 prices, ex-pressed in Italian lire (,000), gross of income taxes and payroll taxes paidby workers, and net of payroll taxes paid by employers.4 Social securitypayroll records a relatively accurate measure of total earnings, at leastwhen compared to survey-based information. The same does not apply tothe measurement of labor input: there is some evidence of underreportingin the number of paid working days, as some firms adjust the reported dailywage to minimum wage requirements. Such underreporting seems to beimportant mostly in the South of Italy, leading to a potential bias in within-country comparisons (Contini, Filippi, and Malpede 2000). There are noobvious ways of recovering the correct value of the variable. An optioncould be to approximate the number of days using another available vari-able in WHIP—the number of paid weeks—which are not affected by suchbias. Unfortunately, this would introduce another bias, as they do not ac-curately measure temporary leaves and the duration of short spells. Be-cause we do not need to drill the data down to the regional level, we usedthe original value of the variable.
386 Bruno Contini, Roberto Leombruni, Lia Pacelli, and Claudia Villosio
4. This is the so-called base wage, on which social security and pension contributions arecalculated. It includes basic wage, cost-of-living allowance, residual fees, overtime plus backpay, bonuses, supplements, holiday pay, and sick pay.

For worker-based statistics, we select all blue- and white-collar workerswith a job spell active during the month of May of the year of interest,working full-time, in firms employing at least twenty employees.
For firm-based statistics, WHIP is a 1:90 random sample of workers.Hence, we do not have a representative sample of the workforce in small-and medium-sized firms. This is not an issue for tables in section 10.3.3 onmobility indicators: the monthly employment stock and the average wageof each firm are reported in WHIP, yielding good approximations of entryand exit rates. For the tables in sections 10.3.1 and 10.3.2, in contrast, wepooled together firms into cells—called “synthetic firms”—in order tohave enough individual observations to compute firm wage and wagechange distributions. The 800-cells grid is based on the following partition:
• Geography: twenty Italian regions• Firm size: five classes (20 to 49, 50 to 99, 100 to 199, 200 to 499, 500+
workers)• Sector of activity: forty-four classes (Nace-70 two-digit sectors)
More details on the data and a discussion on the synthetic firm approachcan be found in the methodological appendix.
10.3.1 Structure of Wages between and within Firms
Table 10.6 includes two sets of statistics: worker-based (referred to as“observation = one person”) and firm-based (referred to as “observation= one firm”).
Worker-based statistics confirm several stylized facts well known in theliterature. Average individual wage and standard deviation increase withworker age, reflecting the wider range of career paths experienced as work-ers grow older. The dispersion of individual wages in Italy is in line with theother countries included in this book. It is not far from that of Norway andSweden, but it is high with respect to Denmark and Finland: in Italy, theP90-P50 ratio is 1.7, and P10-P50 is 0.7 (in Denmark and Finland, thesestatistics are much closer to 1).
Firm-based statistics introduce new hints. Average firm wage is lowerthan average individual wage, reflecting the fact that small firms pay (on av-erage) lower wages than large ones. The ratio of between-firms wage vari-ability relative to the country’s average wage is 13 percent, similar to othercountries included in this book, except the Netherlands and the UnitedStates (see figure I.5 in the introduction of this volume). Within-firm wagevariability represents about two-thirds of total variability (25.87 against33.36 in 1998), and is larger than between-firm variability (12.52 in 1998).5
Wage Mobility and Dynamics in Italy in the 1990s 387
5. The true difference between the two, however, may be upward biased, as statistics basedon synthetic firms tend to underestimate between-firm variability and overestimate within-firm variability, as a consequence of attributing to “within cell” the variability “between firmsbelonging to the same cell” (see the methodological appendix).
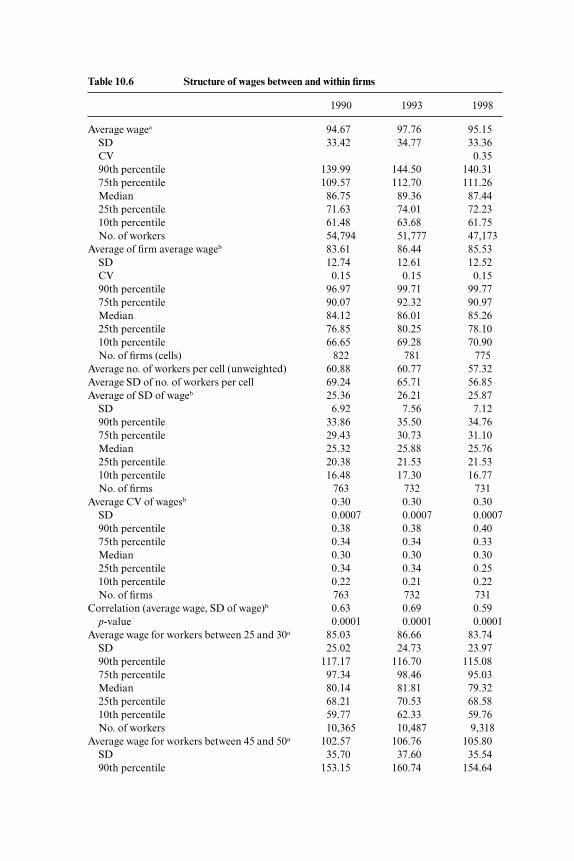
Table 10.6 Structure of wages between and within firms
1990 1993 1998
Average wagea 94.67 97.76 95.15SD 33.42 34.77 33.36CV 0.3590th percentile 139.99 144.50 140.3175th percentile 109.57 112.70 111.26Median 86.75 89.36 87.4425th percentile 71.63 74.01 72.2310th percentile 61.48 63.68 61.75No. of workers 54,794 51,777 47,173
Average of firm average wageb 83.61 86.44 85.53SD 12.74 12.61 12.52CV 0.15 0.15 0.1590th percentile 96.97 99.71 99.7775th percentile 90.07 92.32 90.97Median 84.12 86.01 85.2625th percentile 76.85 80.25 78.1010th percentile 66.65 69.28 70.90No. of firms (cells) 822 781 775
Average no. of workers per cell (unweighted) 60.88 60.77 57.32Average SD of no. of workers per cell 69.24 65.71 56.85Average of SD of wageb 25.36 26.21 25.87
SD 6.92 7.56 7.1290th percentile 33.86 35.50 34.7675th percentile 29.43 30.73 31.10Median 25.32 25.88 25.7625th percentile 20.38 21.53 21.5310th percentile 16.48 17.30 16.77No. of firms 763 732 731
Average CV of wagesb 0.30 0.30 0.30SD 0.0007 0.0007 0.000790th percentile 0.38 0.38 0.4075th percentile 0.34 0.34 0.33Median 0.30 0.30 0.3025th percentile 0.34 0.34 0.2510th percentile 0.22 0.21 0.22No. of firms 763 732 731
Correlation (average wage, SD of wage)b 0.63 0.69 0.59p-value 0.0001 0.0001 0.0001
Average wage for workers between 25 and 30a 85.03 86.66 83.74SD 25.02 24.73 23.9790th percentile 117.17 116.70 115.0875th percentile 97.34 98.46 95.03Median 80.14 81.81 79.3225th percentile 68.21 70.53 68.5810th percentile 59.77 62.33 59.76No. of workers 10,365 10,487 9,318
Average wage for workers between 45 and 50a 102.57 106.76 105.80SD 35.70 37.60 35.5490th percentile 153.15 160.74 154.64

The ratio of the between-firm wage variability relative to total wage vari-ability is sizeable in all countries, and Italy is no exception (see figure I.4 inthe introduction of this volume). In Italy, it is sizeable also with respect toother decompositions (see section 10.1.2). Characteristics like gender, ge-ographical area, and industry account for a negligible part of the total vari-ance of wages. The results presented in section 10.1.2 are not directly com-parable with table 10.6, as the one displayed in the latter is not an exactdecomposition.6 However, this is an indication of the importance of firmwage policies in shaping the wage distribution, a point that seems to over-rule the importance of individual observable characteristics.
Figure 10.7 adds to the point. Panel A shows P10, P50, and P90 of thewithin-firm wage distribution at the end of the period (based on firms—here not synthetic firms—of which we observe at least ten workers), rankedby firm-average wage. Indeed “the tide lifts all boats,” as all percentiles in-crease with average firm wage. In addition, the spread becomes larger withincreasing average wage, especially in the P90 band. Workers receiving“low” wages (P10) from a high-wage firm are paid more than many work-ers receiving “high” wages (P90) from a low-wage firm. This is true not onlyin large firms, like those included in panel A, but also among small firms,as shown in panel B, which refers to firms employing ten or more workersof two Veneto provinces for which we have population data (see appendixfor details). This finding strongly suggests that firms do not follow a paycompression model in their wage policy.
Also, the widening of within-firm wage differentials as average wages in-crease is at odds with the hypothesis that firms are homogeneous with re-spect to human capital (all workers alike in terms of skills, productivity, ef-fort). It rather points to a substantial amount of worker heterogeneityrewarded according to human capital, at least among the medium-large
Wage Mobility and Dynamics in Italy in the 1990s 389
6. Total variability do not decompose into the within and between components reported intable 10.6, although it is positively correlated with both. An exact decomposition, for in-stance, is that reported in equation (1) in the introduction to the volume.
75th percentile 119.68 124.88 124.51Median 94.53 97.86 99.0025th percentile 77.76 80.79 81.1610th percentile 66.25 68.40 67.38No. of workers 7,844 8,343 7,489
Notes: CV � coefficient of variation; SD � standard deviation.aObservation � a person.bObservation � a firm.
Table 10.6 (continued)
1990 1993 1998

firms. It is also consistent with the impact of a bargaining system that hasbeen decentralized during the period under examination (see section 10.2).Today, almost all large firms in Italy bargain over wages with unions at thefirm level, holding the nationwide industry contract as a benchmark. Thisis less frequent among small firms, which at times refer to local agreementsat the district level. In addition, both the correlation between firm-averagewages and within-firm SD (0.59 in 1998), and the average coefficient ofvariation increasing from P10 to P90 (table 10.6) confirm that job hetero-
390 Bruno Contini, Roberto Leombruni, Lia Pacelli, and Claudia Villosio
Fig. 10.7 Tide raises all boats: A, Mean versus P10-P50-P90; Italy, firmsemploying more than 1,000 workers, 1998; B, Mean versus P10-P50-90; Trevisoand Vicenza, firms employing more than ten workers, 1998
A
B
geneity increases with firm size. In general, the task of ascertaining thesource of the firm-specific wage policy (the firm itself or the bargainingprocess with unions) is hard, but the conclusion still holds: firm wage pol-icy shows its relevance in all of these statistics.
10.3.2 Wage Dynamics
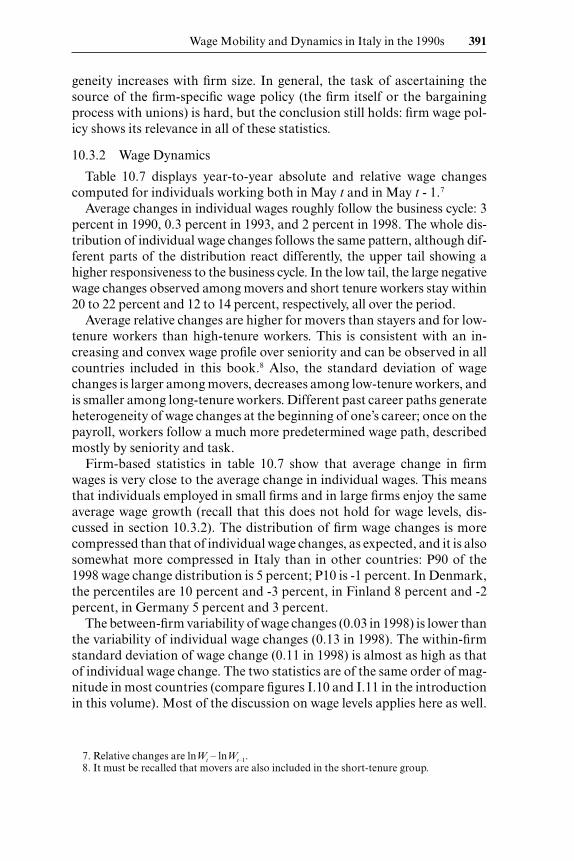
Table 10.7 displays year-to-year absolute and relative wage changescomputed for individuals working both in May t and in May t - 1.7
Average changes in individual wages roughly follow the business cycle: 3percent in 1990, 0.3 percent in 1993, and 2 percent in 1998. The whole dis-tribution of individual wage changes follows the same pattern, although dif-ferent parts of the distribution react differently, the upper tail showing ahigher responsiveness to the business cycle. In the low tail, the large negativewage changes observed among movers and short tenure workers stay within20 to 22 percent and 12 to 14 percent, respectively, all over the period.
Average relative changes are higher for movers than stayers and for low-tenure workers than high-tenure workers. This is consistent with an in-creasing and convex wage profile over seniority and can be observed in allcountries included in this book.8 Also, the standard deviation of wagechanges is larger among movers, decreases among low-tenure workers, andis smaller among long-tenure workers. Different past career paths generateheterogeneity of wage changes at the beginning of one’s career; once on thepayroll, workers follow a much more predetermined wage path, describedmostly by seniority and task.
Firm-based statistics in table 10.7 show that average change in firmwages is very close to the average change in individual wages. This meansthat individuals employed in small firms and in large firms enjoy the sameaverage wage growth (recall that this does not hold for wage levels, dis-cussed in section 10.3.2). The distribution of firm wage changes is morecompressed than that of individual wage changes, as expected, and it is alsosomewhat more compressed in Italy than in other countries: P90 of the1998 wage change distribution is 5 percent; P10 is -1 percent. In Denmark,the percentiles are 10 percent and -3 percent, in Finland 8 percent and -2percent, in Germany 5 percent and 3 percent.
The between-firm variability of wage changes (0.03 in 1998) is lower thanthe variability of individual wage changes (0.13 in 1998). The within-firmstandard deviation of wage change (0.11 in 1998) is almost as high as thatof individual wage change. The two statistics are of the same order of mag-nitude in most countries (compare figures I.10 and I.11 in the introductionin this volume). Most of the discussion on wage levels applies here as well.
Wage Mobility and Dynamics in Italy in the 1990s 391
7. Relative changes are lnWt – lnWt–1.8. It must be recalled that movers are also included in the short-tenure group.

Table 10.7 Wage dynamics
Logs Levels
1989– 1992– 1997– 1989– 1992– 1997–1990 1993 1998 1990 1993 1998
Average change in wagea 0.03 0.003 0.02 3.58 0.21 2.20SD 0.14 0.12 0.13 11.88 10.26 10.2590th percentile 0.16 0.11 0.14 16.36 10.78 13.0975th percentile 0.08 0.04 0.06 8.01 4.06 5.84Median 0.03 –0.00 0.02 2.29 –0.01 1.4725th percentile –0.02 –0.04 –0.02 –1.58 –3.93 –1.9310th percentile –0.08 –0.10 –0.08 –7.34 –10.26 –7.65No. of workers 50,244 48,871 43,377 50,244 48,871 43,377
Average of firm average change in wageb 0.03 0.005 0.02 2.86 0.47 2.07
SD 0.03 0.02 0.03 2.32 1.84 2.2090th percentile 0.06 0.03 0.05 5.48 2.43 4.7875th percentile 0.04 0.02 0.04 3.89 1.56 3.28Median 0.03 0.01 0.02 2.64 0.57 2.1425th percentile 0.02 –0.01 0.01 1.51 –0.38 0.5410th percentile 0.00 –0.03 –0.01 0.48 –2.08 –0.62No. of firms (cells) 791 761 734 791 761 734
Average no. of workers per cell (unweighted) 52.81 55.45 49.91 52.81 55.45 49.91
Average SD of no. of workers per cell 63.23 63.35 51.66 63.23 63.35 51.66
Average of SD of change in wageb 0.13 0.11 0.11 9.75 8.76 8.50SD 0.05 0.03 0.04 2.54 2.10 2.0990th percentile 0.19 0.15 0.16 13.17 11.40 10.9975th percentile 0.14 0.12 0.12 10.93 10.06 9.57Median 0.12 0.10 0.10 9.58 8.57 8.3225th percentile 0.10 0.09 0.09 8.17 7.41 7.3010th percentile 0.08 0.07 0.07 6.81 6.41 5.99No. of firms (cells) 739 713 687 739 713 687
Average CV of change in wagesb 9.03 6.33 0.004 5.50 3.13 4.64SD 0.76 0.58 0.53 0.18 0.64 0.4390th percentile 14.42 23.07 14.82 11.91 21.17 14.8275th percentile 5.76 8.63 5.16 4.88 8.80 4.8325th percentile 2.38 –6.37 1.61 2.37 –4.90 1.7210th percentile 1.28 –17.35 –9.42 1.57 –22.82 –6.00No. of firms (cells) 739 713 687 739 713 687
Average change in wage for peopls who change firma,c 0.06 0.02 0.06 4.91 1.53 3.75
SD 0.25 0.22 0.24 18.17 16.23 16.5290th percentile 0.35 0.27 0.33 28.40 22.39 25.4375th percentile 0.17 0.13 0.17 14.25 10.43 13.54Median 0.05 0.01 0.04 3.69 1.08 3.1125th percentile –0.06 –0.09 –0.07 –4.90 –7.60 –6.0210th percentile –0.20 –0.22 –0.21 –16.50 –19.23 –17.40No. of workers 4,775 3,344 3,496 4,775 3,344 3,496

Firm wage policy matters in shaping not only the wage level distributionbut also the wage change distribution.
10.3.3 Mobility
Focus: Firm Data, Turnover, and Legal Transformations
• The WHIP reports the monthly employment stock and average wageof each firm. The employment stock counts all workers, including parttime, apprentices, and managers, excluded from the previous tables.
• We use the monthly employment series to approximate worker flows:positive monthly changes in employment are association, and negativechanges are separations. The sum of monthly associations (separa-tions) relative to the average yearly employment is the firm association(separations) rate.
• There are two sources of measurement error. The first is that we missacross-month churning: if a worker exits during a given month and his
Wage Mobility and Dynamics in Italy in the 1990s 393
Average change in wage for people with tenure �3 yearsa 0.05 0.02 0.04 4.50 1.48 3.22
SD 0.19 0.16 0.17 14.06 12.30 12.3390th percentile 0.23 0.17 0.21 20.57 15.48 17.6875th percentile 0.12 0.08 0.10 10.02 6.60 8.48Median 0.04 0.01 0.03 3.22 0.90 2.3925th percentile –0.02 –0.04 –0.03 –1.64 –3.63 –2.0110th percentile –0.12 –0.14 –0.12 –9.70 –12.05 –9.98No. of workers 13,305 11,133 10,782 13,305 11,133 10,782
Average change in wage for people with tenure �3 yearsa 0.03 0.00 0.02 3.25 –0.16 1.87
SD 0.12 0.10 0.11 10.97 9.54 9.4490th percentile 0.14 0.09 0.11 14.87 9.37 11.5075th percentile 0.07 0.04 0.05 7.29 3.40 5.08Median 0.02 0.00 0.01 2.03 –0.24 1.2725th percentile –0.02 –0.04 –0.02 –1.56 –3.99 –1.9110th percentile –0.07 –0.09 –0.07 –6.66 –9.77 –7.09No. of workers 36,939 37,738 32,595 36,939 37,738 32,595
Notes: SD � standard deviation; CV � coefficient of variation.aObservation � a person.bObservation � a firm.cThese are true firm changes as we don’t need to pool together observations into synthetic firms.
Table 10.7 (continued)
Logs Levels
1989– 1992– 1997– 1989– 1992– 1997–1990 1993 1998 1990 1993 1998

or her position is filled in the following month, we do not observe anymonthly change in the employment stock, as the latter is measured asthe number of heads present in the payroll in a given month. The sec-ond one is that it is—not surprisingly—difficult to control for legaltransformations. We handle this problem by computing monthlychanges from January to November only and reweighting to twelvemonths, as most legal transformations take place between Decemberand January (end of the Italian fiscal year). Furthermore, we excludeentry and exit rates above 200 percent. The exclusion of spuriousmovements remains, however, far from perfect.
• The firm-average wage refers to white- and blue-collar workers only.Firms are selected if they employ at least twenty employees.
The sum of entry (associations) and exit (separations) rates measured onworker data yields a gross turnover of about 47 percent in 1998. This is theturnover rate relative to people working in firms with more than twentyemployees.9 When computing the same statistics with firm data, we tend to overestimate all rates. The overestimate in entry and exit rates is largerduring the 1993 downturn, while they are more precisely estimated in 1998and 1990. The imperfect control of legal transformations may explain theupward bias when large reorganizations take place (see preceding bulletedlist).
Low-wage firms almost always show the highest positive net flows, whichis consistent with what is observed in other countries. This is explained bythe correlation between average firm size and firm wages, as in Italy mostjob creation occurs in the small-firm sector. Top-decile firms have highernet flows than top-quartile ones, due to the better growth performance offirms with highly skilled workforce. The positive correlation between aver-age firm size and firm wages also explains the ranking in turnover levels,with low-wage firms showing the highest turnover.
Finally, the correlation between firm size and within-firm individual sen-iority is positive, and exit rates decline as wages increase. All this is consis-tent with the working of internal labor markets that provide opportunitiesfor advancement without leaving the firm and with declining external wageoffers that dominate current wages as the latter increase (see table 10.8).
10.4 Conclusions
In spite of the centralized nature of wage bargaining in Italy, we findsome evidence suggesting the existence of firm-wage policies. First, the ra-tio of the between-firm wage variability relative to total wage variability issizeable and not very dissimilar from that reported for other countries. In
394 Bruno Contini, Roberto Leombruni, Lia Pacelli, and Claudia Villosio
9. The same figure is about 60 percent considering all firms; see section 10.1.3.

Italy, it is sizeable also with respect to other decompositions: characteris-tics like gender, geographical area, and industry account for a negligiblepart of the total variance of wages. Second, the tide raising all boats is alsoquite suggestive: not only do individual wages throughout the whole dis-tribution increase as average firm wages increase, but the spread increasestoo as we move from P10 to P90, indicating that the rewards of high-pay in-dividuals are highly differentiated even within the same employer. This iscoherent with the detected positive correlation between firm size and firmwages. In Italy, almost all large firms directly bargain over wages withunions, holding the nationwide industry contract as a benchmark. This isless frequent among small firms, which at times refer to local agreementsat the district level.
Firm wage policy matters in shaping not only the wage level distribution
Wage Mobility and Dynamics in Italy in the 1990s 395
Table 10.8 Mobility
Entry Exit Net
1990 1993 1998 1990 1993 1998 1990 1993 1998
Rate (person) 0.22 0.16 0.24 0.21 0.19 0.23 0.01 –0.03 0.01
Rate 0.26 0.25 0.25 0.20 0.25 0.20 0.05 0.01 0.04SD 0.29 0.30 0.27 0.23 0.30 0.23 0.27 0.28 0.25
Rate, top decile of firm wages 0.28 0.24 0.21 0.16 0.23 0.15 0.12 0.01 0.06
SD 0.36 0.33 0.28 0.24 0.32 0.22Rate, top quartile of
firm wages 0.25 0.22 0.20 0.17 0.23 0.16 0.08 –0.01 0.04SD 0.32 0.29 0.25 0.23 0.31 0.22
Rate, bottom quartile of firm wages 0.30 0.31 0.33 0.23 0.29 0.25 0.07 0.02 0.08
SD 0.31 0.34 0.32 0.23 0.31 0.25Rate, bottom decile
of firm wages 0.34 0.37 0.38 0.25 0.33 0.29 0.09 0.04 0.09SD 0.34 0.39 0.37 0.24 0.35 0.28
1990 1993 1998
Employees 90.62 87.85 88.25SD 745.67 670.58 603.96
Correlation (exit rate, average wage) –0.06 –0.03 0.00p-value 0.00 0.00 0.56
Corr-size-tenure,a obs: person n.a n.a. 0.199p-value 0.00
Exit-90% wage, obs: person 0.170 0.174 0.192Exit-median-wage, obs: person 0.172 0.189 0.183Exit 10%-wage, obs: person 0.430 0.378 0.511
Notes: SD � standard deviation; n.a. � not applicable.aElapsed tenure May 1998, truncated at 161 months.

but also the wage change distribution. The within-firm standard deviationof wage change is almost as high as that of individual wage change, andmuch higher than between-firm variability of average change in wages.Worker-based statistics, on the other side, show that relative changes in in-dividual wages follow the business cycle, although different parts of thedistribution react differently, the upper tail showing a higher responsive-ness. Both facts are at odds with the often-reported rigidity of Italian wages.Indeed, the detected flexibility is mainly driven by movers and short-tenureworkers, who show higher and more dispersed relative wage changes. Dif-ferent past career paths generate heterogeneity of wage changes at the be-ginning of one’s career within each firm. Once workers become insiders,they follow a predetermined wage path according to seniority and task.
The preceding results, and the simple comparisons between stayers’ andmovers’ wages (see table 10.3), are in line with well-established facts: wagegrowth (on impact) is often higher among movers, while wage levels arelower compared to stayers, before and, often, also after the job switch.Along similar lines suggested by Lazear and Shaw, we find that negativewage growth is more common among movers and short-tenure workers. Inaddition, worker entry and exit rates are higher at low-pay firms and lowerat high-pay firms. This stylized fact is, however, of more difficult interpre-tation, as composition effects due to the high correlation between firm sizeand wages may hide the conclusion. Nor do we have any direct evidencethat voluntary mobility is higher where wage compression is high. Thecross-country comparison suggests that the relatively high degree of wagecompression in Italy could be associated with higher entry and exit rates,but, as Lazear and Shaw emphasize in the introduction to this volume, onemust be cautious with this comparison, as the different data sets used inthis book measure exit over different time intervals and types of jobs.
Methodological Appendix
Data Used
In order to produce the tables presented, we used the Work HistoriesItalian Panel (WHIP), a database developed at the LABORatorio R. Re-velli based on administrative data from the Italian Social Security (INPS).
For the purpose of this chapter, we used the WHIP section on depend-ent employment, which is a Linked Employer-Employee Database madeup of a 1:90 sample of employees over the period from 1985 up to 2001. Details on the database and a public use file can be found at http://www.laboratoriorevelli.it/whip.
396 Bruno Contini, Roberto Leombruni, Lia Pacelli, and Claudia Villosio

Treatment of Legal Transformations, Mergers, and Acquisitions
The use of administrative data on firms poses the problem of the treat-ment of legal transformations. Administrative archives treat events such asownership transfers, bequests, donations, and legal transformations as ifthey were firms’ start-ups and closures, even if these events do not producea real interruption in the life of a firm. These events generate spurious flowsof firms, jobs, and workers.
The WHIP database detects and corrects legal transformations firstthrough a longitudinal firm identification algorithm that builds directly onthe firm data provided by INPS. This algorithm is particularly suited tocorrect for mergers and acquisitions involving establishment or plants.
Moreover, the linkage between employees and the firms for which theyare working enables to detect other legal transformations tracking simu-ltaneous flows of workers between two or more firms. The key is to dis-criminate between normal movements, deriving from workers’ decisions tochange jobs, and spurious movements. It is intuitively unlikely that manyworkers of a company independently and simultaneously decide to movetogether to another firm, whereas this event will take place if all, or part of,the activities of the first firm are transferred to the second firm, or if the sec-ond firm is just a legal transformation of the first. In order to identify spu-rious components, a threshold for the intensity of such movements hasbeen established. Given the WHIP sampling ratio, the observation of twoworkers moving within one month from the same firm (call it A) to a samefirm (call it B) would statistically mean that, on average, firm A has handedover about 180 workers to firm B. Thus, if we observe in the same month atleast two workers moving from firm A to firm B, we treat it as a spuriousmovement. Once spurious movements are detected, we reconnect the jobspells of every worker involved in the simultaneous job change.
The Synthetic Firm Approach
Because WHIP is a 1:90 random sample of workers, we do not have arepresentative sample of employees working in small- and medium-sizedfirms. In addition, we observe the average wage paid to blue and white col-lars, but not the standard deviation. Only if the firm is sufficiently large isthe number of observed workers sufficient to estimate the standard devia-tion of wages. For 99 percent of firms recorded in WHIP, we have less thanten workers belonging to the same firm; for 83 percent of them, we have justone worker.
In order to compute firm-based statistics in section 10.3, then, we pooledtogether firms into cells, called “synthetic firms.” The synthetic firm ap-proach leads to an underestimation of between-firm variability and to aparallel overestimation of within-firm variability as we attribute to “within
Wage Mobility and Dynamics in Italy in the 1990s 397

cell” the variability between firms belonging to the same cell. To limit thisbias, we chose the finest grid granting a sufficient number of observationsper cell. After several explorations, we ended up with an 800-cell grid alongthe following partitions:
• Geography: twenty Italian regions• Firm size: five classes (20 to 49, 50 to 99, 100 to 199, 200 to 499, 500+
workers)10
• Sector of activity: forty-four classes (Nace-70 two-digit sectors)
Each cell has been weighted with the actual number of firms with thesame characteristics in the population, as published by “Osservatorio
INPS,” the official aggregate statistics on the population produced by INPS.The validity of the synthetic firm approach is tested using a data set that
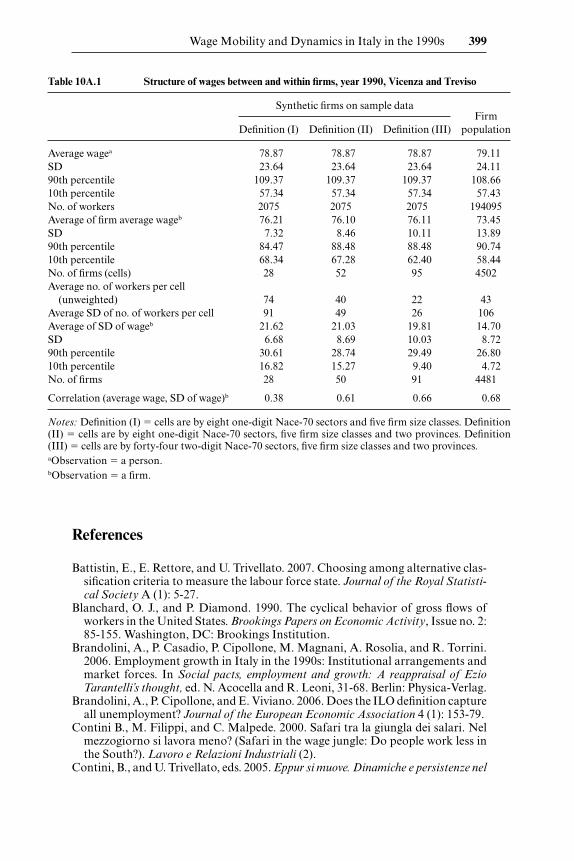
covers the whole population of workers and firms located in two provincesof Veneto, in the Italian Northeast (Treviso and Vicenza). On this data set, we mimicked the sampling procedure that generates WHIP and thenpooled the resulting firm sample using three different synthetic firm defini-tions. We are, therefore, in a position to evaluate how within- and between-variance estimates vary at increasing levels of cell disaggregation and howfar we are from statistics measured in the firm population.
Results are as follows:
1. Worker-based statistics computed in the sample are quite close totrue values (and, obviously, do not change at different synthetic firm defi-nitions).
2. As expected, between-firm variability is always underestimated insynthetic firms with respect to population values, while within-firm vari-ability is overestimated. Comparing the three definitions we have that ascells become smaller, the bias decreases. This is particularly true for the between-firm variability, which increases from 7.32 to 10.11 (the true valuebeing 13.89).
3. The correlation between average wage and standard deviation ofwage, at the highest level of disaggregation, is almost equal to the correla-tion computed at the firm level.
398 Bruno Contini, Roberto Leombruni, Lia Pacelli, and Claudia Villosio
10. Firms under twenty employees have been excluded for cross-country comparability.
References
Battistin, E., E. Rettore, and U. Trivellato. 2007. Choosing among alternative clas-sification criteria to measure the labour force state. Journal of the Royal Statisti-cal Society A (1): 5-27.
Blanchard, O. J., and P. Diamond. 1990. The cyclical behavior of gross flows ofworkers in the United States. Brookings Papers on Economic Activity, Issue no. 2:85-155. Washington, DC: Brookings Institution.
Brandolini, A., P. Casadio, P. Cipollone, M. Magnani, A. Rosolia, and R. Torrini.2006. Employment growth in Italy in the 1990s: Institutional arrangements andmarket forces. In Social pacts, employment and growth: A reappraisal of EzioTarantelli’s thought, ed. N. Acocella and R. Leoni, 31-68. Berlin: Physica-Verlag.
Brandolini, A., P. Cipollone, and E. Viviano. 2006. Does the ILO definition captureall unemployment? Journal of the European Economic Association 4 (1): 153-79.
Contini B., M. Filippi, and C. Malpede. 2000. Safari tra la giungla dei salari. Nelmezzogiorno si lavora meno? (Safari in the wage jungle: Do people work less inthe South?). Lavoro e Relazioni Industriali (2).
Contini, B., and U. Trivellato, eds. 2005. Eppur si muove. Dinamiche e persistenze nel
Wage Mobility and Dynamics in Italy in the 1990s 399
Table 10A.1 Structure of wages between and within firms, year 1990, Vicenza and Treviso
Synthetic firms on sample dataFirm
Definition (I) Definition (II) Definition (III) population
Average wagea 78.87 78.87 78.87 79.11SD 23.64 23.64 23.64 24.1190th percentile 109.37 109.37 109.37 108.6610th percentile 57.34 57.34 57.34 57.43No. of workers 2075 2075 2075 194095Average of firm average wageb 76.21 76.10 76.11 73.45SD 7.32 8.46 10.11 13.8990th percentile 84.47 88.48 88.48 90.7410th percentile 68.34 67.28 62.40 58.44No. of firms (cells) 28 52 95 4502Average no. of workers per cell
(unweighted) 74 40 22 43Average SD of no. of workers per cell 91 49 26 106Average of SD of wageb 21.62 21.03 19.81 14.70SD 6.68 8.69 10.03 8.7290th percentile 30.61 28.74 29.49 26.8010th percentile 16.82 15.27 9.40 4.72No. of firms 28 50 91 4481
Correlation (average wage, SD of wage)b 0.38 0.61 0.66 0.68
Notes: Definition (I) � cells are by eight one-digit Nace-70 sectors and five firm size classes. Definition(II) � cells are by eight one-digit Nace-70 sectors, five firm size classes and two provinces. Definition(III) � cells are by forty-four two-digit Nace-70 sectors, five firm size classes and two provinces.aObservation � a person.bObservation � a firm.

mercato del lavoro Italiano (Still, it moves: Dynamics and persistence in the Ital-ian labor market). Bologna: Il Mulino.
Contini, C., and C. Villosio. 2003. Worker mobility, job displacement and wage dy-namics in Italy. LABORatorio R. Revelli Working Paper no. 24.
Davis, S. J., and J. Haltiwanger. 1999. Gross job flows. In Handbook of labor eco-nomics. Vol. 3B, ed. O. Ashenfelter, and D. Card, 2711-2805. Amsterdam: North-Holland.
Devicienti, F. 2006. Earnings mobility in Italy, 1985-1999. Mimeograph.European Commission. 2003. Employment in Europe 2003. Luxembourg: Office for
Official Publications of the European Communities.Leombruni, R., and R. Quaranta. 2002. Worker mobility: Structural changes and
cyclical behaviour. In Labor mobility and wage dynamics in Italy, ed. B. Contini,91-176. Turin, Italy: Rosemberg & Sellier.
———. 2005. Eppure si muoveva già: Una breve storia della mobilità dei lavoratoriin Italia (Still, it already moved: A brief history on workers mobility in Italy). InEppur si muove: Dinamiche e persistenze nel mercato del lavoro Italiano, ed. B.Contini and U. Trivellato, 205-36. Bologna: Il Mulino.
Organization for Economic Cooperation and Development (OECD). 2004. Ageingand employment policies—Italy. Paris: OECD.
.
400 Bruno Contini, Roberto Leombruni, Lia Pacelli, and Claudia Villosio