Occupational Employment and Wage Estimates 2015
30
-
Upload
khangminh22 -
Category
Documents
-
view
0 -
download
0
Transcript of Occupational Employment and Wage Estimates 2015

Equal Opportunity Employer/ProgramAuxiliary aids and services available upon request to individuals with disabilities: TTY 800-582-2233
Created by the
Labor Market Information Department
Helping Mississippians Get Jobs
2015Occupational Employmentand Wage Estimates
Mississippi Partnership WIA
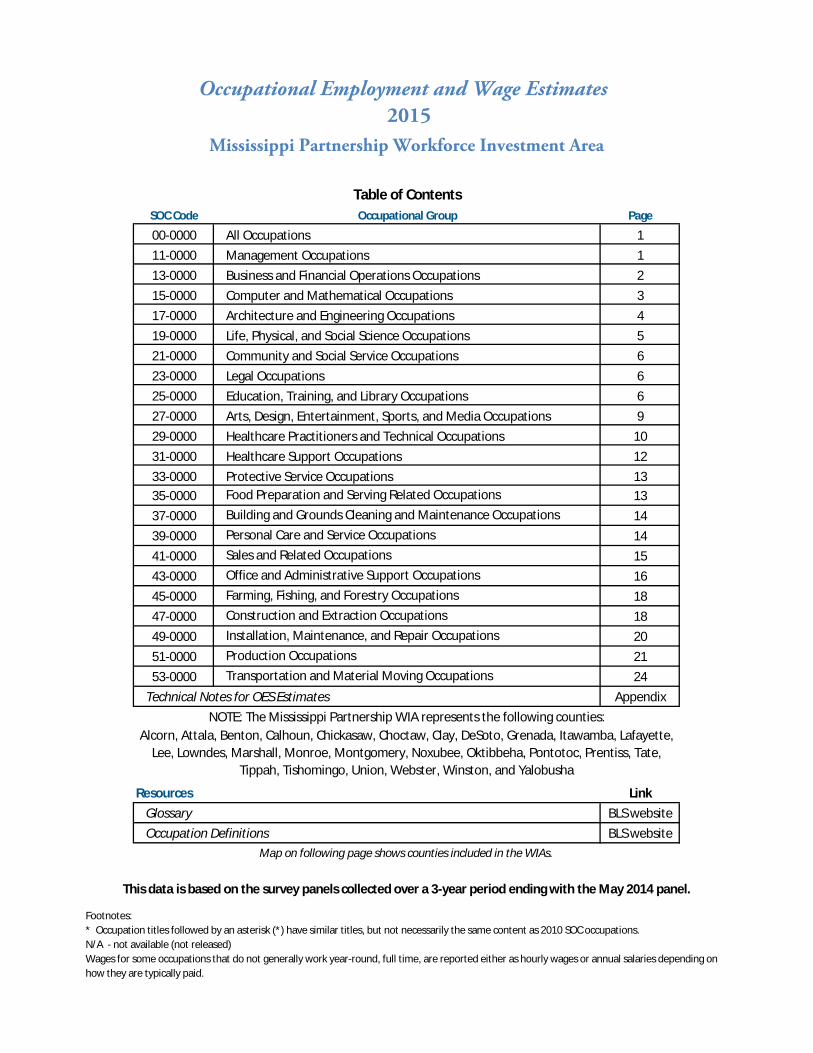
Table of ContentsSOC Code Occupational Group Page
00-0000 All Occupations 111-0000 Management Occupations 113-0000 Business and Financial Operations Occupations 215-0000 Computer and Mathematical Occupations 317-0000 Architecture and Engineering Occupations 419-0000 Life, Physical, and Social Science Occupations 521-0000 Community and Social Service Occupations 623-0000 Legal Occupations 625-0000 Education, Training, and Library Occupations 627-0000 Arts, Design, Entertainment, Sports, and Media Occupations 929-0000 Healthcare Practitioners and Technical Occupations 1031-0000 Healthcare Support Occupations 1233-0000 Protective Service Occupations 1335-0000 Food Preparation and Serving Related Occupations 1337-0000 Building and Grounds Cleaning and Maintenance Occupations 1439-0000 Personal Care and Service Occupations 1441-0000 Sales and Related Occupations 1543-0000 Office and Administrative Support Occupations 1645-0000 Farming, Fishing, and Forestry Occupations 1847-0000 Construction and Extraction Occupations 1849-0000 Installation, Maintenance, and Repair Occupations 2051-0000 Production Occupations 2153-0000 Transportation and Material Moving Occupations 24
Appendix
LinkBLS websiteBLS website
Map on following page shows counties included in the WIAs.
Occupational Employment and Wage Estimates 2015
Mississippi Partnership Workforce Investment Area
Footnotes:* Occupation titles followed by an asterisk (*) have similar titles, but not necessarily the same content as 2010 SOC occupations.N/A - not available (not released)Wages for some occupations that do not generally work year-round, full time, are reported either as hourly wages or annual salaries depending on how they are typically paid.
This data is based on the survey panels collected over a 3-year period ending with the May 2014 panel.
NOTE: The Mississippi Partnership WIA represents the following counties:Alcorn, Attala, Benton, Calhoun, Chickasaw, Choctaw, Clay, DeSoto, Grenada, Itawamba, Lafayette,
Lee, Lowndes, Marshall, Monroe, Montgomery, Noxubee, Oktibbeha, Pontotoc, Prentiss, Tate, Tippah, Tishomingo, Union, Webster, Winston, and Yalobusha
ResourcesGlossaryOccupation Definitions
Technical Notes for OES Estimates
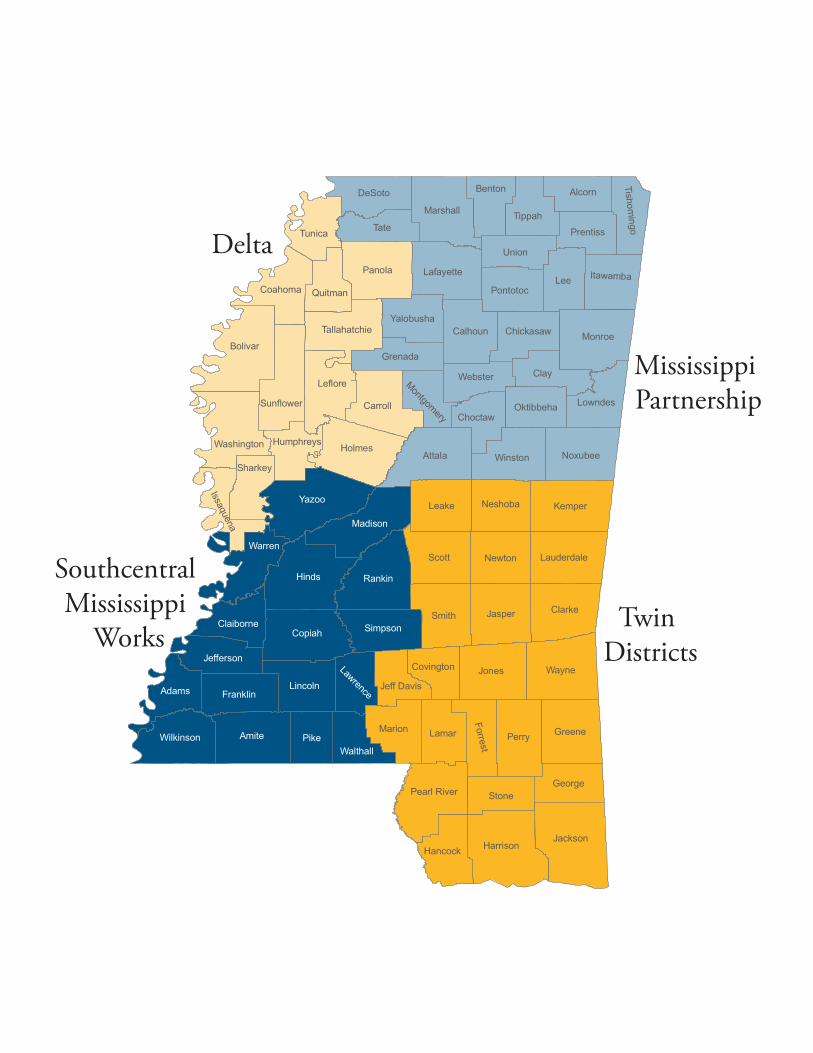
Delta
Mississippi Partnership
Twin Districts
Southcentral Mississippi
Works

MDES/LMIHelping Mississippians Get Jobs
Page 12015 MS Partnership WIA Occupational Employment Wage Estimates
SOC
Code Employment Hourly Annual Hourly Annual Hourly Annual
00-0000 Total all occupations 300,320 $16.79 $34,926 $8.62 $17,933 $20.88 $43,422
11-0000 Management Occupations 12,780 $40.35 $83,929 $19.88 $41,358 $50.58 $105,214
11-1011 Chief Executives 220 $59.62 $124,013 $18.29 $38,037 $80.29 $167,001
11-1021 General and Operations Managers 4,920 $46.60 $96,936 $21.75 $45,235 $59.03 $122,786
11-1031 Legislators 250 N/A $25,391 N/A $17,089 N/A $29,542
11-2011 Advertising and Promotions Managers 20 $25.12 $52,241 $18.40 $38,278 $28.47 $59,223
11-2021 Marketing Managers 110 $42.46 $88,317 $23.24 $48,333 $52.07 $108,309
11-2022 Sales Managers 580 $43.54 $90,556 $18.19 $37,826 $56.21 $116,921
11-2031 Public Relations and Fundraising Managers 70 $32.82 $68,276 $20.97 $43,621 $38.75 $80,603
11-3011 Administrative Services Managers 620 $29.81 $62,009 $18.55 $38,575 $35.45 $73,726
11-3021 Computer and Information Systems Managers 210 $39.92 $83,023 $26.73 $55,596 $46.51 $96,737
11-3031 Financial Managers 720 $41.66 $86,660 $21.30 $44,309 $51.84 $107,835
11-3051 Industrial Production Managers 580 $41.22 $85,740 $27.46 $57,123 $48.10 $100,048
11-3061 Purchasing Managers 190 $37.90 $78,827 $24.29 $50,513 $44.70 $92,984
11-3071 Transportation, Storage, and Distribution Managers 270 $34.06 $70,835 $20.58 $42,802 $40.79 $84,852
11-3111 Compensation and Benefits Managers 20 $33.35 $69,377 $25.69 $53,430 $37.19 $77,351
11-3121 Human Resources Managers 210 $36.90 $76,752 $22.47 $46,729 $44.12 $91,763
11-3131 Training and Development Managers 40 $38.40 $79,874 $24.47 $50,904 $45.37 $94,360
11-9021 Construction Managers 300 $33.35 $69,372 $19.50 $40,559 $40.28 $83,778
11-9031Education Administrators, Preschool and Childcare Center/Program 80 $21.84 $45,425 $15.38 $31,990 $25.07 $52,143
11-9032Education Administrators, Elementary and Secondary School 730 N/A $70,997 N/A $58,037 N/A $77,477
11-9033 Education Administrators, Postsecondary 540 $48.32 $100,515 $26.31 $54,719 $59.33 $123,413
11-9041 Architectural and Engineering Managers 220 $48.83 $101,575 $31.88 $66,310 $57.31 $119,207
11-9051 Food Service Managers 250 $22.90 $47,629 $14.94 $31,069 $26.88 $55,909
11-9061 Funeral Service Managers 50 $27.23 $56,647 $16.49 $34,298 $32.61 $67,821
SOC Title
Average Wage Entry Level Wage Experienced Wage
<-- Back To Table of Contents
NOTE: Totals may not add due to rounding and confidentiality suppressions.

MDES/LMIHelping Mississippians Get Jobs
Page 22015 MS Partnership WIA Occupational Employment Wage Estimates
SOC
Code Employment Hourly Annual Hourly Annual Hourly AnnualSOC Title
Average Wage Entry Level Wage Experienced Wage
11-9081 Lodging Managers 80 $25.39 $52,812 $19.41 $40,372 $28.38 $59,032
11-9111 Medical and Health Services Managers 540 $38.78 $80,662 $23.59 $49,062 $46.38 $96,462
11-9121 Natural Sciences Managers 40 $54.14 $112,618 $41.26 $85,823 $60.58 $126,016
11-9131 Postmasters and Mail Superintendents 80 $35.09 $72,981 $29.00 $60,316 $38.13 $79,313
11-9141Property, Real Estate, and Community Association Managers 440 $18.41 $38,296 $11.12 $23,124 $22.06 $45,882
11-9151 Social and Community Service Managers 180 $22.98 $47,799 $14.13 $29,383 $27.41 $57,007
11-9161 Emergency Management Directors 30 $23.17 $48,201 $15.50 $32,233 $27.01 $56,185
11-9199 Managers, All Other N/A $45.03 $93,668 $24.73 $51,435 $55.18 $114,784
13-0000 Business and Financial Operations Occupations 6,270 $25.41 $52,853 $14.64 $30,456 $30.79 $64,051
13-1022Wholesale and Retail Buyers, Except Farm Products 180 $24.20 $50,334 $15.05 $31,314 $28.77 $59,843
13-1023Purchasing Agents, Except Wholesale, Retail, and Farm Products 460 $25.41 $52,856 $16.56 $34,452 $29.84 $62,058
13-1031 Claims Adjusters, Examiners, and Investigators 130 $34.22 $71,169 $27.25 $56,673 $37.70 $78,416
13-1041Compliance Officers, Except Agriculture, Construction, Health and Safety, and Transportation 360 $22.29 $46,368 $12.65 $26,322 $27.11 $56,391
13-1051 Cost Estimators 260 $30.44 $63,308 $20.60 $42,854 $35.35 $73,536
13-1071 Human Resources Specialists 420 $21.47 $44,665 $12.83 $26,692 $25.79 $53,651
13-1075 Labor Relations Specialists 60 $18.89 $39,291 $16.86 $35,064 $19.91 $41,405
13-1081 Logisticians 90 $38.13 $79,302 $23.77 $49,440 $45.30 $94,233
13-1111 Management Analysts 260 $32.46 $67,511 $20.48 $42,602 $38.45 $79,966
13-1121 Meeting, Convention, and Event Planners 50 $16.20 $33,701 $11.97 $24,903 $18.32 $38,100
13-1131 Fundraisers 40 $20.45 $42,533 $15.79 $32,838 $22.78 $47,380
13-1141Compensation, Benefits, and Job Analysis Specialists 60 $24.58 $51,136 $16.14 $33,563 $28.81 $59,922
13-1151 Training and Development Specialists 200 $22.89 $47,602 $13.82 $28,755 $27.42 $57,026
13-1161Market Research Analysts and Marketing Specialists 300 $27.21 $56,591 $14.60 $30,366 $33.51 $69,703
13-1199 Business Operations Specialists, All Other 650 $21.61 $44,948 $14.27 $29,672 $25.28 $52,586
13-2011 Accountants and Auditors 1,280 $27.72 $57,665 $17.55 $36,513 $32.81 $68,241
<-- Back To Table of Contents
NOTE: Totals may not add due to rounding and confidentiality suppressions.
MDES/LMIHelping Mississippians Get Jobs
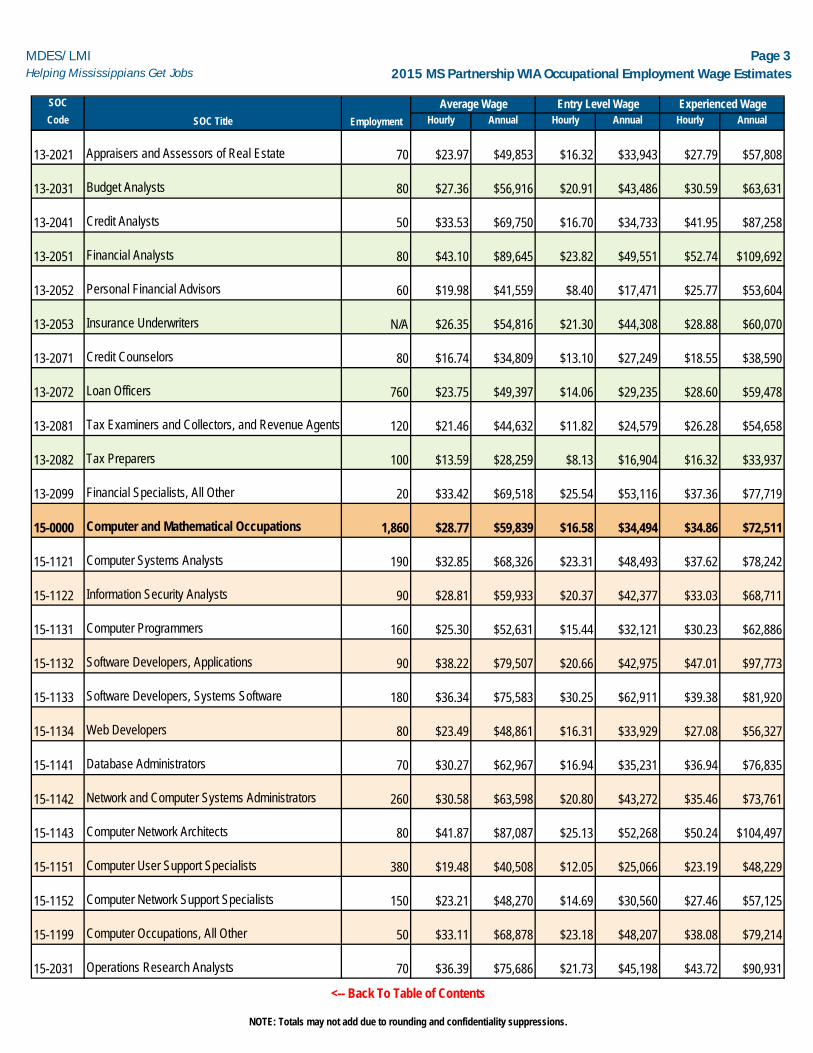
Page 32015 MS Partnership WIA Occupational Employment Wage Estimates
SOC
Code Employment Hourly Annual Hourly Annual Hourly AnnualSOC Title
Average Wage Entry Level Wage Experienced Wage
13-2021 Appraisers and Assessors of Real Estate 70 $23.97 $49,853 $16.32 $33,943 $27.79 $57,808
13-2031 Budget Analysts 80 $27.36 $56,916 $20.91 $43,486 $30.59 $63,631
13-2041 Credit Analysts 50 $33.53 $69,750 $16.70 $34,733 $41.95 $87,258
13-2051 Financial Analysts 80 $43.10 $89,645 $23.82 $49,551 $52.74 $109,692
13-2052 Personal Financial Advisors 60 $19.98 $41,559 $8.40 $17,471 $25.77 $53,604
13-2053 Insurance Underwriters N/A $26.35 $54,816 $21.30 $44,308 $28.88 $60,070
13-2071 Credit Counselors 80 $16.74 $34,809 $13.10 $27,249 $18.55 $38,590
13-2072 Loan Officers 760 $23.75 $49,397 $14.06 $29,235 $28.60 $59,478
13-2081 Tax Examiners and Collectors, and Revenue Agents 120 $21.46 $44,632 $11.82 $24,579 $26.28 $54,658
13-2082 Tax Preparers 100 $13.59 $28,259 $8.13 $16,904 $16.32 $33,937
13-2099 Financial Specialists, All Other 20 $33.42 $69,518 $25.54 $53,116 $37.36 $77,719
15-0000 Computer and Mathematical Occupations 1,860 $28.77 $59,839 $16.58 $34,494 $34.86 $72,511
15-1121 Computer Systems Analysts 190 $32.85 $68,326 $23.31 $48,493 $37.62 $78,242
15-1122 Information Security Analysts 90 $28.81 $59,933 $20.37 $42,377 $33.03 $68,711
15-1131 Computer Programmers 160 $25.30 $52,631 $15.44 $32,121 $30.23 $62,886
15-1132 Software Developers, Applications 90 $38.22 $79,507 $20.66 $42,975 $47.01 $97,773
15-1133 Software Developers, Systems Software 180 $36.34 $75,583 $30.25 $62,911 $39.38 $81,920
15-1134 Web Developers 80 $23.49 $48,861 $16.31 $33,929 $27.08 $56,327
15-1141 Database Administrators 70 $30.27 $62,967 $16.94 $35,231 $36.94 $76,835
15-1142 Network and Computer Systems Administrators 260 $30.58 $63,598 $20.80 $43,272 $35.46 $73,761
15-1143 Computer Network Architects 80 $41.87 $87,087 $25.13 $52,268 $50.24 $104,497
15-1151 Computer User Support Specialists 380 $19.48 $40,508 $12.05 $25,066 $23.19 $48,229
15-1152 Computer Network Support Specialists 150 $23.21 $48,270 $14.69 $30,560 $27.46 $57,125
15-1199 Computer Occupations, All Other 50 $33.11 $68,878 $23.18 $48,207 $38.08 $79,214
15-2031 Operations Research Analysts 70 $36.39 $75,686 $21.73 $45,198 $43.72 $90,931
<-- Back To Table of Contents
NOTE: Totals may not add due to rounding and confidentiality suppressions.

MDES/LMIHelping Mississippians Get Jobs
Page 42015 MS Partnership WIA Occupational Employment Wage Estimates
SOC
Code Employment Hourly Annual Hourly Annual Hourly AnnualSOC Title
Average Wage Entry Level Wage Experienced Wage
17-0000 Architecture and Engineering Occupations 3,040 $30.00 $62,406 $16.62 $34,566 $36.70 $76,326
17-1011 Architects, Except Landscape and Naval 20 $36.78 $76,499 $23.97 $49,847 $43.18 $89,824
17-1022 Surveyors 170 $20.36 $42,349 $14.35 $29,850 $23.36 $48,599
17-2011 Aerospace Engineers 20 $46.37 $96,453 $38.46 $80,006 $50.32 $104,676
17-2041 Chemical Engineers 40 $38.20 $79,456 $28.43 $59,139 $43.08 $89,614
17-2051 Civil Engineers 200 $34.99 $72,776 $22.09 $45,939 $41.44 $86,194
17-2071 Electrical Engineers 110 $50.27 $104,569 $29.81 $62,008 $60.50 $125,849
17-2072 Electronics Engineers, Except Computer 70 $31.21 $64,911 $23.30 $48,468 $35.16 $73,133
17-2081 Environmental Engineers 60 $43.07 $89,587 $27.02 $56,210 $51.09 $106,275
17-2111Health and Safety Engineers, Except Mining Safety Engineers and Inspectors N/A $16.90 $35,159 $9.58 $19,931 $20.56 $42,772
17-2112 Industrial Engineers 520 $36.97 $76,906 $25.08 $52,166 $42.92 $89,276
17-2131 Materials Engineers 40 $39.63 $82,420 $29.56 $61,489 $44.66 $92,886
17-2141 Mechanical Engineers 280 $36.84 $76,627 $25.53 $53,112 $42.49 $88,384
17-2171 Petroleum Engineers 20 $58.21 $121,069 $29.13 $60,591 $72.74 $151,308
17-2199 Engineers, All Other 50 $37.91 $78,846 $23.99 $49,908 $44.86 $93,315
17-3011 Architectural and Civil Drafters 110 $21.58 $44,883 $16.13 $33,545 $24.30 $50,552
17-3013 Mechanical Drafters 130 $23.02 $47,880 $16.84 $35,024 $26.11 $54,307
17-3019 Drafters, All Other 20 $23.15 $48,159 $15.96 $33,193 $26.75 $55,641
17-3021 Aerospace Engineering and Operations Technicians N/A $36.03 $74,945 $27.06 $56,293 $40.51 $84,271
17-3022 Civil Engineering Technicians 210 $17.05 $35,471 $12.73 $26,476 $19.22 $39,969
17-3023 Electrical and Electronics Engineering Technicians 220 $24.32 $50,578 $15.23 $31,685 $28.86 $60,024
17-3025 Environmental Engineering Technicians 110 $19.61 $40,780 $13.58 $28,244 $22.62 $47,047
17-3026 Industrial Engineering Technicians 150 $22.69 $47,188 $14.37 $29,885 $26.85 $55,839
17-3027 Mechanical Engineering Technicians 120 $26.78 $55,695 $26.35 $54,799 $26.99 $56,144
17-3031 Surveying and Mapping Technicians 110 $17.89 $37,207 $11.94 $24,840 $20.86 $43,391
<-- Back To Table of Contents
NOTE: Totals may not add due to rounding and confidentiality suppressions.
MDES/LMIHelping Mississippians Get Jobs
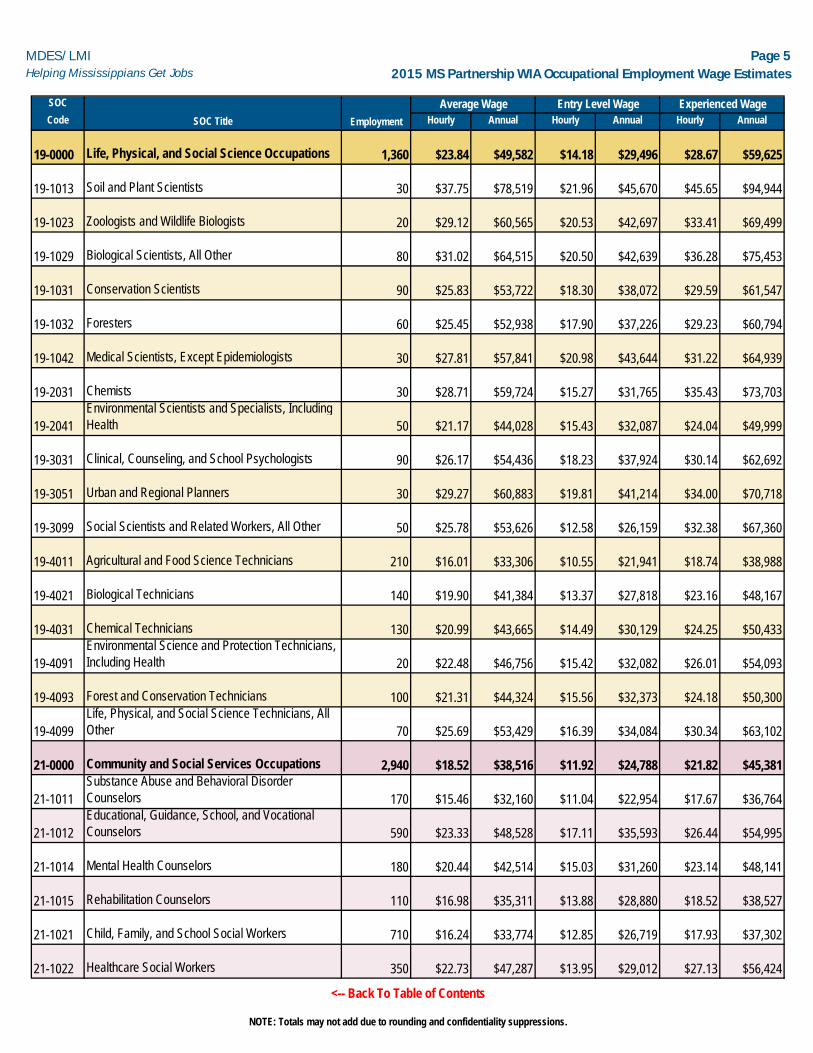
Page 52015 MS Partnership WIA Occupational Employment Wage Estimates
SOC
Code Employment Hourly Annual Hourly Annual Hourly AnnualSOC Title
Average Wage Entry Level Wage Experienced Wage
19-0000 Life, Physical, and Social Science Occupations 1,360 $23.84 $49,582 $14.18 $29,496 $28.67 $59,625
19-1013 Soil and Plant Scientists 30 $37.75 $78,519 $21.96 $45,670 $45.65 $94,944
19-1023 Zoologists and Wildlife Biologists 20 $29.12 $60,565 $20.53 $42,697 $33.41 $69,499
19-1029 Biological Scientists, All Other 80 $31.02 $64,515 $20.50 $42,639 $36.28 $75,453
19-1031 Conservation Scientists 90 $25.83 $53,722 $18.30 $38,072 $29.59 $61,547
19-1032 Foresters 60 $25.45 $52,938 $17.90 $37,226 $29.23 $60,794
19-1042 Medical Scientists, Except Epidemiologists 30 $27.81 $57,841 $20.98 $43,644 $31.22 $64,939
19-2031 Chemists 30 $28.71 $59,724 $15.27 $31,765 $35.43 $73,703
19-2041Environmental Scientists and Specialists, Including Health 50 $21.17 $44,028 $15.43 $32,087 $24.04 $49,999
19-3031 Clinical, Counseling, and School Psychologists 90 $26.17 $54,436 $18.23 $37,924 $30.14 $62,692
19-3051 Urban and Regional Planners 30 $29.27 $60,883 $19.81 $41,214 $34.00 $70,718
19-3099 Social Scientists and Related Workers, All Other 50 $25.78 $53,626 $12.58 $26,159 $32.38 $67,360
19-4011 Agricultural and Food Science Technicians 210 $16.01 $33,306 $10.55 $21,941 $18.74 $38,988
19-4021 Biological Technicians 140 $19.90 $41,384 $13.37 $27,818 $23.16 $48,167
19-4031 Chemical Technicians 130 $20.99 $43,665 $14.49 $30,129 $24.25 $50,433
19-4091Environmental Science and Protection Technicians, Including Health 20 $22.48 $46,756 $15.42 $32,082 $26.01 $54,093
19-4093 Forest and Conservation Technicians 100 $21.31 $44,324 $15.56 $32,373 $24.18 $50,300
19-4099Life, Physical, and Social Science Technicians, All Other 70 $25.69 $53,429 $16.39 $34,084 $30.34 $63,102
21-0000 Community and Social Services Occupations 2,940 $18.52 $38,516 $11.92 $24,788 $21.82 $45,381
21-1011Substance Abuse and Behavioral Disorder Counselors 170 $15.46 $32,160 $11.04 $22,954 $17.67 $36,764
21-1012Educational, Guidance, School, and Vocational Counselors 590 $23.33 $48,528 $17.11 $35,593 $26.44 $54,995
21-1014 Mental Health Counselors 180 $20.44 $42,514 $15.03 $31,260 $23.14 $48,141
21-1015 Rehabilitation Counselors 110 $16.98 $35,311 $13.88 $28,880 $18.52 $38,527
21-1021 Child, Family, and School Social Workers 710 $16.24 $33,774 $12.85 $26,719 $17.93 $37,302
21-1022 Healthcare Social Workers 350 $22.73 $47,287 $13.95 $29,012 $27.13 $56,424
<-- Back To Table of Contents
NOTE: Totals may not add due to rounding and confidentiality suppressions.
MDES/LMIHelping Mississippians Get Jobs
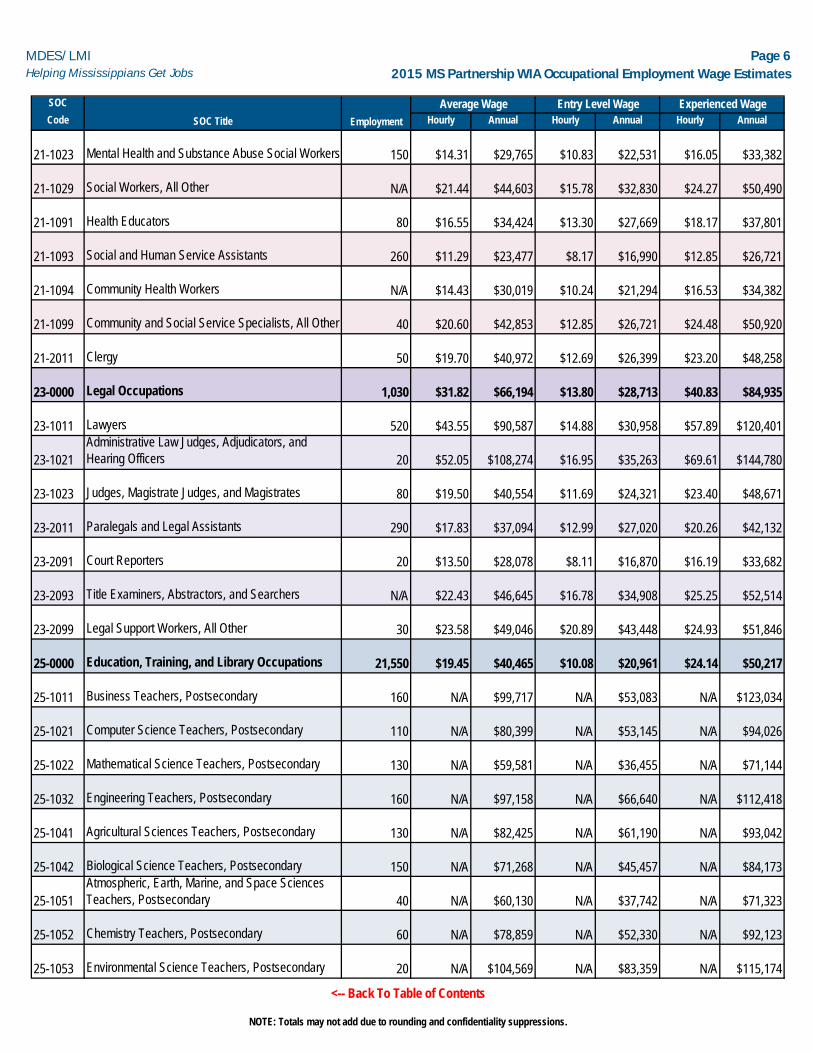
Page 62015 MS Partnership WIA Occupational Employment Wage Estimates
SOC
Code Employment Hourly Annual Hourly Annual Hourly AnnualSOC Title
Average Wage Entry Level Wage Experienced Wage
21-1023 Mental Health and Substance Abuse Social Workers 150 $14.31 $29,765 $10.83 $22,531 $16.05 $33,382
21-1029 Social Workers, All Other N/A $21.44 $44,603 $15.78 $32,830 $24.27 $50,490
21-1091 Health Educators 80 $16.55 $34,424 $13.30 $27,669 $18.17 $37,801
21-1093 Social and Human Service Assistants 260 $11.29 $23,477 $8.17 $16,990 $12.85 $26,721
21-1094 Community Health Workers N/A $14.43 $30,019 $10.24 $21,294 $16.53 $34,382
21-1099 Community and Social Service Specialists, All Other 40 $20.60 $42,853 $12.85 $26,721 $24.48 $50,920
21-2011 Clergy 50 $19.70 $40,972 $12.69 $26,399 $23.20 $48,258
23-0000 Legal Occupations 1,030 $31.82 $66,194 $13.80 $28,713 $40.83 $84,935
23-1011 Lawyers 520 $43.55 $90,587 $14.88 $30,958 $57.89 $120,401
23-1021Administrative Law Judges, Adjudicators, and Hearing Officers 20 $52.05 $108,274 $16.95 $35,263 $69.61 $144,780
23-1023 Judges, Magistrate Judges, and Magistrates 80 $19.50 $40,554 $11.69 $24,321 $23.40 $48,671
23-2011 Paralegals and Legal Assistants 290 $17.83 $37,094 $12.99 $27,020 $20.26 $42,132
23-2091 Court Reporters 20 $13.50 $28,078 $8.11 $16,870 $16.19 $33,682
23-2093 Title Examiners, Abstractors, and Searchers N/A $22.43 $46,645 $16.78 $34,908 $25.25 $52,514
23-2099 Legal Support Workers, All Other 30 $23.58 $49,046 $20.89 $43,448 $24.93 $51,846
25-0000 Education, Training, and Library Occupations 21,550 $19.45 $40,465 $10.08 $20,961 $24.14 $50,217
25-1011 Business Teachers, Postsecondary 160 N/A $99,717 N/A $53,083 N/A $123,034
25-1021 Computer Science Teachers, Postsecondary 110 N/A $80,399 N/A $53,145 N/A $94,026
25-1022 Mathematical Science Teachers, Postsecondary 130 N/A $59,581 N/A $36,455 N/A $71,144
25-1032 Engineering Teachers, Postsecondary 160 N/A $97,158 N/A $66,640 N/A $112,418
25-1041 Agricultural Sciences Teachers, Postsecondary 130 N/A $82,425 N/A $61,190 N/A $93,042
25-1042 Biological Science Teachers, Postsecondary 150 N/A $71,268 N/A $45,457 N/A $84,173
25-1051Atmospheric, Earth, Marine, and Space Sciences Teachers, Postsecondary 40 N/A $60,130 N/A $37,742 N/A $71,323
25-1052 Chemistry Teachers, Postsecondary 60 N/A $78,859 N/A $52,330 N/A $92,123
25-1053 Environmental Science Teachers, Postsecondary 20 N/A $104,569 N/A $83,359 N/A $115,174
<-- Back To Table of Contents
NOTE: Totals may not add due to rounding and confidentiality suppressions.

MDES/LMIHelping Mississippians Get Jobs
Page 72015 MS Partnership WIA Occupational Employment Wage Estimates
SOC
Code Employment Hourly Annual Hourly Annual Hourly AnnualSOC Title
Average Wage Entry Level Wage Experienced Wage
25-1054 Physics Teachers, Postsecondary 70 N/A $64,805 N/A $41,400 N/A $76,508
25-1063 Economics Teachers, Postsecondary 40 N/A $80,534 N/A $53,916 N/A $93,843
25-1065 Political Science Teachers, Postsecondary 50 N/A $66,373 N/A $50,103 N/A $74,508
25-1066 Psychology Teachers, Postsecondary 80 N/A $65,197 N/A $42,168 N/A $76,712
25-1067 Sociology Teachers, Postsecondary 100 N/A $56,579 N/A $36,609 N/A $66,564
25-1069 Social Sciences Teachers, Postsecondary, All Other 20 N/A $74,114 N/A $51,050 N/A $85,646
25-1071 Health Specialties Teachers, Postsecondary 230 N/A $87,092 N/A $43,862 N/A $108,707
25-1072 Nursing Instructors and Teachers, Postsecondary 130 N/A $66,120 N/A $45,664 N/A $76,348
25-1081 Education Teachers, Postsecondary 150 N/A $65,835 N/A $43,997 N/A $76,754
25-1082 Library Science Teachers, Postsecondary 30 N/A $59,752 N/A $43,569 N/A $67,844
25-1112 Law Teachers, Postsecondary 110 N/A $94,718 N/A $48,225 N/A $117,964
25-1113 Social Work Teachers, Postsecondary 30 N/A $62,048 N/A $44,293 N/A $70,926
25-1121 Art, Drama, and Music Teachers, Postsecondary 150 N/A $59,772 N/A $40,410 N/A $69,454
25-1122 Communications Teachers, Postsecondary 120 N/A $54,553 N/A $32,075 N/A $65,792
25-1123English Language and Literature Teachers, Postsecondary 130 N/A $54,882 N/A $33,840 N/A $65,404
25-1124Foreign Language and Literature Teachers, Postsecondary 70 N/A $50,355 N/A $27,886 N/A $61,590
25-1125 History Teachers, Postsecondary 80 N/A $60,350 N/A $36,978 N/A $72,036
25-1126 Philosophy and Religion Teachers, Postsecondary 40 N/A $56,933 N/A $45,248 N/A $62,775
25-1191 Graduate Teaching Assistants 120 N/A $41,513 N/A $28,267 N/A $48,136
25-1192 Home Economics Teachers, Postsecondary 20 N/A $67,420 N/A $33,594 N/A $84,334
25-1193Recreation and Fitness Studies Teachers, Postsecondary 50 N/A $59,338 N/A $39,473 N/A $69,271
25-1194 Vocational Education Teachers, Postsecondary 310 $24.09 $50,098 $13.20 $27,456 $29.53 $61,419
25-1199 Postsecondary Teachers, All Other 290 N/A $60,416 N/A $38,031 N/A $71,609
25-2011 Preschool Teachers, Except Special Education 610 $12.45 $25,891 $8.51 $17,707 $14.42 $29,984
25-2012 Kindergarten Teachers, Except Special Education 320 N/A $40,899 N/A $31,937 N/A $45,380
<-- Back To Table of Contents
NOTE: Totals may not add due to rounding and confidentiality suppressions.

MDES/LMIHelping Mississippians Get Jobs
Page 82015 MS Partnership WIA Occupational Employment Wage Estimates
SOC
Code Employment Hourly Annual Hourly Annual Hourly AnnualSOC Title
Average Wage Entry Level Wage Experienced Wage
25-2021Elementary School Teachers, Except Special Education 4,310 N/A $41,188 N/A $33,647 N/A $44,958
25-2022Middle School Teachers, Except Special and Career/Technical Educa 1,480 N/A $41,529 N/A $34,166 N/A $45,211
25-2023Career/Technical Education Teachers, Middle School 50 N/A $42,350 N/A $34,971 N/A $46,040
25-2031Secondary School Teachers, Except Special and Career/Technical Ed 3,030 N/A $41,762 N/A $33,768 N/A $45,758
25-2032Career/Technical Education Teachers, Secondary School 630 N/A $41,857 N/A $34,170 N/A $45,701
25-2052Special Education Teachers, Kindergarten and Elementary School 470 N/A $43,899 N/A $34,560 N/A $48,569
25-2053 Special Education Teachers, Middle School N/A N/A $40,782 N/A $34,865 N/A $43,741
25-2054 Special Education Teachers, Secondary School 330 N/A $42,833 N/A $34,356 N/A $47,072
25-2059 Special Education Teachers, All Other N/A N/A $45,625 N/A $43,605 N/A $46,635
25-3011Adult Basic and Secondary Education and Literacy Teachers and Ins 170 $16.57 $34,463 $10.72 $22,304 $19.49 $40,542
25-3021 Self-Enrichment Education Teachers 280 $20.16 $41,939 $11.88 $24,717 $24.30 $50,550
25-3097Teachers and Instructors, All Other, Except Substitute Teachers 290 N/A $35,760 N/A $23,687 N/A $41,796
25-3098 Substitute Teachers 1,610 $8.24 $17,140 $8.11 $16,866 $8.31 $17,277
25-4021 Librarians 410 $21.75 $45,249 $16.49 $34,304 $24.39 $50,721
25-4031 Library Technicians 380 $10.95 $22,771 $8.12 $16,890 $12.36 $25,712
25-9011 Audio-Visual and Multimedia Collections Specialists 50 $11.22 $23,337 $8.08 $16,806 $12.79 $26,602
25-9021 Farm and Home Management Advisors 320 $25.10 $52,200 $15.85 $32,977 $29.72 $61,811
25-9031 Instructional Coordinators 200 $25.57 $53,194 $17.30 $35,986 $29.71 $61,798
25-9041 Teacher Assistants 2,790 N/A $17,455 N/A $16,854 N/A $17,755
25-9099 Education, Training, and Library Workers, All Other 30 $24.33 $50,612 $15.28 $31,791 $28.86 $60,023
27-0000Arts, Design, Entertainment, Sports, and Media Occupations 1,730 $20.54 $42,727 $10.37 $21,568 $25.63 $53,307
27-1011 Art Directors 30 $18.06 $37,572 $12.03 $25,021 $21.08 $43,847
27-1021 Commercial and Industrial Designers 70 $28.04 $58,319 $17.98 $37,402 $33.07 $68,777
27-1023 Floral Designers 80 $11.27 $23,437 $8.11 $16,864 $12.85 $26,724
27-1024 Graphic Designers 250 $16.23 $33,749 $11.62 $24,162 $18.53 $38,543
<-- Back To Table of Contents
NOTE: Totals may not add due to rounding and confidentiality suppressions.

MDES/LMIHelping Mississippians Get Jobs
Page 92015 MS Partnership WIA Occupational Employment Wage Estimates
SOC
Code Employment Hourly Annual Hourly Annual Hourly AnnualSOC Title
Average Wage Entry Level Wage Experienced Wage
27-1025 Interior Designers 40 $18.11 $37,673 $12.59 $26,185 $20.87 $43,418
27-1026 Merchandise Displayers and Window Trimmers 90 $13.73 $28,549 $9.54 $19,850 $15.82 $32,899
27-1029 Designers, All Other 20 $15.71 $32,681 $10.04 $20,886 $18.55 $38,578
27-2012 Producers and Directors 50 $17.33 $36,046 $10.78 $22,428 $20.60 $42,856
27-2021 Athletes and Sports Competitors 20 N/A $27,973 N/A $17,298 N/A $33,311
27-2022 Coaches and Scouts 340 N/A $70,353 N/A $24,753 N/A $93,154
27-2041 Music Directors and Composers 60 $22.02 $45,811 $16.78 $34,901 $24.65 $51,265
27-3011 Radio and Television Announcers 60 $14.30 $29,746 $8.09 $16,826 $17.41 $36,206
27-3022 Reporters and Correspondents 90 $14.75 $30,671 $10.09 $20,995 $17.07 $35,509
27-3031 Public Relations Specialists 160 $19.43 $40,405 $11.46 $23,833 $23.41 $48,691
27-3041 Editors 70 $23.46 $48,805 $13.35 $27,768 $28.52 $59,323
27-3043 Writers and Authors 40 $18.12 $37,699 $12.91 $26,858 $20.73 $43,120
27-3091 Interpreters and Translators 20 $12.90 $26,823 $10.56 $21,975 $14.06 $29,247
27-4011 Audio and Video Equipment Technicians N/A $14.29 $29,719 $8.52 $17,729 $17.17 $35,714
27-4012 Broadcast Technicians 50 $13.75 $28,606 $9.73 $20,237 $15.76 $32,791
27-4021 Photographers 60 $16.08 $33,452 $8.60 $17,878 $19.83 $41,240
29-0000Healthcare Practitioners and Technical Occupations 18,810 $28.68 $59,660 $13.65 $28,385 $36.20 $75,298
29-1011 Chiropractors 20 N/A N/A N/A N/A N/A N/A
29-1021 Dentists, General 190 $73.30 $152,464 $27.13 $56,436 $96.38 $200,477
29-1023 Orthodontists N/A $137.23 $285,436 N/A N/A N/A N/A
29-1031 Dietitians and Nutritionists 130 $23.03 $47,900 $16.68 $34,701 $26.20 $54,500
29-1041 Optometrists 60 N/A N/A N/A N/A N/A N/A
29-1051 Pharmacists 750 $57.38 $119,347 $46.39 $96,484 $62.87 $130,778
29-1062 Family and General Practitioners 250 $91.33 $189,961 $55.77 $115,999 $109.11 $226,943
29-1063 Internists, General 110 $115.31 $239,835 $91.78 $190,903 N/A N/A
<-- Back To Table of Contents
NOTE: Totals may not add due to rounding and confidentiality suppressions.

MDES/LMIHelping Mississippians Get Jobs
Page 102015 MS Partnership WIA Occupational Employment Wage Estimates
SOC
Code Employment Hourly Annual Hourly Annual Hourly AnnualSOC Title
Average Wage Entry Level Wage Experienced Wage
29-1064 Obstetricians and Gynecologists N/A $121.26 $252,225 $100.29 $208,603 N/A N/A
29-1066 Psychiatrists 20 $114.39 $237,936 $81.73 $169,989 N/A N/A
29-1067 Surgeons N/A $126.19 $262,472 $98.82 $205,552 N/A N/A
29-1069 Physicians and Surgeons, All Other 250 $97.97 $203,777 $31.33 $65,164 N/A N/A
29-1122 Occupational Therapists 160 $39.97 $83,143 $29.73 $61,839 $45.09 $93,794
29-1123 Physical Therapists 340 $41.22 $85,741 $27.14 $56,449 $48.26 $100,387
29-1124 Radiation Therapists 60 $34.78 $72,335 $25.20 $52,415 $39.56 $82,295
29-1125 Recreational Therapists 40 $14.10 $29,318 $11.83 $24,610 $15.23 $31,672
29-1126 Respiratory Therapists 380 $22.55 $46,903 $18.76 $39,024 $24.44 $50,843
29-1127 Speech-Language Pathologists 330 $24.76 $51,493 $16.24 $33,780 $29.01 $60,349
29-1131 Veterinarians 140 $35.99 $74,859.00 $14.80 $30,779 $46.59 $96,899
29-1141 Registered Nurses 6,530 $25.10 $52,205 $18.33 $38,119 $28.48 $59,248
29-1151 Nurse Anesthetists 40 $74.14 $154,204 $54.96 $114,323 $83.72 $174,144
29-1171 Nurse Practitioners 520 $45.62 $94,881 $33.24 $69,134 $51.81 $107,755
29-1181 Audiologists 40 $27.55 $57,313 $25.16 $52,337 $28.75 $59,801
29-2011 Medical and Clinical Laboratory Technologists 310 $24.76 $51,499 $18.95 $39,416 $27.66 $57,541
29-2012 Medical and Clinical Laboratory Technicians 470 $16.20 $33,700 $10.93 $22,730 $18.84 $39,185
29-2021 Dental Hygienists 190 $25.44 $52,916 $17.93 $37,299 $29.19 $60,725
29-2031 Cardiovascular Technologists and Technicians 110 $19.28 $40,096 $11.55 $24,034 $23.14 $48,127
29-2032 Diagnostic Medical Sonographers 180 $26.38 $54,878 $18.45 $38,373 $30.35 $63,130
29-2033 Nuclear Medicine Technologists 70 $33.80 $70,313 $28.07 $58,391 $36.67 $76,274
29-2034 Radiologic Technologists and Technicians 490 $23.47 $48,824 $18.69 $38,885 $25.86 $53,794
29-2035 Magnetic Resonance Imaging Technologists 70 $29.42 $61,204 $24.47 $50,905 $31.90 $66,353
29-2041 Emergency Medical Technicians and Paramedics 650 $15.24 $31,707 $10.86 $22,599 $17.43 $36,261
29-2051 Dietetic Technicians 60 $10.39 $21,603 $8.02 $16,687 $11.57 $24,061
<-- Back To Table of Contents
NOTE: Totals may not add due to rounding and confidentiality suppressions.

MDES/LMIHelping Mississippians Get Jobs
Page 112015 MS Partnership WIA Occupational Employment Wage Estimates
SOC
Code Employment Hourly Annual Hourly Annual Hourly AnnualSOC Title
Average Wage Entry Level Wage Experienced Wage
29-2052 Pharmacy Technicians 1,060 $13.04 $27,128 $10.07 $20,935 $14.53 $30,225
29-2053 Psychiatric Technicians 320 $10.70 $22,256 $8.60 $17,888 $11.75 $24,440
29-2054 Respiratory Therapy Technicians 40 $21.90 $45,553 $18.96 $39,439 $23.37 $48,610
29-2055 Surgical Technologists 260 $16.98 $35,312 $12.90 $26,836 $19.01 $39,550
29-2056 Veterinary Technologists and Technicians 310 $16.45 $34,208 $12.38 $25,752 $18.48 $38,436
29-2057 Ophthalmic Medical Technicians N/A $23.72 $49,336 $16.75 $34,830 $27.21 $56,589
29-2061 Licensed Practical and Licensed Vocational Nurses 2,520 $16.95 $35,255 $14.04 $29,208 $18.40 $38,278
29-2071Medical Records and Health Information Technicians 650 $12.78 $26,573 $8.99 $18,694 $14.67 $30,512
29-2081 Opticians, Dispensing 70 $12.10 $25,166 $8.97 $18,658 $13.66 $28,421
29-2091 Orthotists and Prosthetists N/A $22.98 $47,796 $15.33 $31,879 $26.81 $55,755
29-2099 Health Technologists and Technicians, All Other N/A $30.23 $62,886 $17.53 $36,453 $36.59 $76,102
29-9011 Occupational Health and Safety Specialists 50 $33.38 $69,426 $23.73 $49,348 $38.20 $79,465
29-9091 Athletic Trainers 60 N/A $40,083 N/A $24,710 N/A $47,769
31-0000 Healthcare Support Occupations 7,420 $10.85 $22,562 $8.12 $16,885 $12.21 $25,401
31-1011 Home Health Aides 860 $9.05 $18,828 $8.08 $16,797 $9.54 $19,844
31-1013 Psychiatric Aides 430 $8.97 $18,657 $8.09 $16,821 $9.41 $19,575
31-1014 Nursing Assistants 3,720 $9.21 $19,166 $8.11 $16,870 $9.77 $20,314
31-1015 Orderlies 90 $9.85 $20,487 $8.09 $16,834 $10.73 $22,313
31-2011 Occupational Therapy Assistants N/A $21.66 $45,057 $16.43 $34,179 $24.28 $50,495
31-2021 Physical Therapist Assistants 150 $24.58 $51,125 $15.87 $33,007 $28.93 $60,184
31-2022 Physical Therapist Aides 60 $10.09 $20,987 $8.17 $16,990 $11.05 $22,985
31-9091 Dental Assistants 710 $14.51 $30,182 $11.27 $23,447 $16.13 $33,549
31-9092 Medical Assistants 700 $12.94 $26,916 $10.11 $21,037 $14.35 $29,856
31-9093 Medical Equipment Preparers 50 $11.36 $23,628 $8.95 $18,609 $12.57 $26,138
31-9094 Medical Transcriptionists 140 $15.40 $32,028 $11.78 $24,501 $17.21 $35,792
<-- Back To Table of Contents
NOTE: Totals may not add due to rounding and confidentiality suppressions.
MDES/LMIHelping Mississippians Get Jobs
Page 122015 MS Partnership WIA Occupational Employment Wage Estimates
SOC
Code Employment Hourly Annual Hourly Annual Hourly AnnualSOC Title
Average Wage Entry Level Wage Experienced Wage
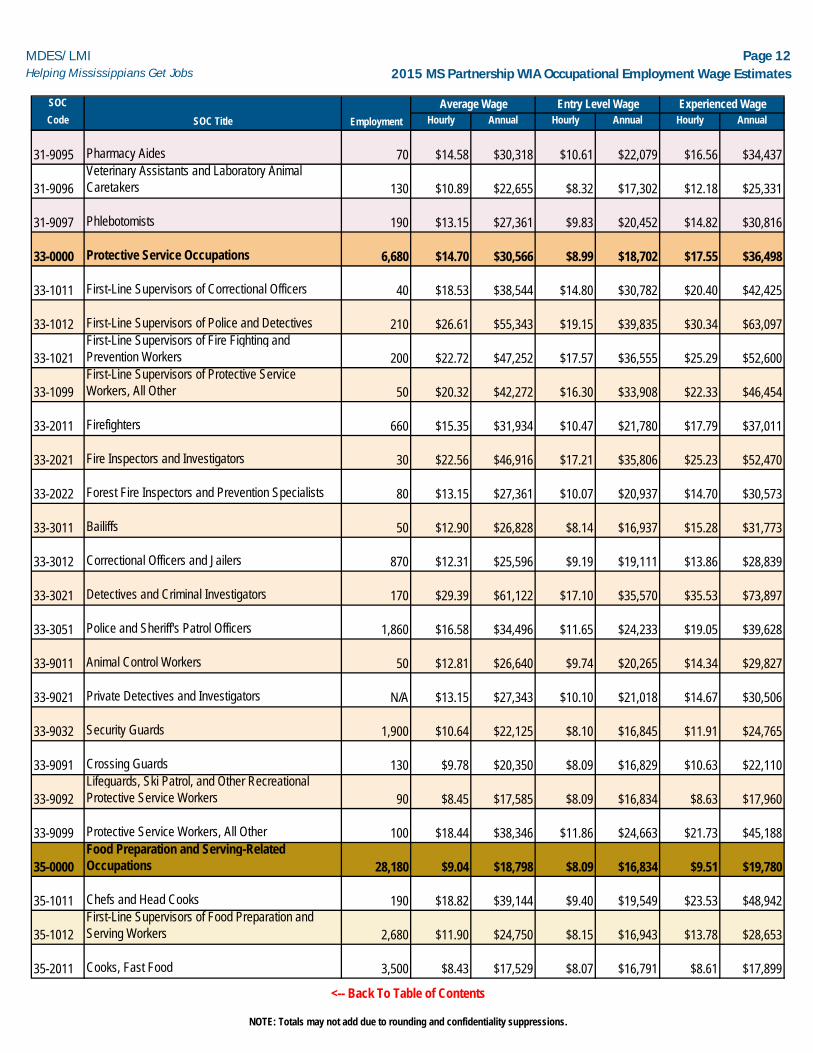
31-9095 Pharmacy Aides 70 $14.58 $30,318 $10.61 $22,079 $16.56 $34,437
31-9096Veterinary Assistants and Laboratory Animal Caretakers 130 $10.89 $22,655 $8.32 $17,302 $12.18 $25,331
31-9097 Phlebotomists 190 $13.15 $27,361 $9.83 $20,452 $14.82 $30,816
33-0000 Protective Service Occupations 6,680 $14.70 $30,566 $8.99 $18,702 $17.55 $36,498
33-1011 First-Line Supervisors of Correctional Officers 40 $18.53 $38,544 $14.80 $30,782 $20.40 $42,425
33-1012 First-Line Supervisors of Police and Detectives 210 $26.61 $55,343 $19.15 $39,835 $30.34 $63,097
33-1021First-Line Supervisors of Fire Fighting and Prevention Workers 200 $22.72 $47,252 $17.57 $36,555 $25.29 $52,600
33-1099First-Line Supervisors of Protective Service Workers, All Other 50 $20.32 $42,272 $16.30 $33,908 $22.33 $46,454
33-2011 Firefighters 660 $15.35 $31,934 $10.47 $21,780 $17.79 $37,011
33-2021 Fire Inspectors and Investigators 30 $22.56 $46,916 $17.21 $35,806 $25.23 $52,470
33-2022 Forest Fire Inspectors and Prevention Specialists 80 $13.15 $27,361 $10.07 $20,937 $14.70 $30,573
33-3011 Bailiffs 50 $12.90 $26,828 $8.14 $16,937 $15.28 $31,773
33-3012 Correctional Officers and Jailers 870 $12.31 $25,596 $9.19 $19,111 $13.86 $28,839
33-3021 Detectives and Criminal Investigators 170 $29.39 $61,122 $17.10 $35,570 $35.53 $73,897
33-3051 Police and Sheriff's Patrol Officers 1,860 $16.58 $34,496 $11.65 $24,233 $19.05 $39,628
33-9011 Animal Control Workers 50 $12.81 $26,640 $9.74 $20,265 $14.34 $29,827
33-9021 Private Detectives and Investigators N/A $13.15 $27,343 $10.10 $21,018 $14.67 $30,506
33-9032 Security Guards 1,900 $10.64 $22,125 $8.10 $16,845 $11.91 $24,765
33-9091 Crossing Guards 130 $9.78 $20,350 $8.09 $16,829 $10.63 $22,110
33-9092Lifeguards, Ski Patrol, and Other Recreational Protective Service Workers 90 $8.45 $17,585 $8.09 $16,834 $8.63 $17,960
33-9099 Protective Service Workers, All Other 100 $18.44 $38,346 $11.86 $24,663 $21.73 $45,188
35-0000Food Preparation and Serving-Related Occupations 28,180 $9.04 $18,798 $8.09 $16,834 $9.51 $19,780
35-1011 Chefs and Head Cooks 190 $18.82 $39,144 $9.40 $19,549 $23.53 $48,942
35-1012First-Line Supervisors of Food Preparation and Serving Workers 2,680 $11.90 $24,750 $8.15 $16,943 $13.78 $28,653
35-2011 Cooks, Fast Food 3,500 $8.43 $17,529 $8.07 $16,791 $8.61 $17,899
<-- Back To Table of Contents
NOTE: Totals may not add due to rounding and confidentiality suppressions.

MDES/LMIHelping Mississippians Get Jobs
Page 132015 MS Partnership WIA Occupational Employment Wage Estimates
SOC
Code Employment Hourly Annual Hourly Annual Hourly AnnualSOC Title
Average Wage Entry Level Wage Experienced Wage
35-2012 Cooks, Institution and Cafeteria 1,780 $8.62 $17,931 $8.05 $16,746 $8.91 $18,524
35-2014 Cooks, Restaurant 2,030 $9.45 $19,662 $8.13 $16,904 $10.12 $21,042
35-2015 Cooks, Short Order 520 $8.48 $17,633 $8.12 $16,886 $8.66 $18,007
35-2019 Cooks, All Other N/A $9.47 $19,693 $8.16 $16,983 $10.12 $21,048
35-2021 Food Preparation Workers 2,380 $8.66 $18,013 $8.11 $16,861 $8.94 $18,589
35-3011 Bartenders 400 $9.34 $19,424 $8.09 $16,822 $9.96 $20,725
35-3021Combined Food Preparation and Serving Workers, Including Fast Food 3,530 $8.54 $17,756 $8.11 $16,860 $8.75 $18,204
35-3022Counter Attendants, Cafeteria, Food Concession, and Coffee Shop 1,520 $8.68 $18,052 $8.10 $16,845 $8.97 $18,656
35-3031 Waiters and Waitresses 5,930 $8.61 $17,906 $8.09 $16,832 $8.87 $18,443
35-3041 Food Servers, Nonrestaurant 1,240 $8.72 $18,136 $8.14 $16,934 $9.01 $18,736
35-9011Dining Room and Cafeteria Attendants and Bartender Helpers 610 $8.50 $17,683 $8.10 $16,839 $8.70 $18,105
35-9021 Dishwashers 710 $8.34 $17,344 $8.11 $16,861 $8.45 $17,586
35-9031Hosts and Hostesses, Restaurant, Lounge, and Coffee Shop 730 $8.65 $17,984 $8.08 $16,807 $8.93 $18,573
35-9099Food Preparation and Serving Related Workers, All Other N/A $8.50 $17,680 $7.98 $16,590 $8.76 $18,226
37-0000Building and Grounds Cleaning and Maintenance Occupations 9,360 $10.83 $22,530 $8.09 $16,828 $12.20 $25,380
37-1011First-Line Supervisors of Housekeeping and Janitorial Workers 470 $16.07 $33,422 $9.67 $20,116 $19.27 $40,075
37-1012First-Line Supervisors of Landscaping, Lawn Service, and Groundsk 230 $19.06 $39,643 $10.47 $21,780 $23.35 $48,574
37-2011Janitors and Cleaners, Except Maids and Housekeeping Cleaners 4,460 $10.39 $21,620 $8.10 $16,849 $11.54 $24,006
37-2012 Maids and Housekeeping Cleaners 1,980 $8.53 $17,735 $8.07 $16,789 $8.75 $18,208
37-2021 Pest Control Workers 250 $15.05 $31,308 $10.94 $22,754 $17.11 $35,585
37-3011 Landscaping and Groundskeeping Workers 1,830 $10.92 $22,712 $8.26 $17,188 $12.25 $25,473
37-3012Pesticide Handlers, Sprayers, and Applicators, Vegetation N/A $13.16 $27,365 $13.15 $27,362 $13.16 $27,366
37-3013 Tree Trimmers and Pruners 100 $18.25 $37,960 $13.69 $28,481 $20.53 $42,699
39-0000 Personal Care and Service Occupations 5,100 $10.33 $21,492 $8.08 $16,808 $11.46 $23,834
39-1021 First-Line Supervisors of Personal Service Workers 170 $14.08 $29,286 $8.45 $17,578 $16.89 $35,140
<-- Back To Table of Contents
NOTE: Totals may not add due to rounding and confidentiality suppressions.
MDES/LMIHelping Mississippians Get Jobs
Page 142015 MS Partnership WIA Occupational Employment Wage Estimates
SOC
Code Employment Hourly Annual Hourly Annual Hourly AnnualSOC Title
Average Wage Entry Level Wage Experienced Wage
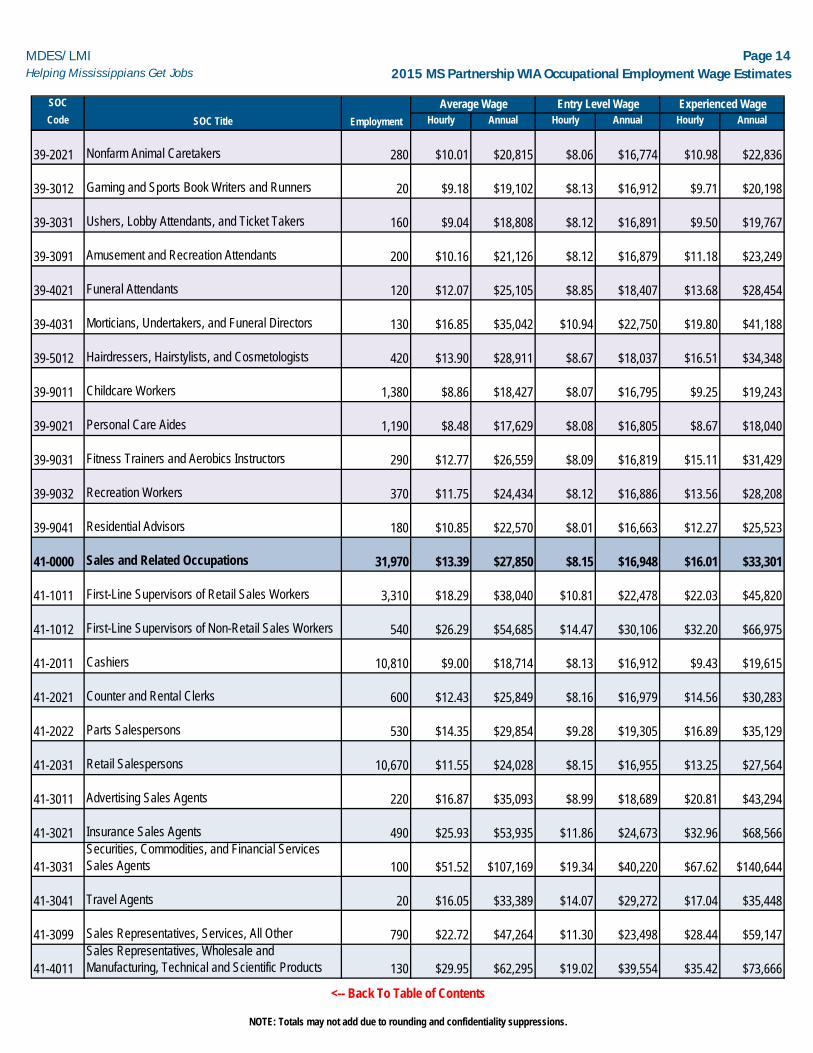
39-2021 Nonfarm Animal Caretakers 280 $10.01 $20,815 $8.06 $16,774 $10.98 $22,836
39-3012 Gaming and Sports Book Writers and Runners 20 $9.18 $19,102 $8.13 $16,912 $9.71 $20,198
39-3031 Ushers, Lobby Attendants, and Ticket Takers 160 $9.04 $18,808 $8.12 $16,891 $9.50 $19,767
39-3091 Amusement and Recreation Attendants 200 $10.16 $21,126 $8.12 $16,879 $11.18 $23,249
39-4021 Funeral Attendants 120 $12.07 $25,105 $8.85 $18,407 $13.68 $28,454
39-4031 Morticians, Undertakers, and Funeral Directors 130 $16.85 $35,042 $10.94 $22,750 $19.80 $41,188
39-5012 Hairdressers, Hairstylists, and Cosmetologists 420 $13.90 $28,911 $8.67 $18,037 $16.51 $34,348
39-9011 Childcare Workers 1,380 $8.86 $18,427 $8.07 $16,795 $9.25 $19,243
39-9021 Personal Care Aides 1,190 $8.48 $17,629 $8.08 $16,805 $8.67 $18,040
39-9031 Fitness Trainers and Aerobics Instructors 290 $12.77 $26,559 $8.09 $16,819 $15.11 $31,429
39-9032 Recreation Workers 370 $11.75 $24,434 $8.12 $16,886 $13.56 $28,208
39-9041 Residential Advisors 180 $10.85 $22,570 $8.01 $16,663 $12.27 $25,523
41-0000 Sales and Related Occupations 31,970 $13.39 $27,850 $8.15 $16,948 $16.01 $33,301
41-1011 First-Line Supervisors of Retail Sales Workers 3,310 $18.29 $38,040 $10.81 $22,478 $22.03 $45,820
41-1012 First-Line Supervisors of Non-Retail Sales Workers 540 $26.29 $54,685 $14.47 $30,106 $32.20 $66,975
41-2011 Cashiers 10,810 $9.00 $18,714 $8.13 $16,912 $9.43 $19,615
41-2021 Counter and Rental Clerks 600 $12.43 $25,849 $8.16 $16,979 $14.56 $30,283
41-2022 Parts Salespersons 530 $14.35 $29,854 $9.28 $19,305 $16.89 $35,129
41-2031 Retail Salespersons 10,670 $11.55 $24,028 $8.15 $16,955 $13.25 $27,564
41-3011 Advertising Sales Agents 220 $16.87 $35,093 $8.99 $18,689 $20.81 $43,294
41-3021 Insurance Sales Agents 490 $25.93 $53,935 $11.86 $24,673 $32.96 $68,566
41-3031Securities, Commodities, and Financial Services Sales Agents 100 $51.52 $107,169 $19.34 $40,220 $67.62 $140,644
41-3041 Travel Agents 20 $16.05 $33,389 $14.07 $29,272 $17.04 $35,448
41-3099 Sales Representatives, Services, All Other 790 $22.72 $47,264 $11.30 $23,498 $28.44 $59,147
41-4011Sales Representatives, Wholesale and Manufacturing, Technical and Scientific Products 130 $29.95 $62,295 $19.02 $39,554 $35.42 $73,666
<-- Back To Table of Contents
NOTE: Totals may not add due to rounding and confidentiality suppressions.

MDES/LMIHelping Mississippians Get Jobs
Page 152015 MS Partnership WIA Occupational Employment Wage Estimates
SOC
Code Employment Hourly Annual Hourly Annual Hourly AnnualSOC Title
Average Wage Entry Level Wage Experienced Wage
41-4012Manufacturing, Except Technical and Scientific Products 2,350 $24.16 $50,261 $10.74 $22,333 $30.88 $64,224
41-9021 Real Estate Brokers N/A $15.02 $31,249 $8.10 $16,838 $18.49 $38,455
41-9022 Real Estate Sales Agents 220 $13.33 $27,725 $8.15 $16,954 $15.92 $33,111
41-9031 Sales Engineers 60 $39.04 $81,193 $28.77 $59,851 $44.17 $91,865
41-9041 Telemarketers 1,000 $10.36 $21,552 $8.19 $17,027 $11.45 $23,814
41-9099 Sales and Related Workers, All Other 90 $12.93 $26,902 $8.46 $17,592 $15.17 $31,557
43-0000 Office and Administrative Support Occupations 42,030 $14.28 $29,694 $9.25 $19,234 $16.79 $34,924
43-1011First-Line Supervisors of Office and Administrative Support Worke 2,740 $20.37 $42,369 $12.90 $26,824 $24.11 $50,142
43-2011Switchboard Operators, Including Answering Service 320 $10.60 $22,057 $8.09 $16,826 $11.86 $24,673
43-3011 Bill and Account Collectors 480 $14.07 $29,262 $9.88 $20,543 $16.16 $33,622
43-3021 Billing and Posting Clerks and Machine Operators 980 $13.91 $28,933 $9.57 $19,899 $16.08 $33,449
43-3031 Bookkeeping, Accounting, and Auditing Clerks 3,200 $16.00 $33,272 $10.69 $22,243 $18.65 $38,787
43-3051 Payroll and Timekeeping Clerks 420 $16.42 $34,148 $11.98 $24,928 $18.63 $38,757
43-3061 Procurement Clerks 150 $17.82 $37,067 $13.17 $27,403 $20.14 $41,899
43-3071 Tellers 1,390 $12.29 $25,573 $10.01 $20,822 $13.44 $27,949
43-4031 Court, Municipal, and License Clerks 330 $14.86 $30,919 $10.98 $22,841 $16.81 $34,958
43-4041 Credit Authorizers, Checkers, and Clerks 420 $12.82 $26,671 $9.55 $19,869 $14.46 $30,071
43-4051 Customer Service Representatives 2,970 $14.82 $30,817 $9.76 $20,304 $17.34 $36,074
43-4061 Eligibility Interviewers, Government Programs 310 $14.63 $30,433 $11.42 $23,749 $16.24 $33,776
43-4071 File Clerks 310 $11.98 $24,919 $8.77 $18,233 $13.59 $28,262
43-4081 Hotel, Motel, and Resort Desk Clerks 850 $8.79 $18,277 $8.11 $16,866 $9.13 $18,983
43-4111 Interviewers, Except Eligibility and Loan 470 $12.71 $26,441 $9.57 $19,902 $14.28 $29,710
43-4121 Library Assistants, Clerical 290 $9.22 $19,187 $8.03 $16,709 $9.82 $20,426
43-4131 Loan Interviewers and Clerks 350 $14.61 $30,398 $10.90 $22,664 $16.47 $34,265
43-4141 New Accounts Clerks 240 $15.27 $31,753 $12.79 $26,607 $16.50 $34,326
<-- Back To Table of Contents
NOTE: Totals may not add due to rounding and confidentiality suppressions.
MDES/LMIHelping Mississippians Get Jobs
Page 162015 MS Partnership WIA Occupational Employment Wage Estimates
SOC
Code Employment Hourly Annual Hourly Annual Hourly AnnualSOC Title
Average Wage Entry Level Wage Experienced Wage
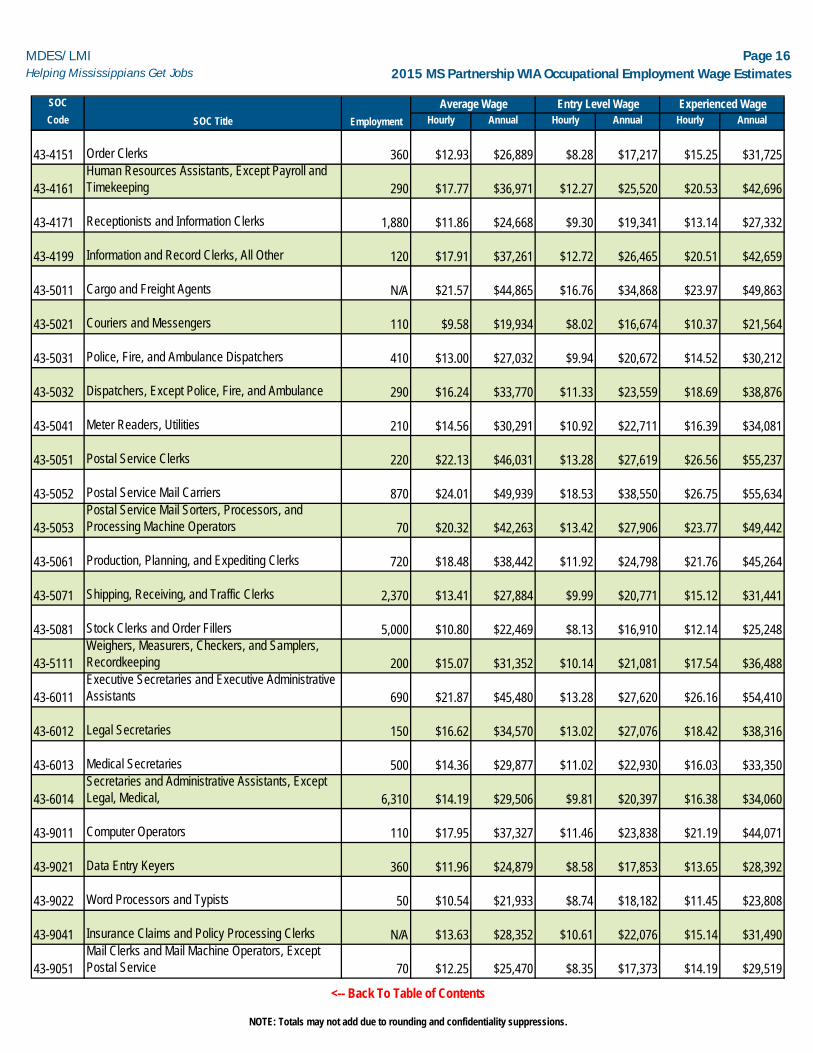
43-4151 Order Clerks 360 $12.93 $26,889 $8.28 $17,217 $15.25 $31,725
43-4161Human Resources Assistants, Except Payroll and Timekeeping 290 $17.77 $36,971 $12.27 $25,520 $20.53 $42,696
43-4171 Receptionists and Information Clerks 1,880 $11.86 $24,668 $9.30 $19,341 $13.14 $27,332
43-4199 Information and Record Clerks, All Other 120 $17.91 $37,261 $12.72 $26,465 $20.51 $42,659
43-5011 Cargo and Freight Agents N/A $21.57 $44,865 $16.76 $34,868 $23.97 $49,863
43-5021 Couriers and Messengers 110 $9.58 $19,934 $8.02 $16,674 $10.37 $21,564
43-5031 Police, Fire, and Ambulance Dispatchers 410 $13.00 $27,032 $9.94 $20,672 $14.52 $30,212
43-5032 Dispatchers, Except Police, Fire, and Ambulance 290 $16.24 $33,770 $11.33 $23,559 $18.69 $38,876
43-5041 Meter Readers, Utilities 210 $14.56 $30,291 $10.92 $22,711 $16.39 $34,081
43-5051 Postal Service Clerks 220 $22.13 $46,031 $13.28 $27,619 $26.56 $55,237
43-5052 Postal Service Mail Carriers 870 $24.01 $49,939 $18.53 $38,550 $26.75 $55,634
43-5053Postal Service Mail Sorters, Processors, and Processing Machine Operators 70 $20.32 $42,263 $13.42 $27,906 $23.77 $49,442
43-5061 Production, Planning, and Expediting Clerks 720 $18.48 $38,442 $11.92 $24,798 $21.76 $45,264
43-5071 Shipping, Receiving, and Traffic Clerks 2,370 $13.41 $27,884 $9.99 $20,771 $15.12 $31,441
43-5081 Stock Clerks and Order Fillers 5,000 $10.80 $22,469 $8.13 $16,910 $12.14 $25,248
43-5111Weighers, Measurers, Checkers, and Samplers, Recordkeeping 200 $15.07 $31,352 $10.14 $21,081 $17.54 $36,488
43-6011Executive Secretaries and Executive Administrative Assistants 690 $21.87 $45,480 $13.28 $27,620 $26.16 $54,410
43-6012 Legal Secretaries 150 $16.62 $34,570 $13.02 $27,076 $18.42 $38,316
43-6013 Medical Secretaries 500 $14.36 $29,877 $11.02 $22,930 $16.03 $33,350
43-6014Secretaries and Administrative Assistants, Except Legal, Medical, 6,310 $14.19 $29,506 $9.81 $20,397 $16.38 $34,060
43-9011 Computer Operators 110 $17.95 $37,327 $11.46 $23,838 $21.19 $44,071
43-9021 Data Entry Keyers 360 $11.96 $24,879 $8.58 $17,853 $13.65 $28,392
43-9022 Word Processors and Typists 50 $10.54 $21,933 $8.74 $18,182 $11.45 $23,808
43-9041 Insurance Claims and Policy Processing Clerks N/A $13.63 $28,352 $10.61 $22,076 $15.14 $31,490
43-9051Mail Clerks and Mail Machine Operators, Except Postal Service 70 $12.25 $25,470 $8.35 $17,373 $14.19 $29,519
<-- Back To Table of Contents
NOTE: Totals may not add due to rounding and confidentiality suppressions.

MDES/LMIHelping Mississippians Get Jobs
Page 172015 MS Partnership WIA Occupational Employment Wage Estimates
SOC
Code Employment Hourly Annual Hourly Annual Hourly AnnualSOC Title
Average Wage Entry Level Wage Experienced Wage
43-9061 Office Clerks, General 3,880 $11.98 $24,923 $8.39 $17,458 $13.78 $28,656
43-9071 Office Machine Operators, Except Computer 40 $16.29 $33,883 $9.78 $20,347 $19.54 $40,651
45-0000 Farming, Fishing, and Forestry Occupations 780 $16.48 $34,278 $11.87 $24,692 $18.78 $39,071
45-1011First-Line Supervisors of Farming, Fishing, and Forestry Workers 120 $23.53 $48,937 $14.21 $29,566 $28.18 $58,622
45-2011 Agricultural Inspectors 30 $16.11 $33,507 $12.77 $26,559 $17.78 $36,980
45-2091 Agricultural Equipment Operators N/A $16.49 $34,295 $13.34 $27,748 $18.06 $37,568
45-2093Farmworkers, Farm, Ranch, and Aquacultural Animals 20 $16.79 $34,915 $12.25 $25,475 $19.05 $39,634
45-4021 Fallers 140 $14.43 $30,007 $10.38 $21,591 $16.45 $34,215
45-4022 Logging Equipment Operators 350 $14.92 $31,025 $12.41 $25,809 $16.17 $33,633
45-4023 Log Graders and Scalers N/A $17.70 $36,823 $13.34 $27,738 $19.89 $41,365
47-0000 Construction and Extraction Occupations 9,970 $16.28 $33,858 $10.73 $22,310 $19.05 $39,631
47-1011First-Line Supervisors of Construction Trades and Extraction Work 1,130 $25.11 $52,227 $17.38 $36,151 $28.97 $60,265
47-2021 Brickmasons and Blockmasons 80 $15.86 $32,991 $12.57 $26,135 $17.51 $36,418
47-2022 Stonemasons N/A $16.67 $34,667 $11.92 $24,790 $19.04 $39,606
47-2031 Carpenters 1,080 $14.65 $30,467 $10.98 $22,835 $16.48 $34,283
47-2044 Tile and Marble Setters 30 $16.89 $35,134 $13.20 $27,449 $18.74 $38,977
47-2051 Cement Masons and Concrete Finishers 180 $13.64 $28,362 $9.60 $19,968 $15.65 $32,558
47-2061 Construction Laborers 1,860 $12.43 $25,853 $9.83 $20,451 $13.73 $28,554
47-2071Paving, Surfacing, and Tamping Equipment Operators 170 $15.09 $31,386 $10.53 $21,908 $17.37 $36,125
47-2073Operating Engineers and Other Construction Equipment Operators 800 $17.28 $35,935 $12.63 $26,267 $19.60 $40,769
47-2081 Drywall and Ceiling Tile Installers 90 $13.86 $28,820 $9.28 $19,312 $16.14 $33,574
47-2111 Electricians 1,010 $20.48 $42,601 $16.37 $34,040 $22.54 $46,881
47-2121 Glaziers 70 $14.67 $30,523 $11.28 $23,472 $16.37 $34,049
47-2131 Insulation Workers, Floor, Ceiling, and Wall N/A $14.44 $30,038 $10.52 $21,876 $16.40 $34,119
47-2141 Painters, Construction and Maintenance 280 $13.30 $27,673 $10.38 $21,597 $14.77 $30,712
<-- Back To Table of Contents
NOTE: Totals may not add due to rounding and confidentiality suppressions.

MDES/LMIHelping Mississippians Get Jobs
Page 182015 MS Partnership WIA Occupational Employment Wage Estimates
SOC
Code Employment Hourly Annual Hourly Annual Hourly AnnualSOC Title
Average Wage Entry Level Wage Experienced Wage
47-2151 Pipelayers 100 $16.01 $33,298 $11.14 $23,166 $18.44 $38,364
47-2152 Plumbers, Pipefitters, and Steamfitters 490 $17.41 $36,217 $12.78 $26,580 $19.73 $41,035
47-2171 Reinforcing Iron and Rebar Workers 40 $21.12 $43,929 $15.89 $33,053 $23.73 $49,367
47-2181 Roofers 110 $11.44 $23,796 $8.27 $17,194 $13.03 $27,097
47-2211 Sheet Metal Workers 570 $15.27 $31,769 $11.19 $23,281 $17.31 $36,012
47-2221 Structural Iron and Steel Workers 60 $18.82 $39,143 $13.97 $29,053 $21.24 $44,189
47-3011Helpers--Brickmasons, Blockmasons, Stonemasons, and Tile and Marble Setters 50 $10.99 $22,862 $8.15 $16,945 $12.41 $25,820
47-3012 Helpers--Carpenters 60 $12.23 $25,440 $10.17 $21,160 $13.26 $27,580
47-3013 Helpers--Electricians 160 $10.88 $22,625 $8.16 $16,968 $12.24 $25,453
47-3015Helpers--Pipelayers, Plumbers, Pipefitters, and Steamfitters 130 $12.15 $25,276 $8.70 $18,096 $13.88 $28,866
47-3016 Helpers--Roofers N/A $9.48 $19,723 $8.17 $16,999 $10.14 $21,084
47-4011 Construction and Building Inspectors 70 $21.34 $44,397 $14.51 $30,174 $24.76 $51,508
47-4051 Highway Maintenance Workers 830 $13.69 $28,469 $9.77 $20,312 $15.65 $32,547
47-4061Rail-Track Laying and Maintenance Equipment Operators 100 $15.30 $31,815 $12.68 $26,365 $16.61 $34,539
47-4071 Septic Tank Servicers and Sewer Pipe Cleaners 30 $15.48 $32,197 $11.29 $23,475 $17.58 $36,558
47-5021 Earth Drillers, Except Oil and Gas 30 $18.24 $37,945 $13.73 $28,559 $20.50 $42,638
47-5081 Helpers--Extraction Workers 80 $11.39 $23,697 $8.08 $16,801 $13.05 $27,145
49-0000Installation, Maintenance, and Repair Occupations 12,530 $18.34 $38,139 $11.18 $23,249 $21.92 $45,583
49-1011First-Line Supervisors of Mechanics, Installers, and Repairers 970 $23.60 $49,085 $14.88 $30,946 $27.96 $58,155
49-2011Computer, Automated Teller, and Office Machine Repairers 190 $15.90 $33,079 $11.13 $23,158 $18.29 $38,039
49-2022Telecommunications Equipment Installers and Repairers, Except Line Installers 420 $24.60 $51,171 $13.06 $27,167 $30.37 $63,173
49-2091 Avionics Technicians 170 $24.31 $50,557 $21.19 $44,081 $25.86 $53,795
49-2092 Electric Motor, Power Tool, and Related Repairers 110 $18.01 $37,462 $12.46 $25,910 $20.79 $43,238
49-2094Electrical and Electronics Repairers, Commercial and Industrial Equipment 160 $20.61 $42,875 $14.14 $29,411 $23.85 $49,607
49-2095Electrical and Electronics Repairers, Powerhouse, Substation, and Relay 40 $32.58 $67,758 $30.53 $63,497 $33.60 $69,888
<-- Back To Table of Contents
NOTE: Totals may not add due to rounding and confidentiality suppressions.
MDES/LMIHelping Mississippians Get Jobs
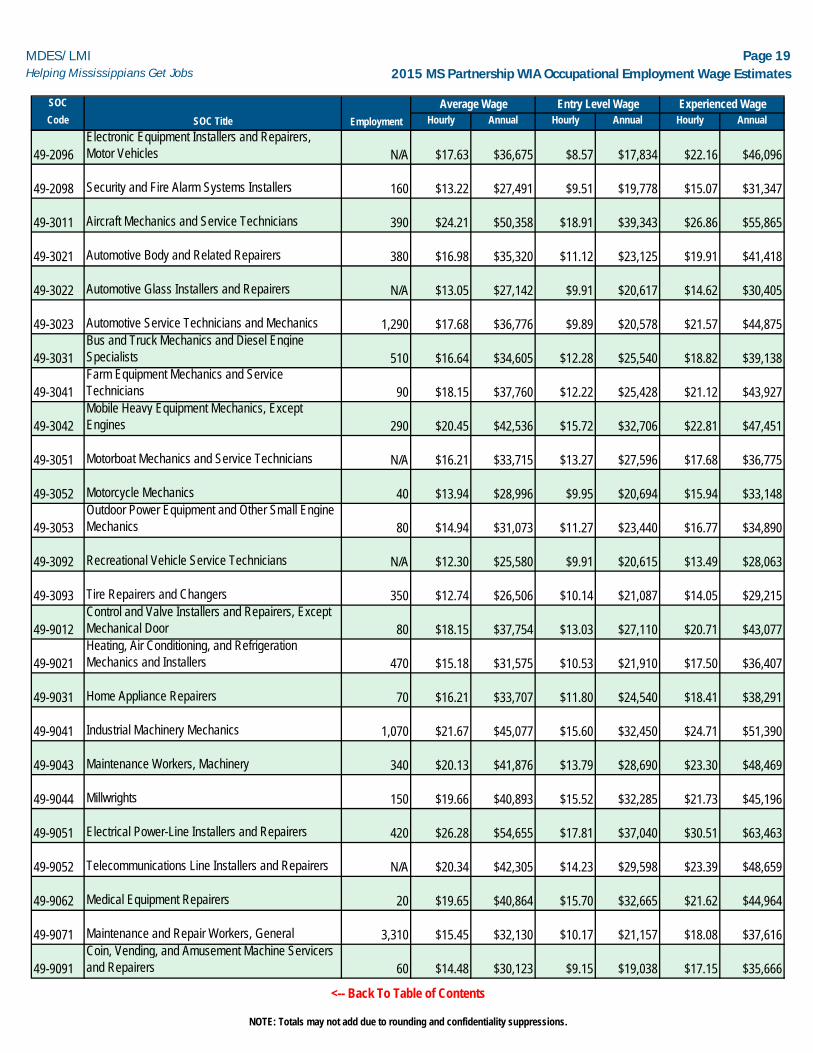
Page 192015 MS Partnership WIA Occupational Employment Wage Estimates
SOC
Code Employment Hourly Annual Hourly Annual Hourly AnnualSOC Title
Average Wage Entry Level Wage Experienced Wage
49-2096Electronic Equipment Installers and Repairers, Motor Vehicles N/A $17.63 $36,675 $8.57 $17,834 $22.16 $46,096
49-2098 Security and Fire Alarm Systems Installers 160 $13.22 $27,491 $9.51 $19,778 $15.07 $31,347
49-3011 Aircraft Mechanics and Service Technicians 390 $24.21 $50,358 $18.91 $39,343 $26.86 $55,865
49-3021 Automotive Body and Related Repairers 380 $16.98 $35,320 $11.12 $23,125 $19.91 $41,418
49-3022 Automotive Glass Installers and Repairers N/A $13.05 $27,142 $9.91 $20,617 $14.62 $30,405
49-3023 Automotive Service Technicians and Mechanics 1,290 $17.68 $36,776 $9.89 $20,578 $21.57 $44,875
49-3031Bus and Truck Mechanics and Diesel Engine Specialists 510 $16.64 $34,605 $12.28 $25,540 $18.82 $39,138
49-3041Farm Equipment Mechanics and Service Technicians 90 $18.15 $37,760 $12.22 $25,428 $21.12 $43,927
49-3042Mobile Heavy Equipment Mechanics, Except Engines 290 $20.45 $42,536 $15.72 $32,706 $22.81 $47,451
49-3051 Motorboat Mechanics and Service Technicians N/A $16.21 $33,715 $13.27 $27,596 $17.68 $36,775
49-3052 Motorcycle Mechanics 40 $13.94 $28,996 $9.95 $20,694 $15.94 $33,148
49-3053Outdoor Power Equipment and Other Small Engine Mechanics 80 $14.94 $31,073 $11.27 $23,440 $16.77 $34,890
49-3092 Recreational Vehicle Service Technicians N/A $12.30 $25,580 $9.91 $20,615 $13.49 $28,063
49-3093 Tire Repairers and Changers 350 $12.74 $26,506 $10.14 $21,087 $14.05 $29,215
49-9012Control and Valve Installers and Repairers, Except Mechanical Door 80 $18.15 $37,754 $13.03 $27,110 $20.71 $43,077
49-9021Heating, Air Conditioning, and Refrigeration Mechanics and Installers 470 $15.18 $31,575 $10.53 $21,910 $17.50 $36,407
49-9031 Home Appliance Repairers 70 $16.21 $33,707 $11.80 $24,540 $18.41 $38,291
49-9041 Industrial Machinery Mechanics 1,070 $21.67 $45,077 $15.60 $32,450 $24.71 $51,390
49-9043 Maintenance Workers, Machinery 340 $20.13 $41,876 $13.79 $28,690 $23.30 $48,469
49-9044 Millwrights 150 $19.66 $40,893 $15.52 $32,285 $21.73 $45,196
49-9051 Electrical Power-Line Installers and Repairers 420 $26.28 $54,655 $17.81 $37,040 $30.51 $63,463
49-9052 Telecommunications Line Installers and Repairers N/A $20.34 $42,305 $14.23 $29,598 $23.39 $48,659
49-9062 Medical Equipment Repairers 20 $19.65 $40,864 $15.70 $32,665 $21.62 $44,964
49-9071 Maintenance and Repair Workers, General 3,310 $15.45 $32,130 $10.17 $21,157 $18.08 $37,616
49-9091Coin, Vending, and Amusement Machine Servicers and Repairers 60 $14.48 $30,123 $9.15 $19,038 $17.15 $35,666
<-- Back To Table of Contents
NOTE: Totals may not add due to rounding and confidentiality suppressions.
MDES/LMIHelping Mississippians Get Jobs
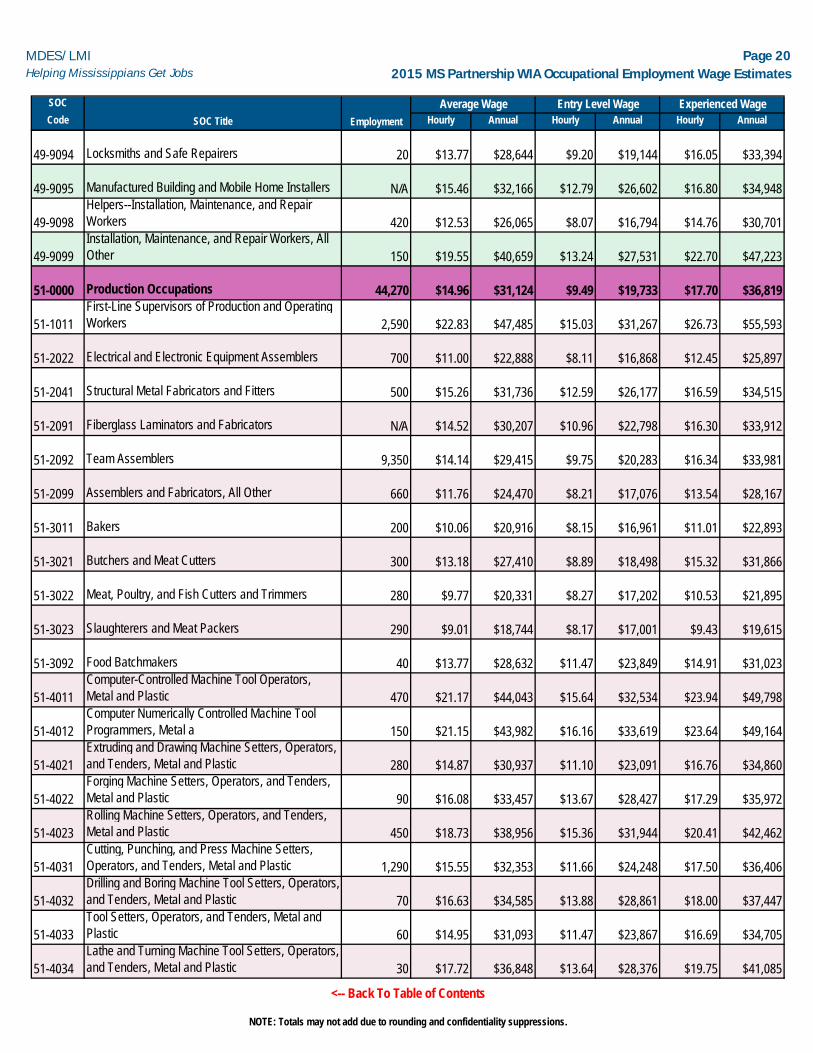
Page 202015 MS Partnership WIA Occupational Employment Wage Estimates
SOC
Code Employment Hourly Annual Hourly Annual Hourly AnnualSOC Title
Average Wage Entry Level Wage Experienced Wage
49-9094 Locksmiths and Safe Repairers 20 $13.77 $28,644 $9.20 $19,144 $16.05 $33,394
49-9095 Manufactured Building and Mobile Home Installers N/A $15.46 $32,166 $12.79 $26,602 $16.80 $34,948
49-9098Helpers--Installation, Maintenance, and Repair Workers 420 $12.53 $26,065 $8.07 $16,794 $14.76 $30,701
49-9099Installation, Maintenance, and Repair Workers, All Other 150 $19.55 $40,659 $13.24 $27,531 $22.70 $47,223
51-0000 Production Occupations 44,270 $14.96 $31,124 $9.49 $19,733 $17.70 $36,819
51-1011First-Line Supervisors of Production and Operating Workers 2,590 $22.83 $47,485 $15.03 $31,267 $26.73 $55,593
51-2022 Electrical and Electronic Equipment Assemblers 700 $11.00 $22,888 $8.11 $16,868 $12.45 $25,897
51-2041 Structural Metal Fabricators and Fitters 500 $15.26 $31,736 $12.59 $26,177 $16.59 $34,515
51-2091 Fiberglass Laminators and Fabricators N/A $14.52 $30,207 $10.96 $22,798 $16.30 $33,912
51-2092 Team Assemblers 9,350 $14.14 $29,415 $9.75 $20,283 $16.34 $33,981
51-2099 Assemblers and Fabricators, All Other 660 $11.76 $24,470 $8.21 $17,076 $13.54 $28,167
51-3011 Bakers 200 $10.06 $20,916 $8.15 $16,961 $11.01 $22,893
51-3021 Butchers and Meat Cutters 300 $13.18 $27,410 $8.89 $18,498 $15.32 $31,866
51-3022 Meat, Poultry, and Fish Cutters and Trimmers 280 $9.77 $20,331 $8.27 $17,202 $10.53 $21,895
51-3023 Slaughterers and Meat Packers 290 $9.01 $18,744 $8.17 $17,001 $9.43 $19,615
51-3092 Food Batchmakers 40 $13.77 $28,632 $11.47 $23,849 $14.91 $31,023
51-4011Computer-Controlled Machine Tool Operators, Metal and Plastic 470 $21.17 $44,043 $15.64 $32,534 $23.94 $49,798
51-4012Computer Numerically Controlled Machine Tool Programmers, Metal a 150 $21.15 $43,982 $16.16 $33,619 $23.64 $49,164
51-4021Extruding and Drawing Machine Setters, Operators, and Tenders, Metal and Plastic 280 $14.87 $30,937 $11.10 $23,091 $16.76 $34,860
51-4022Forging Machine Setters, Operators, and Tenders, Metal and Plastic 90 $16.08 $33,457 $13.67 $28,427 $17.29 $35,972
51-4023Rolling Machine Setters, Operators, and Tenders, Metal and Plastic 450 $18.73 $38,956 $15.36 $31,944 $20.41 $42,462
51-4031Cutting, Punching, and Press Machine Setters, Operators, and Tenders, Metal and Plastic 1,290 $15.55 $32,353 $11.66 $24,248 $17.50 $36,406
51-4032Drilling and Boring Machine Tool Setters, Operators, and Tenders, Metal and Plastic 70 $16.63 $34,585 $13.88 $28,861 $18.00 $37,447
51-4033Tool Setters, Operators, and Tenders, Metal and Plastic 60 $14.95 $31,093 $11.47 $23,867 $16.69 $34,705
51-4034Lathe and Turning Machine Tool Setters, Operators, and Tenders, Metal and Plastic 30 $17.72 $36,848 $13.64 $28,376 $19.75 $41,085
<-- Back To Table of Contents
NOTE: Totals may not add due to rounding and confidentiality suppressions.
MDES/LMIHelping Mississippians Get Jobs
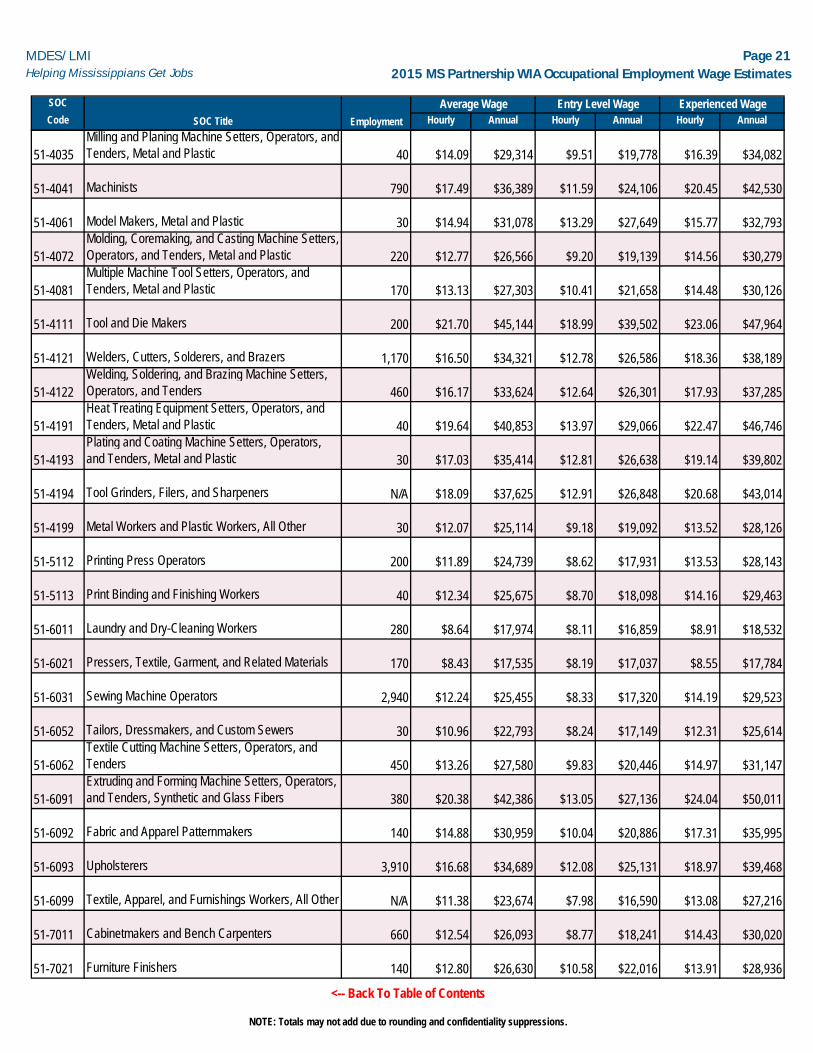
Page 212015 MS Partnership WIA Occupational Employment Wage Estimates
SOC
Code Employment Hourly Annual Hourly Annual Hourly AnnualSOC Title
Average Wage Entry Level Wage Experienced Wage
51-4035Milling and Planing Machine Setters, Operators, and Tenders, Metal and Plastic 40 $14.09 $29,314 $9.51 $19,778 $16.39 $34,082
51-4041 Machinists 790 $17.49 $36,389 $11.59 $24,106 $20.45 $42,530
51-4061 Model Makers, Metal and Plastic 30 $14.94 $31,078 $13.29 $27,649 $15.77 $32,793
51-4072Molding, Coremaking, and Casting Machine Setters, Operators, and Tenders, Metal and Plastic 220 $12.77 $26,566 $9.20 $19,139 $14.56 $30,279
51-4081Multiple Machine Tool Setters, Operators, and Tenders, Metal and Plastic 170 $13.13 $27,303 $10.41 $21,658 $14.48 $30,126
51-4111 Tool and Die Makers 200 $21.70 $45,144 $18.99 $39,502 $23.06 $47,964
51-4121 Welders, Cutters, Solderers, and Brazers 1,170 $16.50 $34,321 $12.78 $26,586 $18.36 $38,189
51-4122Welding, Soldering, and Brazing Machine Setters, Operators, and Tenders 460 $16.17 $33,624 $12.64 $26,301 $17.93 $37,285
51-4191Heat Treating Equipment Setters, Operators, and Tenders, Metal and Plastic 40 $19.64 $40,853 $13.97 $29,066 $22.47 $46,746
51-4193Plating and Coating Machine Setters, Operators, and Tenders, Metal and Plastic 30 $17.03 $35,414 $12.81 $26,638 $19.14 $39,802
51-4194 Tool Grinders, Filers, and Sharpeners N/A $18.09 $37,625 $12.91 $26,848 $20.68 $43,014
51-4199 Metal Workers and Plastic Workers, All Other 30 $12.07 $25,114 $9.18 $19,092 $13.52 $28,126
51-5112 Printing Press Operators 200 $11.89 $24,739 $8.62 $17,931 $13.53 $28,143
51-5113 Print Binding and Finishing Workers 40 $12.34 $25,675 $8.70 $18,098 $14.16 $29,463
51-6011 Laundry and Dry-Cleaning Workers 280 $8.64 $17,974 $8.11 $16,859 $8.91 $18,532
51-6021 Pressers, Textile, Garment, and Related Materials 170 $8.43 $17,535 $8.19 $17,037 $8.55 $17,784
51-6031 Sewing Machine Operators 2,940 $12.24 $25,455 $8.33 $17,320 $14.19 $29,523
51-6052 Tailors, Dressmakers, and Custom Sewers 30 $10.96 $22,793 $8.24 $17,149 $12.31 $25,614
51-6062Textile Cutting Machine Setters, Operators, and Tenders 450 $13.26 $27,580 $9.83 $20,446 $14.97 $31,147
51-6091Extruding and Forming Machine Setters, Operators, and Tenders, Synthetic and Glass Fibers 380 $20.38 $42,386 $13.05 $27,136 $24.04 $50,011
51-6092 Fabric and Apparel Patternmakers 140 $14.88 $30,959 $10.04 $20,886 $17.31 $35,995
51-6093 Upholsterers 3,910 $16.68 $34,689 $12.08 $25,131 $18.97 $39,468
51-6099 Textile, Apparel, and Furnishings Workers, All Other N/A $11.38 $23,674 $7.98 $16,590 $13.08 $27,216
51-7011 Cabinetmakers and Bench Carpenters 660 $12.54 $26,093 $8.77 $18,241 $14.43 $30,020
51-7021 Furniture Finishers 140 $12.80 $26,630 $10.58 $22,016 $13.91 $28,936
<-- Back To Table of Contents
NOTE: Totals may not add due to rounding and confidentiality suppressions.

MDES/LMIHelping Mississippians Get Jobs
Page 222015 MS Partnership WIA Occupational Employment Wage Estimates
SOC
Code Employment Hourly Annual Hourly Annual Hourly AnnualSOC Title
Average Wage Entry Level Wage Experienced Wage
51-7041Sawing Machine Setters, Operators, and Tenders, Wood 830 $11.03 $22,935 $8.06 $16,763 $12.51 $26,021
51-7042Woodworking Machine Setters, Operators, and Tenders, Except Sawing 1,190 $11.38 $23,666 $8.65 $17,993 $12.74 $26,502
51-8013 Power Plant Operators 130 $31.70 $65,929 $20.03 $41,663 $37.53 $78,062
51-8031Water and Wastewater Treatment Plant and System Operators 290 $18.81 $39,119 $14.18 $29,499 $21.12 $43,929
51-8091 Chemical Plant and System Operators N/A $30.04 $62,485 $24.86 $51,712 $32.63 $67,871
51-9011 Chemical Equipment Operators and Tenders 360 $26.24 $54,586 $23.76 $49,431 $27.48 $57,164
51-9012Separating, Filtering, Clarifying, Precipitating, and Still Machine Setters, Operators, and Tenders 140 $21.62 $44,962 $15.08 $31,374 $24.88 $51,756
51-9021Crushing, Grinding, and Polishing Machine Setters, Operators, and Tenders 120 $13.65 $28,398 $9.80 $20,375 $15.58 $32,409
51-9022 Grinding and Polishing Workers, Hand 130 $12.81 $26,640 $8.88 $18,471 $14.77 $30,724
51-9023Mixing and Blending Machine Setters, Operators, and Tenders 210 $15.00 $31,194 $11.84 $24,625 $16.58 $34,479
51-9031 Cutters and Trimmers, Hand 230 $13.95 $29,019 $10.38 $21,585 $15.74 $32,736
51-9032Cutting and Slicing Machine Setters, Operators, and Tenders 160 $13.00 $27,035 $9.95 $20,697 $14.52 $30,204
51-9041Extruding, Forming, Pressing, and Compacting Machine Setters, Operators, and Tenders 250 $13.60 $28,297 $9.81 $20,411 $15.50 $32,240
51-9051Furnace, Kiln, Oven, Drier, and Kettle Operators and Tenders 60 $13.34 $27,743 $9.65 $20,077 $15.18 $31,576
51-9061Inspectors, Testers, Sorters, Samplers, and Weighers 1,930 $15.28 $31,783 $10.18 $21,167 $17.83 $37,092
51-9081 Dental Laboratory Technicians 20 $14.85 $30,882 $12.09 $25,154 $16.22 $33,747
51-9082 Medical Appliance Technicians N/A $21.18 $44,062 $16.73 $34,808 $23.41 $48,689
51-9083 Ophthalmic Laboratory Technicians N/A $11.72 $24,374 $9.88 $20,556 $12.64 $26,283
51-9111Packaging and Filling Machine Operators and Tenders 1,500 $12.53 $26,063 $9.22 $19,179 $14.18 $29,505
51-9121Coating, Painting, and Spraying Machine Setters, Operators, and Tenders 200 $15.21 $31,644 $12.27 $25,516 $16.69 $34,708
51-9122 Painters, Transportation Equipment 240 $16.12 $33,539 $13.12 $27,288 $17.63 $36,664
51-9123 Painting, Coating, and Decorating Workers 20 $12.32 $25,618 $8.89 $18,483 $14.03 $29,185
51-9151Photographic Process Workers and Processing Machine Operators 20 $13.22 $27,488 $10.95 $22,780 $14.35 $29,842
51-9191 Adhesive Bonding Machine Operators and Tenders 320 $12.42 $25,834 $10.19 $21,198 $13.53 $28,152
51-9192Cleaning, Washing, and Metal Pickling Equipment Operators and Tenders 20 $15.02 $31,240 $10.71 $22,273 $17.18 $35,724
<-- Back To Table of Contents
NOTE: Totals may not add due to rounding and confidentiality suppressions.
MDES/LMIHelping Mississippians Get Jobs
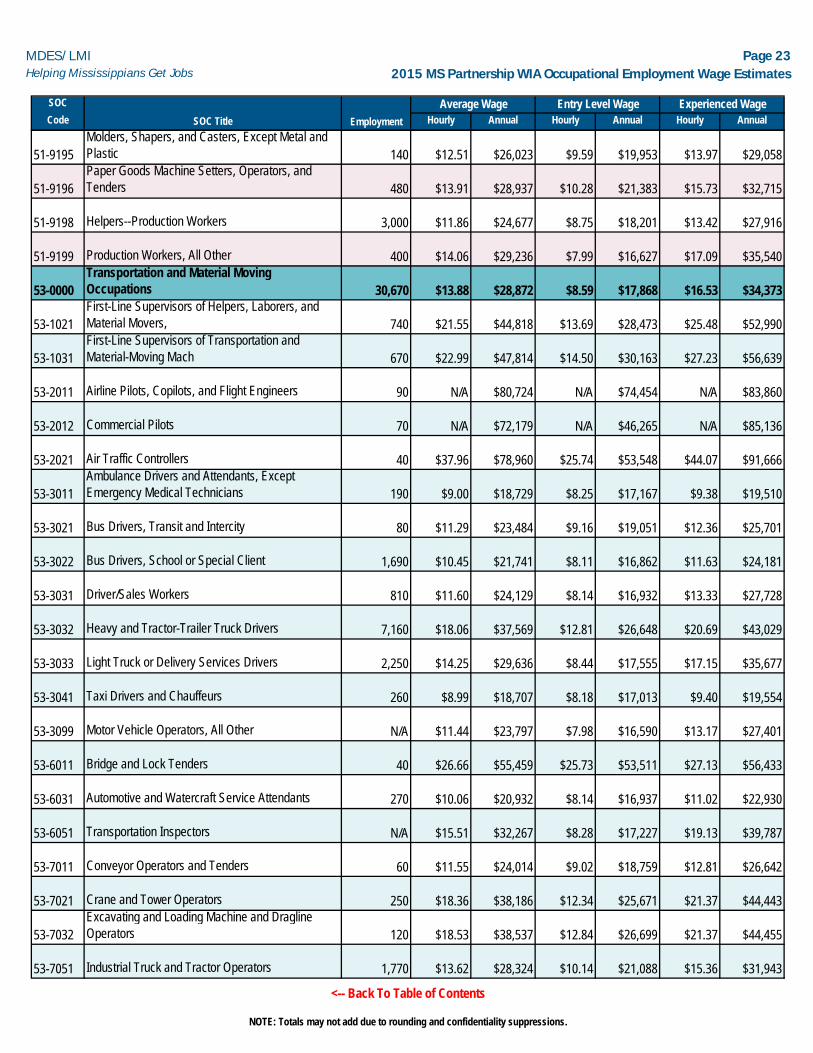
Page 232015 MS Partnership WIA Occupational Employment Wage Estimates
SOC
Code Employment Hourly Annual Hourly Annual Hourly AnnualSOC Title
Average Wage Entry Level Wage Experienced Wage
51-9195Molders, Shapers, and Casters, Except Metal and Plastic 140 $12.51 $26,023 $9.59 $19,953 $13.97 $29,058
51-9196Paper Goods Machine Setters, Operators, and Tenders 480 $13.91 $28,937 $10.28 $21,383 $15.73 $32,715
51-9198 Helpers--Production Workers 3,000 $11.86 $24,677 $8.75 $18,201 $13.42 $27,916
51-9199 Production Workers, All Other 400 $14.06 $29,236 $7.99 $16,627 $17.09 $35,540
53-0000Transportation and Material Moving Occupations 30,670 $13.88 $28,872 $8.59 $17,868 $16.53 $34,373
53-1021First-Line Supervisors of Helpers, Laborers, and Material Movers, 740 $21.55 $44,818 $13.69 $28,473 $25.48 $52,990
53-1031First-Line Supervisors of Transportation and Material-Moving Mach 670 $22.99 $47,814 $14.50 $30,163 $27.23 $56,639
53-2011 Airline Pilots, Copilots, and Flight Engineers 90 N/A $80,724 N/A $74,454 N/A $83,860
53-2012 Commercial Pilots 70 N/A $72,179 N/A $46,265 N/A $85,136
53-2021 Air Traffic Controllers 40 $37.96 $78,960 $25.74 $53,548 $44.07 $91,666
53-3011Ambulance Drivers and Attendants, Except Emergency Medical Technicians 190 $9.00 $18,729 $8.25 $17,167 $9.38 $19,510
53-3021 Bus Drivers, Transit and Intercity 80 $11.29 $23,484 $9.16 $19,051 $12.36 $25,701
53-3022 Bus Drivers, School or Special Client 1,690 $10.45 $21,741 $8.11 $16,862 $11.63 $24,181
53-3031 Driver/Sales Workers 810 $11.60 $24,129 $8.14 $16,932 $13.33 $27,728
53-3032 Heavy and Tractor-Trailer Truck Drivers 7,160 $18.06 $37,569 $12.81 $26,648 $20.69 $43,029
53-3033 Light Truck or Delivery Services Drivers 2,250 $14.25 $29,636 $8.44 $17,555 $17.15 $35,677
53-3041 Taxi Drivers and Chauffeurs 260 $8.99 $18,707 $8.18 $17,013 $9.40 $19,554
53-3099 Motor Vehicle Operators, All Other N/A $11.44 $23,797 $7.98 $16,590 $13.17 $27,401
53-6011 Bridge and Lock Tenders 40 $26.66 $55,459 $25.73 $53,511 $27.13 $56,433
53-6031 Automotive and Watercraft Service Attendants 270 $10.06 $20,932 $8.14 $16,937 $11.02 $22,930
53-6051 Transportation Inspectors N/A $15.51 $32,267 $8.28 $17,227 $19.13 $39,787
53-7011 Conveyor Operators and Tenders 60 $11.55 $24,014 $9.02 $18,759 $12.81 $26,642
53-7021 Crane and Tower Operators 250 $18.36 $38,186 $12.34 $25,671 $21.37 $44,443
53-7032Excavating and Loading Machine and Dragline Operators 120 $18.53 $38,537 $12.84 $26,699 $21.37 $44,455
53-7051 Industrial Truck and Tractor Operators 1,770 $13.62 $28,324 $10.14 $21,088 $15.36 $31,943
<-- Back To Table of Contents
NOTE: Totals may not add due to rounding and confidentiality suppressions.
MDES/LMIHelping Mississippians Get Jobs
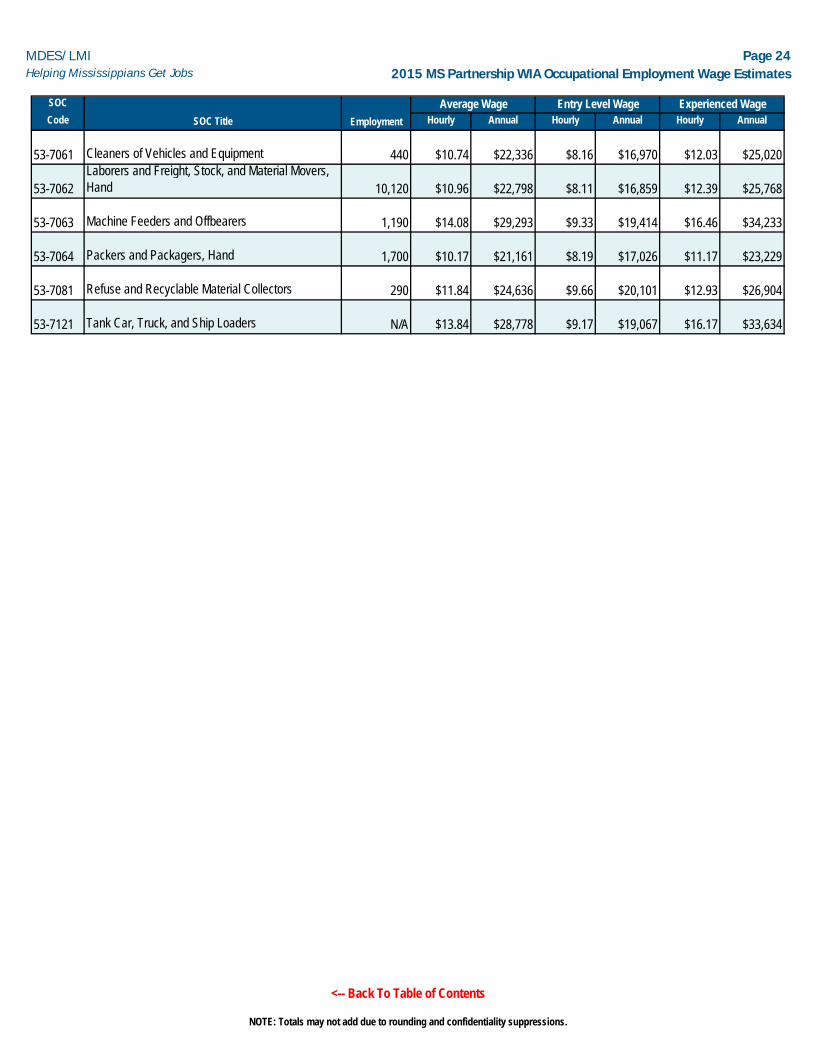
Page 242015 MS Partnership WIA Occupational Employment Wage Estimates
SOC
Code Employment Hourly Annual Hourly Annual Hourly AnnualSOC Title
Average Wage Entry Level Wage Experienced Wage
53-7061 Cleaners of Vehicles and Equipment 440 $10.74 $22,336 $8.16 $16,970 $12.03 $25,020
53-7062Laborers and Freight, Stock, and Material Movers, Hand 10,120 $10.96 $22,798 $8.11 $16,859 $12.39 $25,768
53-7063 Machine Feeders and Offbearers 1,190 $14.08 $29,293 $9.33 $19,414 $16.46 $34,233
53-7064 Packers and Packagers, Hand 1,700 $10.17 $21,161 $8.19 $17,026 $11.17 $23,229
53-7081 Refuse and Recyclable Material Collectors 290 $11.84 $24,636 $9.66 $20,101 $12.93 $26,904
53-7121 Tank Car, Truck, and Ship Loaders N/A $13.84 $28,778 $9.17 $19,067 $16.17 $33,634
<-- Back To Table of Contents
NOTE: Totals may not add due to rounding and confidentiality suppressions.
Appendix - Page 1
Back to Table of Contents
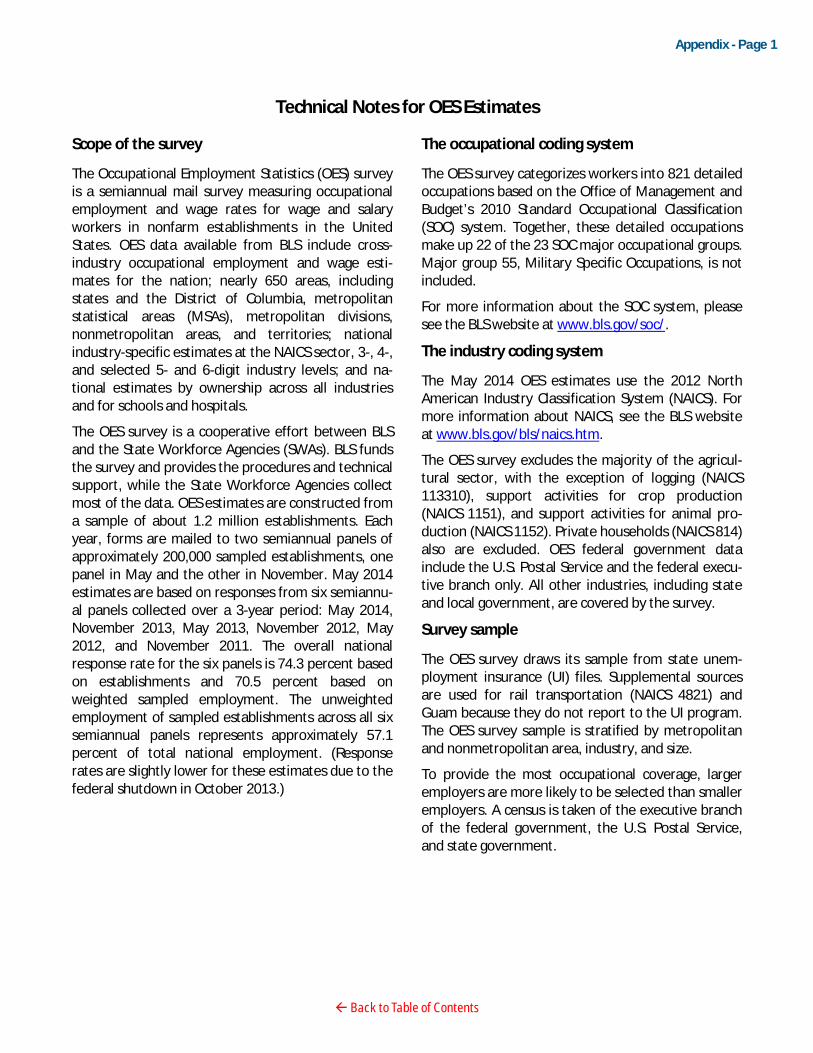
Technical Notes for OES Estimates
Scope of the survey
The Occupational Employment Statistics (OES) survey is a semiannual mail survey measuring occupational employment and wage rates for wage and salary workers in nonfarm establishments in the United States. OES data available from BLS include cross-industry occupational employment and wage esti-mates for the nation; nearly 650 areas, including states and the District of Columbia, metropolitan statistical areas (MSAs), metropolitan divisions, nonmetropolitan areas, and territories; national industry-specific estimates at the NAICS sector, 3-, 4-, and selected 5- and 6-digit industry levels; and na-tional estimates by ownership across all industries and for schools and hospitals.
The OES survey is a cooperative effort between BLS and the State Workforce Agencies (SWAs). BLS funds the survey and provides the procedures and technical support, while the State Workforce Agencies collect most of the data. OES estimates are constructed from a sample of about 1.2 million establishments. Each year, forms are mailed to two semiannual panels of approximately 200,000 sampled establishments, one panel in May and the other in November. May 2014 estimates are based on responses from six semiannu-al panels collected over a 3-year period: May 2014, November 2013, May 2013, November 2012, May 2012, and November 2011. The overall national response rate for the six panels is 74.3 percent based on establishments and 70.5 percent based on weighted sampled employment. The unweighted employment of sampled establishments across all six semiannual panels represents approximately 57.1 percent of total national employment. (Response rates are slightly lower for these estimates due to the federal shutdown in October 2013.)
The occupational coding system
The OES survey categorizes workers into 821 detailed occupations based on the Office of Management and Budget’s 2010 Standard Occupational Classification (SOC) system. Together, these detailed occupations make up 22 of the 23 SOC major occupational groups. Major group 55, Military Specific Occupations, is not included.
For more information about the SOC system, please see the BLS website at www.bls.gov/soc/.
The industry coding system
The May 2014 OES estimates use the 2012 North American Industry Classification System (NAICS). For more information about NAICS, see the BLS website at www.bls.gov/bls/naics.htm.
The OES survey excludes the majority of the agricul-tural sector, with the exception of logging (NAICS 113310), support activities for crop production (NAICS 1151), and support activities for animal pro-duction (NAICS 1152). Private households (NAICS 814) also are excluded. OES federal government data include the U.S. Postal Service and the federal execu-tive branch only. All other industries, including state and local government, are covered by the survey.
Survey sample
The OES survey draws its sample from state unem-ployment insurance (UI) files. Supplemental sources are used for rail transportation (NAICS 4821) and Guam because they do not report to the UI program. The OES survey sample is stratified by metropolitan and nonmetropolitan area, industry, and size.
To provide the most occupational coverage, larger employers are more likely to be selected than smaller employers. A census is taken of the executive branch of the federal government, the U.S. Postal Service, and state government.
Appendix - Page 2
Back to Table of Contents
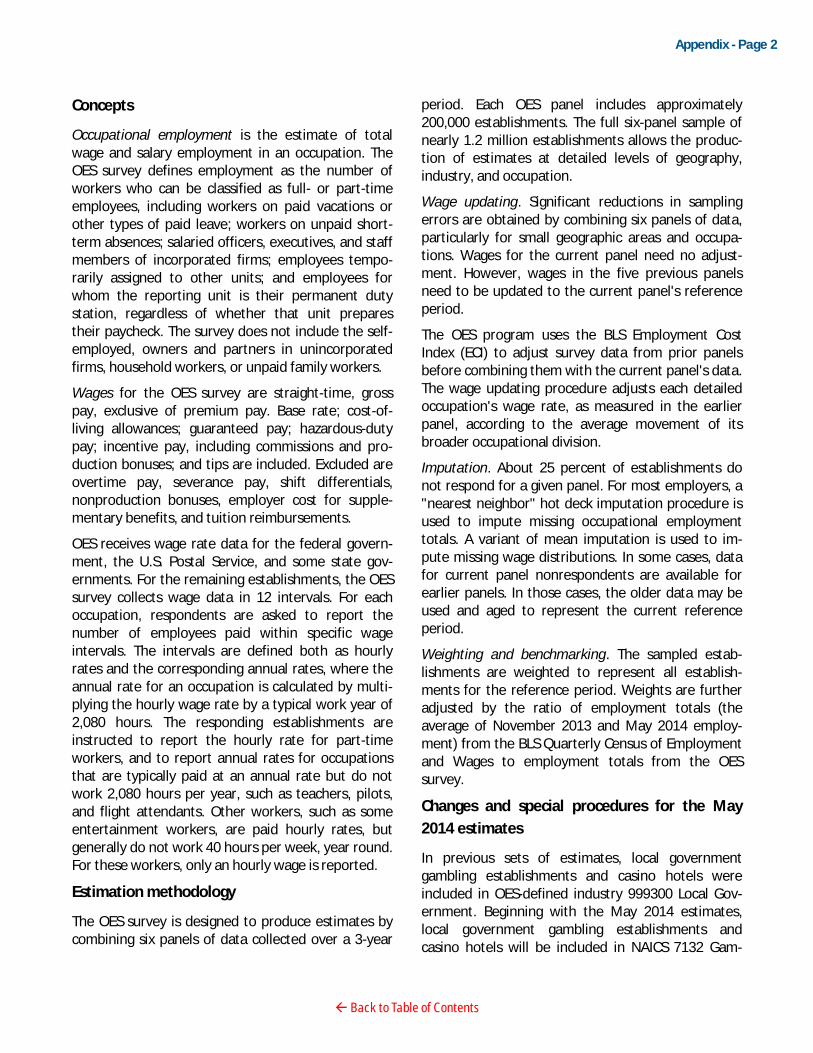
Concepts
Occupational employment is the estimate of total wage and salary employment in an occupation. The OES survey defines employment as the number of workers who can be classified as full- or part-time employees, including workers on paid vacations or other types of paid leave; workers on unpaid short-term absences; salaried officers, executives, and staff members of incorporated firms; employees tempo-rarily assigned to other units; and employees for whom the reporting unit is their permanent duty station, regardless of whether that unit prepares their paycheck. The survey does not include the self-employed, owners and partners in unincorporated firms, household workers, or unpaid family workers.
Wages for the OES survey are straight-time, gross pay, exclusive of premium pay. Base rate; cost-of-living allowances; guaranteed pay; hazardous-duty pay; incentive pay, including commissions and pro-duction bonuses; and tips are included. Excluded are overtime pay, severance pay, shift differentials, nonproduction bonuses, employer cost for supple-mentary benefits, and tuition reimbursements.
OES receives wage rate data for the federal govern-ment, the U.S. Postal Service, and some state gov-ernments. For the remaining establishments, the OES survey collects wage data in 12 intervals. For each occupation, respondents are asked to report the number of employees paid within specific wage intervals. The intervals are defined both as hourly rates and the corresponding annual rates, where the annual rate for an occupation is calculated by multi-plying the hourly wage rate by a typical work year of 2,080 hours. The responding establishments are instructed to report the hourly rate for part-time workers, and to report annual rates for occupations that are typically paid at an annual rate but do not work 2,080 hours per year, such as teachers, pilots, and flight attendants. Other workers, such as some entertainment workers, are paid hourly rates, but generally do not work 40 hours per week, year round. For these workers, only an hourly wage is reported.
Estimation methodology
The OES survey is designed to produce estimates by combining six panels of data collected over a 3-year
period. Each OES panel includes approximately 200,000 establishments. The full six-panel sample of nearly 1.2 million establishments allows the produc-tion of estimates at detailed levels of geography, industry, and occupation.
Wage updating. Significant reductions in sampling errors are obtained by combining six panels of data, particularly for small geographic areas and occupa-tions. Wages for the current panel need no adjust-ment. However, wages in the five previous panels need to be updated to the current panel's reference period.
The OES program uses the BLS Employment Cost Index (ECI) to adjust survey data from prior panels before combining them with the current panel's data. The wage updating procedure adjusts each detailed occupation's wage rate, as measured in the earlier panel, according to the average movement of its broader occupational division.
Imputation. About 25 percent of establishments do not respond for a given panel. For most employers, a "nearest neighbor" hot deck imputation procedure is used to impute missing occupational employment totals. A variant of mean imputation is used to im-pute missing wage distributions. In some cases, data for current panel nonrespondents are available for earlier panels. In those cases, the older data may be used and aged to represent the current reference period.
Weighting and benchmarking. The sampled estab-lishments are weighted to represent all establish-ments for the reference period. Weights are further adjusted by the ratio of employment totals (the average of November 2013 and May 2014 employ-ment) from the BLS Quarterly Census of Employment and Wages to employment totals from the OES survey.
Changes and special procedures for the May 2014 estimates
In previous sets of estimates, local government gambling establishments and casino hotels were included in OES-defined industry 999300 Local Gov-ernment. Beginning with the May 2014 estimates, local government gambling establishments and casino hotels will be included in NAICS 7132 Gam-
Appendix - Page 3
Back to Table of Contents
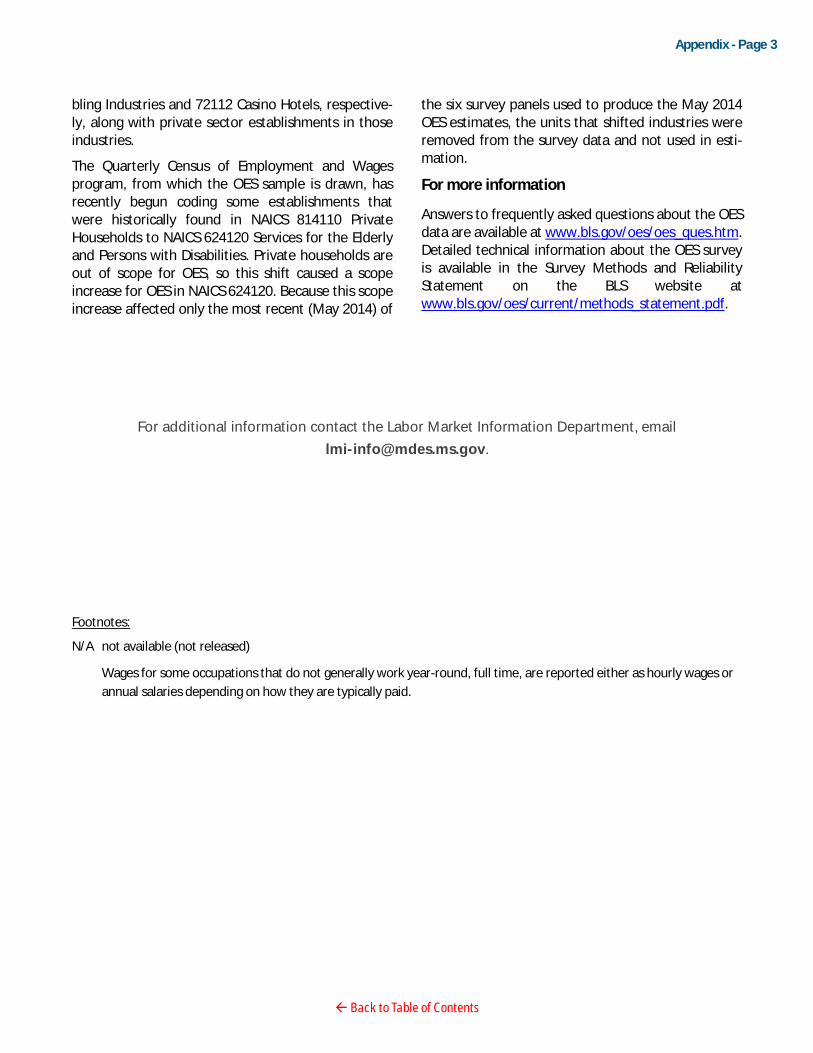
bling Industries and 72112 Casino Hotels, respective-ly, along with private sector establishments in those industries.
The Quarterly Census of Employment and Wages program, from which the OES sample is drawn, has recently begun coding some establishments that were historically found in NAICS 814110 Private Households to NAICS 624120 Services for the Elderly and Persons with Disabilities. Private households are out of scope for OES, so this shift caused a scope increase for OES in NAICS 624120. Because this scope increase affected only the most recent (May 2014) of
the six survey panels used to produce the May 2014 OES estimates, the units that shifted industries were removed from the survey data and not used in esti-mation.
For more information
Answers to frequently asked questions about the OES data are available at www.bls.gov/oes/oes_ques.htm. Detailed technical information about the OES survey is available in the Survey Methods and Reliability Statement on the BLS website at www.bls.gov/oes/current/methods_statement.pdf.
For additional information contact the Labor Market Information Department, email [email protected].
Footnotes:
N/A not available (not released)
Wages for some occupations that do not generally work year-round, full time, are reported either as hourly wages or annual salaries depending on how they are typically paid.