The state of large woody debris in western New York: Implications for stream restoration in the...
52
The State of Large Woody Debris in Western New York: Implications for Stream Restoration in the Niagara Subbasin By Matthew T. Allen A project submitted to the Department of Geography State University of New York at Buffalo In partial fulfillment of the requirements for the degree of Master of Arts May 2015
Transcript of The state of large woody debris in western New York: Implications for stream restoration in the...

The State of Large Woody Debris in Western New York:
Implications for Stream Restoration
in the Niagara Subbasin
By Matthew T. Allen
A project submitted to the
Department of Geography
State University of New York at Buffalo
In partial fulfillment of the requirements for the degree of
Master of Arts
May 2015

i
TABLE OF CONTENTS
List of Figures ..............................................................................................................................ii
List of Tables ...............................................................................................................................iii
Abstract ........................................................................................................................................iv
Introduction ..................................................................................................................................1
Background & Significance .........................................................................................................4
Study Area ...................................................................................................................................5
Methods........................................................................................................................................16
Results ..........................................................................................................................................18
Discussion ....................................................................................................................................33
Conclusion ...................................................................................................................................37
References ....................................................................................................................................40
Appendix: Field photographs .......................................................................................................43

ii
LIST OF FIGURES
1. Figure 1. Geomorphic influences of LWD (Wild Trout Trust, 2012) ....................................2
2. Figure 2. Map of the Niagara Subbasin and watersheds ......................................................6
3. Figure 3. Ecoregions of western New York (Buffalo Niagara Riverkeeper, 2014) ...............7
4. Figure 4. The Ellicott Creek Watershed (HUC 0412010404) ...............................................11
5. Figure 5. Map of Field Study Site 1, Reach 1 ........................................................................13
6. Figure 6. Map of Field Study Site 1, Reach 2 ........................................................................13
7. Figure 7. The Murder Creek Watershed (HUC 0412010402) ...............................................14
8. Figure 8. Map of Field Study Site 2 .......................................................................................16
9. Figure 9. Map of forested LWD recruitment zones, Niagara River Watershed ....................19
10. Figure 10. Map of forested LWD recruitment zones, Lower Tonawanda Watershed ...........20
11. Figure 11. Map of forested LWD recruitment zones, Ellicott Creek Watershed ....................21
12. Figure 12. Map of forested LWD recruitment zones, Middle Tonawanda Creek Watershed 22
13. Figure 12. Map of forested LWD recruitment zones, Murder Creek Watershed....................23
14. Figure 14. Map of forested LWD recruitment zones, Upper Tonawanda Creek Watershed. 24
15. Figure 15. Map of forested LWD recruitment zone density for the Niagara Subbasin..........27
16. Figure 16. Box plots for lengths and diameters of in-stream LWD at Field Study Site 1 ......29
17. Figure 17. Scatter plot of length and diameter of in-stream LWD at Field Study Site 1 .......29
18. Figure 18. Box plots for lengths and diameters of in-stream LWD at Field Study Site 2 ......31
19. Figure 19. Scatter plot of length and diameter of in-stream LWD at Field Study Site 2 .......31
20. Figure 20. Downstream view of large wood jam “MC1” at Field Study Site 2 ....................32
21. Figure 21. Right bank view of large wood jam “MC2” at Field Study Site 2 .......................33

iii
LIST OF TABLES
Table 1. Aquatic habitat viability rating explanation (Buffalo Niagara Riverkeeper, 2014) ......9
Table 2. Watershed aquatic habitat viability ratings (Buffalo Niagara Riverkeeper, 2014) ......9
Table 3. Watershed statistics for the Niagara Subbasin ..............................................................26
Table 4. GIS analysis of LWD recruitment zones in the Niagara Subbasin ................................26
Table 5. Large wood jams at Field Study Site 1 ..........................................................................30
Table 6. Large wood jams at Field Study Site 2 ..........................................................................32
iv
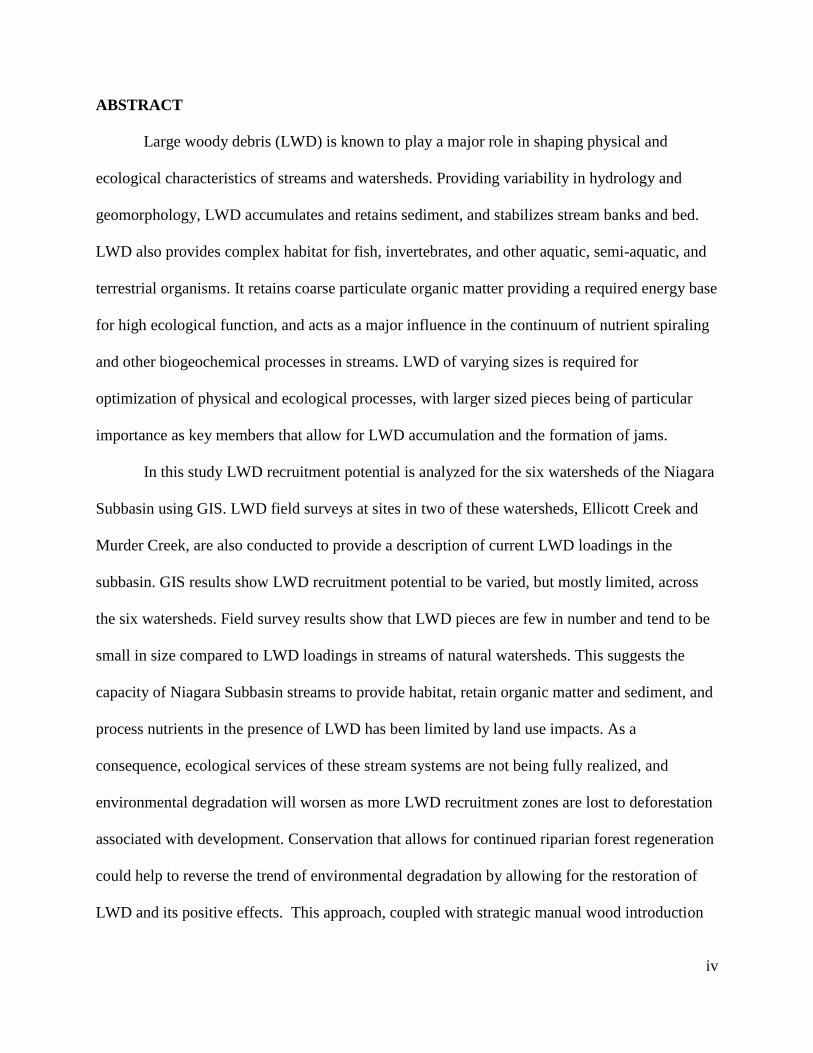
ABSTRACT
Large woody debris (LWD) is known to play a major role in shaping physical and
ecological characteristics of streams and watersheds. Providing variability in hydrology and
geomorphology, LWD accumulates and retains sediment, and stabilizes stream banks and bed.
LWD also provides complex habitat for fish, invertebrates, and other aquatic, semi-aquatic, and
terrestrial organisms. It retains coarse particulate organic matter providing a required energy base
for high ecological function, and acts as a major influence in the continuum of nutrient spiraling
and other biogeochemical processes in streams. LWD of varying sizes is required for
optimization of physical and ecological processes, with larger sized pieces being of particular
importance as key members that allow for LWD accumulation and the formation of jams.
In this study LWD recruitment potential is analyzed for the six watersheds of the Niagara
Subbasin using GIS. LWD field surveys at sites in two of these watersheds, Ellicott Creek and
Murder Creek, are also conducted to provide a description of current LWD loadings in the
subbasin. GIS results show LWD recruitment potential to be varied, but mostly limited, across
the six watersheds. Field survey results show that LWD pieces are few in number and tend to be
small in size compared to LWD loadings in streams of natural watersheds. This suggests the
capacity of Niagara Subbasin streams to provide habitat, retain organic matter and sediment, and
process nutrients in the presence of LWD has been limited by land use impacts. As a
consequence, ecological services of these stream systems are not being fully realized, and
environmental degradation will worsen as more LWD recruitment zones are lost to deforestation
associated with development. Conservation that allows for continued riparian forest regeneration
could help to reverse the trend of environmental degradation by allowing for the restoration of
LWD and its positive effects. This approach, coupled with strategic manual wood introduction

v
in areas of the subbasin where LWD recruitment zone conservation opportunities are lacking,
would likely be an effective strategy for watershed-scale stream restoration in the Niagara
Subbasin.

1
INTRODUCTION
Large woody debris (LWD) has long been recognized as having an important influence
on geomorphic and ecologic processes in stream channels and watersheds of all orders and
gradients (Costigan and Daniels, 2013). LWD acts as an important structural element in aquatic
habitats that supports high levels of abundance and diversity of fish and invertebrates by
providing cover and increasing habitat complexity (Kail et al., 2007; Latterell and Naiman, 2007;
Magilligan et al., 2008; Lassertte and Kondolf, 2012; Costigan and Daniels, 2013). It also allows
for the accumulation and storing of coarse organic matter (twigs and leaves), which serves as a
vital ecological energy base and enhances biogeochemical cycling of nutrients and other
constituents in watershed ecosystems (Magilligan et al., 2008; Kasparak et al., 2012; Costigan
and Daniels, 2013). Geomorphically, LWD influences pool formation, frequency, and type, and
is known to increase sediment storage and sorting, flow resistance, and longitudinal variation of
channel depth and width, as well as bank stabilization and the creation of bars (Tecle et al., 2001;
Daniels, 2006; Magilligan et al., 2008; Kasprak et al., 2012; Costigan and Daniels, 2013; Figure
1). Furthermore, by directing flow into the streambed LWD, can increase hyporheic exchange,
which is known to enhance water quality (Sawyer and Cardenas, 2012; Wagenhoff and Olsen,
2014).
Clustering of LWD into jams influences stream hydrology and channel pattern more than
individual wood pieces (Keller and Swanson, 1979). Key members are those pieces of LWD that
are of sufficient size to anchor jams and are crucial to jam development (Costigan and Daniels,
2013). Jams can initiate lateral channel migration by increasing the elevation of streambed and
water surface (Latterell and Naiman, 2007). The presence and frequency of jams is thought to be

2
an indicator of wood transport capacity, with high frequency and density of jams suggesting a
lower wood transport capacity (Costigan and Daniels, 2013).
Figure 1. Geomorphic influences of LWD (Wild Trout Trust, 2012). Depending on the
orientation of LWD, pools, riffles, and bars of different morphologies are created, increasing
complexity of habitat.
LWD loadings in low-gradient watersheds are recruited primarily through bank erosion
and blow down of whole trees or branches, and are cycled throughout the channel and the
floodplain over time and space (Tecle et al., 2001; Latterell and Naiman, 2007). LWD
accumulations and jams can be deposited on the floodplain through flooding events or
abandoned through lateral channel migration. Both floodplain inundation and lateral channel
migration are promoted by LWD accumulations and jams, and when floodwaters or the
meandering channel eventually return, remnants can re-enter a stream and contribute to new
LWD accumulations (Latterell and Naiman, 2007). Furthermore, LWD remnants can remain
situated in the floodplain for decades and provide habitat for a variety of terrestrial organisms
(Latterell and Naiman, 2007). Those remnants remaining stable over long time periods may

3
represent a sizable carbon reservoir (Guyette et al., 2002) and aid in replenishing supplies of new
key members by protecting developing riparian forests from erosion long enough for trees to
grow large (Montgomery and Abbe, 2006; Latterell and Naiman, 2007).
The primary objective of this study seeks to assess the state of LWD in western New
York, an area with a long history of deforestation associated with land use (Wang et al., 2010;
Buffalo Niagara Riverkeeper, 2014), which could inform planning and decision-making for
watershed-scale stream restoration. GIS analysis will be employed to quantify existing LWD
recruitment potential in the Niagara Subbasin, and field surveys of two representative sites will
be conducted to describe current in-stream loadings of LWD.
The streams of the Niagara Subbasin flow through landscapes that are typical of the
region in that they have been mostly cleared of forests that once dominated (Buffalo Niagara
Riverkeeper, 2014). Today, a mix of land use (commercial, residential, and agricultural
development, and road and highway infrastructure) and land cover (forests, fields, lawns,
shrubland, and impervious surfaces) can be found. These streams are also typical of the region in
that many have been directly altered by humans through channelization and hardening of banks
(Buffalo Niagara Riverkeeper, 2014). Based on the observation that deforestation and stream
alteration have been rampant, the following questions will be addressed in this study, and will be
used to guide data collection and analysis: (I) what is the current state of LWD recruitment
potential across the Niagara Subbasin, (II) what is the current state of in-stream wood loadings in
the Niagara Subbasin an how do they compare to those reported of other regions of the U.S.
where deforestation has occurred, and (III) what is the current state of large wood jam frequency
and type in the Niagara Subbasin?

4
BACKGROUND & SIGNIFICANCE
Fluvial structures and dynamics have been severely altered on a global scale by
widespread land use changes and direct stream channel modifications (Latterell and Naiman,
2007, Costigan and Daniels, 2012). Accumulations of LWD have been directly removed from
stream channels to improve navigation, protect bridges and other infrastructure, recover
marketable timber, and eliminate perceived barriers to fish migration (Latterell and Naiman,
2007; Kasprak et al., 2012; Lassertte and Kondolf, 2012). Furthermore, recruitment of LWD is
limited by deforestation and restriction of lateral channel migration. First and second order
streams are often more directly impacted than higher-order streams by land use activities such as
logging, site preparation, and road construction. In spite of this, land use policies and
management activities have historically paid little attention to low order streams (Tecle et al.,
2001). Anthropogenic impacts on LWD recruitment have resulted in reduced ecological function
and habitat simplification, as well as the destabilization of fluvial systems (Latterell and Naiman,
2007; Costigan and Daniels, 2013). Compounding the problem is the fact that full recovery of
processes that allow for LWD recruitment can lag forest regeneration by centuries (Magilligan et
al., 2008).
In western New York, as in much of the northeastern U.S., widespread deforestation took
place as the land was settled and forests were cleared for agricultural development (Wang et al.,
2009). A drastic decrease in area of land actively used for agriculture began near the turn of the
20th century due to urbanization and the opening of the Great Plains (Wang et al., 2009).
Extensive land survey records from the late 1700s to the early 1900s provide a representation of
the composition of the undisturbed forests of the region as they existed prior to significant
settlement.

5
Comparisons of early accounts with contemporary forest composition surveys and lake
sediment pollen analysis show that anthropogenic disturbance of forests has resulted in
fragmentation, decrease in abundance of late-successional species, and increase in abundance of
early-successional species (Wang et al., 2010). These comparisons have also shown that, despite
regional natural reforestation, forests are not yet returning to their pre-settlement composition,
and the forests of western New York today are largely a patchwork of young regrowth stands
(Wang et al., 2010). This type of forest composition severely limits the recruitment of LWD,
especially key members. As the regeneration of forests back to a mature state has been slow in
western New York, so will the regeneration of LWD loadings and their associated physical and
ecological benefits for local watersheds. Considering this, it is imperative that forested LWD
recruitment zones that currently exist be conserved and protected.
STUDY AREA
The study area was defined based on the U.S. Geological Survey Hydrologic Unit Code
(HUC) system. The HUC system defines the boundaries of watersheds in the U.S. as a hierarchy
based on drainage area from large to small as follows: Region (HUC-2), Subregion (HUC-4),
Basin (HUC-6), Subbasin (HUC-8), Watershed (HUC-10), and Subwatershed (HUC-12). The
watersheds of the Niagara Subbasin are part of the Eastern Lake Erie Basin (HUC 041201) and
the larger Eastern Lake Erie-Lake Erie Subregion (HUC 0412) and Great Lakes Region (HUC
04). The latter holds about 20% of the world’s available freshwater. Through the Eastern Lake
Erie Basin waters from Lake Erie, Lake Huron, Lake Michigan, and Lake Superior flow towards
Lake Ontario and the St. Lawrence River to the north at an average rate of approximately 6,000
m3/s at Buffalo (Buffalo Niagara Riverkeeper, 2014).

6
The study area for GIS analysis of LWD recruitment potential was defined as the six
watersheds of the 2,066.5 km2 Niagara Subbasin (HUC 04120104; Figure 2). The six watersheds
are Niagara River (HUC 0412010406), Lower Tonawanda Creek (HUC 0412010405), Ellicott
Creek (0412010404), Middle Tonawanda Creek (0412010403), Murder Creek (0412010402),
and Upper Tonawanda Creek (0412010401). The watersheds of the Niagara Subbasin drain lands
within the western New York counties of Erie, Niagara, Genesee, and Wyoming through
3,041.03 km of streams.
Figure 2. Map of the Niagara Subbasin and watersheds. The subbasin has a total
drainage area of 2,066.5 km2 and a total stream length of 3,041.02 km.
7
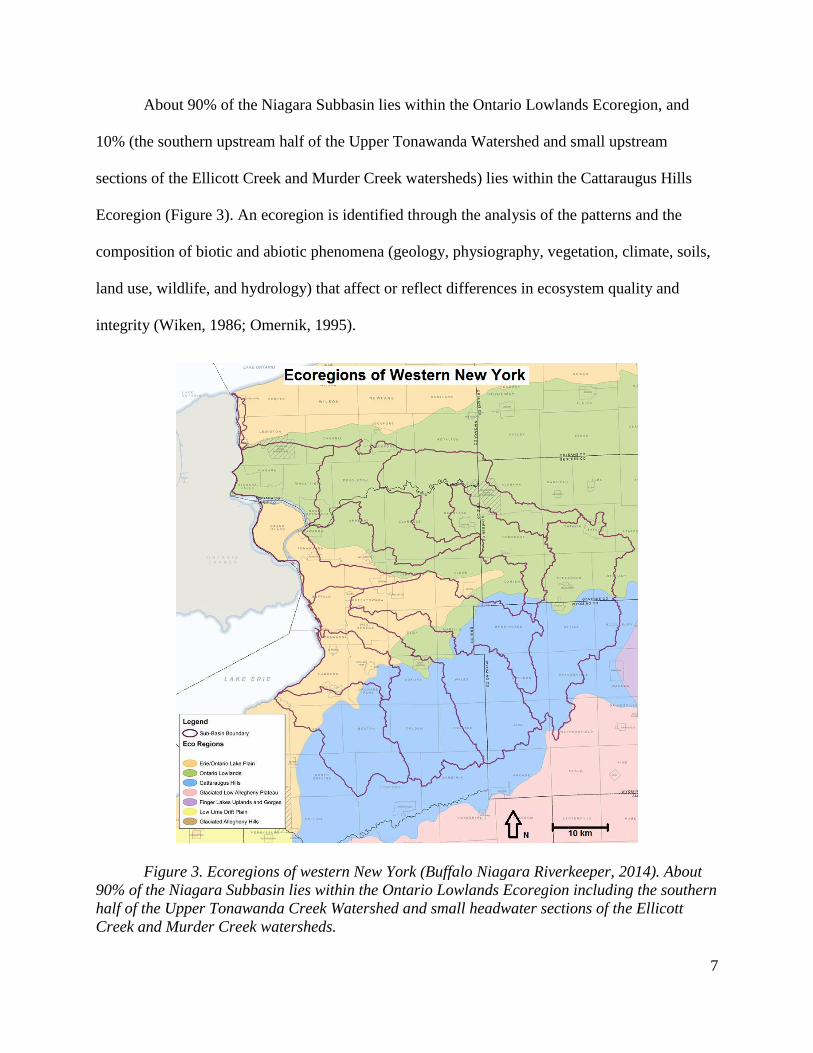
About 90% of the Niagara Subbasin lies within the Ontario Lowlands Ecoregion, and
10% (the southern upstream half of the Upper Tonawanda Watershed and small upstream
sections of the Ellicott Creek and Murder Creek watersheds) lies within the Cattaraugus Hills
Ecoregion (Figure 3). An ecoregion is identified through the analysis of the patterns and the
composition of biotic and abiotic phenomena (geology, physiography, vegetation, climate, soils,
land use, wildlife, and hydrology) that affect or reflect differences in ecosystem quality and
integrity (Wiken, 1986; Omernik, 1995).
Figure 3. Ecoregions of western New York (Buffalo Niagara Riverkeeper, 2014). About
90% of the Niagara Subbasin lies within the Ontario Lowlands Ecoregion including the southern
half of the Upper Tonawanda Creek Watershed and small headwater sections of the Ellicott
Creek and Murder Creek watersheds.

8
The Ontario Lowland Ecoregion is characterized by low-lying wetland complexes,
glacial lake plains, grasslands, and kettle topography. Streams have low gradients, and they drain
into the Niagara River (Buffalo Niagara Riverkeeper, 2014). The Cattaraugus Hills Ecoregion is
characterized by dissected plateau, rolling hills, and plateau toe slope topography. Streams have
low gradients and, in some cases, are spring-fed and support native trout populations (Buffalo
Niagara Riverkeeper, 2014).
Aquatic habitat loss due to anthropogenic impacts has been significant in western New
York. As a result, eight species of fish, 17 species of mollusk, and one species of aquatic
macroinvertebrate are believed to have been extirpated from the region. Of these, three fish
species and four species of mussel have disappeared from western New York waters within the
last 15 years (Buffalo Niagara Riverkeeper, 2014). Recently extirpated fish species include
Blackchin Shiner (Notropis heterodon), Lake Chubsucker (Erimyzon sucetta), and Sauger
(Stizostedion canadense). Recently extirpated mussel species include Black Sandshell (Ligumia
recta), Eastern Pond (Ligumia nasuta), Pocketbook (Lampsilis ovata), and Snuffbox
(Epioblasma triquetra). This trend of decreasing biodiversity signifies major impacts on ecologic
function and illustrates the pressing need for stream restoration in the Niagara Subbasin.
Many of the major threats to western New York waters that contribute to environmental
degradation and habitat and species loss are ones that are known to be ameliorated by LWD.
These include erosion, bank failure, siltation, nutrient runoff, and decreased hyporheic exchange
(Tecle et al., 2001; Daniels, 2006; Magilligan et al., 2008; Kasprak et al., 2012; Costigan and
Daniels, 2013; Buffalo Niagara Riverkeeper, 2014). However, spatial distribution of stream
degradation is not uniform across western New York watersheds. Viability assessments of
habitat in the active river area (Smith et al., 2004) for the six watersheds of the Niagara Subbasin

9
range from “good” to “poor-fair,” (Tables 1 and 2) with a decreasing east to west trend (Buffalo
Niagara Riverkeeper, 2014).
RATING CRITERIA
Very Good Ecologically desirable status; requires little intervention for maintenance.
Good Indicator within acceptable range of variation; some intervention required for
maintenance.
Fair Outside acceptable range of variation, requires human intervention.
Poor Restoration increasingly difficult; may result in extirpation of target.
Table 1. Aquatic habitat viability rating explanation (Buffalo Niagara Riverkeeper,
2014). Aquatic habitat ratings for watersheds in the Niagara Subbasin range from “poor-fair”
to “good.”
Table 2. Watershed aquatic habitat viability ratings (Buffalo Niagara Riverkeeper,
2014). Ratings decline from east to west across the subbasin.
In order for LWD restoration efforts to be effective, it is important to know where
recruitment potential exists across the subbasin. Conservation of forested LWD recruitment
zones in watersheds where significant LWD recruitment potential exists might be effective for
enhancing LWD and its physical and ecological influences. For watersheds with aquatic habitat
viability ratings of “poor” or “fair” conservation of LWD recruitment zones would offer
significant potential for restoration. For watersheds with aquatic habitat viability ratings of
“good” conservation of LWD recruitment zones would offer significant potential for protection.
WATERSHED AQUATIC HABITAT
VIABILITY RATING
THREATS
Niagara River Poor - Fair Erosion, bank failure, siltation
Lower Tonawanda Creek Fair Lack of riparian buffers, runoff,
channelization, invasive species
Ellicott Creek Fair Channelization, lack of riparian
buffers, runoff
Middle Tonawanda Creek Fair - Good Lack of riparian buffers, runoff
Murder Creek Good Lack of riparian buffers, runoff, failing
septic systems (nutrients)
Upper Tonawanda Creek Good Lack of riparian buffers, agricultural
runoff, barriers to fish movement

10
Such a combined strategy of protection for areas of higher environmental quality and restoration
for environmentally degraded areas is a preferred approach for improving natural systems
experiencing anthropogenic impacts (Buffalo Niagara Riverkeeper, 2014).
For watersheds where significant LWD recruitment potential does not exist, conservation
may not be effective for restoration, and other approaches, such as manual wood introduction,
might be more appropriate. Because of the importance of riparian zones for stream health,
conserving existing forested LWD recruitment zones would be of critical importance no matter
where they are located in the subbasin and regardless of whether they combine to represent
significant LWD recruitment potential for a watershed.
In order to describe current wood loadings in the subbasin and reveal the in-stream
signature of existing LWD recruitment, two sites, one on Ellicott Creek and one on Murder
Creek, were chosen for field surveys of in-stream LWD. These sites were chosen because their
wood loadings could be considered representative of the larger system. They can be considered
representative because these sites are located well within the boundaries of the subbasin, their
upstream environs are typical of the region in that they are areas of mixed land cover and land
use and have a low gradient, and they are not located directly downstream of any dams, weirs,
waterfalls, or other situations that might have a significant local impact on wood loadings. They
were also selected for their accessibility and wadeability.
Field Study Site 1 of the in-stream LWD survey is located at Ellicott Creek. Ellicott
Creek is a 72 km-long tributary of Tonawanda Creek that drains an area of 310.93 km² and has
an estimated annual median flow of 30.5 m³/s near its mouth (URS et al., 2005). Ellicott Creek is
sourced in Genesee County near the town of Darien, New York and flows west and northwest
into Erie County and through suburban Buffalo, emptying into Tonawanda Creek near the

11
Niagara River (Figure 4). Upper reaches of Ellicott Creek flow through areas of low to moderate
development, while lower reaches flow through highly developed areas. A stream gage operated
by the U.S. Geological Survey (USGS 04218518, Ellicott Creek near Williamsville, NY) has
provided a continuous record of stage and discharge for Ellicott Creek since 1973. The gage is
located about 10 km downstream from study site 1 at the Sheridan Road crossing near
Williamsville, New York.
Figure 4. The Ellicott Creek Watershed (HUC 0412010404). The watershed extends
across the central area of the Niagara Subbasin. In-stream LWD for Ellicott Creek was surveyed
at a site in the middle part of the watershed near Bowmansville, New York.
12
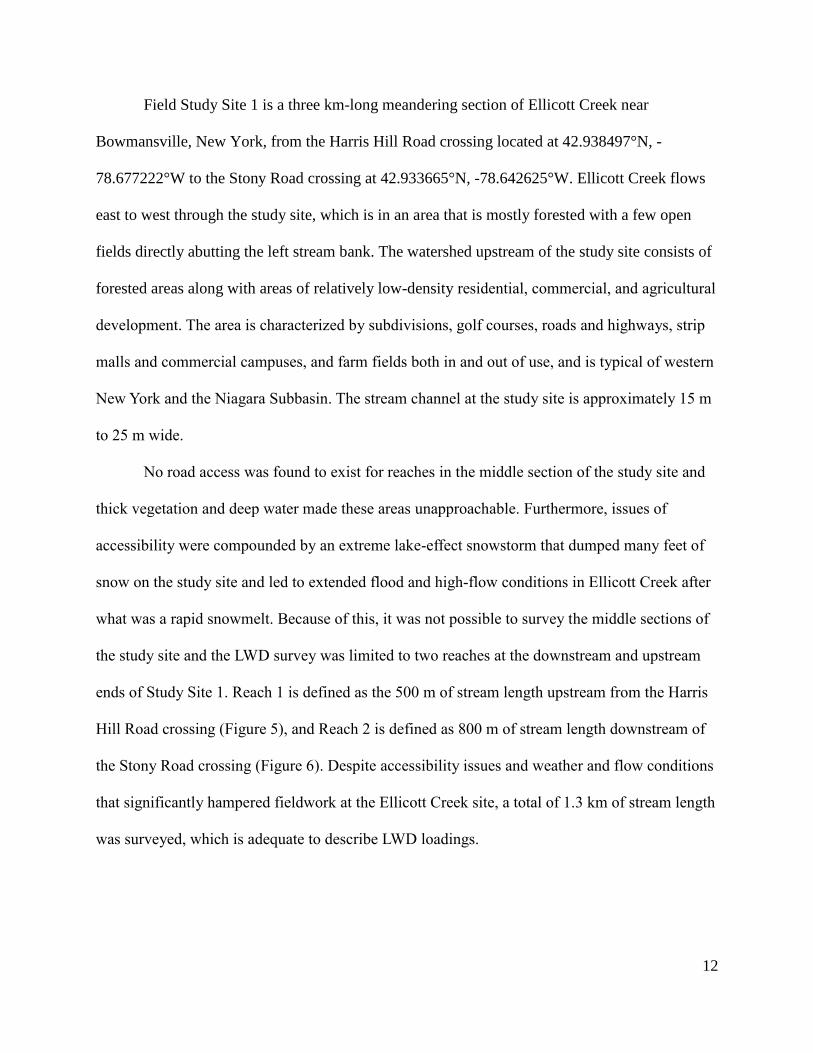
Field Study Site 1 is a three km-long meandering section of Ellicott Creek near
Bowmansville, New York, from the Harris Hill Road crossing located at 42.938497°N, -
78.677222°W to the Stony Road crossing at 42.933665°N, -78.642625°W. Ellicott Creek flows
east to west through the study site, which is in an area that is mostly forested with a few open
fields directly abutting the left stream bank. The watershed upstream of the study site consists of
forested areas along with areas of relatively low-density residential, commercial, and agricultural
development. The area is characterized by subdivisions, golf courses, roads and highways, strip
malls and commercial campuses, and farm fields both in and out of use, and is typical of western
New York and the Niagara Subbasin. The stream channel at the study site is approximately 15 m
to 25 m wide.
No road access was found to exist for reaches in the middle section of the study site and
thick vegetation and deep water made these areas unapproachable. Furthermore, issues of
accessibility were compounded by an extreme lake-effect snowstorm that dumped many feet of
snow on the study site and led to extended flood and high-flow conditions in Ellicott Creek after
what was a rapid snowmelt. Because of this, it was not possible to survey the middle sections of
the study site and the LWD survey was limited to two reaches at the downstream and upstream
ends of Study Site 1. Reach 1 is defined as the 500 m of stream length upstream from the Harris
Hill Road crossing (Figure 5), and Reach 2 is defined as 800 m of stream length downstream of
the Stony Road crossing (Figure 6). Despite accessibility issues and weather and flow conditions
that significantly hampered fieldwork at the Ellicott Creek site, a total of 1.3 km of stream length
was surveyed, which is adequate to describe LWD loadings.

13
Figure 5. Map of Field Study Site 1, Reach 1. Reach 1 is a 0.50 km-long section of
Ellicott Creek east of Harris Hill Road near Bowmansville, New York. Three large wood jams
(EC1, EC2, EC3) were found in reach 1.
Figure 6. Map of Field Study Site 1, Reach 2. Reach 2 is a 0.80 km-long section of
Ellicott Creek west of Stony Road near Bowmansville, New York. Three large wood jams (EC4,
EC5, EC6) were found in reach 2.

14
Field Study Site 2 of the in-stream LWD survey was located at Murder Creek near Akron,
NY approximately 17.5 km northeast of Field Study Site 1 at Ellicott Creek. Murder Creek is a
tributary of Tonawanda Creek and is the main stream of the 188.8 km 2 Murder Creek Watershed,
which is located in eastern part of the Niagara Subbasin directly to the east of the Ellicott Creek
Watershed (Figure 7).
Figure 7. The Murder Creek Watershed (HUC 0412010402). The watershed is located in
the eastern half of the Niagara Subbasin. In-stream LWD for Murder Creek was surveyed at a
site located in the northern part of the watershed near Akron, New York.

15
Murder Creek has its source in Wyoming County and flows northwest through western
Genesee County and into northeastern Erie County where it passes the town of Akron. Murder
Creek confluences Tonawanda Creek in the Middle Tonawanda Creek Watershed about 8.25 km
north of Akron (Figure 7). A U.S. Geological Survey stream gaging station (USGS 04217750,
Murder Creek near Akron, NY) near the Maple Road crossing located at 43.046851°N, -
78.512718°W has been out of use since 1999.
Within the Murder Creek Watershed are suburban and rural landscapes that include farm
fields both in and out of use, roads and highways, commercial properties, residential
subdivisions, forests, and wetlands (Buffalo Niagara Riverkeeper, 2014). The stream channel in
the study area is approximately 15 to 25 m wide. Depths vary somewhat, but are generally
wadeable.
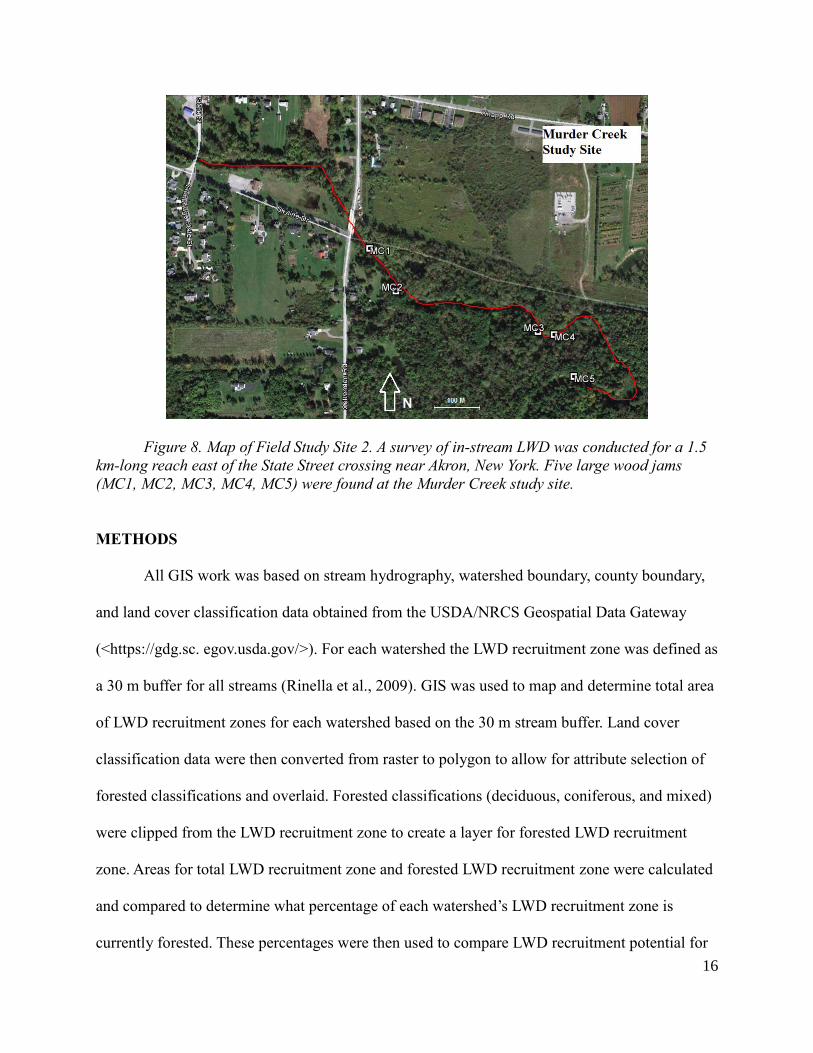
Field Study Site 2 is a 1.5 km reach of Murder Creek originating at the State Street
crossing in Akron Falls Park located at 43.008748°N, -78.481233°W, and terminating at
43.008748 °N, -78.470682°W (Figure 8). Through this area Murder Creek flows northwest
towards its confluence with Tonawanda Creek and the Middle Tonawanda Creek Watershed.
16
Figure 8. Map of Field Study Site 2. A survey of in-stream LWD was conducted for a 1.5
km-long reach east of the State Street crossing near Akron, New York. Five large wood jams
(MC1, MC2, MC3, MC4, MC5) were found at the Murder Creek study site.
METHODS
All GIS work was based on stream hydrography, watershed boundary, county boundary,
and land cover classification data obtained from the USDA/NRCS Geospatial Data Gateway
(<https://gdg.sc. egov.usda.gov/>). For each watershed the LWD recruitment zone was defined as
a 30 m buffer for all streams (Rinella et al., 2009). GIS was used to map and determine total area
of LWD recruitment zones for each watershed based on the 30 m stream buffer. Land cover
classification data were then converted from raster to polygon to allow for attribute selection of
forested classifications and overlaid. Forested classifications (deciduous, coniferous, and mixed)
were clipped from the LWD recruitment zone to create a layer for forested LWD recruitment
zone. Areas for total LWD recruitment zone and forested LWD recruitment zone were calculated
and compared to determine what percentage of each watershed’s LWD recruitment zone is
currently forested. These percentages were then used to compare LWD recruitment potential for

17
each watershed and determine where conservation of forested riparian areas would be most
appropriate and effective as an approach for LWD restoration.
Although mapping forested LWD recruitment zones is appropriate for displaying
inventories and spatial trends at the watershed scale, it is too fine a resolution for the subbasin
scale. For this reason, centroid points for each of 3,028 polygons of forested LWD recruitment
zone produced from the raster to polygon conversion were mapped for a kernel density analysis
that would offer a more appropriate resolution to display spatial trends in LWD recruitment
potential at the subbasin scale.
For the LWD field surveys, pieces of LWD found in the stream channel over 5 cm in
diameter and greater than 30 cm in length were inventoried (Comiti et al., 2006; Costigan and
Daniels, 2013). Each piece was measured for length and mid-length diameter using a measuring
tape. Geographic coordinates of large wood jams were determined using a smart phone GPS
application. Large wood jams were also classified according to Wallerstein and Thorne (2004).
Jams where key members span the width of the stream channel and water flows under or both
over and under the jam were classified as “underflow” jams. Such channel-spanning jams where
water flows over the jam only were classified “dam” jams. Jams where key members do not span
the stream channel and streamflow is directed away from the structure and into the channel or
opposite bank were classified “deflector” jams. Jams where key members are positioned parallel
to streamflow were classified as “parallel” jams. Parallel jams tend to be smaller and less
influential that the other three jam classifications (Wallerstein and Thorne, 2004; Costigan and
Daniels, 2012). Google Earth was used to determine reach lengths and channel width ranges.

18
RESULTS
GIS Analysis
Mapping of forested LWD recruitment zones for each of the six watersheds of the
Niagara Subbasin reveals two major findings. First, amount of forested LWD recruitment zone
varies considerably across watersheds with an east to west decreasing trend. Second, amount of
forested LWD recruitment zone varies considerably within watersheds with an upstream to
downstream decreasing trend in most cases. Presented below are maps of forested LWD
recruitment zone for each of the six watersheds of the Niagara Subbasin (Figures 9 to 14). The
maps also present drainage area (km2), total stream length (km), total LWD recruitment area
(km2), forested LWD recruitment area (km2), and percent forest LWD recruitment area for each
watershed. Captions provide explanation for location of the watershed in the subbasin, aquatic
habitat rating (Buffalo Niagara Riverkeeper, 2014), and relative conservation value.

19
Figure 9. Map of forested LWD recruitment zones, Niagara River Watershed. The
Niagara River Watershed is the western most in Niagara Subbasin and has an aquatic habitat
viability rating of “fair-poor” (Buffalo Niagara Riverkeeper, 2014) and a relative conservation
value of “low.”

20
Figure 10. Map of forested LWD recruitment zones, Lower Tonawanda Watershed. The
Lower Tonawanda Watershed is situated in the western part of the Niagara Subbasin and has an
aquatic habitat viability rating of “fair” (Buffalo Niagara Riverkeeper, 2014) and a relative
conservation value of “fair.”
21
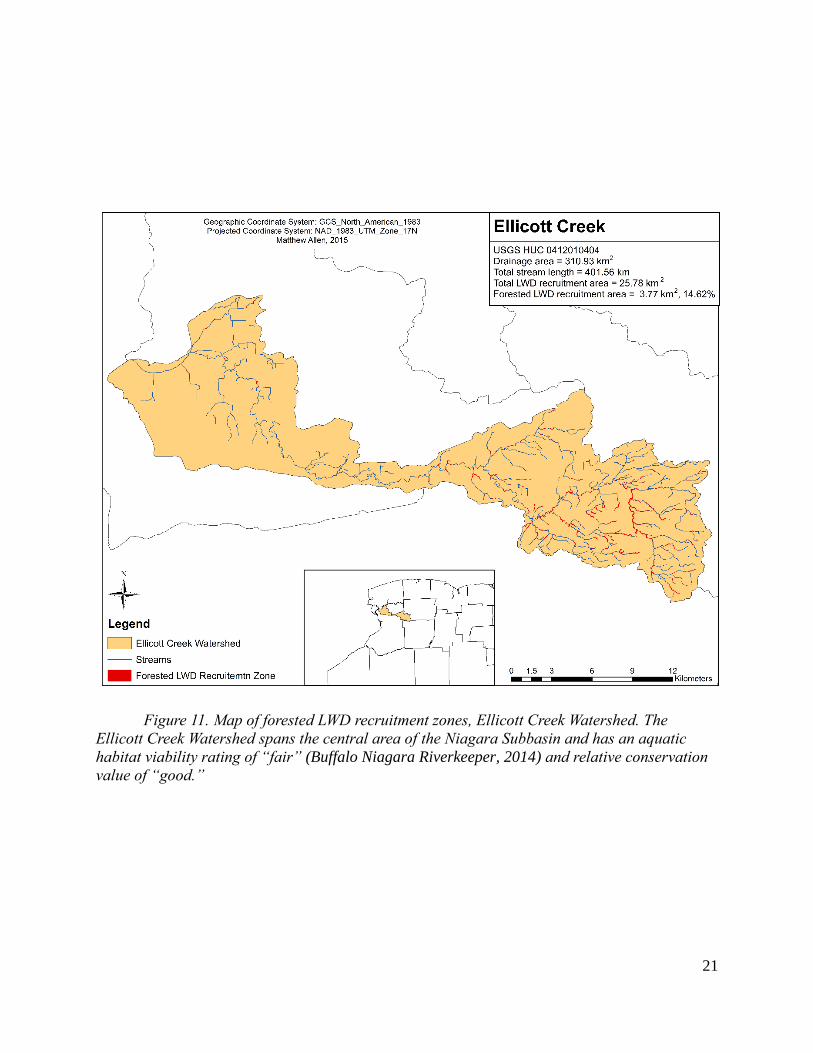
Figure 11. Map of forested LWD recruitment zones, Ellicott Creek Watershed. The
Ellicott Creek Watershed spans the central area of the Niagara Subbasin and has an aquatic
habitat viability rating of “fair” (Buffalo Niagara Riverkeeper, 2014) and relative conservation
value of “good.”

22
Figure 12. Map of forested LWD recruitment zones, Middle Tonawanda Creek Watershed.
The Middle Tonawanda Creek Watershed spans the central area of the Niagara Subbasin and
has an aquatic habitat viability rating of “fair-good” (Buffalo Niagara Riverkeeper, 2014) and a
relative conservation value of “fair.”

23
Figure 12. Map of forested LWD recruitment zones, Murder Creek Watershed. The
Murder Creek Watershed is located in the eastern end of the Niagara Subbasin and has an
aquatic habitat viability rating of “good” (Buffalo Niagara Riverkeeper, 2014) and a relative
conservation value of “fair.”

24
Figure 14. Map of forested LWD recruitment zones, Upper Tonawanda Creek Watershed.
The Upper Tonawanda Creek Watershed is the easternmost of the Niagara Subbasin and has an
aquatic habitat viability rating of “good” (Buffalo Niagara Riverkeeper, 2014) and a relative
conservation value of “high.”

25
Analysis of LWD recruitment zone buffers and forested land cover polygons reveals the
Niagara Subbasin to have a total LWD recruitment zone of 195.02 km2, of which 32.64 km2, or
16.74%, is forested. Total and forested LWD recruitment zone areas were also determined for
each watershed, as well as percent forested LWD recruitment zone (Table 4).
Interquartile range of percent forested LWD recruitment zone values was calculated. The
first quartile was 9.21%, the second quartile (median) was 14.06%, and the third quartile was
17.79%. To create ordinal data for watersheds based on LWD recruitment potential, a relative
conservation value was determined based on the quartile into which each watershed’s percent
forested LWD recruitment zone value fell. Watersheds whose percent forested LWD recruitment
zone value fell into the first quartile (0.0 to 9.21%) were assigned a relative conservation value
of “low.” Watersheds whose percent forested LWD recruitment zone value fell into the second
quartile (9.21 to 14.06%) were assigned a relative conservation value of “fair.” Watersheds
whose percent forested LWD recruitment zone value fell into the third quartile (14.06 to 17.79%)
were assigned a relative conservation value of “good.” Watersheds whose percent forested LWD
recruitment zone value fell into the fourth quartile (17.79 to 27.31%) were assigned a relative
conservation value of “high” (Table 4).
ID Watershed HUC-10 code Drainage area
(km2)
Total stream length
(km)
1 Upper Tonawanda Creek 0412010401 514.97 972.98
2 Murder Creek 0412010402 188.88 364.31
3 Middle Tonawanda Creek 0412010403 320.10 594.42
4 Ellicott Creek 0412010404 310.93 401.56
5 Lower Tonawanda Creek 0412010405 318.88 361.04
6 Niagara River 0412010406 412.74 446.72
Table 3. Watershed statistics for the Niagara Subbasin. HUC-10 code, drainage area,
and total stream length are shown for each of the six watersheds. Drainage areas display no
trend. Excepting the Murder Creek Watershed, total stream length decreases from east to west.

26
ID Watershed Total area
(km2)
Forested area
(km2)
% Forested RCV
1 Upper Tonawanda Creek 62.53 17.08 27.31 High
2 Murder Creek 33.89 2.90 12.14 Fair
3 Middle Tonawanda Creek 38.02 5.08 13.36 Fair
4 Ellicott Creek 25.78 3.77 14.62 Moderate
5 Lower Tonawanda Creek 22.91 2.28 9.95 Fair
6 Niagara River 21.89 1.53 6.99 Low
Table 4. GIS analysis of LWD recruitment zones in the Niagara Subbasin. Total LWD
recruitment zone area in km2 (“Total area”), total forested LWD recruitment zone area in km2
(“Forested area”), percent forested recruitment zone (“% Forested”), and relative conservation
value (“RCV”) are shown for each of the six watersheds. Percent forested LWD recruitment zone
and relative conservation value follow the same east to west decreasing trend as aquatic habitat
viability rating (Table 2) and forested LWD recruitment zone density (Figure 15).
The mapping of forested LWD recruitment zones is effective for displaying spatial trends
at the watershed scale (Figures 9 to 14). However, it is not sufficient for displaying spatial trends
at the subbasin scale because in the resulting map forested LWD recruitment zone polygons
appear as small scattered points. In order to reveal spatial trends of LWD recruitment potential at
the subbasin scale, kernel density analysis was employed.
For each of 3,028 polygons of forested LWD recruitment zone produced from the
conversion of raster land cover data to polygon, centroid points where determined and mapped.
Kernel density analysis was then performed for the centroid points. Kernel density mapping
displays descending values from a point to a given radius. The result is a smooth representation
of point locations that clearly communicates variations in point density across an area. Although
accuracy decreases when polygons are converted to centroid points because polygons range in
size, the result of kernel density analysis based on centroids is a map that clearly shows spatial
trends of forested LWD recruitment zones in the Niagara Subbasin (Figure 15).

27
Figure 15. Map of forested LWD recruitment zone density for the Niagara Subbasin.
Density analysis reveals a spatial trend of decreasing forested LWD recruitment zone density
from east to west.
The Upper Tonawanda Creek Watershed, Middle Tonawanda Creek Watershed, and
eastern upstream section of the Ellicott Creek Watershed are shown to have the highest density of
forested LWD recruitment zones in the Niagara Subbasin. The Murder Creek Watershed and the
eastern upstream area of the Lower Tonawanda Creek Watershed are revealed to also have
significant, but more moderate, density of forested LWD recruitment zones. The Niagara River
Watershed and the western downstream sections of the Lower Tonawanda Creek and Ellicott
Creek watersheds are revealed to have very low density of forested LWD recruitment zones.

28
Comparison of percent forested LWD recruitment zone for the six watersheds in the
subbasin agrees with the density analysis and shows that the 32.64 km2 forested LWD
recruitment zone is unevenly distributed with an east to west decreasing trend. Percent forested
LWD recruitment zone ranges from 6.99 (Niagara River) to 27.31% (Upper Tonawanda Creek)
with a mean of 14.06% and a standard deviation of 7.03%.
LWD Field Surveys
For Field Study Site 1 at Ellicott Creek, Reach 1 (500 m) and Reach 2 (800 m) combined
for a total of 1.3 km of stream length surveyed. One hundred thirty-four pieces of LWD were
found and measured and six large wood jams were located and classified. Over the course of the
surveyed stream length, there were 10.3 pieces of LWD/100 m.
The mean length of LWD pieces was 425.4 cm, median length was 403.5 cm, and length
range was 1,475 cm with a minimum recorded length of 45 cm and a maximum recorded length
of 1,520 cm. The standard deviation was 217.5 cm. The interquartile range was 178.1 cm, with
310.8 cm as the 25th percentile and 489.0 cm as the 75th percentile (Figure 16).
The mean mid-length diameter of LWD pieces was 14.0 cm, median diameter was 12.4
cm, and diameter range was 38.5 cm with a minimum recorded diameter of 5.5 cm and a
maximum recorded diameter of 44 cm. Standard deviation for diameter was 6.7 cm with 10.1 cm
as the 25th percentile and 16.1 cm as the 75th percentile (Figure 16).

29
Figure 16. Box plots for lengths and diameters of in-stream LWD at Field Study Site 1.
Figure 17. Scatter plot of length and diameter of in-stream LWD at Field Study Site 1.
Most pieces are small and there are few large key members.
0
5
10
15
20
25
30
35
40
45
50
0 200 400 600 800 1000 1200 1400 1600
Dia
met
er (
cm)
Length (cm)

30
Six large wood jams were located and classified (Wallerstein and Thorne, 2004) at Field
Study Site 1, three in each reach, and GPS coordinates were recorded (Table 5). Two of the six
jams are classified as parallel, which tend to be smaller and less influential that the other three
jam classifications (Wallerstein and Thorne, 2004; Costigan and Daniels, 2012). Jam frequency
was found to be 0.5 jams/100 m.
Jam ID Latitude Longitude Classification
EC1 42.939208 -78.674971 Deflector
EC2 42.938792 -78.675551 Deflector
EC3 42.939591 -78.673798 Underflow
EC4 42.932042 -78.643921 Parallel
EC5 42.932700 -78.643548 Dam
EC6 42.933121 -78.644744 Parallel
Table 5. Large wood jams at Field Study Site 1. Locations and classifications based on
Wallerstein and Thorne (2004) for large wood jams found at Field Study Site 1 at Ellicott Creek..
For Field Study Site 2 at Murder Creek, one reach totaling 1.5 km of stream length was
surveyed. One hundred eighty-one pieces of LWD were found and measured and five large wood
jams were located and classified. Over the course of the surveyed stream length there were 12.1
pieces of LWD/100 m.
The mean length of LWD pieces was 400.2 cm, median length was 376.0 cm, and length
range was 1,470 cm with a minimum recorded length of 50 cm and a maximum recorded length
of 1,520 cm. The standard deviation was 229.2 cm. The interquartile range was 293.5 cm, with
236.5 cm as the 25th percentile and 530.0 cm as the 75th percentile (Figure 18).
Mean mid-length diameter of LWD pieces was 15.6 cm, median diameter was 13.2 cm,
and diameter range was 47.5 cm with a minimum recorded diameter of 5.3 cm and a maximum
recorded diameter of 52.8 cm. Standard deviation for diameter was 8.4 cm with 10.3 cm as the
25th percentile and 18.0 cm as the 75th percentile (Figure 18).

31
Figure 18. Box plots for lengths and diameters of in-stream LWD at Field Study Site 2.
Figure 19. Scatter plot of length and diameter of in-stream LWD at Field Study Site 2.
Most pieces are small and there are few large key members.
0
10
20
30
40
50
60
0 200 400 600 800 1000 1200 1400 1600
Dia
met
er (
cm)
Length (cm)

32
Five large wood jams were located and classified (Wallerstein and Thorne, 2004) at Field
Study Site 2 and GPS coordinates were recorded (Table 6). No jams found at Study Site 2 were
classified underflow or dam, and one of the five (MC3) was classified as a parallel jam, which
tend to be smaller and less influential that the other three jam classifications (Wallerstein and
Thorne, 2004; Costigan and Daniels, 2012). Frequency of jams was found to be 0.3 jams/100 m.
Addition field photographs from both study sites can be found in the Appendix.
Jam ID Latitude Longitude Classification
MC1 42.011592 -78.476340 Deflector
MC2 42.010688 -78.475623 Deflector
MC3 42.009765 -78.471604 Parallel
MC4 42.009696 -78.471148 Deflector
MC5 42.008814 -78.470622 Deflector
Table 6. Large wood jams at Field Study Site 2. Locations and classifications based on
Wallerstein and Thorne (2004) for large wood jams found at Field Study Site 2 at Murder Creek.
Figure 20. Downstream view of large wood jam “MC1” at Field Study Site 2. MC1 was
classified a deflector jam.

33
Figure 21. Right bank view of large wood jam “MC2” at Field Study Site 2. MC2 was
classified a deflector jam (Wallerstein and Thorne, 2004).
DISCUSSION
This study sought to describe LWD recruitment potential and current LWD loadings for
the Niagara Subbasin in western New York with the objective of informing watershed-scale
stream restoration. Based on the observation that deforestation and stream alteration have been
rampant in western New York, research questions for this study were (I) what is the current state
of LWD recruitment potential across the Niagara Subbasin, (II) what is the current state of in-
stream wood loadings in the Niagara Subbasin and how do they compare to those reported of
other regions of the U.S. where deforestation has occurred, and (III) what is the current state of
large wood jam frequency and type in the Niagara Subbasin?
GIS analysis of LWD recruitment potential for the six watersheds of the Niagara
Subbasin reveals significant spatial variation, and that although there is minimal LWD
recruitment potential for most of the subbasin, significant LWD recruitment potential does exist

34
in some areas. Much conservation opportunity exists to allow for continued regeneration of
riparian forests and LWD recruitment in in the eastern part of the subbasin, especially in the
Upper Tonawanda Creek, Murder Creek, and Middle Tonawanda watersheds, as well as the
eastern upstream section of the Ellicott Creek Watershed. Because they are less costly, it is
imperative to take advantage of opportunities for passive restoration (Morrison and Lindell,
2011), and conservation of forested LWD recruitment zones in these eastern areas of the Niagara
Subbasin may be very effective and sustainable as a restoration approach. However, some
watersheds were found to have very little forested LWD recruitment zones to protect. These may
be areas where active restoration in the form of manual wood addition would be needed.
Mapping and spatial density analysis of forested LWD recruitment zones revealed an east
to west decreasing trend, from 27.31% forested in the Upper Tonawanda Creek Watershed at the
eastern end of the Niagara Subbasin, to 6.99% forested in the Niagara River Watershed at the
western end. This trend might be spatially and temporally correlated to land use, and slope or
other topographic factors may also be important. It may be that LWD recruitment zones in areas
with more rugged terrain are less likely to be encroached by development, and that forested
LWD recruitment zones in areas with less slope or relief should be targeted for protection as their
locations are more apt for development. These considerations could be taken into account to
target conservation efforts even further.
Field surveys of in-stream LWD at Ellicott Creek and Murder Creek show wood loadings
in the Niagara Subbasin to be very low. The two study sites combine for an average of 11.2
pieces/100 m and 0.4 jams/100 m. Also, large mature trees that are known to be key members in
LWD accumulation (Latterell and Naiman, 2007; Magilligan et al., 2008) are mostly absent from
the stream reaches surveyed. These results are lower than, but relatively similar to, those of

35
studies from other regions of the U.S. where deforestation has been rampant. Costigan and
Daniels (2013) and Magilligan et al. (2008) found LWD loadings in New England streams to
have 17.4 pieces/100 m and 4.4 jams/100 m on average. Wood loadings in this study are also
lower than, but relatively similar to, those described by LWD surveys form Pennsylvania and
West Virginia where streams averaged 16.1 pieces/100 m (Cordova et al., 2007). Wood loadings
in the Northeast are much lower than loadings in Alaska, Washington, Montana, Oregon, and
California, where LWD surveys have revealed streams to typically have more than 30.0
pieces/100 m (Cordova et al., 2007). Old-growth forests still exist in the watersheds of these
western states as these areas have not experienced the same levels of deforestation that occurred
in the Northeast.
The LWD survey in this study shows that wood recruited into the stream channel is
mostly too small to resist transport by the stream and maintain productive positions in the
channel (Costigan and Daniels, 2013). As a result, the ecological function and physical stability
of streams in the Niagara Subbasin are likely degraded and ecological services are likely not
being realized. The slow regeneration of forests observed in western New York (Wang, 2009,
2010; Larsen et al., 2012) and the lag known to exist between forest regeneration and LWD
recruitment (Magilligan et al., 2008) means that without intervention streams are likely to remain
degraded long into the future. However, manual wood addition and allowing for continued
riparian forest regeneration can improve both habitat diversity and organic matter and fine
sediment retention in low LWD systems and reverse the trend of degradation (Costigan and
Daniels, 2013).
Limitations exist for this study that could be considered significant. Land cover
classification GIS raster data from the USDA/NRCS Geospatial Data Gateway used in the study

36
has a resolution of 30 m. As the LWD recruitment zone is defined as the 30 m of riparian zone on
either side of the stream channel (Rinella et al., 2009), the analysis is likely susceptible to
accuracy issues due to coarse data resolution. This problem could be mitigated by using higher
resolution land cover classification data that could be attained by using LiDAR to survey land
cover in the LWD recruitment zone. However, such data are not currently available.
Furthermore, it is difficult to verify or ground-truth the land cover data as there are thousands of
polygons to consider. Anomalies were apparent in the stream hydrography data, also obtained
from USDA/NRCS Geospatial Data Gateway, as a few stream segments appeared disconnected
or strangely shaped. Such anomalies were particularly apparent in the Lower Tonawanda Creek
and Middle Tonawanda Creek watersheds. This likely undermines the accuracy of the GIS
analysis.
Despite these limitations data, observations, and analyses are sufficient to address the
research questions and achieve the objective of informing restoration planning efforts. GIS
analysis produced percent forested LWD zone values for each watershed and revealed spatial
trends at the subbasin and watershed scales that could be very useful in planning and targeting
conservation efforts.
Though the need for stream restoration is now widely known and has become an accepted
social objective in developed nations, often local restoration efforts treat the symptoms and do
little to address the causes of stream degradation. What is actually needed is the restoration of
landscape processes on a watershed scale (Kail et al., 2007). Restoring and/or sustaining LWD
in streams is a challenge that exemplifies the difficulty of protecting river environments while
meeting human needs.

37
Floodplain reclamation and preservation are necessary for full restoration but are
prohibitively expensive and significant technical, social, and political obstacles exist. Some
worthwhile degree of restoration could be achieved for systems like the Niagara Subbasin
through the establishment of an interconnected system of large, strategically located riparian
reserves spanning entire stream segments (Latterell and Naiman, 2007). Concerning streams that
flow through developed areas, as is the case for almost all of the Niagara Subbasin, the
importance of LWD demands that the issue of its threat to infrastructure (bridges and culverts) be
re-conceptualized as a problem of infrastructure not allowing for the passing of LWD. The
necessary reconstruction of infrastructure for this course of action is less costly over time than
current strategies (Lassertte and Kondolf, 2012).
Sustainable stream restoration in the Niagara Subbasin through reestablishment of the
processes that allow for large woody debris recruitment and retention is possible. A combination
of an introduction of key members, modification of infrastructure to accommodate the passage of
large woody debris, and preservation of riparian forests to allow for their maturation and
realization of large woody debris recruitment potential would be an effective strategy of
restoration for the watersheds of the Niagara Subbasin.
CONCLUSION
The natural environment of western New York has suffered anthropogenic impacts for
more than 200 years. Rampant deforestation associated with land use has caused severe
degradation of natural systems and environmental quality. This study sought to address the
question of how to restore natural function and improve environmental quality by describing the
current state of large woody debris, a natural element known to play a crucial role in the physical

38
processes and ecology of watersheds, in the Niagara Subbasin. These descriptions were provided
through GIS mapping and analysis of forested large woody debris recruitment zones for the six
watersheds of the 2,066.5 km2 Niagara Subbasin, and through field surveys of in-stream large
woody debris at sites in two of the six watersheds.
GIS mapping and analysis of forested LWD recruitment zones reveals that large woody
debris recruitment potential is generally limited in the study area, but varies spatially at the
subbasin and watershed scales. LWD recruitment potential is shown to decrease from east to
west at the subbasin scale, and upstream to downstream at the watershed scale. Density analysis
of forested LWD recruitment zone polygons further illustrates these trends, showing higher
densities in upstream sections of watersheds and in the eastern half of the subbasin.
Field surveys of in-stream LWD at Ellicott Creek and Murder Creek reveal wood
loadings to be very low with ratings of 10.3 pieces/100 m and 12.1 pieces/100 m respectively.
Large wood jams were few with six jams found at Ellicott Creek (0.5 jams/100 m) and five jams
were found at Murder Creek (0.3 jams/100 m). Three out of 11 jams were classified parallel
jams, the smaller and less influential of the four Wallerstein and Thorne (2004) jam
classifications. These descriptions show current LWD recruitment and loadings to be insufficient
to facilitate full physical and ecological function.
The findings of this study show that by limiting large woody debris, historical and
contemporary land use continues to greatly impact stream function, water quality, and ecology in
western New York. In order to ameliorate these impacts, large woody debris needs to be restored.
In the Niagara Subbasin this could be achieved by conserving existing forested LWD recruitment
zones where they cover enough land area to offer significant LWD recruitment potential. This
study shows these areas to be mostly in the eastern section of the Niagara Subbasin. In the

39
western half of the subbasin, where forested LWD recruitment zones are relatively few and
recruitment potential is low, manual wood introduction would be necessary in order to restore
LWD.
40
REFERENCES
Buffalo Niagara Riverkeeper (2014). Healthy Niagara: Niagara River management plan (phase
1). <http://bnriverkeeper.org/healthyniagara/>.
Comiti, F., Andreolia, A., Lenzia, M.A., Mao, L. (2006). Spatial density and characteristics of
woody debris in five mountain rivers of the Dolomites. Geomorphology 78(1-2): 44-63.
Cordova, J.M., Rosi‐Marshall, E.J., Yamamuro, A.M., Lamberti, G.A. (2007). Quantity, controls
and functions of large woody debris in Midwestern USA streams. River Research and
Applications 23(1): 21-33.
Costigan, K.H., Daniels, M.D. (2013). Spatial pattern, density and characteristics of large wood
in Connecticut Streams: Implications for stream restoration priorities in southern New England.
River Research and Applications 29: 161-171.
Daniels, M.D. (2006). Distribution and dynamics of large woody debris and organic matter in a
low-energy meandering stream. Geomorphology 77(3-4): 286-298.
Guyette, R.P., Cole, W.G., Dey, D.C., Muzika, R.M. (2002). Perspectives on the age and
distribution of large wood in riparian carbon pools. Canadian Journal of Fisheries and Aquatic
Sciences 59(3): 578-585.
Kail, J., Hering, D., Muhar, S., Gerhard, M., Preis, S. (2007). The use of large wood in stream
restoration: Experiences from 50 projects in Germany and Austria. Journal of Applied Ecology
44(6): 1145-1155.
Kasprak, A., Magilligan, F.J., Nislow, K.H., Snyder, N.P. (2012). A LIDAR-derived evaluation
of watershed-scale large woody debris sources and recruitment mechanisms: coastal Maine,
USA. River Research and Applications 28: 1462-1476.
Keller, E.A., Swanson, F.J. (1979). Effects of large organic material on channel form and fluvial
processes. Earth Surface Processes 4: 361-380.
Lassettre, N.S., Kondolf, G.M. (2012). Large woody debris in urban stream channels: Redefining
the problem. River Research and Applications 28: 1477-1487.
Latterell, J.J., Naiman, R.J. (2007). Sources and dynamics of large logs in a temperate floodplain
river. Ecological Applications 17(4): 1127-1141.

41
Larsen, C.P.S., Kronenfeld, B.J., Wang, Y.C. (2012). Forest composition: More altered by future
climate change than by Euro-American settlement in western New York and Pennsylvania.
Physical Geography 33(1): 3-20.
Magilligan, F.J., Nislow, K.H., Fischer, G.B., Wright, J., Mackey, G., Laser, M. (2008). The
geomorphic function and characteristics of large woody debris in low-gradient rivers, coastal
Maine, USA. Geomorphology 97: 467-482.
Montgomery, D.R., Abbe, T.B. (2006). Influence of logjam-formed hard points on the formation
of valley-bottom landforms in an old-growth forest valley, Queets River, Washington, USA.
Quaternary Research 65(1): 147-155.
Morrison, E.B., Lindell, C.A. (2011). Active or passive forest restoration? Assessing restoration
alternatives with avian foraging behavior. Restoration Ecology, 19(201), 170-177.
Omernik, J.M. (1995). Ecoregions: A spatial framework for environmental management.
Biological Assessment and Criteria: Tools for Water Resource Planning and Decision Making.
Davis, W.S. and T.P. Simon (eds.), Lewis Publishers, Boca Raton, FL. 49-62.
Rinella, D.J., Booz, M., Bogan, D.L., Boggs, K., Sturdy, M., & Rinella, M.J. (2009). Large
woody debris and salmonid habitat in the Anchor River basin, Alaska, following an extensive
spruce beetle (Dendroctonus rufipennis) outbreak. Northwest Science, 83(1), 57-69.
Smith, M.P., Schiff, R., Olivero, A., MacBroom, J. (2004). The active river area: A conservation
framework for protecting rivers and streams. Prepared by The Nature Conservancy with support
from Milone & MacBroom Inc., South Burlington, VT. <http://www.floods.org/PDF/ASFPM_
TNC_Active_River_%20Area.pdf>
Tecle, A., Bojonell, H.A., King, J.G. (2001). Effects of harvesting headwater forest watersheds
on woody debris and stream channel characteristics. Journal of the Arizona-Nevada Academy of
Science 33(2): 98-112.
Sawyer, A.H., Cardenas, M.B. (2012). Effect of experimental wood addition on hyporheic
exchange and thermal dynamics in a losing meadow stream. Water Resources. Research 48(10).
URS Corporation, Gomez and Sullivan Engineers, P.C., E/PRO Environmental & Engineering
Consulting, LLC. (2005). Upper Niagara River tributary backwater study, prepared for the New
York Power Authority.
Wallerstein, N.P., Thorne, C.R. (2004). Influence of large woody debris on morphological
evolution of incised, sand-bed channels. Geomorphology 57(1) 53-73.

42
Wang, Y.C., Kronenfeld, B.J., Larsen, C.P.S. (2009). Spatial distribution of forest landscape
change in western New York from presettlement to the present. Canadian Journal of Forest
Research 39: 76-88.
Wang, Y.C., Larsen, C.P.S., Kronenfeld, B.J. (2010). Effects of clearance and fragmentation on
forest compositional change and recovery after 200 years in western New York. Plant Ecology
208(2): 245-258.
Wagenhoff, A., Olsen, D.A. (2014). Does large woody debris affect the hyporheic ecology of a
small New Zealand pasture stream? New Zealand Journal of Marine and Freshwater Research
48(4): 547
Wild Trout Trust (2012). Use of large woody debris. The Chaulkstream Habitat Manual sheet 9
of 9.
Wiken, E. (1986). Terrestrial ecozones of Canada. Environment Canada. Ecological Land
Classification Series No. 19. Ottawa, Canada.

43
APENDIX: Field photographs
A B
Image 1. (A) Upstream side of Stony Road Bridge, LWD field survey site 1, reach 2
(Ellicott Creek). As shown here, the Stony Road Bridge does not allow for passage of LWD
under high flow conditions. (B) Downstream view from Stony Road bridge, LWD field survey site
1, reach 2 (Ellicott Creek).

44
Image 2. View of upstream side of Harris Hill Road Bridge at high flow, LWD field
survey site 1, reach 1 (Ellicott Creek). In contrast to the Stony Road Bridge, the infrastructure
here has allowed for the passing of LWD.
Image 3. Upstream view near Harris Hill Road Bridge, LWD study site 1, reach
1(Ellicott Creek).

45
Image 4. Upstream side of the Crittenden Road Bridge, LWD survey site 2 (Murder
Creek). This bridge would likely allow for the passing of most LWD under high flow condition.
Image 5. Downstream view of large wood jam “MC1” at LWD field survey site 2
(Murder Creek). MC1 was classified a deflector jam.

46
Image 6. View from the right bank of large wood jam “MC2” at LWD field survey site 2
(Murder Creek). MC2 was classified a deflector jam.
Image 7. Downstream view of large wood jam “MC2” at LWD field survey site 2
(Murder Creek). MC2 was classified a deflector jam.