Botryosphaeriaceae as endophytes and latent pathogens of woody plants: diversity, ecology and impact
Upload
independentCategory
view
2download
0
Coarse woody debris in undisturbed and logged forestsin the eastern Brazilian Amazon
M I C H A E L K E L L E R *w , M I C H A E L PA L A C E *, G R E G O R Y P. A S N E R z,
R O D R I G O P E R E I R A J R . § and J O S E N A T A L I N O M . S I LVA }*Complex Systems Research Center Morse Hall University of New Hampshire Durham, NH 03824, USA, wUSDA Forest Service
International Institute of Tropical Forestry San Juan, PR 00926-1119, USA, zCarnegie Institution of Washington, Stanford
University, Stanford, CA 94305, USA, §INAM Conj. Julia Sefer no 52 A, 67.020-520 Belem, Para, Brazil, }EMBRAPA Amazonia
Oriental, PO Box 48, 66095-100 Belem, Para, Brazil
Abstract
Coarse woody debris (CWD) is an important component of the carbon cycle in tropical
forests. We measured the volume and density of fallen CWD at two sites, Cauaxi and
Tapajos in the Eastern Amazon. At both sites we studied undisturbed forests (UFs) and
logged forests 1 year after harvest. Conventional logging (CL) and reduced impact
logging (RIL) were used for management on areas where the geometric volumes of logs
harvested was about 25–30 m3 ha�1. Density for five classes of fallen CWD for large
material (410 cm diameter) ranged from 0.71 to 0.28 Mg m�3 depending upon the degree
of decomposition. Density of wood within large fallen logs varied with position relative
to the ground and with distance from the center of the log. Densities for materials with
diameters from 2 to 5 and 5 to 10 cm were 0.36 and 0.45 Mg m�3, respectively. The average
mass ( � SE) of fallen CWD at Cauaxi was 55.2 (4.7), 74.7 (0.6), and 107.8 (10.5) Mg ha�1 for
duplicate UF, RIL, and CL sites, respectively. At Tapajos, the average mass of fallen CWD
was 50.7 (1.1) Mg ha�1 for UF and 76.2 (10.2) Mg ha�1 for RIL for duplicate sites compared
with 282 Mg ha�1 for live aboveground biomass. Small- and medium-sized material
(o10 cm dia.) accounted for 8–18% of the total fallen CWD mass. The large amount of
fallen CWD at these UF sites relative to standing aboveground biomass suggests either
that the forests have recently been subjected to a pulse of high mortality or that they
normally suffer a high mortality rate in the range of 0.03 per year. Accounting for
background CWD in UF, CL management produced 2.7 times as much CWD as RIL
management. Excess CWD at logging sites would generate a substantial CO2 emission
given the high rates of decay in moist tropical forests.
Key words: Amazon, coarse woody debris, reduced impact logging, selective logging, tropical forest,
wood density
Received 1 November 2002; revised version received and accepted 28 March 2003
Introduction
Coarse woody debris (CWD) is an important compo-
nent in the carbon stock of mature tropical forests
(Harmon et al., 1995; Chambers et al., 2000; Clark et al.,
2002). In undisturbed, old growth, moist forests in the
Brazilian Amazon, Chambers et al. (2000) and Gerwing
(2002) found that CWD accounted for 6% and 18% of
the aboveground live biomass at sites near Manaus and
Paragominas. According to Rice et al. (in press), at the
Tapajos National Forest, near Santarem, Para, Brazil,
CWD accounted for 25% of the aboveground carbon
stock. Chambers et al. (2000, 2001b) found that CWD in
forests near Manaus, decays with an instantaneous
exponential rate of 0.13–0.17 per year (half-life from 4.1
to 5.3 years). The rapid decay of CWD accounts for a
substantial carbon flux. Rice et al. (in press) estimated
that respiration from CWD was approximately
6.3 Mg C ha�1 yr�1; CWD respiration exceeded the
average flux of fine litterfall (5.7 Mg C ha�1 yr�1) at the
site in the Tapajos National Forest, near Santarem.
Aside from its important role in the carbon cycle, CWD
Correspondence: M. Keller, Complex Systems Research Center
Morse Hall University of New Hampshire Durham, NH 03824,
USA, fax 1 1 603 862 0188, e-mail: [email protected]
Global Change Biology (2004) 10, 784–795, doi: 10.1111/j.1529-8817.2003.00770.x
784 r 2004 Blackwell Publishing Ltd

contains important stocks of nutrients, in particular Mg
and Ca (Fernandes et al., 1997; Keller et al., in press).
CWD also provides habitats for a considerable diversity
of life (e.g. MacNally et al., 2001; Norden & Paltto,
2001).
Selective logging is a common management practice
in tropical forests. The process of felling and bucking
trees and then skidding the logs to decks (log landings)
and roads leads to considerable mortality and damage
to the forest (Verissimo et al., 1992; Pereira et al., 2002).
In conventional logging (CL) in the eastern Brazilian
Amazon, the construction of logging infrastructure
such as decks and logging roads is also an important
source of mortality, damage, and ground and canopy
disturbance (Johns et al., 1996; Uhl et al., 1997; Pereira
et al., 2002). Gerwing (2002) found that intact forests
contained about 33 Mg ha�1 of CWD (dry weight of
biomass) above 10 cm diameter. CWD increased to
68 Mg ha�1 at three ‘moderate intensity logging’ sites
that had 28–48 m�3 ha�1 of timber harvested using CL
sampled 4–6 years after harvest.
Harvest practices designed to minimize damage to
the residual forest stand while optimizing the harvest
effort, are referred to as reduced impact logging (RIL).
RIL employs pre-harvest mapping and inventory, and
vine cutting. Inventory data are used to create harvest
plans for directional felling. Skidding along planned
trails uses wheeled skidders rather than crawler
tractors. Several studies near Paragominas, Para, in
the eastern Brazilian Amazon investigated the effects of
RIL compared with CL. RIL resulted in a reduction in
residual stand damage and mortality (Verissimo et al.,
1992; Johns et al., 1996). Comparisons of CL and RIL in
eastern Para, Brazil, show that RIL harvesting opera-
tions reduce ground and canopy damage by half
compared with CL (Pereira et al., 2002). The decrease
in biomass loss by RIL compared with CL was 44% for
a forest in Sabah, Malaysia (Pinard & Putz, 1996). CWD
generation by RIL compared with CL has not been
quantified in the Brazilian Amazon.
RIL has the prospect to minimize carbon losses
following logging in part through the reduction of
CWD generation (Pinard & Putz, 1996). Under forest
conditions in the Eastern Brazilian Amazon, RIL
operations can harvest an equivalent volume of timber
as CL without any increase in cost (Holmes et al., 2002).
Should the avoidance of logging damage become
allowable as a carbon offset practice under international
agreement, then RIL operations should gain a compe-
titive cost advantage over CL. The degree to which RIL
conserves carbon compared with CL depends upon
the generation of CWD, the decomposition of CWD,
as well as on the rate of forest regeneration following
logging.
In order to quantify the mass of CWD in forests of the
eastern Brazilian Amazon and to quantify the genera-
tion of CWD by both CL and RIL management, we
worked at two sites, near the towns of Santarem and
Paragominas, which have active timber industries. We
report on the volume, densities, and mass of fallen
CWD. We made a detailed estimate of the density of
CWD and analyzed the errors related to both density
and volume sampling.
Site description
We worked at two sites that we refer to as Cauaxi and
Tapajos. At the Cauaxi site, we studied undisturbed
forest (UF), and forests harvested using CL and RIL. At
Tapajos, only UF and RIL were studied. Sampling units,
whether logged or unlogged ranged in size from 50 to
100 ha.
The Fazenda Cauaxi in the Paragominas Municipal-
ity, Para, has hosted RIL demonstration and training by
the Fundacao Floresta Tropical since 1995 in collabora-
tion with the property owners CIKEL Brasil Verde SA.
A centrally located camp (3.731S, 48.291W) serves as a
base for these activities. Prior to current logging
operations, there is no historical record of land use or
collection of non-timber forest products, although there
are indicators of indigenous activity. Ranchers and
loggers first entered the area in 1976 through the Rio
Capim and the Rio Surubiju. There were no roads in the
area until the 1980s.
The climate at Fazenda Cauaxi is humid tropical.
Total annual precipitation averages about 2200 mm
(Costa & Foley, 1998). Soils in the area are classified
mainly as dystrophic yellow latosols according to the
Brazilian system (RADAMBRASIL 1983). The topogra-
phy is flat to mildly undulating. The forest at Fazenda
Cauaxi is classified as tropical dense moist forest (IBGE
1988). Stand basal area is approximately 26 m2 ha�1 for
trees greater than 10 cm diameter at breast height
(DBH). The most common timber species that were
harvested during 5 years of forest operations were
Manilkara huberi, M. paraensis, Protium pernevatum,
Dinizia excelsa, and Piptadenia suaveolens. The most
common tree species found are Licania sp., M. huberii,
Astronium lecointei, Eschweilera odorata, and Parkia spp.
At Cauaxi, we studied six forest blocks (50–100 ha each)
including duplicates of UF, CL, and RIL treatments. All
blocks were measured in 2001 and the logged blocks
had been harvested about 1 year earlier in 2000.
Harvest volumes for the RIL blocks were recorded in
detail and ranged from 25 to 30 m3 ha�1. Detailed
records are not available for the CL blocks but
interviews, observations, and market conditions all
suggest that harvest volumes were similar on all blocks.
C O A R S E W O O D Y D E B R I S I N T H E E A S T E R N A M A Z O N 785
r 2004 Blackwell Publishing Ltd, Global Change Biology, 10, 784–795
At Cauaxi, RIL caused only about half as much ground
and canopy damage compared with CL. The ground
damage, defined as the area affected by machines, was
11.2% of CL blocks vs. 4.6% for RIL blocks. Canopy
damage, defined as the gap fraction measured approxi-
mately 1 year following logging was 21.6% for CL vs.
10.9% for RIL (Pereira et al., 2002).
The Tapajos National Forest is located south of the
city of Santarem in Para state. The study site is located
near km 83 on the BR-163 (Santarem-Cuiaba) Highway
(3.041S, 54.951W). The region receives approximately
2000 mm of precipitation per year and has an annual
mean temperature of 25 1C (Silver et al., 2000). The
study site is located on an old, nearly flat, erosional
remnant plateau with well-drained soils. Our studies
were located mainly on a clay-textured Oxisol (80%
clay, 18% sand, 2% silt). A limited number of transects
crossed a sand-loam-textured Ultisol (60% sand, 38%
clay, 2% silt) (Silver et al., 2000). Vegetation at the site is
evergreen, tropical dense moist forest with a total
aboveground live biomass (dry weight) of about
282 Mg ha�1 (Keller et al., 2001). The most common
timber species harvested during 2000 were M. huberi,
Carapa guianensis, Couratari guianensis, Licaria brasilien-
sis, and Nectandra rubra. The most common tree species
(435 cm DBH) found are Pouteria sp., M. huberi, C.
guianensis, Eschweilera sp. and Sclerolobium melanocar-
pum. We studied four forest blocks (�100 ha each)
including duplicate UF and RIL treatments. CWD was
sampled in 2001 approximately 1 year following harvest.
Methods
We used line-intercept sampling (also termed planar
intercept sampling) to quantify CWD volume (e.g.
Brown, 1974; De Vries, 1986; Ringvall & Stahl, 1999).
Three or more lines were selected at random locations
along an edge of each rectangular study block. Parallel
lines separated by at least 100 m ran perpendicular to
the block edge. In the case of logging blocks, we
oriented the lines so that they crossed logging roads at
approximately right angles. As we have shown pre-
viously, damage is concentrated along the roads and
log storage decks bordering the roads (Pereira et al.,
2002). The sampling lines were thus oriented to cross
both high and low damage areas in order to avoid a
sampling bias. We sampled between 2500 and 3400 m of
line for each study block (Table 1) with a total of nearly
29 km of transect reported for the entire study.
We defined CWD as fallen dead woody material with
diameter greater than 2 cm. We did not measure
standing dead material. We divided the material into
three classes according to diameter: 2–5, 5–10, and
410 cm. Each transect was divided into 50 m segments.
A measuring tape was used to demarcate the transects.
In each 50 m segment, a 10 m sub-sample was selected
at random and the small and medium classes (2–5 and
5–10 cm dia.) were counted only in that segment.
Diameter was measured to the nearest centimeter for
all pieces of CWD greater than 10 cm. This material was
classified according to its decomposition state into five
classes (Harmon et al., 1995). The classes 1–5 from
freshest to most rotten were defined according to the
following criteria. Class 1 material was newly fallen
solid wood with some leaves and/or fine twigs still
attached. Material in class 2 was still solid and had
intact bark but no fine twigs or leaves. Class 3 material
resembled class 2 except that bark for this class was
rotten or sloughing. Class 4 material is somewhat rotten
and could be broken when kicked. Class 5 material was
rotten and friable and it could be broken apart with
bare hands.
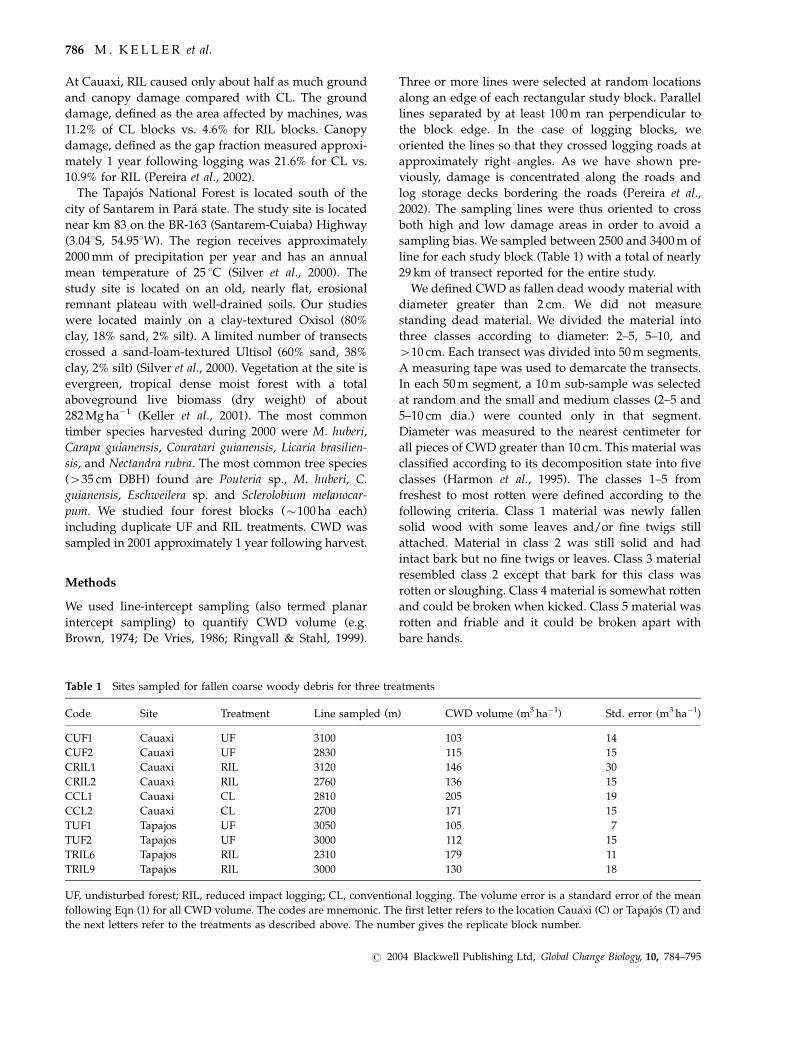
Table 1 Sites sampled for fallen coarse woody debris for three treatments
Code Site Treatment Line sampled (m) CWD volume (m3 ha�1) Std. error (m3 ha�1)
CUF1 Cauaxi UF 3100 103 14
CUF2 Cauaxi UF 2830 115 15
CRIL1 Cauaxi RIL 3120 146 30
CRIL2 Cauaxi RIL 2760 136 15
CCL1 Cauaxi CL 2810 205 19
CCL2 Cauaxi CL 2700 171 15
TUF1 Tapajos UF 3050 105 7
TUF2 Tapajos UF 3000 112 15
TRIL6 Tapajos RIL 2310 179 11
TRIL9 Tapajos RIL 3000 130 18
UF, undisturbed forest; RIL, reduced impact logging; CL, conventional logging. The volume error is a standard error of the mean
following Eqn (1) for all CWD volume. The codes are mnemonic. The first letter refers to the location Cauaxi (C) or Tapajos (T) and
the next letters refer to the treatments as described above. The number gives the replicate block number.
786 M . K E L L E R et al.
r 2004 Blackwell Publishing Ltd, Global Change Biology, 10, 784–795

We determined densities from a sampling of logs
(n5 479) from the Tapajos National Forest from all five
decay classes. We stratified the sample inversely
according to the frequencies of the diameter classes
that we encountered in our volume sampling. We
randomly selected CWD pieces from more populated
classes and sampled all pieces encountered for less
populated classes. Cylindrical radial sections were cut
from the selected sample of the downed material. We
removed cylindrical plugs from the radial sections
using a power drill equipped with plug and tenon
extractor bits (9.525, 12.7, and 19.05 mm dia.). Plugs
were removed along one of eight randomly selected
radii at 5 cm intervals from the center of each cylinder
(Fig. 1a). We cut the ends of the plugs flush to facilitate
fresh volume estimation. For heavily decayed (class 5)
CWD, we used the power drill and tenon extractor
exclusively to sample 29 of 60 pieces. For 11 pieces of
CWD in class 5 that were too friable to sample with the
power drill, we instead inserted a clear plastic cylinder
to a known depth and removed all material that filled
the cylinder. Both the plastic cylinder and the power
drill methods were used on 10 pieces of CWD from
decay class 5. The cylindrical plugs (n5 634 from logs
410 cm) were oven dried at 65 1C and wood density
was calculated as oven dry mass divided by fresh
volume.
Radial sections were photographed digitally. We
separated void space from solid wood by visual
interpretation (Fig. 1b, c). The binary classes of wood
and void were summed to allow a determination of a
proportional void space for each radial section. The
final density for each sampled piece of wood was
calculated by multiplying the averaged wood density of
the plugs by the proportion of space that was not void.
We also sampled 103 and 87 randomly selected
individual pieces of CWD in the 2–5 (small) and 5–
10 cm (medium) diameter classes, respectively. Fresh
volume was estimated by calculating the volume of a
cylinder corresponding to the length and diameter of
each piece. In some cases, the tenon extractor was used
to remove one to two plugs from medium-sized pieces
of CWD. The pieces were cut to manageable sizes
(generally less than 10 cm length) for oven drying
(65 1C).
Error and statistical analysis
Mean CWD volume for a given decay class was
calculated as the average of CWD volume for each
sample transect weighted by transect length. We report
standard errors of the mean for volume and density
measurements. The variances of the mean for volume
(s2, Eqn (1)) are also weighted by transect lengths (Lj)
Fig. 1 (a) A cylindrical section of a piece of fallen CWD after
removal of plugs for density sampling. The groups of sampling
radii are marked top (01), B (4511 3151), C (9011 2701), D
(13511 2251) and bottom (1801). (b) A cylindrical section of a
piece of fallen CWD showing void space. (c) Binary visual
interpretation of the void space. Solid wood is shown in black
and void is shown in gray.
C O A R S E W O O D Y D E B R I S I N T H E E A S T E R N A M A Z O N 787
r 2004 Blackwell Publishing Ltd, Global Change Biology, 10, 784–795

for n transects, as recommended by DeVries (1986, p.
256), prior to calculation of the standard errors for
volumes:
s2 ¼P
LjðVj � �VVÞ2h i
ðn� 1Þ �P
Lj� � ð1Þ
The mass of CWD (Mi) for class i5 1–7 (decay classes
1–5 for large debris and small and medium debris) was
calculated from the product of the volume of material
(Vi) and the respective density for the material class
(Di):
Mi ¼ ri � Vi ð2Þ
Therefore, the error on each Mi (EM) was calculated by:
EM ¼ Er � V þ r � EV ð3Þ
where Er and EV represent the errors in density and
volume, respectively. Eqn (2) is valid when V and D are
not correlated. Our analysis (data not shown) indicated
no significant correlation (r25 0.00) between volume of
the CWD pieces sampled and density for all decay
classes. The mass for a given decay class is not
necessarily independent of the mass for another decay
classes. Therefore, we estimated the total error in mass
conservatively for all material classes as the simple sum
of the component errors in mass.
We only measured densities at the Tapajos site and
we applied these densities to mass calculations at both
sites. Although Tapajos and Cauaxi sites share many
species in common, it is possible that the CWD
densities will vary somewhat between these sites. This
possible difference in densities between sites represents
an unknown potential bias in the reporting of CWD
mass for Cauaxi.
We compared mean fallen CWD volume and mass
across sites and treatments (UF and RIL) using a two-
way ANOVA with a site � treatment interaction term. We
also compared mean mass and volume for three
treatments (UF, CL, and RIL) at Cauaxi using a one-
way ANOVA. The density across five decay classes and
two smaller size classes of CWD material and the effect
of the radial sampling direction were also compared
using a one-way ANOVA.
Results
The total volume of CWD ranged from 102 to
205 m�3 ha�1 across the 10 blocks sampled (Table 2).
In a two-way ANOVA, taking into account site and
treatment effects (UF, RIL), we found no significant
difference between the Cauaxi and Tapajos sites,
Table 2 Mean CWD volume (� SE) for 10 sampled blocks of undisturbed forest, reduced impact, and conventional logging at
Cauaxi and Tapajos
Code
Class 1
(m3 ha�1)
Class 2
(m3 ha�1)
Class 3
(m3 ha�1)
Class 4
(m3 ha�1)
Class 5
(m3 ha�1)
Small
(m3 ha�1)
Medium
(m3 ha�1)
Total
(m3 ha�1)
CUF1 2.6 10.4 32.7 25.9 15.0 7.7 8.6 102.9
(1.4) (3.9) (4.3) (6.7) (2.1) (1.2) (1.6) (21.1)
CUF2 2.1 11.0 55.6 19.5 8.8 7.8 9.6 114.5
(1.1) (3.8) (10.4) (3.7) (2.4) (1.0) (1.7) (24.1)
CRIL1 3.1 29.4 37.8 25.6 19.5 13.6 16.9 145.8
(1.6) (10.4) (8.2) (5.2) (11.8) (2.5) (3.3) (43.0)
CRIL2 16.1 23.7 56.9 14.3 5.6 9.4 10.2 136.2
(5.0) (4.0) (7.0) (5.5) (1.5) (1.6) (1.4) (26.1)
CCL1 15.5 53.9 87.7 15.5 2.1 14.4 15.6 204.8
(4.8) (14.8) (18.9) (7.2) (0.6) (2.3) (2.1) (50.7)
CCL2 44.1 28.6 57.1 18.2 1.6 10.3 11.1 171.0
(6.7) (8.9) (15.5) (5.0) (0.3) (1.6) (0.9) (38.9)
TUF1 2.5 8.5 30.3 29.9 23.3 4.3 6.6 105.5
(2.2) (6.0) (6.9) (2.6) (5.7) (0.7) (2.1) (26.2)
TUF2 4.4 5.8 26.4 36.2 21.5 6.5 11.3 112.0
(2.4) (1.2) (0.9) (6.9) (6.3) (1.0) (1.9) (20.5)
TRIL6 4.3 17.5 47.7 27.5 40.6 18.6 22.1 178.2
(2.7) (6.8) (9.2) (6.6) (12.2) (0.5) (3.4) (41.6)
TRIL9 5.6 15.5 28.2 25.2 22.4 10.6 22.5 130.1
(2.9) (6.0) (11.8) (2.9) (1.6) (0.2) (4.0) (29.6)
The errors for five decays classes of large material (410 cm dia.) and small (2–5 cm) and medium (5–10 cm) material are standard
errors of the mean. The error for the total is a simple sum of the individual errors. Site codes are defined in Table 1.
788 M . K E L L E R et al.
r 2004 Blackwell Publishing Ltd, Global Change Biology, 10, 784–795

although there was a significant difference between the
UF and RIL treatments (Po0.05). There was no
site � treatment interaction. Comparing three treat-
ments (UF, RIL, CL) at Cauaxi, we found that the
CWD volume among logging treatments was signifi-
cantly different (ANOVA, Po0.05). Large debris (410 cm
dia.) represents 72–92% of the total CWD volume
(Fig. 2). Class 3 (partly decayed) material, was the
modal volume class for all sampled sites accounting
for 22–49% of CWD volume, with the exception of one
UF block at Tapajos (TUF2) where class 4 material
represented 32% of CWD volume. As expected, rela-
tively fresh material (classes 1 and 2) represented a
greater proportion of the CWD volume in recently
logged sites, with up to 43% in one conventionally
logged site (CCL2).
Density of large CWD (410 cm dia.) corrected for
void space differed significantly among decay classes
(ANOVA, Po0.001) (Table 3). Density tended to decrease
with the increasing level of decay for classes 1–5.
Curiously, decay class 1, the freshest material was on
average less dense than the slightly more decayed
material in class 2.
The amount of void space also varies significantly
among the decay classes (ANOVA, Po0.001). Void space
was minimal for classes 1 and 2. Void space increases
progressively with the level of decay for classes 1–4.
Material in class 5 was generally highly fragmented. In
class 5, 39 of 60 pieces collected had no macroscopic
void space. Evidently, these pieces of CWD were
fragments of larger pieces that had decayed. For those
pieces of CWD in class 5 where the original form of the
log could be identified, the proportion of void space
was 0.27 (� 0.04) consistent with the trend of increasing
void space with increasing decay class.
Small (2–5 cm dia.) and medium (5–10 cm dia.)
materials were not classified according to decay con-
ditions. On average this material had mean densities
Fig. 2 A stacked bar graph showing the proportions of CWD mass by decay class for diameter410 cm and for small and medium
material. Class 1 material was newly fallen solid wood with some leaves and/or fine twigs still attached. Material in class 2 was still
solid and had intact bark but no fine twigs or leaves. Class 3 material resembled class 2 except that bark for this class was rotten or
sloughing. Class 4 material is somewhat rotten and could be broken when kicked. Class 5 material was rotten and friable and it could be
broken apart with bare hands. Small and medium material had diameters from 2–5 cm and 5–10 cm respectively. Small and medium
material was not further classified for decay status. Site codes are defined in Table 1.
C O A R S E W O O D Y D E B R I S I N T H E E A S T E R N A M A Z O N 789
r 2004 Blackwell Publishing Ltd, Global Change Biology, 10, 784–795

(0.36–0.45 Mg m�3) between those of classes 4 and 5.
Field observations suggested that much of the material
in the small and medium size classes was from vines,
particularly in the logged plots. We did not quantify the
origin of vine- vs. tree-derived debris.
We checked for potential biases related to our density
sampling approach. First, as noted above, we found no
significant correlation between the corrected density
and the size of the debris pieces sampled for large CWD
(410 cm dia.). We examined whether the wood density
of plugs varied with the position of the randomly
selected radius in fallen logs. For this analysis we
grouped the eight randomly selected radii according to
the symmetry through a plane perpendicular to the
ground from the top (01) to the bottom position (1801) of
the log. The eight radii collapse into five categories: top;
bottom; B (45113151); C (90112701); and D (135112251)
as illustrated in Fig. 1a. Radial position had a significant
effect (ANOVA, Po0.05) (Fig. 3). We also examined the
possibility that wood density for extracted plugs varied
by distance from the center of the logs. When wood
density for individual plugs was normalized to the
average for each radial section, we found an inverse
correlation (r25 0.55) between plug density and the
distance from the center of the fallen log (Fig. 4).
The mass of CWD in individual blocks varied from
51 to 118 Mg ha�1 (Table 4). A comparison of CWD mass
in RIL logging and UF treatments at both Cauaxi and
Table 3 Mean (S. E.) wood plug densities, void proportions, and corrected densities for 5 decay classes of CWD (dia. 410 cm) and
medium (5–10 cm) and small (2–5 cm) debris
Debris class Plug density (Mg m�3) Void proportion Corrected density (Mg m�3) Number of pieces sampled
1 0.61 (0.02) 0.02 (0.01) 0.60 (0.02) 88
2 0.71 (0.03) 0.02 (0.01) 0.70 (0.03) 35
3 0.63 (0.02) 0.08 (0.02) 0.58 (0.03) 48
4 0.58 (0.03) 0.21 (0.03) 0.45 (0.03) 52
5 0.32 (0.03) 0.09 (0.02) 0.28 (0.03) 60
Medium(5–10 cm) 0.45 (0.02) 86
Small (2–5 cm) 0.36 (0.01) 103
Fig. 3 Box-and-whisker plot of wood plug density vs. direction sampled. Box labels represent 5 categories of directions (top, bottom, B
(4511 3151), C (9011 2701) and D (13511 2251)) as illustrated in Fig. 1a. Boxes mark the upper and lower quartiles of the data. Whiskers
indicate the 10th and 90th percentiles. Outliers are indicated by bold points. A thick line represents the median and a dotted line the
mean. A total of 215 CWD pieces sampled for the radial direction were analyzed.
790 M . K E L L E R et al.
r 2004 Blackwell Publishing Ltd, Global Change Biology, 10, 784–795

Fig. 4 Averages (� standard error) of the differences in density for plugs at distance from the center of a piece of CWD compared with
the average plug density for the same piece of CWD. The linear regression is y5 0.0109–0.00170x (r25 0.556). Only CWD pieces with at
least two samples per piece (n5 192) were used for this analysis. The analysis was truncated beyond a distance of 30 cm because of the
paucity of samples.
Table 4 Mean (� propagated error) fallen CWD mass for 10 sampled blocks of undisturbed forest, reduced impact, and
conventional logging at Cauaxi and Tapajos for five decays classes of large debris (410 cm dia.) and small (2–5 cm) and medium
(5–10 cm) debris
Code
Class 1
(Mg ha�1)
Class 2
(Mg ha�1)
Class 3
(Mg ha�1)
Class 4
(Mg ha�1)
Class 5
(Mg ha�1)
Small
(Mg ha�1)
Medium
(Mg ha�1)
Total
(Mg ha�1)
CUF1 1.6 7.3 19.1 11.6 4.2 2.8 3.9 50.5
(0.9) (3.0) (3.4) (3.7) (1.0) (0.5) (0.9) (13.4)
CUF2 1.3 7.7 32.5 8.8 2.5 2.8 4.4 59.9
(0.7) (3.0) (7.6) (2.1) (0.9) (0.5) (1.0) (15.8)
CRIL1 1.8 20.6 22.1 11.5 5.5 4.9 7.7 74.0
(1.0) (8.1) (5.8) (3.0) (3.9) (1.1) (1.9) (24.8)
CRIL2 9.7 16.6 33.2 6.4 1.6 3.4 4.6 75.5
(3.3) (3.5) (5.6) (2.9) (0.6) (0.7) (0.9) (17.4)
CCL1 9.3 37.8 51.2 7.0 0.6 5.2 7.1 118.2
(3.2) (11.9) (13.4) (3.6) (0.2) (1.0) (1.3) (34.7)
CCL2 26.5 20.1 33.4 8.2 0.4 3.7 5.0 97.3
(4.7) (7.1) (10.6) (2.7) (0.1) (0.7) (0.7) (26.6)
TUF1 1.5 6.0 17.7 13.4 6.5 1.6 3.0 49.7
(1.4) (4.5) (4.9) (1.9) (2.2) (0.3) (1.1) (16.3)
TUF2 2.6 4.1 15.4 16.2 6.0 2.3 5.1 51.8
(1.5) (1.0) (1.2) (4.0) (2.4) (0.4) (1.1) (11.7)
TRIL6 2.6 12.3 27.8 12.3 11.4 6.7 10.1 83.1
(1.7) (5.3) (6.7) (3.7) (4.6) (0.5) (2.1) (24.4)
TRIL9 3.4 10.9 16.5 11.3 6.3 3.8 10.2 62.4
(1.9) (4.7) (7.7) (2.0) (1.1) (0.2) (2.3) (19.8)
Site codes are defined in Table 1.
C O A R S E W O O D Y D E B R I S I N T H E E A S T E R N A M A Z O N 791
r 2004 Blackwell Publishing Ltd, Global Change Biology, 10, 784–795

Tapajos, showed a significant effect of treatment
(ANOVA, Po0.05) with no significant effect of site and
no site � treatment interaction. At Cauaxi, fallen CWD
mass varied significantly among treatments (ANOVA,
Po0.05).
Average density of CWD calculated for the various
sites and logging treatments, gives an integrated view
of the CWD composition (Table 5). At Cauaxi, the
average density of CWD tended to follow the degree of
disturbance; average density for CL (0.57 Mg m�3)
exceeded that for RIL (0.53 Mg m�3), which in turn
exceeded the average density in the UF (0.51 Mg m�3).
Density did not vary between UF and RIL sites at
Tapajos. Tapajos RIL sites had a relatively high
proportion of CWD volume in small and medium
classes compared with other sites. These relatively low-
density classes offset the increase in fresh material
compared with UF.
Discussion
Comparison of mature forest sites
The mass of fallen CWD (410 cm dia.) for the Tapajos
and Cauaxi sites is surprisingly similar (46 and
50 Mg ha�1, respectively). This assumes that the Tapajos
and Cauaxi forests have similar CWD densities because
we only measured density at Tapajos. We believe this is
a reasonable assumption given that there is a strong
overlap in the species composition at these sites. Our
values for fallen CWD mass (410 cm) are greater than
those found for most forest sites measured in the
Amazon region. Brown et al. (1995) found 30 Mg ha�1
for a forest in Rondonia. Gerwing (2002) reported
33 Mg ha�1 for forest sites near Paragominas. Chambers
et al. (2000) estimated 21 Mg ha�1 of fallen CWD
(410 cm) and 30 Mg ha�1 of ‘coarse litter’ (Chambers
et al., 2001a) for forest near Manaus. In contrast, Rice
et al. (in press) measured fallen CWD of 70 Mg ha�1at a
site only 20 km away from ours at Tapajos.
The fallen CWD (dia. 410 cm) at the Tapajos site
contained about 16% as much mass as the aboveground
live biomass (Keller et al., 2001), while Rice et al. (in
press) found 24% at a Tapajos site 20 km distant. These
proportions are large compared with the results by
Chambers et al. (2000, 2001a) near Manaus, Gerwing
(2002) near Paragominas, and Brown et al. (1995) (6–9%,
11%, and 11%, respectively).
We do not believe that the difference among sites was
an artifact of the methods used. Brown et al. (1995),
Chambers et al. (2000), and Rice et al. (in press) used
plot-based methods, while Gerwing (2002) and our
study use line-intercept sampling. However, Rice et al.
(in press) compared their plot-based method with line-
intercept measurements using the approach described
above and found no difference within the errors of the
respective methods. Despite the comparable methods,
Rice et al., found a much greater mass of CWD.
Apparently, forest dynamics and mortality can vary
significantly on a spatial scale of kilometers and it is
likely, as Rice et al. (in press) contend, that their site has
recently suffered a considerable pulse of mortality. Rice
et al. (in press) have speculated that the severe El Nino
related droughts of 1997 and 1998 may have provoked
the pulse in mortality.
Is CWD at steady state in these mature forests?
Given the large quantity of CWD found at the Tapajos
forest in our study, is it reasonable to assume that UFs
at our study sites are close to steady state? We consider
a simple compartment model for the forest,
dB=dt ¼ G� mB ð4Þ
and
dN=dt ¼ mB� kN ð5Þ
Biomass (B) and necromass (N) change according a
fixed growth rate (G) and first-order mortality (m) and
decay of necromass (k). For our purposes, we consider
B to be only woody aboveground biomass and N to be
CWD. Therefore G is the growth rate of aboveground
wood. At steady state, mB5 kN. For Tapajos
(B5 282 Mg ha�1, N5 51 Mg ha�1), if we assume a
range of decay rates (k) estimated by Chambers et al.
(2000, 2001b) of 0.13–0.17 per year, then at steady state
the instantaneous mortality rate (m) (sensu Sheil et al.,
1995) ranges from 0.024 to 0.031 per year. If we increase
the CWD pool (N) by 20% to account for standing dead
(Rice et al., in press), then the instantaneous mortality
Table 5 Average density of fallen CWD and average mass (SE) of CWD for five site � treatment combinations
Cauaxi UF Cauaxi RIL Cauaxi CL Tapajos UF Tapajos RIL
Average density (Mg m�3) 0.51 0.53 0.57 0.47 0.47
Average mass (Mg ha�1) 55.2 74.8 107.8 50.8 72.8
Standard error (Mg ha�1) 4.7 0.7 10.5 1.1 10.4
Standard errors are calculated from n5 2 blocks per site.
792 M . K E L L E R et al.
r 2004 Blackwell Publishing Ltd, Global Change Biology, 10, 784–795

rates would rise to 0.028–0.037 per year. These rates are
at the high end of the range of mortalities compiled by
Phillips et al. (1994), but consistent with the mortality
coefficient derived from measurements in permanent
plots in the Tapajos National Forest (0.032 per year)
(Alder & Silva, 2000; Keller et al., in press). A steady-
state interpretation cannot be ruled out by our
measurements.
The CWD flux resulting from mortality includes not
only tree death but also branch fall. Branch fall has
received limited attention in tropical forest studies
(Clark et al., 2001). Chambers et al. (2001c) estimated
that branch fall accounted for 0.9 Mg ha�1 y�1 for
tropical moist forest outside Manaus. Other biomass
components, such as vines and small trees, not
normally included in long-term mortality studies may
also contribute a significant flux of CWD. Given these
other sources of mortality, when considering the CWD
pool, the high mortality rates calculated above appear
to be reasonable.
Effects of logging on CWD stocks
We studied logged sites where 25–30 m3 ha�1 of timber
had been harvested. This level of harvest falls between
intermediate and high intensity for current logging in
the Brazilian Amazon (Nepstad et al., 1999). Fallen
CWD increased by 35–43% above background levels in
RIL treatments and by 95% in CL treatments. This
finding is consistent with the 106% increase in fallen
CWD observed by Gerwing (2002) for ‘moderately
logged’ sites near Paragominas. Those sites had 28–
48 m3 ha�1 of timber removed 4–6 years prior to
sampling. If we subtract a background level of
55 Mg ha�1 fallen CWD for Cauaxi, then the CL
treatment produced 2.7 times as much CWD as RIL
for the same volume of timber harvested. In paired high
intensity (54 to 175 m3 ha�1) RIL and CL logging
operations in Sabah, Malaysia, Pinard & Putz (1996)
found that CL operations produced 77% more necro-
mass than did RIL (including roots, and wood waste at
the mill).
The production of CWD following logging will
strongly influence the carbon balance of logged sites.
The carbon content of CWD created for RIL blocks is
about equal to the carbon in timber extracted while in
CL blocks, about 2.5 times as much carbon goes to
CWD as goes to the sawmill. Assuming the instanta-
neous decay constant estimated by Chambers et al.
(2000) of 0.17 per year, we would expect CWD at the
RIL and CL sites at Cauaxi to emit about 1.5–
4.5 Mg C ha�1 yr�1 in the year after they were sampled.
This represents a substantial portion of the gross
primary production (26 Mg C ha�1 y�1) for UF at the
Tapajos site (Goulden et al., in press).
In recently logged sites, we would expect some
increase of net primary productivity (NPP) resulting
from opening of the canopy and liberation of the
suppressed understory species (Silva et al., 1995). The
balance between added respiration from CWD follow-
ing logging and possible increases of NPP from
liberation has not been measured. Recent model results
based on the Tapajos Forest site that we studied,
suggest that over 200 years of logging at 30 m3 ha�1
with 30 years cutting cycles, about 29 Mg C ha�1 would
be lost from CL managed sites and 16 Mg C ha�1 would
be lost from RIL managed forest (Keller et al., in press).
However, results from the CAFOGROM stand projec-
tion model (Alder & Silva, 2002; Keller et al., in press)
suggest that CL logging would not be commercially
sustainable over 200 years.
Analysis of errors
In order to estimate the mass of CWD we had to
measure both volume and density of the fallen material.
The volume estimates were made using line-intercept
sampling, a standard method that is considered highly
efficient (De Vries, 1986). Even in logged forest, a
practiced three-person team could measure fallen CWD
on 3000 m of transect per day. Errors in sampling CWD
volume arise primarily from the highly uneven spatial
distribution of the CWD. Our within-block errors
(6–21% expressed as standard error of the mean) for
all fallen CWD volume were similar to within treatment
errors at a given site (3–16%) (Table 1). Proportionally,
within site errors in volume estimates were similar for
both logged and UF sites and the greatest variation was
found between logging sites. This variation probably
resulted from differences in harvest management.
We counted several thousand (n5 9527) individual
pieces of CWD. It was impractical to determine density
for this large sample. Therefore, we randomly sub-
sampled fallen CWD to measure density. We found that
the proportional errors in density ranged from 3% to
10% of the mean density and the most highly decayed
material (class 5) had the greatest proportional varia-
tion in density (Table 3).
When estimating mass, we applied a specific density
estimate to each material class. In order to estimate the
overall error in mass, we conservatively summed the
errors for individual classes. Using data from all 10
blocks, error in volume accounted for 69% of the error
in mass determination and the error in density
accounted for the remaining 31%. Many other recent
estimates of CWD mass in tropical forests only
accounted for the errors in volume measurement
C O A R S E W O O D Y D E B R I S I N T H E E A S T E R N A M A Z O N 793
r 2004 Blackwell Publishing Ltd, Global Change Biology, 10, 784–795

(e.g. Gerwing, 2002; Grove, 2001). Therefore, they
substantially underestimated the uncertainty in their
measurements.
Our results suggest that the wood in outer portions of
fallen logs has a lower density than wood at the core of
fallen logs (Fig. 4). We did not attempt to correct the
volume-weighted density for this effect because of the
complications that the apparently anisotropic distribu-
tion of void space would impose on such a correction.
The average volume-weighted density of CWD for
UF at the Tapajos site (0.47 Mg m�3) was high compared
with values measured in other tropical forests. For
example, in a wet forest in Costa Rica, Clark et al. (2002)
found that mean density was 0.45 Mg m�3 for ‘sound’
debris, 0.35 Mg m�3 for ‘partially decomposed’ debris,
and 0.25 Mg m�3 for ‘fully decomposed’ debris. In the
Daintree lowland rain forest in Australia, Grove (2001)
found a volume weighted density of 0.26 Mg m�3.
Gerwing (2002) applied densities of 0.7 Mg m�3 to
‘sound’ fallen CWD with the exception of debris from
Cecropia sp. where a density of 0.3 Mg m�3 was applied.
This value is taken from the average density of fresh
wood from Amazonian trees as compiled by Fearnside
(1997). For the ‘intermediate’ and ‘rotten’ categories,
Gerwing (2002) used factors of 0.88 and 0.60 multiplied
by the value for ‘sound’ debris giving densities of 0.62
and 0.42 Mg m�3 for non-Cecropia species. These esti-
mated densities appear quite high compared with our
measured values. Therefore, we suspect that Gerwing
(2002) overestimated CWD mass.
We sampled CWD approximately 1 year following
logging at CL and RIL sites. Presumably, most CWD is
generated immediately following logging. However,
tree mortality may remain elevated compared with
background levels for several years following logging.
The time history of flux of CWD falling to the ground
following logging has not been quantified in a tropical
forest site.
Conclusion
The old growth forest sites at Cauaxi and Tapajos
contained an average (SE) of 53.0 (2.3) Mg ha�1 fallen
CWD. At Tapajos, this CWD pool is 18% as large as the
aboveground biomass. Taking into account the best
current estimates for decomposition of CWD in the
Amazon, this large pool size implies that either our site
at Tapajos was subject to a recent disturbance or that it
normally has a high instantaneous mortality rate in the
range of 0.03 per year. Mortality in this case would
include branch fall, a flux that is rarely measured.
Volume weighted density of all fallen CWD at the
Tapajos site (0.47 Mg m�3) is greater than the density of
fallen CWD measured at other tropical forest sites. It is
plausible that this greater density results from a
predominance of more recently fallen material at
Tapajos. However, the densities for individual decom-
position classes appear to be greater at Tapajos than at
other sites. Density of CWD has been measured
infrequently in tropical forests. Error in the density
measurements in our study accounted for about 18% of
the overall estimated error in CWD mass in a study
block. In most studies, this density error is not
quantified and therefore the error in CWD stock is
underestimated.
Density of woody material within the large fallen
logs varied significantly both with regard to position
relative to the ground and with distance from the center
of the log. Void space within fallen logs ranged from
about 2% for fresh material (classes 1 and 2) to 27% for
relatively intact logs in the most rotten material (class
5). An unbiased density sampling method must account
for the anisotropy in wood density and the haphazard
distribution of void space.
Logging significantly increases the fallen CWD pools.
Fallen CWD mass at our two sites sampled 1 year
following logging averaged 75 and 108 Mg ha�1 for RIL
and CL management, respectively. Accounting for
background CWD in UF, CL management produced
2.7 times as much CWD as RIL management. Decay of
CWD in the logged sites we studied would emit about
1.5–4.5 Mg C ha�1 y�1 about 1 year following logging.
Acknowledgments
We thank S. Hagen, H. Silva, F. Ferreira Filho, A. Harris, J. Hicke,S. Parks, and B. Sawtelle for assistance with field measurements.J. Zweede and the staff of the Fundacao Floresta Tropicalprovided critical support for our field studies. S. Saleska and M.Ducey provided valuable advice on error analysis. We aregrateful to CIKEL Brasil Verde S.A. for access to their land andfor operational support. We thank IBAMA for access to theTapajos National Forest. We are grateful to the Brazilian Ministryof Science and Technology (MCT) for their leadership of theLarge-Scale Biosphere–Atmosphere Experiment in Amazonia(LBA) and to Brazil’s Center for Weather Prediction and ClimateStudies (CPTEC) for their management of that program. Weacknowledge the superb support offered by the LBA SantaremField Support Office. This work was supported by the NASATerrestrial Ecology Program (NCC5-225 and NCC5-357), theNASA New Millennium Program (NCC5-481), the NASA LBAProgram (LC-13), the NASA New Investigator Program (NAG5-8709), EMBRAPA, the USDA Forest Service, and USAID.
References
Alder D, Silva JNM (2000) An empirical cohort model for
management of Terra Firme forests in the Brazilian Amazon.
Forest Ecology and Management, 130, 141–157.
Alder D, Silva JNM (2002) Sustentabilidade da producao
volumetrica: Um estudo de caso na Floresta Nacional
do Tapajos com o auxılio do modelo de crescimento
794 M . K E L L E R et al.
r 2004 Blackwell Publishing Ltd, Global Change Biology, 10, 784–795
CAFOGROM. In: Silvicultura na Amazonia Oriental: Resultados
do Projeto EMBRAPA/DFID (eds Silva JNM, de Carvalho JOP
& Yared J). EMBRAPA Amazonia Oriental, Belem, Brasil.
Brown IF, Martinelli LA, Thomas WW et al. (1995) Uncertainty in
the biomass of Amazonian forests: an example from Rondo-
nia, Brazil. Forest Ecology and Management, 75, 175–189.
Brown JK (1974) Handbook for Inventorying Downed Woody
Material. USDA Forest Service, Ogden, Utah.
Chambers JQ, Higuchi N, Schimel JP et al. (2000) Decomposition
and carbon cycling of dead trees in tropical forests of the
central Amazon. Oecologia, 122, 380–388.
Chambers JQ, Higuchi N, Tribuzy ES et al. (2001a) Carbon sink
for a century. Nature, 410, 429.
Chambers JQ, Schimel JP, Nobre AD (2001b) Respiration from
coarse wood litter in central Amazon forests. Biogeochemistry,
52, 115–131.
Chambers JQ, Santos J, Ribeiro RJ, Higuchi N (2001c) Tree
damage, allometirc relationships, and above-ground net
primary production in a dense tropical forest. Forest Ecology
and Management, 152, 73–84.
Clark DA, Brown S, Kicklighter DW et al. (2001) NPP in tropical
forests: an evaluation and synthesis of the existing field data.
Ecological Applications, 11, 371–384.
Clark DB, Clark DA, Brown S et al. (2002) Stocks and flows of
coarse woody debris across a tropical rain forest nutrient and
topography gradient. Forest Ecology and Management, 164, 237–
248.
Costa MH, Foley JA (1998) A comparison of precipitation
datasets for the Amazon basin. Geophysical Research Letters, 25,
155–158.
De Vries PG (1986) Sampling Theory for Forest Inventory. A Teach-
Yourself Course. Berlin, Springer-Verlag.
Fearnside PM (1997) Wood density for estimating forest biomass
in Brazilian Amazonia. Forest Ecology and Management, 90,
59–87.
Fernandes ECM, Biot Y, Castilla C et al. (1997) The impact of
selective logging and forest conversion for subsistence
agriculture and pastures on terrestrial nutrient dynamics in
the Amazon. Ciencia e Cultura Journal of the Brazilian Association
for the Advancement of Science, 49, 34–47.
Gerwing JJ (2002) Degradation of forests through logging and
fire in the eastern Brazilian Amazon. Forest Ecology and
Management, 157, 131–141.
Goulden ML, Miller SD, Menton MC et al. (in press) Physiolo-
gical controls on tropical forest CO2 exchange. Ecological
Applications.
Grove SJ (2001) Extent and composition of dead wood in
Australian lowland tropical rainforest with different manage-
ment histories. Forest Ecology and Management, 154, 35–53.
Harmon ME, Whigham DF, Sexton J (1995) Decomposition and
mass of woody detritus in the dry tropical forest of the
Northeastern Yucatan Peninsula, Mexico. Biotropica, 27, 305–
316.
Holmes TP, Blate GM, Zweede JC et al. (2002) Financial and
ecological indicators of reduced impact logging performance
in the eastern Amazon. Forest Ecology and Management, 163,
93–110.
Johns JS, Barreto P, Uhl C (1996) Logging damage during
planned and unplanned logging operations in the eastern
Amazon. Forest Ecology and Management, 89, 59–77.
Keller M, Palace MW, Hurtt G (2001) Biomass estimation in the
Tapajos National Forest, Brazil. Estimation of sampling and
allometric uncertainties. Forest Ecology Management, 154, 371–
382.
Keller M, Silva JMN, Asner GP et al. (in press) Sustainability of
selective logging of upland forests in the Brazilian Amazon:
carbon budgets and remote sensing as tools for evaluation of
logging effects. In: Working Forests in the American Tropics:
Conservation Through Sustainable Management? (eds Zarin DJ,
Alavalapati J, Putz FE, Schmink M), Colombia University
Press, New York.
MacNally R, Parkinson A, Horrocks G et al. (2001) Relationships
between terrestrial vertebrate diversity, abundance and avail-
ability of coarse woody debris on south-eastern Australian
floodplains. Biological Conservation, 99, 191–205.
Nepstad DC, Verissimo A, Alencar A et al. (1999) Large-scale
impoverishment of Amazonian forests by logging and fire.
Nature, 398, 505–508.
Norden B, Paltto H (2001) Wood-decay fungi in hazel wood:
species richness correlated to stand age and dead wood
features. Biological Conservation, 101, 1–8.
Pereira R, Zweede JC, Asner GP et al. (2002) Forest canopy
damage and recovery in reduced impact and conventional
logging in eastern Para, Brazil. Forest Ecology and Management,
168, 77–89.
Phillips OL, Gentry AH (1994) Increasing turnover through time
in tropical forests. Science, 263, 954–958.
Pinard MA, Putz FE (1996) Retaining forest biomass by reducing
logging damage. Biotropica, 28, 278–295.
Rice AH, Pyle EH, Saleska SR et al. (in press) Carbon balance and
vegetation dynamics in an old-growth Amazonian forest.
Ecological Applications.
Ringvall A, Stahl G (1999) Field aspects of line intersect
sampling for assessing coarse woody debris. Forest Ecology
and Management, 119, 163–170.
Sheil D (1995) Evaluating turnover in tropical forests. Science,
268, 894–895.
Silva JNM, Carvalho JPO, de Lopes JCA et al. (1995) Growth and
yield of a tropical rainforest 13 years after logging. Forest
Ecology and Management, 71, 267–274.
Silver WL, Neff J, McGroddy M et al. (2000) Effects of soil texture
on belowground carbon and nutrient storage in a lowland
Amazonian forest ecosystem. Ecosystems, 3, 193–209.
Uhl C, Barreto P, Verissimo A et al. (1997) Natural re-
source management in the Brazilian Amazon. Bioscience, 47,
160–168.
Verissimo A, Barreto P, Mattos M (1992) Logging impacts and
prospects for sustainable forest management in an old
Amazonian frontier: the case of Paragominas. Forest Ecology
and Management, 55, 169–199.
C O A R S E W O O D Y D E B R I S I N T H E E A S T E R N A M A Z O N 795
r 2004 Blackwell Publishing Ltd, Global Change Biology, 10, 784–795
Copyright © 2022 FDOKUMEN