The spatial and temporal scales of local dengue virus ...
14
RESEARCH Open Access The spatial and temporal scales of local dengue virus transmission in natural settings: a retrospective analysis Luigi Sedda 1 , Ana Paula Pessoa Vilela 2,3 , Eric Roberto Guimarães Rocha Aguiar 2,4 , Caio Henrique Pessoa Gaspar 3 , André Nicolau Aquime Gonçalves 2 , Roenick Proveti Olmo 2 , Ana Teresa Saraiva Silva 2 , Lízia de Cássia da Silveira 2 , Álvaro Eduardo Eiras 5 , Betânia Paiva Drumond 3 , Erna Geessien Kroon 3 and João Trindade Marques 2* Abstract Background: Dengue is a vector-borne disease caused by the dengue virus (DENV). Despite the crucial role of Aedes mosquitoes in DENV transmission, pure vector indices poorly correlate with human infections. Therefore there is great need for a better understanding of the spatial and temporal scales of DENV transmission between mosquitoes and humans. Here, we have systematically monitored the circulation of DENV in individual Aedes spp. mosquitoes and human patients from Caratinga, a dengue endemic city in the state of Minas Gerais, in Southeast Brazil. From these data, we have developed a novel stochastic point process pattern algorithm to identify the spatial and temporal association between DENV infected mosquitoes and human patients. Methods: The algorithm comprises of: (i) parameterization of the variogram for the incidence of each DENV serotype in mosquitoes; (ii) identification of the spatial and temporal ranges and variances of DENV incidence in mosquitoes in the proximity of humans infected with dengue; and (iii) analysis of the association between a set of environmental variables and DENV incidence in mosquitoes in the proximity of humans infected with dengue using a spatio-temporal additive, geostatistical linear model. Results: DENV serotypes 1 and 3 were the most common virus serotypes detected in both mosquitoes and humans. Using the data on each virus serotype separately, our spatio-temporal analyses indicated that infected humans were located in areas with the highest DENV incidence in mosquitoes, when incidence is calculated within 2.5–3 km and 50 days (credible interval 30–70 days) before onset of symptoms in humans. These measurements are in agreement with expected distances covered by mosquitoes and humans and the time for virus incubation. Finally, DENV incidence in mosquitoes found in the vicinity of infected humans correlated well with the low wind speed, higher air temperature and northerly winds that were more likely to favor vector survival and dispersal in Caratinga. (Continued on next page) * Correspondence: [email protected] 2 Department of Biochemistry and Immunology, Instituto de Ciências Biológicas, Universidade Federal de Minas Gerais, Belo Horizonte, Minas Gerais 30270-901, Brazil Full list of author information is available at the end of the article © The Author(s). 2018 Open Access This article is distributed under the terms of the Creative Commons Attribution 4.0 International License (http://creativecommons.org/licenses/by/4.0/), which permits unrestricted use, distribution, and reproduction in any medium, provided you give appropriate credit to the original author(s) and the source, provide a link to the Creative Commons license, and indicate if changes were made. The Creative Commons Public Domain Dedication waiver (http://creativecommons.org/publicdomain/zero/1.0/) applies to the data made available in this article, unless otherwise stated. Sedda et al. Parasites & Vectors (2018) 11:79 DOI 10.1186/s13071-018-2662-6
-
Upload
khangminh22 -
Category
Documents
-
view
6 -
download
0
Transcript of The spatial and temporal scales of local dengue virus ...

RESEARCH Open Access
The spatial and temporal scales of localdengue virus transmission in naturalsettings: a retrospective analysisLuigi Sedda1, Ana Paula Pessoa Vilela2,3, Eric Roberto Guimarães Rocha Aguiar2,4, Caio Henrique Pessoa Gaspar3,André Nicolau Aquime Gonçalves2, Roenick Proveti Olmo2, Ana Teresa Saraiva Silva2, Lízia de Cássia da Silveira2,Álvaro Eduardo Eiras5, Betânia Paiva Drumond3, Erna Geessien Kroon3 and João Trindade Marques2*
Abstract
Background: Dengue is a vector-borne disease caused by the dengue virus (DENV). Despite the crucial role ofAedes mosquitoes in DENV transmission, pure vector indices poorly correlate with human infections. Therefore thereis great need for a better understanding of the spatial and temporal scales of DENV transmission betweenmosquitoes and humans. Here, we have systematically monitored the circulation of DENV in individual Aedes spp.mosquitoes and human patients from Caratinga, a dengue endemic city in the state of Minas Gerais, in SoutheastBrazil. From these data, we have developed a novel stochastic point process pattern algorithm to identify thespatial and temporal association between DENV infected mosquitoes and human patients.
Methods: The algorithm comprises of: (i) parameterization of the variogram for the incidence of each DENVserotype in mosquitoes; (ii) identification of the spatial and temporal ranges and variances of DENV incidence inmosquitoes in the proximity of humans infected with dengue; and (iii) analysis of the association between a set ofenvironmental variables and DENV incidence in mosquitoes in the proximity of humans infected with dengue usinga spatio-temporal additive, geostatistical linear model.
Results: DENV serotypes 1 and 3 were the most common virus serotypes detected in both mosquitoes and humans.Using the data on each virus serotype separately, our spatio-temporal analyses indicated that infected humans werelocated in areas with the highest DENV incidence in mosquitoes, when incidence is calculated within 2.5–3 km and50 days (credible interval 30–70 days) before onset of symptoms in humans. These measurements are in agreementwith expected distances covered by mosquitoes and humans and the time for virus incubation. Finally, DENVincidence in mosquitoes found in the vicinity of infected humans correlated well with the low wind speed, higher airtemperature and northerly winds that were more likely to favor vector survival and dispersal in Caratinga.(Continued on next page)
* Correspondence: [email protected] of Biochemistry and Immunology, Instituto de CiênciasBiológicas, Universidade Federal de Minas Gerais, Belo Horizonte, MinasGerais 30270-901, BrazilFull list of author information is available at the end of the article
© The Author(s). 2018 Open Access This article is distributed under the terms of the Creative Commons Attribution 4.0International License (http://creativecommons.org/licenses/by/4.0/), which permits unrestricted use, distribution, andreproduction in any medium, provided you give appropriate credit to the original author(s) and the source, provide a link tothe Creative Commons license, and indicate if changes were made. The Creative Commons Public Domain Dedication waiver(http://creativecommons.org/publicdomain/zero/1.0/) applies to the data made available in this article, unless otherwise stated.
Sedda et al. Parasites & Vectors (2018) 11:79 DOI 10.1186/s13071-018-2662-6

(Continued from previous page)
Conclusions: We have proposed a new way of modeling bivariate point pattern on the transmission of arthropod-borne pathogens between vector and host when the location of infection in the latter is known. This strategy avoidssome of the strong and unrealistic assumptions made by other point-process models. Regarding virus transmission inCaratinga, our model showed a strong and significant association between high DENV incidence in mosquitoes andthe onset of symptoms in humans at specific spatial and temporal windows. Together, our results indicate that vectorsurveillance must be a priority for dengue control. Nevertheless, localized vector control at distances lower than 2.5 kmaround premises with infected vectors in densely populated areas are not likely to be effective.
Keywords: Aedes aegypti, Aedes albopictus, Dengue virus serotypes 1 and 3, Bivariate point-process, Kriging,Geostatistical additive models, Urban dengue
BackgroundDengue is a mosquito-borne viral infection that affects500 million people every year [1]. Considering the largenumber of infections, dengue causes significant mortalityand morbidity worldwide [2, 3]. Three quarters of humaninfections are estimated to be asymptomatic but a smallpercentage of patients can develop a severe and deadlyform of dengue [1]. According to the World HealthOrganization, Brazil currently occupies the first place inthe ranking of reported dengue cases in the world with in-cidence rates increasing since 2004 [4].Dengue virus (DENV) is a positive single-stranded RNA
virus belonging to the genus Flavivirus of the family Flavi-viridae [5]. There are at least four distinct types of DENVthat are genetically related by sharing at least 60% sequencesimilarity (here simply denoted as DENV1, DENV2,DENV3 and DENV4) [6], and co-circulating in severalparts of the world including Brazil [7–9].The DENV transmission cycle involves mosquitoes and
humans, although virus circulation in other vertebrate hostshas also been reported [10, 11]. Aedes aegypti mosquitoesare mostly responsible for the urban transmission cycle [3]while Ae. albopictus have been suggested to have a rolecommunicating sylvatic and urban cycles of DENV [12, 13].Despite the essential role of mosquitoes in DENV transmis-sion, there is little correlation between vector indices andhuman outbreaks [14–17] and hence the importance of thisstudy. DENV transmission is highly dependent on environ-mental variables that influence vector population dynamicsand virus-vector interactions. Macro-scale studies indicatedthat temperature, wind speed and precipitation are relatedto changes in DENV incidence (reviewed in [18]). Vectorsurvival depends on water availability and therefore on pre-cipitation, since larval stages of the mosquito are aquatic[19]. Wind influences flight-related activities of vector mos-quitoes such as host-seeking. In fact, it has been shown thatwind speed above 0.9 m/s seems to discourage nectar-feeding and biting activity [18]. Biting activity, survival rateand extrinsic incubation period (EIP) of the virus in the in-sect vector are all temperature-dependent. Higher tempera-tures reduce the duration of the EIP, increasing the
likelihood of DENV transmission [20]. However, DENVtransmission can only happen if there is contact betweenhumans and mosquitoes, which depends on host-seekingactivities of the vector as well as human mobility [21]. Inparticular, Ae. aegypti is considered a localized vector, withlow dispersal range, i.e. around 60 m or less, and rarely be-yond 500 m [22–25]. On this basis, Ae. aegypti females areexpected to visit no more than two or three houses in theirlifetime thus creating local clusters of DENV infections [26].Finally, Stoddard et al. [27] found that house-to-house hu-man mobility (social connections) played a key role in defin-ing individual infection risk. Therefore, the contact ratebetween humans and infected mosquitoes, and the eco-logical, socio-economic and cultural factors must be consid-ered when inferring the spatial and temporal scales ofDENV transmission [28]. However, most of the studies onDENV transmission have focused only on one dimension,either the spatial scale of mosquito distribution or the tem-poral range of the transmission. Thus, the spatio-temporaldynamics of DENV transmission between mosquitoes andhumans in natural and urban settings remains largely un-known. Nevertheless more effective public health policiesrequire that we understand the scales of DENV circulation,which are essential to help predict and prevent outbreaksby vector control strategies [29]. These are at the momentthe only effective intervention against outbreaks due to theabsence of efficient treatments and vaccines for DENV.The aim of this study was to estimate (i) the spatial and
temporal scales of local dengue transmission in an urbanarea, and (ii) the effect of the environmental factors. For thefirst objective, we first analyzed DENV presence in individ-ual mosquitoes and human patients. Then, in order to esti-mate the values and significance of the spatial and temporalscales of DENV infections in mosquitoes and humans, wedeveloped a bivariate spatio-temporal model. This combineslocal ordinary kriging (a common interpolator, often used topredict the distribution, dispersal, and abundance of mos-quito vectors [22]) of DENV incidence in mosquitoes andpermutation of the locations of human DENV cases. Forthe second aim, we applied a geostatistical additive linearmodel [30] to identify the important environmental factors
Sedda et al. Parasites & Vectors (2018) 11:79 Page 2 of 14

that correlated with DENV incidence in mosquitoes foundin the proximity of human patients. Importantly, our modeldoes not require the restrictive assumptions made by otherspatio-temporal point processes such as marked-pointprocess or inhomogeneous Poisson point process [31].Hence, we have proposed and implemented a novel meth-odological framework that will help our understanding onthe ecology and scales of local DENV transmission in nat-ural settings.
ResultsMosquito collection and analysisBetween August 2010 and July 2011, we performed acomprehensive spatiotemporal survey of mosquitoes inthe city of Caratinga utilizing 158 mosquito trapsevenly distributed throughout the urban area (Fig. 1a).Aedes spp. females represented 95.9% of 763 mosqui-toes captured, which confirms the preference describedfor the traps we utilized [32]. We observed highernumbers of Ae. aegypti (655) females compared to Ae.albopictus (73) as previously observed for urban areas[33–36]. We also captured a small number of male Ae-des mosquitoes (30 Ae. aegypti and one Ae. albopictus)and four Culex mosquitoes. These results are in accord-ance with the types of traps we utilized that were de-signed for highly specific and detailed surveillance ofAedes mosquitoes and not population control [29, 37].Spatially, Aedes mosquitoes were concentrated in thecity center close to the city hall (Fig. 1b). Temporally,there was a sharp increase in mosquito numbers in thetransition from spring to summer and a decrease in thefall (Fig. 1c).Out of the total, we detected 43 Aedes mosquitoes (36
Ae. aegypti females, two Ae. aegypti males and five Ae.albopictus females) that were positive for DENV. Infectionof male mosquitoes is indicative of DENV circulation be-tween mosquitoes but does not directly contribute to virustransmission to humans. Considering only Aedes females,we observed a total DENV prevalence of 5.6%, or 41 indi-viduals out of 728 (Fig. 1d). This number is higher thanobserved in other studies where DENV prevalence inmosquitoes ranged between 0.58 and 1.8% [38–40]. How-ever, our strategy involved sample preparation and testingof individual mosquitoes, which increases the sensitivitycompared to the analysis of mosquito pools in previousstudies [41–44].Regarding the diversity of DENV serotypes, we observed
that the majority of wild Aedes female mosquitoes carriedDENV1 or DENV3 (Fig. 1d). One A. albopictus female waspositive for DENV4 but was not included in further analysisdue to the small numbers. For the subsequent spatio-temporal analyses of DENV transmission, we only consid-ered female Aedes mosquitoes infected with DENV1 andDENV3.
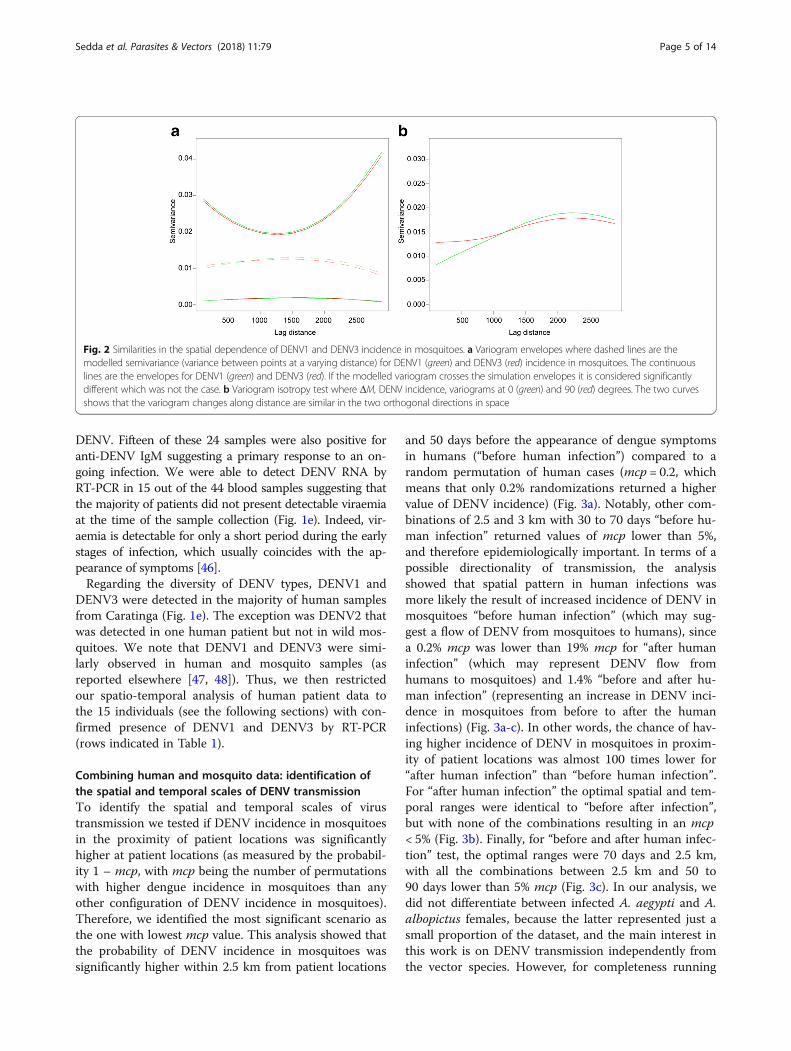
Identification of the parameters of the variograms for thespatial incidence of DENV1 and DENV3 in mosquitoesWe next analyzed the spatial DENV incidence in mosqui-toes by fitting a variogram. A variogram is a function of thevariance of an attribute between point locations, in this caseDENV incidence between trap locations. This variance isusually lower at shorter distances so that closer locationsare more likely to have similar values than locations farapart. The variograms of DENV1 and DENV3 incidence inmosquitoes were fitted with a restricted maximum likeli-hood approach using an exponential function that returnedlowest errors in cross validation (via kriging) (mean error0.0002; mean squared error 0.006). For both DENV1 andDENV3, we also calculated the variogram confidence enve-lopes, which indicate the amount of variation that would beexpected in the case of independence between incidenceand location. Figure 2a shows an almost identical autocor-relation pattern and envelopes for the two DENV serotypes(from 1000 permutations).Since the two variograms are statistically very similar,
we merged the data for DENV1 and DENV3 in a singlevariable, ΔM. This new variable contains the values ofDENV1 incidence in mosquitoes for humans infected withDENV1, and DENV3 incidence in mosquitoes for humanscarrying DENV3; in this manner, we are not averaging theincidence, but unifying them in a single variable. We thentested if this variable is isotropic in space or, in otherwords, if the variogram changes with direction. Figure 2bshows that the variograms at 0 and 90 degrees are verysimilar suggesting that an isotropic model (that does notaccount for direction) can be used for the next analyses.In summary, our results indicate that the incidence of
DENV1 and DENV3 in mosquitoes is characterized by asimilar spatial process, which is invariant with direction(North to South and East to West). The common esti-mated variogram parameters are a spatial range of1.469 km (1.731 km and 1.261 km at 95% permutationinterval), a noise of 0.010 (0.002 and 0.017 at 95% per-mutation interval) and spatially dependent variance of0.006 (0.002 and 0.006 at 95% permutation interval).The observed spatial range of 1.469 km is larger thanthe average dispersal of Aedes mosquitoes [25], butlower than the known spatial scales of Aedes urban geo-graphical distribution [45].
Human data collection and analysisIn total, we analyzed 44 human blood samples representing47% of the dengue patients notified based on symptom-atology by the city of Caratinga for the 2010/2011 out-break. We first analyzed human samples for presence ofDENV-specific antibodies (IgM and IgG) and observedthat 24 out of the 44 (54.5%) were positive for anti-DENVIgG (Table 1). Detection of DENV specific IgG suggeststhat the population in Caratinga had previous contact with
Sedda et al. Parasites & Vectors (2018) 11:79 Page 3 of 14
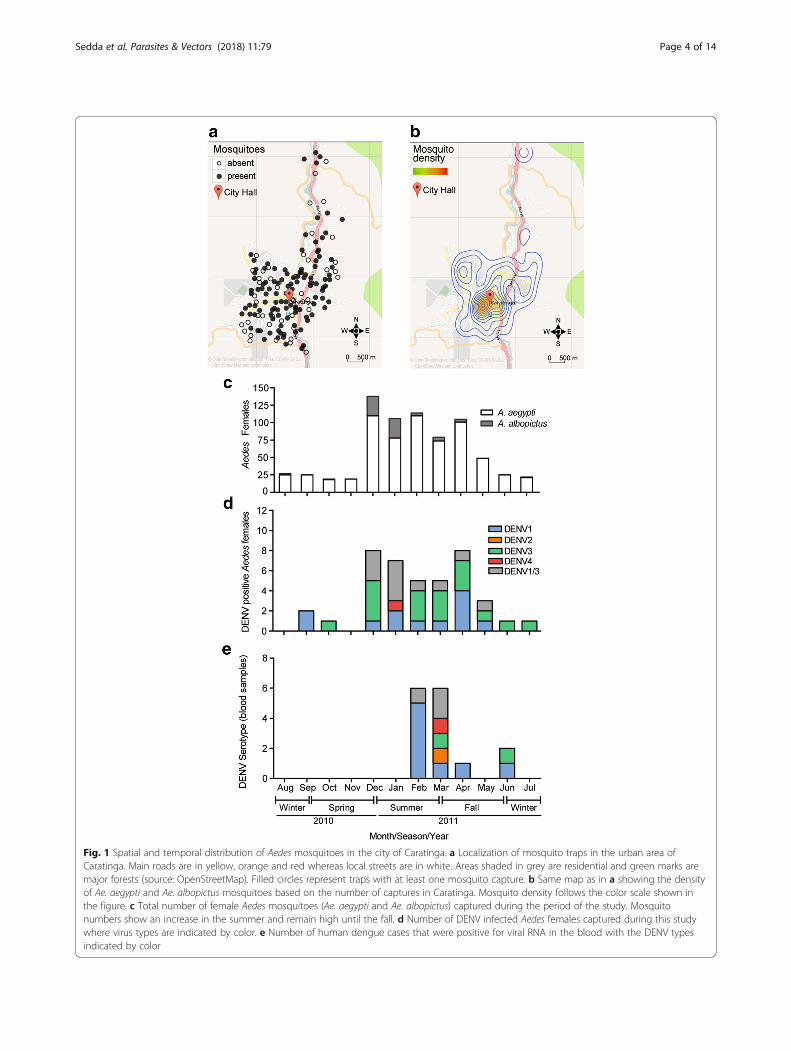
Fig. 1 Spatial and temporal distribution of Aedes mosquitoes in the city of Caratinga. a Localization of mosquito traps in the urban area ofCaratinga. Main roads are in yellow, orange and red whereas local streets are in white. Areas shaded in grey are residential and green marks aremajor forests (source: OpenStreetMap). Filled circles represent traps with at least one mosquito capture. b Same map as in a showing the densityof Ae. aegypti and Ae. albopictus mosquitoes based on the number of captures in Caratinga. Mosquito density follows the color scale shown inthe figure. c Total number of female Aedes mosquitoes (Ae. aegypti and Ae. albopictus) captured during the period of the study. Mosquitonumbers show an increase in the summer and remain high until the fall. d Number of DENV infected Aedes females captured during this studywhere virus types are indicated by color. e Number of human dengue cases that were positive for viral RNA in the blood with the DENV typesindicated by color
Sedda et al. Parasites & Vectors (2018) 11:79 Page 4 of 14
DENV. Fifteen of these 24 samples were also positive foranti-DENV IgM suggesting a primary response to an on-going infection. We were able to detect DENV RNA byRT-PCR in 15 out of the 44 blood samples suggesting thatthe majority of patients did not present detectable viraemiaat the time of the sample collection (Fig. 1e). Indeed, vir-aemia is detectable for only a short period during the earlystages of infection, which usually coincides with the ap-pearance of symptoms [46].Regarding the diversity of DENV types, DENV1 and
DENV3 were detected in the majority of human samplesfrom Caratinga (Fig. 1e). The exception was DENV2 thatwas detected in one human patient but not in wild mos-quitoes. We note that DENV1 and DENV3 were simi-larly observed in human and mosquito samples (asreported elsewhere [47, 48]). Thus, we then restrictedour spatio-temporal analysis of human patient data tothe 15 individuals (see the following sections) with con-firmed presence of DENV1 and DENV3 by RT-PCR(rows indicated in Table 1).
Combining human and mosquito data: identification ofthe spatial and temporal scales of DENV transmissionTo identify the spatial and temporal scales of virustransmission we tested if DENV incidence in mosquitoesin the proximity of patient locations was significantlyhigher at patient locations (as measured by the probabil-ity 1 – mcp, with mcp being the number of permutationswith higher dengue incidence in mosquitoes than anyother configuration of DENV incidence in mosquitoes).Therefore, we identified the most significant scenario asthe one with lowest mcp value. This analysis showed thatthe probability of DENV incidence in mosquitoes wassignificantly higher within 2.5 km from patient locations
and 50 days before the appearance of dengue symptomsin humans (“before human infection”) compared to arandom permutation of human cases (mcp = 0.2, whichmeans that only 0.2% randomizations returned a highervalue of DENV incidence) (Fig. 3a). Notably, other com-binations of 2.5 and 3 km with 30 to 70 days “before hu-man infection” returned values of mcp lower than 5%,and therefore epidemiologically important. In terms of apossible directionality of transmission, the analysisshowed that spatial pattern in human infections wasmore likely the result of increased incidence of DENV inmosquitoes “before human infection” (which may sug-gest a flow of DENV from mosquitoes to humans), sincea 0.2% mcp was lower than 19% mcp for “after humaninfection” (which may represent DENV flow fromhumans to mosquitoes) and 1.4% “before and after hu-man infection” (representing an increase in DENV inci-dence in mosquitoes from before to after the humaninfections) (Fig. 3a-c). In other words, the chance of hav-ing higher incidence of DENV in mosquitoes in proxim-ity of patient locations was almost 100 times lower for“after human infection” than “before human infection”.For “after human infection” the optimal spatial and tem-poral ranges were identical to “before after infection”,but with none of the combinations resulting in an mcp< 5% (Fig. 3b). Finally, for “before and after human infec-tion” test, the optimal ranges were 70 days and 2.5 km,with all the combinations between 2.5 km and 50 to90 days lower than 5% mcp (Fig. 3c). In our analysis, wedid not differentiate between infected A. aegypti and A.albopictus females, because the latter represented just asmall proportion of the dataset, and the main interest inthis work is on DENV transmission independently fromthe vector species. However, for completeness running
Fig. 2 Similarities in the spatial dependence of DENV1 and DENV3 incidence in mosquitoes. a Variogram envelopes where dashed lines are themodelled semivariance (variance between points at a varying distance) for DENV1 (green) and DENV3 (red) incidence in mosquitoes. The continuouslines are the envelopes for DENV1 (green) and DENV3 (red). If the modelled variogram crosses the simulation envelopes it is considered significantlydifferent which was not the case. b Variogram isotropy test where ΔM, DENV incidence, variograms at 0 (green) and 90 (red) degrees. The two curvesshows that the variogram changes along distance are similar in the two orthogonal directions in space
Sedda et al. Parasites & Vectors (2018) 11:79 Page 5 of 14
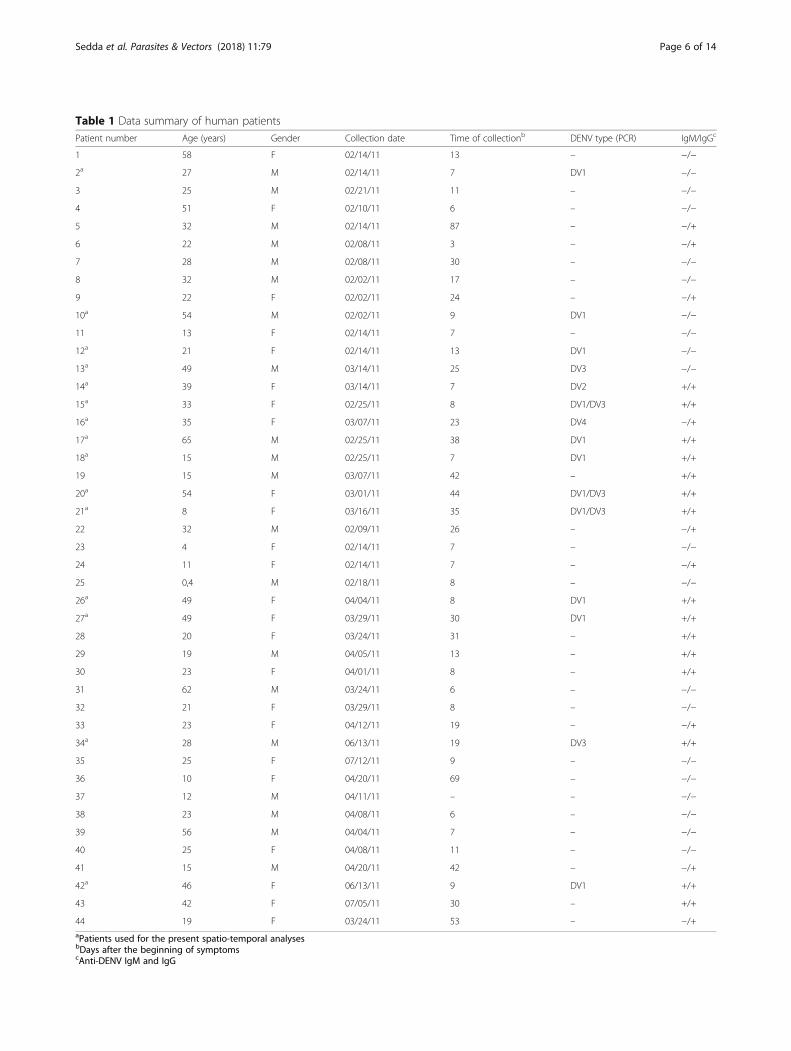
Table 1 Data summary of human patients
Patient number Age (years) Gender Collection date Time of collectionb DENV type (PCR) IgM/IgGc
1 58 F 02/14/11 13 – −/−
2a 27 M 02/14/11 7 DV1 −/−
3 25 M 02/21/11 11 – −/−
4 51 F 02/10/11 6 – −/−
5 32 M 02/14/11 87 – −/+
6 22 M 02/08/11 3 – −/+
7 28 M 02/08/11 30 – −/−
8 32 M 02/02/11 17 – −/−
9 22 F 02/02/11 24 – −/+
10a 54 M 02/02/11 9 DV1 −/−
11 13 F 02/14/11 7 – −/−
12a 21 F 02/14/11 13 DV1 −/−
13a 49 M 03/14/11 25 DV3 −/−
14a 39 F 03/14/11 7 DV2 +/+
15a 33 F 02/25/11 8 DV1/DV3 +/+
16a 35 F 03/07/11 23 DV4 −/+
17a 65 M 02/25/11 38 DV1 +/+
18a 15 M 02/25/11 7 DV1 +/+
19 15 M 03/07/11 42 – +/+
20a 54 F 03/01/11 44 DV1/DV3 +/+
21a 8 F 03/16/11 35 DV1/DV3 +/+
22 32 M 02/09/11 26 – −/+
23 4 F 02/14/11 7 – −/−
24 11 F 02/14/11 7 – −/+
25 0,4 M 02/18/11 8 – −/−
26a 49 F 04/04/11 8 DV1 +/+
27a 49 F 03/29/11 30 DV1 +/+
28 20 F 03/24/11 31 – +/+
29 19 M 04/05/11 13 – +/+
30 23 F 04/01/11 8 – +/+
31 62 M 03/24/11 6 – −/−
32 21 F 03/29/11 8 – −/−
33 23 F 04/12/11 19 – −/+
34a 28 M 06/13/11 19 DV3 +/+
35 25 F 07/12/11 9 – −/−
36 10 F 04/20/11 69 – −/−
37 12 M 04/11/11 – – −/−
38 23 M 04/08/11 6 – −/−
39 56 M 04/04/11 7 – −/−
40 25 F 04/08/11 11 – −/−
41 15 M 04/20/11 42 – −/+
42a 46 F 06/13/11 9 DV1 +/+
43 42 F 07/05/11 30 – +/+
44 19 F 03/24/11 53 – −/+aPatients used for the present spatio-temporal analysesbDays after the beginning of symptomscAnti-DENV IgM and IgG
Sedda et al. Parasites & Vectors (2018) 11:79 Page 6 of 14

the same framework only for A. aegypti mosquitoes, weobtained the same optimal spatial and temporal ranges,and spatial credible interval (2.5–3 km), but with largercredible interval for the temporal range (20–70 days)than “before human infection”.
Modeling the association between environmental variablesand DENV incidence in mosquitoes around patientlocations: a spatio-temporal additive, geostatistical, linearmodelThe spatio-temporal modeling of the association betweenenvironmental variables and DENV incidence in mosqui-toes 50 days before human infections and 2.5 km aroundpatient locations was then analyzed. We note that this ana-lysis is limited by the small sample size since we had to useonly data for DENV1 and DENV3 infections in mosquitoesand humans. However, the combinations of mosquito sur-vey sites and human locations at 2.5 km and 50 days, gener-ated a dataset of slightly more than 1000 records.Our results showed that there were three environmental
variables, wind speed (P-value of 0.03), wind direction (P-value of 10−7) and air temperature (P-value of 0.002) thatsignificantly correlated with spatiotemporal DENV inci-dence in mosquitoes in proximity of patient locations(Table 2). The cross validation test for spatio-temporaladditive, geostatistical and linear model considering theenvironmental variables returned a mean error of 0.0008,a mean squared error of 0.003 and a mean squared devi-ation ratio of 0.999 (ideal value 1). The mean error andmean squared error are 2 and 8% of the incidence mean(0.036), respectively.
DiscussionTo our knowledge, this is the first report on the analysis onthe spatial and temporal scales of DENV transmission
between mosquitoes and humans in a small urban setting.We surveyed individual mosquitoes over a one-year periodthroughout most of a small urban area and analyzed a sig-nificant number of human samples collected during theconcurrent dengue outbreak providing important informa-tion about the complexity of DENV circulation in mosqui-toes and humans. Previous attempts focused on analyzingthe clustering pattern of human dengue cases without tak-ing into account vector populations or DENV incidence inmosquitoes (e.g. [49–51]). An exception to this can befound in [52], where the authors investigated the numberof human dengue cases per district and the relative mos-quito density (but not DENV incidence in mosquitoes),using a generalized linear mixed model. In addition, only afew studies have characterized the distribution of DENVtypes detected in mosquitoes and humans during the sameoutbreak [53, 54].Despite the lack of research in the spatio-temporal scales
of DENV transmission, it is well accepted that early warn-ing systems and disease surveillance may benefit from thisinformation [55, 56]. Dengue epidemiological surveillancein Brazil has often taken into account vector density andthe number of people infected with DENV [57]. The formeris estimated by the Breteau Index (BI), which is the numberof positive containers per 100 houses inspected. For the hu-man dengue cases, the WHO suggested the “endemicchannel” rule, which identifies an outbreak if the number ofcases reported is larger than two standard deviations abovethe “endemic channel” (weekly or monthly average inci-dence in the previous 5 to 7 years) in weekly or monthly re-ports [58]. During an outbreak, a perifocal spraying strategyis often utilized where insecticide is applied around 400 mradius of the residence where a human was detected withdengue. As pointed out by the WHO guidelines, this ap-proach does not account for the time delay between when
Fig. 3 Probability of DENV incidence in mosquitoes around patient locations. We calculated whether the probability that DENV incidence inmosquitoes around patient locations was larger than in other permutation of the locations “before human infection” (a), “after human infection”(b) or “before and after human infection” (c). The highest observed probability (1-mcp) was concentrated between 2.5 and 3 km spatial range and30 to 70 days temporal range, with a maximum at 2.5 km and 50 days (red area) in the model “before human infection”
Sedda et al. Parasites & Vectors (2018) 11:79 Page 7 of 14

a person is infective to mosquitoes and the appearance ofsymptoms. In addition, the large number of asymptomaticcases and the capacity of infected people to transportDENV over longer distances more rapidly than infectedmosquitoes pose a serious limitation to the efficacy of peri-focal spraying [26]. It is noteworthy that our sampling de-sign and statistical method do not allow us to estimatewhat proportion of the variance in incidence falls withinthe 400 m range. However, the spatial range of 1.5 km sug-gests that transmission occurs more at neighborhood thanhousehold level. Therefore, the radius of perifocal sprayingshould be extended, unless areas at higher risk of infectionsare known prior to an intervention.We tested if DENV incidence in mosquitoes around lo-
cations where humans were detected with dengue washigher “before human infection”, “after human infection”or “before and after human infection”. We found that thestrongest association of an increase in DENV incidence inmosquitoes occurred “before human infection”. Theweaker association between DENV incidence in mosqui-toes “after human infection” may suggest saturation of theinfection in the mosquito population. In addition, vectorcontrol interventions after the start of the human out-break can contribute to suppress DENV incidence in mos-quitoes resulting in low values “after human infection”.Our results indicated a strong spatiotemporal correlation
between incidence of DENV in mosquitoes and the appear-ance of human dengue cases in Caratinga. The approachdescribed in this paper was accurate in identifying thespatial range of transmission but proved less robust in iden-tifying the temporal range. Human infections were stronglyassociated with higher incidence of DENV in mosquitoeswithin 2.5–3 km around patient location (optima at2.5 km) and 30–70 days (optima at 50 days) “before humaninfection”. Difficulties in sampling infected mosquitoes anddetecting infected individuals could have affected our abilityto determine a temporal range closer to the extrinsic incu-bation period, which would be more intuitive. Nevertheless,temporal heterogeneity has been shown in other studies[22]. For example, Pepin et al. [52] found a temporal rangeof two to 13 weeks between the peak in mosquito densityand human infections. Other analyses, focused only on theclusters of human cases, found a temporal lag from 2 to10 weeks [59, 60]. Certainly, the minimum amount of timenecessary from when the a mosquito acquires DENV to thepoint when it transmits it to a human and the human
becoming infectious is generally 2 weeks under favorableclimate conditions. However, host-seeking activities and therelative low rate of successful transmission can extend thetime lag to well above the two to 3 weeks window [52]. Fi-nally, the temporal accuracy of our results is probably af-fected by the technique employed for DENV detection inwhole mosquitoes, which does not distinguish whether thevector is infectious to humans at the time of collection.Regarding spatial ranges, we observed 1.5 km for infected
mosquitoes and 2.5 km for DENV transmission betweenmosquitoes and humans. These ranges are larger thansome vector distribution and local transmission studies, butare certainly smaller than other medium and large-scaleanalyses [19, 60]. The distribution of the traps cannot haveaffected the optimal spatial range since they are homoge-neously distributed every ~ 0.2 km2 (this accounts for Aedesdispersal, estimated to be 800 m every 6 days [61]) andabundant around each patient location (32 to 82 traps)[62]. The size of the urban area, human mobility, asymp-tomatic cases and vector control interventions (eliminationof potential breeding containers, spraying insecticide whichtend to disperse the clustered distribution of mosquitoes)could explain why DENV infections in humans are notclustered. The sparsity of human dengue cases is confirmedby the negatively skewed distribution of the spatial rangestowards large values (Fig. 3). All these factors may havecontributed to identify a medium-scale of 2.5 km range asmost significant [21, 27, 63]. A priori knowledge abouthousehold commuting behavior could improve the identifi-cation of the spatial range for transmission and help defin-ing zones for targeted control, especially if the scales ofhuman movement exceed that of the vectors.The ecological analysis (Table 2) confirmed the import-
ance of warm air temperature (in agreement with [64]) andlow wind speed in DENV transmission. Indeed, winds aregenerally an important component in mosquito dispersaland host-seeking strategy [65]. The importance of low windspeed in increasing DENV incidence has been found inBrazil [66, 67] and many other countries including Australia[68], Sri Lanka [69], Barbados [70], Pakistan [71], China[72], Malaysia [73] and Vietnam [74]. In our dataset, winddirection was positively associated to DENV incidence inmosquitoes. This means that winds from the North andNortheast (which are the predominant winds in Caratinga,according to the climatological normal from INMET) weremore likely associated with high DENV incidence in
Table 2 Estimated coefficients for important variables associated with DENV incidence in mosquitoes around patient locations
Model Coefficients Estimate Standard error P-value
DENV incidence in Aedes mosquitoes Intercept 0.210 0.064 0.001
Wind speed -0.013 0.006 0.03
Wind direction 0.003 0.000 10−7
Air Temperature 0.006 0.002 0.002
Sedda et al. Parasites & Vectors (2018) 11:79 Page 8 of 14
mosquitoes. Remarkably, wind direction is the only variablepresent in all the five best models (in terms of mean errorin cross validation), followed by temperature (four out offive best models) and wind speed (two out of five models)(Additional file 1: Table S1). Relative humidity was not se-lected in the first two models, but has higher frequency(three out of five best models) than wind speed. The totalnumber of mosquitoes caught by the traps was not signifi-cant in the best five models.We also applied a non-spatial model (simple general lin-
ear regression) to analyze DENV transmission betweenmosquitoes and humans. This model showed similar fit-ting results for wind speed and direction but did not per-form better than the spatial model (Additional file 1: TableS1). However, the effect of temperature is inverted (lowertemperature associated with larger incidence) due to thefact that the variance is not adjusted for the spatialautocorrelation.Finally, we found a weak trend (P = 0.08) on the ques-
tion whether infections were simply due to a larger mos-quito density around patient locations “before humaninfection” as suggested by several studies [57, 75]. Thisresult confirms the unclear association between purevector indices and DENV incidence in humans and rein-forces the importance of directly monitoring mosquitoinfection [76]. However, considering the difficulties insampling and identifying infected mosquitoes, surveil-lance based solely on mosquito abundance may still beuseful in assessing overall risk, especially when used withother epidemiological parameters.It is important to point out that our work has some
limitations including: (i) small number of samples forhuman patients and DENV infected mosquitoes; (ii) thefact we did not analyze asymptomatic humans that con-tribute to DENV circulation and can represent 50–90%of all infections [1]; (iii) the possibility that DENV cir-culates in other vertebrate hosts [10]; and (iv) the effectof human mobility [27, 63]. Due to the spatial and tem-poral scale of the DENV epidemic in Caratinga, it ispossible that traps with recorded infected mosquitoes,are considered at the same time in different patient lo-cations. Although this is true, we have not found par-ticular traps recurring more often than others. In fact,60% of the traps are recurring in more than 50% of thepatient locations. In addition, the fact that we tested forrandomness of spatial and temporal scales within differ-ent scenarios (“before human infection”, “after humaninfection” and “before and after human infection”) hascertainly reduced the risk of bias. However, since ouranalysis only focused on the comparison between sce-narios and the accuracy of the obtained parameters, itis possible that additional transmission components,such as human mobility, could significantly change ourparameterization.
We observed no evidence that DENV serotypes influ-ence the spatial process (autocorrelation) of infectedmosquitoes (Fig. 2a). This result must be confirmed (es-pecially due to the small sample size), since some sero-types may influence mosquito behavior [77]. In contrast,as found elsewhere (e.g. [78]), the distribution of mos-quitoes infected with different DENV serotypes is patchyand localized to a small proportion of the territory whenthe spatial autocorrelation is accounted for.
ConclusionsDengue is currently the most prevalent viral disease in theworld. Mosquito control strategies can have a significantimpact on transmission although vector indices show littlecorrelation with human outbreaks [14]. Thus, better un-derstanding of DENV circulation between mosquitoes andhumans in natural settings is required. More accurate esti-mations of the spatial scales of DENV transmission canhelp design more efficient surveillance and vector controlsystems. The method proposed in this work was able toinfer parameters of DENV transmission that are coherentwith experimental analysis in the laboratory. Our spatio-temporal analysis indicates that local incidence of DENVin mosquitoes is a great indicator of the probability of hu-man dengue cases and should be a major target for sur-veillance strategies meant to raise preparedness sincelocalized vector control interventions are not likely towork. Altogether, this work contributes to the understand-ing of the spatial and temporal transmission of DENV inendemic urban areas. The developed framework can beused for any spatiotemporal process with reference points(in statistics, those points containing only the informationof presence, like the patient locations) when no initial as-sumptions about reference (patient) and target (mosquitotraps) points can be made.
MethodsStudy areaThe study was conducted in the municipality of Caratingalocated in the east of Minas Gerais state, SoutheasternBrazil (19°47′24"S, 42°08′20"W). Caratinga has a total ter-ritorial extension of 1,258,778 km2 with approximately90,000 inhabitants. Atlantic forest is the biome of the mu-nicipality with 21 °C median annual temperature and 80%humidity (data from the Brazilian Ministry of Agriculture,INMET) [79]. Caratinga is a dengue endemic region with1274, 91, 409 and 51 confirmed human cases each yearfrom 2007 to 2010 prior to this study (data from theBrazilian Ministry of Health, SINAN) [80].
Mosquito collectionWe took advantage of a mosquito monitoring system thathas been utilized by Caratinga and other municipalities inthe state of Minas Gerais [37]. This system uses mosquito
Sedda et al. Parasites & Vectors (2018) 11:79 Page 9 of 14

traps known as MosquiTRAP [29, 81] that are placed300 m apart, following a 300 × 300 m grid design, in astudy area. Traps are placed outdoors, usually in the frontor backyard of the property where access is restricted.Traps are never placed in open areas accessible to the gen-eral public. Whenever the 300 m distance between trapscould not be achieved, traps were placed in a distance ofless than 300 m, never more than this limit. In Caratinga,158 MosquiTRAPs were installed at an average density of5.15 traps/km2 (3.2–12.5 traps/km2, 95% confidence inter-val) [29]. These traps covered 14.2 km2 of the urban andperi-urban areas of the city of Caratinga (Fig. 1). BetweenAugust 2010 and July 2011, traps were inspected by localhealth authorities once a week and each captured mos-quito was collected and visually classified by species andgender [82]. Mosquitoes were individually stored in liquidN2 before being processed for RNA extraction using Tri-zol reagent (Invitrogen, Carlsbad, USA).
Human blood samplesIn order to compare DENV circulation in mosquitoes tohuman dengue, we obtained blood samples from patientsthat sought medical attention in the city of Caratinga be-tween February and July of 2011, concomitantly with mos-quito captures. Human samples were collected byprofessional nurses employed by the health system of Car-atinga as part of a city surveillance plan. Blood sampleswere collected at home from patients that had any denguerelated symptoms such as fever, anorexia, myalgia, arthral-gia and headaches and requested assistance. We obtained44 samples representing 47% of the 94 patients thatsought medical attention by health professionals from thecity of Caratinga. Samples were collected at different timesafter the appearance of symptoms ranging from 3 to87 days. Blood samples were mixed with EDTA as an anti-coagulant and stored at 4 °C. Serum was obtained fromblood samples and inactivated at 56 °C for 30 min. Inacti-vated serum was tested for the presence of DENV specificIgM and IgG utilizing the Panbio Dengue IgM CaptureELISA (Alere, Waltham, USA) and Dengue IgG ELISATest (HUMAN Diagnostics, Wiesbaden, Germany). Foreach patient, we utilized information of time and locationbased the date of onset of symptoms and home addressreported to health authorities. Total RNA extraction fromhuman blood samples was performed using Trizol LS Re-agent (Invitrogen). Unlinked anonymous testing of humanblood samples was approved by the ethics committee inresearch (COEP) of Universidade Federal de Minas Gerais(number 415/04 to EGK).
DENV detection by RT-qPCR and RT-PCRRNA extracted from whole mosquitoes and humanblood samples were screened for the presence ofDENV RNA by RT-qPCR. For this purpose, we
designed specific primers targeting a conserved regionin the 5’ UTR of the DENV genome of different virustypes (Additional file 2: Table S2). Samples thatshowed DENV amplification by RT-qPCR were subse-quently tested using a previously described nestedRT-PCR strategy [83]. This strategy utilizes DENVgeneric primers on the first PCR followed by a sec-ond reaction using primers targeting a region of theNS5 gene that are specific for each virus type (Add-itional file 2: Table S2). Reverse transcription was per-formed using total RNA (200 ng to 1 μg) andrandom primers (300 ng/μl) using MMLV reversetranscriptase. qPCR was performed using Power SYBRGreen I (Applied Biosystems, Foster City, USA) and2 pmol of specific primers. Conventional PCR wasperformed using 10 pmol of gene specific primers.Importantly, in the case of mosquitoes, our strategy isnot able to infer whether individuals are infective atthe time of collection.
Statistical analysesStatistical analyses comprised: (A) parameterization ofthe variogram for incidence of each DENV serotypein mosquitoes and analysis of their differences; (B) es-timation of the spatial and temporal scales in localDENV transmission and calculation of their signifi-cance by 10,000 permutations of patient locations(home addresses of each human case was used as pa-tient location); and (C) spatio-temporal additive, geos-tatistical, linear model on the incidence of DENV inmosquitoes found around patient locations and usingenvironmental data.Abundance of adult female mosquitoes is considered the
most appropriate measure of entomological risk [26].Therefore, we did not use two DENV infected and 31 unin-fected Aedes males in our spatiotemporal analysis. Weconsidered females of Ae. aegypti combined with Ae. albo-pictus, since we were more interested in the regionaldynamics of DENV transmission and not specific contribu-tions of each vector. However, we recognize that the twovectors have a different ecology and behavior that can affectthe spatial and temporal scales of DENV transmission [84,85]. We compared our results using both mosquito speciesto Ae. aegypti alone and observed no major differences. Aseparate analysis of Ae. albopictus was not possible due tothe limited amount of traps with infected (only five foundin two traps) and uninfected Ae. albopictus, which are pre-dominantly located on the edges of the city.We used the variogram parameterization from (A) to
inform kriging (value of a function at a given point bycomputing a weighted average of the known values ofthe function in the neighborhood of the point) in (B).Then we used the spatial and temporal ranges obtainedin (ii) to produce the response variable for (C).
Sedda et al. Parasites & Vectors (2018) 11:79 Page 10 of 14

Parameterization of the variogramFor each mosquito trap we calculated the incidence ofDENV in mosquitoes (which is the ratio between numberof infected mosquitoes for each DENV serotype and thetotal number of captured individuals in a trap in a week).DENV incidence in mosquito variogram parameters (tem-poral range, t, and spatial range s) are fitted with a re-stricted maximum likelihood approach [86] using aspatio-temporal exponential function, where d and h arethe spatial and temporal Euclidian distances, respectively,between trap locations.
γ s; tð Þ ¼ exp −ds
þ ds
ht−ht
� �
The exponential function form was chosen since itreturned the lowest errors in cross validation (via kri-ging) compared to spherical and Gneiting functions[87]. We tested if there were any differences in thespatio-temporal process (in terms of variogramparameterization) of the incidence for each DENVserotype in mosquitoes. To evaluate this, we per-muted data values of DENV incidence at the spatiallocations to produce upper and lower envelopes ofthe variogram for each virus type [88, 89]. We thenassumed that the variograms of DENV serotypes areidentical if the area within the lower and upper enve-lopes overlap by 95%. Finally we explored the pres-ence of anisotropy (i.e. when the spatial variationaround each point have a component of direction) byplotting the variograms at different directions [90].
Spatial and temporal scales in local DENV transmission andtheir statistical significanceThe spatial and temporal ranges of DENV transmis-sion were estimated by finding those scales thatmaximize the predicted mean incidence of DENV inmosquitoes at the patient location, i.e. the geograph-ical coordinates at the exact home address, comparedto the predicted mean from a set of permutations ofpatient locations. In practice:
1. Define a grid of spatial and temporal ranges.2. For each spatial and temporal range
combination:a. For each patient location, select those
mosquito traps (and relative DENV incidence)within the selected spatial and temporal rangesaround the patient, and considering only themosquitoes infected with the same DENVserotype detected in the patient.
b. For each patient location, v, apply localordinary kriging [using the parameterizationobtained from section (A)] to the DENV
incidences selected in the previous step toestimate the value of incidence, I v (krigingapplied individually). The mean of theestimated values, F1, is:
F1 ¼ 1N
XN
v¼1I v
where N is the total number of patients.
c. Create a variable “count” equal to 0.d. Repeat for 9999 times:
i. Permute the location of human patients in time(e.g. swapping the time of human infectionbetween locations)
ii. Recalculate (a) and (b)iii. If the new mean of the kriging fitted values is larger
than F1, then add 1 to count.
e. Calculate mcp, the probability that DENV incidencein mosquitoes in permuted locations is higher thanthe one at the original patient locations:
mcp ¼ count=10; 000
f. Go to (a) with a new spatial and temporal rangecombination. If all the spatial and temporal rangecombinations are explored, then stop.
A lower mcp indicates lower probability that there is analternative spatio-temporal configuration of the human pa-tient locations with larger DENV incidence in mosquitoes.This algorithm was repeated for temporal ranges before thehuman infection (thereafter “before human infection”), afterhuman infection (thereafter “after human infection”) orboth (thereafter “before and after human infection”).Preliminary analyses on mosquito spatial and temporal
variogram restricted the exploration of spatial ranges be-tween 0.5 and 5 km and temporal ranges between 0 and100 days [30]. These spatial and temporal ranges are at thelow and high limits expected for mosquito-human interac-tions in DENV transmission [52]. Finally mosquito DENVincidence within the optimized spatial and temporal rangefrom human patient location, ΔM, were selected as re-sponse variable for the next step of the analysis.
Spatio-temporal additive, geostatistical, linear model on theincidence of DENV incidence in mosquitoes around humanpatient locationsAn additive, geostatistical, linear model was applied to theincidence of DENV in mosquitoes at survey locations inproximity (in space and time) of infected patient locations,ΔM, as described in [30] but without autoregressive term
Sedda et al. Parasites & Vectors (2018) 11:79 Page 11 of 14
and random effects. The additive, geostatistical, linearmodel contains a matrix of covariates X (fixed effects); aspatiotemporal correlation effect, Z; and an error compo-nent ε:
ΔMq;u ¼ βX þ Z þ ε
Z∼Nð0; σ2z γðs; tÞÞ
ε∼N 0; σ2ε I� �
therefore:
ΔMq;u∼N βX; σ2z γ s; tð Þ þ σ2ε I� �
where the subscripts q and u indicate the location and thetime of the patient event, respectively; β is a vector of co-efficients for X; Z is a one column vector with spatio-temporal normally distributed random effects with meanzero and a covariance matrix given by the product of thespatial variance, σ2z , and the correlation matrix, γ . Asshown above, γ is expressed as a function of the spatialcorrelation parameter, s, defining the spatial range of ΔM;and the temporal correlation, t, defining the temporalrange of ΔM. Finally, ε is the independent and identicallynormally distributed error, with error variance σ2ε I. Thecandidate covariates in X are total number of mosquitoes,temperature, atmospheric pressure, wind speed, wind dir-ection, and relative humidity. Important variables were se-lected based on the improvement of the mean standarderror in cross-validation from the total 63 possible combi-nations between variables.Model validation was performed by leave-one-out
cross validation, for which we produced three statistics:the mean error, the mean squared error and the meansquared deviation ratio (full description in [30]).
Additional files
Additional file 1: Table S1. Selection results for linear and non-linearmodels. (PDF 76 kb)
Additional file 2: Table S2. Oligonucleotides primers utilized for PCRamplification of specific targets. (PDF 91 kb)
AbbreviationsDENV: Dengue virus; EDTA: Ethylenediaminetetraacetic acid;ELISA: Enzyme-linked immunosorbent assay; IgG: Immunoglobulin G;IgM: Immunoglobulin M; RNA: Ribonucleic acid; RT-PCR: Reversetranscription polymerase chain reaction
AcknowledgmentsWe thank Luciano Moreira for providing reagents, Karla Pollyanna Vieirade Oliveira for technical help, Ecovec LTDA for installing the mosquitotrap system in Caratinga, and Viv Dillon for reviewing the manuscript.We are also indebted to Eduardo Pessanha (in memoriam) and HealthSurveillance authorities in the city of Caratinga for mosquito capturesand blood sample collections.
FundingThis work was supported with grants from CAPES, CNPq and FAPEMIG toEGK and JTM. EGK and JTM are researchers from CNPq.
Availability of data and materialsThe datasets used and/or analyzed during the current study are availablefrom the corresponding author upon request.
Authors’ contributionsConceived and designed the experiments: APPV, EGK and JTM. Performedthe experiments: APPV, CHPG, RPO, ATSS and LCS. Conceived and designedthe statistical analysis: LS. Analyzed the data: LS, APPV, ERGRA, ANAG, BPD,EGK and JTM. Contributed reagents/materials/analysis tools: AEE, EGK andJTM. Wrote the paper: LS, APPV, ERGRA, EGK and JTM. All authors read andapproved the final manuscript.
Ethics approval and consent to participateUnlinked anonymous testing of human blood samples was approved by theethics committee in research (COEP) of Universidade Federal de Minas Gerais(number 415/04 to EGK). Human blood samples were utilized in accordancewith the approved guidelines from the ethics committee.
Consent for publicationNot applicable.
Competing interestsThe authors declare that they have no competing interests.
Publisher’s NoteSpringer Nature remains neutral with regard to jurisdictional claims inpublished maps and institutional affiliations.
Author details1Centre for Health Information Computation and Statistics (CHICAS), FurnessBuilding, Lancaster University, Lancaster LA1 4YG, UK. 2Department ofBiochemistry and Immunology, Instituto de Ciências Biológicas, UniversidadeFederal de Minas Gerais, Belo Horizonte, Minas Gerais 30270-901, Brazil.3Department of Microbiology, Instituto de Ciências Biológicas, UniversidadeFederal de Minas Gerais, Belo Horizonte, Minas Gerais 30270-901, Brazil.4Present Address: Instituto de Ciências da Saúde, Universidade Federal daBahia, Salvador, Bahia 40110-100, Brazil. 5Department of Parasitology, Institutode Ciências Biológicas, Universidade Federal de Minas Gerais, Belo Horizonte,Minas Gerais 30270-901, Brazil.
Received: 25 July 2017 Accepted: 19 January 2018
References1. Bhatt S, Gething PW, Brady OJ, Messina JP, Farlow AW, Moyes CL, et al. The
global distribution and burden of dengue. Nature. 2013;496(7446):504–7.2. Gubler DJ. Dengue, urbanization and globalization: the unholy trinity of the
21st century. Trop Med Health. 2011;39(Suppl. 4):3–11.3. Kraemer MU, Sinka ME, Duda KA, Mylne A, Shearer FM, Brady OJ, et al. The
global compendium of Aedes aegypti and Ae. albopictus occurrence. SciData. 2015;2:150035.
4. Fares RC, Souza KP, Anez G, Rios M. Epidemiological scenario of dengue inBrazil. Biomed Res Int. 2015;2015:321873.
5. Weaver SC, Vasilakis N. Molecular evolution of dengue viruses: contributionsof phylogenetics to understanding the history and epidemiology of thepreeminent arboviral disease. Infec Genet Evol. 2009;9(4):523–40.
6. Chambers TJ, Hahn CS, Galler R, Rice CM. Flavivirus genome organization,expression, and replication. Annu Rev Microbiol. 1990;44(1):649–88.
7. Villabona-Arenas CJ, Zanotto PM. Worldwide spread of dengue virus type 1.PLoS One. 2013;8(5):e62649.
8. Heringer M, Nogueira RM, de Filippis AM, Lima MR, Faria NR, Nunes PC, etal. Impact of the emergence and re-emergence of different dengue viruses’serotypes in Rio de Janeiro, Brazil, 2010 to 2012. Trans R Soc Trop Med Hyg.2015;109(4):268–74.
9. Drumond BP, Mondini A, Schmidt DJ, de Morais Bronzoni RV, Bosch I,Nogueira ML. Circulation of different lineages of dengue virus 2, genotype
Sedda et al. Parasites & Vectors (2018) 11:79 Page 12 of 14
American/Asian in Brazil: dynamics and molecular and phylogeneticcharacterization. PLoS One. 2013;8(3):e59422.
10. de Thoisy B, Lacoste V, Germain A, Munoz-Jordan J, Colon C, Mauffrey JF,et al. Dengue infection in neotropical forest mammals. Vector BorneZoonotic Dis. 2009;9(2):157–70.
11. Diallo M, Ba Y, Sall AA, Diop OM, Ndione JA, Mondo M, et al. Amplificationof the sylvatic cycle of dengue virus type 2, Senegal, 1999-2000:entomologic findings and epidemiologic considerations. Emerg Infect Dis.2003;9(3):362–7.
12. Whitehorn J, Kien DT, Nguyen NM, Nguyen HL, Kyrylos PP, Carrington LB,et al. Comparative susceptibility of Aedes albopictus and Aedes aegypti todengue virus infection after feeding on blood of viremic humans:implications for public health. J Infec Dis. 2015;212(8):1182–90.
13. Richards SL, Anderson SL, Alto BW. Vector competence of Aedes aegypti andAedes albopictus (Diptera: Culicidae) for dengue virus in the Florida keys.J Med Entomol. 2012;49(4):942–6.
14. Bowman LR, Runge-Ranzinger S, McCall PJ. Assessing the relationshipbetween vector indices and dengue transmission: a systematic review ofthe evidence. PLoS Negl Trop Dis. 2014;8(5):e2848.
15. de Melo DP, Scherrer LR, Eiras AE. Dengue fever occurrence and vectordetection by larval survey, ovitrap and MosquiTRAP: a space-time clustersanalysis. PLoS One. 2012;7(7):e42125.
16. Sanchez L, Vanlerberghe V, Alfonso L, Marquetti Mdel C, Guzman MG, BissetJ, et al. Aedes aegypti larval indices and risk for dengue epidemics. EmergInfect Dis. 2006;12(5):800–6.
17. Chadee DD. Dengue cases and Aedes aegypti indices in Trinidad, WestIndies. Acta Trop. 2009;112(2):174–80.
18. Wong GK, Jim C. Urban-microclimate effect on vector mosquito abundanceof tropical green roofs. Build Environ. 2017;112:63–76.
19. Costa ACC, Codeco CT, Honorio NA, Pereira GR, Pinheiro CFN, Nobre AA.Surveillance of dengue vectors using spatio-temporal Bayesian modeling.BMC Med Inform Decis. 2015;15(93):1–12.
20. Wong GK, Jim C. Do vegetated rooftops attract more mosquitoes?Monitoring disease vector abundance on urban green roofs. Sci TotalEnviron. 2016;573:222–32.
21. Karl S, Halder N, Kelso JK, Ritchie SA, Milne GJ. A spatial simulation modelfor dengue virus infection in urban areas. BMC Infect Dis. 2014;14:447.
22. Azil AH, Bruce D, Williams CR. Determining the spatial autocorrelation ofdengue vector populations: influences of mosquito sampling method,covariables, and vector control. J Vector Ecol. 2014;39(1):153–63.
23. Nino L. Use of the function semivariogram and kriging estimation in thespacial analysis of Aedes aegypti (Diptera: Culicidae) distributions. Biomedica.2008;28(4):578–86.
24. Mercado-Hernandez R, Fernandez-Salas I, Villarreal-Martinez H. Spatialdistribution of the larval indices of Aedes aegypti in Guadalupe, Nuevo Leon,Mexico, with circular distribution analysis. J Am Mosq Control Assoc.2003;19(1):15–8.
25. Magori K, Legros M, Puente ME, Focks DA, Scott TW, Lloyd AL, et al. Skeeterbuster: a stochastic, spatially explicit modeling tool for studying Aedesaegypti population replacement and population suppression strategies.PLoS Negl Trop Dis. 2009;3(9):e508.
26. Getis A, Morrison AC, Gray K, Scott TW. Characteristics of the spatial patternof the dengue vector, Aedes aegypti, in Iquitos, Peru. Am J Trop Med Hyg.2003;69(5):494–505.
27. Stoddard ST, Forshey BM, Morrison AC, Paz-Soldan VA, Vazquez-ProkopecGM, Astete H, et al. House-to-house human movement drives dengue virustransmission. Proc Natl Acad Sci USA. 2013;110(3):994–9.
28. Viennet E, Ritchie SA, Faddy HM, Williams CR, Harley D. Epidemiology ofdengue in a high-income country: a case study in Queensland, Australia.Parasit Vectors. 2014;7:379.
29. Pepin KM, Marques-Toledo C, Scherer L, Morais MM, Ellis B, Eiras AE. Cost-effectiveness of novel system of mosquito surveillance and control, Brazil.Emerg Infect Dis. 2013;19(4):542–50.
30. Sedda L, Qi Q, Tatem AJ. A geostatistical analysis of the associationbetween armed conflicts and Plasmodium falciparum malaria in Africa,1997–2010. Malar J. 2015;14:500.
31. Diggle PJ. Statistical analysis of spatial and spatio-temporal point patterns.England: CRC Press; 2013.
32. Favaro EA, Dibo MR, Mondini A, Ferreira AC, Barbosa AA, Eiras AE, et al.Physiological state of Aedes (Stegomyia) aegypti mosquitoes captured withMosquiTRAPs in Mirassol, Sao Paulo, Brazil. J Vector Ecol. 2006;31(2):285–91.
33. Cecilio SG, Junior WF, Totola AH, de Brito Magalhaes CL, Ferreira JM, deMagalhaes JC. Dengue virus detection in Aedes aegypti larvae fromsoutheastern Brazil. J Vector Ecol. 2015;40(1):71–4.
34. da Rocha Taranto MF, Pessanha JE, dos Santos M, Ddos Santos PereiraAndrade AC, Camargos VN, Alves SN, et al. Dengue outbreaks in Divinopolis,south-eastern Brazil and the geographic and climatic distribution of Aedesalbopictus and Aedes aegypti in 2011-2012. Trop Med Int Health: TM & IH.2015;20(1):77–88.
35. Piovezan R, Rosa SL, Rocha ML, de Azevedo TS, Von Zuben CJ.Entomological surveillance, spatial distribution, and diversity of Culicidae(Diptera) immatures in a rural area of the Atlantic Forest Biome, State of SaoPaulo, Brazil. J Vector Ecol. 2013;38(2):317–25.
36. Mwangangi JM, Midega J, Kahindi S, Njoroge L, Nzovu J, Githure J, et al.Mosquito species abundance and diversity in Malindi, Kenya and their potentialimplication in pathogen transmission. Parasitol Res. 2012;110(1):61–71.
37. Eiras AE, Resende MC. Preliminary evaluation of the “dengue-MI” technologyfor Aedes aegypti monitoring and control. Cad Saude Publica. 2009;25(1):14.
38. Vilela AP, Figueiredo LB, dos Santos JR, Eiras AE, Bonjardim CA, Ferreira PC,et al. Dengue virus 3 genotype I in Aedes aegypti mosquitoes and eggs,Brazil, 2005–2006. Emerg Infect Dis. 2010;16(6):989–92.
39. Vikram K, Nagpal BN, Pande V, Srivastava A, Saxena R, Singh H, et al.Detection of dengue virus in individual Aedes aegypti mosquitoes in Delhi,India. J Vector Borne Dis. 2015;52(2):129–33.
40. Urdaneta L, Herrera F, Pernalete M, Zoghbi N, Rubio-Palis Y, Barrios R, et al.Detection of dengue viruses in field-caught Aedes aegypti (Diptera:Culicidae) in Maracay, Aragua state, Venezuela by type-specific polymerasechain reaction. Infec Genet Evol. 2005;5(2):177–84.
41. Chow VT, Chan YC, Yong R, Lee KM, Lim LK, Chung YK, et al. Monitoring ofdengue viruses in field-caught Aedes aegypti and Aedes albopictusmosquitoes by a type-specific polymerase chain reaction and cyclesequencing. Am J Trop Med Hyg. 1998;58(5):578–86.
42. Le Goff G, Revollo J, Guerra M, Cruz M, Barja Simon Z, Roca Y, et al. Naturalvertical transmission of dengue viruses by Aedes aegypti in Bolivia. Parasite.2011;18(3):277–80.
43. Figueiredo ML, Alfonso HL, Amarilla AA, Figueiredo LT, Aquino VH, CostaCA, et al. Detection of DENV-4 genotype I from mosquitoes collected in thecity of Manaus, Brazil. Virol J. 2013;10:60.
44. Chen CF, Shu PY, Teng HJ, Su CL, Wu JW, Wang JH, et al. Screening ofdengue virus in field-caught Aedes aegypti and Aedes albopictus (Diptera:Culicidae) by one-step SYBR green-based reverse transcriptase-polymerasechain reaction assay during 2004–2007 in southern Taiwan. Vector BorneZoonotic Dis. 2010;10(10):1017–25.
45. Higa Y. Dengue vectors and their spatial distribution. Trop Med Health.2011;39(4 Suppl):17–27.
46. Guzman MG, Halstead SB, Artsob H, Buchy P, Farrar J, Gubler DJ, et al. Dengue:a continuing global threat. Nat Rev Microbiol. 2010;8(Suppl. 12):S7–16.
47. Gaye A, Faye O, Diagne CT, Faye O, Diallo D, Weaver SC, et al. Oralsusceptibility of Aedes aegypti (Diptera: Culicidae) from Senegal for dengueserotypes 1 and 3 viruses. Trop Med Int Health: TM & IH. 2014;19(11):1355–9.
48. Pepin KM, Lambeth K, Hanley KA. Asymmetric competitive suppressionbetween strains of dengue virus. BMC Microbiol. 2008;8:28.
49. Wijayanti SPM, Porphyre T, Chase-Topping M, Rainey SM, McFarlane M,Schnettler E, et al. The importance of socio-economic versus environmentalrisk factors for reported dengue cases in Java, Indonesia. PLoS Negl TropDis. 2016;10(9):e0004964.
50. Telle O, Vaguet A, Yadav NK, Lefebvre B, Daude E, Paul RE, et al. The spread ofdengue in an endemic urban milieu-the case of Delhi, India. PLoS One. 2016;11(1):e0146539.
51. Naish S, Dale P, Mackenzie JS, McBride J, Mengersen K, Tong SL. Spatial andtemporal patterns of locally-acquired dengue transmission in northernQueensland, Australia, 1993–2012. PLoS One. 2014;9(4):e92524.
52. Pepin KM, Leach CB, Marques-Toledo C, Laass KH, Paixao KS, Luis AD, et al.Utility of mosquito surveillance data for spatial prioritization of vector controlagainst dengue viruses in three Brazilian cities. Parasit Vectors. 2015;8:98.
53. de Castro MG, de Nogueira FB, Nogueira RM, Lourenco-de-Oliveira R,dos Santos FB. Genetic variation in the 3′ untranslated region ofdengue virus serotype 3 strains isolated from mosquitoes and humansin Brazil. Virol J. 2013;10:3.
54. Mondini A, de Moraes Bronzoni RV, Nunes SH, Chiaravalloti Neto F, Massad E,Alonso WJ, et al. Spatio-temporal tracking and phylodynamics of an urbandengue 3 outbreak in Sao Paulo, Brazil. PLoS Negl Trop Dis. 2009;3(5):e448.
Sedda et al. Parasites & Vectors (2018) 11:79 Page 13 of 14
55. Racloz V, Ramsey R, Tong SL, Hu WB. Surveillance of dengue fever virus: areview of epidemiological models and early warning systems. PLoS NeglTrop Dis. 2012;6(5):e1648
56. Wen T-H, Lin M-H, Teng H-J, Chang N-T. Incorporating the human-Aedes mosquito interactions into measuring the spatial risk of urbandengue fever. Appl Geog. 2015;62:256–66.
57. Vargas WP, Kawa H, Sabroza PC, Soares VB, Honorio NA, de Almeida AS.Association among house infestation index, dengue incidence, andsociodemographic indicators: surveillance using geographic informationsystem. BMC Public Health. 2015;15:746.
58. WHO. Dengue: guidelines for diagnosis, treatment, prevention and control.Geneva: WHO; 2009.
59. Kan CC, Lee PF, Wen TH, Chao DY, Wu MH, Lin NH, et al. Two clusteringdiffusion patterns identified from the 2001–2003 dengue epidemic,Kaohsiung, Taiwan. Am J Trop Med Hyg. 2008;79(3):344–52.
60. Estallo EL, Carbajo AE, Grech MG, Frias-Cespedes M, Lopez L, Lanfri MA, etal. Spatio-temporal dynamics of dengue 2009 outbreak in Cordoba City,Argentina. Acta Trop 2014; 136:129–36.
61. Honorio NA, Da Costa SW, Leite PJ, Goncalves JM, Lounibos LP, Lourenco-de-Oliveira R. Dispearsal of Aedes aegypti and Aedes albopictus (Diptera:Culicidae) in an urban endemic dengue area in the state of Rio de Janeiro,Brazil. Mem Inst Oswaldo Cruz. 2003;98(2):191–8.
62. Sun CC, Fuller AK, Royle JA. Trap configuration and spacing influences parameterestimates in spatial capture-recapture models. PLoS One. 2014;9(2):e88025.
63. Barmak DH, Dorso CO, Otero M. Modelling dengue epidemic spreadingwith human mobility. Physica A. 2016;447:129–40.
64. Halstead SB. Dengue virus-mosquito interactions. Annu Rev Entomol. 2008;53:273–91.
65. Cummins B, Cortez R, Foppa IM, Walbeck J, Hyman JM. A spatial model ofmosquito host-seeking behavior. PLoS Comput Biol. 2012;8(5):e1002500.
66. Simoes TC, Codeco CT, Nobre AA, Eiras AE. Modeling the non-stationaryclimate dependent temporal dynamics of Aedes aegypti. PLoS One. 2013;8(8):e64773.
67. Rosa-Freitas MG, Schreiber KV, Tsouris P, de Souza Weimann ET, Luitgards-Moura JF. Associations between dengue and combinations of weatherfactors in a city in the Brazilian Amazon. Rev Panam Salud Publica. 2006;20(4):256–67.
68. Vazquez-Prokopec GM, Kitron U, Montgomery B, Horne P, Ritchie SA.Quantifying the spatial dimension of dengue virus epidemic spread withina tropical urban environment. PLoS Negl Trop Dis. 2010;4(12):e920.
69. Talagala T. Distributed lag nonlinear modelling appraoch to identifyrelationship between climatic factors and dengue incidence in Colombodisrict, Sri Lanka. Epidemiol Biostat Public Health. 2015;12(4):e11522.
70. Depradine C, Lovell E. Climatological variables and the incidence of denguefever in Barbados. Int J Environ Health Res. 2004;14(6):429–41.
71. Khalid B, Ghaffar A. Dengue transmission based on urban environmentalgradients in different cities of Pakistan. Int J Biometeorol. 2015;59(3):267–83.
72. Wang C, Jiang B, Fan J, Wang F, Liu Q. A study of the dengue epidemic andmeteorological factors in Guangzhou, China, by using a zero-inflatedPoisson regression model. Asia-Pac J Public Health. 2014;26(1):48–57.
73. Cheong YL, Burkart K, Leitao PJ, Lakes T. Assessing weather effects on denguedisease in Malaysia. Int J Environ Res Public Health. 2013;10(12):6319–34.
74. Cuong HQ, Hien NT, Duong TN, Phong TV, Cam NN, Farrar J, et al.Quantifying the emergence of dengue in Hanoi, Vietnam: 1998–2009. PLoSNegl Trop Dis. 2011;5(9):e1322.
75. Taber ED, Hutchinson ML, Smithwick EAH, Blanford JI. A decade ofcolonization: the spread of the Asian tiger mosquito in Pennsylvania andimplications for disease risk. J Vector Ecol. 2017;42(1):3–12.
76. Morin CW, Comrie AC, Ernst K. Climate and dengue transmission: evidenceand implications. Environ Health Perspect. 2013;121(11–12):1264–72.
77. Maciel-de-Freitas R, Sylvestre G, Gandini M, Koella JC. The influence ofdengue virus serotype-2 infection on Aedes aegypti (Diptera: Culicidae)motivation and avidity to blood feed. PLoS One. 2013;8(6):e65252.
78. Méndez-Galván J, Sánchez-Casas RM, Gaitan-Burns A, Díaz-González EE,Ibarra-Juarez LA, Garza CEM, et al. Detection of Aedes aegypti mosquitoesinfected with dengue virus as a complementary method for increasing thesensitivity of surveillance: identification of serotypes 1, 2, and 4 by RT-PCR inQuintana Roo, Mexico. Southwest Entomol. 2014;39(2):307–16.
79. Instituto Nacional de Metereologia. Ministerio da Agricultura, Pecuaria eAbastecimento do Brasil. 2015. http://www.inmet.gov.br/portal. Accessed1 Oct 2015.
80. DATASUS–Sinan. Ministerio da Saude. 2016. http://tabnet.datasus.gov.br/cgi/deftohtm.exe?sinannet/dengue/bases/denguebrnet.def. Accessed 15Jan 2016.
81. Degener CM, de Azara TMF, Roque RA, Rosner S, Rocha ESO, Kroon EG, etal. Mass trapping with MosquiTRAPs does not reduce Aedes aegyptiabundance. Mem Inst Oswaldo Cruz. 2015;110(4):517–27.
82. Consoli RAGB, Oliveira RL. Principais mosquitos de importância sanitária noBrasil. Rio de Janeiro: Editora FIOCRUZ; 1994.
83. de Morais Bronzoni RV, Baleotti FG, Ribeiro Nogueira RM, Nunes M, MoraesFigueiredo LT. Duplex reverse transcription-PCR followed by nested PCRassay for detection and identification of Brazilian alphaviruses andflaviviruses. J Clin Microbiol. 2005;43(2):7.
84. Kraemer MU, Sinka ME, Duda KA, Mylne AQ, Shearer FM, Barker CM, et al.The global distribution of the arbovirus vectors Aedes aegypti and Ae.albopictus. elife. 2015;4:e08347.
85. Honorio NA, Castro MG, Barros FS, Magalhaes Mde A, Sabroza PC. Thespatial distribution of Aedes aegypti and Aedes albopictus in a transitionzone, Rio de Janeiro, Brazil. Cad Saude Publica. 2009;25(6):1203–14.
86. Pinheiro JC, Bates DJ, D DebRoy S, Sakar D. The Nlme package: linear andnonlinear mixed effects models, R version 3, vol. 6; 2012.
87. Cressie N. Statistics for spatial data. Hoboken: Wiley; 2015.88. Schlather M. Construction of covariance functions and unconditional
simulation of random fields. In: Porcu E, Montero JM, Schlather M, editors.Advances and challenges in space-time modelling of natural events. Berlin:Springer Berlin Heidelberg; 2012. p. 25–54.
89. Diggle P, Ribeiro PJ. Model-based Geostatistics. New York: Springer; 2007.90. Zimmerman DL. Another look at anisotropy in geostatistics. Math Geol.
1993;25(4):453–70.
• We accept pre-submission inquiries
• Our selector tool helps you to find the most relevant journal
• We provide round the clock customer support
• Convenient online submission
• Thorough peer review
• Inclusion in PubMed and all major indexing services
• Maximum visibility for your research
Submit your manuscript atwww.biomedcentral.com/submit
Submit your next manuscript to BioMed Central and we will help you at every step:
Sedda et al. Parasites & Vectors (2018) 11:79 Page 14 of 14