Spatial mapping of temporal risk characteristic of dengue cases in Subang Jaya
10
Spatial mapping of temporal risk characteristics to improve environmental health risk identification: A case study of a dengue epidemic in Taiwan Tzai-Hung Wen a , Neal H. Lin b , Chun-Hung Lin a , Chwan-Chuen King b , Ming-Daw Su a, ⁎ a Department of Bioenvironmental Systems Engineering, National Taiwan University, Taipei, Taiwan b Institute of Epidemiology, College of Public Health, National Taiwan University, Taipei, Taiwan Received 24 November 2005; received in revised form 6 February 2006; accepted 7 February 2006 Available online 11 April 2006 Abstract Mapping uneven events, such as disease cases or pollutants, is a basic but important procedure for analyzing regional relationships and variation in public health and environmental agencies. The purpose of mapping is to find out the spatial clustering of uneven events and identify spatial risk areas, which could lead to potential environmental hazards or epidemics. Meanwhile, more hypotheses could be generated through mapping process for further investigations. This paper proposed a novel spatial–temporal approach to focusing on: (1) how often these uneven cases occur, (2) how long these cases persist and (3) how significant cases occur in consecutive periods across the study area. The proposed model was applied to the dengue fever epidemic in Taiwan in 2002 as a case study, which was the worst epidemic in the last 60 years. This approach provides procedures to identify spatial health risk levels with temporal characteristics and assists in generating hypothesis that will be investigated in further detail. © 2006 Elsevier B.V. All rights reserved. Keywords: Spatial risk assessment; Spatial–temporal clustering; Geographic information systems (GIS) 1. Introduction Mapping uneven events, such as disease cases or pollutants, makes it possible for public administrators to discover the origin of pollution or source of epidemic outbreaks and generate more hypotheses for further investigations. More importantly, it may spatially identify the high-risk areas, which can be targeted for environmental hazards and public health prevention. Mapping has been made easier and become more wisely used with the development of geographical information systems (GIS). However, mapping provides only a visual display of the uneven cases, but cannot definitively confirm clustering of cases or spatial correlations. Spatial statistics is extensively used to find relationship of case rates Science of the Total Environment 367 (2006) 631 – 640 www.elsevier.com/locate/scitotenv ⁎ Corresponding author. Department of Bioenvironmental Systems Engineering, National Taiwan University, No. 1, Sec. 4, Rd. Roosevelt, Taipei City, Taiwan 10617. Tel.: +886 2 2363 1108; fax: +886 2 2363 5854. E-mail address: [email protected] (M.-D. Su). 0048-9697/$ - see front matter © 2006 Elsevier B.V. All rights reserved. doi:10.1016/j.scitotenv.2006.02.009
-
Upload
independent -
Category
Documents
-
view
1 -
download
0
Transcript of Spatial mapping of temporal risk characteristic of dengue cases in Subang Jaya

ent 367 (2006) 631–640www.elsevier.com/locate/scitotenv
Science of the Total Environm
Spatial mapping of temporal risk characteristics to improveenvironmental health risk identification: A case study of a dengue
epidemic in Taiwan
Tzai-Hung Wen a, Neal H. Lin b, Chun-Hung Lin a,Chwan-Chuen King b, Ming-Daw Su a,⁎
a Department of Bioenvironmental Systems Engineering, National Taiwan University, Taipei, Taiwanb Institute of Epidemiology, College of Public Health, National Taiwan University, Taipei, Taiwan
Received 24 November 2005; received in revised form 6 February 2006; accepted 7 February 2006Available online 11 April 2006
Abstract
Mapping uneven events, such as disease cases or pollutants, is a basic but important procedure for analyzing regionalrelationships and variation in public health and environmental agencies. The purpose of mapping is to find out the spatialclustering of uneven events and identify spatial risk areas, which could lead to potential environmental hazards or epidemics.Meanwhile, more hypotheses could be generated through mapping process for further investigations. This paper proposed anovel spatial–temporal approach to focusing on: (1) how often these uneven cases occur, (2) how long these cases persist and(3) how significant cases occur in consecutive periods across the study area. The proposed model was applied to the denguefever epidemic in Taiwan in 2002 as a case study, which was the worst epidemic in the last 60 years. This approach providesprocedures to identify spatial health risk levels with temporal characteristics and assists in generating hypothesis that will beinvestigated in further detail.© 2006 Elsevier B.V. All rights reserved.
Keywords: Spatial risk assessment; Spatial–temporal clustering; Geographic information systems (GIS)
1. Introduction
Mapping uneven events, such as disease cases orpollutants, makes it possible for public administratorsto discover the origin of pollution or source of
⁎ Corresponding author. Department of Bioenvironmental SystemsEngineering, National Taiwan University, No. 1, Sec. 4, Rd.Roosevelt, Taipei City, Taiwan 10617. Tel.: +886 2 2363 1108; fax:+886 2 2363 5854.
E-mail address: [email protected] (M.-D. Su).
0048-9697/$ - see front matter © 2006 Elsevier B.V. All rights reserved.doi:10.1016/j.scitotenv.2006.02.009
epidemic outbreaks and generate more hypotheses forfurther investigations. More importantly, it mayspatially identify the high-risk areas, which can betargeted for environmental hazards and public healthprevention. Mapping has been made easier andbecome more wisely used with the development ofgeographical information systems (GIS). However,mapping provides only a visual display of the unevencases, but cannot definitively confirm clustering ofcases or spatial correlations. Spatial statistics isextensively used to find relationship of case rates

632 T.-H. Wen et al. / Science of the Total Environment 367 (2006) 631–640
and their geographical location (Croner et al., 2000).Point pattern analysis is a method often employed inthe detection of clustering patterns. Since points mayrepresent actual locations of uneven events, themethod involves in the issue of privacy (Maheswanand Haining, 2004). Risk surface estimation, includ-ing kernel estimation and geostatistical methods,produces continuous surfaces of risk across thewhole study areas and potentially offer more insightinto the nature of the clusters (Bithell, 1990, 1999;Diggle, 2000). However, mapping the spatial clustersof uneven events is a static snapshot, which ignoresthe temporal kinetics of these uneven events, and it isdifficult to evaluate whether the hazards or epidemicshave been broken out or kept under control bypolicymakers. Time-series statistical techniques, suchas Box-Jenkins (seasonal) autoregressive integratedmoving average (ARIMA) models, are used toforecast the outbreak of uneven cases or to estimatethe expected incidence values (Zeger et al., 2004;Earnest et al., 2005). But these kinds of approachescould not provide clues for identification of spatialrisk areas. This paper intends to propose a spatial–temporal risk model for mapping geographic distri-bution of uneven events with temporally definedindices to improve health risks identifications. Themodel focuses on three temporal risk characteristicsacross geographic space: (1) how often these unevencases occur, (2) how long these cases persist and (3)how significant cases occurring in consecutiveperiods. This model will be applied to the denguefever epidemic in Taiwan in 2002 as a case study,which is the worst epidemic in the last 60 years.
Dengue is a member of flavivirus with four knownantigenically distinct serotypes and is vectored mainlyby domestically adapted mosquito species, specificallyAedes aegypti. Environmental risk factors, includingwater storage containers, housing patterns and frequen-cy of waste disposal, etc., reflect the condition ofenvironmental health in certain area (Bohra andAndrianasolo, 2001). These risk factors could havepotential to cause more mosquito breeding sites, whichmight lead to an outbreak of dengue epidemic.However, routinely monitoring environmental riskfactors is not feasible for public health and environmentagencies. Therefore, this study only used dengue case-incidence data, including onset date of a confirmeddengue case and its geographic location, collected byofficial surveillance systems to investigate whether theapproach will improve the detection of environmentalhealth risk areas and the evaluation of vector ormosquito control measures.
2. Materials and methods
2.1. Study area and data
Kaohsiung City, located in southern Taiwan, is thesecond largest metropolitan city, the largest commercialharbor and an important land, marine and air transpor-tation hub. Fig. 1 shows the location of Kaohsiung Cityand one of its satellite cities, Fengshan City. This two-city area was used as our study area because it was themajor dengue epidemic foci in southern Taiwan. Thestudy focused on dengue cases based on surveillancedata, which reported 4790 confirmed dengue cases(DEN), including 4574 dengue fever (DF) cases and 216dengue hemorrhagic fever (DHF) cases, from April toDecember in the year of 2002 (Wu et al., 2003). Theregistered population for this two-city area was used asthe control population. Fig. 2 illustrates the temporalprogression of DEN and DHF cases for the 2002calendar-year, but it gave no clues on the interplaybetween temporal and the spatial distribution of thesecases.
2.2. Spatial and temporal units to summarize case-incidence data
A Li, the smallest administrative unit in Taiwan, wasused as the spatial mapping unit. This study involved542 Li, and most Li in urban region cover an area ofbetween 0.26 and 0.58 km2, and have 2100–5300 popu-lations or 850–1600 households (DGBAS, 2005).
The Center for Disease Control-Taiwan (CDC-Taiwan) summarized dengue cases on a weekly basis.Therefore, our study used a week as temporal unit forbetter comparison on different indices. Case data wereprovided by the CDC-Taiwan. Personal identifiers wereremoved for privacy concern but the spatial locationswere preserved for mapping and analysis purposes.These data were then summarized by Li to avoid theexact locations of patients and thus further protect theirprivacy.
2.3. Temporal risk indices
The occurrence of disease can be described aseither a sporadic or clustering event, both temporallyand spatially. An infectious disease epidemic mayresult from intensive contact with the contagion, theenvironment or other risk factors depending on themode of transmission for that specific disease(Giesecke, 2001). A number of indicators are usedto measure the magnitude and severity of an epidemic,
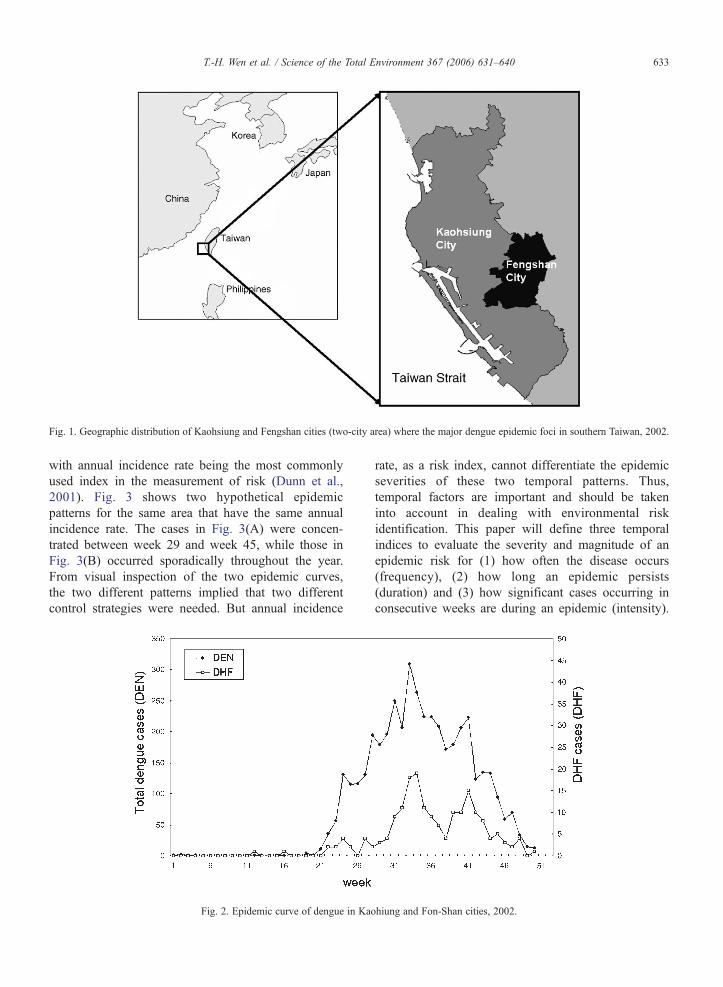
Fig. 1. Geographic distribution of Kaohsiung and Fengshan cities (two-city area) where the major dengue epidemic foci in southern Taiwan, 2002.
633T.-H. Wen et al. / Science of the Total Environment 367 (2006) 631–640
with annual incidence rate being the most commonlyused index in the measurement of risk (Dunn et al.,2001). Fig. 3 shows two hypothetical epidemicpatterns for the same area that have the same annualincidence rate. The cases in Fig. 3(A) were concen-trated between week 29 and week 45, while those inFig. 3(B) occurred sporadically throughout the year.From visual inspection of the two epidemic curves,the two different patterns implied that two differentcontrol strategies were needed. But annual incidence
Fig. 2. Epidemic curve of dengue in Kao
rate, as a risk index, cannot differentiate the epidemicseverities of these two temporal patterns. Thus,temporal factors are important and should be takeninto account in dealing with environmental riskidentification. This paper will define three temporalindices to evaluate the severity and magnitude of anepidemic risk for (1) how often the disease occurs(frequency), (2) how long an epidemic persists(duration) and (3) how significant cases occurring inconsecutive weeks are during an epidemic (intensity).
hiung and Fon-Shan cities, 2002.
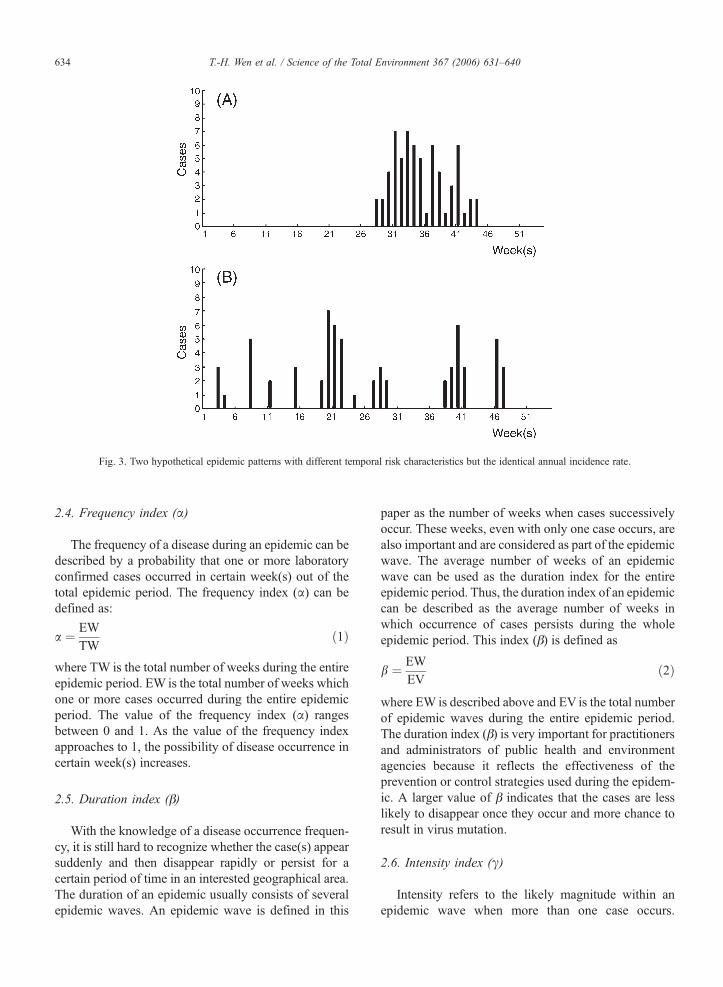
Fig. 3. Two hypothetical epidemic patterns with different temporal risk characteristics but the identical annual incidence rate.
634 T.-H. Wen et al. / Science of the Total Environment 367 (2006) 631–640
2.4. Frequency index (α)
The frequency of a disease during an epidemic can bedescribed by a probability that one or more laboratoryconfirmed cases occurred in certain week(s) out of thetotal epidemic period. The frequency index (α) can bedefined as:
a ¼ EWTW
ð1Þ
where TW is the total number of weeks during the entireepidemic period. EW is the total number of weeks whichone or more cases occurred during the entire epidemicperiod. The value of the frequency index (α) rangesbetween 0 and 1. As the value of the frequency indexapproaches to 1, the possibility of disease occurrence incertain week(s) increases.
2.5. Duration index (β)
With the knowledge of a disease occurrence frequen-cy, it is still hard to recognize whether the case(s) appearsuddenly and then disappear rapidly or persist for acertain period of time in an interested geographical area.The duration of an epidemic usually consists of severalepidemic waves. An epidemic wave is defined in this
paper as the number of weeks when cases successivelyoccur. These weeks, even with only one case occurs, arealso important and are considered as part of the epidemicwave. The average number of weeks of an epidemicwave can be used as the duration index for the entireepidemic period. Thus, the duration index of an epidemiccan be described as the average number of weeks inwhich occurrence of cases persists during the wholeepidemic period. This index (β) is defined as
b ¼ EW
EVð2Þ
where EW is described above and EV is the total numberof epidemic waves during the entire epidemic period.The duration index (β) is very important for practitionersand administrators of public health and environmentagencies because it reflects the effectiveness of theprevention or control strategies used during the epidem-ic. A larger value of β indicates that the cases are lesslikely to disappear once they occur and more chance toresult in virus mutation.
2.6. Intensity index (γ)
Intensity refers to the likely magnitude within anepidemic wave when more than one case occurs.
635T.-H. Wen et al. / Science of the Total Environment 367 (2006) 631–640
Incidence rate is taken as an index to measure themagnitude of new cases appearing during a specifiedperiod. However, it cannot measure the weekly severityduring the period. Therefore, the intensity index (γ) isformulated as:
c ¼ IREV
ð3Þ
where IR is the incidence rate during the definedepidemic period and EV is as described above. Theindex evaluates the severity of an epidemic by focusingon successive weeks when cases have occurred. A highγ value describes an epidemic that is more temporallyconcentrated. The value of γ will become smaller ifthere were more waves, as most cases are temporallydispersed throughout the epidemic.
The two hypothetical epidemic patterns in Table 1can be used to show how the three temporal indicesdiffer in despite of having the identical annual incidencerate. For the dengue epidemic described by these twosituations, situation (a) would be more temporallysignificant. The frequency index α of situation (b) isslightly higher than that of situation (a) [35.2% vs.31.5%], meaning that there are a greater number ofweeks with at least one case occurring. However, theduration index β and intensity index γ of situation (a) ishigher than those of situation (b) [β: 17 vs. 2.1, γ:0.0064 vs. 0.00071], meaning that the epidemic ofsituation (b) has shorter epidemic waves and milderintensity. Overall, the situation (a) had higher frequencyindex than situation (b) but shorter duration and lessintensity even though both situations have the sameincidence. Therefore, we may conclude that theepidemic patterns of situation (a) is more severe thansituation (b) from these three temporal indices andprovide more public health resources and exercise morecontrol measures for situation (a).
2.7. Identification of significant risk areas
Epidemiologists used to calculate odds ratios (ORs)with the specific confidence interval (CI) as relativerisk measures to assess the significant risk factors(Duarte et al., 2006; Wilder-Smith et al., 2004). Rather
Table 1Temporal risk indices between case (a) and case (b) in the two hypothetical
At-risk population Infected cases Annual incidence rate
Case (a) 10,000 64 0.0064Case (b) 10,000 64 0.0064
than these case-control studies, local spatial autocor-relation index is used in this study to evaluatesignificant clustering trends of an interested temporalindex as spatial risk areas. The local indicator ofspatial autocorrelation (LISA) was adopted as thespatial risk index to identify significant spatial clusters(Anselin, 1995). The definition of LISA index is givenbelow:
I ið Þ ¼ ðXi− X̄ Þd
�Xnj¼1
Wij � ðXj− X̄ Þd
� �ð4Þ
where I(i)= the LISA index for region i, Wij=theproximity of region i to region j, Xi=the value for thetemporal index of region i, Xj=the value for thetemporal index of region j, X̄ =the average value ofthe temporal index, δ=the standard deviation of Xi andn=the total number of the regions to be evaluated.
The term Wij describes the proximity of region i to j.If the region i is next to region j, a value of 1 is assigned;0 otherwise. For any region i next to region j, the term(Xi− X̄ )× (Xj− X̄ ) describes the degree of similarity in atested index within a designated area and its neighbors.Monte Carlo significance test, which calculate thelikelihood that clusters could have arisen by chance ina given population, was used to evaluate the statisticalsignificance of spatial clusters. Thus, each of thetemporal indices for the 2002 dengue epidemic in thetwo-city area was identified as high with a 95%statistical significance.
3. Results
3.1. Spatial pattern analysis of temporal risk indices
Since any epidemic is a dynamic process, it would beimportant to identify spatial risk areas, if any, throughthe use of different temporal characteristics. Forexample, some area might have longer epidemicduration and the others might have stronger intensityeven though the duration is short. Once the risk areas atdifferent epidemic periods are identified, the compar-isons of case-incidence with its temporal–spatialdynamics can be helpful in identifying the possiblecauses or effective control measures.
epidemic patterns
Frequency index, α Duration index, β Intensity index, γ
31.5% 17.0 weeks 0.006435.2% 2.1 weeks 0.00071
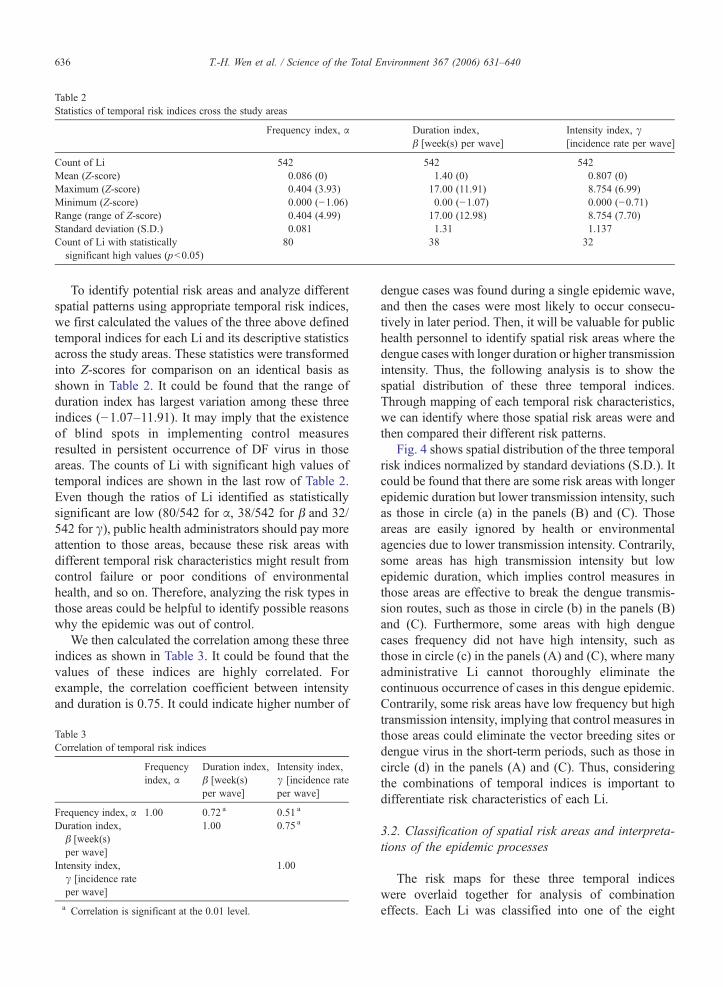
Table 2Statistics of temporal risk indices cross the study areas
Frequency index, α Duration index,β [week(s) per wave]
Intensity index, γ[incidence rate per wave]
Count of Li 542 542 542Mean (Z-score) 0.086 (0) 1.40 (0) 0.807 (0)Maximum (Z-score) 0.404 (3.93) 17.00 (11.91) 8.754 (6.99)Minimum (Z-score) 0.000 (−1.06) 0.00 (−1.07) 0.000 (−0.71)Range (range of Z-score) 0.404 (4.99) 17.00 (12.98) 8.754 (7.70)Standard deviation (S.D.) 0.081 1.31 1.137Count of Li with statisticallysignificant high values (p<0.05)
80 38 32
636 T.-H. Wen et al. / Science of the Total Environment 367 (2006) 631–640
To identify potential risk areas and analyze differentspatial patterns using appropriate temporal risk indices,we first calculated the values of the three above definedtemporal indices for each Li and its descriptive statisticsacross the study areas. These statistics were transformedinto Z-scores for comparison on an identical basis asshown in Table 2. It could be found that the range ofduration index has largest variation among these threeindices (−1.07–11.91). It may imply that the existenceof blind spots in implementing control measuresresulted in persistent occurrence of DF virus in thoseareas. The counts of Li with significant high values oftemporal indices are shown in the last row of Table 2.Even though the ratios of Li identified as statisticallysignificant are low (80/542 for α, 38/542 for β and 32/542 for γ), public health administrators should pay moreattention to those areas, because these risk areas withdifferent temporal risk characteristics might result fromcontrol failure or poor conditions of environmentalhealth, and so on. Therefore, analyzing the risk types inthose areas could be helpful to identify possible reasonswhy the epidemic was out of control.
We then calculated the correlation among these threeindices as shown in Table 3. It could be found that thevalues of these indices are highly correlated. Forexample, the correlation coefficient between intensityand duration is 0.75. It could indicate higher number of
Table 3Correlation of temporal risk indices
Frequencyindex, α
Duration index,β [week(s)per wave]
Intensity index,γ [incidence rateper wave]
Frequency index, α 1.00 0.72 a 0.51 a
Duration index,β [week(s)per wave]
1.00 0.75 a
Intensity index,γ [incidence rateper wave]
1.00
a Correlation is significant at the 0.01 level.
dengue cases was found during a single epidemic wave,and then the cases were most likely to occur consecu-tively in later period. Then, it will be valuable for publichealth personnel to identify spatial risk areas where thedengue cases with longer duration or higher transmissionintensity. Thus, the following analysis is to show thespatial distribution of these three temporal indices.Through mapping of each temporal risk characteristics,we can identify where those spatial risk areas were andthen compared their different risk patterns.
Fig. 4 shows spatial distribution of the three temporalrisk indices normalized by standard deviations (S.D.). Itcould be found that there are some risk areas with longerepidemic duration but lower transmission intensity, suchas those in circle (a) in the panels (B) and (C). Thoseareas are easily ignored by health or environmentalagencies due to lower transmission intensity. Contrarily,some areas has high transmission intensity but lowepidemic duration, which implies control measures inthose areas are effective to break the dengue transmis-sion routes, such as those in circle (b) in the panels (B)and (C). Furthermore, some areas with high denguecases frequency did not have high intensity, such asthose in circle (c) in the panels (A) and (C), where manyadministrative Li cannot thoroughly eliminate thecontinuous occurrence of cases in this dengue epidemic.Contrarily, some risk areas have low frequency but hightransmission intensity, implying that control measures inthose areas could eliminate the vector breeding sites ordengue virus in the short-term periods, such as those incircle (d) in the panels (A) and (C). Thus, consideringthe combinations of temporal indices is important todifferentiate risk characteristics of each Li.
3.2. Classification of spatial risk areas and interpreta-tions of the epidemic processes
The risk maps for these three temporal indiceswere overlaid together for analysis of combinationeffects. Each Li was classified into one of the eight
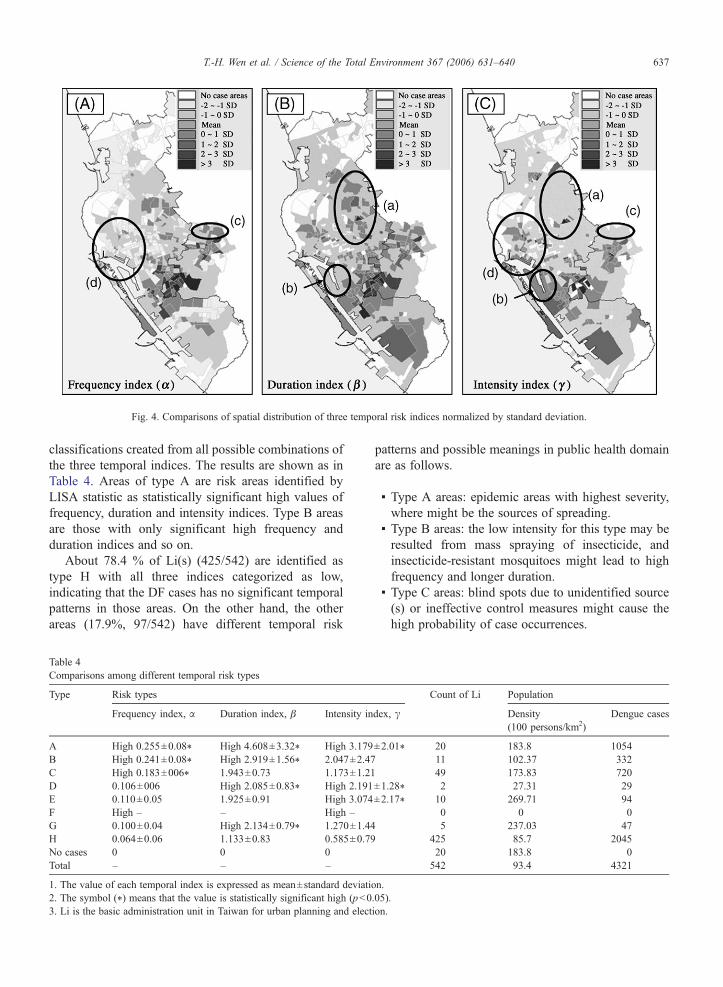
Fig. 4. Comparisons of spatial distribution of three temporal risk indices normalized by standard deviation.
637T.-H. Wen et al. / Science of the Total Environment 367 (2006) 631–640
classifications created from all possible combinations ofthe three temporal indices. The results are shown as inTable 4. Areas of type A are risk areas identified byLISA statistic as statistically significant high values offrequency, duration and intensity indices. Type B areasare those with only significant high frequency andduration indices and so on.
About 78.4 % of Li(s) (425/542) are identified astype H with all three indices categorized as low,indicating that the DF cases has no significant temporalpatterns in those areas. On the other hand, the otherareas (17.9%, 97/542) have different temporal risk
Table 4Comparisons among different temporal risk types
Type Risk types
Frequency index, α Duration index, β Intensity in
A High 0.255±0.08⁎ High 4.608±3.32⁎ High 3.179B High 0.241±0.08⁎ High 2.919±1.56⁎ 2.047±2.47C High 0.183±006⁎ 1.943±0.73 1.173±1.21D 0.106±006 High 2.085±0.83⁎ High 2.191E 0.110±0.05 1.925±0.91 High 3.074F High – – High –G 0.100±0.04 High 2.134±0.79⁎ 1.270±1.44H 0.064±0.06 1.133±0.83 0.585±0.79No cases 0 0 0Total – – –
1. The value of each temporal index is expressed as mean±standard deviatio2. The symbol (⁎) means that the value is statistically significant high (p<03. Li is the basic administration unit in Taiwan for urban planning and elect
patterns and possible meanings in public health domainare as follows.
▪ Type A areas: epidemic areas with highest severity,where might be the sources of spreading.
▪ Type B areas: the low intensity for this type may beresulted from mass spraying of insecticide, andinsecticide-resistant mosquitoes might lead to highfrequency and longer duration.
▪ Type C areas: blind spots due to unidentified source(s) or ineffective control measures might cause thehigh probability of case occurrences.
Count of Li Population
dex, γ Density(100 persons/km2)
Dengue cases
±2.01⁎ 20 183.8 105411 102.37 33249 173.83 720
±1.28⁎ 2 27.31 29±2.17⁎ 10 269.71 94
0 0 05 237.03 47
425 85.7 204520 183.8 0542 93.4 4321
n..05).ion.
638 T.-H. Wen et al. / Science of the Total Environment 367 (2006) 631–640
▪ Type D areas: the high intensity and long durationmay be resulted from a severe epidemic, but lowfrequency likely results from these areas far frommajor epidemic foci.
▪ Type E areas: few but intense transmission pulsesmay have occurred, implying that the controlmeasures might be effective.
▪ Type F areas: temporally sporadic but frequentlyinterrupted transmission pulses, implying that thecontrol measures might be effective briefly becauseof shorter duration but failed in the long run becauseof higher frequency of case-incidence. We did notfind any area with this risk type, possibly becauselarge-scale integrated measures had been implemen-ted in this epidemic, combining mass spraying ofinsecticide and reduction of mosquito breeding hadshorten the frequency and epidemic waves.
▪ Type G areas: this pattern can easily be ignoredbecause of few cumulated cases. But the continuous
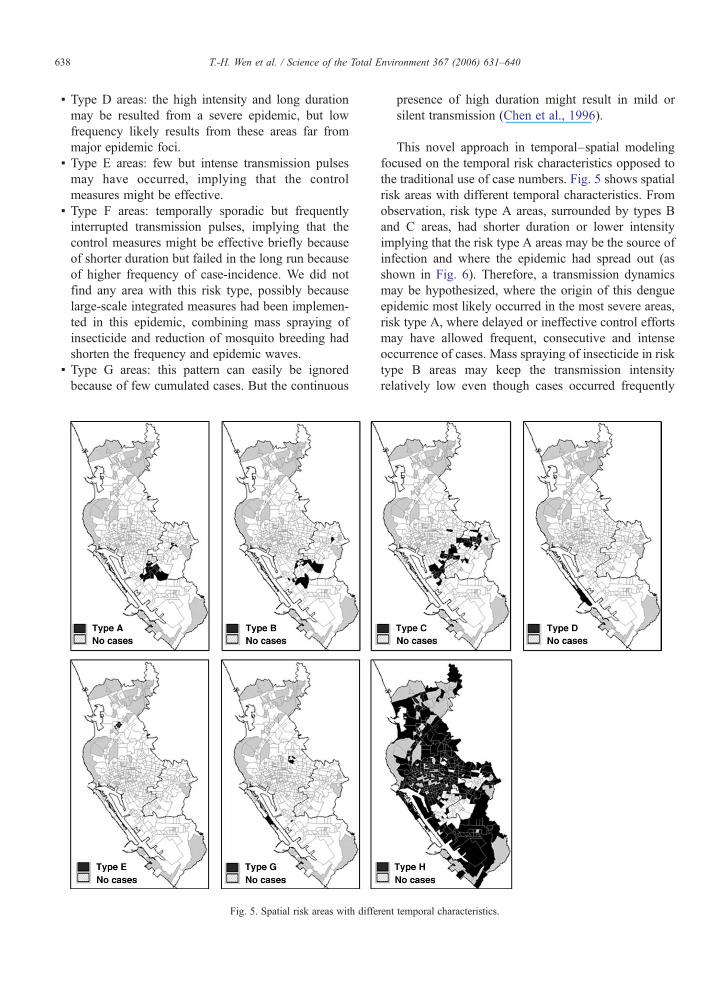
Fig. 5. Spatial risk areas with diffe
presence of high duration might result in mild orsilent transmission (Chen et al., 1996).
This novel approach in temporal–spatial modelingfocused on the temporal risk characteristics opposed tothe traditional use of case numbers. Fig. 5 shows spatialrisk areas with different temporal characteristics. Fromobservation, risk type A areas, surrounded by types Band C areas, had shorter duration or lower intensityimplying that the risk type A areas may be the source ofinfection and where the epidemic had spread out (asshown in Fig. 6). Therefore, a transmission dynamicsmay be hypothesized, where the origin of this dengueepidemic most likely occurred in the most severe areas,risk type A, where delayed or ineffective control effortsmay have allowed frequent, consecutive and intenseoccurrence of cases. Mass spraying of insecticide in risktype B areas may keep the transmission intensityrelatively low even though cases occurred frequently
rent temporal characteristics.
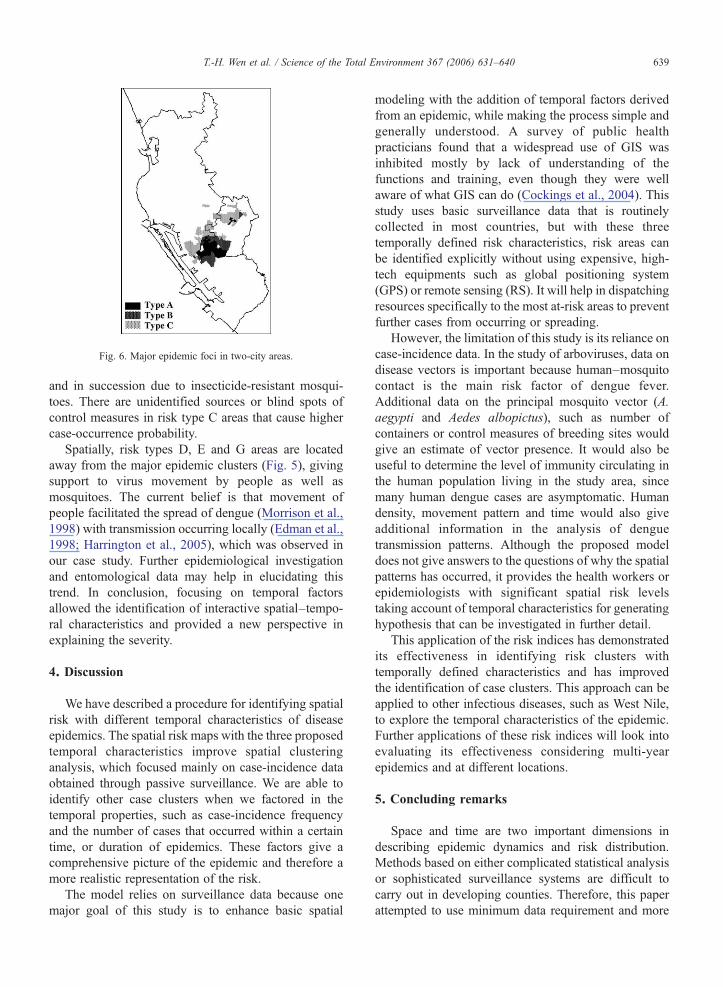
Fig. 6. Major epidemic foci in two-city areas.
639T.-H. Wen et al. / Science of the Total Environment 367 (2006) 631–640
and in succession due to insecticide-resistant mosqui-toes. There are unidentified sources or blind spots ofcontrol measures in risk type C areas that cause highercase-occurrence probability.
Spatially, risk types D, E and G areas are locatedaway from the major epidemic clusters (Fig. 5), givingsupport to virus movement by people as well asmosquitoes. The current belief is that movement ofpeople facilitated the spread of dengue (Morrison et al.,1998) with transmission occurring locally (Edman et al.,1998; Harrington et al., 2005), which was observed inour case study. Further epidemiological investigationand entomological data may help in elucidating thistrend. In conclusion, focusing on temporal factorsallowed the identification of interactive spatial–tempo-ral characteristics and provided a new perspective inexplaining the severity.
4. Discussion
We have described a procedure for identifying spatialrisk with different temporal characteristics of diseaseepidemics. The spatial risk maps with the three proposedtemporal characteristics improve spatial clusteringanalysis, which focused mainly on case-incidence dataobtained through passive surveillance. We are able toidentify other case clusters when we factored in thetemporal properties, such as case-incidence frequencyand the number of cases that occurred within a certaintime, or duration of epidemics. These factors give acomprehensive picture of the epidemic and therefore amore realistic representation of the risk.
The model relies on surveillance data because onemajor goal of this study is to enhance basic spatial
modeling with the addition of temporal factors derivedfrom an epidemic, while making the process simple andgenerally understood. A survey of public healthpracticians found that a widespread use of GIS wasinhibited mostly by lack of understanding of thefunctions and training, even though they were wellaware of what GIS can do (Cockings et al., 2004). Thisstudy uses basic surveillance data that is routinelycollected in most countries, but with these threetemporally defined risk characteristics, risk areas canbe identified explicitly without using expensive, high-tech equipments such as global positioning system(GPS) or remote sensing (RS). It will help in dispatchingresources specifically to the most at-risk areas to preventfurther cases from occurring or spreading.
However, the limitation of this study is its reliance oncase-incidence data. In the study of arboviruses, data ondisease vectors is important because human–mosquitocontact is the main risk factor of dengue fever.Additional data on the principal mosquito vector (A.aegypti and Aedes albopictus), such as number ofcontainers or control measures of breeding sites wouldgive an estimate of vector presence. It would also beuseful to determine the level of immunity circulating inthe human population living in the study area, sincemany human dengue cases are asymptomatic. Humandensity, movement pattern and time would also giveadditional information in the analysis of denguetransmission patterns. Although the proposed modeldoes not give answers to the questions of why the spatialpatterns has occurred, it provides the health workers orepidemiologists with significant spatial risk levelstaking account of temporal characteristics for generatinghypothesis that can be investigated in further detail.
This application of the risk indices has demonstratedits effectiveness in identifying risk clusters withtemporally defined characteristics and has improvedthe identification of case clusters. This approach can beapplied to other infectious diseases, such as West Nile,to explore the temporal characteristics of the epidemic.Further applications of these risk indices will look intoevaluating its effectiveness considering multi-yearepidemics and at different locations.
5. Concluding remarks
Space and time are two important dimensions indescribing epidemic dynamics and risk distribution.Methods based on either complicated statistical analysisor sophisticated surveillance systems are difficult tocarry out in developing counties. Therefore, this paperattempted to use minimum data requirement and more
640 T.-H. Wen et al. / Science of the Total Environment 367 (2006) 631–640
straightforward statistical methods to capture majortemporal characteristics of epidemic dynamic process,including frequency, duration and intensity. Differentepidemic patterns can be clearly depicted throughmapping these temporal risk indices. Rather than relyingon mapping case number or incidence rate, this studyenables the public health officers to comprehensivelyidentify the risk areas. It also provides them with newand broader perspectives on temporal risk characteristicsother than the traditional epidemic curves.
Acknowledgements
The authors sincerely thank the staff of KaohsiungCity and County Health Bureau and the Center forDisease Control in Taiwan (Taiwan-CDC) for theirefforts in surveillance and vector control during the hardtime of the dengue epidemic. The authors also thankanonymous referee's comments for clarifying theoriginal manuscript. Neal Lin would like to expressappreciation for the support from the Fulbright grant,sponsored by the Foundation for Scholarly Exchange inTaiwan.
References
Anselin L. Local indicators of spatial association—LISA. Geogr Anal1995;27(2):93-115.
Bithell JF. An application of density estimation to geographicalepidemiology. Stat Med 1990;9:691–701.
Bithell JF. Disease mapping using the relative risk function estimatedfrom areal data. In: Lawson AB, Biggeri A, Bohning D, Lesaffre E,Viel J-F, Bertollini R, editors. Disease mapping and riskassessment for public health. New York: John Wiley & Sons;1999. p. 247–55.
Bohra Alpana, Andrianasolo Haja. Application of GIS in modeling ofdengue risk based on sociocultural data: case of Jalore, Rajasthan,India. Dengue Bull 2001;25:92-102.
Chen WJ, Chen SL, Chien LJ, Chen CC, King CC, Harn MR, et al.Silent transmission of the dengue virus in southern Taiwan. Am JTrop Med Hyg 1996;55(1):12–6.
Cockings S, Dunn CE, Bhopal RS, Walker DR. Users' perspectives onepidemiological, GIS and point pattern approaches to analyzingenvironment and health data. Health Place 2004;10(2):169–82.
Croner CM, Sperling J, Broom FR. Geographic information systems(GIS): new perspectives in understanding human health andenvironmental relationship. Stat Med 2000;15:1961–77.
Diggle PJ. Overview of statistical methods for disease mapping and itsrelationship to cluster detection. In: Elliott P, Wakefield J, Best N,Briggs D, editors. Spatial epidemiology: methods and applications.Oxford: Oxford University Press; 2000. p. 494.
DGBAS, Population and Housing Census Taiwan-Fukien Area,Republic of China, http://www.dgbas.gov.tw/, Nov. 2005 [inChinese].
Duarte HH, Franca EB. Data quality of dengue epidemiologicalsurveillance in Belo Horizonte, southeastern Brazil. Rev SaudePublica 2006;40(1):134–42.
Dunn CE, Kingham SP, Rowlingson B, Bhopal RS, Cockings S, FoyCJ, et al. Analysing spatially referenced public health data: acomparison of three methodological approaches. Health Place2001;7(1):1-12.
Earnest A, Chen MI, Ng D, Sin LY. Using autoregressive integratedmoving average (ARIMA) models to predict and monitor thenumber of beds occupied during a SARS outbreak in a tertiaryhospital in Singapore. BMC Health Serv Res 2005;11; 5(1):36.
Edman JD, Scott TW, Costero A, Morrison AC, Harrington LC,Clark GG. Aedes aegypti (Diptera: Culicidae) movementinfluenced by availability of oviposition sites. J Med Entomol1998;35(4):578–83.
Giesecke J. Modern infectious disease epidemiology. London: Arnold;2001. 280 pp.
Harrington LC, Scott TW, Lerdthusnee K, Coleman RC, Costero A,Clark GG, et al. Dispersal of the dengue vector Aedes aegyptiwithin and between rural communities. Am J Trop Med Hyg2005;72(2):209–20.
Maheswan Ravi, Haining Robert P. In: Ravi M, Massimo C, editors.Basic issues in geographic analysis, GIS in public health practice.CRC PRESS (Electric Media); 2004. 287 pp.
Morrison AC, Getis A, Santiago M, Rigau-Perez JG, Reiter P.Exploratory space–time analysis of reported dengue cases duringan outbreak in Florida, Puerto Rico, 1991–1992. Am J Trop MedHyg 1998;58(3):287–98.
Wilder-Smith A, Foo W, Earnest A, Sremulanathan S, Paton NI.Seroepidemiology of dengue in the adult population of Singapore.Trop Med Int Health 2004;9(2):305–8 [Feb].
Wu MH, Chao DY, Wang WK, Lin YL, King CC. The epidemiologyof dengue fever/dengue hemorrhagic fever in Kaohsiung during2001–2002. Proceeding of Taiwan Public Health Conference;2003. p. 103–18 [in Chinese].
Zeger Scott L, Irizarry Rafael A, Peng Roger D. On time seriesanalysis of public health and biomedical data, Johns HopkinsUniversity, Dept. of Biostatistics, Working papers; 2004. 54 pp.