The soft gamma-ray spectrum of A0535+26: Detection of an absorption feature at 110 keV by OSSE
15
Transcript of The soft gamma-ray spectrum of A0535+26: Detection of an absorption feature at 110 keV by OSSE
The Soft Gamma-Ray Spectrum of A0535+26:Detection of an Absorption Feature at 110 keV by OSSEJ.E. Grove1, M.S. Strickman, W.N. Johnson, J.D. Kurfess, R.L. KinzerE.O. Hulburt Center for Space Research, Code 7650, Naval Research Lab., Washington DC20375, U.S.A.C.H. Starr, G.V. JungUniversities Space Research Association, Washington, DC 20024, U.S.A.E. Kendziorra, P. Kretschmar, M. Maisack, R. StaubertAstronomisches Institut der Universit�at T�ubingen, D-72076 T�ubingen, GermanyReceived 1994 August 11; accepted 1994 October 11Accepted for publication in Astrophysical Journal Letters1E-mail: [email protected]
{ 2 {ABSTRACTWe present soft -ray observations by the Oriented Scintillation SpectrometerExperiment (OSSE) on the Compton Gamma Ray Observatory (GRO) of thetransient X-ray binary pulsar A0535+26. The observations were made 1994February 8{17, immediately prior to the peak of a giant outburst. The phase-averaged spectrum is complex and cannot be described by a single-componentmodel. We �nd that structure in the spectrum above 100 keV can best bemodeled by an absorption feature near 110 keV, which we interpret as thesignature of cyclotron resonant scattering. Because of OSSE's 45-keV threshold,we are unable to make a de�nitive statement on the presence of a 55-keVabsorption line; however we can conclude that if this line does exist, it musthave a smaller optical depth than the line at 110 keV. A �rst harmonic (=fundamental) cyclotron resonance at 110 keV corresponds to a magnetic �eldstrength at the surface of the neutron star of � 1 � 1013 G (� 5� 1012 G if the�rst harmonic is at 55 keV).Subject headings: gamma rays: observation | line identi�cation | stars:individual (A0535+26) | stars: magnetic �elds | stars: neutron | X-rays:stars
{ 3 {1. IntroductionThe massive X-ray binary A0535+26 is a recurrent transient pulsar, with pulse period� 104 s (Rosenberg et al. 1975) and recurrence period � 111 days (Motch et al. 1991). Theoptical companion is the Be star HDE 245770 (Li et al. 1979) at an estimated distance of1:8� 0:3 kpc (Giangrande et al. 1980). For a review, see Giovanelli & Graziati (1992). TheX-ray outbursts are thought to be powered by enhanced mass transfer from the companionstar near periastron. The intensity of the X-ray emission can vary dramatically from oneperiastron passage to the next: No outburst may be observed; a \typical" outburst mayoccur, with peak ux of a few hundred mCrab units (1{10 keV); or a \giant" outburst mayoccur, with peak X-ray ux of several Crab units. Giant outbursts may appear away fromperiastron (Motch et al. 1991).Previous hard X-ray spectra of A0535+26 have been modeled variously as exponential(kT = 17 keV; Hameury et al. 1983), blackbody (kT = 9 keV; Frontera et al. 1985),and Wien (kT = 8 keV; Dal Fiume et al. 1988). Kendziorra et al. (1992, 1994) reportedthe detection of two absorption features, near 50 keV and 100 keV, in the spectrum ofA0535+26 in outburst. Previous estimates of the magnetic �eld strength have rangedover 4 � 20 � 1012 G, based on the suggestion of cyclotron line features (Kendziorra et al.1992, 1994), the energy dependence of the pulsed fraction (Dal Fiume et al. 1988), or themultiplicity of pulse shapes at low energies (Kanno 1980).We report here on spectral observations of A0535+26 by the Oriented ScintillationSpectrometer Experiment (OSSE) on the Compton GRO over the interval 1994 February8{17, during the rise immediately preceding the peak of a giant outburst. These observationswere scheduled as a \target of opportunity" triggered by the detection of the outburst bythe BATSE instrument on GRO. The rise to maximum of this giant outburst spanned abinary phase interval of �0.15, with the peak intensity occurring on 1994 February 18
{ 4 {at binary phase 0:95 � 0:03, according to the ephemeris of Motch et al. (1991). At themaximum, the pulsed emission reached 8 Crab (nebula + pulsar) ux units in the 20{40keV band (Finger, Wilson, & Hagedon 1994; Wilson et al. 1994).2. ObservationsThe OSSE instrument consists of four nearly identical large-area NaI(Tl){CsI(Na)phoswich detector systems, as described in detail in Johnson et al. (1993). Full-resolutionspectra were accumulated every 4.096 s in a sequence of two-minute measurements of thesource �eld alternated with two-minute, o�set-pointed measurements of background. Theobservation was made in twice-normal gain to improve the low-energy response. A total of1:8 � 105 s of highest-quality data, equally divided between source and background, werecollected for each of the four detectors.For this observation, the source and background �elds were placed to ensure that theCrab Nebula, a potentially contaminating source, did not cause a signi�cant contributionto the ux measurement of A0535+26. Below 100 keV, the net (source { background) Crabcontribution is <0.1% of the measured ux from A0535+26, and in the critical range from100{200 keV where we see spectral structure, the contribution is < 10�4 photons cm�2 s�1MeV�1, or �< 1% of the measured A0535+26 ux.3. ResultsWe detected emission from A0535+26 with high statistical signi�cance from 45keV to �200 keV. The average 45{200 keV luminosity during 1994 February 8{17 was4 � 1036 (d=1:8 kpc)2 erg s�1; the luminosity doubled over the nine days of the observation,from 2:5 � 1036 to 5:1 � 1036 (d=1:8 kpc)2 erg s�1.
{ 5 {We �t the phase-averaged spectrum between 45 keV and 300 keV from the sum ofthe four detectors for the entire observation using a forward-folding method (Johnson etal. 1993). We derived error estimates in the parameters of the various spectral models by�2-mapping, with con�dence intervals speci�ed according to Lampton, Margon, & Bowyer(1976). With such a strong source, it is important to address possible sources of systematicerror. We have identi�ed a number of likely contributors, and in all the analysis describedherein we have added our best estimate of the systematic error to the statistical error. Thesystematic error becomes the dominant source of error below �70 keV, rising to �3% of the ux at 45 keV. It does not signi�cantly alter the values of the best-�t parameters.Fig. 1a shows the phase-averaged spectrum summed over the entire observation.The spectrum is quite soft (Wien temperature �10 keV), although no single-componentmodel adequately describes the spectrum. Simple continuum models show very signi�cantresiduals and have unacceptably large �2 values (Table 1). The structure apparent above100 keV could indicate the emergence of weak, underlying, high-energy continuum emission,or it could indicate a broad emission or absorption line. To determine which of these is mostlikely, we tested a number of models in two classes: a class of two-component continuumspectra, and a class of single-component continuum spectra together with line pro�les foremission or absorption (Table 1). In both classes, the continuum model that accounts forthe bulk of the emission is a power law times an exponential (hereafter, \PLExp"), chosenbecause of its general adequacy in describing the standard and hard X-ray spectra of X-raybinaries (White, Swank, & Holt 1983).The models from the �rst class, the two-component continuum models, do not giveacceptable �ts (Table 1). The weak, hard continuum necessary to describe the emissionabove 100 keV|either a simple power law or PLExp|has a substantial e�ect on thespectrum below 100 keV and generates signi�cant residuals. Models from the second classemploying a Gaussian emission feature (centroid energy �150 keV) are similarly poor, with
{ 6 {�2 probabilities < 10�7.The remaining models from the second class, those with broad absorption lines, providesubstantially better �ts. In these models, the continuum is modi�ed by a multiplicativetransmission function from one or more absorption lines, which we presume arise fromcyclotron resonant scattering. First proposed by Tanaka (1986), the transmission functionassumes an exponentiated Lorentzian-times-E2 form, which resembles the cyclotronscattering cross section (Herold 1979; Daugherty & Harding 1986; Harding & Daugherty1991) and has been used successfully to model cyclotron absorption features in Ginga data(e.g. Nagase et al. 1991; Tamura et al. 1992). The model function has the formf(E) = AC(E) exp[�L(E)] ; (1)where C(E) = E�� exp(�E=kT ) (2)and L(E) = 2Xn=1 �n (nW )2 (E=nEL)2(E � nEL)2 + (nW )2 : (3)The continuum term, C(E), is the PLExp model with folding energy kT . In the absorptionpro�le L(E), parameters �n, nEL, and nW are the optical depth, energy, and width (thehalf-width at half maximum of the Lorentzian, HWHM) of absorption line n = 1 or 2. Wehave assumed a harmonic relationship of 1:2 between the line energies and widths. Whilein the relativistic treatment the resonant energies are not strict multiples of the cyclotronenergy (Herold 1979), the nonlinearities are small (of order several percent for the �rst fewlevels) and have been ignored. Trial �ts with independent line energies and widths wereconsistent with the harmonic assumption and did not substantially improve the �t.Table 1 shows that the best �t is achieved with the general PLExp continuum modelwith two absorption lines, although the �rst harmonic (= fundamental) near 55 keV has a
{ 7 {small optical depth (�1 = 0:1+0:5�0:1; 68% con�dence, �2min+7:0), which serves mostly to attenthe model spectrum at low energies. Indeed this absorption line is not strictly required withthe PLExp continuum model: �2 probabilities for models with free or zero optical depth at55 keV are both acceptable (33% and 22%, respectively). The 95% con�dence upper limitis � < 1:1 (�2min + 12:6). We note also that the Wien continuum with two absorption linesis acceptable; however the lines are extremely broad (42+4�3% HWHM), and the 55 keV lineis di�cult to distinguish from a smooth change in the continuum.Parameters of the best-�t model are given in Table 2. The errors given correspondto 68% con�dence intervals for six interesting parameters (we judge the intensity A to beirrelevant); thus we use �2min+ 7:0. Care should be taken in interpreting the error estimatesfor this non-linear model; for example, the 95% (i.e. \2�") con�dence interval is not givenby twice the 68% (i.e. \1�") con�dence interval. The best-�t optical depth of the line at110+2�4 keV is 1:8+1:1�0:5, implying �15% transmission at the centroid. The width of the line(28+16�9 keV HWHM) is typical of the absorption features detected by Ginga (� 25%, e.g.Tamura et al. 1992). The width and depth of the line combine to a�ect the overall spectrumsigni�cantly throughout the 45{200 keV band (Fig. 1c). Because of the large uncertaintiesin the data above 150 keV, the existence of possible higher harmonics near 165 keV and220 keV is not well constrained; e.g. the 95% con�dence upper limit on the optical depthat 165 keV is � < 4 (�2min + 14:1). Fig. 1a shows a PLExp continuum model with a singleabsorption feature (near 110 keV); the optical depth of the potential �rst harmonic near 55keV has been set to zero. With only a single absorption line, signi�cant correlation amongthe parameters is removed, and the con�dence intervals (inset Fig. 1a) are signi�cantlysmaller than those in Table 2. The residuals (Fig. 1b) demonstrate that a feature near 55keV is not required, reinforcing the conclusion drawn from the �2 probabilities. The totalexcess emission above the model in the 200{600 keV band is <2�.We have also employed a more general line pro�le than that of eqs. 1 and 3, a
{ 8 {multiplicative Gaussian. Fits with this symmetric pro�le are essentially identical in qualityto those given above (e.g., for the two-line model �2min = 1:09 with 89 degrees of freedom)and lead to identical conclusions, in particular that only the line near 110 keV is stronglyrequired. The line centroid is shifted to a slightly higher energy (115+3�4 keV), presumablybecause the Gaussian lacks the blue tail of the exponentiated Lorentzian-times-E2. Theline width is unchanged (26+69�7 keV HWHM), although it is not well constrained. Theline width is governed by thermal broadening, as well as the averaging over magnetic �eldconditions and viewing angle present in the phase-averaged spectrum.Fits to the spectrum for each day show that the line centroid and width vary by< 2�, which suggests that we have not introduced a signi�cant bias by summing the dataover the entire observation. However, as the luminosity increases during the outburst, thespectrum does soften. In order to characterize the spectral change in a simple manner, we�t the daily spectra over 45{80 keV with a Wien law. Although formally these �ts are onlymarginally acceptable (�2 probabilities typically � 1%), they are su�cient to convey thatthe magnitude of the softening is modest. The Wien temperature decreases by 7% as theluminosity doubles. 4. DiscussionWe have shown that an absorption feature near 110 keV is present in the phase-averagedspectrum of A0535+26 during the giant outburst of 1994 February. This is the �rst timethat both the low-energy and high-energy wings of an absorption line have been clearlydetected at such high energies in any binary pulsar. We interpret this absorption as asignature of cyclotron resonance scattering. Two-continuum and continuum + emission-linemodels are strongly rejected by the �2 test (Table 1).We are unable to make a de�nitive statement on the presence of a 55 keV absorption
{ 9 {line in the phase-averaged spectrum. Furthermore, there have been no reports to dateon the existence of such a feature in the BATSE data. Adequate �ts to the OSSE dataare obtained with and without this feature, with a slight preference for a weak line incombination with the general power-law-times-exponential continuum (Table 1). However,we caution that it is always di�cult to distinguish between the appearance of a weak, broadline feature and an inadequate description of the underlying continuum: There is signi�cantcoupling between the line and continuum model parameters. Such is the case here, and itis compounded by uncertainties in the instrument response and the absence of adequatespectral coverage below the nominal line energy. We can conclude, however, that if a 55 keVfeature is present, its optical depth must be signi�cantly smaller than that of the 110 keVfeature. It is surprising that the ratio of depths would be small (�1:20 in the best-�t modelwith both depths free; <1:3.5 at 95% con�dence). Radiative transfer calculations based ona neutron-star paradigm for the hard-spectrum -ray bursts do show signi�cant �lling-inof the �rst harmonic by two- decay of the second excited state (e.g. Wang et al. 1989;Alexander and M�esz�aros 1991). However, Bulik et al. (1992) point out that this \photonspawning" process should be much less important in accreting X-ray pulsars, where thetypically soft, thermal spectrum would not populate the higher harmonics signi�cantly, andtherefore would not lead to any appreciable downscattering into the �rst harmonic.Kendziorra et al. (1992, 1994) reported the detection of two absorption features (�50keV and �100 keV) in the spectrum of A0535+26 at periastron. An exponentially-truncatedpower law model for the underlying continuum was required by their combined TTM andHEXE spectrum; a Wien law was unacceptable. The 50-keV absorption was detected atlow signi�cance (�< 3�) in the phase-averaged spectrum, and HEXE lacked the sensitivity todetect with certainty the high-energy wing of the 100-keV line; however, most importantly,the amplitudes of the absorption features depended on rotation phase. We have begunanalysis of the phase-resolved spectroscopy data from OSSE, which will be sensitive to a
{ 10 {phase-dependent absorption at 55 keV, if it exists. We note that the 95% con�dence limitwe set here on the optical depth at 55 keV (� < 1:1) in the phase-averaged spectrum doesnot exclude the HEXE value.If the feature at 110 keV does indeed result from cyclotron resonant scattering in astrongly magnetized plasma, it can be used to estimate the magnetic �eld strength. A�rst harmonic resonance at 110 keV corresponds to a �eld strength at the surface of theneutron star of 9:5 � 1012 (1 + z) G, where z is the gravitational redshift. If instead the�rst harmonic is at 55 keV, the �eld is 4:7 � 1012 (1 + z) G. In either case, this is thehighest �eld strength for an accreting neutron star ever measured through direct detectionof cyclotron absorption, although the value is within reason and is consistent with thestrongest magnetic �elds inferred from the spin-down of radio pulsars.This work was supported by NASA contract S-10987-C and by DARA grant 50 OR92054.
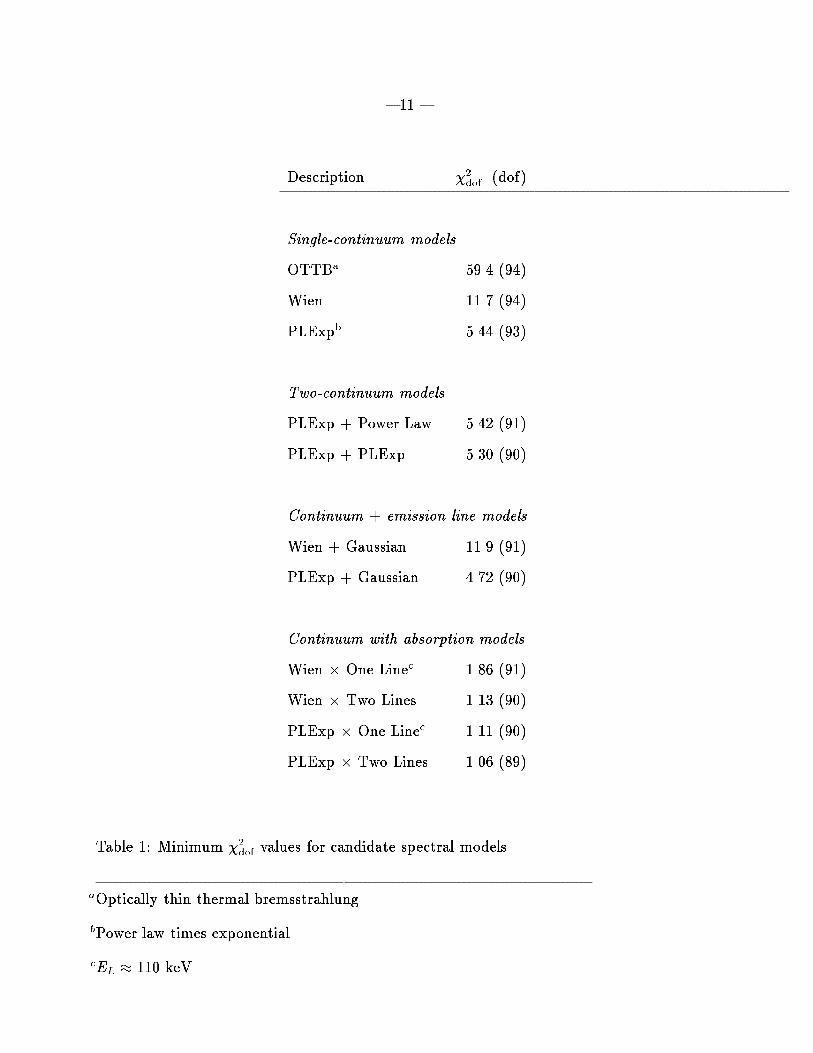
{ 11 {Description �2dof (dof)Single-continuum modelsOTTBa 59.4 (94)Wien 11.7 (94)PLExpb 5.44 (93)Two-continuum modelsPLExp + Power Law 5.42 (91)PLExp + PLExp 5.30 (90)Continuum + emission line modelsWien + Gaussian 11.9 (91)PLExp + Gaussian 4.72 (90)Continuum with absorption modelsWien � One Linec 1.86 (91)Wien � Two Lines 1.13 (90)PLExp � One Linec 1.11 (90)PLExp � Two Lines 1.06 (89)Table 1: Minimum �2dof values for candidate spectral models.aOptically thin thermal bremsstrahlung.bPower law times exponential.cEL � 110 keV.
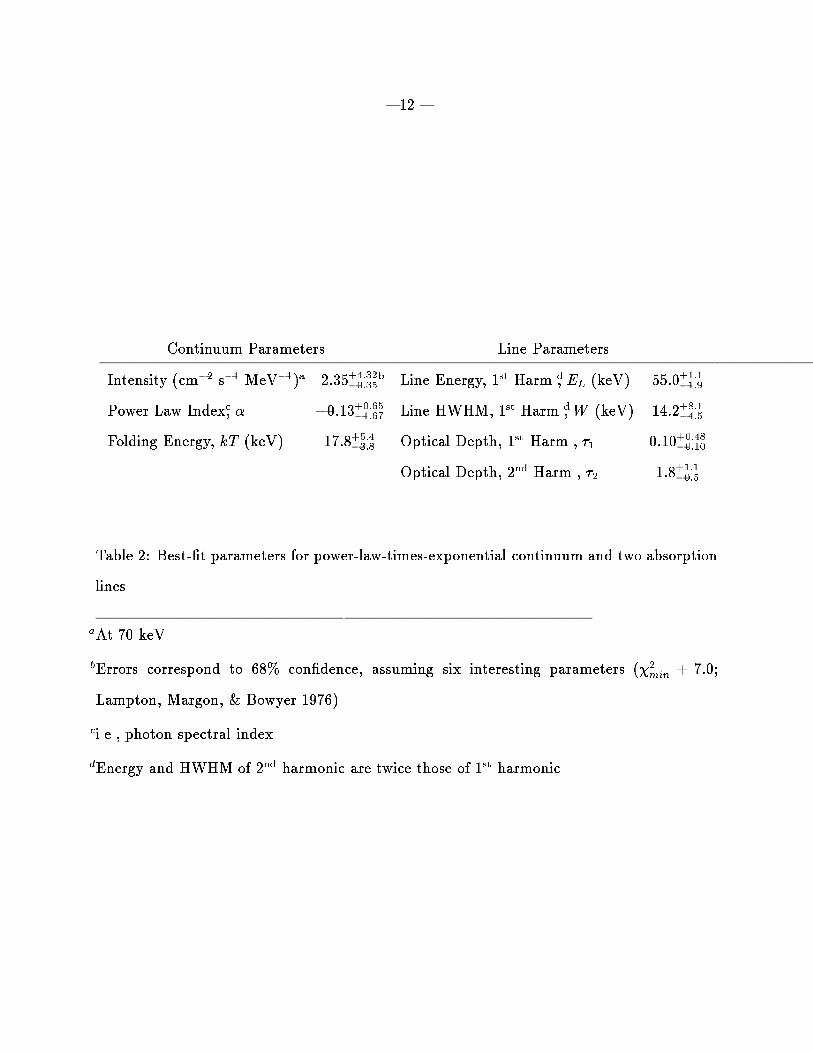
{ 12 {Continuum Parameters Line ParametersIntensity (cm�2 s�1 MeV�1)a 2:35+4:32�0:35b Line Energy, 1st Harm.d, EL (keV) 55:0+1:1�1:9Power Law Indexc, � �0:13+0:65�1:67 Line HWHM, 1st Harm.d, W (keV) 14:2+8:1�4:5Folding Energy, kT (keV) 17:8+5:4�3:8 Optical Depth, 1st Harm., �1 0:10+0:48�0:10Optical Depth, 2nd Harm., �2 1:8+1:1�0:5Table 2: Best-�t parameters for power-law-times-exponential continuum and two absorptionlines.aAt 70 keV.bErrors correspond to 68% con�dence, assuming six interesting parameters (�2min + 7:0;Lampton, Margon, & Bowyer 1976).ci.e., photon spectral index.dEnergy and HWHM of 2nd harmonic are twice those of 1st harmonic.
{ 13 {REFERENCESAlexander, S. G., & M�esz�aros, P. 1991, ApJ, 344, L1Bulik, T. et al. 1992, ApJ, 395, 564Dal Fiume, D. et al. 1988, ApJ, 331, 313Daugherty, J. K., & Harding, A. K. 1986, ApJ, 309, 362Finger, M. H., Wilson, R. B., & Hagedon, K. S. 1994, IAU Circ. 5931Frontera, F. et al. 1985, ApJ, 298, 585Giangrande, A. et al. 1980, A&AS, 40, 289Giovanelli, F., & Graziati, L. S., 1992, Space Science Reviews, 59, 1Hameury, J. M. et al. 1983, ApJ, 270, 144Harding, A. K. & Daugherty, J. K. 1991, ApJ, 374, 687Herold, H. 1979, Phys.Rev.D, 19, 2868Johnson, W. N. et al. 1993, ApJS, 86, 693Kanno, S. 1980, PASJ, 32, 105Kendziorra, E. et al. 1992, in Frontiers of X-Ray Astronomy (Proc. 28th Yamada Conf.),ed. Y. Tanaka and K. Koyama, (Univ. Acad. Press, Tokyo), p. 51Kendziorra, E. et al. 1994, A&A, in pressLampton, M., Margon, B., & Bowyer, S. 1976, ApJ, 208, 177Li, F. et al. 1979, ApJ, 228, 893Motch, C. et al. 1991, ApJ, 369, 490Nagase, F. et al. 1991, ApJ, 375, L49Rosenberg, F. D. et al. 1975, Nature, 256, 628
{ 14 {Tamura, K. et al. 1992, ApJ, 389, 676Tanaka, Y. 1986, in Radiation Hydrodynamics in Stars and Compact Objects, IAU Colloq.No. 89, ed. D. Mihalas and K.-H. A. Winkler (Springer-Verlag, Berlin), p. 198Wang, J. C. L. et al. 1989, Phys.Rev.Lett, 63, 1550White, N. E., Swank, J. H., and Holt, S. S. 1983, ApJ, 270, 711Wilson, R. B. et al. 1994, IAU Circ. 5945
This manuscript was prepared with the AAS LATEX macros v3.0.
{ 15 {Fig. 1.| a) Phase-averaged spectrum of A0535+26 from 1994 February 8{17. The outburstpeaked 1994 February 18 (Wilson et al. 1994). Solid line is the model �t, consisting of apower law times an exponential continuum (eq. 2) with transmission function of a singleabsorption line near 110 keV (eq. 3). Inset shows joint 68% (�2min+5:9) and 95% (�2min+11:1)con�dence intervals for the line centroid and optical depth from the single-line model. b)Residuals from best �t. c) Transmission function for the best-�t absorption line near 110keV. Data are divided by the continuum portion (eq. 2) of the best-�t model.