The Singapore Way: Planning for a Sustainable Future
26
The Singapore Way: Planning for a Sustainable Future Jeremy N. Rauch NYU Stern Urban Systems Professor Paul Romer April 27, 2015 Source: http://www.asiagreenbuildings.com/singaporegreenbuildingindividualawards2013/
-
Upload
independent -
Category
Documents
-
view
3 -
download
0
Transcript of The Singapore Way: Planning for a Sustainable Future

The Singapore Way: Planning for a Sustainable Future
Jeremy N. Rauch NYU Stern Urban Systems
Professor Paul Romer April 27, 2015
Source: http://www.asiagreenbuildings.com/singapore-‐green-‐building-‐individual-‐awards-‐2013/

1
Introduction
In 1819, Sir Stamford Raffles decided to open a new trading post for the British East India Company in Singapore. Given the dearth of natural resources in Singapore, the trading post was used for entrepôt trade – commodities were imported, processed, repackaged and then exported. This new trading post caused an explosion in the population of Singapore from around one thousand in 1819 to almost 81,000 in 1860. After many years under British rule and a short stint under Japanese rule from 1941 to 1945, Singapore became a self-governing state in 1959. The People’s Action Party (PAP) won 43 out of 51 seats in the Legislative Assembly and Lee Kuan Yew was appointed prime minister. Singapore tried to work out a merger with Malaysia but was ultimately expelled due to Malaysia’s distrust of predominantly Chinese Singapore. Singapore became an independent city-state in 1965. Singapore was thrown into a situation where they had to fend and care for themselves.1, 2 By 1965, Singapore’s population had ballooned to 1,887,000 and the GDP per capita was S$1,580.3 They were growing at a very rapid pace and it seemed they were going to use up their resources in a very short amount of time. Lee Kuan Yew and the PAP believed sustainable development and the pursuit of a green city was the solution. They felt a green city would encourage foreign and local investment, could be embraced by the locals and would help avert the deleterious effects of overpopulation.4 They reorganized the government into functional ministries and departments and established a centralized system of planning. The Urban Redevelopment Authority (under the auspices of the Ministry of National Development) was in charge of planning. In 1971, they devised the first Concept Plan, a general plan that set a direction for development over the next 40-50 years. Short-term master plans were created every 10-15 years. All plans were reviewed often. Early on they set aside one-tenth of their land for parks and other green spaces. Nature reserves that were protected by law comprised four and a half percent of the city’s land. The Ministry of the Environment (later renamed the Ministry of the Environment and Water Resources) cleaned up the Singapore River and Kallang Basin, worked hard to provide access for all to clean potable water and created early initiatives to provide for waste management, pollution reduction, and energy efficiency. Today, Singapore is a thriving city-state with a population of 5,470,000 people5 representing a growth of almost 80% since 19906, a population density of 7,615 people per km2, a GDP per capita of S$71,318, and a land area of 718 km2, compared to a land area of only 582 km2 in 1965.5, 7 A combination of strong government planning, policy implementation, public-private partnerships and international support has led to the growth of the city and its sustainability. As urban populations are expected to grow over the next fifty years or more and urban boundaries are being expanded, it is imperative that countries and their cities plan for sustainability and resource management.
2
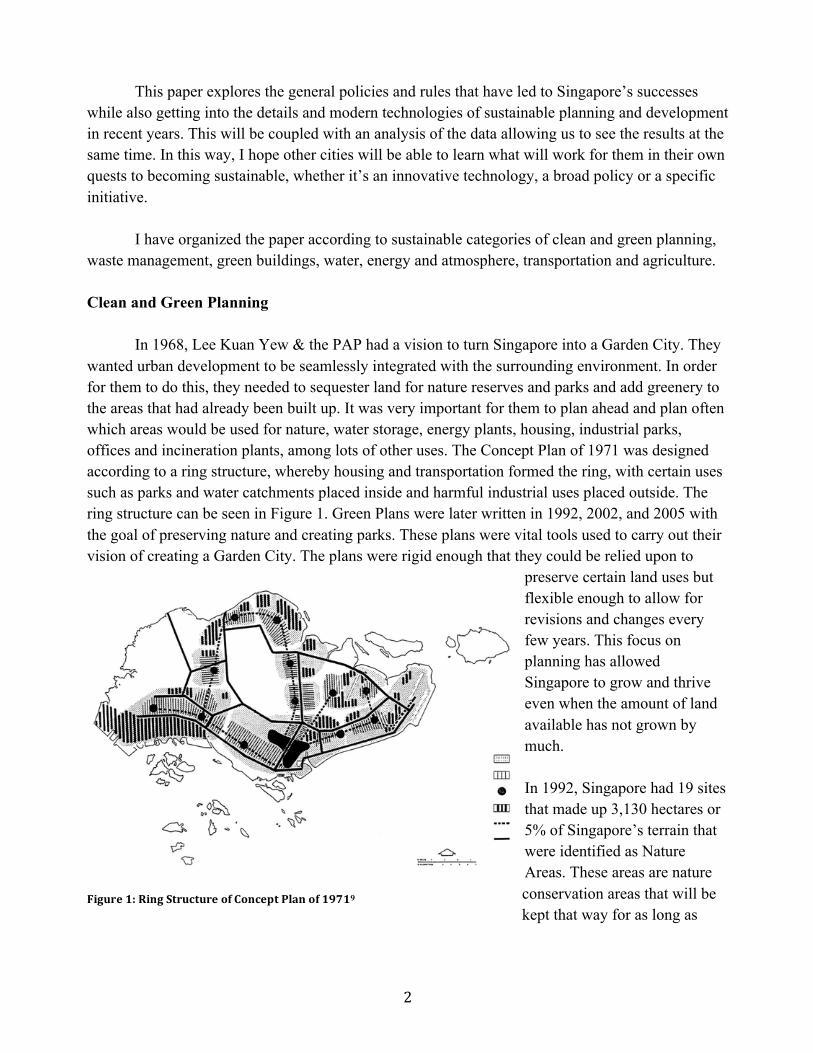
This paper explores the general policies and rules that have led to Singapore’s successes while also getting into the details and modern technologies of sustainable planning and development in recent years. This will be coupled with an analysis of the data allowing us to see the results at the same time. In this way, I hope other cities will be able to learn what will work for them in their own quests to becoming sustainable, whether it’s an innovative technology, a broad policy or a specific initiative. I have organized the paper according to sustainable categories of clean and green planning, waste management, green buildings, water, energy and atmosphere, transportation and agriculture. Clean and Green Planning In 1968, Lee Kuan Yew & the PAP had a vision to turn Singapore into a Garden City. They wanted urban development to be seamlessly integrated with the surrounding environment. In order for them to do this, they needed to sequester land for nature reserves and parks and add greenery to the areas that had already been built up. It was very important for them to plan ahead and plan often which areas would be used for nature, water storage, energy plants, housing, industrial parks, offices and incineration plants, among lots of other uses. The Concept Plan of 1971 was designed according to a ring structure, whereby housing and transportation formed the ring, with certain uses such as parks and water catchments placed inside and harmful industrial uses placed outside. The ring structure can be seen in Figure 1. Green Plans were later written in 1992, 2002, and 2005 with the goal of preserving nature and creating parks. These plans were vital tools used to carry out their vision of creating a Garden City. The plans were rigid enough that they could be relied upon to
preserve certain land uses but flexible enough to allow for revisions and changes every few years. This focus on planning has allowed Singapore to grow and thrive even when the amount of land available has not grown by much. In 1992, Singapore had 19 sites that made up 3,130 hectares or 5% of Singapore’s terrain that were identified as Nature Areas. These areas are nature conservation areas that will be kept that way for as long as
Figure 1: Ring Structure of Concept Plan of 19719

3
possible. Nature reserves, however, are afforded strict legal protection from other development claims under the Nature Reserve Act. The largest nature area in Singapore is the Bukit Timah and Central Catchment Nature Reserves, encompassing 2,100 hectares in 1992.10 The National Park Board (NParks) is in charge of conserving and developing the natural areas of Singapore. Since 1992, NParks has been adding to the nature areas of Singapore and reforesting hundreds of hectares of land. In 2001, Sungei Buloh Nature Park and Labrador Nature Park were promoted from Nature Areas to Nature Reserves bringing the total to 4.10 Today Singapore has 3,318 hectares of space devoted to parks, park connectors, and open space and 3,393 hectares of Nature Reserves.11 The growth in green space in Singapore can largely be attributed to the programs set up by NParks and partnering agencies. A Park Connector Network (PCN) program began in 2007 to enhance the sense of green space in the city. Since its inception, the park connector network has grown from 42 km to 200 km.11 The current park connector network can be seen in Figure 2.
The Streetscape Greenery Master Plan is a “blueprint for optimizing available green spaces along the roads for lush, densely planted treatments.”11 The Skyrise Greenery Incentive Scheme (SGIS) was introduced in 2009. “Under this scheme, NParks will fund up to 50% of installation costs of rooftop greenery and vertical greenery.”13 To date, there are 322 buildings with skyrise greenery.14 The Active, Beautiful, and Clean (ABC) Waters Program was created to “break down some of the harsh concrete walls of water canals and landscape them for better integration with surrounding parks and green space.”15 These programs have significantly contributed to the green feel of Singapore.
In addition to these programs, NParks has established many programs that seek to involve what they call the 3P sectors: people, public sector agencies, and private corporations. The
Figure 2: Park Connector Network12

4
Community-In-Bloom (CIB) program seeks to encourage a gardening culture in Singapore. A Garden City Fund was set up in 2002 to allow for donations to the city’s greening efforts.15 Donations and public-private partnerships have allowed NParks to launch major programs such as the 101-hectare Gardens by the Bay development. It was a joint effort between government agencies, architectural and design firms, and construction companies that sought to blend together nature, modern technology, and environmental management.16
Figure 3: Gardens by the Bay16
Figure 4: Gardens by the Bay Technology16
From 1986 to 2007, green cover in Singapore grew from 35.7% to 46.5% despite a 68% growth in population.15 The concerted planning and efforts of Singapore’s government agencies as well as the efforts of private companies have enabled Singapore to become one of the greenest cities in the world against a backdrop of limited land and a growing population.

5
Waste Management One of the more pressing issues for Singapore has been waste management. With limited land area, there is very little room for landfills and it is difficult to locate landfills far away from residential areas. Additionally, “from 1970 to 2000, the amount of solid waste disposed of increased six times to 7,600 tonnes per day.”17 Acknowledging the waste problems they were facing, the government borrowed US$25 million from the World Bank in 1973 to build its first incineration plant.8 Since then, the government opened more incineration plants in the city-state while opening and closing a series of landfills located away from residents. But ultimately, their goal has been to reduce, reuse and recycle until they will no longer need landfills or incineration plants. The government currently owns and operates four waste-to-energy incineration plants. These plants reduce waste volume by up to 90%.17, 18 New technologies allow the incineration plants to generate 962 million kWh of electricity from waste heat, or 2-3% of Singapore’s total electricity use, and advanced air pollution control equipment mitigates the pollution that would otherwise be generated.17 Locations of the current incineration plants can be seen in Figure 5.
Figure 5: Singapore Incineration Plants16
The ash that is created from the incineration plants and any waste that cannot be incinerated is sent to Semakau Landfill. This landfill was opened in 1999 when mainland landfills were used up. The landfill covers 350 hectares and has a capacity of 63 million cubic meters. It was originally estimated to have a lifespan of 25 to 30 years. The lifespan has been extended to 35 to 40 years due to increasing recycling rates.19 The landfill is not a wasteland due to careful construction of an impermeable rock bund around its perimeter. The marine ecosystem is protected and the wildlife on and around the island haven’t been affected negatively.17 Although the incineration plants and Semakau landfill have been successful to a large extent, they provide an unsustainable means to manage waste at current growth rates. Therefore, the National Environment Agency (NEA), the government body responsible for waste management,

6
has set up many rules, initiatives, and programs that seek to reduce waste disposal through increased recycling of materials. Some of the programs that have been set up by the NEA since the 1990s include a National Recycling Program that has been increasing the amount of recycling bins and providing more frequent collection services, a Recycling Program for Schools, and a Recycling Program for Industrial and Commercial Premises.17 Since 2000, many more recycling programs and incentives have been introduced. The Voluntary Packaging Agreement seeks to reduce packaging waste. Key 3P (people, public, private) partners such as the Singapore Environment Council, the Packaging Council of Singapore, and participating industries have come together to make this initiative a success. In 2006, a national “Why Waste Plastic Bags? Choose Reusable Bags!” campaign was launched to encourage the use of reusable bags for shopping. In 2011, a new requirement was launched whereby all waste collection companies would be required to incentivize households to recycle more. Recycle bins are being fitted with electronic tags that will measure the amount of waste recycled. Other public initiatives and campaigns such as the Clean & Green Singapore (CGS) campaign, the Recycling Outreach Program, the Pre-School 3R Training Kit, the Clean & Green Week Schools Carnival, and the promotion of Earth and World Environment Days have been launched to encourage the public to recycle as much as possible and to get others to do so as well.20
From 2000 to 2015, waste generation in Singapore has increased from 4.65 million tonnes to 7.5 million tonnes, an increase of 61.4%. During the same period, the recycling rate has increased from 40% to 60% and continues to increase. The government is on track to meet its recycling target of 65% by 2020 and 70% by 2030, set in the Sustainable Singapore Blueprint.21, 22 As Singapore continues to increase its recycling rate, the city moves closer and closer to achieving its sustainable waste management goals of ‘Towards Zero Landfill’ and ‘Towards Zero Waste’.
Green Buildings According to the United Nations Environment Programme Report, buildings account for one-third of greenhouse gas emissions, 40% of global energy consumption and resources, and 25% of global water consumption. “In Singapore’s densely built-up urban environment, with limited land space and few natural resources, greening buildings is vital to sustainability. It is one of the most effective ways for a city to reduce its carbon footprint in the long term, whether in terms of energy and water efficiency, waste reduction, or the use of sustainable materials.”23 In 2005, the Building and Construction Authority (BCA) of Singapore introduced the BCA Green Mark green buildings rating system. It evaluates and grades a building’s environmental impact and sustainability performance.23 The Green Mark allocates points to projects according to their performances in the categories of energy efficiency, water efficiency, environmental protection, indoor environmental quality, and other green features and innovations. Based on the

7
points allocated, a project can be awarded Green Mark Certified, Gold, GoldPlus, or Platinum ratings. The system is heavily weighted towards achieving energy efficiency due to the importance of energy in the tropical environment.24* The BCA published Green Building Masterplans in 2006, 2009, and 2014. The Masterplans introduced new legislation, financial incentive schemes, industry training programs, public outreach campaigns, and research and development initiatives. In 2006, a S$20 million Green Mark Incentive Scheme was launched. It offers direct monetary incentives to developers that achieve a rating above the Certified level. In 2008, the Building Control Act was amended to impose minimum standards on all new buildings to a level on par with the Certified standard. The Ministry of National Development launched a S$50 million R&D Research Fund to encourage research into green building technologies and solutions. One of the Fund’s flagship projects is the Zero Energy Building that was completed in 2009. The building, shown in Figure 6, produces enough energy to run itself. 25
Figure 6: Zero Energy Building at BCA Academy26
Additional incentive schemes include the S$100 million Green Mark Incentive Scheme for Existing Buildings, the Green Mark Gross Floor Area Incentive Scheme†, the S$5 million Green Mark Incentive Scheme for Design Prototype and Building Retrofit Energy Efficiency Financing Scheme. All throughout, the government has been leading by example. In 2006, all new public sector buildings and those undergoing major retrofits had to meet standards on the level of Green Mark Certified. In 2009, all new public sector buildings with air-conditioned floor areas of more than
* 87 of the possible 155 points are allocated to energy efficiency24 † A joint effort of the BCA & Urban Redevelopment Authority to provide floor area incentives for achieving certain rating levels23

8
5,000 m2 had to achieve a Platinum rating and existing buildings with air-conditioned floor areas of more than 10,000 m2 had to be retrofitted to achieve a Green Mark GoldPlus rating.24 Additionally, the government is spending S$52 million to create a Green Buildings Innovation Cluster (GBIC) whose goal will be to develop large scale and high impact demonstration projects and address barriers to widespread adoption of energy efficient solutions and practices.27 The BCA devised strategic thrusts that outline the basis for policy regarding green buildings. The thrusts are: public sector taking the lead, spurring the private sector, furthering the development of green building technology, building industry capabilities through training, profiling Singapore and raising awareness, and imposing minimum standards.25 These thrusts, and the countless programs and incentive schemes that were born by them, have led to much success. The number of Green Mark buildings in Singapore has grown from 17 in 2005 to more than 2,100 in 2014 and the gross floor area of green buildings amounts to 25% of the total built-up areas in Singapore.27
Figure 7: Growth of Green Mark Buildings27
Water In 1969, approximately 6,900 hectares of land, or 12.75% of main land area, were prone to flooding, the waterways of Singapore were severely polluted and Singapore was highly dependent on Johor, Malaysia for its clean water supply. The government drew up a Sewerage Master Plan in the late 1960s to reduce flooding, enacted the Water Pollution Control and Drainage Act in 1975 and continued to open new water catchment areas (areas where rainwater will flow into reservoirs) around Singapore as had been the plan since the time the British were still in power.28
The government began to work hard to clean up water pollution in 1977 when Prime
Minister Lee Kuan Yew demanded the government agencies clean up the Singapore River and Kallang Basin in less than ten years. After eight months of study, the Master Plan for the Cleaning of the Singapore River and Kallang Basin was drafted. The Ministry of Environment worked together with the Housing and Development Board to relocate more than 46,000 squatters and more

9
than 10,000 farms that were polluting the waterways. All 11,847 nightsoil bucket latrines were phased out. After polluting sources were removed from the banks, the Drainage Department physically cleaned the rivers by removing 2,000 tonnes of refuse and digging up about 640,000 m3 of sediments. According to Chou, the cleaning cost S$200 million29 and according to Tan it cost S$300 million.30 Either way, it had many direct and indirect benefits to Singapore that were worth much more than that. The clean waterways caused the adjacent land to grow in value, business activities began to flourish and the way was paved for a new mass rapid transit tunnel to be dug underneath the Singapore River.31
The Sewerage Master Plan laid out detailed drawings for a sewer network that would be built as quickly as possible and in 1970 the government began to charge for sewer services to cover the cost of expansion. Through improvements to water sources, pathways, and receptors (as illustrated in figure 8), flooding has decreased dramatically and only 56 hectares remained vulnerable to flooding in 2011.
Once pollution and drainage
were accounted for, Singapore was able to vastly increase their clean water initiatives. The First Water Master Plan was drafted in 1972 and the focus on four national water taps was introduced. The four water taps are imported water, local catchment water, desalinated water and NEWater (which is high-grade reclaimed water).
The Johor River Water Agreement, signed with Johor, Malaysia in 1962, gave Singapore the
right to draw water from the Johor River up to 250 million gallons per day. In return, Johor would get 3 cents per 1,000 gallons of raw water supplied to Singapore, treated water from Singapore up to 2% of the raw water it supplied (at a cost of 50 cents per 1,000 gallons) and rent for the land. In 1990, they signed a separate agreement that allowed Singapore to construct a dam across the Sungei Linggui to increase water extraction from the Johor River. Both of these agreements are set to expire in 2061 and the government of Singapore is committed to becoming self-reliant by that time.33
Figure 8: Drainage by Source, Pathway & Receptor32

10
When Singapore gained independence, there were only 3 reservoirs and 64 km2 of water catchment areas, or 11% of its land area at the time. Since then, Singapore opened many new reservoirs including the Marina Reservoir, which required construction of the Marina Barrage across the Marina Channel, in 2009. Additionally, the government spent S$18 million to construct a reservoir integration scheme that allowed for pumping of water from any reservoir to another, thereby increasing storage capacity. By 2011, there were 17 reservoirs and the water catchment areas had grown to 478 km2, or 67% of its land area at the time. The growth in water catchment areas has allowed Singapore to capture a lot more of the 2,400 mm of annual rainfall they receive on average.3 The water catchment areas, rivers and reservoirs can be seen in figure 9.
Figure 9: Water Catchment Areas, Rivers and Reservoirs34
The next water tap is NEWater, which is the high-grade water produced after being treated and further purified using a 3-step process of microfiltration, reverse osmosis and disinfection by ultraviolet light. Although NEWater meets World Health Organization Standards for drinking water, the Public Utilities Board (PUB) currently uses it mostly for non-potable uses and also mixes small amounts into reservoirs.* The first NEWater plants were opened in Bedok and Kranji in 2003 providing 15 million gallons per day (mgd). Seletar and Ulu Pandan were opened in 2004 and 2006 adding 30 mgd. The Changi NEWater plant was opened in 2010 and has a capacity of 50 mgd. Current NEWater capacity is 117 million gallons per day, or a little over 30% of current water consumption in Singapore.35
In order for water reclamation plants (WRPs) to be effective in receiving and treating
wastewater, the PUB had to create a large network of 6 WRPs, many pumping stations and many kilometers of pipes. In the 1990s, Singapore designed a deep tunnel sewerage system (DTSS) that
* Constituting about 1.5% of total potable water consumption.

11
seeks to locate pipes and pumping stations 60 meters below ground and to free up much needed land above ground.36 Phase one of DTSS was completed in 2009 with the opening of the Changi WRP and phase two is expected to be completed in 2024.37 See figure 10 for phases of the DTSS and figure 11 for the WRP process.
Figure 10: Phases of the Deep Tunnel Sewerage System37
Figure 11: WRP Process38
The final water tap is desalination of saltwater. Singapore’s first desalination plant was brought to fruition through a public-private partnership between PUB and Singspring Pte Ltd, a subsidiary of Hyflux, and was opened in 2005. Under the contract, Singspring Pte Ltd was to build

12
and operate the plant and supply water to PUB for 20 years. The plant cost S$200 million and has a capacity of 30 mgd. The larger Tuaspring Desalination Plant was built under a similar public-private partnership and completed in 2013 at a capacity of 70 mgd, bringing total desalination capacity to 100 mgd, or 26% of current water consumption.36 In addition to the four water taps, PUB is working with the community to reduce water consumption and increase conservation. PUB mandated maximum flow rates for taps and showers and required water efficiency labeling for water fittings and appliances. They created a 10-litre challenge that challenges individuals to reduce daily water consumption by 10 litres. The Water Efficient Homes program helps people to install water saving devices in their homes and Water Volunteer Groups go from door to door encouraging homeowners to install water saving devices and to take the 10-litre challenge.36 One of the most effective ways to get people to conserve water is by charging for it. PUB has set the price of its water at a level sufficient to pay for current expenses from the pipes to the NEWater plant and for future expansion. They have also been charging a Water Conservation Tax since 1991. However effective PUB believes the current pricing scheme may be, Cecilia Tortajada and Asit K Biswas believe it is not priced high enough. Although Singapore has been able to reduce water consumption per capita from 176 litres per day in 1994 to 151 litres per day in 2014, they argue it is simply not enough. They invoke cities like Hamburg with per capita water consumption of 105 litres per day in 2008 and Munich, Barcelona, Berlin, Copenhagen, and Amsterdam whose water consumption per capita levels are all below 140 litres per day.39 Perhaps, Singapore should raise their prices to reduce consumption even further. While issues do exist, such as still-too-high water consumption levels, relatively high energy use by NEWater and desalination plants* and environmental costs of brine discharges†, Singapore has achieved a lot in a short time span. The 3Ps have come together to control pollution, reduce water consumption, reduce unaccounted-for water‡ and create what could become a self-sufficient water supply in the future. Energy and Atmosphere Due to Singapore’s lack of natural resources, the city-state depends on imports of oil, natural gas and coal from other countries. In 2009, Singapore imported 97.7% of total primary energy supply (TPES) from countries all over the world,40 44,136 ktoe (kilatonnes of oil equivalent) of crude oil and 86,266 ktoe of petroleum products. (A lot of petroleum products imported are refined and then exported).41 Natural gas accounted for 80% of total installed electricity capacity in 2009.42 Singapore’s reliance on imports has led to increased risk of power outages due to disruptions in the
* PUB is working with Equova Water Technologies to pilot desalination using half the energy36 † PUB believes they will be able to recover energy from brine streams in the future36 ‡ From 11% in 1989 to 5% in 20113

13
supply chain. Therefore, the Energy Market Authority has been working to diversify the energy resources that the country imports and to increase petroleum reserves. One way in which diversification is being achieved is through increased usage of natural gas as opposed to crude oil and other petroleum products. Singapore has been turning to natural gas for electricity generation in order to lower carbon emissions and increase efficiency. Over the years, they have shifted from using oil-fired steam turbine plants that use fuel oil to combined cycle gas turbine (CCGT) plants that use natural gas.42 Additionally, they built a liquid natural gas (LNG) terminal in 2013 at a cost of S$1.7 billion44 to increase imports of a liquid form of natural gas. According to Singapore LNG Corporation, initial import capacity of the terminal was 168 billion cubic feet (Bcf). It was increased to 288 Bcf by the end of 2013 and is expected to increase to at least 432 Bcf by 2017.43 In 2014, natural gas accounted for 95% of total installed electricity capacity, 11% of which was liquefied natural gas.42 The government has also created policies that are meant to foster the use of renewable energy and innovation in renewable energy technology. The most likely sources for renewable energy in Singapore are solar and biomass. The city-state has already been generating energy at its waste incineration plants and many companies are exploring other forms of biomass energy generation. However, the greatest potential lies in solar energy. While it is still considered too costly for widespread use, solar power has been implemented at many commercial buildings. In 2011, the National Research Foundation (NRF) produced a report on potential for photovoltaic use in the country, concluding that the grid system is suitable for further photovoltaic generation. “The National Environment Agency (NEA) encourages private and public sector partners to explore and test-bed new technologies through schemes such as the Innovation for Environmental Sustainability (IES) fund, which co-funds innovative environmental projects, and the Environmental Test-bedding Initiative that allows access to public infrastructure for test-bedding purposes.”41 Through partnerships between the government and private companies, it is looking like renewable energy will become a feasible alternative once innovative new technologies drive costs down to a level that will allow for widespread adoption. In addition to the government’s focus on a robust and diversified supply, they have also worked on decreasing consumption. In 2001, the National Energy Efficiency Committee (NEEC) was formed. The NEEC worked with the 3P sectors to increase efficiency and awareness. It spearheaded many programs including the energy labeling scheme for appliances, fuel economy labeling scheme for cars, the energy audit scheme, and the energy improvement assistance scheme.45 In 2010, the National Climate Change Secretariat (NCCS) was established. The responsibilities of the NCCS are “to facilitate efforts to mitigate carbon emissions in all sectors, help Singapore adapt to the effects of climate change, harness economic and green growth opportunities arising from climate change and encourage public awareness and action on climate change.”46 They have launched brochures titled “Climate Change: How Can I Help?” and “Climate Change: How It Affects You” and infographics aimed at increasing consumer awareness.46 While total final energy consumption per capita has increased from 1.05 toe in 1990 to 1.83 toe in 201040

14
and electricity consumption has increased from 35,489 GWh in 2005 to 44,923 GWh in 201342, energy intensity (energy consumption in tonnes of oil equivalent/mil SGD of GDP) has decreased from 84.7 in 1990 to 61 in 2010,40 indicating a decreasing use of energy per unit of GDP. This has been achieved through the increase in use of highly efficient combined cycle gas turbine plants and “through policies and measures to improve the energy efficiency of key energy use sectors like industry, buildings, transport and households.”19 Singapore’s key strategy to reduce carbon emissions and mitigate climate change is through increased energy efficiency. Natural gas emits 40% less CO2 than fuel oil per unit of electricity generated.19 Therefore, the switch to CCGT plants has had a large impact on carbon emissions. The NEA has also focused on prevention, monitoring, enforcement and education to help mitigate greenhouse gas emissions. The government has encouraged co-regulation of emissions from stationary sources by industry and continues to introduce self-monitoring equipment that will allow for easy enforcement. They have also introduced new regulatory measures for vehicles, especially diesel vehicles. Euro IV emissions standards were introduced in 2006. In order for Singapore to adopt these standards, the government made it mandatory for all diesel-driven vehicles to use ultra low sulphur diesel (ULSD) since 2005. All diesel vehicles must take a Chassis Dynamometer Smoke Test (CDST) that measures smoke emissions under simulated driving conditions. Additional programs have been introduced to encourage owners to switch to greener vehicles. Two of these were the Green Vehicle Rebate and a package introduced in 2004 to encourage owners of buses, taxis and other commercial vehicles to switch to Euro IV diesel vehicles or compressed natural gas vehicles before Euro IV standards were implemented.45 Through increased energy efficiency and clean energy programs, Singapore has been able to clean the air significantly. In 2008, the Pollutant Standards Index (PSI) was at a ‘good’ level (≤ 50 𝜇g/m3) for 96% of the days in the year and at a ‘moderate’ level (51-100 𝜇g/m3) for the remaining 4%. Fine Particulate Matter (PM2.5) has been linked to numerous illnesses and half of these emissions were from diesel vehicles. By targeting diesel vehicle emissions, the PM2.5 level has decreased from an annual average of 21 𝜇g/m3 in 2005 to an annual average of 16 𝜇g/m3 in 2008.19 Carbon intensity (emissions/GDP) has decreased from 0.258 ktCO2/mil SGD in 1990 to 0.152 ktCO2/mil SGD in 2010, a decrease of 41%.40 The government’s use of encouragement, regulation and enforcement is making the air in Singapore cleaner despite increasing population, GDP and vehicle usage. Transportation Three main policies can be said to have driven the transformation of Singapore’s transportation since the 1970s: “1) the explicit choice to pursue a transit-oriented and compact urban structure; 2) the vigorous restraint of private vehicle ownership and usage; and 3) the commitment to the steady improvement of mainstream public transport.”47 These policies were born out of the State and City Planning (SCP) project conducted with the help of the United Nations Development Programme (UNDP) and Australian consultants, which ultimately emerged with the 1971 Concept Plan. The program recommended managing car travel to the city center and restraint

15
of vehicle ownership due to incompatibility with the proposed structure and dearth of land available for road expansion.47 To control road demand and traffic, the Area Licensing Scheme (ALS) was introduced in 1975, which required purchasing a ticket to drive a vehicle into the city center. In 1998, the ALS was replaced with the Electronic Road Pricing (ERP) system. The ERP system attempts to match road supply with car demand at all times of the day. Using short-range radio communication, charges are deducted automatically from ERP cash cards inserted into vehicles. In 2010, annual revenues from ERP were S$90 million. The initial cost of ERP’s installation in 1998 was S$115 million. The ERP system also allows the government to collect real-time traffic data, which then allows them to fine-tune the ERP pricing accordingly. The Land Transport Authority (LTA) plans to introduce a next generation ERP II that will use a Global Navigation Satellite System (GNSS) that will also be able to set prices according to distance travelled. The ERP has been effective at minimizing traffic volume in heavily used roads throughout Singapore.48, 49 The government also introduced a Vehicle Quota System (VQS) in 1990 to control the amount of cars on the roads, whereby Certificates of Entitlement (COE) [to vehicle ownership for ten years] are auctioned off to the highest bidders. The Land Transport Authority began targeting a 3% annual growth rate of vehicle population in 1990. As part of the Land Transport Master Plan 2008, the annual growth rate was reduced from 3% to 1.5% from 2009 to 2012. In 2012, the growth rate was further reduced to 1% and then to 0.5% in 2013 and again to 0.25% in 2015. Roads currently account for 12% of Singapore’s land area (housing for 14%) and the government is running out of land for road expansion.50 The VQS has been the most important tool for capping the vehicle population in Singapore and it has been effective at that.
Figure 12: Vehicle Population 2004-‐2014 | Data Source: Reference 51
Another system called the Parking Guidance System (PGS) was launched in 2008 in response to rising parking congestion. The PGS collects parking data, and its electronic information

16
panels direct drivers to the nearest available parking spaces. The system also charges drivers market-rate prices for using spots that are in locations of high demand. These three systems, along with some other transport initiatives, make up the Intelligent Transport System (ITS). While the ITS has kept vehicle population growth rates at low levels and road and parking congestion at bay, this system seems to be unsustainable if the population is unwilling to give up their vehicles in favor of public transportation. In 2013, only 15% of the population owned their own vehicles.52 It has become the norm for Singaporeans to dream for the status that car ownership would afford them. This system has caused a large rift between the wealthy and the middle-class in Singapore. However, the revenue the government brings in and puts to use for public transportation and other middle-class benefits can be conceived as justifying the gap. But Singaporeans still long to own a car and that is where the problem lies. With a vehicle population that is practically being capped at current levels, COE prices are likely to rise, causing the car ownership dream to drift farther and farther away from the middle-class. The government knows that this is the case and they are working hard to change this image by making public transportation the best means of transportation possible. Singapore’s first steps in improving public transportation came in the 1970s with massive improvements to the busing system. Bus companies were merged together, routes were reorganized, pirate taxis were banned and a network of bus lanes on major roadways was created.47 The Mass Rapid Transit (MRT) rail network was built in 1987 and has grown rapidly. In 1999, a Light Rapid Transit (LRT) network was built to improve transportation around public housing estates. In 2002, the MRT had expanded to 89 km of track with 51 stations and the LRT had 8 km of track with 13 stations. At that time, there were also 4,509 bus stops and 133 taxi stands.53 In accordance with the government’s policy to make public transit the desired means of transportation, all these systems have been expanded and improved upon. In 2013, there were 153 km of MRT track with 105 stations, 29 km of LRT track with 35 stations, 4,638 bus stops and 272 taxi stands.54 Average daily ridership on the MRT has more than doubled since 2005, rising from 1,321,000 in 2005 to 2,762,000 in 2014. Average daily bus ridership has also grown from 2,779,000 in 2005 to 3,751,000 in 2014.55 The growth in ridership is testament to the importance the government places on increasing use of public transportation. Some feel the fluctuations in COE prices show that demand for cars can decrease at times and point to a high level of satisfaction with Singapore’s public transportation as the root cause.47 The government is seeking to make this a permanent reality.

17
Figure 13: MRT, LRT and Roadways in 2014 | Source: seacitymaps.com
Multiple improvements are coming to Singapore’s public transportation. The MRT is going to be expanded to 360 km by 2030 with roomier rail cars and faster speeds. See figure 14 for the MRT’s planned expansion. An upgraded signaling system will provide for six trains every ten minutes instead of the current five. More than 200 km of sheltered walkways are being added by 2018 for MRT, LRT and buses. Thirteen integrated transport hubs in commercial centers with trains, buses and taxis will be built within the next ten years. The Bus Service Enhancement Program (BSEP) has been adding more buses, services and routes. A total of 450 government-funded buses were added through the BSEP as of September 2014.56 Bike lanes are connecting many towns and 8 cycling paths are going to be added to the network, bringing the cycling network to more than 700 km by 2030. 500 roads are going to have improved LED lighting by 2030. 20 km of noise barriers are being added to certain locations along elevated rail tracks.57 An information system accessible on smartphones called MyTransport SG provides real-time updates on rail, bus, taxi and car times, services and rates.56 All of these improvements are being made to increase access to public transportation, shorten waiting times, increase comfort and provide for all-around better service. One day, it is hoped, all Singaporeans will be happy to travel on public transit and no longer desire car ownership.

18
Figure 14: Planned MRT & LRT Expansion (to be completed by 2030) | Source: LTA
Agriculture Singapore’s land area is too small to accommodate agricultural uses. Therefore, most food must be imported to provide for their needs. According to the Agri-Food and Veterinary Authority (AVA), Singapore imported approximately 95% of all vegetables consumed in 2008. As of 2010, there were approximately 1,500 hectares of land devoted to agriculture and aquaculture. Three key initiatives have been highlighted as central to increasing Singapore’s food security: “1) the diversification of food sources; 2) the promotion of food and agro-based industry, research and development; and 3) the increase of local food production.”58 One important diversification initiative of the government is to diversify food import regions across the globe and to store reserves of food earmarked for Singapore in those regions. Many government agencies have programs in place that are aimed at increasing local food production and agricultural technology. The AVA has a S$10 million Food Fund to improve productivity on existing farms or to develop new technology. The Kranji Countryside Association (KCA) in partnership with the government has set up public tours of local farms and other food-related programs. The NParks’ Community-In-Bloom program has planted over 450 gardens since 2005 with ornamental and productive plants. A new technology called Sky Greens is a hydraulically powered rotating vegetable flat system that was developed to create a sustainable agricultural production system with limited area. The prototype installation has 120 towers on 3.5 hectares and uses 75% less water, fertilizer and soil

19
than the same amount grown in the ground. This technology was partially funded by the AVA.58 According to Astee and Kishnani, rooftop farming is another innovation that deserves serious consideration. Their study suggests that HDB roofs are suitable for rooftop farming and if implemented, it could increase local vegetable production to 35.5%. Other additional benefits would include a reduction in heat island effects, increased availability of biofuels and increased opportunities for rainwater storage.59 All of these programs and initiatives, along with increased diversification of imports, are leading to a more food secure Singapore. Key Takeaways
Singapore’s policies and initiatives common throughout all the sustainable categories can provide lessons for other governments to follow when they look to implement their own sustainable development policies and initiatives. While some lessons will not apply to certain countries, such as ones that do not have the capital to implement large capital expenditure programs, other lessons can still be gleaned from areas that are comparable, such as with volunteer programs and public awareness initiatives.
Create a hierarchical government structure The Singapore government consists of high-level ministries with boards, authorities and agencies falling under their purview. An example of this is the Ministry of the Environment and Water Resources (MEWR) with its Public Utilities Board and National Environment Agency. This hierarchical structure has allowed Singapore’s ministries to plan for the long-term and work on large projects, while its boards, authorities and agencies have been able to focus on short-term planning and implementation.
Seek aid from international institutions and consultants when available When Singapore gained independence in 1965, there were daunting tasks facing the government. Loose plans for water management and commerce were in place but not much in the way of how to turn Singapore into a thriving country. Population was rising and proper housing was unavailable. Streets and waterways were polluted and transportation infrastructure was severely lacking. The government worked with the United Nations Development Program and Australian consultants to begin planning for Singapore’s future. Over a 6-year period, from 1965 to 1971, rigorous study was being carried out. The 1971 Concept Plan was created out of those studies. It was a comprehensive plan that set the stage for sustainable future growth. In 1973, the government borrowed money from the World Bank to build its first incineration plant and more money has been borrowed from international agencies over the years. The aid that Singapore received from the international agencies was important for them to get the ball rolling.

20
Plan in detail and do it often The 1971 Concept Plan was only the first of many plans that were created for Singapore. A series of concept plans and master plans laid the groundwork for spatial planning and green plans set goals for Singapore’s green initiatives. Individual government agencies set plans of their own such as the Land Transport Plans and Green Building Plans. Concept plans theoretically were meant to lay the groundwork for 40 to 50 years but they were still updated and improved upon over the years. The master plans were updated every 10 to 15 years. The green plans were sent to consultants for suggestions every 3 years and updates and improvements were made every few years. Most agencies also came out with annual reports that analyzed what had been achieved in the past year and what will be improved upon in the future. All of this planning and re-planning created a constant awareness of what was working and what else needed to be done to achieve future goals. Set realistic goals and make sure they are achieved on time The Singapore government always set goals that were difficult to achieve but that were within their reach if they followed the plan they had prepared. Careful planning led to an understanding of what levels were attainable. Examples of this include achieving a 60% recycling rate, increasing water catchment areas to 67% of land area, growing NEWater and desalination capacities to 30% and 26% of water consumption, respectively, increasing the use of natural gas to 95% of total installed electricity capacity and expanding the MRT rail network to its current length. Partner with private companies Without the help of private companies, Singapore would not have been able accomplish as much as it has. Private companies needed to work with the government on their initiatives to decrease water and energy consumption, to reduce water and air pollution and to increase local food production. Partnerships with local developers and urban planning firms helped create some of the great parks in Singapore, including the Gardens by the Bay project. Economic partnerships with private companies were essential in the construction of NEWater and desalination plants and the LNG Terminal. The contracts provided monetary benefits for both sides and an economic efficiency was born out of them. Provide incentives for private companies’ involvement The Singapore government has provided many incentives to private companies for implementing sustainable features. Some of these incentives are the Green Mark Incentive Scheme, Green Building Floor Area Incentive Scheme, the Skyrise Greenery Incentive Scheme, and Industrial energy and water reduction schemes. All of these incentives have financially encouraged private companies to get on board with government greening initiatives.

21
Provide incentives for innovative technologies A staple in the implementation of a sustainable Singapore has been new innovative technologies. Many of these technologies benefited greatly from government incentives. Incentive funds were set up by many government agencies, including the Innovation for Environmental Sustainability fund and the Ministry of National Development R&D fund to encourage new green building technologies. Some of these incentives led to new waste-to-energy incineration plant technologies, new water desalination technologies (with Equova Water Technologies) and Sky Green vegetable production technologies, among others. If not for these incentives, some of the most innovative and promising technologies for Singapore’s sustainable future may not have been created. Increase public awareness Some of the biggest and most important programs created by Singapore’s government agencies have been ones that focus on increasing public awareness of the sustainability issues at hand. Without public awareness, the people would not decrease consumption, would not volunteer to make a difference and would not approve of the government’s schemes and initiatives. Programs such as the Community-In-Bloom program, numerous recycling awareness programs, the Clean and Green Singapore campaign, the 10-Litre Challenge and Water Efficient Homes programs, energy labeling schemes, fuel economy schemes and many more have brought about a palpable awareness of sustainability issues among Singaporeans. This awareness has led to public concern over these issues and reduced consumption because of it. Provide incentives for individual involvement In addition to incentives provided to private companies, the Singapore government has also provided incentives for individuals to make a difference. The government made it mandatory for waste collection companies to provide incentives for increased recycling and implemented a Green Vehicle Rebate for those who bought vehicles that met green standards. These incentives have also contributed to decreased consumption, increased energy efficiency and reduced air pollution. Conclusion With numerous challenges facing Singapore in 1965, the government took action. They set up plans for the future and carried out their orders. Singapore is truly a City in a Garden with green cover all around and innovative technologies working constantly to maintain the clean and green city-state. As the population continues to rise, the government and their plans will continue to be tested. It remains to be seen how far they can go with their planning and implementation. But if the past is any indication, it looks like they have a bright, green and sustainable future ahead.

22
References 1. Frommer’s Singapore History.
http://www.frommers.com/destinations/singapore/677256#sthash.iL1O2ZJb.dpbs 2. Wayback Machine Internet Archive.
http://wayback.archive.org/web/20070323095958/http://inic.utexas.edu/asnic/countries/singapore/Singapore-History.html
3. Tortajada, C., Joshi, Y., & Biswas, A. 2013. “The Singapore Water Story.” New York: Routledge 4. Singapore Biodiversity: Chapter 23 Sustainable Development. http://lkyspp.nus.edu.sg/wp-content/uploads/2013/04/pa_tk_Singapore-biodiversity_ch-23.pdf 5. Singapore Department of Statistics. 2014. Latest Data. http://www.singstat.gov.sg/statistics/latest-data#14 6. Singapore Department of Statistics. March 2015. Monthly Digest of Statistics Singapore. http://www.singstat.gov.sg/docs/default-source/default-document-
library/publications/publications_and_papers/reference/monthly_digest/mdsmar15.pdf 7. National University of Singapore. 2009. The Natural Heritage of Singapore.
http://www.dbs.nus.edu.sg/staff/details/hugh_tan/Ch4%20Waste-%20and%20Reclaimed%20Land%20p.%2078.pdf
8. Yong Soon, Tan. 2010. Sustainable Development: Challenges and Opportunities. Civil Service
College of Singapore: Ethos – Issue 7. https://www.cscollege.gov.sg/Knowledge/Ethos/Issue%207%20Jan%202010/Pages/Sustainable-Development-Challenges-and-Opportunities.aspx
9. Murphy, Noel. 2013. Singapore Ground Games. http://www.noel-
murphy.com/rotch/2013/07/11/singapore-ground-games/ 10. Ministry of the Environment and Water Resources. 2002. The Singapore Green Plan 2012 (2002
edition) 11. National Parks Board. From Garden City to City in a Garden.
http://www.mnd.gov.sg/MNDAPPImages/About%20Us/From%20Garden%20City%20to%20City%20in%20a%20Garden.pdf
12. http://www.greatnewplaces.com/sg/c909-ParkConnectorsNetwork 13. https://www.skyrisegreenery.com/index.php/home/incentive_scheme/about/ 14. https://www.nparks.gov.sg/gardens-parks-and-nature/skyrise-greenery 15. Lang, Ng. 2008. A City in a Garden. Civil Service College of Singapore: World Cities Summit
Issue. https://www.cscollege.gov.sg/knowledge/ethos/world%20cities%20summit/Pages/08A%20City%20in%20a%20Garden.aspx

23
16. http://www.grant-associates.uk.com/projects/gardens-by-the-bay/ 17. Ministry of the Environment and Water Resources. 2005. State of the Environment 2005 Chapter 3 –
Land. https://www.mewr.gov.sg/docs/default-source/default-document-library/grab-our-research/soe-report-2005(minister-39-s-messageintroduction).pdf
18. Integrated Thinking: Solid Waste Management in Singapore. Waste Management World: Volume 8,
Issue 1. http://www.waste-management-world.com/articles/print/volume-8/issue-1/features/integrated-thinking-solid-waste-management-in-singapore.html
19. http://www.mewr.gov.sg/grab-our-research/singapore-green-plan-2012 20. Ministry of the Environment and Water Resources. 2008. State of the Environment 2008 Chapter 4 –
Land. http://www.mewr.gov.sg/grab-our-research/state-of-the-environment-report-2008 21. Zero Waste Singapore. Singapore Waste Statistics 2012.
http://www.zerowastesg.com/2013/04/01/singapore-waste-statistics-2012/ 22. National Environment Agency. Waste Statistics and Recycling Rate for 2014.
http://www.nea.gov.sg/energy-waste/waste-management/waste-statistics-and-overall-recycling 23. Building and Construction Authority. 2012. Singapore: Leading the Way for Green Buildings in the
Tropics. https://www.bca.gov.sg/greenmark/others/sg_green_buildings_tropics.pdf 24. Building and Construction Authority. BCA Green Mark for New Residential Buildings.
http://www.bca.gov.sg/greenmark/others/gm_resi_v4.1_R.pdf 25. Building and Construction Authority. 2009. 2nd Green Building Masterplan.
http://www.bca.gov.sg/GreenMark/others/2nd_Green_Building_Masterplan.pdf 26. https://www.nccs.gov.sg/climatechallenge/issue05/green-tech.html 27. Building and Construction Authority. 2014. 3rd Green Building Masterplan.
http://www.bca.gov.sg/GreenMark/others/3rd_Green_Building_Masterplan.pdf 28. Tortajada, C & Joshi, Y. 2013. Water Resources Management and Governance as Part of an
Overall Framework for Growth and Development. http://www.thirdworldcentre.org/wrmgovernance.pdf
29. Chou, L.M. 1998. The Cleaning of Singapore River and the Kallang Basin: approaches, methods,
investments and benefits. Ocean and Coastal Management 38: 133-145 30. Tan, Y.S. 2009. Clean, Green and Blue. Singapore: Institute of Southeast Asian Studies. 31. Tortajada, C, Joshi, Y, & Biswas, A. 2012. Cleaning of the Singapore River and Kallang Basin in
Singapore: Human and Environmental Dimensions. SpringerLink: AMBIO - November 2012, Volume 41, Issue 7, pp. 777-781.

24
32. Public Utilities Board. Managing Stormwater For Our Future. http://www.pub.gov.sg/managingflashfloods/Documents/ManagingStormwater.pdf
33. Chew, Valerie. 2011. Singapore-Malaysia Water Agreements. Singapore Infopedia.
http://eresources.nlb.gov.sg/infopedia/articles/SIP_1533_2009-06-23.html 34. http://www.pub.gov.sg/water/Pages/LocalCatchment.aspx 35. Ministry of the Environment and Water Resources. 2005. State of the Environment 2005 Chapter 2 –
Water. https://www.mewr.gov.sg/docs/default-source/default-document-library/grab-our-research/soe-report-2005(minister-39-s-messageintroduction).pdf
36. Public Utilities Board. 2015. Our Water, Our Future.
http://www.pub.gov.sg/mpublications/OurWaterOurFuture/Documents/OurWaterOurFuture_2015.pdf
37. http://www.pub.gov.sg/dtss/Pages/default.aspx 38. http://www.pub.gov.sg/dtss/dtssph1/Pages/default.aspx?Print2=yes 39. Tortajada, C & Biswas, A. 2014. Managing Singapore’s Water. The Business Times.
http://www.businesstimes.com.sg/opinion/managing-singapores-water 40. Ang, B.W., Choong, W.L., & T.S., Ng. A Framework for Evaluating Singapore’s Energy Security.
Applied Energy: Volume 148.15 June 2015, pp. 314-325. 41. http://www.reegle.info/policy-and-regulatory-overviews/SG 42. Energy Market Authority. Singapore Energy Statistics 2014.
https://www.ema.gov.sg/cmsmedia/Publications_and_Statistics/Publications/EMA_SES%202014.pdf
43. U.S. Energy Information Administration. Singapore. http://www.eia.gov/countries/country-
data.cfm?fips=sn 44. Singapore LNG Corporation. 2014. Press Release. http://www.slng.com.sg/newsroom-press-release-
20140225.html 45. Ministry of the Environment and Water Resources. 2006. The Singapore Green Plan 2012 (2006
Edition) Chapter 1: Clean Air Always. 46. National Climate Change Secretariat. https://www.nccs.gov.sg/about-nccs 47. Barter, Paul A. 2008. Singapore’s Urban Transport: Sustainability by Design or Necessity? Spatial
Planning for a Sustainable Singapore 2008, pp. 95-112. 48. C40 Cities & Siemens. 2013. City Climate Leadership Awards: Singapore Climate Close-Up.
http://cityclimateleadershipawards.com/wp-content/uploads/2014/06/Singapore-Climate-Close-Up.pdf

25
49. Land Transport Authority. Electronic Road Pricing. http://www.lta.gov.sg/content/ltaweb/en/roads-and-motoring/managing-traffic-and-congestion/electronic-road-pricing-erp.html
50. Ministry of Transport. Vehicle Ownership. http://www.mot.gov.sg/About-MOT/Land-
Transport/Motoring/Vehicle-Ownership/ 51. Land Transport Authority. Annual Vehicle Statistics 2014: Motor Vehicle Population by Vehicle
Type. http://www.lta.gov.sg/content/dam/ltaweb/corp/PublicationsResearch/files/FactsandFigures/MVP01-1_MVP_by_type.pdf
52. Kirk, Mimi. In Singapore, Making Cars Unaffordable Has Only Made Them More Desirable. From
the Atlantic CityLab. http://www.citylab.com/commute/2013/06/singapore-making-cars-unaffordable-has-only-made-them-more-desirable/5931/
53. Land Transport Authority. Singapore Land Transport Statistics in Brief 2004.
http://www.lta.gov.sg/content/dam/ltaweb/corp/PublicationsResearch/files/FactsandFigures/Statistic_Brief-layout_final.pdf
54. Land Transport Authority. Singapore Land Transport Statistics in Brief 2014.
http://www.lta.gov.sg/content/dam/ltaweb/corp/PublicationsResearch/files/FactsandFigures/Statistics%20in%20Brief%202014.pdf
55. Land Transport Authority. 2015. Public Transport Ridership.
http://www.lta.gov.sg/content/dam/ltaweb/corp/PublicationsResearch/files/FactsandFigures/PT%20Ridership.pdf
56. Land Transport Authority. Transforming Your Daily Lives: LTA Annual Report 2013/2014.
http://www.lta.gov.sg/content/dam/ltaweb/corp/PublicationsResearch/files/AnnualReports/1314/LTA%20AR%202014%20web.pdf
57. Land Transport Authority. Land Transport Sustainability Update 2014.
http://www.lta.gov.sg/content/dam/ltaweb/corp/PublicationsResearch/files/ReportNewsletter/Sustainability%20Update%202014.pdf
58. Christ, Melissa Cate. 2013. Food Security and the Commons in ASEAN: The Role of Singapore.
ICIRD. 59. Kishnani, Nirmal & Astee. Lim Yinghui. Building Integrated Architecture: Utilizing Rooftops for
Sustainable Food Crop Cultivation in Singapore. https://www.academia.edu/7367088/Building_Integrated_Agriculture_Utilising_Rooftops_for_Sustainable_Food_Crop_Cultivation_in_Singapore