Singapore Rigbuilders - DBS Bank
49
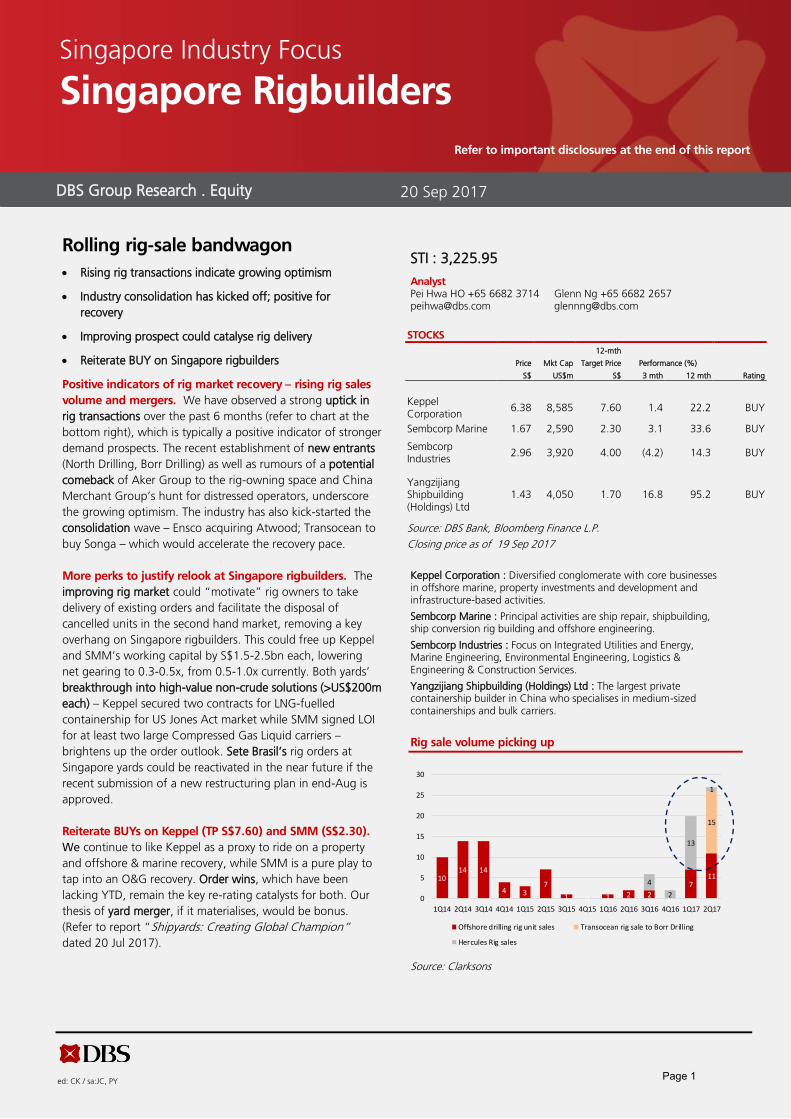
ed: CK / sa:JC, PY Rolling rig-sale bandwagon Rising rig transactions indicate growing optimism Industry consolidation has kicked off; positive for recovery Improving prospect could catalyse rig delivery Reiterate BUY on Singapore rigbuilders Positive indicators of rig market recovery – rising rig sales volume and mergers. We have observed a strong uptick in rig transactions over the past 6 months (refer to chart at the bottom right), which is typically a positive indicator of stronger demand prospects. The recent establishment of new entrants (North Drilling, Borr Drilling) as well as rumours of a potential comeback of Aker Group to the rig-owning space and China Merchant Group’s hunt for distressed operators, underscore the growing optimism. The industry has also kick-started the consolidation wave – Ensco acquiring Atwood; Transocean to buy Songa – which would accelerate the recovery pace. More perks to justify relook at Singapore rigbuilders. The improving rig market could “motivate” rig owners to take delivery of existing orders and facilitate the disposal of cancelled units in the second hand market, removing a key overhang on Singapore rigbuilders. This could free up Keppel and SMM’s working capital by S$1.5-2.5bn each, lowering net gearing to 0.3-0.5x, from 0.5-1.0x currently. Both yards’ breakthrough into high-value non-crude solutions (>US$200m each) – Keppel secured two contracts for LNG-fuelled containership for US Jones Act market while SMM signed LOI for at least two large Compressed Gas Liquid carriers – brightens up the order outlook. Sete Brasil’s rig orders at Singapore yards could be reactivated in the near future if the recent submission of a new restructuring plan in end-Aug is approved. Reiterate BUYs on Keppel (TP S$7.60) and SMM (S$2.30). We continue to like Keppel as a proxy to ride on a property and offshore & marine recovery, while SMM is a pure play to tap into an O&G recovery. Order wins, which have been lacking YTD, remain the key re-rating catalysts for both. Our thesis of yard merger, if it materialises, would be bonus. (Refer to report “Shipyards: Creating Global Champion” dated 20 Jul 2017). STI : 3,225.95 Analyst Pei Hwa HO +65 6682 3714 Glenn Ng +65 6682 2657 [email protected] [email protected] Keppel Corporation : Diversified conglomerate with core businesses in offshore marine, property investments and development and infrastructure-based activities. Sembcorp Marine : Principal activities are ship repair, shipbuilding, ship conversion rig building and offshore engineering. Sembcorp Industries : Focus on Integrated Utilities and Energy, Marine Engineering, Environmental Engineering, Logistics & Engineering & Construction Services. Yangzijiang Shipbuilding (Holdings) Ltd : The largest private containership builder in China who specialises in medium-sized containerships and bulk carriers. Rig sale volume picking up Source: Clarksons 10 14 14 4 3 7 1 0 1 2 2 0 7 11 15 4 2 13 1 0 5 10 15 20 25 30 1Q14 2Q14 3Q14 4Q14 1Q15 2Q15 3Q15 4Q15 1Q16 2Q16 3Q16 4Q16 1Q17 2Q17 Offshore drilling rig unit sales Transocean rig sale to Borr Drilling Hercules Rig sales DBS Group Research . Equity 20 Sep 2017 Singapore Industry Focus Singapore Rigbuilders Refer to important disclosures at the end of this report STOCKS 12-mth Price Mkt Cap Target Price Performance (%) S$ US$m S$ 3 mth 12 mth Rating Keppel Corporation 6.38 8,585 7.60 1.4 22.2 BUY Sembcorp Marine 1.67 2,590 2.30 3.1 33.6 BUY Sembcorp Industries 2.96 3,920 4.00 (4.2) 14.3 BUY Yangzijiang Shipbuilding (Holdings) Ltd 1.43 4,050 1.70 16.8 95.2 BUY Source: DBS Bank, Bloomberg Finance L.P. Closing price as of 19 Sep 2017 Page 1
-
Upload
khangminh22 -
Category
Documents
-
view
1 -
download
0
Transcript of Singapore Rigbuilders - DBS Bank
ed: CK / sa:JC, PY
Rolling rig-sale bandwagon
Rising rig transactions indicate growing optimism
Industry consolidation has kicked off; positive for
recovery
Improving prospect could catalyse rig delivery
Reiterate BUY on Singapore rigbuilders
Positive indicators of rig market recovery – rising rig sales
volume and mergers. We have observed a strong uptick in
rig transactions over the past 6 months (refer to chart at the
bottom right), which is typically a positive indicator of stronger
demand prospects. The recent establishment of new entrants
(North Drilling, Borr Drilling) as well as rumours of a potential
comeback of Aker Group to the rig-owning space and China
Merchant Group’s hunt for distressed operators, underscore
the growing optimism. The industry has also kick-started the
consolidation wave – Ensco acquiring Atwood; Transocean to
buy Songa – which would accelerate the recovery pace.
More perks to justify relook at Singapore rigbuilders. The
improving rig market could “motivate” rig owners to take
delivery of existing orders and facilitate the disposal of
cancelled units in the second hand market, removing a key
overhang on Singapore rigbuilders. This could free up Keppel
and SMM’s working capital by S$1.5-2.5bn each, lowering
net gearing to 0.3-0.5x, from 0.5-1.0x currently. Both yards’
breakthrough into high-value non-crude solutions (>US$200m
each) – Keppel secured two contracts for LNG-fuelled
containership for US Jones Act market while SMM signed LOI
for at least two large Compressed Gas Liquid carriers –
brightens up the order outlook. Sete Brasil’s rig orders at
Singapore yards could be reactivated in the near future if the
recent submission of a new restructuring plan in end-Aug is
approved.
Reiterate BUYs on Keppel (TP S$7.60) and SMM (S$2.30).
We continue to like Keppel as a proxy to ride on a property
and offshore & marine recovery, while SMM is a pure play to
tap into an O&G recovery. Order wins, which have been
lacking YTD, remain the key re-rating catalysts for both. Our
thesis of yard merger, if it materialises, would be bonus.
(Refer to report “Shipyards: Creating Global Champion”
dated 20 Jul 2017).
STI : 3,225.95
Analyst Pei Hwa HO +65 6682 3714 Glenn Ng +65 6682 2657 [email protected] [email protected]
Keppel Corporation : Diversified conglomerate with core businesses in offshore marine, property investments and development and infrastructure-based activities.
Sembcorp Marine : Principal activities are ship repair, shipbuilding, ship conversion rig building and offshore engineering.
Sembcorp Industries : Focus on Integrated Utilities and Energy, Marine Engineering, Environmental Engineering, Logistics & Engineering & Construction Services.
Yangzijiang Shipbuilding (Holdings) Ltd : The largest private containership builder in China who specialises in medium-sized containerships and bulk carriers.
Rig sale volume picking up
Source: Clarksons
1014 14
4 37
1 0 1 2 20
711
15
4
2
13
1
0
5
10
15
20
25
30
1Q14 2Q14 3Q14 4Q14 1Q15 2Q15 3Q15 4Q15 1Q16 2Q16 3Q16 4Q16 1Q17 2Q17
Offshore drilling rig unit sales Transocean rig sale to Borr Drilling
Hercules Rig sales
DBS Group Research . Equity 20 Sep 2017
Singapore Industry Focus
Singapore Rigbuilders
Refer to important disclosures at the end of this report
STOCKS
12-mth
Price Mkt Cap Target Price Performance (%)
S$ US$m S$ 3 mth 12 mth Rating
Keppel Corporation
6.38 8,585 7.60 1.4 22.2 BUY
Sembcorp Marine 1.67 2,590 2.30 3.1 33.6 BUY
Sembcorp Industries
2.96 3,920 4.00 (4.2) 14.3 BUY
Yangzijiang Shipbuilding (Holdings) Ltd
1.43 4,050 1.70 16.8 95.2 BUY
Source: DBS Bank, Bloomberg Finance L.P.
Closing price as of 19 Sep 2017
Page 1
Industry Focus
Singapore Rigbuilders
RIG SALE & CONSOLIDATION PICKING UP
RISING SECONDHAND VOLUME
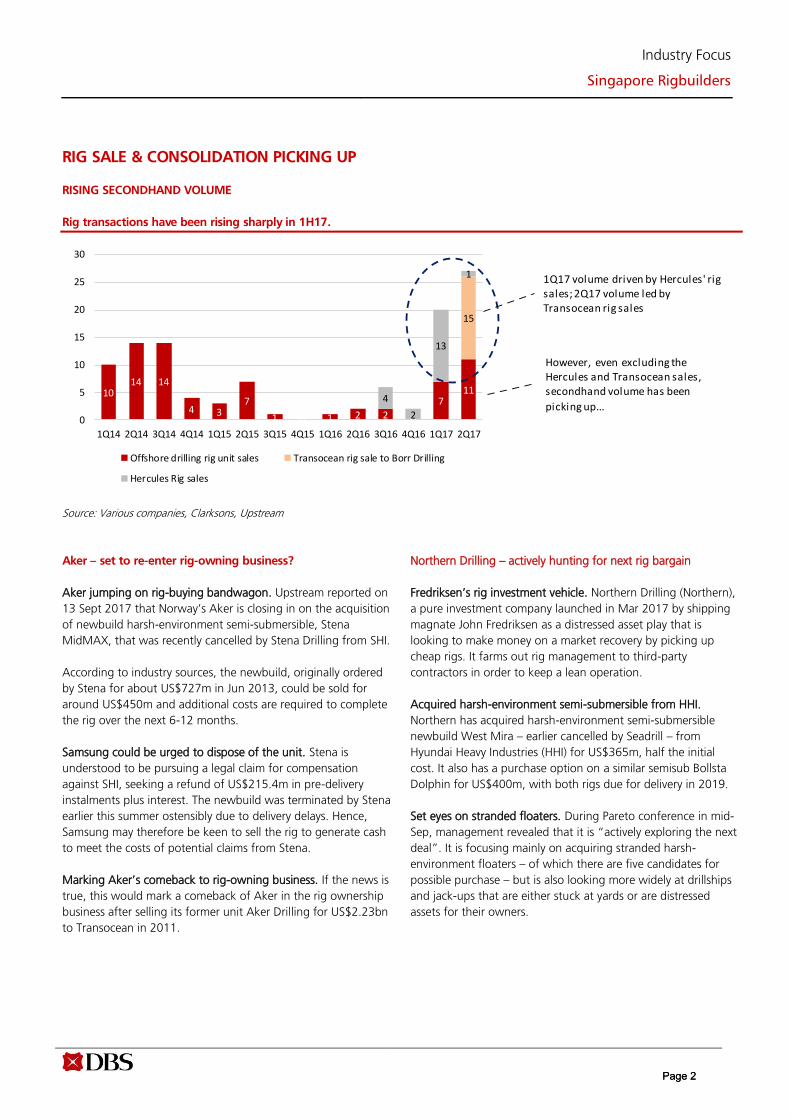
Rig transactions have been rising sharply in 1H17.
Source: Various companies, Clarksons, Upstream
Aker – set to re-enter rig-owning business?
Aker jumping on rig-buying bandwagon. Upstream reported on
13 Sept 2017 that Norway’s Aker is closing in on the acquisition
of newbuild harsh-environment semi-submersible, Stena
MidMAX, that was recently cancelled by Stena Drilling from SHI.
According to industry sources, the newbuild, originally ordered
by Stena for about US$727m in Jun 2013, could be sold for
around US$450m and additional costs are required to complete
the rig over the next 6-12 months.
Samsung could be urged to dispose of the unit. Stena is
understood to be pursuing a legal claim for compensation
against SHI, seeking a refund of US$215.4m in pre-delivery
instalments plus interest. The newbuild was terminated by Stena
earlier this summer ostensibly due to delivery delays. Hence,
Samsung may therefore be keen to sell the rig to generate cash
to meet the costs of potential claims from Stena.
Marking Aker’s comeback to rig-owning business. If the news is
true, this would mark a comeback of Aker in the rig ownership
business after selling its former unit Aker Drilling for US$2.23bn
to Transocean in 2011.
Northern Drilling – actively hunting for next rig bargain
Fredriksen’s rig investment vehicle. Northern Drilling (Northern),
a pure investment company launched in Mar 2017 by shipping
magnate John Fredriksen as a distressed asset play that is
looking to make money on a market recovery by picking up
cheap rigs. It farms out rig management to third-party
contractors in order to keep a lean operation.
Acquired harsh-environment semi-submersible from HHI.
Northern has acquired harsh-environment semi-submersible
newbuild West Mira – earlier cancelled by Seadrill – from
Hyundai Heavy Industries (HHI) for US$365m, half the initial
cost. It also has a purchase option on a similar semisub Bollsta
Dolphin for US$400m, with both rigs due for delivery in 2019.
Set eyes on stranded floaters. During Pareto conference in mid-
Sep, management revealed that it is “actively exploring the next
deal”. It is focusing mainly on acquiring stranded harsh-
environment floaters – of which there are five candidates for
possible purchase – but is also looking more widely at drillships
and jack-ups that are either stuck at yards or are distressed
assets for their owners.
1014 14
4 37
1 0 1 2 20
711
15
4
2
13
1
0
5
10
15
20
25
30
1Q14 2Q14 3Q14 4Q14 1Q15 2Q15 3Q15 4Q15 1Q16 2Q16 3Q16 4Q16 1Q17 2Q17
Offshore drilling rig unit sales Transocean rig sale to Borr Drilling
Hercules Rig sales
1Q17 volume driven by Hercules' rig sales; 2Q17 volume led by Transocean rig sales
However, even excluding the Hercules and Transocean sales, secondhand volume has been
picking up...
Page 2Page 2
Industry Focus
Singapore Rigbuilders
Borr Drilling – sees a “window of opportunity” for rig deals
Building high specification jackup empire. Borr Drilling Limited
(Borr), founded in Aug 2016 by John Fredriksen’s ex-associate
Tor Olav Troim and listed on Oslo at end-Aug 2017, has built up
a fleet of 17 premium jack-ups at an average acquisition price of
US$107m/rig, in two rig deals involving Transocean and
bankrupt Hercules Offshore.
Landmark Transocean deal consists of 15 jackups. In Mar 2017,
Borr signed a letter of intent with Transocean for the acquisition
of its entire 15 high-specification jackup rigs for US$1.35bn,
including five newbuilds under construction at Keppel FELS
Limited.
In negotiation for further advantageous jackup deals. Borr is
well-positioned in a price competition for contracts with a
break-even cost per rig that is around 50% lower than its peers.
The new CEO Simon Johnson, who comes on board 1 Aug,
shared at Pareto Securities’ Oil & Offshore conference in Oslo
that Borr will continue to grow their fleet as it sees a “window
of opportunity” for further advantageous rig deals. He further
elaborated that the company is in talks with different players
and “anticipate these discussions to bear fruit”.
Introducing new operator contracting model. Besides the cost
advantage, Borr also aims to differentiate itself from rivals by
offering a new contracting model for operators with features
such as performance incentives based on drilling efficiency, in
collaboration with partner Schlumberger that holds a 20% stake
in Borr.
Page 3Page 3
Industry Focus
Singapore Rigbuilders
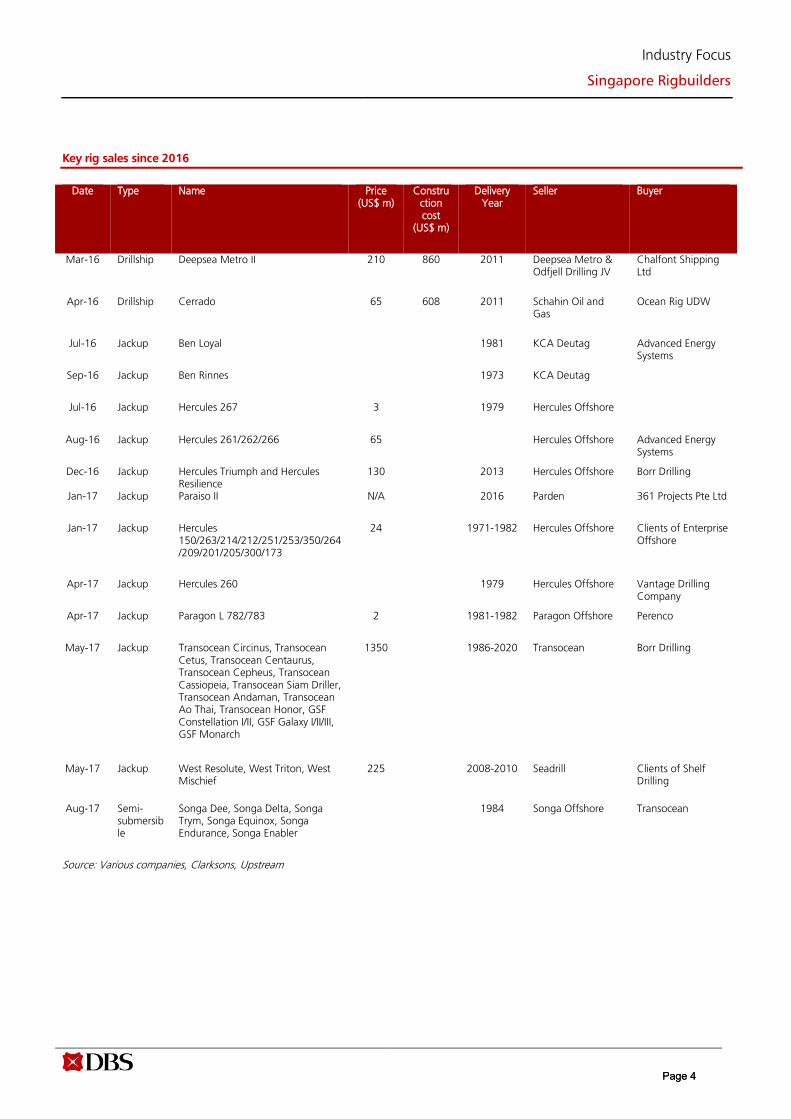
Key rig sales since 2016
Date Type Name Price (US$ m)
Construction cost
(US$ m)
Delivery Year
Seller Buyer
Mar-16 Drillship Deepsea Metro II 210 860 2011 Deepsea Metro & Odfjell Drilling JV
Chalfont Shipping Ltd
Apr-16 Drillship Cerrado 65 608 2011 Schahin Oil and Gas
Ocean Rig UDW
Jul-16 Jackup Ben Loyal 1981 KCA Deutag Advanced Energy Systems
Sep-16 Jackup Ben Rinnes 1973 KCA Deutag
Jul-16 Jackup Hercules 267 3 1979 Hercules Offshore
Aug-16 Jackup Hercules 261/262/266 65 Hercules Offshore Advanced Energy Systems
Dec-16 Jackup Hercules Triumph and Hercules Resilience
130 2013 Hercules Offshore Borr Drilling
Jan-17 Jackup Paraiso II N/A 2016 Parden 361 Projects Pte Ltd
Jan-17 Jackup Hercules 150/263/214/212/251/253/350/264/209/201/205/300/173
24 1971-1982 Hercules Offshore Clients of Enterprise Offshore
Apr-17 Jackup Hercules 260 1979 Hercules Offshore Vantage Drilling Company
Apr-17 Jackup Paragon L 782/783 2 1981-1982 Paragon Offshore Perenco
May-17 Jackup Transocean Circinus, Transocean Cetus, Transocean Centaurus, Transocean Cepheus, Transocean Cassiopeia, Transocean Siam Driller, Transocean Andaman, Transocean Ao Thai, Transocean Honor, GSF Constellation I/II, GSF Galaxy I/II/III, GSF Monarch
1350 1986-2020 Transocean Borr Drilling
May-17 Jackup West Resolute, West Triton, West Mischief
225 2008-2010 Seadrill Clients of Shelf Drilling
Aug-17 Semi-submersible
Songa Dee, Songa Delta, Songa Trym, Songa Equinox, Songa Endurance, Songa Enabler
1984 Songa Offshore Transocean
Source: Various companies, Clarksons, Upstream
Page 4Page 4
Industry Focus
Singapore Rigbuilders
RIG CONSOLIDATION WAVE
Transocean to buy Songa
Transocean pays US$3.4bn for Songa. In mid-Aug 2017,
Transocean Ltd (Transocean) announced that it is acquiring
Songa Offshore (Songa) for US$3.4bn. The offer price of
NOK47.50 per Songa share represents a 37% premium to the
five-day average closing price.
Strengthen positioning in harsh-environment, deepwater rigs.
The transaction strengthens Transocean’s industry-leading
position with the addition of Songa’s four “Cat-D” harsh-
environment, semisubmersible drilling rigs on long-term
contracts with Statoil in Norway. Besides, Songa’s fleet also
includes three additional semisubmersible drilling rigs.
The combined company will operate a fleet of 51 mobile
offshore drilling units, consisting of 30 ultra-deepwater floaters,
11 harsh environment floaters, three deepwater floaters and
seven midwater floaters. Additionally, Transocean has four ultra-
deepwater drillships under construction, including two
contracted with Shell for ten years each.
Cost synergies. The transaction is expected to be earnings
accretive and yields annual expense synergies of approximately
US$40m.
Ensco acquires Atwood
Ensco to acquire Atwood Oceanics in an all-stock deal valued at
about US$863m. Ensco plc (Ensco) and Atwood Oceanics, Inc.
(Atwood) jointly announced in end-May 2017 that they have
entered into a definitive merger agreement under which Ensco
will acquire Atwood in an all-stock transaction.
Offer price premium of 33%. The offer price of US$10.72 per
Atwood share (at a swap ratio of 1.6x Ensco share for every
Atwood share) represents a premium of approximately 33% to
Atwood’s closing price on 26 May.
Potential cost synergies. Post-merger, Ensco and Atwood
shareholders will own approximately 69% and 31%,
respectively, of Ensco. The merged entity is expected to realise
annual pre-tax expense synergies of approximately U$65m for
full-year 2019 and beyond.
Widened product offerings. The deal will provide Ensco with six
ultradeepwater floaters, including four drillships, and five high-
specification jackups. Post-transaction, the combined company
will have a fleet of 63 rigs, including ultradeepwater drillships,
deep and midwater semisubmersibles, and shallow-water
jackups, with a customer base of 27 national oil companies,
supermajors, and independents.
China Merchants Group – from rig-builder to rig-owner?
Looking to acquire distressed offshore rig operators or assets? In
early-Sep 2017, state-owned conglomerate China Merchants
Group is reportedly exploring acquisitions of distressed offshore
rig operators. It is said to have looked at various assets and
companies including Seadrill Ltd (Seadrill) and Shelf Drilling Ltd
(Shelf). These efforts are at an early stage, and China Merchants
may also opt to pick off assets as opposed to full takeovers.
Moving up value chain. The group’s China Merchants Industry
Holdings Co. unit builds semi-submersible rigs and other
offshore equipment. It is also a minority shareholder in the
parent company of CIMC Raffles, which builds drilling platforms
used by oil producers, including China National Petroleum Corp.
RIG MARKET ON RECOVERY TRACK
Brent crude oil prices holding up at the US$55/bbl level; gradual
recovery expected going into 2018. Our forecast of US$50-
55/bbl average Brent price in 2017 looks broadly on track to be
met, with YTD Brent price averaging US$52.2/bbl currently. We
believe the global crude oil rebalancing should accelerate into
2018, driven by demand outstripping supply and thus inventory
drawdowns. Additionally, we think worries over US shale oil
production could be overblown as we see evidence of US shale
productivity gains plateauing, and cash operating costs look to
have bottomed. Thus, we are forecasting an average price of
US$55-60/bbl for Brent in 2018, followed by US$60-65/bbl in
the long term (based on a marginal cost curve analysis).
Industry capital expenditure looks to have bottomed; 2018
could see an upswing. If we look at the capital expenditure
(capex) budgets for 2017 of the eight largest international oil
companies (IOCs), the trend is essentially flattish compared to
2016 (up 1% y-o-y). However, as the oil market rebalances, and
prices stabilise in the US$50-$60/bbl range, we believe oil
majors may consider revising up future capex estimates in 2018,
which could support higher spending in 2H18 and 2019.
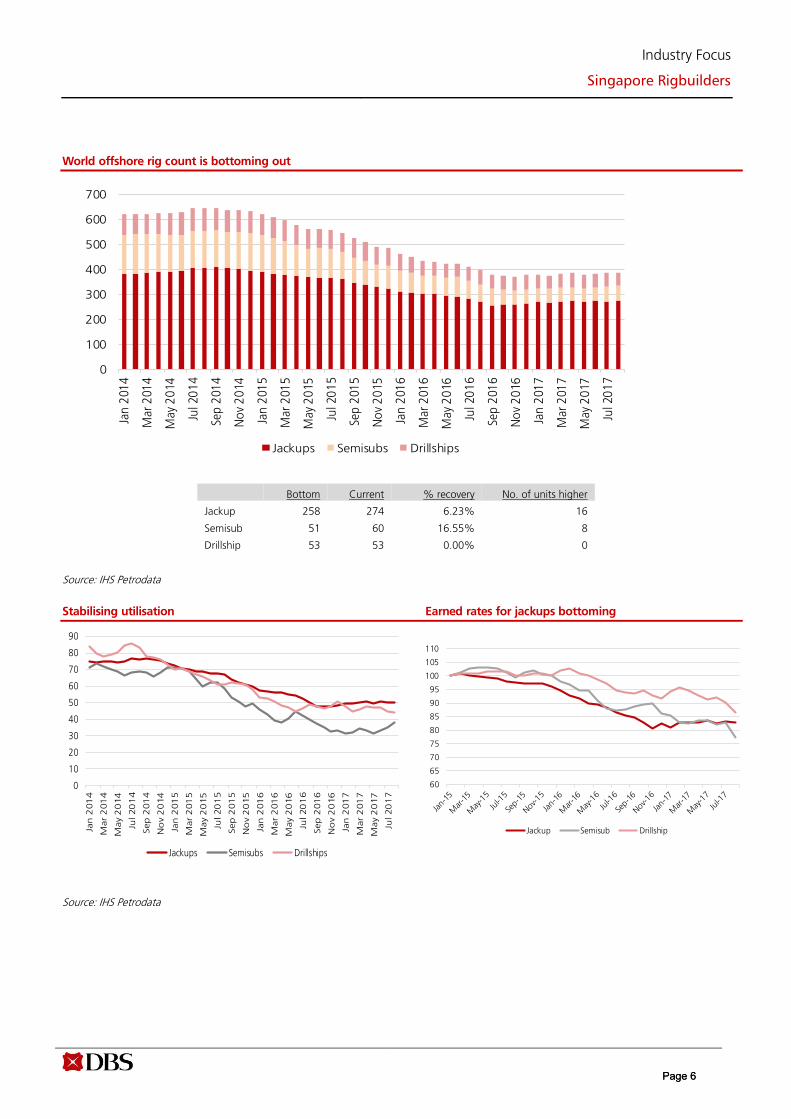
Green shoots of a recovery: offshore working rig count has
bottomed in 1Q17. After falling from a peak of 736 contracted
offshore rigs in April 2014 to 457 rigs in January 2017, the
working rig count has taken a U-shaped upward trajectory since
February 2017, with the rig count as of August 2017 rising
c.6.5% from January’s trough levels. A meaningful rebound in
the working rig count would of course be predicated on oil
majors increasing their capex budgets.
Page 5Page 5
Industry Focus
Singapore Rigbuilders
World offshore rig count is bottoming out
Source: IHS Petrodata
Stabilising utilisation Earned rates for jackups bottoming
Source: IHS Petrodata
Bottom Current % recovery No. of units higher
Jackup 258 274 6.23% 16
Semisub 51 60 16.55% 8
Drillship 53 53 0.00% 0
0
100
200
300
400
500
600
700
Jan
201
4
Mar
201
4
May
20
14
Jul 2
01
4
Sep
201
4
No
v 2
014
Jan
201
5
Mar
201
5
May
20
15
Jul 2
01
5
Sep
201
5
No
v 2
015
Jan
201
6
Mar
201
6
May
20
16
Jul 2
01
6
Sep
201
6
No
v 2
016
Jan
201
7
Mar
201
7
May
20
17
Jul 2
01
7
Jackups Semisubs Drillships
0
10
20
30
40
50
60
70
80
90
Jan
201
4
Mar
201
4
May 2
014
Jul 20
14
Sep
201
4
No
v 2
014
Jan
201
5
Mar
201
5
May 2
015
Jul 20
15
Sep
201
5
No
v 2
015
Jan
201
6
Mar
201
6
May 2
016
Jul 20
16
Sep
201
6
No
v 2
016
Jan
201
7
Mar
201
7
May 2
017
Jul 20
17
Jackups Semisubs Drillships
60
65
70
75
80
85
90
95
100
105
110
Jackup Semisub Drillship
Page 6Page 6
Industry Focus
Singapore Rigbuilders
CATALYSTS FOR RIG DELIVERY
Rig-owners more incentivised to take delivery. While newbuild
order is not expected to come back in big way in the near to
medium term, we believe the improving prospects in the oil
market and rig supply/demand could “motivate” rig owners to
take delivery of existing orders and facilitate the disposal of
cancelled units in the second hand market, removing a key
overhang on Singapore rig builders. This could free up Keppel
and SMM’s working capital by S$1.5-2.5bn each, lowering net
gearing to 0.3-0.5x from 0.5-1.0x currently. Most of the jackup
rig orders placed with Singapore rigbuilders are on 20:80
payment terms and technically completed or near completion.
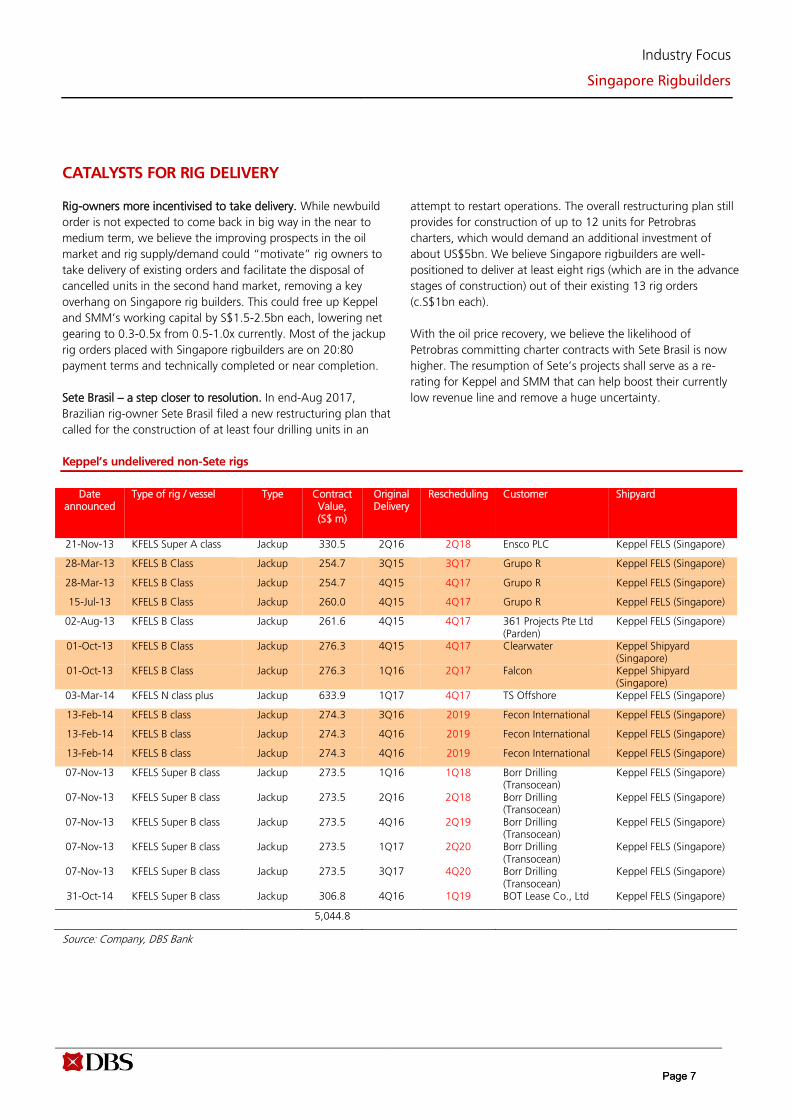
Sete Brasil – a step closer to resolution. In end-Aug 2017,
Brazilian rig-owner Sete Brasil filed a new restructuring plan that
called for the construction of at least four drilling units in an
attempt to restart operations. The overall restructuring plan still
provides for construction of up to 12 units for Petrobras
charters, which would demand an additional investment of
about US$5bn. We believe Singapore rigbuilders are well-
positioned to deliver at least eight rigs (which are in the advance
stages of construction) out of their existing 13 rig orders
(c.S$1bn each).
With the oil price recovery, we believe the likelihood of
Petrobras committing charter contracts with Sete Brasil is now
higher. The resumption of Sete’s projects shall serve as a re-
rating for Keppel and SMM that can help boost their currently
low revenue line and remove a huge uncertainty.
Keppel’s undelivered non-Sete rigs
Date announced
Type of rig / vessel Type Contract Value, (S$ m)
Original Delivery
Rescheduling Customer Shipyard
21-Nov-13 KFELS Super A class Jackup 330.5 2Q16 2Q18 Ensco PLC Keppel FELS (Singapore)
28-Mar-13 KFELS B Class Jackup 254.7 3Q15 3Q17 Grupo R Keppel FELS (Singapore)
28-Mar-13 KFELS B Class Jackup 254.7 4Q15 4Q17 Grupo R Keppel FELS (Singapore)
15-Jul-13 KFELS B Class Jackup 260.0 4Q15 4Q17 Grupo R Keppel FELS (Singapore)
02-Aug-13 KFELS B Class Jackup 261.6 4Q15 4Q17 361 Projects Pte Ltd (Parden)
Keppel FELS (Singapore)
01-Oct-13 KFELS B Class Jackup 276.3 4Q15 4Q17 Clearwater Keppel Shipyard (Singapore)
01-Oct-13 KFELS B Class Jackup 276.3 1Q16 2Q17 Falcon Keppel Shipyard (Singapore)
03-Mar-14 KFELS N class plus Jackup 633.9 1Q17 4Q17 TS Offshore Keppel FELS (Singapore)
13-Feb-14 KFELS B class Jackup 274.3 3Q16 2019 Fecon International Keppel FELS (Singapore)
13-Feb-14 KFELS B class Jackup 274.3 4Q16 2019 Fecon International Keppel FELS (Singapore)
13-Feb-14 KFELS B class Jackup 274.3 4Q16 2019 Fecon International Keppel FELS (Singapore)
07-Nov-13 KFELS Super B class Jackup 273.5 1Q16 1Q18 Borr Drilling (Transocean)
Keppel FELS (Singapore)
07-Nov-13 KFELS Super B class Jackup 273.5 2Q16 2Q18 Borr Drilling (Transocean)
Keppel FELS (Singapore)
07-Nov-13 KFELS Super B class Jackup 273.5 4Q16 2Q19 Borr Drilling (Transocean)
Keppel FELS (Singapore)
07-Nov-13 KFELS Super B class Jackup 273.5 1Q17 2Q20 Borr Drilling (Transocean)
Keppel FELS (Singapore)
07-Nov-13 KFELS Super B class Jackup 273.5 3Q17 4Q20 Borr Drilling (Transocean)
Keppel FELS (Singapore)
31-Oct-14 KFELS Super B class Jackup 306.8 4Q16 1Q19 BOT Lease Co., Ltd Keppel FELS (Singapore)
5,044.8
Source: Company, DBS Bank
Page 7Page 7
Industry Focus
Singapore Rigbuilders
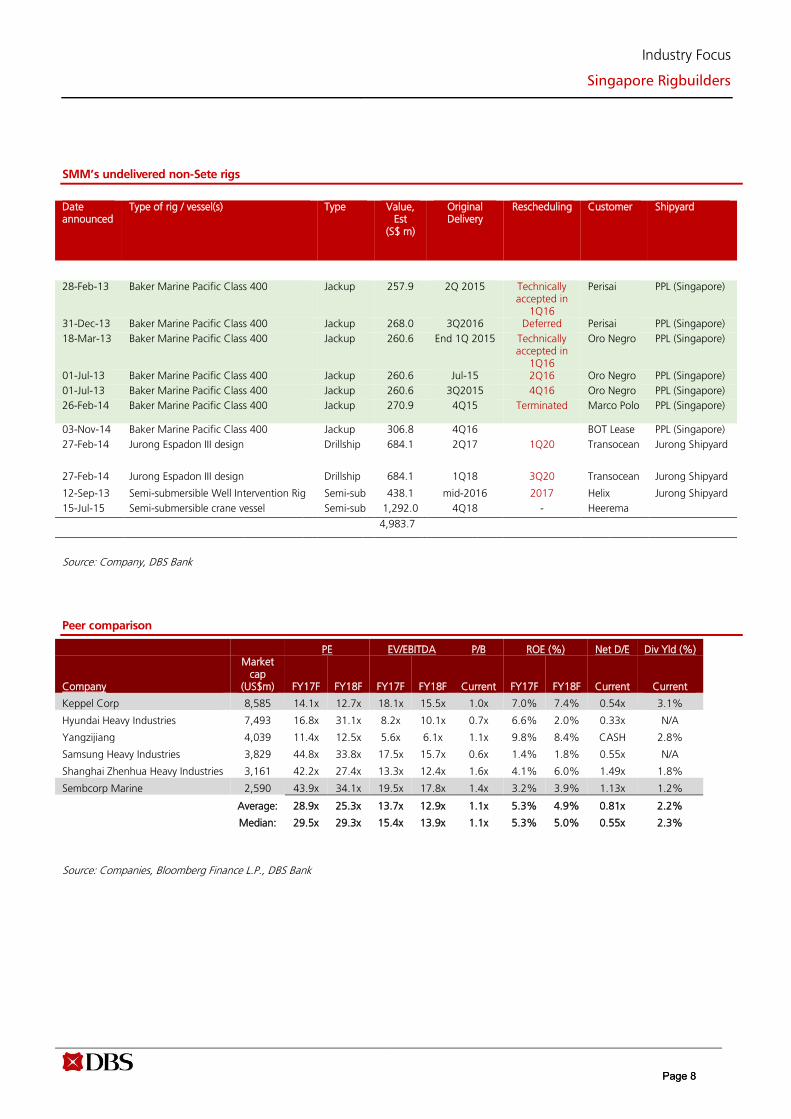
SMM’s undelivered non-Sete rigs
Date announced
Type of rig / vessel(s) Type Value, Est
(S$ m)
Original Delivery
Rescheduling Customer Shipyard
28-Feb-13 Baker Marine Pacific Class 400 Jackup 257.9 2Q 2015 Technically accepted in
1Q16
Perisai PPL (Singapore)
31-Dec-13 Baker Marine Pacific Class 400 Jackup 268.0 3Q2016 Deferred Perisai PPL (Singapore)
18-Mar-13 Baker Marine Pacific Class 400 Jackup 260.6 End 1Q 2015 Technically accepted in
1Q16
Oro Negro PPL (Singapore)
01-Jul-13 Baker Marine Pacific Class 400 Jackup 260.6 Jul-15 2Q16 Oro Negro PPL (Singapore)
01-Jul-13 Baker Marine Pacific Class 400 Jackup 260.6 3Q2015 4Q16 Oro Negro PPL (Singapore)
26-Feb-14 Baker Marine Pacific Class 400 Jackup 270.9 4Q15 Terminated Marco Polo PPL (Singapore)
03-Nov-14 Baker Marine Pacific Class 400 Jackup 306.8 4Q16 BOT Lease PPL (Singapore)
27-Feb-14 Jurong Espadon III design Drillship 684.1 2Q17 1Q20 Transocean Jurong Shipyard
27-Feb-14 Jurong Espadon III design Drillship 684.1 1Q18 3Q20 Transocean Jurong Shipyard
12-Sep-13 Semi-submersible Well Intervention Rig Semi-sub 438.1 mid-2016 2017 Helix Jurong Shipyard
15-Jul-15 Semi-submersible crane vessel Semi-sub 1,292.0 4Q18 - Heerema
4,983.7
Source: Company, DBS Bank
Peer comparison
Source: Companies, Bloomberg Finance L.P., DBS Bank
PE EV/EBITDA P/B ROE (%) Net D/E Div Yld (%)
Company
Market cap
(US$m) FY17F FY18F FY17F FY18F Current FY17F FY18F Current Current
Keppel Corp 8,585 14.1x 12.7x 18.1x 15.5x 1.0x 7.0% 7.4% 0.54x 3.1%
Hyundai Heavy Industries 7,493 16.8x 31.1x 8.2x 10.1x 0.7x 6.6% 2.0% 0.33x N/A
Yangzijiang 4,039 11.4x 12.5x 5.6x 6.1x 1.1x 9.8% 8.4% CASH 2.8%
Samsung Heavy Industries 3,829 44.8x 33.8x 17.5x 15.7x 0.6x 1.4% 1.8% 0.55x N/A
Shanghai Zhenhua Heavy Industries 3,161 42.2x 27.4x 13.3x 12.4x 1.6x 4.1% 6.0% 1.49x 1.8%
Sembcorp Marine 2,590 43.9x 34.1x 19.5x 17.8x 1.4x 3.2% 3.9% 1.13x 1.2%
Average: 28.9x 25.3x 13.7x 12.9x 1.1x 5.3% 4.9% 0.81x 2.2%
Median: 29.5x 29.3x 15.4x 13.9x 1.1x 5.3% 5.0% 0.55x 2.3%
Page 8Page 8
Industry Focus
Singapore Rigbuilders
COMPANY GUIDES
COMPANY GUIDES
Page 9Page 9

ed: JLC / sa:JC, PY
BUY (Upgrade from HOLD)
Last Traded Price ( 20 Jul 2017): S$6.53 (STI : 3,293.13)
Price Target 12-mth: S$7.60 (16% upside) (Prev S$6.00)
Analyst Pei Hwa HO +65 6682 3714 [email protected]
What’s New Keppel closes in on delivery of world’s first FLNG vessel
conversion
A testament to Keppel; smooth operation of this unit
will boost confidence of potential customers
Benefits from improving sentiment on property
Upgrade to BUY; TP lifted to S$7.60
Price Relative
Forecasts and Valuation FY Dec (S$ m) 2015A 2016A 2017F 2018F
Revenue 10,296 6,767 6,568 6,666 EBITDA 2,280 1,392 1,568 1,669 Pre-tax Profit 1,997 1,055 1,202 1,271 Net Profit 1,525 784 907 959 Net Pft (Pre Ex.) 1,476 784 907 959 Net Pft Gth (Pre-ex) (%) 2.2 (46.9) 15.7 5.7 EPS (S cts) 83.9 43.1 49.9 52.7 EPS Pre Ex. (S cts) 81.2 43.1 49.9 52.7 EPS Gth Pre Ex (%) 2 (47) 16 6 Diluted EPS (S cts) 83.6 43.0 49.7 52.5 Net DPS (S cts) 33.9 20.0 20.0 21.1 BV Per Share (S cts) 610 641 671 704 PE (X) 7.8 15.1 13.1 12.4 PE Pre Ex. (X) 8.0 15.1 13.1 12.4 P/Cash Flow (X) nm 36.0 12.0 14.3 EV/EBITDA (X) 8.3 13.8 12.1 11.3 Net Div Yield (%) 5.2 3.1 3.1 3.2 P/Book Value (X) 1.1 1.0 1.0 0.9 Net Debt/Equity (X) 0.5 0.5 0.5 0.5 ROAE (%) 14.2 6.9 7.6 7.7
Earnings Rev (%): - - 4 Consensus EPS (S cts): 47.6 52.0 Other Broker Recs: B: 6 S: 0 H: 12
Source of all data on this page: Company, DBS Bank, Bloomberg Finance L.P
Riding on improving sentiment on property
Upgrade to BUY with higher TP of S$7.60, after raising valuation peg for property segment from 0.85x to 1.0x P/B, in line with larger-cap Singapore developer peers. We have also omitted the 10% conglomerate discount. Property now contributes nearly two-thirds of earnings and valuation. The segment should continue to see promising sales in China, Vietnam and Singapore. Keppel’s decent dividend yield of 3-4% (based on 40% payout ratio) would also lend some support to its share price.
O&M barely breaking even; looking beyond results. O&M’s recurring net earnings plunged from the peak of c.S$260m a quarter in 2014 to barely break even in 1H17 due to lower volume; EBIT margins fell from 14% to 2% during the same period. We opine that investors should look beyond the upcoming quarterly results, which tend to be lumpy and likely to remain weak, given the low order wins over the past 2 years.
Catalysts – Order wins; property re-rating. We expect Keppel to secure S$1.5bn worth of new orders this year, up from S$500m last year. The group is diversifying into non drilling and LNG segments. This is much needed to replenish its orderbook, which has dwindled to S$3.4bn, excluding Sete’s S$4bn orders. Positive sentiment on the property sector could narrow the valuation discount (currently at 15% to book in our SOTP valuation). Management remains optimistic of stronger home sales in China and Vietnam, with 17k ready-to-launch homes in its pipeline through 2019, representing c.3x of its home sales in 2016.
Valuation: Our TP of S$7.60 is based on sum-of-parts valuation: (1) the O&M segment is valued at 1.8x P/BV, (2) infrastructure at 15x PE on FY16F earnings, (3) the property segment at 1.0x P/BV, (4) investment (Keppel Capital) at 15x PATMI, and (5) market values/estimated fair values are used for listed subsidiaries. Our TP translates to 1.1x FY17 P/BV.
Key Risks to Our View: The O&M segment could fare worse than expected. We forecast annual revenues from Keppel O&M to fall to the ~S$2.6bn level in FY17 and FY18, from S$7-8bn during FY12-14. The continued depletion of its orderbook and deferments/cancellations could pose downside risks to our forecast.
At A Glance Issued Capital (m shrs) 1,813
Mkt. Cap (S$m/US$m) 11,838 / 8,651
Major Shareholders (%)
Temasek Holdings Private Ltd 20.5
Aberdeen Asset Management 5.0
Blackrock 4.7
Free Float (%) 69.8
3m Avg. Daily Val (US$m) 13.9
ICB Industry : Oil & Gas / Oil Equipment; Services & Dist
DBS Group Research . Equity 20 Jul 2017
Singapore Company Guide
Keppel CorporationVersion 9 | Bloomberg: KEP SP | Reuters: KPLM.SI Refer to important disclosures at the end of this report
49
69
89
109
129
149
169
189
209
4.2
5.2
6.2
7.2
8.2
9.2
10.2
11.2
Jul-13 Jul-14 Jul-15 Jul-16 Jul-17
Relative IndexS$
Keppel Corporation (LHS) Relative STI (RHS)
Page 10Page 10

Company Guide
Keppel Corporation
WHAT’S NEW
Delivering world’s first FLNG vessel conversion
Keppel hosted a vessel tour and analyst briefing in early July
following the naming ceremony of the world’s first Floating
Liquefied Natural Gas FLNG vessel conversion – Hilli Episeyo
(picture attached). The vessel is expected to be delivered over
the next 2-3 months upon completion of vessel
commissioning.
This is a significant milestone for Keppel:
1) Hilli Episeyo is the world’s first FLNG vessel conversion
project. Keppel’s Korean peers are only constructing newbuild
FLNG vessels.
2) It is a testament to Keppel’s engineering capability,
given the complexity of the project and space constraint, as
the vessel was converted from a 1975-built LNG carrier
3) It showcases Keppel’s industry connection and ability
to stitch up the value chain with key partners, including
customers and end users.
4) With the experience gained from this first FLNGV
conversion project, Keppel is now in a unique position to
provide customers with reliable end-to-end solutions for the
EPC and commissioning of liquefaction unit - FLNG vessel as
well as regasification unit - FSRU (Floating Storage and
Regasification Unit) conversions.
5) Keppel’s converted FLNG vessel is a faster-to-market
and cost-effective solution compared to newbuilds. The
successful delivery and smooth operation of the unit will
boost the confidence of potential customers and attract new
orders for this solution. In the longer term, Keppel’s LNG
solutions are poised to become mainstream products, riding
on the global push towards cleaner energy.
Order wins driven by non-drilling solutions, diversifying into
LNG. Keppel’s FLNG vessel orders from Golar were priced at
over S$900m each. FLNG orders currently account for over
50% of Keppel’s orderbook (S$3.5bn as of end-March 2017).
This is a strategic move to reduce reliance on drilling solutions
and tap on the robust demand growth for natural gas as
cleaner energy. We believe LNG solutions will be a major
order driver for Singapore rigbuilders moving into 2018.
Keppel to ride on sentiment turnaround in the property
sector; raising valuation peg to 1.0x P/BV. Our property
analysts believe that we are at the start of a multi-year
government relaxation cycle in Singapore, which presents a
multi-year re-rating potential for developers. We are raising
our valuation peg for Keppel’s property segment from 0.85x
to 1.0x P/BV, in line with the other large-cap Singapore
developer peers.
Page 11Page 11

Company Guide
Keppel Corporation
CRITICAL DATA POINTS TO WATCH
Critical Factors
Orderbook the key driver of Keppel O&M’s earnings; FLNG and
production facilities to fill the gap. Keppel O&M secured
S$1.8bn in order wins in FY15 and S$500m in FY16, dismal
compared to its 2010 and 2011 peak of S$10bn p.a. Its
orderbook has dwindled to S$3.4bn, from S$5.1bn at end-2015
and S$3.5bn a quarter ago. A declining net orderbook points to
declining earnings ahead. Scrapping of old rigs (>30 years old),
estimated to constitute ~15% of the current fleet globally,
could help push the market back into balance. An oil price
rebound would also improve rig utilisation, spurring capex
spend and order wins. In terms of growth potential, Keppel’s
first-mover advantage in the FLNG conversion market could
provide earnings upside; customer Golar has already awarded
Keppel a third FLNG project.
Residential property sales in China and Vietnam are the main
drivers of Keppel Land’s revenue and earnings. In China, further
relaxation of cooling measures, urbanisation and low mortgage
rates resulting from monetary easing, seem to be encouraging
for residential property sales. Vietnam is another emerging
market for Keppel, accounting for 27% of its home sales in
FY16. Unit sales in Singapore will likely be dampened by weak
buyer sentiment due to the continuing effects of the
government’s tightening measures, a flood of incoming
completions and slowing government land sales (GLS) – factors
which signal falling average selling prices.
The infrastructure division’s earnings buoyed by handover of
problematic assets. The bad-apple situation with Keppel
Infrastructure’s EPC projects has improved with the handover of
the two Greater Manchester EfW (energy-from-waste) plants
and Doha North in 2015. Thus, lower EPC provisions going
forward should boost earnings in the short term.
Value-unlocking divestments can provide earnings upside.
Divestments can free up cash to be invested in more profitable
areas or to pay down debt. In Keppel’s case, it may also reduce
the conglomerate discount on its stock. M1 is a possible
candidate for sale; its fundamentals are uninspiring and our
telecom analyst has downgraded M1 to FULLY VALUED after
removing the 25% M&A premium from its DCF valuation,
following the announcement that M1’s major shareholders
(with a combined stake of 61%) are not going ahead with a
strategic review to dispose of their stake. We estimate Keppel's
stake in M1 to be worth ~S$320m. Injection of infrastructure
assets such as Woodlands Wafer Fab Park into Keppel
Infrastructure Trust (KIT), to whom Keppel Infrastructure acts as
sponsor, could be another alternative.
Sales Trend
Asset Trend
Profitability Trend
Margin Trends (%)
Source: Company, DBS Bank
-30.0%
-25.0%
-20.0%
-15.0%
-10.0%
-5.0%
0.0%
5.0%
10.0%
0
2,000
4,000
6,000
8,000
10,000
12,000
2014A 2015A 2016A 2017F 2018F
S$ m
Total Revenue Revenue Growth (%) (YoY)
5,000
10,000
15,000
20,000
25,000
2014A 2015A 2016A 2017F 2018F
S$ m
Net Fixed Assets (Tangible) Total Current Assets
783
1,283
1,783
2,283
2,783
2014A 2015A 2016A 2017F 2018F
S$ m
Operating EBIT Pre tax Profit Net Profit
10%
15%
20%
25%
30%
2014A 2015A 2016A 2017F 2018F
EBITDA Margin % EBIT Margin % Net Income Margin %
Page 12Page 12

Company Guide
Keppel Corporation
Balance Sheet:
Following the privatisation of Keppel Land in 1Q15, Keppel
Corp’s net gearing rose from 0.11x as of end-2014 to 0.42x as
of end-2Q15 and 0.662x as of end-2Q16. The increase in
gearing stems from a lower shareholders' equity and cash
balance as the privatization was largely funded by cash. The
gearing level had declined to 0.58x as of end-2Q17, aided by
capital recycling.
Share Price Drivers:
Recovery in oil prices would support the share price. We think
Keppel O&M would benefit if oil prices recover to at least above
the US$55/bbl level, which would trigger more offshore oil &
gas capex spend.
Announcement of new order wins. Strong order win
announcements could push up the share price, as investors
reward greater visibility on revenues and earnings.
Key Risks:
Competition from foreign yards. Keener competition from
Chinese yards – which are usually aggressive in their pricing
and lax with payment terms – as well as Korean peers may
affect order wins and profitability, especially if Keppel starts to
offer concessions to protect market share.
Further deferments possible if oil prices remain subdued. Since
the oil price started declining in mid-2014, we have seen oil
majors and asset owners slash capex spending substantially,
which has hit yards hard. Meanwhile, deliveries of newbuilds
and conversions already under construction are being delayed
– a situation which could worsen if oil prices remain low.
Company Background
Keppel is a diversified conglomerate with its core businesses in
offshore marine (O&M), property investments and
development, and infrastructure-based activities in Singapore
and the region. O&M is the largest segment, typically
contributing about two-thirds of group revenue. It possesses
strong market leadership positions in rigbuilding, particularly
for jackups and semi-submersibles, FPSO conversion, FLNG
conversion, as well as repair and construction of high-end
specialised vessels.
Leverage & Asset Turnover (x)
Capital Expenditure
ROE (%)
Forward PE Band (x)
PB Band (x)
Source: Company, DBS Bank
0.2
0.3
0.3
0.4
0.4
0.5
0.5
0.00
0.10
0.20
0.30
0.40
0.50
0.60
0.70
0.80
2014A 2015A 2016A 2017F 2018F
Gross Debt to Equity (LHS) Asset Turnover (RHS)
0.0
200.0
400.0
600.0
800.0
1,000.0
1,200.0
1,400.0
2014A 2015A 2016A 2017F 2018F
Capital Expenditure (-)
S$m
0.0%
2.0%
4.0%
6.0%
8.0%
10.0%
12.0%
14.0%
16.0%
18.0%
2014A 2015A 2016A 2017F 2018F
Avg: 12.7x
+1sd: 13.8x
+2sd: 14.8x
-1sd: 11.6x
-2sd: 10.5x
8.8
9.8
10.8
11.8
12.8
13.8
14.8
15.8
Jul-13 Jul-14 Jul-15 Jul-16 Jul-17
(x)
Avg: 1.39x
+1sd: 1.84x
+2sd: 2.29x
-1sd: 0.93x
-2sd: 0.48x0.4
0.9
1.4
1.9
2.4
Jul-13 Jul-14 Jul-15 Jul-16 Jul-17
(x)
Page 13Page 13
Company Guide
Keppel Corporation
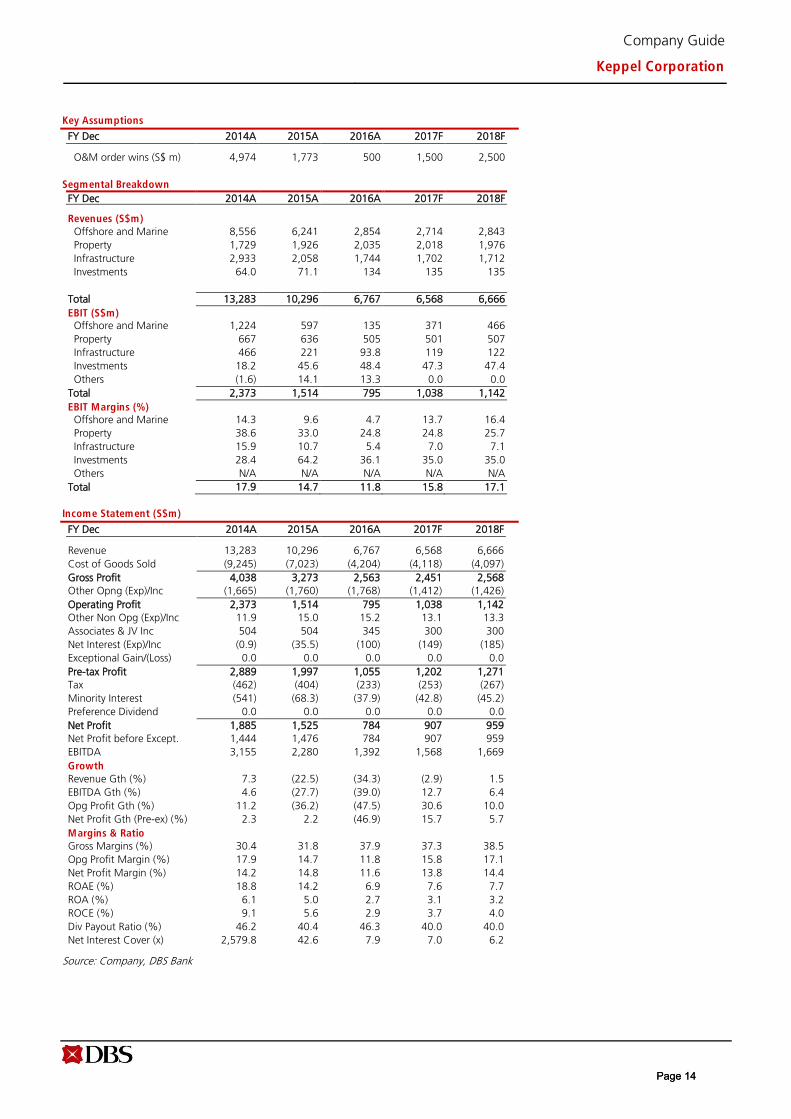
Key Assumptions
FY Dec 2014A 2015A 2016A 2017F 2018F
O&M order wins (S$ m) 4,974 1,773 500 1,500 2,500
Segmental Breakdown
FY Dec 2014A 2015A 2016A 2017F 2018F
Revenues (S$m)
Offshore and Marine 8,556 6,241 2,854 2,714 2,843
Property 1,729 1,926 2,035 2,018 1,976
Infrastructure 2,933 2,058 1,744 1,702 1,712
Investments 64.0 71.1 134 135 135
Total 13,283 10,296 6,767 6,568 6,666
EBIT (S$m) Offshore and Marine 1,224 597 135 371 466
Property 667 636 505 501 507
Infrastructure 466 221 93.8 119 122
Investments 18.2 45.6 48.4 47.3 47.4
Others (1.6) 14.1 13.3 0.0 0.0
Total 2,373 1,514 795 1,038 1,142
EBIT Margins (%) Offshore and Marine 14.3 9.6 4.7 13.7 16.4
Property 38.6 33.0 24.8 24.8 25.7
Infrastructure 15.9 10.7 5.4 7.0 7.1
Investments 28.4 64.2 36.1 35.0 35.0
Others N/A N/A N/A N/A N/A
Total 17.9 14.7 11.8 15.8 17.1
Income Statement (S$m)
FY Dec 2014A 2015A 2016A 2017F 2018F
Revenue 13,283 10,296 6,767 6,568 6,666
Cost of Goods Sold (9,245) (7,023) (4,204) (4,118) (4,097)
Gross Profit 4,038 3,273 2,563 2,451 2,568
Other Opng (Exp)/Inc (1,665) (1,760) (1,768) (1,412) (1,426)
Operating Profit 2,373 1,514 795 1,038 1,142
Other Non Opg (Exp)/Inc 11.9 15.0 15.2 13.1 13.3
Associates & JV Inc 504 504 345 300 300
Net Interest (Exp)/Inc (0.9) (35.5) (100) (149) (185)
Exceptional Gain/(Loss) 0.0 0.0 0.0 0.0 0.0
Pre-tax Profit 2,889 1,997 1,055 1,202 1,271
Tax (462) (404) (233) (253) (267)
Minority Interest (541) (68.3) (37.9) (42.8) (45.2)
Preference Dividend 0.0 0.0 0.0 0.0 0.0
Net Profit 1,885 1,525 784 907 959
Net Profit before Except. 1,444 1,476 784 907 959
EBITDA 3,155 2,280 1,392 1,568 1,669
Growth
Revenue Gth (%) 7.3 (22.5) (34.3) (2.9) 1.5
EBITDA Gth (%) 4.6 (27.7) (39.0) 12.7 6.4
Opg Profit Gth (%) 11.2 (36.2) (47.5) 30.6 10.0
Net Profit Gth (Pre-ex) (%) 2.3 2.2 (46.9) 15.7 5.7
Margins & Ratio
Gross Margins (%) 30.4 31.8 37.9 37.3 38.5
Opg Profit Margin (%) 17.9 14.7 11.8 15.8 17.1
Net Profit Margin (%) 14.2 14.8 11.6 13.8 14.4
ROAE (%) 18.8 14.2 6.9 7.6 7.7
ROA (%) 6.1 5.0 2.7 3.1 3.2
ROCE (%) 9.1 5.6 2.9 3.7 4.0
Div Payout Ratio (%) 46.2 40.4 46.3 40.0 40.0
Net Interest Cover (x) 2,579.8 42.6 7.9 7.0 6.2
Source: Company, DBS Bank
Page 14Page 14
Company Guide
Keppel Corporation
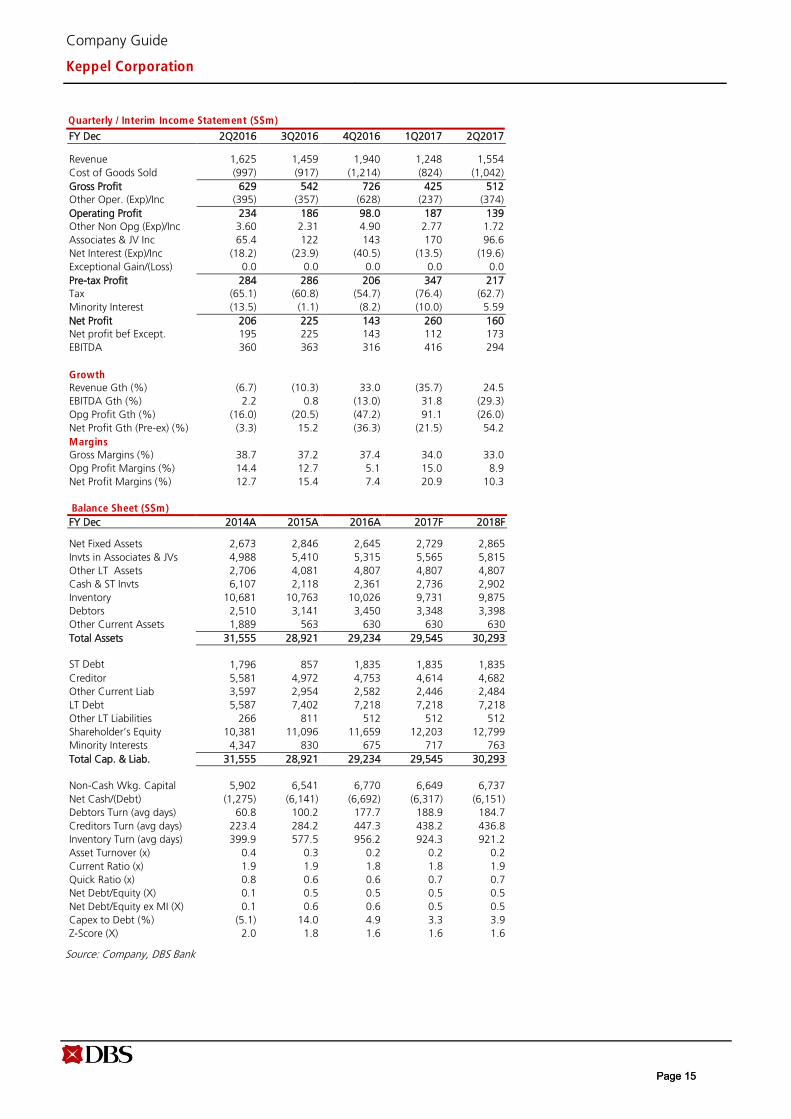
Quarterly / Interim Income Statement (S$m)
FY Dec 2Q2016 3Q2016 4Q2016 1Q2017 2Q2017
Revenue 1,625 1,459 1,940 1,248 1,554
Cost of Goods Sold (997) (917) (1,214) (824) (1,042)
Gross Profit 629 542 726 425 512
Other Oper. (Exp)/Inc (395) (357) (628) (237) (374)
Operating Profit 234 186 98.0 187 139
Other Non Opg (Exp)/Inc 3.60 2.31 4.90 2.77 1.72
Associates & JV Inc 65.4 122 143 170 96.6
Net Interest (Exp)/Inc (18.2) (23.9) (40.5) (13.5) (19.6)
Exceptional Gain/(Loss) 0.0 0.0 0.0 0.0 0.0
Pre-tax Profit 284 286 206 347 217
Tax (65.1) (60.8) (54.7) (76.4) (62.7)
Minority Interest (13.5) (1.1) (8.2) (10.0) 5.59
Net Profit 206 225 143 260 160
Net profit bef Except. 195 225 143 112 173
EBITDA 360 363 316 416 294
Growth
Revenue Gth (%) (6.7) (10.3) 33.0 (35.7) 24.5
EBITDA Gth (%) 2.2 0.8 (13.0) 31.8 (29.3)
Opg Profit Gth (%) (16.0) (20.5) (47.2) 91.1 (26.0)
Net Profit Gth (Pre-ex) (%) (3.3) 15.2 (36.3) (21.5) 54.2
Margins
Gross Margins (%) 38.7 37.2 37.4 34.0 33.0
Opg Profit Margins (%) 14.4 12.7 5.1 15.0 8.9
Net Profit Margins (%) 12.7 15.4 7.4 20.9 10.3
Balance Sheet (S$m)
FY Dec 2014A 2015A 2016A 2017F 2018F
Net Fixed Assets 2,673 2,846 2,645 2,729 2,865
Invts in Associates & JVs 4,988 5,410 5,315 5,565 5,815
Other LT Assets 2,706 4,081 4,807 4,807 4,807
Cash & ST Invts 6,107 2,118 2,361 2,736 2,902
Inventory 10,681 10,763 10,026 9,731 9,875
Debtors 2,510 3,141 3,450 3,348 3,398
Other Current Assets 1,889 563 630 630 630
Total Assets 31,555 28,921 29,234 29,545 30,293
ST Debt 1,796 857 1,835 1,835 1,835
Creditor 5,581 4,972 4,753 4,614 4,682
Other Current Liab 3,597 2,954 2,582 2,446 2,484
LT Debt 5,587 7,402 7,218 7,218 7,218
Other LT Liabilities 266 811 512 512 512
Shareholder’s Equity 10,381 11,096 11,659 12,203 12,799
Minority Interests 4,347 830 675 717 763
Total Cap. & Liab. 31,555 28,921 29,234 29,545 30,293
Non-Cash Wkg. Capital 5,902 6,541 6,770 6,649 6,737
Net Cash/(Debt) (1,275) (6,141) (6,692) (6,317) (6,151)
Debtors Turn (avg days) 60.8 100.2 177.7 188.9 184.7
Creditors Turn (avg days) 223.4 284.2 447.3 438.2 436.8
Inventory Turn (avg days) 399.9 577.5 956.2 924.3 921.2
Asset Turnover (x) 0.4 0.3 0.2 0.2 0.2
Current Ratio (x) 1.9 1.9 1.8 1.8 1.9
Quick Ratio (x) 0.8 0.6 0.6 0.7 0.7
Net Debt/Equity (X) 0.1 0.5 0.5 0.5 0.5
Net Debt/Equity ex MI (X) 0.1 0.6 0.6 0.5 0.5
Capex to Debt (%) (5.1) 14.0 4.9 3.3 3.9
Z-Score (X) 2.0 1.8 1.6 1.6 1.6
Source: Company, DBS Bank
Page 15Page 15
Company Guide
Keppel Corporation
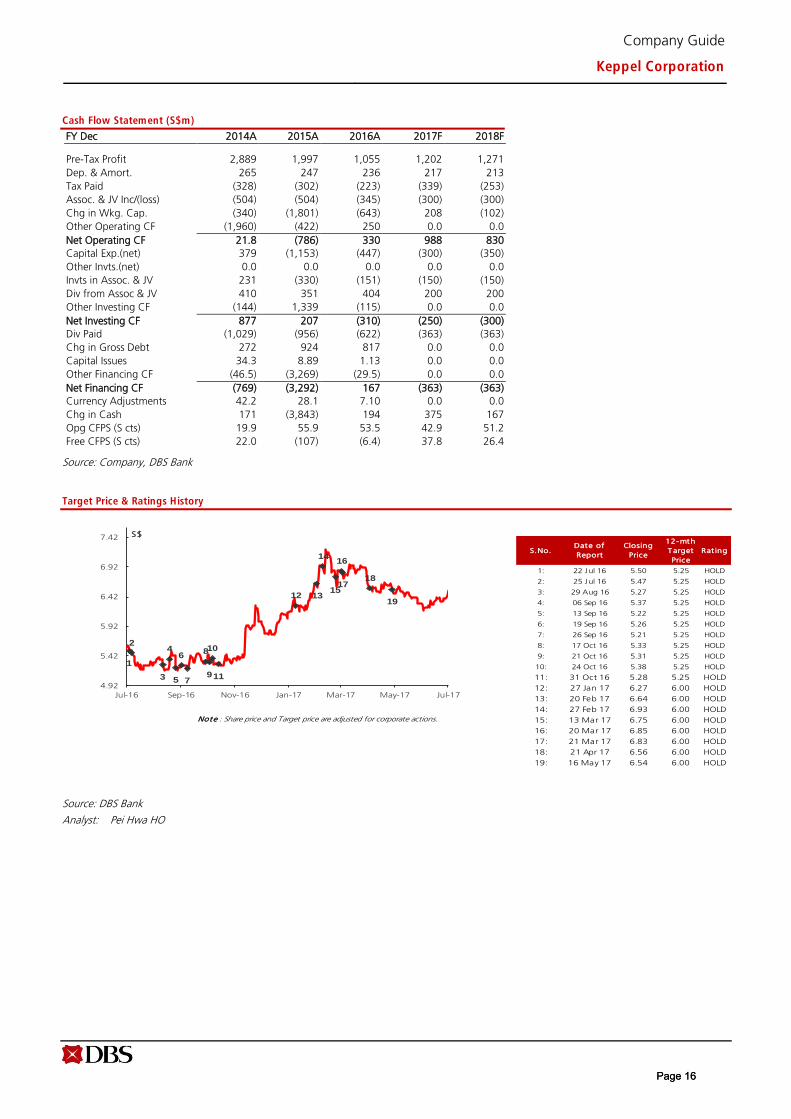
Cash Flow Statement (S$m)
FY Dec 2014A 2015A 2016A 2017F 2018F
Pre-Tax Profit 2,889 1,997 1,055 1,202 1,271
Dep. & Amort. 265 247 236 217 213
Tax Paid (328) (302) (223) (339) (253)
Assoc. & JV Inc/(loss) (504) (504) (345) (300) (300)
Chg in Wkg. Cap. (340) (1,801) (643) 208 (102)
Other Operating CF (1,960) (422) 250 0.0 0.0
Net Operating CF 21.8 (786) 330 988 830
Capital Exp.(net) 379 (1,153) (447) (300) (350)
Other Invts.(net) 0.0 0.0 0.0 0.0 0.0
Invts in Assoc. & JV 231 (330) (151) (150) (150)
Div from Assoc & JV 410 351 404 200 200
Other Investing CF (144) 1,339 (115) 0.0 0.0
Net Investing CF 877 207 (310) (250) (300)
Div Paid (1,029) (956) (622) (363) (363)
Chg in Gross Debt 272 924 817 0.0 0.0
Capital Issues 34.3 8.89 1.13 0.0 0.0
Other Financing CF (46.5) (3,269) (29.5) 0.0 0.0
Net Financing CF (769) (3,292) 167 (363) (363)
Currency Adjustments 42.2 28.1 7.10 0.0 0.0
Chg in Cash 171 (3,843) 194 375 167
Opg CFPS (S cts) 19.9 55.9 53.5 42.9 51.2
Free CFPS (S cts) 22.0 (107) (6.4) 37.8 26.4
Source: Company, DBS Bank
Target Price & Ratings History
Source: DBS Bank
Analyst: Pei Hwa HO
S.No.Date of
Report
Closing
Price
12-mth
Target
Price
Rat ing
1: 22 Jul 16 5.50 5.25 HOLD
2: 25 Jul 16 5.47 5.25 HOLD
3: 29 Aug 16 5.27 5.25 HOLD
4: 06 Sep 16 5.37 5.25 HOLD
5: 13 Sep 16 5.22 5.25 HOLD
6: 19 Sep 16 5.26 5.25 HOLD
7: 26 Sep 16 5.21 5.25 HOLD
8: 17 Oct 16 5.33 5.25 HOLD
9: 21 Oct 16 5.31 5.25 HOLD
10: 24 Oct 16 5.38 5.25 HOLD
11: 31 Oct 16 5.28 5.25 HOLD
12: 27 Jan 17 6.27 6.00 HOLD
13: 20 Feb 17 6.64 6.00 HOLD
14: 27 Feb 17 6.93 6.00 HOLD
Note : Share price and Target price are adjusted for corporate actions. 15: 13 Mar 17 6.75 6.00 HOLD
16: 20 Mar 17 6.85 6.00 HOLD
17: 21 Mar 17 6.83 6.00 HOLD
18: 21 Apr 17 6.56 6.00 HOLD
19: 16 May 17 6.54 6.00 HOLD
1
2
3
4
5
6
7
8
9
10
11
12 13
14
15
16
1718
19
4.92
5.42
5.92
6.42
6.92
7.42
Jul-16 Sep-16 Nov-16 Jan-17 Mar-17 May-17 Jul-17
S$
Page 16Page 16
ed: JS / sa:JC, PY
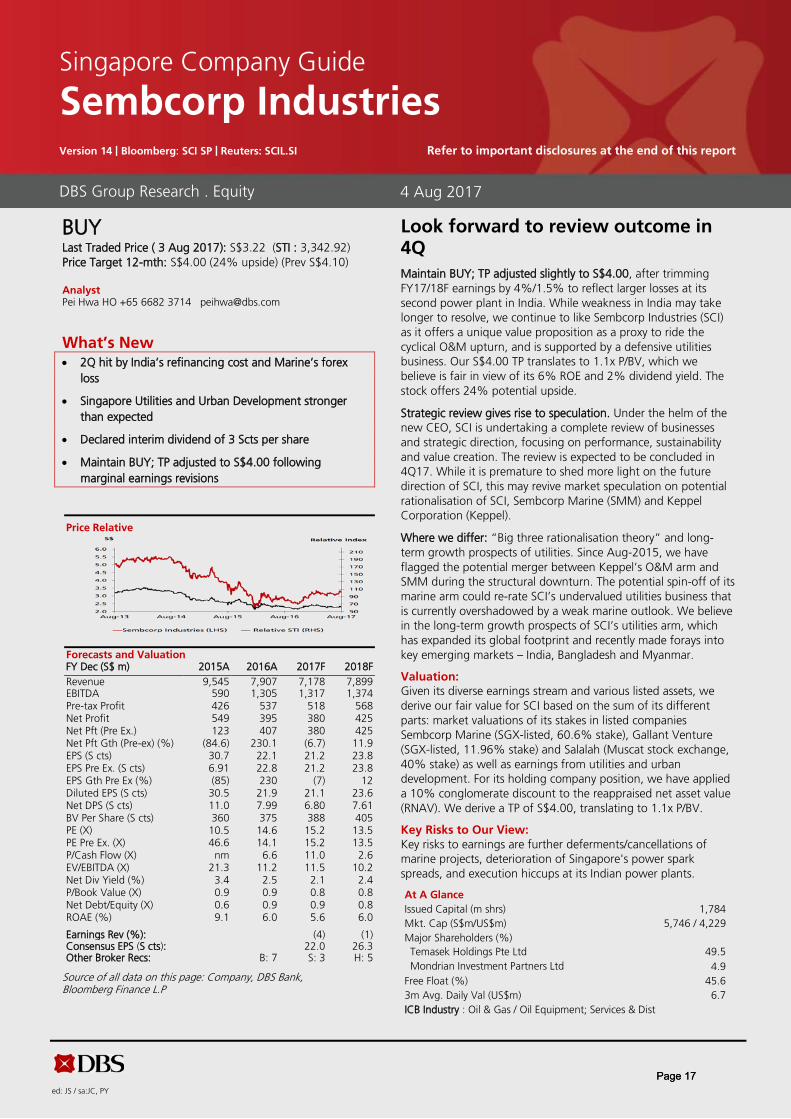
BUYLast Traded Price ( 3 Aug 2017): S$3.22 (STI : 3,342.92) Price Target 12-mth: S$4.00 (24% upside) (Prev S$4.10)
Analyst Pei Hwa HO +65 6682 3714 [email protected]
What’s New • 2Q hit by India’s refinancing cost and Marine’s forex
loss
• Singapore Utilities and Urban Development strongerthan expected
• Declared interim dividend of 3 Scts per share
• Maintain BUY; TP adjusted to S$4.00 followingmarginal earnings revisions
Price Relative
Forecasts and Valuation FY Dec (S$ m) 2015A 2016A 2017F 2018F Revenue 9,545 7,907 7,178 7,899 EBITDA 590 1,305 1,317 1,374 Pre-tax Profit 426 537 518 568 Net Profit 549 395 380 425 Net Pft (Pre Ex.) 123 407 380 425 Net Pft Gth (Pre-ex) (%) (84.6) 230.1 (6.7) 11.9 EPS (S cts) 30.7 22.1 21.2 23.8 EPS Pre Ex. (S cts) 6.91 22.8 21.2 23.8 EPS Gth Pre Ex (%) (85) 230 (7) 12 Diluted EPS (S cts) 30.5 21.9 21.1 23.6 Net DPS (S cts) 11.0 7.99 6.80 7.61 BV Per Share (S cts) 360 375 388 405 PE (X) 10.5 14.6 15.2 13.5 PE Pre Ex. (X) 46.6 14.1 15.2 13.5 P/Cash Flow (X) nm 6.6 11.0 2.6 EV/EBITDA (X) 21.3 11.2 11.5 10.2 Net Div Yield (%) 3.4 2.5 2.1 2.4 P/Book Value (X) 0.9 0.9 0.8 0.8 Net Debt/Equity (X) 0.6 0.9 0.9 0.8 ROAE (%) 9.1 6.0 5.6 6.0 Earnings Rev (%): (4) (1) Consensus EPS (S cts): 22.0 26.3 Other Broker Recs: B: 7 S: 3 H: 5
Source of all data on this page: Company, DBS Bank, Bloomberg Finance L.P
Look forward to review outcome in 4Q Maintain BUY; TP adjusted slightly to S$4.00, after trimming FY17/18F earnings by 4%/1.5% to reflect larger losses at its second power plant in India. While weakness in India may take longer to resolve, we continue to like Sembcorp Industries (SCI) as it offers a unique value proposition as a proxy to ride the cyclical O&M upturn, and is supported by a defensive utilities business. Our S$4.00 TP translates to 1.1x P/BV, which we believe is fair in view of its 6% ROE and 2% dividend yield. The stock offers 24% potential upside.
Strategic review gives rise to speculation. Under the helm of the new CEO, SCI is undertaking a complete review of businesses and strategic direction, focusing on performance, sustainability and value creation. The review is expected to be concluded in 4Q17. While it is premature to shed more light on the future direction of SCI, this may revive market speculation on potential rationalisation of SCI, Sembcorp Marine (SMM) and Keppel Corporation (Keppel).
Where we differ: “Big three rationalisation theory” and long-term growth prospects of utilities. Since Aug-2015, we have flagged the potential merger between Keppel’s O&M arm and SMM during the structural downturn. The potential spin-off of its marine arm could re-rate SCI’s undervalued utilities business that is currently overshadowed by a weak marine outlook. We believe in the long-term growth prospects of SCI’s utilities arm, which has expanded its global footprint and recently made forays into key emerging markets – India, Bangladesh and Myanmar.
Valuation: Given its diverse earnings stream and various listed assets, we derive our fair value for SCI based on the sum of its different parts: market valuations of its stakes in listed companies Sembcorp Marine (SGX-listed, 60.6% stake), Gallant Venture (SGX-listed, 11.96% stake) and Salalah (Muscat stock exchange, 40% stake) as well as earnings from utilities and urban development. For its holding company position, we have applied a 10% conglomerate discount to the reappraised net asset value (RNAV). We derive a TP of S$4.00, translating to 1.1x P/BV.
Key Risks to Our View: Key risks to earnings are further deferments/cancellations of marine projects, deterioration of Singapore's power spark spreads, and execution hiccups at its Indian power plants.
At A Glance Issued Capital (m shrs) 1,784 Mkt. Cap (S$m/US$m) 5,746 / 4,229 Major Shareholders (%) Temasek Holdings Pte Ltd 49.5 Mondrian Investment Partners Ltd 4.9
Free Float (%) 45.6 3m Avg. Daily Val (US$m) 6.7 ICB Industry : Oil & Gas / Oil Equipment; Services & Dist
DBS Group Research . Equity 4 Aug 2017
Singapore Company Guide
Sembcorp Industries Version 14 | Bloomberg: SCI SP | Reuters: SCIL.SI Refer to important disclosures at the end of this report
Page 17Page 17
Company Guide
Sembcorp Industries
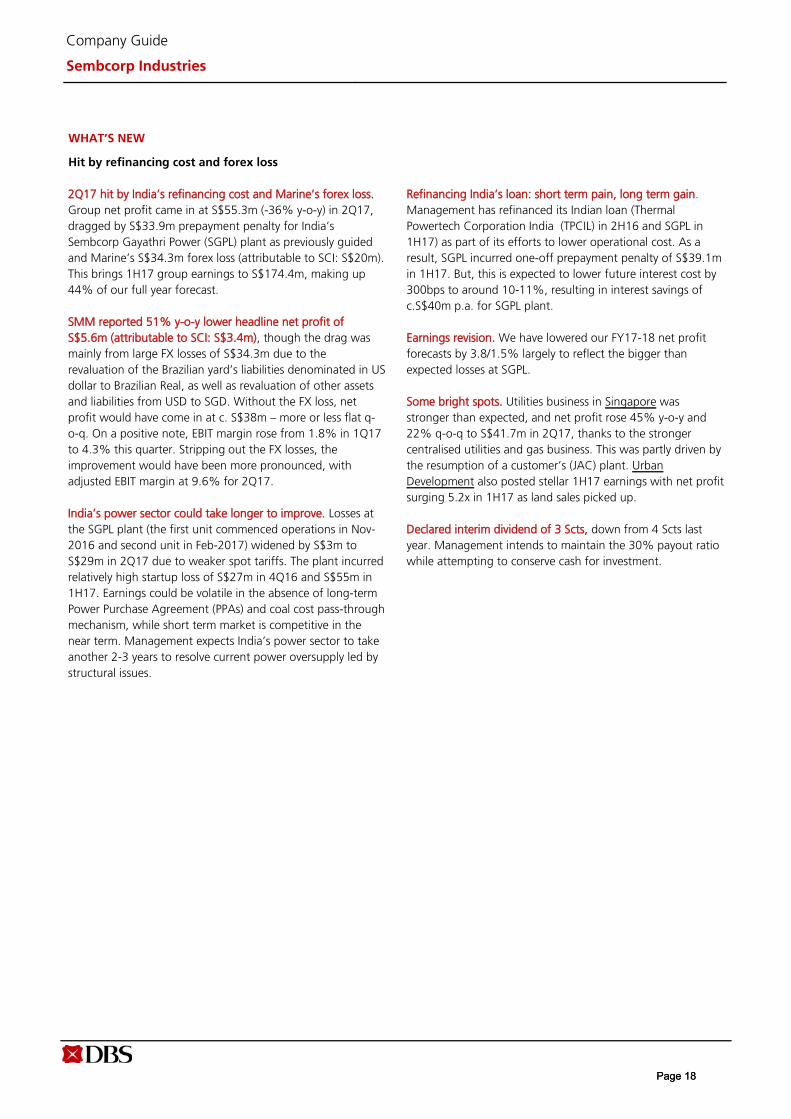
WHAT’S NEW
Hit by refinancing cost and forex loss
2Q17 hit by India’s refinancing cost and Marine’s forex loss. Group net profit came in at S$55.3m (-36% y-o-y) in 2Q17, dragged by S$33.9m prepayment penalty for India’s Sembcorp Gayathri Power (SGPL) plant as previously guided and Marine’s S$34.3m forex loss (attributable to SCI: S$20m). This brings 1H17 group earnings to S$174.4m, making up 44% of our full year forecast.
SMM reported 51% y-o-y lower headline net profit of S$5.6m (attributable to SCI: S$3.4m), though the drag was mainly from large FX losses of S$34.3m due to the revaluation of the Brazilian yard’s liabilities denominated in US dollar to Brazilian Real, as well as revaluation of other assets and liabilities from USD to SGD. Without the FX loss, net profit would have come in at c. S$38m – more or less flat q-o-q. On a positive note, EBIT margin rose from 1.8% in 1Q17 to 4.3% this quarter. Stripping out the FX losses, the improvement would have been more pronounced, with adjusted EBIT margin at 9.6% for 2Q17.
India’s power sector could take longer to improve. Losses at the SGPL plant (the first unit commenced operations in Nov-2016 and second unit in Feb-2017) widened by S$3m to S$29m in 2Q17 due to weaker spot tariffs. The plant incurred relatively high startup loss of S$27m in 4Q16 and S$55m in 1H17. Earnings could be volatile in the absence of long-term Power Purchase Agreement (PPAs) and coal cost pass-through mechanism, while short term market is competitive in the near term. Management expects India’s power sector to take another 2-3 years to resolve current power oversupply led by structural issues.
Refinancing India’s loan: short term pain, long term gain. Management has refinanced its Indian loan (Thermal Powertech Corporation India (TPCIL) in 2H16 and SGPL in 1H17) as part of its efforts to lower operational cost. As a result, SGPL incurred one-off prepayment penalty of S$39.1m in 1H17. But, this is expected to lower future interest cost by 300bps to around 10-11%, resulting in interest savings of c.S$40m p.a. for SGPL plant.
Earnings revision. We have lowered our FY17-18 net profit forecasts by 3.8/1.5% largely to reflect the bigger than expected losses at SGPL.
Some bright spots. Utilities business in Singapore was stronger than expected, and net profit rose 45% y-o-y and 22% q-o-q to S$41.7m in 2Q17, thanks to the stronger centralised utilities and gas business. This was partly driven by the resumption of a customer’s (JAC) plant. Urban Development also posted stellar 1H17 earnings with net profit surging 5.2x in 1H17 as land sales picked up.
Declared interim dividend of 3 Scts, down from 4 Scts last year. Management intends to maintain the 30% payout ratio while attempting to conserve cash for investment.
Page 18Page 18
Company Guide
Sembcorp Industries
Quarterly / Interim Income Statement (S$m)
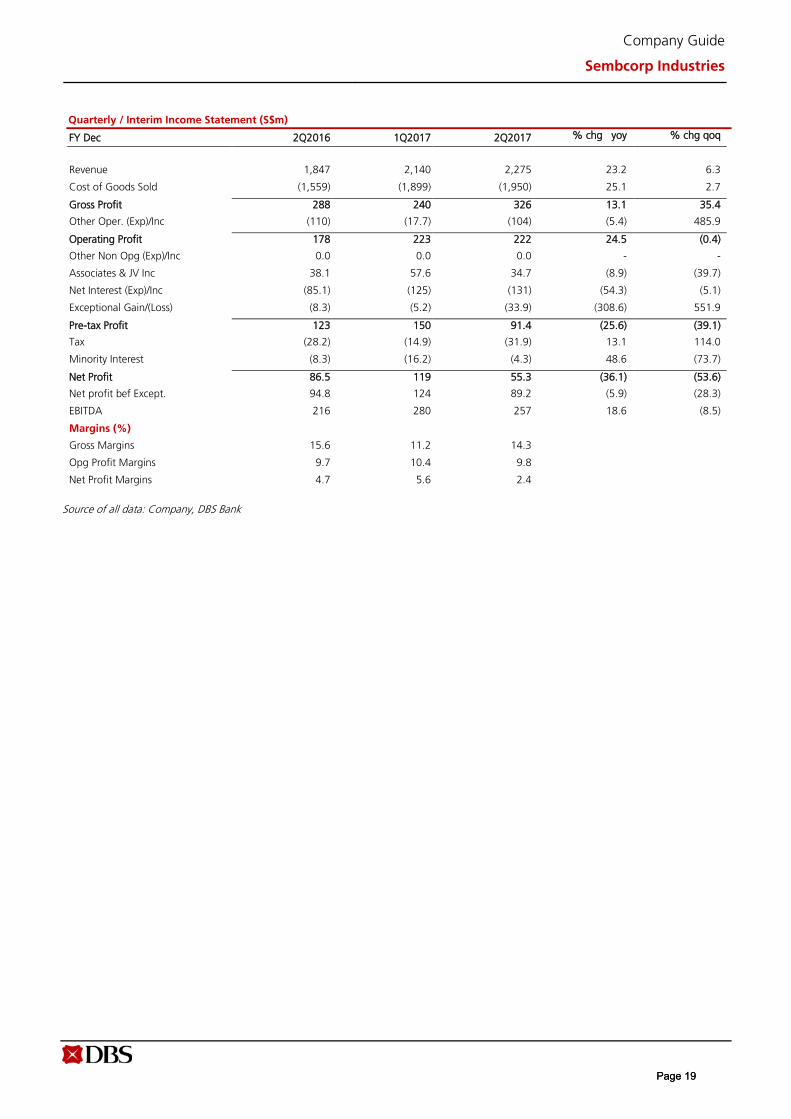
FY Dec 2Q2016 1Q2017 2Q2017 % chg yoy % chg qoq
Revenue 1,847 2,140 2,275 23.2 6.3
Cost of Goods Sold (1,559) (1,899) (1,950) 25.1 2.7
Gross Profit 288 240 326 13.1 35.4
Other Oper. (Exp)/Inc (110) (17.7) (104) (5.4) 485.9
Operating Profit 178 223 222 24.5 (0.4)
Other Non Opg (Exp)/Inc 0.0 0.0 0.0 - -
Associates & JV Inc 38.1 57.6 34.7 (8.9) (39.7)
Net Interest (Exp)/Inc (85.1) (125) (131) (54.3) (5.1)
Exceptional Gain/(Loss) (8.3) (5.2) (33.9) (308.6) 551.9
Pre-tax Profit 123 150 91.4 (25.6) (39.1)
Tax (28.2) (14.9) (31.9) 13.1 114.0
Minority Interest (8.3) (16.2) (4.3) 48.6 (73.7)
Net Profit 86.5 119 55.3 (36.1) (53.6)
Net profit bef Except. 94.8 124 89.2 (5.9) (28.3)
EBITDA 216 280 257 18.6 (8.5)
Margins (%)
Gross Margins 15.6 11.2 14.3
Opg Profit Margins 9.7 10.4 9.8
Net Profit Margins 4.7 5.6 2.4
Source of all data: Company, DBS Bank
Page 19Page 19
Company Guide
Sembcorp Industries
CRITICAL DATA POINTS TO WATCH
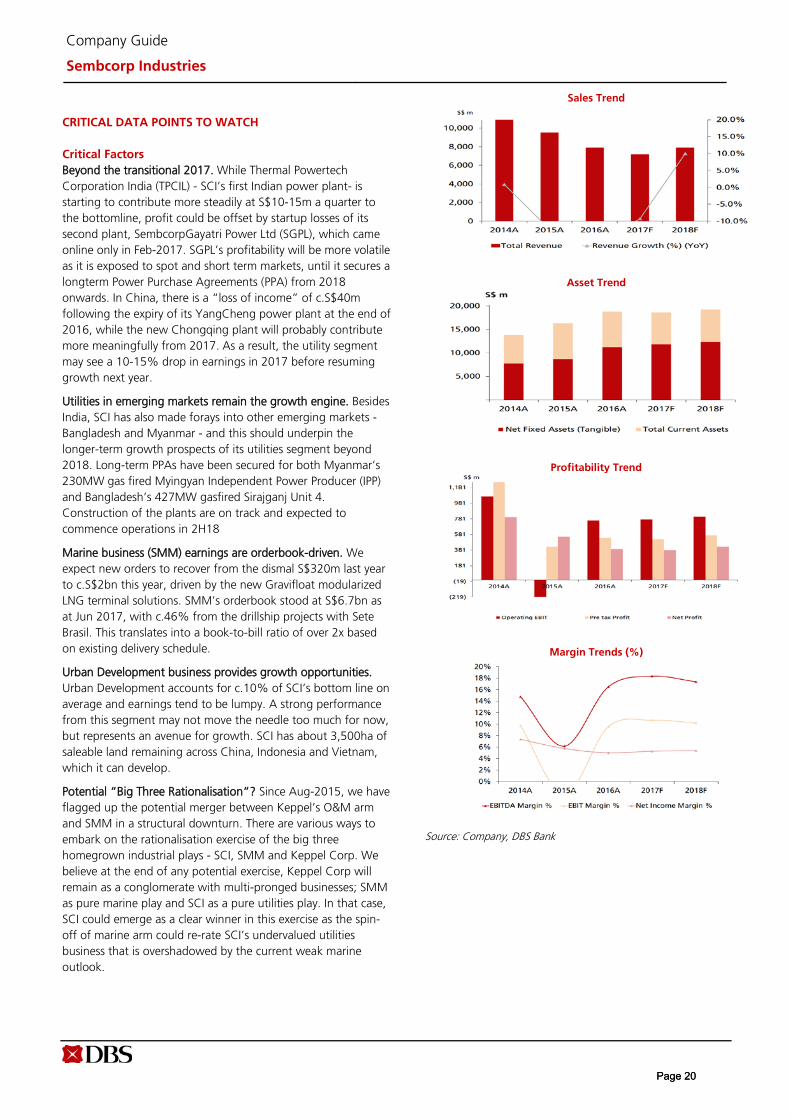
Critical Factors Beyond the transitional 2017. While Thermal Powertech Corporation India (TPCIL) - SCI’s first Indian power plant- is starting to contribute more steadily at S$10-15m a quarter to the bottomline, profit could be offset by startup losses of its second plant, SembcorpGayatri Power Ltd (SGPL), which came online only in Feb-2017. SGPL’s profitability will be more volatile as it is exposed to spot and short term markets, until it secures a longterm Power Purchase Agreements (PPA) from 2018 onwards. In China, there is a “loss of income” of c.S$40m following the expiry of its YangCheng power plant at the end of 2016, while the new Chongqing plant will probably contribute more meaningfully from 2017. As a result, the utility segment may see a 10-15% drop in earnings in 2017 before resuming growth next year.
Utilities in emerging markets remain the growth engine. Besides India, SCI has also made forays into other emerging markets - Bangladesh and Myanmar - and this should underpin the longer-term growth prospects of its utilities segment beyond 2018. Long-term PPAs have been secured for both Myanmar’s 230MW gas fired Myingyan Independent Power Producer (IPP) and Bangladesh’s 427MW gasfired Sirajganj Unit 4. Construction of the plants are on track and expected to commence operations in 2H18
Marine business (SMM) earnings are orderbook-driven. We expect new orders to recover from the dismal S$320m last year to c.S$2bn this year, driven by the new Gravifloat modularized LNG terminal solutions. SMM’s orderbook stood at S$6.7bn as at Jun 2017, with c.46% from the drillship projects with Sete Brasil. This translates into a book-to-bill ratio of over 2x based on existing delivery schedule.
Urban Development business provides growth opportunities. Urban Development accounts for c.10% of SCI’s bottom line on average and earnings tend to be lumpy. A strong performance from this segment may not move the needle too much for now, but represents an avenue for growth. SCI has about 3,500ha of saleable land remaining across China, Indonesia and Vietnam, which it can develop.
Potential “Big Three Rationalisation”? Since Aug-2015, we have flagged up the potential merger between Keppel’s O&M arm and SMM in a structural downturn. There are various ways to embark on the rationalisation exercise of the big three homegrown industrial plays - SCI, SMM and Keppel Corp. We believe at the end of any potential exercise, Keppel Corp will remain as a conglomerate with multi-pronged businesses; SMM as pure marine play and SCI as a pure utilities play. In that case, SCI could emerge as a clear winner in this exercise as the spin-off of marine arm could re-rate SCI’s undervalued utilities business that is overshadowed by the current weak marine outlook.
Sales Trend
Asset Trend
Profitability Trend
Margin Trends (%)
Source: Company, DBS Bank
Page 20Page 20
Company Guide
Sembcorp Industries
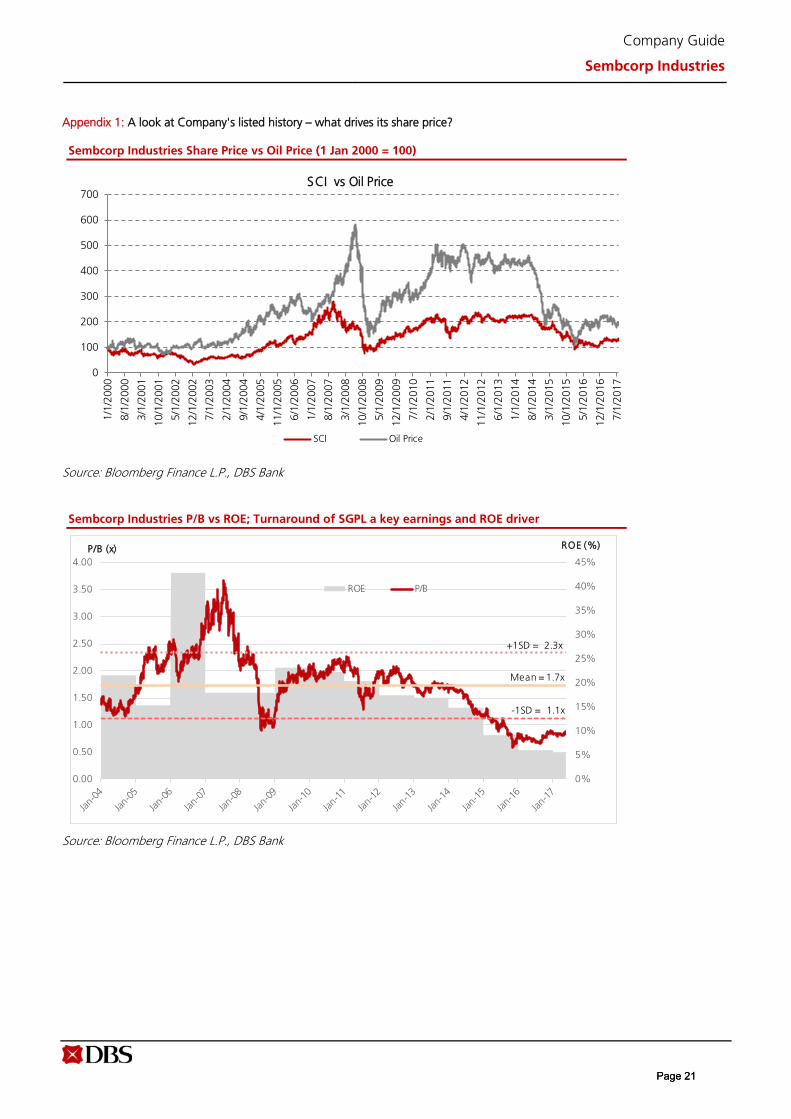
Appendix 1: A look at Company's listed history – what drives its share price?
Sembcorp Industries Share Price vs Oil Price (1 Jan 2000 = 100)
Source: Bloomberg Finance L.P., DBS Bank
Sembcorp Industries P/B vs ROE; Turnaround of SGPL a key earnings and ROE driver
Source: Bloomberg Finance L.P., DBS Bank
0
100
200
300
400
500
600
700
1/1/
2000
8/1/
2000
3/1/
2001
10/1
/200
1
5/1/
2002
12/1
/200
2
7/1/
2003
2/1/
2004
9/1/
2004
4/1/
2005
11/1
/200
5
6/1/
2006
1/1/
2007
8/1/
2007
3/1/
2008
10/1
/200
8
5/1/
2009
12/1
/200
9
7/1/
2010
2/1/
2011
9/1/
2011
4/1/
2012
11/1
/201
2
6/1/
2013
1/1/
2014
8/1/
2014
3/1/
2015
10/1
/201
5
5/1/
2016
12/1
/201
6
7/1/
2017
SCI vs Oil Price
SCI Oil Price
0%
5%
10%
15%
20%
25%
30%
35%
40%
45%
0.00
0.50
1.00
1.50
2.00
2.50
3.00
3.50
4.00
ROE P/B
Mean = 1.7x
-1SD = 1.1x
ROE (%)P/B (x)
+1SD = 2.3x
Page 21Page 21
Company Guide
Sembcorp Industries
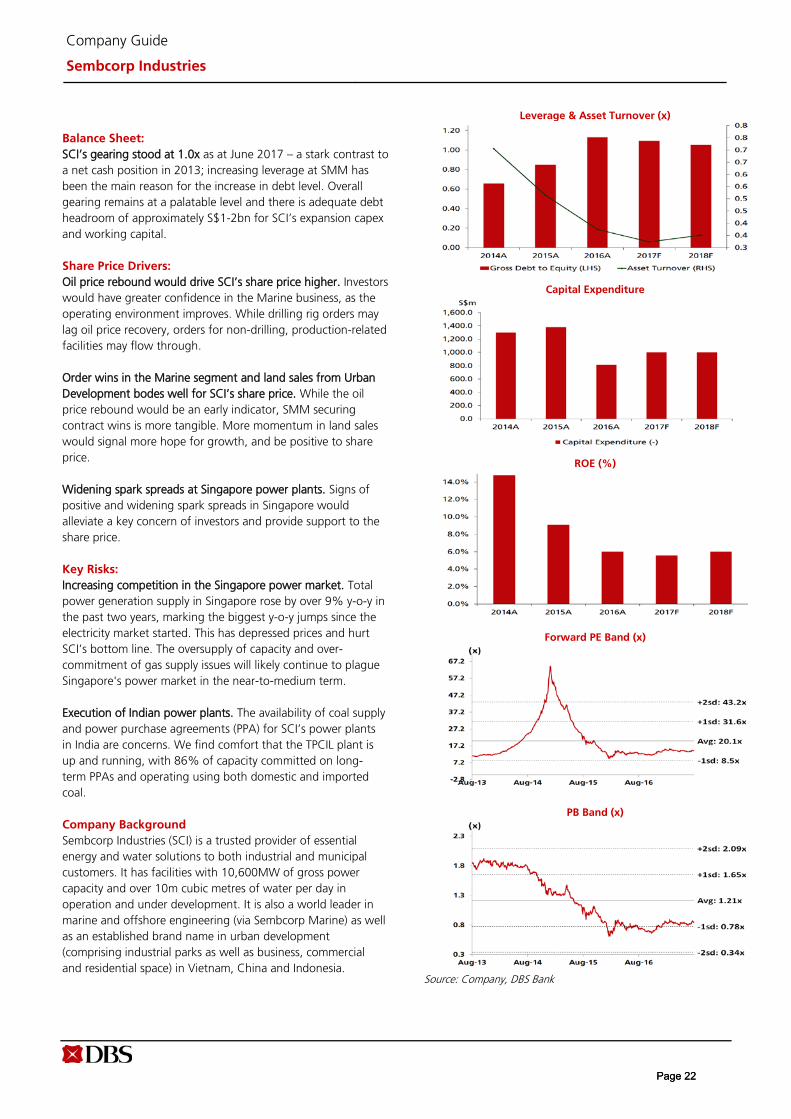
Balance Sheet: SCI’s gearing stood at 1.0x as at June 2017 – a stark contrast to a net cash position in 2013; increasing leverage at SMM has been the main reason for the increase in debt level. Overall gearing remains at a palatable level and there is adequate debt headroom of approximately S$1-2bn for SCI’s expansion capex and working capital.
Share Price Drivers: Oil price rebound would drive SCI’s share price higher. Investors would have greater confidence in the Marine business, as the operating environment improves. While drilling rig orders may lag oil price recovery, orders for non-drilling, production-related facilities may flow through.
Order wins in the Marine segment and land sales from Urban Development bodes well for SCI’s share price. While the oil price rebound would be an early indicator, SMM securing contract wins is more tangible. More momentum in land sales would signal more hope for growth, and be positive to share price.
Widening spark spreads at Singapore power plants. Signs of positive and widening spark spreads in Singapore would alleviate a key concern of investors and provide support to the share price.
Key Risks: Increasing competition in the Singapore power market. Total power generation supply in Singapore rose by over 9% y-o-y in the past two years, marking the biggest y-o-y jumps since the electricity market started. This has depressed prices and hurt SCI’s bottom line. The oversupply of capacity and over-commitment of gas supply issues will likely continue to plague Singapore's power market in the near-to-medium term.
Execution of Indian power plants. The availability of coal supply and power purchase agreements (PPA) for SCI’s power plants in India are concerns. We find comfort that the TPCIL plant is up and running, with 86% of capacity committed on long-term PPAs and operating using both domestic and imported coal.
Company Background Sembcorp Industries (SCI) is a trusted provider of essential energy and water solutions to both industrial and municipal customers. It has facilities with 10,600MW of gross power capacity and over 10m cubic metres of water per day in operation and under development. It is also a world leader in marine and offshore engineering (via Sembcorp Marine) as well as an established brand name in urban development (comprising industrial parks as well as business, commercial and residential space) in Vietnam, China and Indonesia.
Leverage & Asset Turnover (x)
Capital Expenditure
ROE (%)
Forward PE Band (x)
PB Band (x)
Source: Company, DBS Bank
Page 22Page 22
Company Guide
Sembcorp Industries
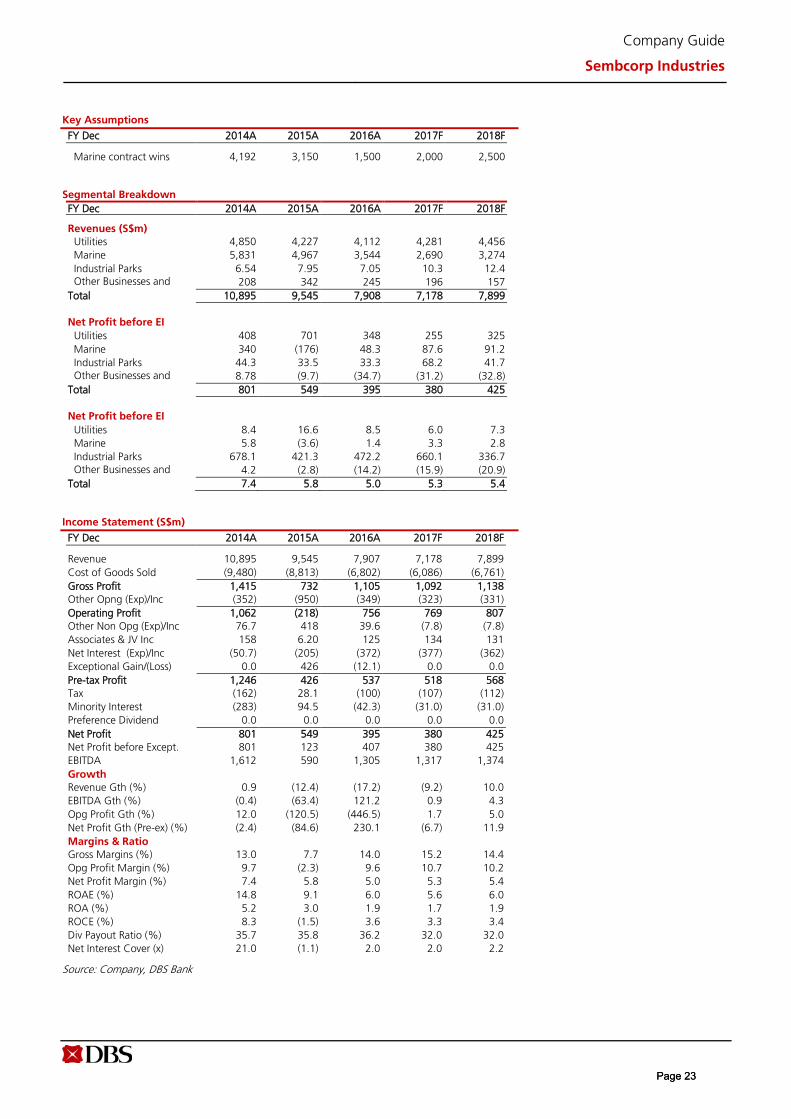
Key Assumptions
FY Dec 2014A 2015A 2016A 2017F 2018F
Marine contract wins 4,192 3,150 1,500 2,000 2,500
Segmental Breakdown FY Dec 2014A 2015A 2016A 2017F 2018F
Revenues (S$m) Utilities 4,850 4,227 4,112 4,281 4,456 Marine 5,831 4,967 3,544 2,690 3,274 Industrial Parks 6.54 7.95 7.05 10.3 12.4 Other Businesses and 208 342 245 196 157 Total 10,895 9,545 7,908 7,178 7,899
Net Profit before EI Utilities 408 701 348 255 325
Marine 340 (176) 48.3 87.6 91.2 Industrial Parks 44.3 33.5 33.3 68.2 41.7 Other Businesses and
8.78 (9.7) (34.7) (31.2) (32.8)
Total 801 549 395 380 425
Net Profit before EI Utilities 8.4 16.6 8.5 6.0 7.3
Marine 5.8 (3.6) 1.4 3.3 2.8 Industrial Parks 678.1 421.3 472.2 660.1 336.7 Other Businesses and
4.2 (2.8) (14.2) (15.9) (20.9)
Total 7.4 5.8 5.0 5.3 5.4
Income Statement (S$m)
FY Dec 2014A 2015A 2016A 2017F 2018F
Revenue 10,895 9,545 7,907 7,178 7,899 Cost of Goods Sold (9,480) (8,813) (6,802) (6,086) (6,761) Gross Profit 1,415 732 1,105 1,092 1,138 Other Opng (Exp)/Inc (352) (950) (349) (323) (331) Operating Profit 1,062 (218) 756 769 807 Other Non Opg (Exp)/Inc 76.7 418 39.6 (7.8) (7.8) Associates & JV Inc 158 6.20 125 134 131 Net Interest (Exp)/Inc (50.7) (205) (372) (377) (362) Exceptional Gain/(Loss) 0.0 426 (12.1) 0.0 0.0 Pre-tax Profit 1,246 426 537 518 568 Tax (162) 28.1 (100) (107) (112) Minority Interest (283) 94.5 (42.3) (31.0) (31.0) Preference Dividend 0.0 0.0 0.0 0.0 0.0 Net Profit 801 549 395 380 425 Net Profit before Except. 801 123 407 380 425 EBITDA 1,612 590 1,305 1,317 1,374 Growth Revenue Gth (%) 0.9 (12.4) (17.2) (9.2) 10.0 EBITDA Gth (%) (0.4) (63.4) 121.2 0.9 4.3 Opg Profit Gth (%) 12.0 (120.5) (446.5) 1.7 5.0 Net Profit Gth (Pre-ex) (%) (2.4) (84.6) 230.1 (6.7) 11.9 Margins & Ratio Gross Margins (%) 13.0 7.7 14.0 15.2 14.4 Opg Profit Margin (%) 9.7 (2.3) 9.6 10.7 10.2 Net Profit Margin (%) 7.4 5.8 5.0 5.3 5.4 ROAE (%) 14.8 9.1 6.0 5.6 6.0 ROA (%) 5.2 3.0 1.9 1.7 1.9 ROCE (%) 8.3 (1.5) 3.6 3.3 3.4 Div Payout Ratio (%) 35.7 35.8 36.2 32.0 32.0 Net Interest Cover (x) 21.0 (1.1) 2.0 2.0 2.2
Source: Company, DBS Bank
Page 23Page 23
Company Guide
Sembcorp Industries
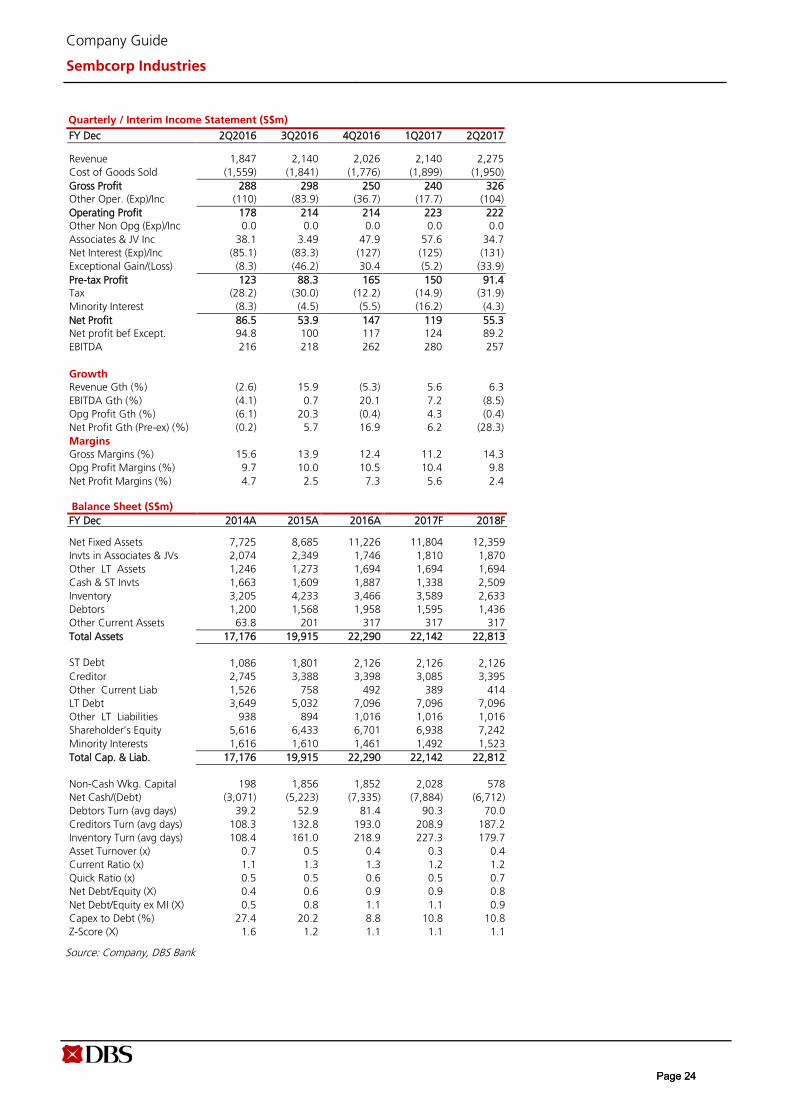
Quarterly / Interim Income Statement (S$m)
FY Dec 2Q2016 3Q2016 4Q2016 1Q2017 2Q2017
Revenue 1,847 2,140 2,026 2,140 2,275 Cost of Goods Sold (1,559) (1,841) (1,776) (1,899) (1,950) Gross Profit 288 298 250 240 326 Other Oper. (Exp)/Inc (110) (83.9) (36.7) (17.7) (104) Operating Profit 178 214 214 223 222 Other Non Opg (Exp)/Inc 0.0 0.0 0.0 0.0 0.0 Associates & JV Inc 38.1 3.49 47.9 57.6 34.7 Net Interest (Exp)/Inc (85.1) (83.3) (127) (125) (131) Exceptional Gain/(Loss) (8.3) (46.2) 30.4 (5.2) (33.9) Pre-tax Profit 123 88.3 165 150 91.4 Tax (28.2) (30.0) (12.2) (14.9) (31.9) Minority Interest (8.3) (4.5) (5.5) (16.2) (4.3) Net Profit 86.5 53.9 147 119 55.3 Net profit bef Except. 94.8 100 117 124 89.2 EBITDA 216 218 262 280 257
Growth Revenue Gth (%) (2.6) 15.9 (5.3) 5.6 6.3 EBITDA Gth (%) (4.1) 0.7 20.1 7.2 (8.5) Opg Profit Gth (%) (6.1) 20.3 (0.4) 4.3 (0.4) Net Profit Gth (Pre-ex) (%) (0.2) 5.7 16.9 6.2 (28.3) Margins Gross Margins (%) 15.6 13.9 12.4 11.2 14.3 Opg Profit Margins (%) 9.7 10.0 10.5 10.4 9.8 Net Profit Margins (%) 4.7 2.5 7.3 5.6 2.4
Balance Sheet (S$m) FY Dec 2014A 2015A 2016A 2017F 2018F
Net Fixed Assets 7,725 8,685 11,226 11,804 12,359 Invts in Associates & JVs 2,074 2,349 1,746 1,810 1,870 Other LT Assets 1,246 1,273 1,694 1,694 1,694 Cash & ST Invts 1,663 1,609 1,887 1,338 2,509 Inventory 3,205 4,233 3,466 3,589 2,633 Debtors 1,200 1,568 1,958 1,595 1,436 Other Current Assets 63.8 201 317 317 317 Total Assets 17,176 19,915 22,290 22,142 22,813
ST Debt 1,086 1,801 2,126 2,126 2,126 Creditor 2,745 3,388 3,398 3,085 3,395 Other Current Liab 1,526 758 492 389 414 LT Debt 3,649 5,032 7,096 7,096 7,096 Other LT Liabilities 938 894 1,016 1,016 1,016 Shareholder’s Equity 5,616 6,433 6,701 6,938 7,242 Minority Interests 1,616 1,610 1,461 1,492 1,523 Total Cap. & Liab. 17,176 19,915 22,290 22,142 22,812
Non-Cash Wkg. Capital 198 1,856 1,852 2,028 578 Net Cash/(Debt) (3,071) (5,223) (7,335) (7,884) (6,712) Debtors Turn (avg days) 39.2 52.9 81.4 90.3 70.0 Creditors Turn (avg days) 108.3 132.8 193.0 208.9 187.2 Inventory Turn (avg days) 108.4 161.0 218.9 227.3 179.7 Asset Turnover (x) 0.7 0.5 0.4 0.3 0.4 Current Ratio (x) 1.1 1.3 1.3 1.2 1.2 Quick Ratio (x) 0.5 0.5 0.6 0.5 0.7 Net Debt/Equity (X) 0.4 0.6 0.9 0.9 0.8 Net Debt/Equity ex MI (X) 0.5 0.8 1.1 1.1 0.9 Capex to Debt (%) 27.4 20.2 8.8 10.8 10.8 Z-Score (X) 1.6 1.2 1.1 1.1 1.1
Source: Company, DBS Bank
Page 24Page 24
Company Guide
Sembcorp Industries
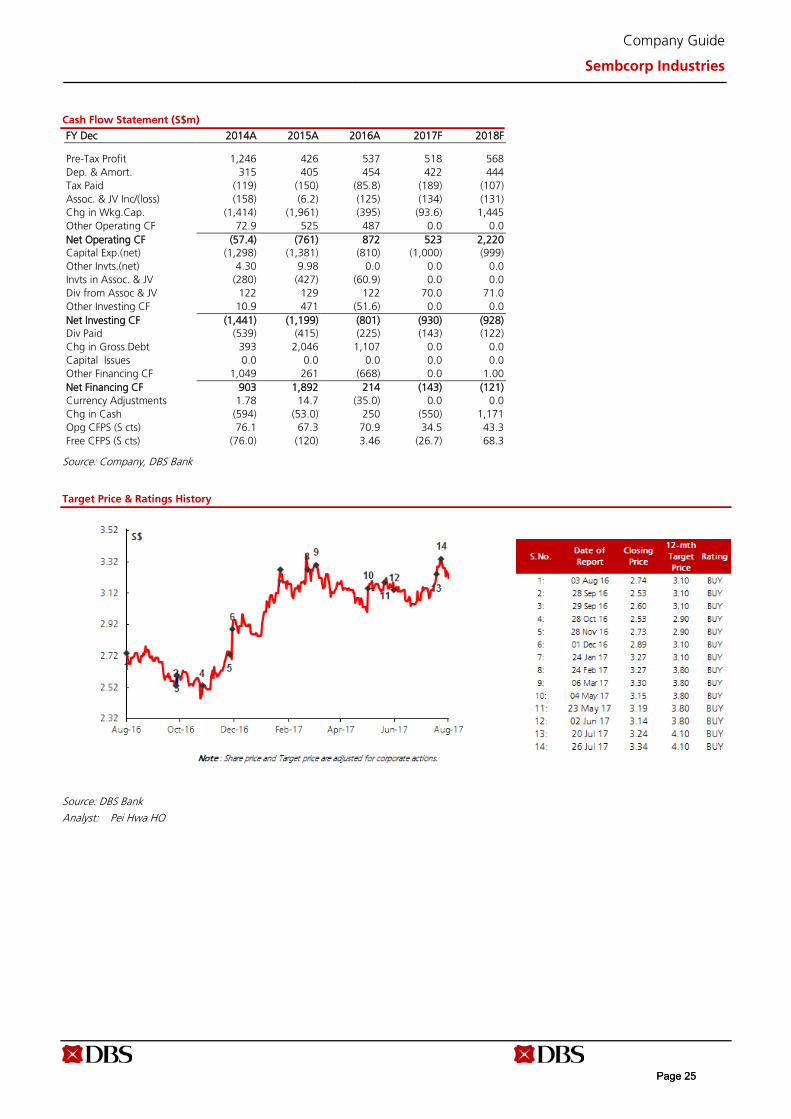
Cash Flow Statement (S$m)
FY Dec 2014A 2015A 2016A 2017F 2018F
Pre-Tax Profit 1,246 426 537 518 568 Dep. & Amort. 315 405 454 422 444 Tax Paid (119) (150) (85.8) (189) (107) Assoc. & JV Inc/(loss) (158) (6.2) (125) (134) (131) Chg in Wkg.Cap. (1,414) (1,961) (395) (93.6) 1,445 Other Operating CF 72.9 525 487 0.0 0.0 Net Operating CF (57.4) (761) 872 523 2,220 Capital Exp.(net) (1,298) (1,381) (810) (1,000) (999) Other Invts.(net) 4.30 9.98 0.0 0.0 0.0 Invts in Assoc. & JV (280) (427) (60.9) 0.0 0.0 Div from Assoc & JV 122 129 122 70.0 71.0 Other Investing CF 10.9 471 (51.6) 0.0 0.0 Net Investing CF (1,441) (1,199) (801) (930) (928) Div Paid (539) (415) (225) (143) (122) Chg in Gross Debt 393 2,046 1,107 0.0 0.0 Capital Issues 0.0 0.0 0.0 0.0 0.0 Other Financing CF 1,049 261 (668) 0.0 1.00 Net Financing CF 903 1,892 214 (143) (121) Currency Adjustments 1.78 14.7 (35.0) 0.0 0.0 Chg in Cash (594) (53.0) 250 (550) 1,171 Opg CFPS (S cts) 76.1 67.3 70.9 34.5 43.3 Free CFPS (S cts) (76.0) (120) 3.46 (26.7) 68.3
Source: Company, DBS Bank
Target Price & Ratings History
Source: DBS Bank
Analyst: Pei Hwa HO
Page 25Page 25
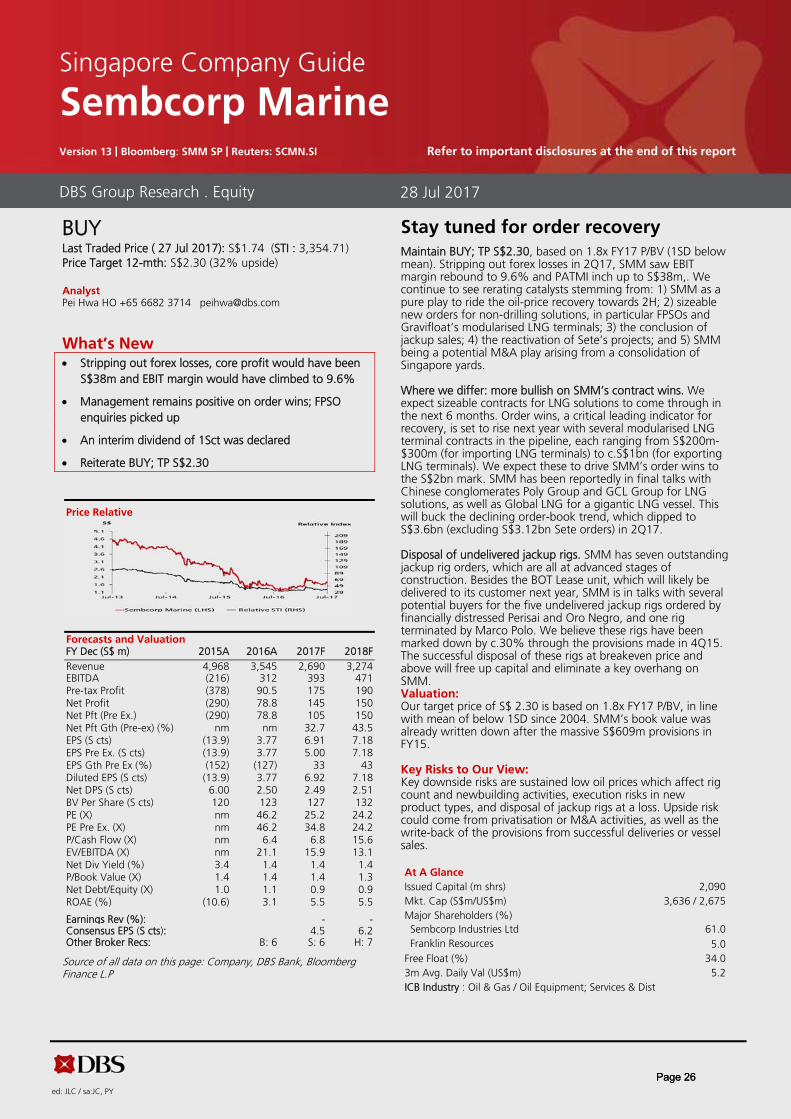
ed: JLC / sa:JC, PY
BUYLast Traded Price ( 27 Jul 2017): S$1.74 (STI : 3,354.71) Price Target 12-mth: S$2.30 (32% upside)
Analyst Pei Hwa HO +65 6682 3714 [email protected]
What’s New Stripping out forex losses, core profit would have been
S$38m and EBIT margin would have climbed to 9.6%
Management remains positive on order wins; FPSOenquiries picked up
An interim dividend of 1Sct was declared
Reiterate BUY; TP S$2.30
Price Relative
Forecasts and Valuation FY Dec (S$ m) 2015A 2016A 2017F 2018F Revenue 4,968 3,545 2,690 3,274 EBITDA (216) 312 393 471 Pre-tax Profit (378) 90.5 175 190 Net Profit (290) 78.8 145 150 Net Pft (Pre Ex.) (290) 78.8 105 150 Net Pft Gth (Pre-ex) (%) nm nm 32.7 43.5 EPS (S cts) (13.9) 3.77 6.91 7.18 EPS Pre Ex. (S cts) (13.9) 3.77 5.00 7.18 EPS Gth Pre Ex (%) (152) (127) 33 43 Diluted EPS (S cts) (13.9) 3.77 6.92 7.18 Net DPS (S cts) 6.00 2.50 2.49 2.51 BV Per Share (S cts) 120 123 127 132 PE (X) nm 46.2 25.2 24.2 PE Pre Ex. (X) nm 46.2 34.8 24.2 P/Cash Flow (X) nm 6.4 6.8 15.6 EV/EBITDA (X) nm 21.1 15.9 13.1 Net Div Yield (%) 3.4 1.4 1.4 1.4 P/Book Value (X) 1.4 1.4 1.4 1.3 Net Debt/Equity (X) 1.0 1.1 0.9 0.9 ROAE (%) (10.6) 3.1 5.5 5.5
Earnings Rev (%): - - Consensus EPS (S cts): 4.5 6.2 Other Broker Recs: B: 6 S: 6 H: 7
Source of all data on this page: Company, DBS Bank, Bloomberg Finance L.P
Stay tuned for order recovery
Maintain BUY; TP S$2.30, based on 1.8x FY17 P/BV (1SD below mean). Stripping out forex losses in 2Q17, SMM saw EBIT margin rebound to 9.6% and PATMI inch up to S$38m,. We continue to see rerating catalysts stemming from: 1) SMM as a pure play to ride the oil-price recovery towards 2H; 2) sizeable new orders for non-drilling solutions, in particular FPSOs and Gravifloat’s modularised LNG terminals; 3) the conclusion of jackup sales; 4) the reactivation of Sete’s projects; and 5) SMM being a potential M&A play arising from a consolidation of Singapore yards.
Where we differ: more bullish on SMM’s contract wins. We expect sizeable contracts for LNG solutions to come through in the next 6 months. Order wins, a critical leading indicator for recovery, is set to rise next year with several modularised LNG terminal contracts in the pipeline, each ranging from S$200m-$300m (for importing LNG terminals) to c.S$1bn (for exporting LNG terminals). We expect these to drive SMM’s order wins to the S$2bn mark. SMM has been reportedly in final talks with Chinese conglomerates Poly Group and GCL Group for LNG solutions, as well as Global LNG for a gigantic LNG vessel. This will buck the declining order-book trend, which dipped to S$3.6bn (excluding S$3.12bn Sete orders) in 2Q17.
Disposal of undelivered jackup rigs. SMM has seven outstanding jackup rig orders, which are all at advanced stages of construction. Besides the BOT Lease unit, which will likely be delivered to its customer next year, SMM is in talks with several potential buyers for the five undelivered jackup rigs ordered by financially distressed Perisai and Oro Negro, and one rig terminated by Marco Polo. We believe these rigs have been marked down by c.30% through the provisions made in 4Q15. The successful disposal of these rigs at breakeven price and above will free up capital and eliminate a key overhang on SMM. Valuation: Our target price of S$ 2.30 is based on 1.8x FY17 P/BV, in line with mean of below 1SD since 2004. SMM’s book value was already written down after the massive S$609m provisions in FY15.
Key Risks to Our View: Key downside risks are sustained low oil prices which affect rig count and newbuilding activities, execution risks in new product types, and disposal of jackup rigs at a loss. Upside risk could come from privatisation or M&A activities, as well as the write-back of the provisions from successful deliveries or vessel sales.
At A Glance
Issued Capital (m shrs) 2,090 Mkt. Cap (S$m/US$m) 3,636 / 2,675 Major Shareholders (%) Sembcorp Industries Ltd 61.0 Franklin Resources 5.0
Free Float (%) 34.0 3m Avg. Daily Val (US$m) 5.2 ICB Industry : Oil & Gas / Oil Equipment; Services & Dist
DBS Group Research . Equity 28 Jul 2017
Singapore Company Guide
Sembcorp Marine Version 13 | Bloomberg: SMM SP | Reuters: SCMN.SI Refer to important disclosures at the end of this report
Page 26Page 26

Company Guide
Sembcorp Marine
WHAT’S NEW
2Q showed sequential improvement
SMM reported headline net profits of S$5.6m, though this was mainly due to large FX losses of S$34.3m - on the revaluation of the Brazilian yard’s liabilities denominated in US dollar to Brazilian Real, as well as revaluation of other assets and liabilities from USD to SGD. Without the FX loss, net profit would have come in at c.S$40m – more or less flat q-o-q.
EBIT margin up from 1.8% in 1Q17 to 4.3% this quarter. Stripping out the FX losses, the improvement would have been more pronounced, with adjusted EBIT margin at 9.6% for 2Q17.
YTD order wins at S$75m, but management expects 2017 total wins to surpass 2016’s quantum. While order wins so far this year have been lackluster, management expressed optimism that the full-year orders would come in above 2016’s S$320m secured, although we note that this forecast
may include a variation order on one of the Petrobras FPSOs worth >US$100m. We believe SMM’s Gravifloat LNG terminals provide a unique modular option to customers, and will be the key driver of order wins in the near term. The value of these units can range from S$200-$300m for importing LNG terminals, and up to c.S$1bn for exporting LNG terminals.
Interim dividend of 1.0Scts declared (vs. 1.5Scts interim last year). This translates to a payout ratio of about 46% for 1H16. We believe SMM intends to maintain its dividend payout policy (and assume full-year dividend of 2.5Scts]. Lower gearing upon receipt of the proceeds of the divestment of a 30% in Cosco Shipyard Group should provide some comfort in terms of balance sheet/cashflow management with respect to continued dividend payouts.
Quarterly / Interim Income Statement (S$m)
FY Dec 2Q2016 1Q2017 2Q2017 % chg yoy % chg qoq
Revenue 908 760 655 (27.8) (13.8)
Cost of Goods Sold (802) (740) (579) (27.8) (21.7)
Gross Profit 106 19.9 76.3 (28.3) 282.6
Other Oper. (Exp)/Inc (52.9) (6.4) (47.8) (9.7) 652.1
Operating Profit 53.6 13.6 28.5 (46.8) 109.7
Other Non Opg (Exp)/Inc (8.4) 46.8 (4.6) 44.5 nm
Associates & JV Inc (4.7) (0.7) (0.5) 89.0 (27.1)
Net Interest (Exp)/Inc (21.2) (22.9) (19.8) 6.7 13.4
Exceptional Gain/(Loss) 0.0 0.0 0.0 - -
Pre-tax Profit 19.2 36.8 3.52 (81.7) (90.4)
Tax (8.5) 2.77 0.19 (102.2) (93.3)
Minority Interest 0.72 0.0 1.89 164.6 nm
Net Profit 11.5 39.6 5.59 (51.2) nm
Net profit bef Except. 11.5 39.6 5.59 (51.2) (85.9)
EBITDA 76.1 107 71.6 (6.0) (32.9)
Margins (%)
Gross Margins 11.7 2.6 11.6
Opg Profit Margins 5.9 1.8 4.3
Net Profit Margins 1.3 5.2 0.9
Source of all data: Company, DBS Bank
Page 27Page 27
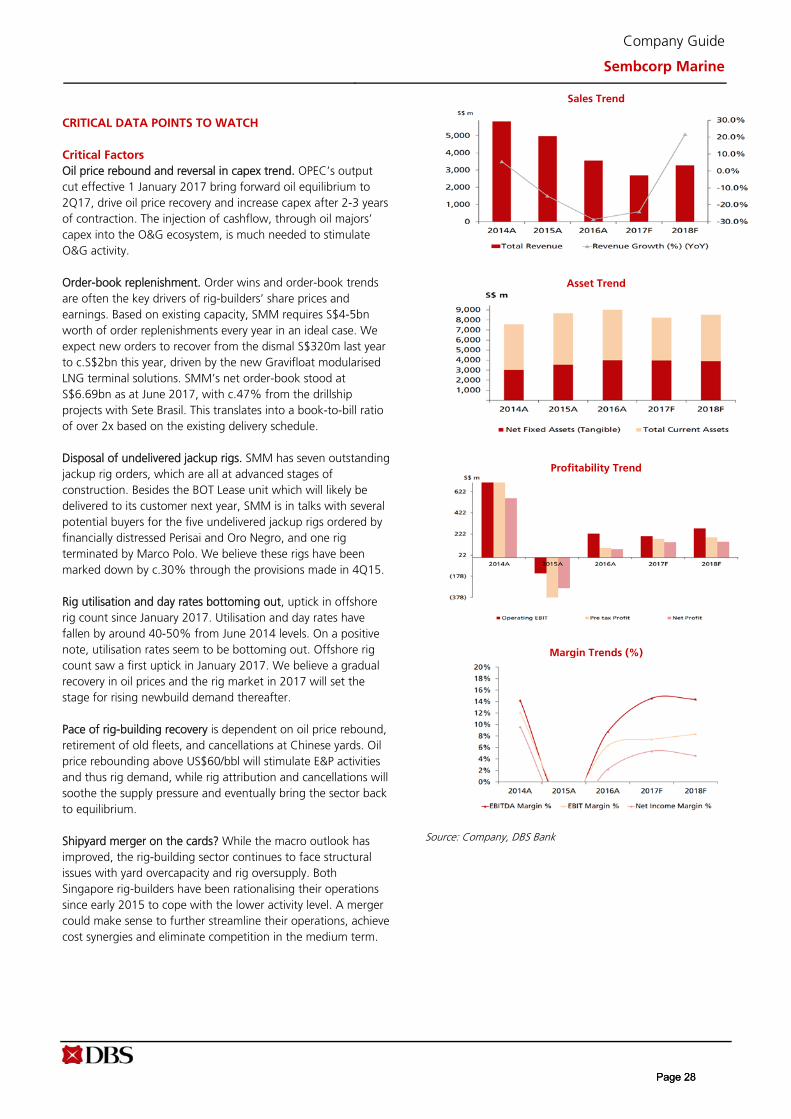
Company Guide
Sembcorp Marine
CRITICAL DATA POINTS TO WATCH
Critical Factors
Oil price rebound and reversal in capex trend. OPEC’s output cut effective 1 January 2017 bring forward oil equilibrium to 2Q17, drive oil price recovery and increase capex after 2-3 years of contraction. The injection of cashflow, through oil majors’ capex into the O&G ecosystem, is much needed to stimulate O&G activity.
Order-book replenishment. Order wins and order-book trends are often the key drivers of rig-builders’ share prices and earnings. Based on existing capacity, SMM requires S$4-5bn worth of order replenishments every year in an ideal case. We expect new orders to recover from the dismal S$320m last year to c.S$2bn this year, driven by the new Gravifloat modularised LNG terminal solutions. SMM’s net order-book stood at S$6.69bn as at June 2017, with c.47% from the drillship projects with Sete Brasil. This translates into a book-to-bill ratio of over 2x based on the existing delivery schedule.
Disposal of undelivered jackup rigs. SMM has seven outstanding jackup rig orders, which are all at advanced stages of construction. Besides the BOT Lease unit which will likely be delivered to its customer next year, SMM is in talks with several potential buyers for the five undelivered jackup rigs ordered by financially distressed Perisai and Oro Negro, and one rig terminated by Marco Polo. We believe these rigs have been marked down by c.30% through the provisions made in 4Q15.
Rig utilisation and day rates bottoming out, uptick in offshore rig count since January 2017. Utilisation and day rates have fallen by around 40-50% from June 2014 levels. On a positive note, utilisation rates seem to be bottoming out. Offshore rig count saw a first uptick in January 2017. We believe a gradual recovery in oil prices and the rig market in 2017 will set the stage for rising newbuild demand thereafter.
Pace of rig-building recovery is dependent on oil price rebound, retirement of old fleets, and cancellations at Chinese yards. Oil price rebounding above US$60/bbl will stimulate E&P activities and thus rig demand, while rig attribution and cancellations will soothe the supply pressure and eventually bring the sector back to equilibrium.
Shipyard merger on the cards? While the macro outlook has improved, the rig-building sector continues to face structural issues with yard overcapacity and rig oversupply. Both Singapore rig-builders have been rationalising their operations since early 2015 to cope with the lower activity level. A merger could make sense to further streamline their operations, achieve cost synergies and eliminate competition in the medium term.
Sales Trend
Asset Trend
Profitability Trend
Margin Trends (%)
Source: Company, DBS Bank
Page 28Page 28
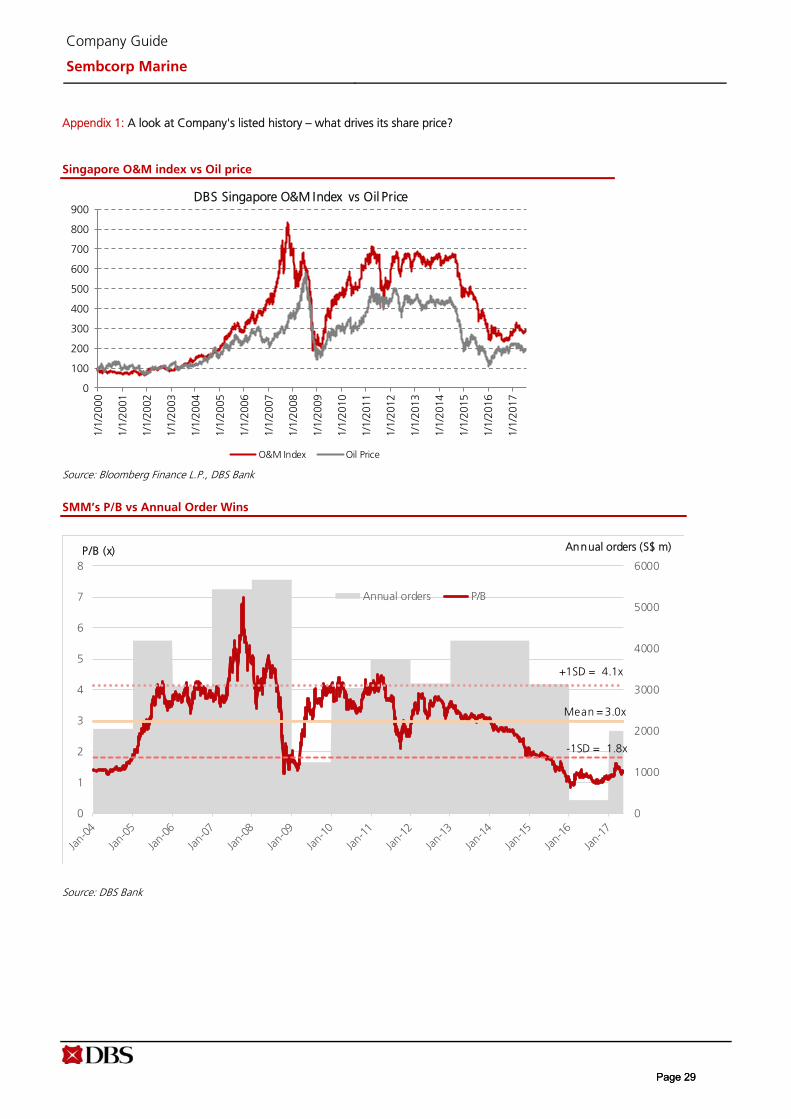
Company Guide
Sembcorp Marine
Appendix 1: A look at Company's listed history – what drives its share price?
Singapore O&M index vs Oil price
Source: Bloomberg Finance L.P., DBS Bank
SMM’s P/B vs Annual Order Wins
Source: DBS Bank
0
100
200
300
400
500
600
700
800
900
1/1/
2000
1/1/
2001
1/1/
2002
1/1/
2003
1/1/
2004
1/1/
2005
1/1/
2006
1/1/
2007
1/1/
2008
1/1/
2009
1/1/
2010
1/1/
2011
1/1/
2012
1/1/
2013
1/1/
2014
1/1/
2015
1/1/
2016
1/1/
2017
DBS Singapore O&M Index vs Oil Price
O&M Index Oil Price
0
1000
2000
3000
4000
5000
6000
0
1
2
3
4
5
6
7
8
Annual orders P/B
Mean = 3.0x
-1SD = 1.8x
Annual orders (S$ m)P/B (x)
+1SD = 4.1x
Page 29Page 29
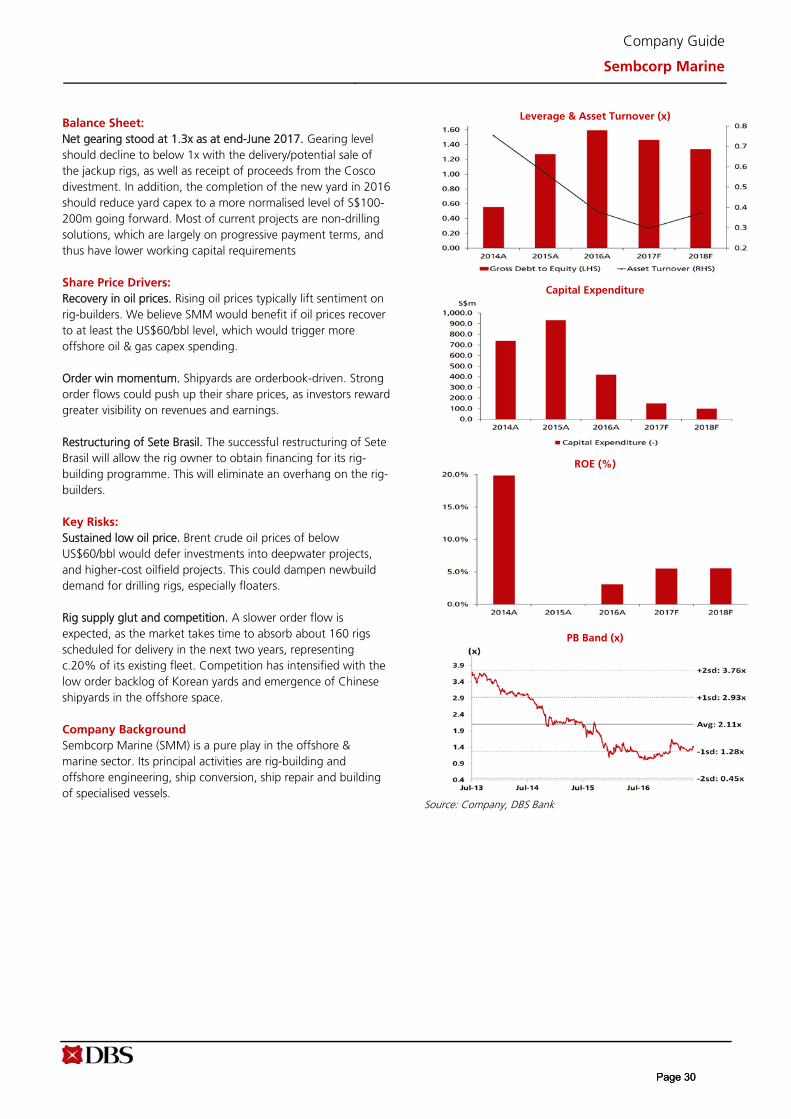
Company Guide
Sembcorp Marine
Balance Sheet:
Net gearing stood at 1.3x as at end-June 2017. Gearing level should decline to below 1x with the delivery/potential sale of the jackup rigs, as well as receipt of proceeds from the Cosco divestment. In addition, the completion of the new yard in 2016 should reduce yard capex to a more normalised level of S$100-200m going forward. Most of current projects are non-drilling solutions, which are largely on progressive payment terms, and thus have lower working capital requirements
Share Price Drivers:
Recovery in oil prices. Rising oil prices typically lift sentiment on rig-builders. We believe SMM would benefit if oil prices recover to at least the US$60/bbl level, which would trigger more offshore oil & gas capex spending.
Order win momentum. Shipyards are orderbook-driven. Strong order flows could push up their share prices, as investors reward greater visibility on revenues and earnings.
Restructuring of Sete Brasil. The successful restructuring of Sete Brasil will allow the rig owner to obtain financing for its rig-building programme. This will eliminate an overhang on the rig-builders.
Key Risks:
Sustained low oil price. Brent crude oil prices of below US$60/bbl would defer investments into deepwater projects, and higher-cost oilfield projects. This could dampen newbuild demand for drilling rigs, especially floaters.
Rig supply glut and competition. A slower order flow is expected, as the market takes time to absorb about 160 rigs scheduled for delivery in the next two years, representing c.20% of its existing fleet. Competition has intensified with thelow order backlog of Korean yards and emergence of Chinese shipyards in the offshore space.
Company Background
Sembcorp Marine (SMM) is a pure play in the offshore & marine sector. Its principal activities are rig-building and offshore engineering, ship conversion, ship repair and building of specialised vessels.
Leverage & Asset Turnover (x)
Capital Expenditure
ROE (%)
PB Band (x)
Source: Company, DBS Bank
Page 30Page 30

Company Guide
Sembcorp Marine
Key Assumptions
FY Dec 2014A 2015A 2016A 2017F 2018F
New order wins (S$ m) 4,192 3,128 320 2,000 2,500
Segmental Breakdown FY Dec 2014A 2015A 2016A 2017F 2018F
Revenues (S$m)
Rigs & Floaters 4,207 3,319 1,887 1,005 1,021 Offshore Platforms 925 1,017 1,116 1,074 1,586 Repairs & Upgrades 622 557 460 531 586 Specialised Shipbuilding 0.0 0.0 0.0 0.0 0.0 Others 78.6 75.8 82.1 80.0 81.0
Income Statement (S$m)
FY Dec 2014A 2015A 2016A 2017F 2018F
Revenue 5,833 4,968 3,545 2,690 3,274 Cost of Goods Sold (4,989) (4,837) (3,252) (2,428) (2,906) Gross Profit 844 131 293 262 368Other Opng (Exp)/Inc (137) (281) (67.5) (61.9) (95.0) Operating Profit 707 (150) 225 201 273Other Non Opg (Exp)/Inc 1.19 (18.2) (18.9) 4.50 4.50 Associates & JV Inc 9.86 (174) (35.1) 11.0 11.0 Net Interest (Exp)/Inc (11.3) (36.0) (80.7) (81.5) (98.4) Exceptional Gain/(Loss) 0.10 0.0 0.0 40.0 0.0 Pre-tax Profit 707 (378) 90.5 175 190Tax (106) 77.6 (15.4) (27.9) (34.3) Minority Interest (41.2) 10.3 3.62 (2.2) (6.3) Preference Dividend 0.0 0.0 0.0 0.0 0.0 Net Profit 560 (290) 78.8 145 150Net Profit before Except. 560 (290) 78.8 105 150 EBITDA 829 (216) 312 393 471 Growth
Revenue Gth (%) 5.6 (14.8) (28.6) (24.1) 21.7 EBITDA Gth (%) 11.4 nm nm 25.9 20.1 Opg Profit Gth (%) 12.3 (121.2) (250.2) (11.0) 36.3 Net Profit Gth (Pre-ex) (%) 4.1 nm nm 32.7 43.5 Margins & Ratio
Gross Margins (%) 14.5 2.6 8.3 9.8 11.3Opg Profit Margin (%) 12.1 (3.0) 6.4 7.5 8.4Net Profit Margin (%) 9.6 (5.8) 2.2 5.4 4.6ROAE (%) 19.9 (10.6) 3.1 5.5 5.5ROA (%) 7.2 (3.3) 0.8 1.6 1.7ROCE (%) 13.2 (2.6) 2.8 2.4 3.3Div Payout Ratio (%) 48.5 N/A 66.3 36.0 35.0 Net Interest Cover (x) 62.9 (4.2) 2.8 2.5 2.8
Source: Company, DBS Bank
Page 31Page 31
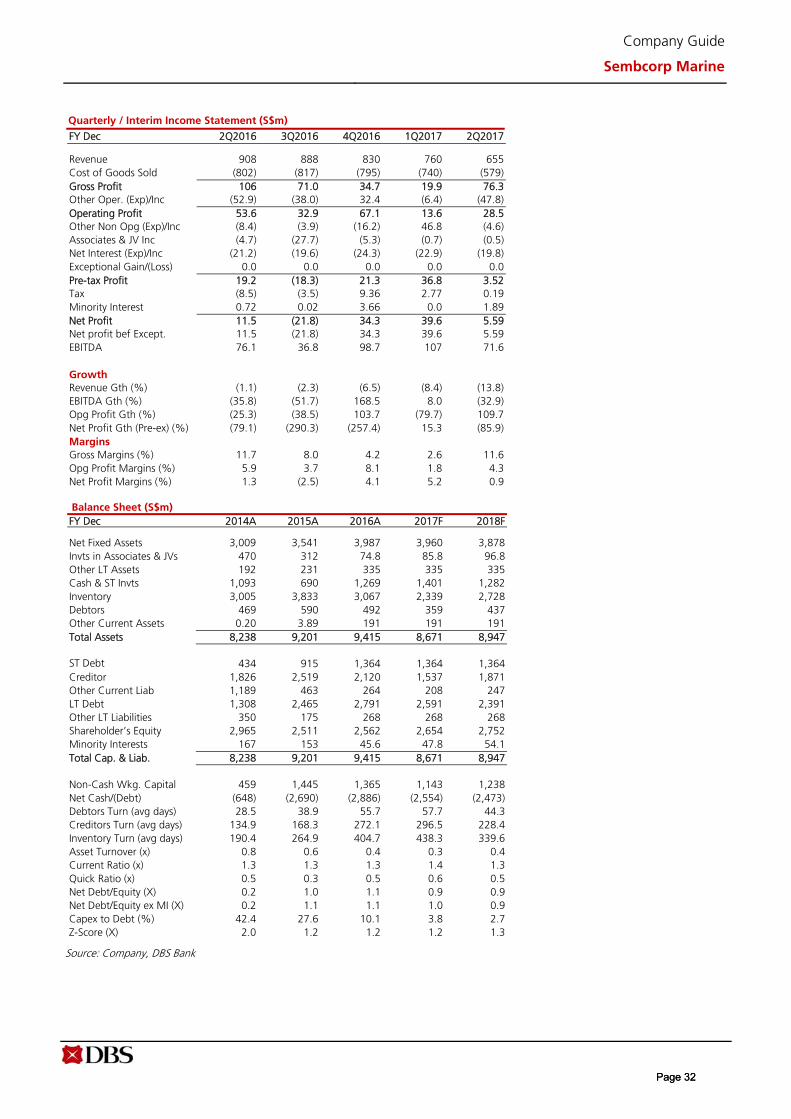
Company Guide
Sembcorp Marine
Quarterly / Interim Income Statement (S$m)
FY Dec 2Q2016 3Q2016 4Q2016 1Q2017 2Q2017
Revenue 908 888 830 760 655Cost of Goods Sold (802) (817) (795) (740) (579)Gross Profit 106 71.0 34.7 19.9 76.3Other Oper. (Exp)/Inc (52.9) (38.0) 32.4 (6.4) (47.8)Operating Profit 53.6 32.9 67.1 13.6 28.5Other Non Opg (Exp)/Inc (8.4) (3.9) (16.2) 46.8 (4.6) Associates & JV Inc (4.7) (27.7) (5.3) (0.7) (0.5)Net Interest (Exp)/Inc (21.2) (19.6) (24.3) (22.9) (19.8) Exceptional Gain/(Loss) 0.0 0.0 0.0 0.0 0.0Pre-tax Profit 19.2 (18.3) 21.3 36.8 3.52Tax (8.5) (3.5) 9.36 2.77 0.19Minority Interest 0.72 0.02 3.66 0.0 1.89Net Profit 11.5 (21.8) 34.3 39.6 5.59Net profit bef Except. 11.5 (21.8) 34.3 39.6 5.59EBITDA 76.1 36.8 98.7 107 71.6
Growth
Revenue Gth (%) (1.1) (2.3) (6.5) (8.4) (13.8)EBITDA Gth (%) (35.8) (51.7) 168.5 8.0 (32.9) Opg Profit Gth (%) (25.3) (38.5) 103.7 (79.7) 109.7 Net Profit Gth (Pre-ex) (%) (79.1) (290.3) (257.4) 15.3 (85.9) Margins
Gross Margins (%) 11.7 8.0 4.2 2.6 11.6Opg Profit Margins (%) 5.9 3.7 8.1 1.8 4.3Net Profit Margins (%) 1.3 (2.5) 4.1 5.2 0.9
Balance Sheet (S$m) FY Dec 2014A 2015A 2016A 2017F 2018F
Net Fixed Assets 3,009 3,541 3,987 3,960 3,878 Invts in Associates & JVs 470 312 74.8 85.8 96.8 Other LT Assets 192 231 335 335 335 Cash & ST Invts 1,093 690 1,269 1,401 1,282 Inventory 3,005 3,833 3,067 2,339 2,728 Debtors 469 590 492 359 437 Other Current Assets 0.20 3.89 191 191 191 Total Assets 8,238 9,201 9,415 8,671 8,947
ST Debt 434 915 1,364 1,364 1,364 Creditor 1,826 2,519 2,120 1,537 1,871 Other Current Liab 1,189 463 264 208 247 LT Debt 1,308 2,465 2,791 2,591 2,391 Other LT Liabilities 350 175 268 268 268 Shareholder’s Equity 2,965 2,511 2,562 2,654 2,752 Minority Interests 167 153 45.6 47.8 54.1 Total Cap. & Liab. 8,238 9,201 9,415 8,671 8,947
Non-Cash Wkg. Capital 459 1,445 1,365 1,143 1,238 Net Cash/(Debt) (648) (2,690) (2,886) (2,554) (2,473) Debtors Turn (avg days) 28.5 38.9 55.7 57.7 44.3 Creditors Turn (avg days) 134.9 168.3 272.1 296.5 228.4 Inventory Turn (avg days) 190.4 264.9 404.7 438.3 339.6 Asset Turnover (x) 0.8 0.6 0.4 0.3 0.4 Current Ratio (x) 1.3 1.3 1.3 1.4 1.3 Quick Ratio (x) 0.5 0.3 0.5 0.6 0.5 Net Debt/Equity (X) 0.2 1.0 1.1 0.9 0.9 Net Debt/Equity ex MI (X) 0.2 1.1 1.1 1.0 0.9 Capex to Debt (%) 42.4 27.6 10.1 3.8 2.7 Z-Score (X) 2.0 1.2 1.2 1.2 1.3
Source: Company, DBS Bank
Page 32Page 32
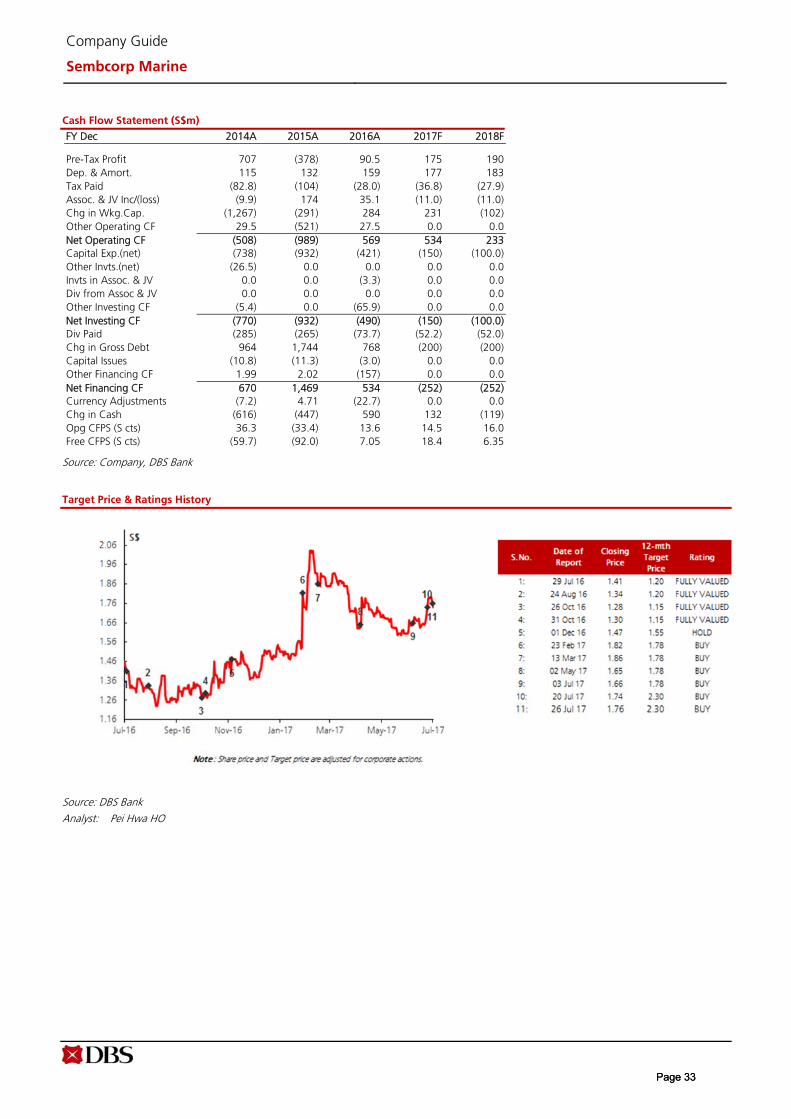
Company Guide
Sembcorp Marine
Cash Flow Statement (S$m)
FY Dec 2014A 2015A 2016A 2017F 2018F
Pre-Tax Profit 707 (378) 90.5 175 190Dep. & Amort. 115 132 159 177 183Tax Paid (82.8) (104) (28.0) (36.8) (27.9) Assoc. & JV Inc/(loss) (9.9) 174 35.1 (11.0) (11.0) Chg in Wkg.Cap. (1,267) (291) 284 231 (102) Other Operating CF 29.5 (521) 27.5 0.0 0.0Net Operating CF (508) (989) 569 534 233Capital Exp.(net) (738) (932) (421) (150) (100.0)Other Invts.(net) (26.5) 0.0 0.0 0.0 0.0Invts in Assoc. & JV 0.0 0.0 (3.3) 0.0 0.0 Div from Assoc & JV 0.0 0.0 0.0 0.0 0.0Other Investing CF (5.4) 0.0 (65.9) 0.0 0.0Net Investing CF (770) (932) (490) (150) (100.0)Div Paid (285) (265) (73.7) (52.2) (52.0) Chg in Gross Debt 964 1,744 768 (200) (200) Capital Issues (10.8) (11.3) (3.0) 0.0 0.0Other Financing CF 1.99 2.02 (157) 0.0 0.0Net Financing CF 670 1,469 534 (252) (252) Currency Adjustments (7.2) 4.71 (22.7) 0.0 0.0Chg in Cash (616) (447) 590 132 (119) Opg CFPS (S cts) 36.3 (33.4) 13.6 14.5 16.0 Free CFPS (S cts) (59.7) (92.0) 7.05 18.4 6.35
Source: Company, DBS Bank
Target Price & Ratings History
Source: DBS Bank
Analyst: Pei Hwa HO
Page 33Page 33
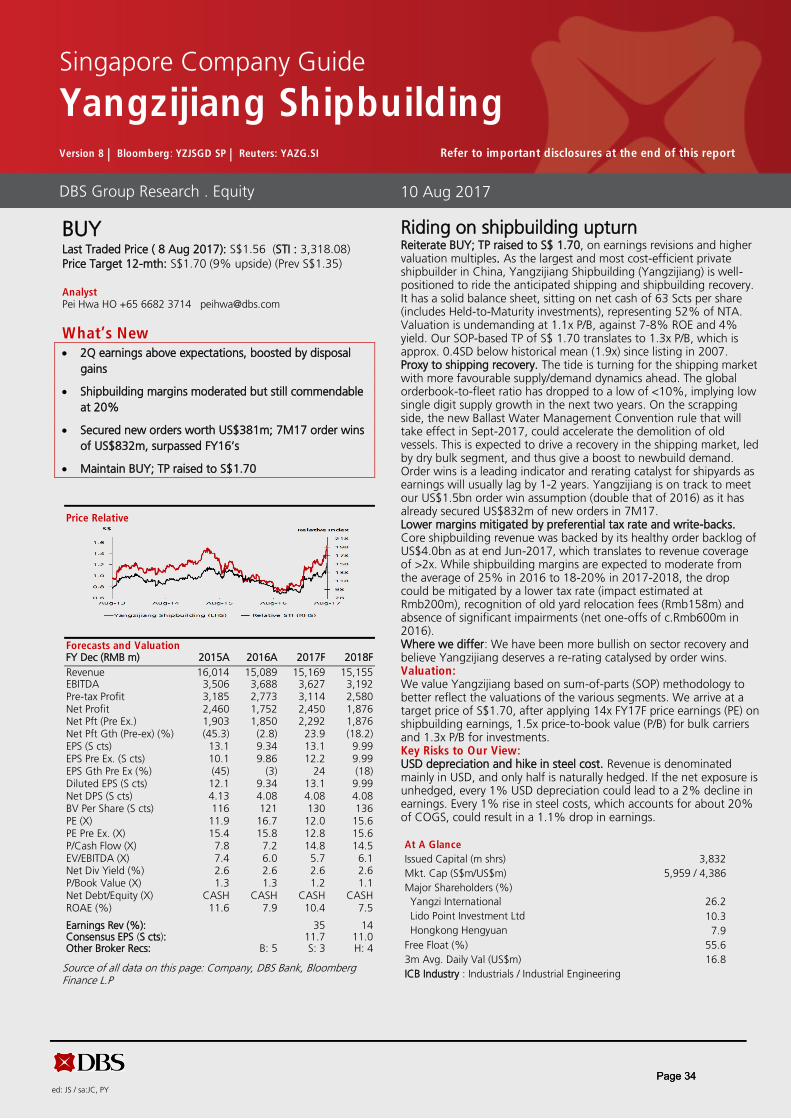
ed: JS / sa:JC, PY
BUYLast Traded Price ( 8 Aug 2017): S$1.56 (STI : 3,318.08)
Price Target 12-mth: S$1.70 (9% upside) (Prev S$1.35)
Analyst Pei Hwa HO +65 6682 3714 [email protected]
What’s New 2Q earnings above expectations, boosted by disposal
gains
Shipbuilding margins moderated but still commendable
at 20%
Secured new orders worth US$381m; 7M17 order wins
of US$832m, surpassed FY16’s
Maintain BUY; TP raised to S$1.70
Price Relative
Forecasts and Valuation FY Dec (RMB m) 2015A 2016A 2017F 2018F
Revenue 16,014 15,089 15,169 15,155 EBITDA 3,506 3,688 3,627 3,192 Pre-tax Profit 3,185 2,773 3,114 2,580 Net Profit 2,460 1,752 2,450 1,876 Net Pft (Pre Ex.) 1,903 1,850 2,292 1,876 Net Pft Gth (Pre-ex) (%) (45.3) (2.8) 23.9 (18.2) EPS (S cts) 13.1 9.34 13.1 9.99 EPS Pre Ex. (S cts) 10.1 9.86 12.2 9.99 EPS Gth Pre Ex (%) (45) (3) 24 (18) Diluted EPS (S cts) 12.1 9.34 13.1 9.99 Net DPS (S cts) 4.13 4.08 4.08 4.08 BV Per Share (S cts) 116 121 130 136 PE (X) 11.9 16.7 12.0 15.6 PE Pre Ex. (X) 15.4 15.8 12.8 15.6 P/Cash Flow (X) 7.8 7.2 14.8 14.5 EV/EBITDA (X) 7.4 6.0 5.7 6.1 Net Div Yield (%) 2.6 2.6 2.6 2.6 P/Book Value (X) 1.3 1.3 1.2 1.1 Net Debt/Equity (X) CASH CASH CASH CASH ROAE (%) 11.6 7.9 10.4 7.5
Earnings Rev (%): 35 14 Consensus EPS (S cts): 11.7 11.0 Other Broker Recs: B: 5 S: 3 H: 4
Source of all data on this page: Company, DBS Bank, Bloomberg Finance L.P
Riding on shipbuilding upturn Reiterate BUY; TP raised to S$ 1.70, on earnings revisions and higher valuation multiples. As the largest and most cost-efficient private shipbuilder in China, Yangzijiang Shipbuilding (Yangzijiang) is well-positioned to ride the anticipated shipping and shipbuilding recovery. It has a solid balance sheet, sitting on net cash of 63 Scts per share (includes Held-to-Maturity investments), representing 52% of NTA. Valuation is undemanding at 1.1x P/B, against 7-8% ROE and 4% yield. Our SOP-based TP of S$ 1.70 translates to 1.3x P/B, which is approx. 0.4SD below historical mean (1.9x) since listing in 2007. Proxy to shipping recovery. The tide is turning for the shipping market with more favourable supply/demand dynamics ahead. The global orderbook-to-fleet ratio has dropped to a low of <10%, implying low single digit supply growth in the next two years. On the scrapping side, the new Ballast Water Management Convention rule that will take effect in Sept-2017, could accelerate the demolition of old vessels. This is expected to drive a recovery in the shipping market, led by dry bulk segment, and thus give a boost to newbuild demand. Order wins is a leading indicator and rerating catalyst for shipyards as earnings will usually lag by 1-2 years. Yangzijiang is on track to meet our US$1.5bn order win assumption (double that of 2016) as it has already secured US$832m of new orders in 7M17. Lower margins mitigated by preferential tax rate and write-backs. Core shipbuilding revenue was backed by its healthy order backlog of US$4.0bn as at end Jun-2017, which translates to revenue coverage of >2x. While shipbuilding margins are expected to moderate from the average of 25% in 2016 to 18-20% in 2017-2018, the drop could be mitigated by a lower tax rate (impact estimated at Rmb200m), recognition of old yard relocation fees (Rmb158m) and absence of significant impairments (net one-offs of c.Rmb600m in 2016). Where we differ: We have been more bullish on sector recovery and believe Yangzijiang deserves a re-rating catalysed by order wins. Valuation: We value Yangzijiang based on sum-of-parts (SOP) methodology to better reflect the valuations of the various segments. We arrive at a target price of S$1.70, after applying 14x FY17F price earnings (PE) on shipbuilding earnings, 1.5x price-to-book value (P/B) for bulk carriers and 1.3x P/B for investments. Key Risks to Our View: USD depreciation and hike in steel cost. Revenue is denominated mainly in USD, and only half is naturally hedged. If the net exposure is unhedged, every 1% USD depreciation could lead to a 2% decline in earnings. Every 1% rise in steel costs, which accounts for about 20% of COGS, could result in a 1.1% drop in earnings.
At A Glance Issued Capital (m shrs) 3,832
Mkt. Cap (S$m/US$m) 5,959 / 4,386
Major Shareholders (%)
Yangzi International 26.2
Lido Point Investment Ltd 10.3
Hongkong Hengyuan 7.9
Free Float (%) 55.6
3m Avg. Daily Val (US$m) 16.8
ICB Industry : Industrials / Industrial Engineering
DBS Group Research . Equity 10 Aug 2017
Singapore Company Guide
Yangzijiang ShipbuildingVersion 8 | Bloomberg: YZJSGD SP | Reuters: YAZG.SI Refer to important disclosures at the end of this report
Page 34Page 34

Company Guide
Yangzijiang Shipbuilding
WHAT’S NEW
Another stellar quarter
2Q17 results review
2Q17 above; boosted by disposal gain. Yangzijiang’s headline
net profit rose 73% y-o-y to Rmb720m in 2Q17, on the back
of 27% y-o-y revenue growth. This was better than our
expectation of c.Rmb500m, aided by the gains from
dissolution of four shipping companies of Rmb134m and
higher HTM investment income (+Rmb82m y-o-y). The impact
of forex loss was offset by fair value gains on financial assets.
This brings 1H17 net profit to Rmb1,388m, making up 77%
of our full year estimate.
Shipbuilding margin moderated but remains commendable at
20%. Core shipbuilding gross margin was down 3ppts q-o-q
to 20% in 2Q17 due largely to lower contract prices for new
projects.
Solid balance sheet. Including HTM investments, Yangzijiang
is in a net cash position, equivalent to 63 Scts per share or
50% of its NTA. This bodes well for M&A activities.
Secured new orders worth c.US$381m in Jul-2017.
Yangzijiang announced US$451m new orders in 1H17. In
addition, the group has secured new orders worth US$381m
in Jul-2017, comprising:
- Three units of 180,000DWT bulk carriers
- Six units of 82,000DWT bulk carriers
- Four units of 45,000DWT bulk carriers
- One unit of 29,800DWT Great Lakes Unloading bulk
carrier
New wins YTD make up 55% of our order win assumption of
US$1.5bn this year. Orderbook was steady at US$4.0bn,
implying revenue coverage of more than 2-years.
One termination in 2Q. An order for 82,000 dwt bulk carrier
was terminated in 2Q. There should not be any material
impact given construction had yet to commence and
downpayment will be forfeited. We understand the
shipowner would place an order for another design instead.
We believe order deferments and cancellations will subside as
recovery gains momentum.
Outlook
Shipbuilding on recovery track. Globally, a total of 409 vessels
of a combined 31.4m dwt were ordered in 7M17, and this
surpassed the full year 2016 orders of 30.7m dwt. This has
been supported primarily by investment in the tanker sector,
while bulk carrier and containership ordering has remained
relatively benign. We expect ordering especially for bulk
carriers to accelerate in 2018 given the current very low
orderbook-to-fleet ratio of <10%, supported by anticipated
recovery in shipping market.
Key beneficiaries are likely to be the top Korean and Chinese
shipyards, which have better credit access, and are more cost
efficient. Management of Yangzijiang believes that industry
consolidation will continue, with the top 20% of shipyards
receiving 80% of the orders.
Recommendation
Earnings revisions. We have raised our FY17/18F net profit by
35%/14% after factoring in the dissolution gain for shipping
companies (+Rmb134m in 2Q17), estimated retroactive tax
for 2016 (+Rmb200m in 2H17), higher investment returns
(+Rmb180m in 2017 and Rmb120m in 2018), and better
shipbuilding gross margins from 15.9% to 21.3% in 2017
and 17.0% in 2018.
Page 35Page 35
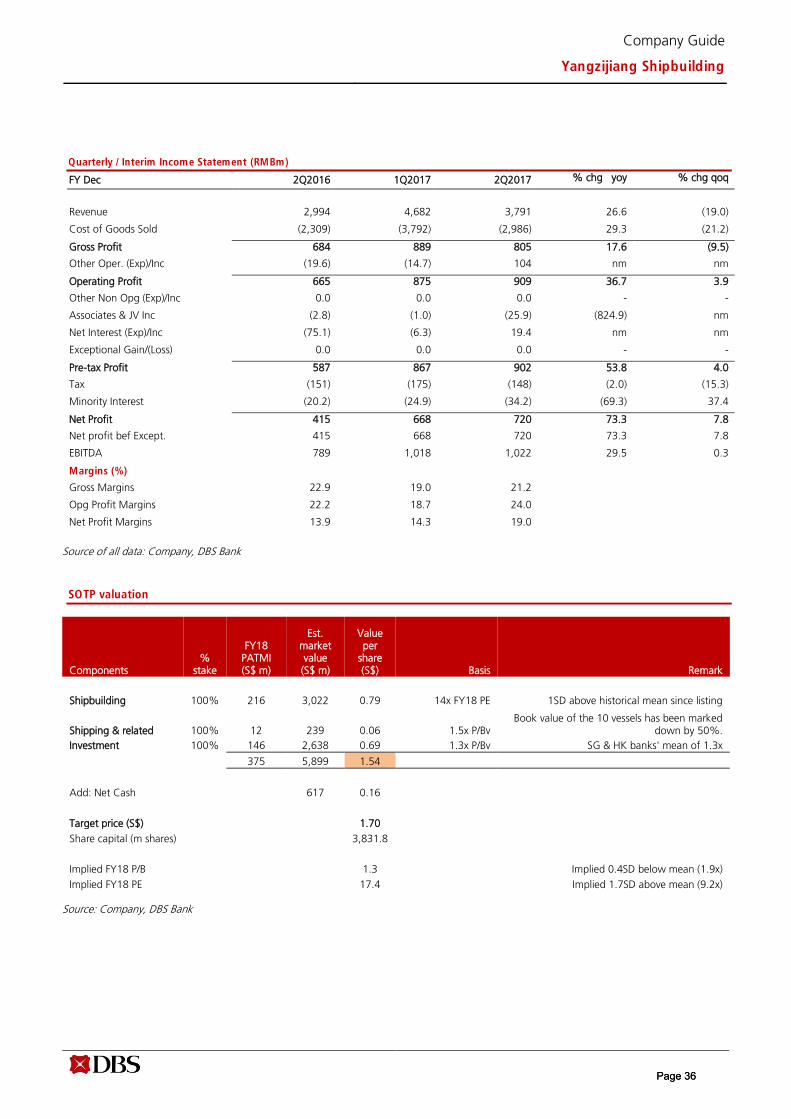
Company Guide
Yangzijiang Shipbuilding
Quarterly / Interim Income Statement (RMBm)
FY Dec 2Q2016 1Q2017 2Q2017 % chg yoy % chg qoq
Revenue 2,994 4,682 3,791 26.6 (19.0)
Cost of Goods Sold (2,309) (3,792) (2,986) 29.3 (21.2)
Gross Profit 684 889 805 17.6 (9.5)
Other Oper. (Exp)/Inc (19.6) (14.7) 104 nm nm
Operating Profit 665 875 909 36.7 3.9
Other Non Opg (Exp)/Inc 0.0 0.0 0.0 - -
Associates & JV Inc (2.8) (1.0) (25.9) (824.9) nm
Net Interest (Exp)/Inc (75.1) (6.3) 19.4 nm nm
Exceptional Gain/(Loss) 0.0 0.0 0.0 - -
Pre-tax Profit 587 867 902 53.8 4.0
Tax (151) (175) (148) (2.0) (15.3)
Minority Interest (20.2) (24.9) (34.2) (69.3) 37.4
Net Profit 415 668 720 73.3 7.8
Net profit bef Except. 415 668 720 73.3 7.8
EBITDA 789 1,018 1,022 29.5 0.3
Margins (%)
Gross Margins 22.9 19.0 21.2
Opg Profit Margins 22.2 18.7 24.0
Net Profit Margins 13.9 14.3 19.0
Source of all data: Company, DBS Bank
SOTP valuation
Components %
stake
FY18 PATMI (S$ m)
Est. market value (S$ m)
Value per
share (S$) Basis Remark
Shipbuilding 100% 216 3,022 0.79 14x FY18 PE 1SD above historical mean since listing
Shipping & related 100% 12 239 0.06 1.5x P/Bv Book value of the 10 vessels has been marked
down by 50%.
Investment 100% 146 2,638 0.69 1.3x P/Bv SG & HK banks' mean of 1.3x
375 5,899 1.54
Add: Net Cash 617 0.16
Target price (S$) 1.70
Share capital (m shares) 3,831.8
Implied FY18 P/B 1.3 Implied 0.4SD below mean (1.9x)
Implied FY18 PE 17.4 Implied 1.7SD above mean (9.2x)
Source: Company, DBS Bank
Page 36Page 36

Company Guide
Yangzijiang Shipbuilding
World new contracting, monthly and annually
Source: Clarksons, DBS Bank
0
5
10
15
20
25
30
35
40
Jan-9
6Ju
l-96
Jan-9
7Ju
l-97
Jan-9
8Ju
l-98
Jan-9
9Ju
l-99
Jan-0
0Ju
l-00
Jan-0
1Ju
l-01
Jan-0
2Ju
l-02
Jan-0
3Ju
l-03
Jan-0
4Ju
l-04
Jan-0
5Ju
l-05
Jan-0
6Ju
l-06
Jan-0
7Ju
l-07
Jan-0
8Ju
l-08
Jan-0
9Ju
l-09
Jan-1
0Ju
l-10
Jan-1
1Ju
l-11
Jan-1
2Ju
l-12
Jan-1
3Ju
l-13
Jan-1
4Ju
l-14
Jan-1
5Ju
l-15
Jan-1
6Ju
l-16
Jan-1
7Ju
l-17
m dwt
3653
37 44
6947 54
118106
95
209
260
181
57
156
86
54
178
118111
31 31
0
50
100
150
200
250
300
1996
1997
1998
1999
2000
2001
2002
2003
2004
2005
2006
2007
2008
2009
2010
2011
2012
2013
2014
2015
2016
7M
17
m dwt
Page 37Page 37
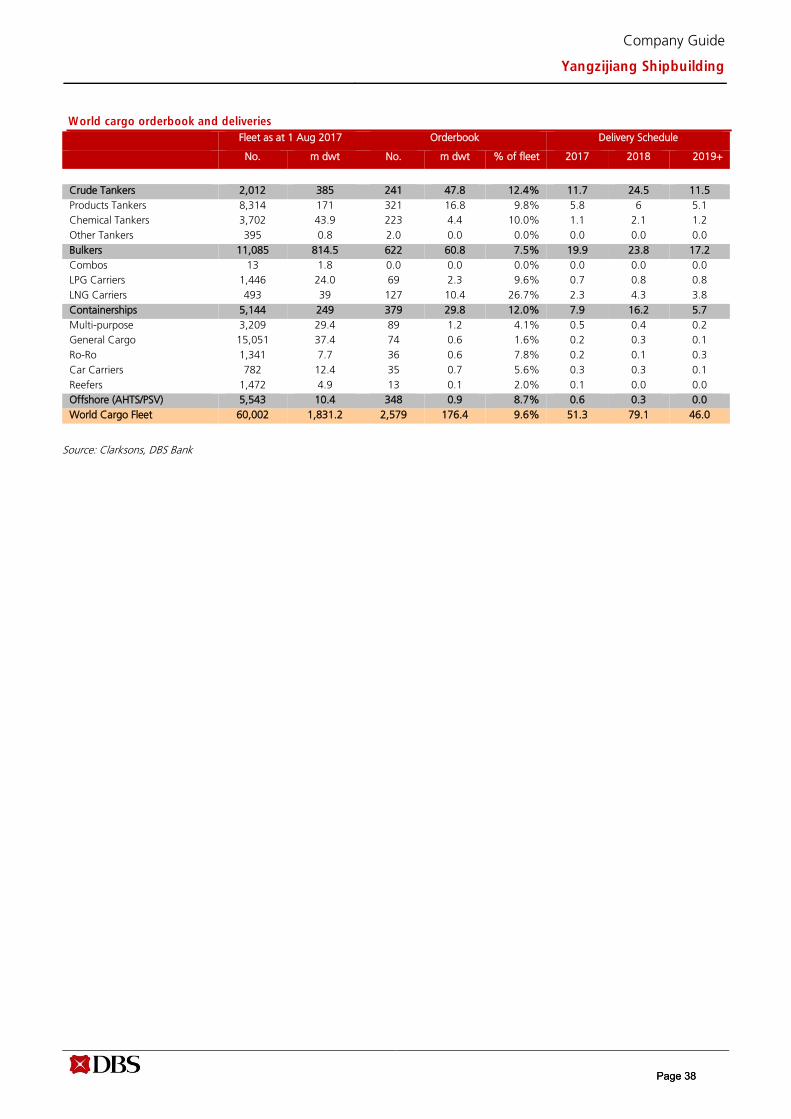
Company Guide
Yangzijiang Shipbuilding
World cargo orderbook and deliveries
Fleet as at 1 Aug 2017 Orderbook Delivery Schedule
No. m dwt No. m dwt % of fleet 2017 2018 2019+
Crude Tankers 2,012 385 241 47.8 12.4% 11.7 24.5 11.5
Products Tankers 8,314 171 321 16.8 9.8% 5.8 6 5.1
Chemical Tankers 3,702 43.9 223 4.4 10.0% 1.1 2.1 1.2
Other Tankers 395 0.8 2.0 0.0 0.0% 0.0 0.0 0.0
Bulkers 11,085 814.5 622 60.8 7.5% 19.9 23.8 17.2
Combos 13 1.8 0.0 0.0 0.0% 0.0 0.0 0.0
LPG Carriers 1,446 24.0 69 2.3 9.6% 0.7 0.8 0.8
LNG Carriers 493 39 127 10.4 26.7% 2.3 4.3 3.8
Containerships 5,144 249 379 29.8 12.0% 7.9 16.2 5.7
Multi-purpose 3,209 29.4 89 1.2 4.1% 0.5 0.4 0.2
General Cargo 15,051 37.4 74 0.6 1.6% 0.2 0.3 0.1
Ro-Ro 1,341 7.7 36 0.6 7.8% 0.2 0.1 0.3
Car Carriers 782 12.4 35 0.7 5.6% 0.3 0.3 0.1
Reefers 1,472 4.9 13 0.1 2.0% 0.1 0.0 0.0
Offshore (AHTS/PSV) 5,543 10.4 348 0.9 8.7% 0.6 0.3 0.0
World Cargo Fleet 60,002 1,831.2 2,579 176.4 9.6% 51.3 79.1 46.0
Source: Clarksons, DBS Bank
Page 38Page 38
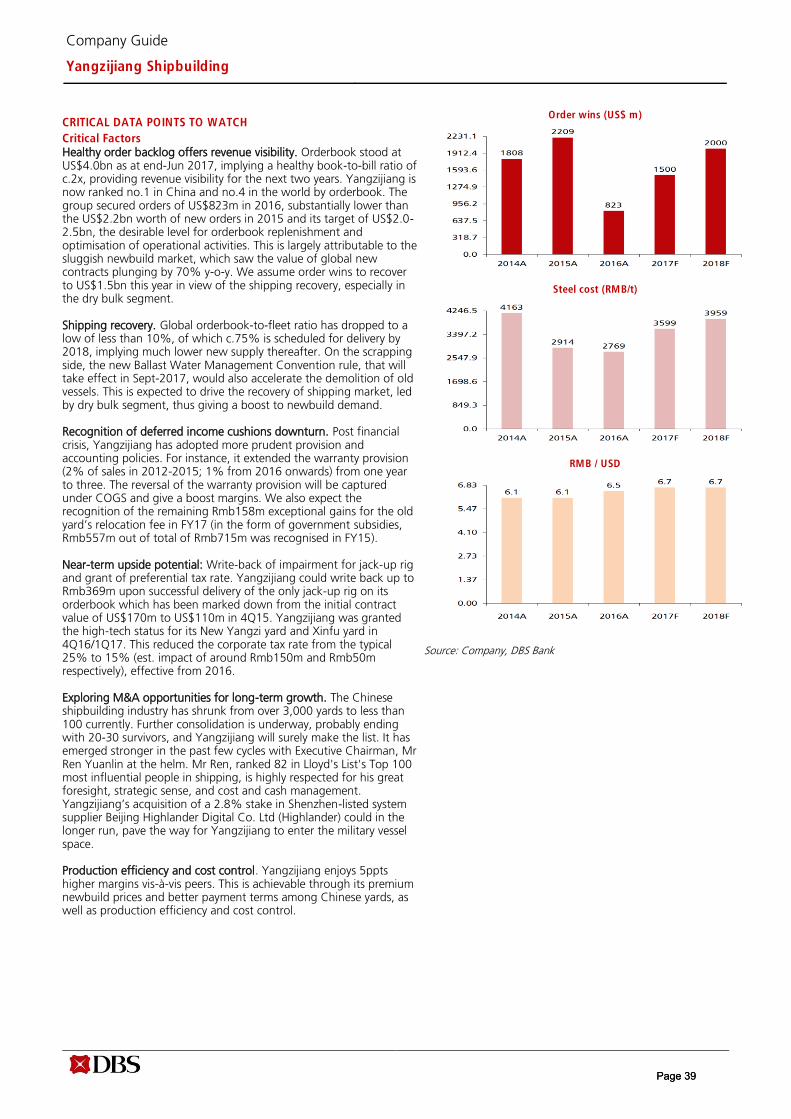
Company Guide
Yangzijiang Shipbuilding
CRITICAL DATA POINTS TO WATCH
Critical Factors Healthy order backlog offers revenue visibility. Orderbook stood at US$4.0bn as at end-Jun 2017, implying a healthy book-to-bill ratio of c.2x, providing revenue visibility for the next two years. Yangzijiang isnow ranked no.1 in China and no.4 in the world by orderbook. The group secured orders of US$823m in 2016, substantially lower than the US$2.2bn worth of new orders in 2015 and its target of US$2.0-2.5bn, the desirable level for orderbook replenishment and optimisation of operational activities. This is largely attributable to the sluggish newbuild market, which saw the value of global new contracts plunging by 70% y-o-y. We assume order wins to recover to US$1.5bn this year in view of the shipping recovery, especially in the dry bulk segment.
Shipping recovery. Global orderbook-to-fleet ratio has dropped to a low of less than 10%, of which c.75% is scheduled for delivery by 2018, implying much lower new supply thereafter. On the scrapping side, the new Ballast Water Management Convention rule, that will take effect in Sept-2017, would also accelerate the demolition of old vessels. This is expected to drive the recovery of shipping market, led by dry bulk segment, thus giving a boost to newbuild demand.
Recognition of deferred income cushions downturn. Post financial crisis, Yangzijiang has adopted more prudent provision and accounting policies. For instance, it extended the warranty provision (2% of sales in 2012-2015; 1% from 2016 onwards) from one year to three. The reversal of the warranty provision will be captured under COGS and give a boost margins. We also expect the recognition of the remaining Rmb158m exceptional gains for the old yard’s relocation fee in FY17 (in the form of government subsidies, Rmb557m out of total of Rmb715m was recognised in FY15).
Near-term upside potential: Write-back of impairment for jack-up rig and grant of preferential tax rate. Yangzijiang could write back up to Rmb369m upon successful delivery of the only jack-up rig on its orderbook which has been marked down from the initial contract value of US$170m to US$110m in 4Q15. Yangzijiang was granted the high-tech status for its New Yangzi yard and Xinfu yard in 4Q16/1Q17. This reduced the corporate tax rate from the typical 25% to 15% (est. impact of around Rmb150m and Rmb50m respectively), effective from 2016.
Exploring M&A opportunities for long-term growth. The Chinese shipbuilding industry has shrunk from over 3,000 yards to less than 100 currently. Further consolidation is underway, probably ending with 20-30 survivors, and Yangzijiang will surely make the list. It has emerged stronger in the past few cycles with Executive Chairman, Mr Ren Yuanlin at the helm. Mr Ren, ranked 82 in Lloyd's List's Top 100 most influential people in shipping, is highly respected for his great foresight, strategic sense, and cost and cash management. Yangzijiang’s acquisition of a 2.8% stake in Shenzhen-listed system supplier Beijing Highlander Digital Co. Ltd (Highlander) could in the longer run, pave the way for Yangzijiang to enter the military vessel space.
Production efficiency and cost control. Yangzijiang enjoys 5ppts higher margins vis-à-vis peers. This is achievable through its premium newbuild prices and better payment terms among Chinese yards, as well as production efficiency and cost control.
Order wins (US$ m)
Steel cost (RMB/t)
RMB / USD
Source: Company, DBS Bank
Page 39Page 39
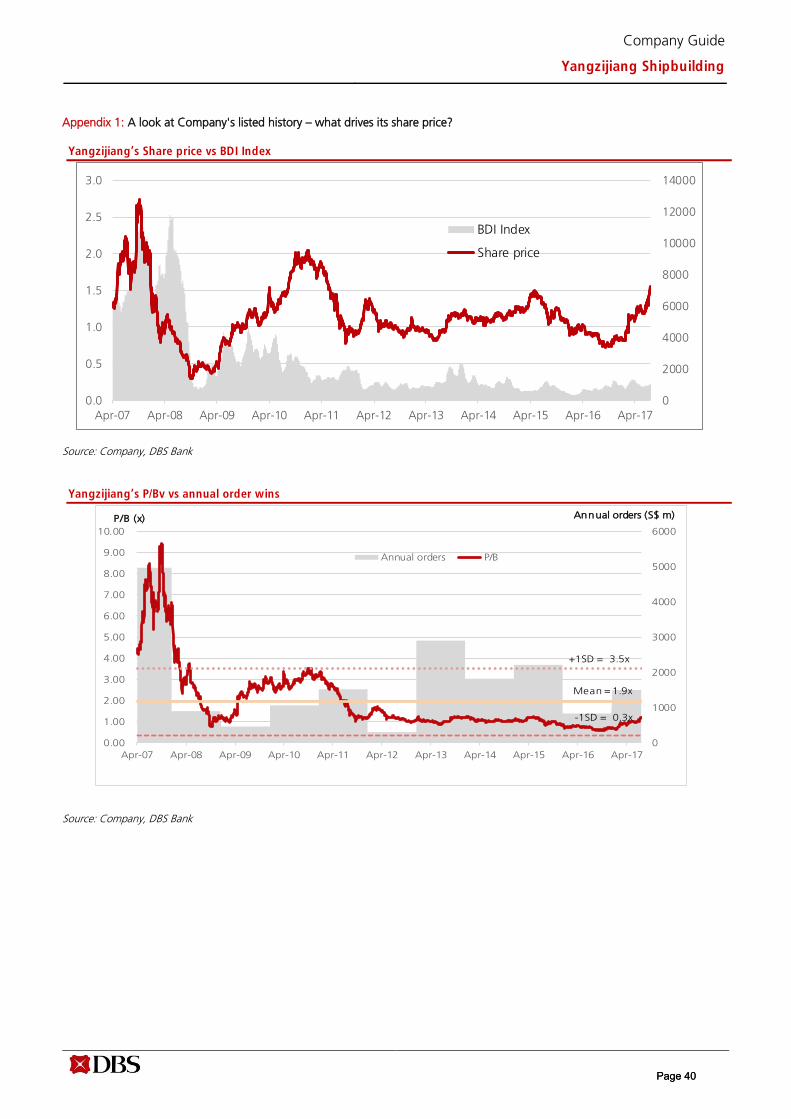
Company Guide
Yangzijiang Shipbuilding
Appendix 1: A look at Company's listed history – what drives its share price?
Yangzijiang’s Share price vs BDI Index
Source: Company, DBS Bank
Yangzijiang’s P/Bv vs annual order wins
Source: Company, DBS Bank
0
1000
2000
3000
4000
5000
6000
0.00
1.00
2.00
3.00
4.00
5.00
6.00
7.00
8.00
9.00
10.00
Apr-07 Apr-08 Apr-09 Apr-10 Apr-11 Apr-12 Apr-13 Apr-14 Apr-15 Apr-16 Apr-17
Annual orders P/B
Mean = 1.9x
-1SD = 0.3x
Annual orders (S$ m)P/B (x)
+1SD = 3.5x
0
2000
4000
6000
8000
10000
12000
14000
0.0
0.5
1.0
1.5
2.0
2.5
3.0
Apr-07 Apr-08 Apr-09 Apr-10 Apr-11 Apr-12 Apr-13 Apr-14 Apr-15 Apr-16 Apr-17
BDI Index
Share price
Page 40Page 40
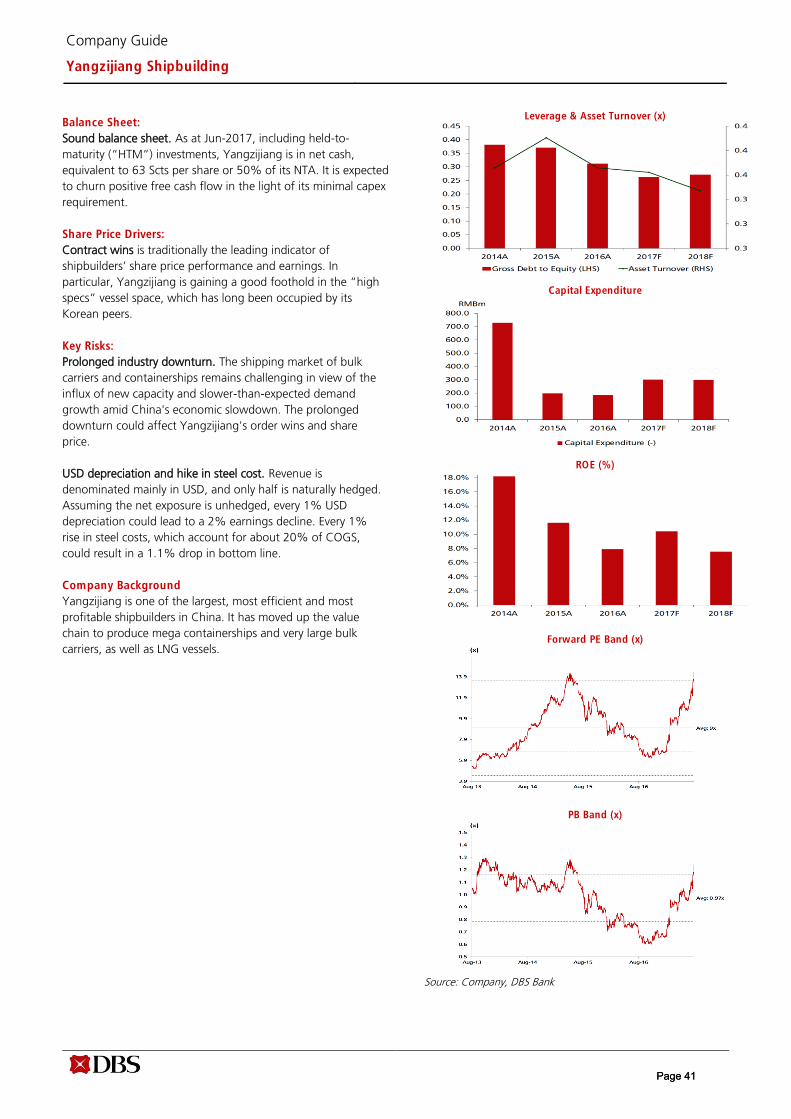
Company Guide
Yangzijiang Shipbuilding
Balance Sheet:
Sound balance sheet. As at Jun-2017, including held-to-
maturity (“HTM”) investments, Yangzijiang is in net cash,
equivalent to 63 Scts per share or 50% of its NTA. It is expected
to churn positive free cash flow in the light of its minimal capex
requirement.
Share Price Drivers:
Contract wins is traditionally the leading indicator of
shipbuilders’ share price performance and earnings. In
particular, Yangzijiang is gaining a good foothold in the “high
specs” vessel space, which has long been occupied by its
Korean peers.
Key Risks:
Prolonged industry downturn. The shipping market of bulk
carriers and containerships remains challenging in view of the
influx of new capacity and slower-than-expected demand
growth amid China's economic slowdown. The prolonged
downturn could affect Yangzijiang's order wins and share
price.
USD depreciation and hike in steel cost. Revenue is
denominated mainly in USD, and only half is naturally hedged.
Assuming the net exposure is unhedged, every 1% USD
depreciation could lead to a 2% earnings decline. Every 1%
rise in steel costs, which account for about 20% of COGS,
could result in a 1.1% drop in bottom line.
Company Background
Yangzijiang is one of the largest, most efficient and most
profitable shipbuilders in China. It has moved up the value
chain to produce mega containerships and very large bulk
carriers, as well as LNG vessels.
Leverage & Asset Turnover (x)
Capital Expenditure
ROE (%)
Forward PE Band (x)
PB Band (x)
Source: Company, DBS Bank
Page 41Page 41
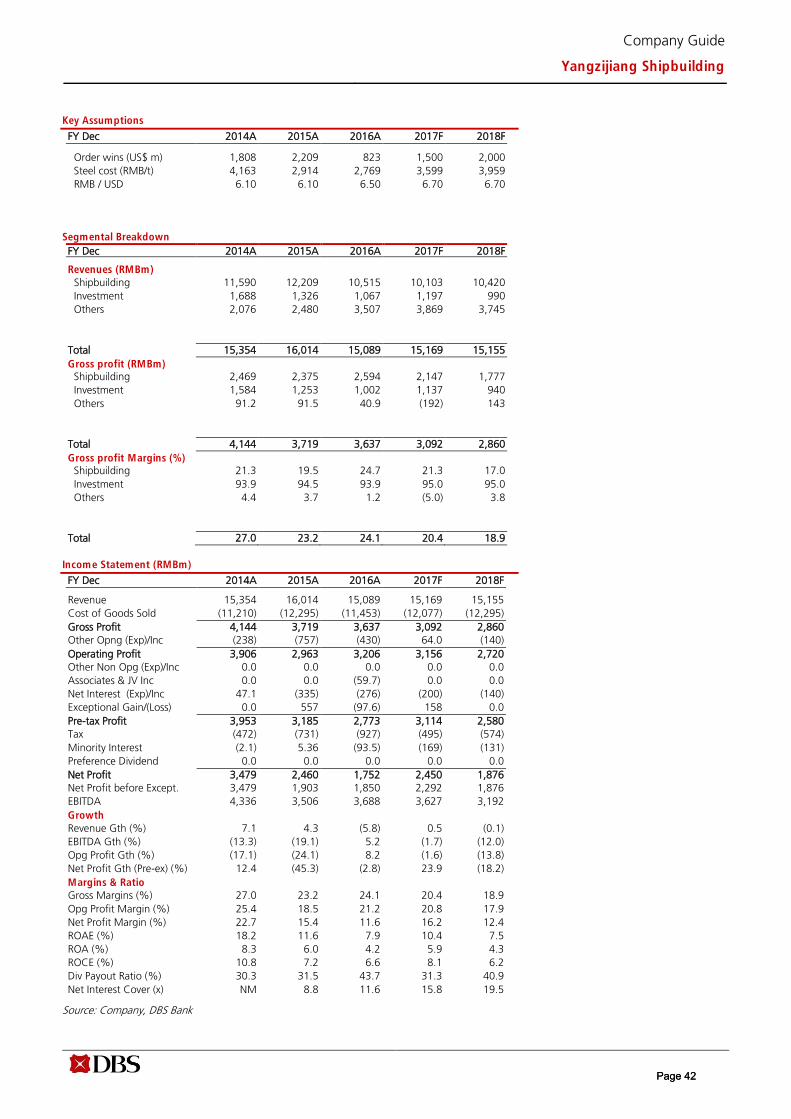
Company Guide
Yangzijiang Shipbuilding
Key Assumptions
FY Dec 2014A 2015A 2016A 2017F 2018F
Order wins (US$ m) 1,808 2,209 823 1,500 2,000
Steel cost (RMB/t) 4,163 2,914 2,769 3,599 3,959
RMB / USD 6.10 6.10 6.50 6.70 6.70
Segmental Breakdown
FY Dec 2014A 2015A 2016A 2017F 2018F
Revenues (RMBm)
Shipbuilding 11,590 12,209 10,515 10,103 10,420
Investment 1,688 1,326 1,067 1,197 990
Others 2,076 2,480 3,507 3,869 3,745
Total 15,354 16,014 15,089 15,169 15,155
Gross profit (RMBm) Shipbuilding 2,469 2,375 2,594 2,147 1,777
Investment 1,584 1,253 1,002 1,137 940
Others 91.2 91.5 40.9 (192) 143
Total 4,144 3,719 3,637 3,092 2,860
Gross profit Margins (%) Shipbuilding 21.3 19.5 24.7 21.3 17.0
Investment 93.9 94.5 93.9 95.0 95.0
Others 4.4 3.7 1.2 (5.0) 3.8
Total 27.0 23.2 24.1 20.4 18.9
Income Statement (RMBm)
FY Dec 2014A 2015A 2016A 2017F 2018F
Revenue 15,354 16,014 15,089 15,169 15,155
Cost of Goods Sold (11,210) (12,295) (11,453) (12,077) (12,295)
Gross Profit 4,144 3,719 3,637 3,092 2,860
Other Opng (Exp)/Inc (238) (757) (430) 64.0 (140)
Operating Profit 3,906 2,963 3,206 3,156 2,720
Other Non Opg (Exp)/Inc 0.0 0.0 0.0 0.0 0.0
Associates & JV Inc 0.0 0.0 (59.7) 0.0 0.0
Net Interest (Exp)/Inc 47.1 (335) (276) (200) (140)
Exceptional Gain/(Loss) 0.0 557 (97.6) 158 0.0
Pre-tax Profit 3,953 3,185 2,773 3,114 2,580
Tax (472) (731) (927) (495) (574)
Minority Interest (2.1) 5.36 (93.5) (169) (131)
Preference Dividend 0.0 0.0 0.0 0.0 0.0
Net Profit 3,479 2,460 1,752 2,450 1,876
Net Profit before Except. 3,479 1,903 1,850 2,292 1,876
EBITDA 4,336 3,506 3,688 3,627 3,192
Growth
Revenue Gth (%) 7.1 4.3 (5.8) 0.5 (0.1)
EBITDA Gth (%) (13.3) (19.1) 5.2 (1.7) (12.0)
Opg Profit Gth (%) (17.1) (24.1) 8.2 (1.6) (13.8)
Net Profit Gth (Pre-ex) (%) 12.4 (45.3) (2.8) 23.9 (18.2)
Margins & Ratio
Gross Margins (%) 27.0 23.2 24.1 20.4 18.9
Opg Profit Margin (%) 25.4 18.5 21.2 20.8 17.9
Net Profit Margin (%) 22.7 15.4 11.6 16.2 12.4
ROAE (%) 18.2 11.6 7.9 10.4 7.5
ROA (%) 8.3 6.0 4.2 5.9 4.3
ROCE (%) 10.8 7.2 6.6 8.1 6.2
Div Payout Ratio (%) 30.3 31.5 43.7 31.3 40.9
Net Interest Cover (x) NM 8.8 11.6 15.8 19.5
Source: Company, DBS Bank
Page 42Page 42
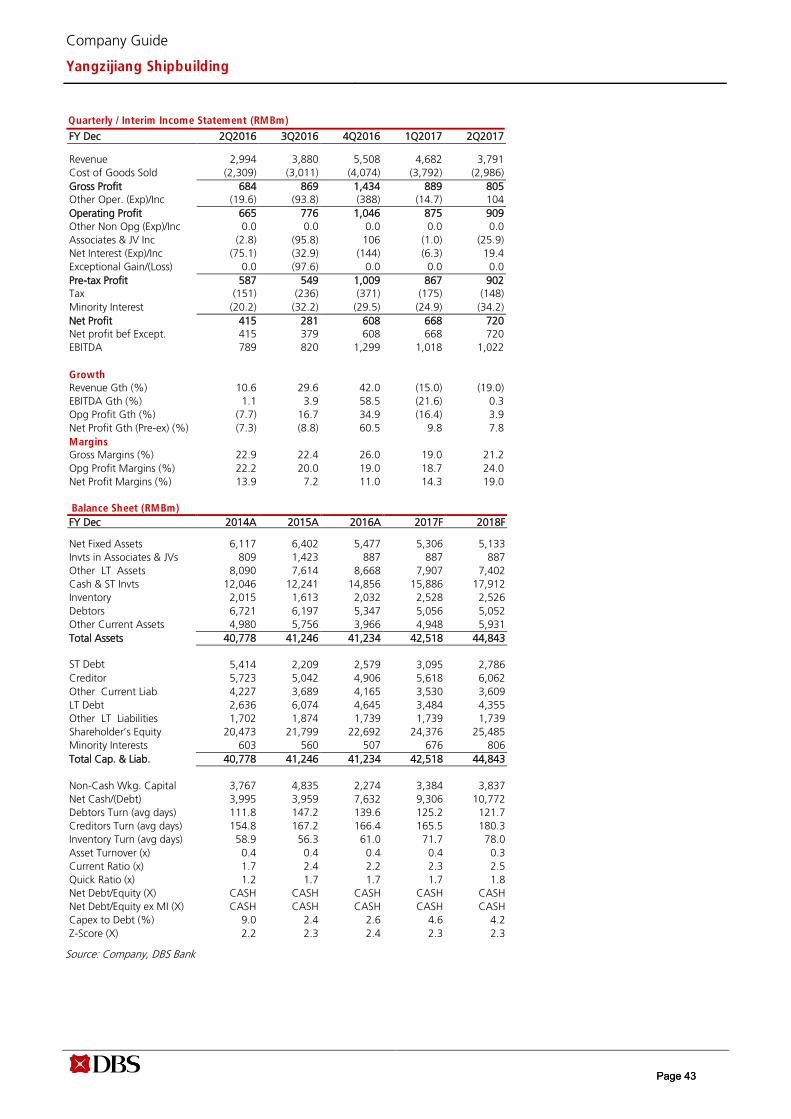
Company Guide
Yangzijiang Shipbuilding
Quarterly / Interim Income Statement (RMBm)
FY Dec 2Q2016 3Q2016 4Q2016 1Q2017 2Q2017
Revenue 2,994 3,880 5,508 4,682 3,791
Cost of Goods Sold (2,309) (3,011) (4,074) (3,792) (2,986)
Gross Profit 684 869 1,434 889 805
Other Oper. (Exp)/Inc (19.6) (93.8) (388) (14.7) 104
Operating Profit 665 776 1,046 875 909
Other Non Opg (Exp)/Inc 0.0 0.0 0.0 0.0 0.0
Associates & JV Inc (2.8) (95.8) 106 (1.0) (25.9)
Net Interest (Exp)/Inc (75.1) (32.9) (144) (6.3) 19.4
Exceptional Gain/(Loss) 0.0 (97.6) 0.0 0.0 0.0
Pre-tax Profit 587 549 1,009 867 902
Tax (151) (236) (371) (175) (148)
Minority Interest (20.2) (32.2) (29.5) (24.9) (34.2)
Net Profit 415 281 608 668 720
Net profit bef Except. 415 379 608 668 720
EBITDA 789 820 1,299 1,018 1,022
Growth
Revenue Gth (%) 10.6 29.6 42.0 (15.0) (19.0)
EBITDA Gth (%) 1.1 3.9 58.5 (21.6) 0.3
Opg Profit Gth (%) (7.7) 16.7 34.9 (16.4) 3.9
Net Profit Gth (Pre-ex) (%) (7.3) (8.8) 60.5 9.8 7.8
Margins
Gross Margins (%) 22.9 22.4 26.0 19.0 21.2
Opg Profit Margins (%) 22.2 20.0 19.0 18.7 24.0
Net Profit Margins (%) 13.9 7.2 11.0 14.3 19.0
Balance Sheet (RMBm)
FY Dec 2014A 2015A 2016A 2017F 2018F
Net Fixed Assets 6,117 6,402 5,477 5,306 5,133
Invts in Associates & JVs 809 1,423 887 887 887
Other LT Assets 8,090 7,614 8,668 7,907 7,402
Cash & ST Invts 12,046 12,241 14,856 15,886 17,912
Inventory 2,015 1,613 2,032 2,528 2,526
Debtors 6,721 6,197 5,347 5,056 5,052
Other Current Assets 4,980 5,756 3,966 4,948 5,931
Total Assets 40,778 41,246 41,234 42,518 44,843
ST Debt 5,414 2,209 2,579 3,095 2,786
Creditor 5,723 5,042 4,906 5,618 6,062
Other Current Liab 4,227 3,689 4,165 3,530 3,609
LT Debt 2,636 6,074 4,645 3,484 4,355
Other LT Liabilities 1,702 1,874 1,739 1,739 1,739
Shareholder’s Equity 20,473 21,799 22,692 24,376 25,485
Minority Interests 603 560 507 676 806
Total Cap. & Liab. 40,778 41,246 41,234 42,518 44,843
Non-Cash Wkg. Capital 3,767 4,835 2,274 3,384 3,837
Net Cash/(Debt) 3,995 3,959 7,632 9,306 10,772
Debtors Turn (avg days) 111.8 147.2 139.6 125.2 121.7
Creditors Turn (avg days) 154.8 167.2 166.4 165.5 180.3
Inventory Turn (avg days) 58.9 56.3 61.0 71.7 78.0
Asset Turnover (x) 0.4 0.4 0.4 0.4 0.3
Current Ratio (x) 1.7 2.4 2.2 2.3 2.5
Quick Ratio (x) 1.2 1.7 1.7 1.7 1.8
Net Debt/Equity (X) CASH CASH CASH CASH CASH
Net Debt/Equity ex MI (X) CASH CASH CASH CASH CASH
Capex to Debt (%) 9.0 2.4 2.6 4.6 4.2
Z-Score (X) 2.2 2.3 2.4 2.3 2.3
Source: Company, DBS Bank
Page 43Page 43
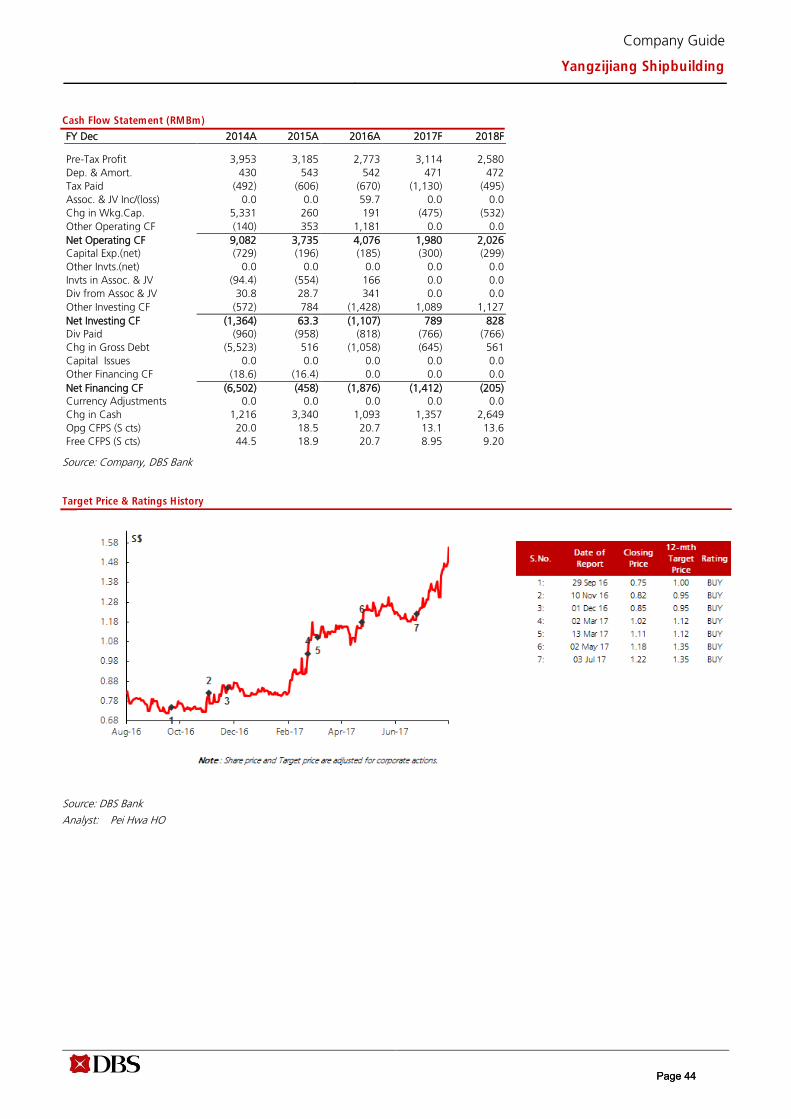
Company Guide
Yangzijiang Shipbuilding
Cash Flow Statement (RMBm)
FY Dec 2014A 2015A 2016A 2017F 2018F
Pre-Tax Profit 3,953 3,185 2,773 3,114 2,580
Dep. & Amort. 430 543 542 471 472
Tax Paid (492) (606) (670) (1,130) (495)
Assoc. & JV Inc/(loss) 0.0 0.0 59.7 0.0 0.0
Chg in Wkg.Cap. 5,331 260 191 (475) (532)
Other Operating CF (140) 353 1,181 0.0 0.0
Net Operating CF 9,082 3,735 4,076 1,980 2,026
Capital Exp.(net) (729) (196) (185) (300) (299)
Other Invts.(net) 0.0 0.0 0.0 0.0 0.0
Invts in Assoc. & JV (94.4) (554) 166 0.0 0.0
Div from Assoc & JV 30.8 28.7 341 0.0 0.0
Other Investing CF (572) 784 (1,428) 1,089 1,127
Net Investing CF (1,364) 63.3 (1,107) 789 828
Div Paid (960) (958) (818) (766) (766)
Chg in Gross Debt (5,523) 516 (1,058) (645) 561
Capital Issues 0.0 0.0 0.0 0.0 0.0
Other Financing CF (18.6) (16.4) 0.0 0.0 0.0
Net Financing CF (6,502) (458) (1,876) (1,412) (205)
Currency Adjustments 0.0 0.0 0.0 0.0 0.0
Chg in Cash 1,216 3,340 1,093 1,357 2,649
Opg CFPS (S cts) 20.0 18.5 20.7 13.1 13.6
Free CFPS (S cts) 44.5 18.9 20.7 8.95 9.20
Source: Company, DBS Bank
Target Price & Ratings History
Source: DBS Bank
Analyst: Pei Hwa HO
Page 44Page 44

Industry Focus
Singapore Rigbuilders
DBS Bank recommendations are based an Absolute Total Return* Rating system, defined as follows:
STRONG BUY (>20% total return over the next 3 months, with identifiable share price catalysts within this time frame)
BUY (>15% total return over the next 12 months for small caps, >10% for large caps)
HOLD (-10% to +15% total return over the next 12 months for small caps, -10% to +10% for large caps)
FULLY VALUED (negative total return i.e. > -10% over the next 12 months)
SELL (negative total return of > -20% over the next 3 months, with identifiable catalysts within this time frame)
Share price appreciation + dividends
Completed Date: 20 Sep 2017 07:24:18 (SGT) Dissemination Date: 20 Sep 2017 08:16:43 (SGT)
Sources for all charts and tables are DBS Bank unless otherwise specified.
GENERAL DISCLOSURE/DISCLAIMER
This report is prepared by DBS Bank Ltd. This report is solely intended for the clients of DBS Bank Ltd, its respective connected and associated
corporations and affiliates only and no part of this document may be (i) copied, photocopied or duplicated in any form or by any means or (ii)
redistributed without the prior written consent of DBS Bank Ltd.
The research set out in this report is based on information obtained from sources believed to be reliable, but we (which collectively refers to DBS
Bank Ltd, its respective connected and associated corporations, affiliates and their respective directors, officers, employees and agents (collectively,
the “DBS Group”) have not conducted due diligence on any of the companies, verified any information or sources or taken into account any other
factors which we may consider to be relevant or appropriate in preparing the research. Accordingly, we do not make any representation or
warranty as to the accuracy, completeness or correctness of the research set out in this report. Opinions expressed are subject to change without
notice. This research is prepared for general circulation. Any recommendation contained in this document does not have regard to the specific
investment objectives, financial situation and the particular needs of any specific addressee. This document is for the information of addressees
only and is not to be taken in substitution for the exercise of judgement by addressees, who should obtain separate independent legal or financial
advice. The DBS Group accepts no liability whatsoever for any direct, indirect and/or consequential loss (including any claims for loss of profit)
arising from any use of and/or reliance upon this document and/or further communication given in relation to this document. This document is not
to be construed as an offer or a solicitation of an offer to buy or sell any securities. The DBS Group, along with its affiliates and/or persons
associated with any of them may from time to time have interests in the securities mentioned in this document. The DBS Group, may have
positions in, and may effect transactions in securities mentioned herein and may also perform or seek to perform broking, investment banking and
other banking services for these companies.
Any valuations, opinions, estimates, forecasts, ratings or risk assessments herein constitutes a judgment as of the date of this report, and there can
be no assurance that future results or events will be consistent with any such valuations, opinions, estimates, forecasts, ratings or risk assessments.
The information in this document is subject to change without notice, its accuracy is not guaranteed, it may be incomplete or condensed, it may
not contain all material information concerning the company (or companies) referred to in this report and the DBS Group is under no obligation to
update the information in this report.
This publication has not been reviewed or authorized by any regulatory authority in Singapore, Hong Kong or elsewhere. There is no planned
schedule or frequency for updating research publication relating to any issuer.
The valuations, opinions, estimates, forecasts, ratings or risk assessments described in this report were based upon a number of estimates and
assumptions and are inherently subject to significant uncertainties and contingencies. It can be expected that one or more of the estimates on
which the valuations, opinions, estimates, forecasts, ratings or risk assessments were based will not materialize or will vary significantly from actual
results. Therefore, the inclusion of the valuations, opinions, estimates, forecasts, ratings or risk assessments described herein IS NOT TO BE RELIED
UPON as a representation and/or warranty by the DBS Group (and/or any persons associated with the aforesaid entities), that:
(a) such valuations, opinions, estimates, forecasts, ratings or risk assessments or their underlying assumptions will be achieved, and
(b) there is any assurance that future results or events will be consistent with any such valuations, opinions, estimates, forecasts, ratings or risk
assessments stated therein.
Please contact the primary analyst for valuation methodologies and assumptions associated with the covered companies or price targets.
Any assumptions made in this report that refers to commodities, are for the purposes of making forecasts for the company (or companies)
mentioned herein. They are not to be construed as recommendations to trade in the physical commodity or in the futures contract relating to the
commodity referred to in this report.
Page 45
Industry Focus
Singapore Rigbuilders
DBSVUSA, a US-registered broker-dealer, does not have its own investment banking or research department, has not participated in any public
offering of securities as a manager or co-manager or in any other investment banking transaction in the past twelve months and does not engage
in market-making.
ANALYST CERTIFICATION
The research analyst(s) primarily responsible for the content of this research report, in part or in whole, certifies that the views about the
companies and their securities expressed in this report accurately reflect his/her personal views. The analyst(s) also certifies that no part of his/her
compensation was, is, or will be, directly or indirectly, related to specific recommendations or views expressed in the report. The research analyst (s)
primarily responsible for the content of this research report, in part or in whole, certifies that he or his associate1 does not serve as an officer of the
issuer or the new listing applicant (which includes in the case of a real estate investment trust, an officer of the management company of the real
estate investment trust; and in the case of any other entity, an officer or its equivalent counterparty of the entity who is responsible for the
management of the issuer or the new listing applicant) and the research analyst(s) primarily responsible for the content of this research report or
his associate does not have financial interests2 in relation to an issuer or a new listing applicant that the analyst reviews. DBS Group has
procedures in place to eliminate, avoid and manage any potential conflicts of interests that may arise in connection with the production of
research reports. The research analyst(s) responsible for this report operates as part of a separate and independent team to the investment
banking function of the DBS Group and procedures are in place to ensure that confidential information held by either the research or investment
banking function is handled appropriately. There is no direct link of DBS Group's compensation to any specific investment banking function of the
DBS Group.
COMPANY-SPECIFIC / REGULATORY DISCLOSURES 1. DBS Bank Ltd, DBS HK, DBS Vickers Securities (Singapore) Pte Ltd (''DBSVS''), DBSV HK or their subsidiaries and/or other affiliates have a
proprietary position in Keppel Corporation, Sembcorp Marine, Sembcorp Industries, Yangzijiang Shipbuilding, recommended in this report as
of 31 Aug 2017.
2. Neither DBS Bank Ltd, DBS HK nor DBSV HK market makes in equity securities of the issuer(s) or company(ies) mentioned in this Research
Report.
Compensation for investment banking services: 3. DBS Bank Ltd, DBS HK, DBSVS, DBSV HK, their subsidiaries and/or other affiliates of DBSVUSA have received compensation, within the past
12 months for investment banking services from Sembcorp Industries as of 31 Aug 2017. 4. 5.DBS Bank Ltd, DBS HK, DBSVS, their subsidiaries and/or other affiliates of DBSVUSA have managed or co-managed a public offering of
securities for from Sembcorp Industries as of 31 Aug 2017.
5. DBSVUSA does not have its own investment banking or research department, nor has it participated in any public offering of securities as a
manager or co-manager or in any other investment banking transaction in the past twelve months. Any US persons wishing to obtain further
information, including any clarification on disclosures in this disclaimer, or to effect a transaction in any security discussed in this document
should contact DBSVUSA exclusively.
Directorship/trustee interests:
6. Danny Teoh Leong Kay, a member of DBS Group Holdings Board of Directors, is a Director of Keppel Corporation as of 30 Jun 2017.
Disclosure of previous investment recommendation produced:
7. DBS Bank Ltd, DBS Vickers Securities (Singapore) Pte Ltd (''DBSVS''), their subsidiaries and/or other affiliates may have published other
investment recommendations in respect of the same securities / instruments recommended in this research report during the preceding 12
months. Please contact the primary analyst listed in the first page of this report to view previous investment recommendations published by
DBS Bank Ltd, DBS Vickers Securities (Singapore) Pte Ltd (''DBSVS''), their subsidiaries and/or other affiliates in the preceding 12 months.
1 An associate is defined as (i) the spouse, or any minor child (natural or adopted) or minor step-child, of the analyst; (ii) the trustee of a trust of which the analyst, his spouse, minor child (natural or adopted) or minor step-child, is a beneficiary or discretionary object; or (iii) another person accustomed or obliged to act in accordance with the directions or instructions of the analyst.
2 Financial interest is defined as interests that are commonly known financial interest, such as investment in the securities in respect of an issuer or a new listing applicant, or financial accommodation arrangement between the issuer or the new listing applicant and the firm or analysis. This term does not include commercial lending conducted at arm's length, or investments in any collective investment scheme other than an issuer or new listing applicant notwithstanding the fact that the scheme has investments in securities in respect of an issuer or a new listing applicant.
Page 46
Industry Focus
Singapore Rigbuilders
RESTRICTIONS ON DISTRIBUTION
General This report is not directed to, or intended for distribution to or use by, any person or entity who is a citizen or resident of or located in any locality, state, country or other jurisdiction where such distribution, publication, availability or use would be contrary to law or regulation.
Australia This report is being distributed in Australia by DBS Bank Ltd. (“DBS”) or DBS Vickers Securities (Singapore) Pte Ltd (“DBSVS”). DBS holds Australian Financial Services Licence no. 475946.
DBSVS is exempted from the requirement to hold an Australian Financial Services Licence under the Corporation Act 2001 (“CA”) in respect of financial services provided to the recipients. DBSVS is regulated by the Monetary Authority of Singapore under the laws of Singapore, which differ from Australian laws.
Distribution of this report is intended only for “wholesale investors” within the meaning of the CA.
Hong Kong This report has been prepared by a person(s) who is not licensed by the Hong Kong Securities and Futures Commission to carry on the regulated activity of advising on securities in Hong Kong pursuant to the Securities and Futures Ordinance (Chapter 571 of the Laws of Hong Kong). This report is being distributed in Hong Kong and is attributable to DBS Vickers Hong Kong Limited, a licensed corporation licensed by the Hong Kong Securities and Futures Commission to carry on the regulated activity of advising on securities pursuant to the Securities and Futures Ordinance (Chapter 571 of the Laws of Hong Kong).
For any query regarding the materials herein, please contact Paul Yong (CE. No. ASE988) at [email protected].
Indonesia This report is being distributed in Indonesia by PT DBS Vickers Sekuritas Indonesia.
Malaysia This report is distributed in Malaysia by AllianceDBS Research Sdn Bhd ("ADBSR"). Recipients of this report, received from ADBSR are to contact the undersigned at 603-2604 3333 in respect of any matters arising from or in connection with this report. In addition to the General Disclosure/Disclaimer found at the preceding page, recipients of this report are advised that ADBSR (the preparer of this report), its holding company Alliance Investment Bank Berhad, their respective connected and associated corporations, affiliates, their directors, officers, employees, agents and parties related or associated with any of them may have positions in, and may effect transactions in the securities mentioned herein and may also perform or seek to perform broking, investment banking/corporate advisory and other services for the subject companies. They may also have received compensation and/or seek to obtain compensation for broking, investment banking/corporate advisory and other services from the subject companies.
Wong Ming Tek, Executive Director, ADBSR
Singapore This report is distributed in Singapore by DBS Bank Ltd (Company Regn. No. 196800306E) or DBSVS (Company Regn No. 198600294G), both of which are Exempt Financial Advisers as defined in the Financial Advisers Act and regulated by the Monetary Authority of Singapore. DBS Bank Ltd and/or DBSVS, may distribute reports produced by its respective foreign entities, affiliates or other foreign research houses pursuant to an arrangement under Regulation 32C of the Financial Advisers Regulations. Where the report is distributed in Singapore to a person who is not an Accredited Investor, Expert Investor or an Institutional Investor, DBS Bank Ltd accepts legal responsibility for the contents of the report to such persons only to the extent required by law. Singapore recipients should contact DBS Bank Ltd at 6327 2288 for matters arising from, or in connection with the report.
Thailand This report is being distributed in Thailand by DBS Vickers Securities (Thailand) Co Ltd. Research reports distributed are only intended for institutional clients only and no other person may act upon it.
Page 47
Industry Focus
Singapore Rigbuilders
United Kingdom
This report is produced by DBS Bank Ltd which is regulated by the Monetary Authority of Singapore.
This report is disseminated in the United Kingdom by DBS Vickers Securities (UK) Ltd, ("DBSVUK"). DBSVUK is authorised and regulated by the Financial Conduct Authority in the United Kingdom.
In respect of the United Kingdom, this report is solely intended for the clients of DBSVUK, its respective connected and associated corporations and affiliates only and no part of this document may be (i) copied, photocopied or duplicated in any form or by any means or (ii) redistributed without the prior written consent of DBSVUK. This communication is directed at persons having professional experience in matters relating to investments. Any investment activity following from this communication will only be engaged in with such persons. Persons who do not have professional experience in matters relating to investments should not rely on this communication.
Dubai International Financial Centre
This research report is being distributed by DBS Bank Ltd., (DIFC Branch) having its office at PO Box 506538, 3rd Floor, Building 3, East Wing, Gate Precinct, Dubai International Financial Centre (DIFC), Dubai, United Arab Emirates. DBS Bank Ltd., (DIFC Branch) is regulated by The Dubai Financial Services Authority. This research report is intended only for professional clients (as defined in the DFSA rulebook) and no other person may act upon it.
United Arab Emirates
This report is provided by DBS Bank Ltd (Company Regn. No. 196800306E) which is an Exempt Financial Adviser as defined in the Financial Advisers Act and regulated by the Monetary Authority of Singapore. This report is for information purposes only and should not be relied upon or acted on by the recipient or considered as a solicitation or inducement to buy or sell any financial product. It does not constitute a personal recommendation or take into account the particular investment objectives, financial situation, or needs of individual clients. You should contact your relationship manager or investment adviser if you need advice on the merits of buying, selling or holding a particular investment. You should note that the information in this report may be out of date and it is not represented or warranted to be accurate, timely or complete. This report or any portion thereof may not be reprinted, sold or redistributed without our written consent.
United States This report was prepared by DBS Bank Ltd. DBSVUSA did not participate in its preparation. The research analyst(s) named on this report are not registered as research analysts with FINRA and are not associated persons of DBSVUSA. The research analyst(s) are not subject to FINRA Rule 2241 restrictions on analyst compensation, communications with a subject company, public appearances and trading securities held by a research analyst. This report is being distributed in the United States by DBSVUSA, which accepts responsibility for its contents. This report may only be distributed to Major U.S. Institutional Investors (as defined in SEC Rule 15a-6) and to such other institutional investors and qualified persons as DBSVUSA may authorize. Any U.S. person receiving this report who wishes to effect transactions in any securities referred to herein should contact DBSVUSA directly and not its affiliate.
Other jurisdictions
In any other jurisdictions, except if otherwise restricted by laws or regulations, this report is intended only for qualified, professional, institutional or sophisticated investors as defined in the laws and regulations of such jurisdictions.
Page 48
Industry Focus
Singapore Rigbuilders
DBS Regional Research Offices
HONG KONG DBS Vickers (Hong Kong) Ltd Contact: Paul Yong 18th Floor Man Yee Building 68 Des Voeux Road Central Central, Hong Kong Tel: 65 6878 8888 Fax: 65 65353 418 e-mail: [email protected] Participant of the Stock Exchange of Hong Kong
MALAYSIA AllianceDBS Research Sdn Bhd Contact: Wong Ming Tek (128540 U) 19th Floor, Menara Multi-Purpose, Capital Square, 8 Jalan Munshi Abdullah 50100 Kuala Lumpur, Malaysia. Tel.: 603 2604 3333 Fax: 603 2604 3921 e-mail: [email protected]
SINGAPORE DBS Bank Ltd Contact: Janice Chua 12 Marina Boulevard, Marina Bay Financial Centre Tower 3 Singapore 018982 Tel: 65 6878 8888 Fax: 65 65353 418 e-mail: [email protected] Company Regn. No. 196800306E
INDONESIA PT DBS Vickers Sekuritas (Indonesia) Contact: Maynard Priajaya Arif DBS Bank Tower Ciputra World 1, 32/F Jl. Prof. Dr. Satrio Kav. 3-5 Jakarta 12940, Indonesia Tel: 62 21 3003 4900 Fax: 6221 3003 4943 e-mail: [email protected]
THAILAND DBS Vickers Securities (Thailand) Co Ltd Contact: Chanpen Sirithanarattanakul 989 Siam Piwat Tower Building, 9th, 14th-15th Floor Rama 1 Road, Pathumwan, Bangkok Thailand 10330 Tel. 66 2 657 7831 Fax: 66 2 658 1269 e-mail: [email protected] Company Regn. No 0105539127012 Securities and Exchange Commission, Thailand
Page 49