China Merchants Bank - DBS
18
ed-TH / sa- AH H: BUY Last Traded Price (H) ( 21 Aug 2017): HK$25.80 (HSI : 27,155) Price Target 12-mth (H): HK$30.00 (16% upside) (Prev HK$27.00) A: BUY Last Traded Price (A) ( 21 Aug 2017): RMB25.30 ( CSI300 Index : 3,741) Price Target 12-mth (A): RMB27.60 (9% upside) (Prev RMB24.90) Analyst Ken SHIH +852 2820 4920 [email protected] Keith TSANG CFA, +852 2971 1935 [email protected] What’s New • 1H17 profit rose 11.4% y-o-y driven mainly by fewer provisioning, stabilized NIM and better efficiency • Better corporate loan demand seen with strong credit card/settlement service growth and outlook • Asset quality reaffirmed of reaching reflection point. Fewer credit cost expected going forward • Revise up earnings by 2-4% y-o-y in FY17F-19F, and raise target price to HK$30. Reiterate BUY Price Relative Forecasts and Valuation (H Shares) FY Dec (RMB m) 2016A 2017F 2018F 2019F Pre-prov. Profit 144,801 161,194 189,023 223,613 Pre-prov. Profit Gth (%) 8 11 17 18 Pretax Profit 78,963 91,541 107,162 126,707 Net Profit 62,081 71,516 81,619 96,888 EPS (RMB) 2.46 2.84 3.24 3.84 EPS (HK$) 2.86 3.23 3.69 4.38 EPS Gth (%) 8 15 14 19 PE (X) 9.0 8.0 7.0 5.9 DPS (HK$) 0.86 0.97 1.11 1.32 Div Yield (%) 3.3 3.8 4.3 5.1 BV Per Share (HK$) 18.51 20.58 23.39 26.66 P/Book Value (x) 1.4 1.3 1.1 1.0 ROAE (%) 16.3 16.7 16.8 17.5 ROAE (ex-exceptional (%) 16.3 16.7 16.8 17.5 ROA (%) 1.09 1.15 1.19 1.27 Earnings Rev (%): 2.0 2.4 New Consensus EPS (RMB) 2.73 2.98 Other Broker Recs: B: 12 S: 3 H: 10 Source of all data on this page: Company, DBSV, Thomson Reuters, HKEX Earnings growth re-accelerating 1H17 profit rose 11.4% y-o-y, ahead of consensus forecast: CMB posted 1H17 profit of Rmb39bn, +11.4% y-o-y, making up 56%/58% of ours/consensus FY17F forecasts. The better-than-expected result was mainly driven by fewer provisioning expenses backed by lower new NPL formation of 0.54 % (versus 1.63% in 2016), stabilised NIM of 2.43% (+1bp q-o-q), and better operating efficiency with cost-to-income ratio at 27%. Although fee income fell 8% y-o-y given the contraction in WMP sales (down 10% y-o-y), the positive is sufficient to outweigh the negative. Better loan demand with strong credit card prospects Stronger corporate loan demand was seen during 1H17, which increased 7.5% h-o-h as CMB stepped up support to its strategically important clients. Its credit card business continued to surge, with credit card interest income and fee income up 22%/29% y-o-y respectively. As at 1H17, interest income/fee income from credit card accounted for 16%/18% of total gross income/fee income, and we expect the contribution to continue to rise. Asset quality remained benign at the 1.26% level. Growth prospect in settlement service fee is also bright. Asset quality reflection point affirmed One of the main spotlights of CMB’s 1H17 results was the improvement in its asset quality, where NPL ratio was at 1.71% (down 17bps/5bps y-o-y/q- o-q), thanks to the substantial decline in the bank’s new NPL formation. SML ratio declined by 37bps to 1.72%. We believe the main reason for such improvement includes 1. Continuous scale down in risky sector exposure, 2. Refocus on strategically important clients, and 3. Rising retail loan contribution. Management also provided a positive outlook by confirming that its asset quality reflection point has been reached. Raise target price to HK$30. Reiterate BUY We revise up earnings by 2-4% for FY17F-19F, to factor in lower credit cost, improving cost control and better loan demand. We raise our target price to HK$30/Rmb27.6 (from HK$27/Rmb24.9), which implies 1.3x FY18F PB. With 16% share price upside, we reiterate our BUY call on CMB. Valuation: Our TP of HK$30/Rmb27.6 is based on DDM method, where we apply 13.1% cost of equity and 5% terminal growth, and raised our ROE assumption to 13% (from 12.5%) given the better earnings outlook. The target price implies 1.3 x FY18F P/BV, in line with the upper- to mid-end of its past 5-year trading band. Key Risks to Our View: Deterioration in credit card asset quality, slowdown in China's economy, increasingly tighter measures on WMP products. At A Glance Issued Capital - H shares (m shs) 4,591 - Non H shares (m shs) 20,629 H shs as a % of Total 18 Total Mkt. Cap (HK$m/US$m) 730,625 / 93,388 Major Shareholders China Merchants Group (%) 26.8 Anbang Property & Casualty Insurance (%) 10.7 COSCO Group (%) 6.2 Major H Shareholders (%) China Merchants Group Ltd. (%) 17.6 Best Winner Investment Limited (%) 7.2 JPMorgan Chase & Co. (%) 6.0 H Shares-Free Float (%) 69.3 3m Avg. Daily Val. (US$m) 79.6 ICB Industry : Financials 80 100 120 140 160 180 200 220 11.0 13.0 15.0 17.0 19.0 21.0 23.0 25.0 27.0 29.0 Aug-13 Aug-14 Aug-15 Aug-16 Aug-17 Relative Index HK$ China Merchants Bank (LHS) Relative HSI (RHS) 69 89 109 129 149 169 189 209 8.5 13.5 18.5 23.5 28.5 Aug-13 Aug-14 Aug-15 Aug-16 Aug-17 Relative Index RMB China Merchants Bank-A (LHS) Relative CSI300 Index (RHS) DBS Group Research . Equity 21 Aug 2017 China / Hong Kong Company Guide China Merchants Bank Version 2 | Bloomberg: 3968 HK EQUITY | 600036 CH Equity | Reuters: 3968.HK | 600036.SS Refer to important disclosures at the end of this report
-
Upload
khangminh22 -
Category
Documents
-
view
0 -
download
0
Transcript of China Merchants Bank - DBS

ed-TH / sa- AH
H: BUY Last Traded Price (H) ( 21 Aug 2017): HK$25.80 (HSI : 27,155) Price Target 12-mth (H): HK$30.00 (16% upside) (Prev HK$27.00)
A: BUY
Last Traded Price (A) ( 21 Aug 2017): RMB25.30 (CSI300 Index : 3,741) Price Target 12-mth (A): RMB27.60 (9% upside) (Prev RMB24.90) Analyst Ken SHIH +852 2820 4920 [email protected] Keith TSANG CFA, +852 2971 1935 [email protected]
What’s New · 1H17 profit rose 11.4% y-o-y driven mainly by fewer
provisioning, stabilized NIM and better efficiency · Better corporate loan demand seen with strong
credit card/settlement service growth and outlook · Asset quality reaffirmed of reaching reflection point.
Fewer credit cost expected going forward · Revise up earnings by 2-4% y-o-y in FY17F-19F, and
raise target price to HK$30. Reiterate BUY Price Relative
Forecasts and Valuation (H Shares) FY Dec (RMB m) 2016A 2017F 2018F 2019F Pre-prov. Profit 144,801 161,194 189,023 223,613 Pre-prov. Profit Gth (%) 8 11 17 18 Pretax Profit 78,963 91,541 107,162 126,707 Net Profit 62,081 71,516 81,619 96,888 EPS (RMB) 2.46 2.84 3.24 3.84 EPS (HK$) 2.86 3.23 3.69 4.38 EPS Gth (%) 8 15 14 19 PE (X) 9.0 8.0 7.0 5.9 DPS (HK$) 0.86 0.97 1.11 1.32 Div Yield (%) 3.3 3.8 4.3 5.1 BV Per Share (HK$) 18.51 20.58 23.39 26.66 P/Book Value (x) 1.4 1.3 1.1 1.0 ROAE (%) 16.3 16.7 16.8 17.5 ROAE (ex-exceptional (%) 16.3 16.7 16.8 17.5 ROA (%) 1.09 1.15 1.19 1.27 Earnings Rev (%): 2.0 2.4 New Consensus EPS (RMB) 2.73 2.98 Other Broker Recs: B: 12 S: 3 H: 10
Source of all data on this page: Company, DBSV, Thomson Reuters, HKEX
Earnings growth re-accelerating 1H17 profit rose 11.4% y-o-y, ahead of consensus forecast: CMB posted 1H17 profit of Rmb39bn, +11.4% y-o-y, making up 56%/58% of ours/consensus FY17F forecasts. The better-than-expected result was mainly driven by fewer provisioning expenses backed by lower new NPL formation of 0.54 % (versus 1.63% in 2016), stabilised NIM of 2.43% (+1bp q-o-q), and better operating efficiency with cost-to-income ratio at 27%. Although fee income fell 8% y-o-y given the contraction in WMP sales (down 10% y-o-y), the positive is sufficient to outweigh the negative. Better loan demand with strong credit card prospects Stronger corporate loan demand was seen during 1H17, which increased 7.5% h-o-h as CMB stepped up support to its strategically important clients. Its credit card business continued to surge, with credit card interest income and fee income up 22%/29% y-o-y respectively. As at 1H17, interest income/fee income from credit card accounted for 16%/18% of total gross income/fee income, and we expect the contribution to continue to rise. Asset quality remained benign at the 1.26% level. Growth prospect in settlement service fee is also bright. Asset quality reflection point affirmed One of the main spotlights of CMB’s 1H17 results was the improvement in its asset quality, where NPL ratio was at 1.71% (down 17bps/5bps y-o-y/q-o-q), thanks to the substantial decline in the bank’s new NPL formation. SML ratio declined by 37bps to 1.72%. We believe the main reason for such improvement includes 1. Continuous scale down in risky sector exposure, 2. Refocus on strategically important clients, and 3. Rising retail loan contribution. Management also provided a positive outlook by confirming that its asset quality reflection point has been reached. Raise target price to HK$30. Reiterate BUY We revise up earnings by 2-4% for FY17F-19F, to factor in lower credit cost, improving cost control and better loan demand. We raise our target price to HK$30/Rmb27.6 (from HK$27/Rmb24.9), which implies 1.3x FY18F PB. With 16% share price upside, we reiterate our BUY call on CMB. Valuation: Our TP of HK$30/Rmb27.6 is based on DDM method, where we apply 13.1% cost of equity and 5% terminal growth, and raised our ROE assumption to 13% (from 12.5%) given the better earnings outlook. The target price implies 1.3 x FY18F P/BV, in line with the upper- to mid-end of its past 5-year trading band. Key Risks to Our View: Deterioration in credit card asset quality, slowdown in China's economy, increasingly tighter measures on WMP products.
At A Glance Issued Capital - H shares (m shs) 4,591 - Non H shares (m shs) 20,629 H shs as a % of Total 18 Total Mkt. Cap (HK$m/US$m) 730,625 / 93,388 Major Shareholders
China Merchants Group (%) 26.8 Anbang Property & Casualty Insurance (%) 10.7 COSCO Group (%) 6.2
Major H Shareholders (%) China Merchants Group Ltd. (%) 17.6 Best Winner Investment Limited (%) 7.2 JPMorgan Chase & Co. (%) 6.0
H Shares-Free Float (%) 69.3 3m Avg. Daily Val. (US$m) 79.6 ICB Industry : Financials
80
100
120
140
160
180
200
220
11.0
13.0
15.0
17.0
19.0
21.0
23.0
25.0
27.0
29.0
Aug-13 Aug-14 Aug-15 Aug-16 Aug-17
Relative IndexHK$
China Merchants Bank (LHS) Relative HSI (RHS)
69
89
109
129
149
169
189
209
8.5
13.5
18.5
23.5
28.5
Aug-13 Aug-14 Aug-15 Aug-16 Aug-17
Relative IndexRMB
China Merchants Bank-A (LHS) Relative CSI300 Index (RHS)
DBS Group Research . Equity
21 Aug 2017
China / Hong Kong Company Guide
China Merchants Bank Version 2 | Bloomberg: 3968 HK EQUITY | 600036 CH Equity | Reuters: 3968.HK | 600036.SS
Refer to important disclosures at the end of this report

Page 2
Company Guide
China Merchants Bank
Quarterly Results
Source: Company, DBS Vickers
First-half Results
Source: Company, DBS Vickers
1Q15 2Q15 3Q15 4Q15 1Q16 2Q16 3Q16 4Q16 1Q17 2Q17 y oy % qoq %P&L (Rmb m)Net interest income 33,579 32,525 35,055 35,570 34,306 30,800 33,245 33,873 34,914 35,982 16.8 3.1 Net fee income 15,446 15,651 13,880 8,442 19,824 17,955 11,457 11,629 18,640 16,110 (10.3) (13.6) Net non-interest income 17,201 20,942 17,187 10,107 23,968 21,797 14,501 15,088 22,113 16,110 (26.1) (27.1) Total income 50,780 53,467 52,242 45,677 58,274 54,968 47,746 48,961 57,027 55,603 1.2 (2.5) Operating expenses (15,402) (16,424) (16,859) (19,272) (16,041) (15,688) (14,405) (19,014) (14,436) (16,006) 2.0 10.9 Pre-provision profit 35,378 37,043 35,383 26,405 42,233 39,280 33,341 29,947 42,591 39,597 0.8 (7.0) Prov ision (12,744) (16,427) (14,781) (15,314) (18,516) (17,654) (11,470) (18,519) (17,315) (15,333) (13.1) (11.4) Pretax prof it 22,699 20,685 20,606 11,089 23,796 21,699 21,943 11,525 25,502 24,440 12.6 (4.2) Tax (5,393) (4,822) (4,989) (1,857) (5,377) (4,786) (4,931) (1,489) (5,410) (5,066) 5.9 (6.4) Minority interests 83 110 93 36 69 32 101 97 115 92 187.5 (20.0) Net prof it 17,223 15,753 15,524 9,196 18,350 16,881 16,911 9,939 19,977 19,282 14.2 (3.5) Adj net profit 17,223 15,753 15,524 9,196 18,350 16,880 16,911 9,939 19,977 19,282 14.2 (3.5) EPS (Rmb cts) 0.68 0.62 0.62 0.36 0.73 0.67 0.67 0.39 0.79 0.76 14.2 (3.5)
1H16 2H16 1H17 y oy % HoH % 2017F % of 2017F % of DBS est . DBS est . Cons est . Cons est .
P&L (Rmb m)Net interest income 67,477 67,118 70,896 5.1 5.6 148,529 47.7 Net fee income 37,779 23,086 34,750 (8.0) 50.5 69,310 50.1
Total income 113,242 96,707 112,630 (0.5) 16.5 234,501 48.0 225,822 49.9 Operating expenses (31,729) (33,419) (30,442) (4.1) (8.9) (69,749) 43.6 Pre-provision profit 81,513 63,288 82,188 0.8 29.9 164,751 49.9 Prov ision (36,170) (29,989) (32,648) (9.7) 8.9 (75,412) 43.3 Pretax prof it 45,495 33,468 49,942 9.8 49.2 89,704 55.7 86,601 57.7 Tax (10,163) (6,420) (10,476) 3.1 63.2 (19,286) 54.3 Minority interests 101 198 207 105.0 4.5 338 61.3 Net prof it 35,231 26,850 39,259 11.4 46.2 70,080 56.0 68,113 57.6 Adj net profit 35,230 26,850 39,259 11.4 46.2 70,080 56.0 EPS (Rmb cts) 1.40 1.06 1.56 11.4 46.2 2.78 56.0 2.70 57.7
Key balance sheet it ems (Rmb bn)Loan 3,027 3,262 3,540 17.0 8.5 3,694 Deposit 3,693 3,802 4,142 12.2 8.9 4,049 Asset 5,537 5,942 6,200 12.0 4.3 6,419 Shareholders' equity 378 402 421 11.2 4.5 454
Key f inancial rat iosFee as % of income 33.4 23.9 30.9 -2.5ppt 7.0ppt 29.6 Cost to income (%) 28.0 34.6 27.0 -1.0ppt -7.5ppt 29.7 NIM (%) 2.58 2.45 2.43 -15bps -1bps 2.49 Credit cost (bps) 247.28 190.76 192.00 -55bps 1bps 217 ROA (%) 1.28 0.94 1.30 0.0ppt 0.4ppt 1.14 ROE (%) 19.07 13.76 19.08 0.0ppt 5.3ppt 16.37
NPL (Rmb bn) 55.26 61.12 60.5 9.4 (1.1) 71,146 NPL ratio (%) 1.83 1.87 1.71 -12bps -17bps 1.93 NPL prov. cov (%) 189.11 180.02 224.69 36ppt 44.7ppt 189.35 Prov ision/loan (%) 3.45 3.37 3.84 38bps 46bps 3.65 Core tier 1 CAR (%) 12.09 11.54 12.42 33bps 88bps 12.88 Tier 1 CAR (%) 12.09 11.54 12.42 33bps 88bps 13.85 CAR (%) 13.90 13.33 14.59 69bps 126bps 15.77

Page 3
Company Guide
China Merchants Bank
Earnings revision
Source: Company, DBS Vickers
F Y17F F Y18F F Y19F F Y17F F Y18F F Y19F F Y17F F Y18F F Y19FP&L (Rmb m)Net interest income 148,529 163,582 181,279 148,199 166,460 187,280 (0.2) 1.8 3.3 Net fee income 69,310 81,242 94,159 62,851 75,074 91,382 (9.3) (7.6) (2.9)
Total income 234,501 264,486 298,639 227,278 261,007 302,030 (3.1) (1.3) 1.1 Operating expenses (69,749) (75,346) (81,420) (66,084) (71,984) (78,417) (5.3) (4.5) (3.7) Pre-provision profit 164,751 189,139 217,219 161,194 189,023 223,613 (2.2) (0.1) 2.9 Prov ision (75,412) (84,818) (95,890) (70,062) (82,340) (97,473) (7.1) (2.9) 1.7 Pretax prof it 89,704 104,747 121,824 91,541 107,162 126,707 2.0 2.3 4.0 Tax (19,286) (22,521) (26,192) (19,681) (23,040) (27,242) 2.0 2.3 4.0 Minority interests 338 394 458 344 403 477 2.0 2.3 4.0 Net prof it 70,080 81,833 95,173 71,516 83,719 98,988 2.0 2.3 4.0 Adj net profit 70,080 79,733 93,073 71,516 81,619 96,888 2.0 2.4 4.1 EPS (Rmb cts) 2.78 3.16 3.69 2.84 3.24 3.84 2.0 2.4 4.1
Old New Dif ference (%)
Page 4
Company Guide
China Merchants Bank
WHAT’S NEW Q&A Highlight
Q1. What is CMB’s progress in FinTech and its future development plan? - Key strategy: 1) FinTech as the core growth driver, 2)
Develop mobile terminal to replace offline branch level, 3) Enhance risk management in retail banking by biometric identification. The existing technologies that CMB adopts are fingerprint identification, face recognition, and cloud computing.
- Achievements: 1) The current strategy is to allocate 1% of profit in FinTech investment funds (CMB has set up a fund of Rmb10bn for FinTech investment), and CMB will seek approval from the Board for a higher investment if necessary, 2) Set up a FinTech committee for system building and lean innovation, 3) Incubated 15 FinTech projects in 1H17, 4) 15% of existing systems have been replaced, 5) Completed one investment in AI, 6) Teamed up with 30 FinTech companies, and 7) Launched the first block chain cross-border payment platform in Asia.
- Development plan: Recruit top talents from FinTech, accelerate external cooperation with small- and medium-sized FinTech companies, acquire tech firms which can create huge synergies.
Q2. What are the driving forces behind double-digit profit growth in 1H17? Does it indicate a turnaround in ROE? - The double-digit growth is mainly attributable to
improvement in asset quality (lower credit cost charge). The management expects this to be maintained in the future.
Q3. What are the reasons for the decline in non-interest income? - Non-interest income account for 37% of net operating
income, down 3.21% from 1H16. Management thinks it remains a satisfactory result in percentage terms.
- The major reasons are 1) Negative impact on bill business due to VAT reform (expected to continue in 2H17), 2) Contraction of income from entrusted wealth management, 3) Weaker capital market hurting agency sales from trust and insurance products.
Q4. Is CMB seeing an inflection point for NPL? - Management concluded that turnaround point has been
reached. - Reasons for improving asset quality: 1) Percentage of retail
loans further increased to 51.4% by last year-end, 2) The company has focused more on quality wholesale clients by having 75% incremental loans approved at head office and branch levels, 3) The company exited risky sectors including coal, ship making, mining and other risky companies, 4) More proactive actions for write-off and loan recovery
Q5. What is the strategy and long-term approach for wealth management business under stringent regulations? - Key strategy: Wealth management will remain a strategic
business of the bank to benefit from strong demand in retail and wholesale banking
- Present situation: AUM dropped to Rmb2.13tr (10.5% decline from end-2016) and ranked as the second largest in domestic banking industry. The balance is expected to remain stable.
- Plan: 1) Control growth and optimise investment between equity and bond funds, 2) Develop fundamental asset management business by changing underlying assets, 3) Reduce risk exposure from off-balance sheet financing, and 4) Enhance operational risk management.
Q6. What is the NIM outlook? - NIM expansion in the first half is attributed to good control
of cost of funding (1.24% in 1Q and 2Q). The company is on track to achieve NIM of 2.5% in 2H.
Q7. What is the future allocation in business mix? - Present situation: Profit contribution from retail banking
exceed 50%, provisioning for retail banking improved - Future plan: Maintain similar size for wholesale banking,
enhance risk management procedures, continue to raise provision for retail finance to cope with larger risks from increasing residence leverage.
Q8. With more banks competing in retail area, how can CMB maintain its leading position in retail banking (maintain low cost of deposit)? - With the reform initiative starting since 2004, this creates a
solid position for CMB to stand out from other peers. - CMB will continue to apply FinTech in all channels, focus
on cost control in retail banking and risk management to solidify its leading position.
Q9. What is the management’s industry outlook? - Supply-side reform: The bank will explore new business
model in customer and business structures from changes in ecosystems.
- Overcapacity: The problem is highly relevant to economic cycle and government regulations, management expects the problems to be completely alleviated only when new economic cycle comes
- Bank policy: Developed own identification system for 20 industries with overcapacity, set up strategic plan system to ensure effective resource allocation.

Page 5
Company Guide
China Merchants Bank
CRITICAL FACTORS TO WATCH
Critical Factors Stabilising net interest margin CMB’s NIM rebounded by 5bps q-o-q from 2.39% in 4Q16 to 2.44% in 1Q17. This was largely helped by CMB’s leading retail franchise. The improving loan mix with rising revolving loans outstanding may also help NIM to stabilise given higher interest rate. PBOC will tighten monetary measures in FY17 to i) carry out debt deleveraging, and ii) control impacts from US rate hikes. CMB should continue to benefit from its large demand deposit portion. We expect its NIM to stabilise at 2.46%/2.47% in FY17/18F. Solid loan growth CMB focuses on personal loans, particularly residential mortgage and credit card loans which accounted for 22.8% and 12.8% of its total loans respectively in 1H17. CMB’s gross loans were up 8.5% h-o-h in 1H17. As the recently announced restrictions on home purchase will likely slow mortgage growth, we believe CMB will strategically shift to corporate loans and credit card business to sustain loan growth in the near-to-mid term. We expect loan growth to reach 15-16% in FY17/18F. Fee income CMB derived 24% of its FY17H1 net revenue from net fee income, driven by settlement service (+61% y-o-y) and bank cards fees (+36% y-o-y). Despite high-base effect and more stringent off-balance sheet regulation, we forecast CMB’s fee income to grow 3/19% in FY17/18F as we believe CMB can reinforce its leading position in retail banking, and bank cards and bancassurance are areas where CMB has potential to grow. Settlement fees are also expected to be supported by rising usage of e-payment. Policy CMB largely outperformed the Hang Seng Financial Index from October 2014 to June 2015. We believe this was partly caused by mixed ownership reform initiatives which included CMB's approval of its initial employee stock ownership plan which led to employees becoming more efficient, with some even playing a supervisory role as shareholder.
Margin Trends
Gross Loan& Growth
Loan-to-Deposit Ratio Trend
Fee income Growth
Cost & Income Structure
Source: Company, DBS Vickers
2.3%
2.4%
2.5%
2.6%
2.7%
2.8%
2.9%
3.0%
0
20,000
40,000
60,000
80,000
100,000
120,000
140,000
160,000
180,000
2015A 2016A 2017F 2018F 2019F
RMB m
Net Interest Income Net Interest Income Margin
10%11%12%13%14%15%16%17%18%19%20%
0
1,000,000
2,000,000
3,000,000
4,000,000
5,000,000
2015A 2016A 2017F 2018F 2019F
RMB m
Gross Loan (LHS) Gross Loan Growth (%) (YoY) (RHS)
69%
74%
79%
84%
89%
94%
2,465,500
2,965,500
3,465,500
3,965,500
4,465,500
4,965,500
5,465,500
5,965,500
2015A 2016A 2017F 2018F 2019F
m
Loans Deposit Loan-to-Deposit Ratio (RHS)
3.1%
8.1%
13.1%
18.1%
23.1%
28.1%
33.1%
38.1%
0
10,000
20,000
30,000
40,000
50,000
60,000
70,000
80,000
90,000
2015A 2016A 2017F 2018F 2019F
RMB m
Fees & Commissions
Fees & Commissions Growth (%) (YoY) (RHS)
0%
5%
10%
15%
20%
25%
30%
35%
40%
0
50,000
100,000
150,000
200,000
250,000
300,000
2015A 2016A 2017F 2018F 2019F
RMB m
Net Interest Income Non-interest Income Cost-to-income Ratio

Page 6
Company Guide
China Merchants Bank
Share price performance vs policy roadmap
50
60
70
80
90
100
110
120
130
140
Jan-
11M
ar-1
1M
ay-1
1Ju
l-11
Sep-
11N
ov-1
1Ja
n-12
Mar
-12
May
-12
Jul-1
2Se
p-12
Nov
-12
Jan-
13M
ar-1
3M
ay-1
3Ju
l-13
Sep-
13N
ov-1
3Ja
n-14
Mar
-14
May
-14
Jul-1
4Se
p-14
Nov
-14
Jan-
15M
ar-1
5M
ay-1
5Ju
l-15
Sep-
15N
ov-1
5Ja
n-16
Mar
-16
May
-16
Jul-1
6Se
p-16
Nov
-16
Jan-
17M
ar-1
7M
ay-1
7
Share price (HK$) HSF index
(Rebased 1 Jan 2011 = 100) China State Council's proposal to realx 75% LDR requirement ( Jun 15)
Relaxation of bad loans write-down from MOF (Jan 14 MOF)
Local debt replacement scheme (Mar 15 MOF)
PBOC relaxedthe upper and lower limit of interest rate (Jun-Jul 12)
PBOC ended restrictions on lending rates (Jul 13)
PBOC launched MPA; (Dec 15)
Rmb added to SDR basket (Oct 16)
PBOC removed all deposit interestrate ceiling restriction (Oct 15)
CBRC further regulated WMPs betwen banks and trust companies (Jan 11)
Acqn of 50% Equity in CIGNA & CMC Life Insurance
Issuanc eof Tier 2 capital bonds of RMB 11bn
Proposed issaunce of pref shares of RMB 35bn
First PhaseEmployee Stock Ownership Scheme
Rights Issue (680m H Shares) & (3bn A share)
Sub bond issuance (RMB 11.7bn)
Source: PBOC, CBRC, MOF, Bloomberg Finance L.P., Company data, DBS Vickers

Page 7
Company Guide
China Merchants Bank
Share price performance vs 3M Shibor
Remarks
With CMB’s net interest income contributing 64% of operating income, interest rate movement is an important driver of share price.
CMB benefits from low deposit cost (FY16 avg deposit cost of 1.27%, even lower than big-4) caused by a high proportion of demand deposits (72% of retail deposits) pushing down the retail deposit cost to merely 0.9%. CMB is set to enjoy larger benefits from rate hike given high CASA ratio.
The close relationship is evident from the high correlation coefficient of 0.7x between CMB's share price and SHIBOR 3-month since January 2016.
Source: Bloomberg Finance L.P., DBS Vickers
Share price performance vs fee income y-o-y growth
Remarks
0
10
20
30
40
50
60
50
70
90
110
130
150
170
Jul-1
4
Jul-1
4
Aug
-14
Sep-
14
Sep-
14
Oct
-14
Nov
-14
Nov
-14
Dec
-14
Jan-
15
Jan-
15
Feb-
15
Mar
-15
Apr
-15
Apr
-15
May
-15
Jun-
15
Jun-
15
Jul-1
5
Aug
-15
Aug
-15
Sep-
15
Share price (HK$) HSF index fees growth y-o-y
(Rebased Jul 2014 = 100)
CMB outperformed the Hang Seng Financial Index from July 2014 to September 2015 by 26%. The correlation between its share price and fee growth reached 0.72 during this period.
We believe the outperformance was caused by market appreciating CMB’s successful delivery of its “One-body-two-wings” strategy of putting retail banking as its business focus. This in turn delivered robust fee performance (FY13-15 CAGR 35% y-o-y) driven by agency service fees (FY13-15 CAGR of 63%) and commission from custody and other trustee business (FY13-15 CAGR of 61%).
Source: Bloomberg Finance L.P., DBS Vickers
0
1
2
3
4
5
6
7
0
20
40
60
80
100
120
140
Jan-
11A
pr-1
1Ju
l-11
Oct
-11
Jan-
12A
pr-1
2Ju
l-12
Oct
-12
Jan-
13A
pr-1
3Ju
l-13
Oct
-13
Jan-
14A
pr-1
4Ju
l-14
Oct
-14
Jan-
15A
pr-1
5Ju
l-15
Oct
-15
Jan-
16A
pr-1
6Ju
l-16
Oct
-16
Jan-
17A
pr-1
7
Share price (HK$) SHIBOR 3mth
(Rebased 1 Jan 2011 = 100) (%)
Correl:0.70
Page 8
Company Guide
China Merchants Bank
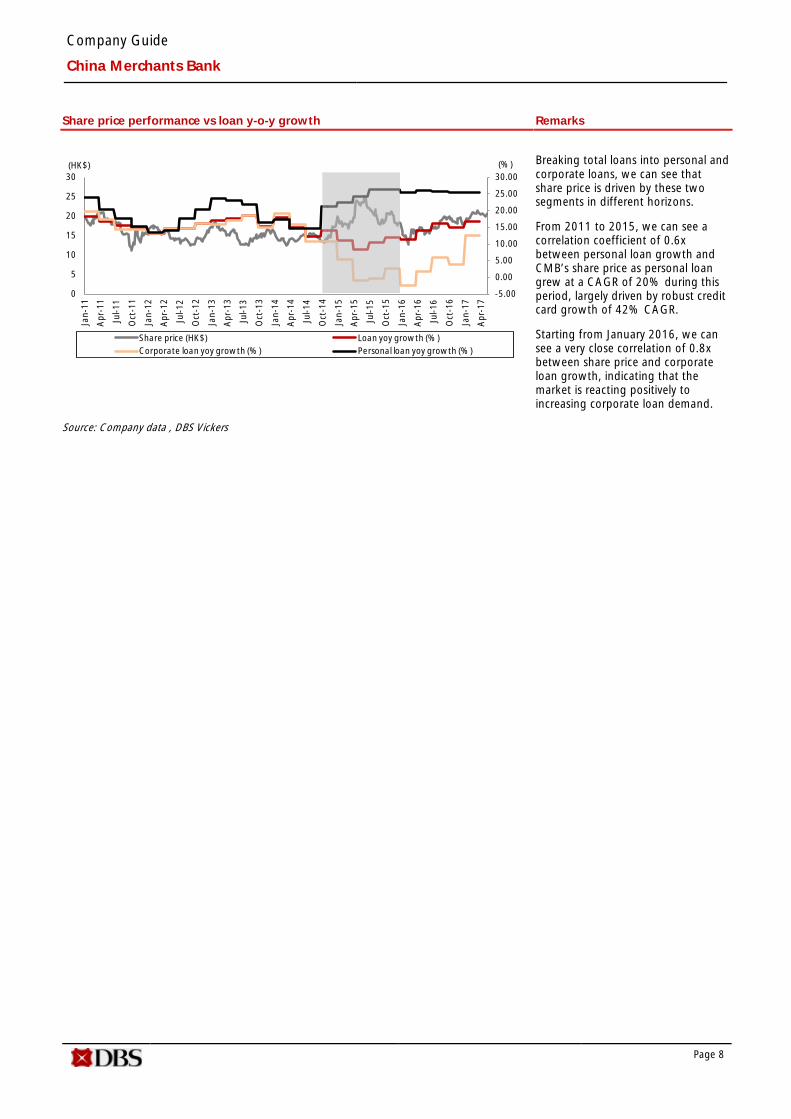
Share price performance vs loan y-o-y growth
Remarks
-5.00
0.00
5.00
10.00
15.00
20.00
25.00
30.00
0
5
10
15
20
25
30
Jan-
11
Apr
-11
Jul-1
1
Oct
-11
Jan-
12
Apr
-12
Jul-1
2
Oct
-12
Jan-
13
Apr
-13
Jul-1
3
Oct
-13
Jan-
14
Apr
-14
Jul-1
4
Oct
-14
Jan-
15
Apr
-15
Jul-1
5
Oct
-15
Jan-
16
Apr
-16
Jul-1
6
Oct
-16
Jan-
17
Apr
-17
Share price (HK$) Loan yoy growth (%)Corporate loan yoy growth (%) Personal loan yoy growth (%)
(HK$) (%)
Breaking total loans into personal and corporate loans, we can see that share price is driven by these two segments in different horizons.
From 2011 to 2015, we can see a correlation coefficient of 0.6x between personal loan growth and CMB’s share price as personal loan grew at a CAGR of 20% during this period, largely driven by robust credit card growth of 42% CAGR.
Starting from January 2016, we can see a very close correlation of 0.8x between share price and corporate loan growth, indicating that the market is reacting positively to increasing corporate loan demand.
Source: Company data , DBS Vickers

Page 9
Company Guide
China Merchants Bank
Balance Sheet: Asset quality. CMB’s NPL ratio stood at 1.71% in 1H17, improving by 16bps h-o-h with new NPL formation rate slowing to 0.54%. CMB has less debt exposures to risky sectors including manufacturing, wholesale, retail and mining, while it allocates more to healthier mortgage and credit card loans. Management expects the asset quality to improve in FY17F. Capital adequacy ratio. As at end-Jun 2017, CMB’s core Tier-1 CAR, Tier-1 CAR and CAR were 12.4%, 12.4% and 14.6% respectively, much higher than the CBRC’s required 8.5% as at end-2018, and low dilution risk. This well illustrates CMB’s capabilities of sound operations and risk resistance. Given a leading position and solid expertise in WMPs, fund-distribution and card business, CMB’s asset-light model can lessen capital adequacy pressure and solidify its diversified profitability mode. Additionally, CMB has proposed to issue preferred shares of not more than Rmb35bn to replenish its AT1 capital. Share Price Drivers: Continuous recovery in the real economy. Rising domestic corporate returns underpinned by more balanced supply and demand will continue to help ease CMB’s NPL formation and credit cost pressures. This should bode well for its asset quality as well as earnings outlook. Interest rate hikes to help stabilise NIM. Potential interest rate hikes should support CMB’s loan yield growth while CMB can benefit from low funding costs by leveraging on its strong retail franchise. M&As in FinTech space. Management believes technology will be the next long-term driver for its retail business while its client base and contributions per client reach a high point. Investments in FinTech will help to substantially reduce costs and increase operating efficiency. Thus, the bank can enjoy better operating leverage. Key Risks: Asset quality remains a key concern for investors as deteriorating asset quality will weigh on credit cost and its profitability. Macro headwinds will also put pressure on CMB’s NPLs and retail businesses. Other risks include tighter measures on WMPs. Company Background Founded in 1987 and headquartered in Shenzhen, CMB has a leading retail franchise and offers diversified wholesale and retail finance services. It was listed on the SSE in April 2002 and the HKEX in September 2016. At end-2016, CMB’s total assets amounted to Rmb5.94tr while gross loans and total deposits amounted to Rmb3.26tr and Rmb3.80tr respectively.
Asset Quality
Capitalisation (%)
ROE
PE Band
PB Band
Source: Company, DBS Vickers
1.0%
1.2%
1.4%
1.6%
1.8%
2.0%
2.2%
2.4%
2.6%
2.8%
3.0%
2015A 2016A 2017F 2018F 2019F
NPL Ratio Provision Charge-Off Rate
10.0%
11.0%
12.0%
13.0%
14.0%
15.0%
16.0%
17.0%
2015A 2016A 2017F 2018F 2019F
Tier-1 CAR Total CAR
0.0%
2.0%
4.0%
6.0%
8.0%
10.0%
12.0%
14.0%
16.0%
2015A 2016A 2017F 2018F 2019F
Avg: 6.3x
+1sd: 7.4x
+2sd: 8.5x
-1sd: 5.2x
-2sd: 4.1x3.7
4.7
5.7
6.7
7.7
8.7
9.7
2013 2014 2015 2016
(x)
Avg: 1.09x
+1sd: 1.23x
+2sd: 1.36x
-1sd: 0.95x
-2sd: 0.81x
0.6
0.8
1.0
1.2
1.4
1.6
1.8
Aug-13 Aug-14 Aug-15 Aug-16
(x)

Page 10
Company Guide
China Merchants Bank
Key Assumptions FY Dec 2015A 2016A 2017F 2018F 2019F NIM (%) 2.75 2.50 2.46 2.47 2.48 Loan growth (%) 12 15 15 16 16 Fee growth (%) 35 14 3 19 22 Cost-to-income (%) 33.6 31.0 29.1 27.6 26.0 Credit cost (%) 2.22 2.17 1.96 2.00 2.05 Customer Deposits Growth (%) Growth (%) 8 6 13 14 16
Yld. On Earnings Assets (%) 4.69 3.85 3.91 3.95 3.99 Avg Cost Of Funds (%) 2.13 1.63 1.67 1.68 1.71 Source: Company, DBS Vickers
Income Statement (RMB m) FY Dec 2015A 2016A 2017F 2018F 2019F Net Interest Income 136,729 134,595 148,199 166,460 187,280 Non-Interest Income 65,437 75,354 79,079 94,547 114,750 Operating Income 202,166 209,949 227,278 261,007 302,030 Operating Expenses (67,957) (65,148) (66,084) (71,984) (78,417) Pre-provision Profit 134,209 144,801 161,194 189,023 223,613 Provisions (59,266) (66,159) (70,062) (82,340) (97,473) Associates 136 321 409 479 566 Exceptionals 0 0 0 0 0 Pre-tax Profit 75,079 78,963 91,541 107,162 126,707 Taxation (17,061) (16,583) (19,681) (23,040) (27,242) Minority Interests (322) (299) (344) (403) (477) Preference Dividend 0 0 0 (2,100) (2,100) Net Profit 57,696 62,081 71,516 81,619 96,888 Net Profit bef Except 57,696 62,081 71,516 81,619 96,888 Growth (%) Net Interest Income Gth 16.66 (1.56) 10.11 12.32 12.51 Net Profit Gth 3.19 7.60 15.20 14.13 18.71 Margins, Costs & Efficiency (%) Spread 2.56 2.22 2.24 2.27 2.29 Net Interest Margin 2.73 2.40 2.42 2.45 2.47 Cost-to-Income Ratio 33.6 31.0 29.1 27.6 26.0 Business Mix (%) Net Int. Inc / Opg Inc. 67.6 64.1 65.2 63.8 62.0 Non-Int. Inc / Opg inc. 32.4 35.9 34.8 36.2 38.0 Fee Inc / Opg Income 26.4 29.0 27.7 28.8 30.3 Oth Non-Int Inc/Opg Inc 5.9 6.9 7.1 7.5 7.7 Profitability (%) ROAE Pre Ex. 17.1 16.3 16.7 16.8 17.5 ROAE 17.1 16.3 16.7 16.8 17.5 ROA Pre Ex. 1.1 1.1 1.2 1.2 1.3 ROA 1.1 1.1 1.1 1.2 1.3 Source: Company, DBS Vickers

Page 11
Company Guide
China Merchants Bank
Quarterly Income Statement (RMB m) FY Dec 2Q2016 3Q2016 4Q2016 1Q2017 2Q2017 Net Interest Income 30,800 33,245 33,873 34,914 35,982 Non-Interest Income 21,797 14,501 15,088 22,113 19,621 Operating Income 52,597 47,746 48,961 57,027 55,603 Operating Expenses (15,688) (14,405) (19,014) (14,436) (16,006) Pre-Provision Profit 36,909 33,341 29,947 42,591 39,597 Provisions (17,654) (11,470) (18,519) (17,315) (15,333) Associates 73 72 97 226 176 Exceptionals 0 0 0 0 0 Pretax Profit 19,328 21,943 11,525 25,502 24,440 Taxation (4,786) (4,931) (1,489) (5,410) (5,066) Minority Interests (32) (101) (97) (115) (92) Net Profit 14,509 16,911 9,939 19,977 19,282 Growth (%) Net Interest Income Gth (5.3) (5.2) (4.8) (4.8) 16.8 Net Profit Gth (7.9) 8.9 8.1 (3.6) 32.9 Source: Company, DBS Vickers
Interim Income Statement (RMB m)
FY Dec 1H2015 2H2015 1H2016 2H2016 1H2017 Net Interest Income 66,104 70,625 67,477 67,118 70,896 Non-Interest Income 38,143 27,294 45,765 29,589 41,734 Operating Income 104,247 97,919 113,242 96,707 112,630 Operating Expenses (31,826) (36,131) (31,729) (33,419) (30,442) Pre-Provision Profit 72,421 61,788 81,513 63,288 82,188 Provisions (29,171) (30,095) (36,170) (29,989) (32,648) Associates 134 2 152 169 402 Exceptionals 0 0 0 0 0 Pretax Profit 43,384 31,695 45,495 33,468 49,942 Taxation (10,215) (6,846) (10,163) (6,420) (10,476) Minority Interests (193) (129) (101) (198) (207) Net Profit 32,976 24,720 35,230 26,850 39,259 Growth (%) Net Interest Income Gth 17.7 15.7 2.1 (5.0) 5.1 Net Profit Gth 8.3 (2.9) 6.8 8.6 11.4 Source: Company, DBS Vickers

Page 12
Company Guide
China Merchants Bank
Balance Sheet (RMB m) FY Dec 2015A 2016A 2017F 2018F 2019F Cash/Bank Balance 584,342 597,529 672,220 721,667 803,196 Government Securities 0 0 0 0 0 Inter Bank Assets 593,396 581,963 494,669 445,202 409,586 Total Net Loans & Advs. 2,739,444 3,151,649 3,614,592 4,170,928 4,810,604 Investment 1,368,760 1,394,950 1,506,546 1,627,070 1,789,777 Associates 2,786 3,712 3,712 3,712 3,712 Fixed Assets 33,543 45,558 58,613 72,050 85,263 Goodwill 13,549 13,868 13,868 13,868 13,868 Other Assets 139,158 153,082 153,049 139,371 155,875 Total Assets 5,474,978 5,942,311 6,517,269 7,193,867 8,071,881 Customer Deposits 3,571,698 3,802,049 4,277,305 4,876,128 5,656,308 Inter Bank Deposits 1,138,584 1,297,533 1,297,533 1,297,533 1,297,533 Debts/Borrowings 236,759 260,563 265,774 271,090 284,644 Others 166,179 178,804 185,180 195,113 206,671 Minorities 952 1,012 1,274 1,582 1,950 Shareholders' Funds 360,806 402,350 490,203 552,422 624,774 Total Liab& S/H’s Funds 5,474,978 5,942,311 6,517,269 7,193,867 8,071,881 Source: Company, DBS Vickers
Financial Stability Measures (%)
FY Dec 2015A 2016A 2017F 2018F 2019F Balance Sheet Structure Loan-to-Deposit Ratio 79.1 85.8 87.8 89.2 88.9 Net Loans / Total Assets 50.0 53.0 55.5 58.0 59.6 Investment / Total Assets 25.0 23.5 23.1 22.6 22.2 Cust . Dep./Int. Bear. Liab. 72.8 72.8 72.9 75.0 77.2 Interbank Dep / Int. Bear. 23.5 21.1 21.4 20.0 18.2 Asset Quality NPL / Total Gross Loans 1.7 1.9 1.7 1.7 1.7 NPL / Total Assets 0.9 1.0 1.0 1.0 1.1 Loan Loss Reserve Coverage 179.0 180.0 222.9 241.1 256.5 Provision Charge-Off Rate 2.1 2.0 1.9 1.9 1.9 Capital Strength Total CAR 12.6 13.3 15.6 16.0 16.1 Tier-1 CAR 10.8 11.5 12.8 13.2 13.5 Source: Company, DBS Vickers

Page 13
Company Guide
China Merchants Bank
H Share - Target Price & Ratings History
Source: DBS Vickers
Analyst: Ken SHIH
A Share - Target Price & Ratings History
Source: DBS Vickers
Analyst: Ken SHIH
12
17.0
19.0
21.0
23.0
25.0
27.0
Aug
-16
Sep-
16
Oct
-16
Nov
-16
Dec
-16
Jan-
17
Feb-
17
Mar
-17
Apr
-17
May
-17
Jun-
17
Jul-1
7
Aug
-17
HK$S.No. Date Closing 12-mth Rat ing
Price TargetPrice
1: 21-Apr-17 HK$20.15 HK$27.00 Buy2: 21-Jun-17 HK$22.15 HK$27.00 Buy
1 2
3.0
8.0
13.0
18.0
23.0
28.0
Aug
-16
Oct
-16
Jan-
17
Mar
-17
Jun-
17
Aug
-17
RMB S.No. Date ClosingPrice
12-mthTarget
Rat ing
Price1: 21-Apr-17 RMB18.46 RMB24.90 Buy2: 21-Jun-17 RMB21.31 RMB24.90 Buy3:

Page 14
Company Guide
China Merchants Bank
DBSVHK recommendations are based an Absolute Total Return* Rating system, defined as follows:
STRONG BUY (>20% total return over the next 3 months, with identifiable share price catalysts within this time frame)
BUY (>15% total return over the next 12 months for small caps, >10% for large caps)
HOLD (-10% to +15% total return over the next 12 months for small caps, -10% to +10% for large caps)
FULLY VALUED (negative total return i.e. > -10% over the next 12 months)
SELL (negative total return of > -20% over the next 3 months, with identifiable catalysts within this time frame)
Share price appreciation + dividends Completed Date: 21 Aug 2017 18:21:05 (HKT) Dissemination Date: 21 Aug 2017 19:07:41 (HKT)
Sources for all charts and tables are DBS Vickers unless otherwise specified. GENERAL DISCLOSURE/DISCLAIMER This report is prepared by DBS Vickers (Hong Kong) Limited (“DBSV HK”). This report is solely intended for the clients of DBS Bank Ltd., DBS Bank (Hong Kong) Limited (DBS HK), DBSV HK, and DBS Vickers Securities (Singapore) Pte Ltd. (“DBSVS”), its respective connected and associated corporations and affiliates only and no part of this document may be (i) copied, photocopied or duplicated in any form or by any means or (ii) redistributed without the prior written consent of DBSV HK. The research set out in this report is based on information obtained from sources believed to be reliable, but we (which collectively refers to DBS Bank Ltd., DBS HK, DBSV HK, DBSVS, its respective connected and associated corporations, affiliates and their respective directors, officers, employees and agents (collectively, the “DBS Group”) have not conducted due diligence on any of the companies, verified any information or sources or taken into account any other factors which we may consider to be relevant or appropriate in preparing the research. Accordingly, we do not make any representation or warranty as to the accuracy, completeness or correctness of the research set out in this report. Opinions expressed are subject to change without notice. This research is prepared for general circulation. Any recommendation contained in this document does not have regard to the specific investment objectives, financial situation and the particular needs of any specific addressee. This document is for the information of addressees only and is not to be taken in substitution for the exercise of judgement by addressees, who should obtain separate independent legal or financial advice. The DBS Group accepts no liability whatsoever for any direct, indirect and/or consequential loss (including any claims for loss of profit) arising from any use of and/or reliance upon this document and/or further communication given in relation to this document. This document is not to be construed as an offer or a solicitation of an offer to buy or sell any securities. The DBS Group, along with its affiliates and/or persons associated with any of them may from time to time have interests in the securities mentioned in this document. The DBS Group, may have positions in, and may effect transactions in securities mentioned herein and may also perform or seek to perform broking, investment banking and other banking services for these companies. Any valuations, opinions, estimates, forecasts, ratings or risk assessments herein constitutes a judgment as of the date of this report, and there can be no assurance that future results or events will be consistent with any such valuations, opinions, estimates, forecasts, ratings or risk assessments. The information in this document is subject to change without notice, its accuracy is not guaranteed, it may be incomplete or condensed, it may not contain all material information concerning the company (or companies) referred to in this report and the DBS Group is under no obligation to update the information in this report. This publication has not been reviewed or authorized by any regulatory authority in Singapore, Hong Kong or elsewhere. There is no planned schedule or frequency for updating research publication relating to any issuer. The valuations, opinions, estimates, forecasts, ratings or risk assessments described in this report were based upon a number of estimates and assumptions and are inherently subject to significant uncertainties and contingencies. It can be expected that one or more of the estimates on which the valuations, opinions, estimates, forecasts, ratings or risk assessments were based will not materialize or will vary significantly from actual results. Therefore, the inclusion of the valuations, opinions, estimates, forecasts, ratings or risk assessments described herein IS NOT TO BE RELIED UPON as a representation and/or warranty by the DBS Group (and/or any persons associated with the aforesaid entities), that: (a) such valuations, opinions, estimates, forecasts, ratings or risk assessments or their underlying assumptions will be achieved, and (b) there is any assurance that future results or events will be consistent with any such valuations, opinions, estimates, forecasts, ratings or risk
assessments stated therein. Please contact the primary analyst for valuation methodologies and assumptions associated with the covered companies or price targets. Any assumptions made in this report that refers to commodities, are for the purposes of making forecasts for the company (or companies) mentioned herein. They are not to be construed as recommendations to trade in the physical commodity or in the futures contract relating to the commodity referred to in this report. DBSVUSA, a US-registered broker-dealer, does not have its own investment banking or research department, has not participated in any public offering of securities as a manager or co-manager or in any other investment banking transaction in the past twelve months and does not engage in market-making.

Page 15
Company Guide
China Merchants Bank
ANALYST CERTIFICATION The research analyst(s) primarily responsible for the content of this research report, in part or in whole, certifies that the views about the companies and their securities expressed in this report accurately reflect his/her personal views. The analyst(s) also certifies that no part of his/her compensation was, is, or will be, directly or indirectly, related to specific recommendations or views expressed in the report. The research analyst (s) primarily responsible for the content of this research report, in part or in whole, certifies that he or his associate1 does not serve as an officer of the issuer or the new listing applicant (which includes in the case of a real estate investment trust, an officer of the management company of the real estate investment trust; and in the case of any other entity, an officer or its equivalent counterparty of the entity who is responsible for the management of the issuer or the new listing applicant) and the research analyst(s) primarily responsible for the content of this research report or his associate does not have financial interests2 in relation to an issuer or a new listing applicant that the analyst reviews. DBS Group has procedures in place to eliminate, avoid and manage any potential conflicts of interests that may arise in connection with the production of research reports. The research analyst(s) responsible for this report operates as part of a separate and independent team to the investment banking function of the DBS Group and procedures are in place to ensure that confidential information held by either the research or investment banking function is handled appropriately. There is no direct link of DBS Group's compensation to any specific investment banking function of the DBS Group.
COMPANY-SPECIFIC / REGULATORY DISCLOSURES 1. DBS Bank Ltd, DBS HK, DBSVS, DBSV HK or their subsidiaries and/or other affiliates have a proprietary position in China Merchants
Bank Company Limited (3968 HK) recommended in this report as of 17 Aug 2017.
2. Neither DBS Bank Ltd, DBS HK nor DBSV HK market makes in equity securities of the issuer(s) or company(ies) mentioned in this Research Report.
3. Compensation for investment banking services: DBS Bank Ltd, DBS HK, DBSVS, DBSV HK, their subsidiaries and/or other affiliates of DBSVUSA, within the next 3 months, will receive or intend to seek compensation for investment banking services from China Merchants Bank Company Limited (3968 HK) and China Merchants Bank Company Limited (600036 CH) as of 31 Jul 2017.
DBSVUSA does not have its own investment banking or research department, nor has it participated in any public offering of securities as a manager or co-manager or in any other investment banking transaction in the past twelve months. Any US persons wishing to obtain further information, including any clarification on disclosures in this disclaimer, or to effect a transaction in any security discussed in this document should contact DBSVUSA exclusively.
4. Disclosure of previous investment recommendation produced:
DBS Bank Ltd, DBSVS, DBSVHK, their subsidiaries and/or other affiliates of DBSVUSA may have published other investment recommendations in respect of the same securities / instruments recommended in this research report during the preceding 12 months. Please contact the primary analyst listed in the first page of this report to view previous investment recommendations published by DBS Bank Ltd, DBSVHK, their subsidiaries and/or other affiliates of DBSVUSA in the preceding 12 months.
1 An associate is defined as (i) the spouse, or any minor child (natural or adopted) or minor step-child, of the analyst; (ii) the trustee of a trust of
which the analyst, his spouse, minor child (natural or adopted) or minor step-child, is a beneficiary or discretionary object; or (iii) another person accustomed or obliged to act in accordance with the directions or instructions of the analyst.
2 Financial interest is defined as interests that are commonly known financial interest, such as investment in the securities in respect of an issuer or a new listing applicant, or financial accommodation arrangement between the issuer or the new listing applicant and the firm or analysis. This term does not include commercial lending conducted at arm's length, or investments in any collective investment scheme other than an issuer or new listing applicant notwithstanding the fact that the scheme has investments in securities in respect of an issuer or a new listing applicant.

Page 16
Company Guide
China Merchants Bank
RESTRICTIONS ON DISTRIBUTION
General This report is not directed to, or intended for distribution to or use by, any person or entity who is a citizen or resident of or located in any locality, state, country or other jurisdiction where such distribution, publication, availability or use would be contrary to law or regulation.
Australia This report is being distributed in Australia by DBS Bank Ltd. (“DBS”) or DBS Vickers Securities (Singapore) Pte Ltd (“DBSVS”). DBS holds Australian Financial Services Licence no. 475946.
DBSVS is exempted from the requirement to hold an Australian Financial Services Licence under the Corporation Act 2001 (“CA”) in respect of financial services provided to the recipients. Both DBS and DBSVS are regulated by the Monetary Authority of Singapore under the laws of Singapore, and DBSVHK is regulated by the Securities and Futures Commission of Hong Kong under the laws of Hong Kong, which differ from Australian laws.
Distribution of this report is intended only for “wholesale investors” within the meaning of the CA.
Hong Kong This report is being distributed in Hong Kong by DBS Bank Ltd, DBS Bank (Hong Kong) Limited and DBS Vickers (Hong Kong) Limited, all of which are registered with or licensed by the Hong Kong Securities and Futures Commission to carry out the regulated activity of advising on securities.
Indonesia This report is being distributed in Indonesia by PT DBS Vickers Sekuritas Indonesia.
Malaysia This report is distributed in Malaysia by AllianceDBS Research Sdn Bhd ("ADBSR"). Recipients of this report, received from ADBSR are to contact the undersigned at 603-2604 3333 in respect of any matters arising from or in connection with this report. In addition to the General Disclosure/Disclaimer found at the preceding page, recipients of this report are advised that ADBSR (the preparer of this report), its holding company Alliance Investment Bank Berhad, their respective connected and associated corporations, affiliates, their directors, officers, employees, agents and parties related or associated with any of them may have positions in, and may effect transactions in the securities mentioned herein and may also perform or seek to perform broking, investment banking/corporate advisory and other services for the subject companies. They may also have received compensation and/or seek to obtain compensation for broking, investment banking/corporate advisory and other services from the subject companies.
Wong Ming Tek, Executive Director, ADBSR
Singapore This report is distributed in Singapore by DBS Bank Ltd (Company Regn. No. 196800306E) or DBSVS (Company Regn No. 198600294G), both of which are Exempt Financial Advisers as defined in the Financial Advisers Act and regulated by the Monetary Authority of Singapore. DBS Bank Ltd and/or DBSVS, may distribute reports produced by its respective foreign entities, affiliates or other foreign research houses pursuant to an arrangement under Regulation 32C of the Financial Advisers Regulations. Where the report is distributed in Singapore to a person who is not an Accredited Investor, Expert Investor or an Institutional Investor, DBS Bank Ltd accepts legal responsibility for the contents of the report to such persons only to the extent required by law. Singapore recipients should contact DBS Bank Ltd at 6327 2288 for matters arising from, or in connection with the report.
Thailand This report is being distributed in Thailand by DBS Vickers Securities (Thailand) Co Ltd. Research reports distributed are only intended for institutional clients only and no other person may act upon it.
United Kingdom
This report is produced by DBSVHK which is regulated by the Hong Kong Securities and Futures Commission This report is disseminated in the United Kingdom by DBS Vickers Securities (UK) Ltd (“DBSVUK”). DBSVUK is authorised and regulated by the Financial Conduct Authority in the United Kingdom. In respect of the United Kingdom, this report is solely intended for the clients of DBSVUK, its respective connected and associated corporations and affiliates only and no part of this document may be (i) copied, photocopied or duplicated in any form or by any means or (ii) redistributed without the prior written consent of DBSVUK. This communication is directed at persons having professional experience in matters relating to investments. Any investment activity following from this communication will only be engaged in with such persons. Persons who do not have professional experience in matters relating to investments should not rely on this communication.
Dubai International Financial Centre
This research report is being distributed by DBS Bank Ltd., (DIFC Branch) having its office at PO Box 506538, 3rd Floor, Building 3, East Wing, Gate Precinct, Dubai International Financial Centre (DIFC), Dubai, United Arab Emirates. DBS Bank Ltd., (DIFC Branch) is regulated by The Dubai Financial Services Authority. This research report is intended only for professional clients (as defined in the DFSA rulebook) and no other person may act upon it.
United Arab Emirates
This report is provided by DBS Bank Ltd (Company Regn. No. 196800306E) which is an Exempt Financial Adviser as defined in the Financial Advisers Act and regulated by the Monetary Authority of Singapore. This report is for information purposes only and should not be relied upon or acted on by the recipient or considered as a solicitation or inducement to buy or sell any financial product. It does not constitute a personal recommendation or take into account the particular investment objectives, financial situation, or needs of individual clients. You should contact your relationship manager or investment adviser if you need advice on the merits of buying, selling or holding a particular investment. You should note that the information in this report may be out of date and it is not represented or warranted to be accurate, timely or complete. This report or any portion thereof may not be reprinted, sold or redistributed without our written consent.

Page 17
Company Guide
China Merchants Bank
United States This report was prepared by DBSVHK. DBSVUSA did not participate in its preparation. The research analyst(s) named on
this report are not registered as research analysts with FINRA and are not associated persons of DBSVUSA. The research analyst(s) are not subject to FINRA Rule 2241 restrictions on analyst compensation, communications with a subject company, public appearances and trading securities held by a research analyst. This report is being distributed in the United States by DBSVUSA, which accepts responsibility for its contents. This report may only be distributed to Major U.S. Institutional Investors (as defined in SEC Rule 15a-6) and to such other institutional investors and qualified persons as DBSVUSA may authorize. Any U.S. person receiving this report who wishes to effect transactions in any securities referred to herein should contact DBSVUSA directly and not its affiliate.
Other jurisdictions
In any other jurisdictions, except if otherwise restricted by laws or regulations, this report is intended only for qualified, professional, institutional or sophisticated investors as defined in the laws and regulations of such jurisdictions.
DBS Vickers (Hong Kong) Limited
18th Floor Man Yee building, 68 Des Voeux Road Central, Central, Hong Kong
Tel: (852) 2820-4888, Fax: (852) 2868-1523
Company Regn. No. 31758

Page 18
Company Guide
China Merchants Bank
DBS Regional Research Offices
HONG KONG DBS Vickers (Hong Kong) Ltd Contact: Carol Wu 18th Floor Man Yee Building 68 Des Voeux Road Central Central, Hong Kong Tel: 852 2820 4888 Fax: 852 2863 1523 e-mail: [email protected] Participant of the Stock Exchange of Hong Kong Ltd
MALAYSIA AllianceDBS Research Sdn Bhd Contact: Wong Ming Tek (128540 U) 19th Floor, Menara Multi-Purpose, Capital Square, 8 Jalan Munshi Abdullah 50100 Kuala Lumpur, Malaysia. Tel.: 603 2604 3333 Fax: 603 2604 3921 e-mail: [email protected]
SINGAPORE DBS Bank Ltd Contact: Janice Chua 12 Marina Boulevard, Marina Bay Financial Centre Tower 3 Singapore 018982 Tel: 65 6878 8888 Fax: 65 65353 418 e-mail: [email protected] Company Regn. No. 196800306E
INDONESIA PT DBS Vickers Sekuritas (Indonesia) Contact: Maynard Priajaya Arif DBS Bank Tower Ciputra World 1, 32/F Jl. Prof. Dr. Satrio Kav. 3-5 Jakarta 12940, Indonesia Tel: 62 21 3003 4900 Fax: 6221 3003 4943 e-mail: [email protected]
THAILAND DBS Vickers Securities (Thailand) Co Ltd Contact: Chanpen Sirithanarattanakul 989 Siam Piwat Tower Building, 9th, 14th-15th Floor Rama 1 Road, Pathumwan, Bangkok Thailand 10330 Tel. 66 2 657 7831 Fax: 66 2 658 1269 e-mail: [email protected] Company Regn. No 0105539127012 Securities and Exchange Commission, Thailand