
The simulation of heavy rainfall episode over Mumbai: impact of horizontal resolutions and cumulus...
26
ORIGINAL PAPER The simulation of heavy rainfall episode over Mumbai: impact of horizontal resolutions and cumulus parameterization schemes Sanjib K. Deb C. M. Kishtawal V. S. Bongirwar P. K. Pal Received: 5 March 2008 / Accepted: 5 February 2009 / Published online: 26 February 2009 Ó Springer Science+Business Media B.V. 2009 Abstract In this study, the simulation of an extreme weather event like heavy rainfall over Mumbai (India) on July 26, 2005 has been attempted with different horizontal res- olutions using the Advanced Research Weather Research Forecast model version 2.0.1 developed at the National Center for Atmospheric Research (NCAR), USA. The study uses the Betts–Miller–Janjic (BMJ) and the Grell–Devenyi ensemble (GDE) cumulus param- eterization schemes in single and nested domain configurations. The model performance was evaluated by examining the different predicted parameters like upper and lower level circulations, moisture, temperature, and rainfall. The large-scale circulation features, moisture, and temperature were compared with the National Centers for Environmental Prediction analyses. The rainfall prediction was assessed quantitatively by comparing rainfall from the Tropical Rainfall Measuring Mission products and the observed station values reported in the Indian Daily Weather Reports from India Meteorological Depart- ment (IMD). The quantitative validation of the simulated rainfall was done by calculating the categorical skill scores like frequency bias, threat scores (TS), and equitable threat scores (ETS). It is found that in all simulations, both in single and nested domains, the GDE scheme has outperformed the BMJ scheme for the simulation of rainfall for this specific event. Keywords Mumbai rainfall TRMM rainfall Cumulus parameterization 1 Introduction In numerical weather prediction, an accurate timely and location specific prediction is very important to minimize the loss of lives and damage to property due to strong winds and heavy precipitations associated with severe or very severe weather systems. For the better prediction of flash flood, it is necessary to understand the dynamics and physics of isolated S. K. Deb (&) C. M. Kishtawal V. S. Bongirwar P. K. Pal Atmospheric Sciences Division, Meteorology and Oceanography Group, Space Applications Centre, RESA, Indian Space Research Organization, Ahmedabad 380015, India e-mail: [email protected]; [email protected] 123 Nat Hazards (2010) 52:117–142 DOI 10.1007/s11069-009-9361-8
Transcript of The simulation of heavy rainfall episode over Mumbai: impact of horizontal resolutions and cumulus...

ORI GIN AL PA PER
The simulation of heavy rainfall episode over Mumbai:impact of horizontal resolutions and cumulusparameterization schemes
Sanjib K. Deb Æ C. M. Kishtawal Æ V. S. Bongirwar Æ P. K. Pal
Received: 5 March 2008 / Accepted: 5 February 2009 / Published online: 26 February 2009� Springer Science+Business Media B.V. 2009
Abstract In this study, the simulation of an extreme weather event like heavy rainfall
over Mumbai (India) on July 26, 2005 has been attempted with different horizontal res-
olutions using the Advanced Research Weather Research Forecast model version 2.0.1
developed at the National Center for Atmospheric Research (NCAR), USA. The study uses
the Betts–Miller–Janjic (BMJ) and the Grell–Devenyi ensemble (GDE) cumulus param-
eterization schemes in single and nested domain configurations. The model performance
was evaluated by examining the different predicted parameters like upper and lower level
circulations, moisture, temperature, and rainfall. The large-scale circulation features,
moisture, and temperature were compared with the National Centers for Environmental
Prediction analyses. The rainfall prediction was assessed quantitatively by comparing
rainfall from the Tropical Rainfall Measuring Mission products and the observed station
values reported in the Indian Daily Weather Reports from India Meteorological Depart-
ment (IMD). The quantitative validation of the simulated rainfall was done by calculating
the categorical skill scores like frequency bias, threat scores (TS), and equitable threat
scores (ETS). It is found that in all simulations, both in single and nested domains, the
GDE scheme has outperformed the BMJ scheme for the simulation of rainfall for this
specific event.
Keywords Mumbai rainfall � TRMM rainfall � Cumulus parameterization
1 Introduction
In numerical weather prediction, an accurate timely and location specific prediction is very
important to minimize the loss of lives and damage to property due to strong winds and
heavy precipitations associated with severe or very severe weather systems. For the better
prediction of flash flood, it is necessary to understand the dynamics and physics of isolated
S. K. Deb (&) � C. M. Kishtawal � V. S. Bongirwar � P. K. PalAtmospheric Sciences Division, Meteorology and Oceanography Group, Space Applications Centre,RESA, Indian Space Research Organization, Ahmedabad 380015, Indiae-mail: [email protected]; [email protected]
123
Nat Hazards (2010) 52:117–142DOI 10.1007/s11069-009-9361-8

heavy precipitation and other dynamical features associated with thunderstorms, tornados,
etc. The extreme event becomes a matter of importance only when it comes as nature of a
disaster with heavy loss of life and damage to property. One such phenomenon was the heavy
rainfall episode over Mumbai on July 26, 2005. On that day, within a span of a few hours,
northern Mumbai received unprecedented rainfall, with Santa Cruz recording 94.4 cm of
rainfall for the day and more heavy rainfall of 104.9 cm at Vihar Lake located around 15 Km
northeast of Santa Cruz. Bhandup located southeast of Vihar Lake received 81.5 cm of
rainfall. Colaba in southern Mumbai, on the other hand, received only 7 cm. This event
disrupted life, besides causing heavy damage to property and human life. Prior knowledge of
such an extreme event by a day or a few hours could have minimized the loss of life.
The real-time forecast over Taiwan was carried out by Ching et al. (2005) by studying
the typhoon Nida and a mesoscale convective system (MCS) during May 2004 using MM5
(Dudhia 1993; Grell et al. 1995) and WRF (Skamarock et al. 2005) mesoscale models. It
was found that the timing of the MCS was captured slightly better by the WRF model than
the MM5 model. However, the simulated rainfall amount in the WRF model was not large
enough when compared with the observations. The predicted rainfall amounts in the MM5
were more consistent with the observations. The simulation of a high impact weather event
over Israel was carried out with an observation-nudging-based rapid-cycling four-dimen-
sional data assimilation and forecast (RTFDDA) system implemented in the WRF
modeling (Rostkier-Edelstein et al. 2006) system. The WRF model was used for the
simulation of thunderstorm at Machilipatnam over the east coast of India and a cyclonic
circulation over Kerala (Vaidya 2007), and for the simulation of the extreme rainfall event
of July 26, 2005 over Mumbai (Vaidya and Kulkarni 2007). In United States (US) this
model was used for the prediction of warm season rainfall forecasts over the central US
(Gallus and Bresch 2006). They have carried out a comparison of impacts of the WRF
dynamic core, physics package, and initial conditions on warm season rainfall forecasts.
A series of 15 simulations of weather events occurring in August 2002 were performed
using the WRF model over a domain encompassing most of the central US to compare the
sensitivity of the warm season rainfall forecasts with changes in the model physics,
dynamics, and initial conditions. Chang et al. (2009) had carried out the impact of land
surface parameterizations on the simulation of the July 26, 2005 heavy rain event over
Mumbai, India. Sixteen numerical experiments were designed using two mesoscale
models: the MM5 and the WRF, with three nested domains (30, 10, and 3.33 km grid
spacing), for various land surface schemes and land use/land cover conditions. The study
revealed that the simulations of rainfall using the WRF model was better than the corre-
sponding MM5 model in terms of both location and intensity.
Now-a-days the accuracy and reliability of numerical weather prediction (NWP) have
improved a lot because of advances in numerical techniques for assimilation of satellite
data into the numerical model. However, still some limitations exist in the prediction of
extreme weather events like the Orissa (India) supercyclone (29 October of 1999) over the
Bay of Bengal or the extreme rainfall event of July 26, 2005 over Mumbai (India). Though
some of the state-of-the-art non-hydrostatic and compressible mesoscale models like MM5
[developed by Penn-state University and National Center for Atmospheric Research
(NCAR), USA] have been successfully used for the simulation of extreme events like
tropical cyclones (Mohanty et al. 2004; Mandal et al. 2004; Singh et al. 2005), these
models were not very successful for the prediction of the Mumbai rainfall event in hindcast
mode. The purpose of this study is to examine the performance of the WRF modeling
system for the simulation of the severe rainfall event of July 26, 2005 over Mumbai with
varying horizontal resolutions and cumulus parameterization schemes. These limited
118 Nat Hazards (2010) 52:117–142
123

numbers of experiments will definitely give some clues about the performances of NWP
model over the tropical Indian region.
The present study is organized in the following manner: Section 2 describes the
methodology adopted for this study, which includes three subsections, viz., the synoptic
and observed features related to Mumbai rainfall; the brief description of the model and
experiments design; and the verification procedure. The Sect. 3 describes the results and
discussion. Conclusions are given in Sect. 4.
2 Methodology
2.1 Synoptic and observed features of Mumbai rainfall
Generally, during the active phase of the southwest monsoon in July and August, the
regions lying in the windward side of the Western Ghats (a north–south mountain range in
the western zone of India) like the stations near Konkan and Goa, including Mumbai and
coastal Karnataka (Fig. 1) get heavy rainfall because of the orographic effect (Rao 1976).
The strong westerly moist wind from the Arabian Sea hits the hills of the Western Ghats
and is lifted vertically upward during active monsoon and causes very heavy rainfall there.
During this period, the strong westerly/southwesterly flow over the Arabian Sea also leads
to the formation of offshore trough over the sea off the west coast, causing very heavy
Fig. 1 A map of India showing important landmarks referred in the article
Nat Hazards (2010) 52:117–142 119
123

rainfall activity along the west coast of India, including Mumbai (George 1956). This
westerly/southwesterly wind is also strengthened when the Arabian Sea branch of the
monsoon is active or when a depression/low pressure area forms over the north Bay of
Bengal and moves into Central India. Due to the presence of mid-tropospheric cyclone
(MTC) Gujarat–Konkan coast also experiences very heavy rainfall up to 40 cm. During the
onset phase of the southwest monsoon, heavy rainfall of more than 20 cm is quite common
for Mumbai. Generally it is caused by a convergence of the dry winds from the north with
the advancing moist southwesterly monsoon winds, which are coupled with the develop-
ment of onset vortex either over the Arabian Sea or over the Bay of Bengal. However,
during the active phase of monsoon, some special features of synoptic situation are con-
ducive to the occurrence of very heavy rainfall over Mumbai, viz., the development of a
low pressure area over the northwest Bay of Bengal, the intensification of monsoon trough
and development of embedded convective vortex over the central parts of India, the
strengthening of the Somali Jet, and the super-positioning of a mesoscale off-shore vortex
over the northeast Arabian Sea and its northward movement.
On July 26, 2005, the summer monsoon was active and a low-pressure area was formed
over the north Bay of Bengal on July 24 and became a well marked ‘‘low’’ when it reached
inland. Due to this reason the monsoon trough shifted south of its usual position and a
strong cross-equatorial flow was developed over there. As the cross equatorial flow from
west mixed with the low-level jet, the strengthened westerly winds hit the Konkan and Goa
coasts and caused a very heavy rainfall over these regions. On the next day (July 25), the
rainfall band moved north, and large parts of Maharashtra, including Mumbai, received
heavy rainfall on July 26. Some previous studies (Jayaram 1965; Sharma 1965) have
showed that a diurnal pressure gradient of about 4–8 hPa along the west coast of India
between 15 and 20� N was necessary for the occurrence of a heavy rainfall event in the
Mumbai belt and during the large variation in rainfall over Mumbai, the westerly winds
were of the order of 15–20 m/s with a depth of 3 Km. However, in the present case,
3-hourly surface chart has also shown that the pressure gradient of 4–6 hPa along the west
coast between 15 and 20� N from 00Z to 12Z 26 July (Jenamani et al. 2006); westerly
winds were also of the order of 15–25 m/s with a depth of 5.8 Km. Thus, the synoptic scale
features were highly favorable for the occurrence of heavy rainfall, but the localized nature
of the event and its strong intensity could not be anticipated.
On this day, Santa Cruz recorded 94.4 cm of rainfall, however, even higher rainfall of
104.9 cm was recorded at the Vihar Lake (Jenamani et al. 2006; Shyamala and Bhadram
2006). Although the UK Met Office Model (UKMO) was one of the few models that
predicted up to 80 cm of rainfall in the retrospective mode over a smaller area covering
Mumbai on July 26, 24-h in advance, most of the numerical models, both global and
mesoscale, failed to simulate this catastrophic event in operational as well as in hindcast
mode (Bohra et al. 2006). Here, an attempt has been made to simulate this event using the
WRF model with varying grid resolution and different cumulus parameterization schemes.
In this regard, a study by Vaidya (2006) using the Kain–Fritsch (KF) and the Betts–Miller–
Janjic (BMJ) cumulus schemes in the Atmospheric Regional Prediction System (ARPS)
model had shown that the different tropical events like low-pressure area, monsoon
depression, and tropical cyclones are sensitive to the different cumulus schemes.
2.2 The WRF model and experimental design
The mesoscale model used in this study is the Advanced Research Weather Research Forecast
(WRF-ARW) model version 2.0.1 developed primarily at NCAR with collaboration of
120 Nat Hazards (2010) 52:117–142
123

different agencies like the National Oceanic and Atmospheric Administration (NOAA), the
National Centers for Environmental Prediction (NCEP), the NOAA’s Earth System Research
Laboratory (NESRL), University of Oklahoma, and many others. The development of the
WRF modeling system is to serve both operational forecasting and atmospheric research (
http://www.wrf-model.org). The WRF is a limited area, non-hydrostatic primitive equation
model with multiple options for various physical parameterization schemes (Skamarock
et al. 2005). The terrain following hydrostatic pressure with vertical grid stretching (r) is
followed in vertical. The vertical co-ordinate is defined as r = (ph - pht)/l , where
l = phs - pht, ph is the hydrostatic component of the pressure, and phs and pht refer to the
values along the surface and top boundaries, respectively. The value of r is 1 at the surface to 0
at the upper boundary of the model domain. This vertical co-ordinate is also called as a mass
vertical coordinate. Due to the meteorological complexities involved in simulating and
forecasting the heavy rainfall occurrences over a tropical region, use of the WRF modeling
system, both in single and in a nested configuration, has been selected for the present study. In
this study, the performance of the WRF model for the simulation of this excessive rainfall
event over Mumbai has been attempted using two cumulus parameterization schemes, the
Betts–Miller–Janjic (Janjic 1994, 2000) and the Grell–Devenyi ensemble (Grell and Devenyi
2002) schemes. The other different dynamical and physical options used in this study are
given in Table 1.
The Betts–Miller–Janjic (BMJ) scheme is a convective adjustment scheme and it is
derived from the original Betts and Miller (1986) adjustment scheme. In the BMJ scheme,
the deep convection profiles and the relaxation time are variables and they depend on the
cloud efficiency, a non-dimensional parameter, that characterizes the convective regime
(Janjic 1994). The cloud efficiency depends on the entropy change, precipitation, and mean
temperature of the cloud. The shallow convection moisture profile is derived from the
requirement that the entropy change be small and non-negative (Janjic 1994). Some
attempts have been made to refine the scheme for higher horizontal resolutions, primarily
through modifications of the triggering mechanism. In particular, a floor value for the
entropy change in the cloud is set up below which the deep convection is not triggered; in
searching for the cloud top, the ascending particle mixes with the environment, and the
work of the buoyancy force on the ascending particle is required to exceed a prescribed
Table 1 A summary of characteristics of the WRF model
S. No. Characteristic feature WRF
1 Nesting option used Nest: 10 Km inner and 30 Km outer
2 Vertical coordinate rp Terrain following mass vertical coordinate (Laprise 1992)
3 Horizontal grid Arakawa C-grid
4 Time integration scheme Third-order Runga–Kutta scheme
5 Microphysics Single-moment 6-class graupel (WSM6) microphysics scheme
6 Convection Grell–Devenyi ensemble scheme (Grell and Devenyi 2002)and Betts–Miller–Janjic (Janjic 1994, 2000)
7 Radiation Rapid radiative transfer model (RRTM), Mlawer et al. (1997)for longwave and Dudhia (1989) for shortwave.
8 Planetary boundary layer (PBL) MRF (Medium Range Forecast) Scheme, (Hong and Pan 1996)
9 Land surface model Noah-LSM (Chen and Dudhia 2001)
Nat Hazards (2010) 52:117–142 121
123
positive threshold. The Grell–Devenyi ensemble (GDE) cumulus parameterization scheme
consists of an ensemble of cumulus scheme in which multiple schemes are run within each
grid box and the results are averaged to give the feedback of the model. All cumulus
schemes in the GDE scheme are of mass–flux nature, differing in updraft and downdraft
with entrainment and detrainment parameters, and precipitation efficiencies. The dynamic
control closures are based on either convective available potential energy (CAPE), or low-
level vertical velocity, or moisture convergence. Those based on CAPE either balance the
rate of change of CAPE or relax the CAPE to a climatological value and those based on
moisture convergence balances the cloud rainfall to the integrated vertical advection of
moisture.
For this study, eight experiments were designed, viz., S20BMJ, S20GDE, S10BMJ,
S10GDE, N30BMJ, N10BMJ, N30GDE, and N10GDE, respectively (Table 2). Out of
which S20BMJ, S20GDE, S10BMJ, and S10GDE were in single domains with 20 and
10 Km resolutions using the GDE and the BMJ cumulus parameterization schemes having
179 9 150 grid points, covering the regions [58� E–91� E, 1� N–28� N] and [66�E–83� E, 12� N–25� N], respectively. The remaining were two-way nested domains
experiments with 30 Km outer and 10 Km inner resolutions, using the same cumulus
schemes (constituted another four sets of results) used for the single domain experiments,
having 179 9 150 and 270 9 225 grid points in outer and inner domains, covering the
areas [49� E–100� E, 2� S–36� N] and [62� E–87� E, 7� N–27� N], respectively. In the
two-way nesting: first, the inner (fine) grid boundary conditions (i.e., the lateral bound-
aries) are interpolated from the outer (coarse) grid forecast, and later, the inner (fine) grid
solution replaces the outer (coarse) grid solution for those grid points that lie inside the
inner (fine) grid. This information exchanges between the grids in both the directions
(coarse-to-fine and fine-to-coarse). Hence, the name is two-way nesting. In the vertical, the
model has 31 vertical layers with the top model layer at 50 hPa. For each simulation, 48 h
integration was started from 00 GMT July 25, 2005. The NCEP FNL (final analysis)
1� 9 1� 6-hourly data were used for preparing both initial and boundary conditions for the
model integrations.
2.3 Verification procedure
The rainfall is one of the most important parameters for the tropical weather systems. Apart
from the ground-based observations from IMD, the Tropical Rainfall Measuring Mission
(TRMM) rainfall was used to verify the simulated rainfall. TRMM is a joint mission
between NASA and the Japan Aerospace Exploration Agency (JAXA) to monitor tropical
Table 2 Design of the different experiments
S. No. Experiments Domain type Resolution (Km) Cumulus schemes
1 S20BMJ Single 20 Betts–Miller–Janjic (BMJ)
2 S20GDE Grell–Devenyi-ensemble (GDE)
3 S10BMJ 10 BMJ
4 S10GDE GDE
5 N30BMJ Nested (Outer) 30 BMJ
6 N30GDE GDE
7 N10BMJ Nested (Inner) 10 BMJ
8 N10GDE GDE
122 Nat Hazards (2010) 52:117–142
123

and subtropical precipitation and to estimate its associated latent heating. TRMM provides
systematic visible, infrared, and microwave measurements of rainfall in the tropics as key
inputs to weather and climate research. The NCEP Global Data Assimilation System
(GDAS) analyses were used to verify the simulated large-scale circulations pattern,
moisture, and relative humidity fields. The precipitation fields are generally verified by the
categorical skill score method, where forecast are varied against the occurrence or non-
occurrence of specific categories of the predicted rainfall (Gandin and Murphy 1992). The
common methods of categorical verification of the precipitation fields are based on the
calculation of frequency bias B, threat score (TS), and equitable threat score (ETS). The
area frequency bias B is defined as B = F/O, where F is the number of stations for which
the model predicted rainfall amount exceeded a certain threshold and O is the number of
stations that recorded at least the selected threshold. The TS and the ETS are defined as
TS ¼ CF
F þ O� CF
and
ETS ¼ CF � R
F þ O � CF � R;
where R is a random forecast defined as the product of F and O, divided by the total
number of N of verified stations: R = FO/N and CF is the number of points where the
rainfall from model forecast is equal to the observed one (Correct Forecast). The ETS is
equivalent to TS with a correction to remove the frequency bias from the random hits.
These statistical measures are used extensively for the evaluation of model forecast pre-
cipitation (Mesinger 1996; Lagouvardos et al. 2003; Mazarakis et al. 2006). The
quantitative analysis of the simulated rainfall is carried out by calculating the frequency
bias, TS, and ETS for the day 2, i.e., second 24 h of simulation in all the cases with respect
to the TRMM rainfall. Apart from rainfall, the analysis of the simulated circulation features
(850 and 300 hPa winds), thermal, and moisture fields were also discussed.
3 Results and discussion
Four sets of forecast results were obtained in each cumulus scheme for different resolutions
(Table 2). The purpose of this study is to see the impact of two cumulus parameterization
schemes in the WRF model for the simulation of this extreme rainfall event. Initially, the
observed features, viz., large-scale upper and lower level circulation, moisture, and thermal
structure from the NCEP GDAS analyses, ground-based observed rainfall from IMD and
gridded observed rainfall from the TRMM were analyzed. Later, the performance of each
scheme was presented here with respect to the upper- and lower-level wind, rainfall,
moisture fields, and their thermal structure.
On July 26, 2005, the summer monsoon over major parts of the country particularly
over the west coast and the peninsular India was active and a low-pressure area formed
over the North Bay off Gangetic West Bengal and Orissa coast on July 24 and becomes a
well-marked low when it reached inland. Due to this reason, the monsoon trough moved
south of its normal position and a strong cross-equatorial flow was developed. As the cross-
equatorial flow moved to the west and mixed with low-level jet and strengthened the
westerly wind, which hits the Konkan and Goa coasts, it resulted in heavy rainfall over
Nat Hazards (2010) 52:117–142 123
123
these regions. On the next day (25 July), the rainfall band moved north and large parts of
Maharashtra, including Mumbai, received heavy rainfall on July 26. Both the lower- and
upper-level large-scale flow pattern over the Indian region were analyzed with 850 and
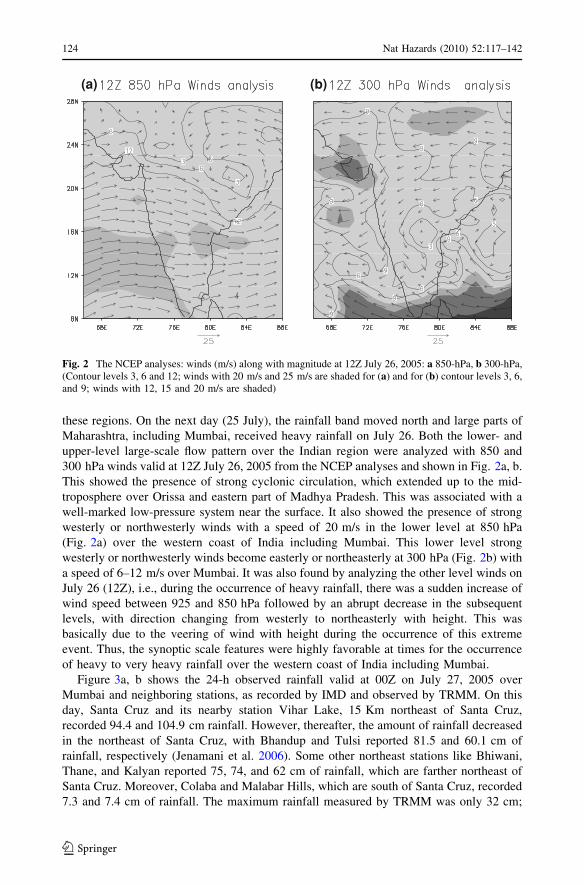
300 hPa winds valid at 12Z July 26, 2005 from the NCEP analyses and shown in Fig. 2a, b.
This showed the presence of strong cyclonic circulation, which extended up to the mid-
troposphere over Orissa and eastern part of Madhya Pradesh. This was associated with a
well-marked low-pressure system near the surface. It also showed the presence of strong
westerly or northwesterly winds with a speed of 20 m/s in the lower level at 850 hPa
(Fig. 2a) over the western coast of India including Mumbai. This lower level strong
westerly or northwesterly winds become easterly or northeasterly at 300 hPa (Fig. 2b) with
a speed of 6–12 m/s over Mumbai. It was also found by analyzing the other level winds on
July 26 (12Z), i.e., during the occurrence of heavy rainfall, there was a sudden increase of
wind speed between 925 and 850 hPa followed by an abrupt decrease in the subsequent
levels, with direction changing from westerly to northeasterly with height. This was
basically due to the veering of wind with height during the occurrence of this extreme
event. Thus, the synoptic scale features were highly favorable at times for the occurrence
of heavy to very heavy rainfall over the western coast of India including Mumbai.
Figure 3a, b shows the 24-h observed rainfall valid at 00Z on July 27, 2005 over
Mumbai and neighboring stations, as recorded by IMD and observed by TRMM. On this
day, Santa Cruz and its nearby station Vihar Lake, 15 Km northeast of Santa Cruz,
recorded 94.4 and 104.9 cm rainfall. However, thereafter, the amount of rainfall decreased
in the northeast of Santa Cruz, with Bhandup and Tulsi reported 81.5 and 60.1 cm of
rainfall, respectively (Jenamani et al. 2006). Some other northeast stations like Bhiwani,
Thane, and Kalyan reported 75, 74, and 62 cm of rainfall, which are farther northeast of
Santa Cruz. Moreover, Colaba and Malabar Hills, which are south of Santa Cruz, recorded
7.3 and 7.4 cm of rainfall. The maximum rainfall measured by TRMM was only 32 cm;
(a) (b)
Fig. 2 The NCEP analyses: winds (m/s) along with magnitude at 12Z July 26, 2005: a 850-hPa, b 300-hPa,(Contour levels 3, 6 and 12; winds with 20 m/s and 25 m/s are shaded for (a) and for (b) contour levels 3, 6,and 9; winds with 12, 15 and 20 m/s are shaded)
124 Nat Hazards (2010) 52:117–142
123

Fig. 3 Twenty four-hour cumulative rainfall (cm) valid at 03Z July 27, 2005 observed by a IMD atdifferent stations near Mumbai and b TRMM
Nat Hazards (2010) 52:117–142 125
123
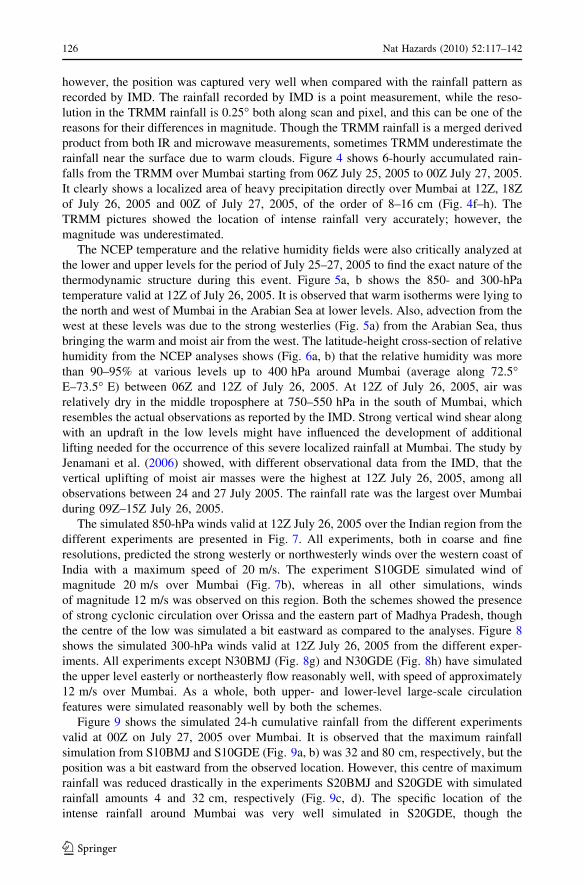
however, the position was captured very well when compared with the rainfall pattern as
recorded by IMD. The rainfall recorded by IMD is a point measurement, while the reso-
lution in the TRMM rainfall is 0.25� both along scan and pixel, and this can be one of the
reasons for their differences in magnitude. Though the TRMM rainfall is a merged derived
product from both IR and microwave measurements, sometimes TRMM underestimate the
rainfall near the surface due to warm clouds. Figure 4 shows 6-hourly accumulated rain-
falls from the TRMM over Mumbai starting from 06Z July 25, 2005 to 00Z July 27, 2005.
It clearly shows a localized area of heavy precipitation directly over Mumbai at 12Z, 18Z
of July 26, 2005 and 00Z of July 27, 2005, of the order of 8–16 cm (Fig. 4f–h). The
TRMM pictures showed the location of intense rainfall very accurately; however, the
magnitude was underestimated.
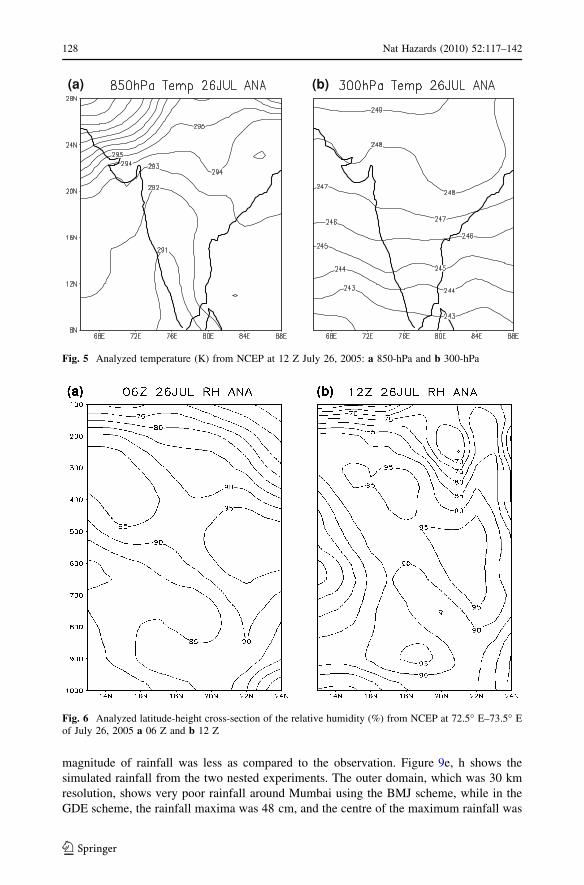
The NCEP temperature and the relative humidity fields were also critically analyzed at
the lower and upper levels for the period of July 25–27, 2005 to find the exact nature of the
thermodynamic structure during this event. Figure 5a, b shows the 850- and 300-hPa
temperature valid at 12Z of July 26, 2005. It is observed that warm isotherms were lying to
the north and west of Mumbai in the Arabian Sea at lower levels. Also, advection from the
west at these levels was due to the strong westerlies (Fig. 5a) from the Arabian Sea, thus
bringing the warm and moist air from the west. The latitude-height cross-section of relative
humidity from the NCEP analyses shows (Fig. 6a, b) that the relative humidity was more
than 90–95% at various levels up to 400 hPa around Mumbai (average along 72.5�E–73.5� E) between 06Z and 12Z of July 26, 2005. At 12Z of July 26, 2005, air was
relatively dry in the middle troposphere at 750–550 hPa in the south of Mumbai, which
resembles the actual observations as reported by the IMD. Strong vertical wind shear along
with an updraft in the low levels might have influenced the development of additional
lifting needed for the occurrence of this severe localized rainfall at Mumbai. The study by
Jenamani et al. (2006) showed, with different observational data from the IMD, that the
vertical uplifting of moist air masses were the highest at 12Z July 26, 2005, among all
observations between 24 and 27 July 2005. The rainfall rate was the largest over Mumbai
during 09Z–15Z July 26, 2005.
The simulated 850-hPa winds valid at 12Z July 26, 2005 over the Indian region from the
different experiments are presented in Fig. 7. All experiments, both in coarse and fine
resolutions, predicted the strong westerly or northwesterly winds over the western coast of
India with a maximum speed of 20 m/s. The experiment S10GDE simulated wind of
magnitude 20 m/s over Mumbai (Fig. 7b), whereas in all other simulations, winds
of magnitude 12 m/s was observed on this region. Both the schemes showed the presence
of strong cyclonic circulation over Orissa and the eastern part of Madhya Pradesh, though
the centre of the low was simulated a bit eastward as compared to the analyses. Figure 8
shows the simulated 300-hPa winds valid at 12Z July 26, 2005 from the different exper-
iments. All experiments except N30BMJ (Fig. 8g) and N30GDE (Fig. 8h) have simulated
the upper level easterly or northeasterly flow reasonably well, with speed of approximately
12 m/s over Mumbai. As a whole, both upper- and lower-level large-scale circulation
features were simulated reasonably well by both the schemes.
Figure 9 shows the simulated 24-h cumulative rainfall from the different experiments
valid at 00Z on July 27, 2005 over Mumbai. It is observed that the maximum rainfall
simulation from S10BMJ and S10GDE (Fig. 9a, b) was 32 and 80 cm, respectively, but the
position was a bit eastward from the observed location. However, this centre of maximum
rainfall was reduced drastically in the experiments S20BMJ and S20GDE with simulated
rainfall amounts 4 and 32 cm, respectively (Fig. 9c, d). The specific location of the
intense rainfall around Mumbai was very well simulated in S20GDE, though the
126 Nat Hazards (2010) 52:117–142
123

Fig
.4
Six
hourl
yac
cum
ula
ted
rain
fall
(cm
)fr
om
the
TR
MM
:Ju
ly25,
2005
a0
6Z
,b
12
Z,
c1
8Z
,Ju
ly2
6,
20
05
d0
0Z
,e
06
Z,
f1
2Z
,g
18
Z,
and
h0
0Z
July
27
,2005
resp
ecti
vel
y.
(Conto
ur
level
s1
,2
,4
,8
,16,
32,
and
48)
Nat Hazards (2010) 52:117–142 127
123
magnitude of rainfall was less as compared to the observation. Figure 9e, h shows the
simulated rainfall from the two nested experiments. The outer domain, which was 30 km
resolution, shows very poor rainfall around Mumbai using the BMJ scheme, while in the
GDE scheme, the rainfall maxima was 48 cm, and the centre of the maximum rainfall was
(a) (b)
Fig. 5 Analyzed temperature (K) from NCEP at 12 Z July 26, 2005: a 850-hPa and b 300-hPa
Fig. 6 Analyzed latitude-height cross-section of the relative humidity (%) from NCEP at 72.5� E–73.5� Eof July 26, 2005 a 06 Z and b 12 Z
128 Nat Hazards (2010) 52:117–142
123

(a)
(b)
(c)
(d)
(e)
(f)
(g)
(h)
Fig
.7
Th
esi
mu
late
d8
50
-hP
aw
ind
s(m
/s)
alo
ng
wit
hm
agn
itu
de
val
idat
12
ZJu
ly2
6,
20
05
fro
mth
ed
iffe
ren
tex
per
imen
ts:
aS
10B
MJ,
bS
10G
DE
,c
S2
0B
MJ,
dS
20G
DE
,e
N1
0B
MJ,
fN
10
GD
E,
gN
30
BM
J,an
dh
N30G
DE
.(C
onto
ur
level
s3
,6
,an
d12;
win
ds
wit
h20
and
25
m/s
are
shad
ed)
Nat Hazards (2010) 52:117–142 129
123

(a)
(b)
(c)
(d)
(e)
(f)
(g)
(h)
Fig
.8
Th
esi
mu
late
d3
00
-hP
aw
inds
(m/s
)al
ong
wit
hm
agn
itu
de
val
idat
12
ZJu
ly2
6,
20
05
fro
mth
ed
iffe
ren
tex
per
imen
ts:
aS
10
BM
J,b
S1
0G
DE
,c
S2
0B
MJ,
dS
20G
DE
,e
N10B
MJ,
fN
10
GD
E,
gN
30
BM
J,an
dh
N30G
DE
.(C
onto
ur
level
s3,
6,
and
9;
win
ds
wit
h12,
15,
and
20
are
shad
ed)
130 Nat Hazards (2010) 52:117–142
123

(a)
(e)
(b)
(f)
(c)
(g)
(d)
(h)
Fig
.9
Sim
ula
ted
24-h
our
cum
ula
tive
rain
fall
(cm
)val
idat
00Z
July
27,
2005
from
the
dif
fere
nt
exper
imen
ts:
aS
10B
MJ,
bS
10G
DE
,c
S2
0B
MJ,
dS
20G
DE
,e
N1
0B
MJ,
fN
10
GD
E,
gN
30
BM
J,an
dh
N3
0G
DE
.(C
onto
ur
lev
els
1,
2,
4,
8,
16
,3
2,
48
,6
4,
80
,an
d9
6)
Nat Hazards (2010) 52:117–142 131
123
also moved southward from the actual position (Fig. 9g, h). Both the schemes simulated
unrealistic rainfall along the Western Ghats in all experiments. However, in the inner
domain, simulated rainfall pattern from the GDE scheme (Fig. 9f) around Mumbai
resembles well with the observation with maximum rainfall of 80 cm as compared with the
BMJ scheme (Fig. 9e) where maximum rainfall was only 8–16 cm. Though the N10GDE
has simulated the maximum rainfall of 96 cm, but its centre of maximum was 50 Km south
of its actual position. In the BMJ scheme, the centre of maximum was shifted southward
and both the schemes simulated unrealistic rainfall along the Western Ghats. This clearly
indicates that the GDE scheme has outperformed the BMJ scheme in all experiments,
either in coarse or fine resolutions. The coarse resolutions experiments S20BMJ and
N30BMJ have not simulated the observed features of rainfall. It is found from the simu-
lated 24-h cumulative rainfall for July 26, 2005 that fine resolution (10 Km) experiments
have been able to reproduce the observed features quite well as compared to their coarse
resolution counterpart.
The simulated 6-hourly cumulative rainfall from the fine resolution experiments
S10BMJ, S10GDE, N10BMJ, and N10GDE were analyzed and a qualitative comparison
with the TRMM merged rainfall was carried out. The simulated 6-hourly cumulative
rainfall from S10BMJ, S10GDE, N10BMJ, and N10GDE valid at 06Z, 12Z, and 18Z July
26, 2005 and 00Z July 27, 2006 are shown in Figs. 10 and 11, respectively. The structure
and pattern of the simulated rainfall using the GDE scheme resembles well with the
TRMM observation, but the BMJ scheme has not simulated the observed pattern of rainfall
accurately at 06Z July 26, 2005. The structure of rainfall in S10GDE was simulated more
accurately as compared to N10GDE, where the centre of maximum was slightly shifted
southward. This might be due to the interaction of N10GDE with N30GDE in the nested
experiment, where the error from 30 Km resolution has transferred to 10 Km inner domain
during the model integration through boundaries. At 12Z, both the schemes have simulated
realistically a localized area of heavy precipitation around Mumbai. The quantum of
rainfall predicted by the GDE scheme was around 16 cm in both S10GDE and N10GDE,
which was more realistic as compared to 8 cm for S10BMJ and 4 cm for N10BMJ. The
S10GDE and N10GDE have also simulated unrealistic rainfall along the Western Ghats
both on 06Z and 12Z. At 18Z, the GDE scheme has overestimated the rainfall, but both the
schemes have simulated the localized area of very heavy rainfall over Mumbai. TRMM
shows rainfall of around 16 cm at 00Z July 27, 2005 over Mumbai and in the simulation
using the GDE scheme also showed very heavy precipitating zone there in both S10GDE
(Fig. 10g) and N10GDE (Fig. 11g). However, the BMJ scheme has failed to capture such
intense rainfall at 00Z 27 July (Figs. 10h, 11h). One of the major limitations of all sim-
ulations was that none of the schemes either at coarser or finer domains have been able to
simulate the observed rainfall over the northwestern part of India.
Figure 12a shows the 6-hourly cumulative maximum rainfall time series from the
different experiments. It is seen from the figure that the experiments N10GDE, N30GDE,
and S10GDE have captured the observed episodic nature of heavy rainfall quite well. The
position of the simulated maximum was a bit east of actual maximum in the case of
S10GDE, while it was south in the case of N10GDE and N30GDE. Since in the two-way
nesting the inner (fine) grid forecast replaces the outer (coarse) grid forecast for those grid
points that lie inside the inner (fine) grid, so the rainfall maxima time series of N30GDE
was not very different from that of N10GDE. The experiments S20GDE and S10BMJ have
also tried to simulate the observed increasing trends, however, failed to pickup the
observed strength. However, none of the other experiments using the BMJ scheme has
been able to simulate the observed features. The frequency bias for the last 24-h simulation
132 Nat Hazards (2010) 52:117–142
123

(a)
(e)
(b)
(f)
(c)
(g)
(d)
(h)
Fig
.1
0T
he
sim
ula
ted
6-h
ou
rly
cum
ula
tive
rain
fall
(cm
)v
alid
at0
6Z
July
26
,2
00
5to
00
ZJu
ly2
7,
20
05
from
S1
0B
MJ
and
S1
0G
DE
.(C
onto
ur
lev
els
1,
2,
4,
8,
16
,3
2,
and
48
)
Nat Hazards (2010) 52:117–142 133
123

(a)
(e)
(b)
(f)
(c)
(g)
(d)
(h)
Fig
.1
1T
he
sim
ula
ted
6-h
ourl
ycu
mu
lati
ve
rain
fall
(cm
)v
alid
at0
6Z
July
26
,2
00
5to
00
ZJu
ly2
7,
20
05
from
N1
0B
MJ
and
N1
0G
DE
.(C
onto
ur
lev
els
1,
2,
4,
8,
16
,3
2,
and
48
)
134 Nat Hazards (2010) 52:117–142
123

for the different rainfall threshold (in mm) is shown in Fig. 12b. It is clearly visible from
the figure that frequency bias scores in the BMJ scheme was around 1 (the perfect score) in
all the precipitation threshold up to 200 mm rainfall threshold. In the GDE scheme, except
for rainfall threshold 15 of mm, the bias score was always [1. This shows that the GDE
scheme has a tendency to enlarge the forecast precipitation areas. The TS values (Fig. 12c)
for the GDE scheme was higher when compared to the BMJ scheme for all precipitation
thresholds up to 200 mm. This shows that the performance of the GDE scheme was better
BIAS for different precipitaion thresholds
0
1
2
3
4
5
6
7
8
0 20 40 60 80 100 120 140 160 180 200
Threshold (mm)
BIA
S
N10BMJ N10GDE
S10BMJ S10GDE
S20BMJ S20GDE
N30BMJ N30GDE
Rainfall Time series(a)
(b)
0
10
20
30
40
50
60
70
80
90
100
26_0
6Z
26_1
2Z
26_1
8Z
27_0
0ZTime
rain
fall
(cm
)
Santacruz (SCZ) Coloba(CLB)S10BMJ S10GDES20BMJ S20GDEN10BMJ N10GDEN30BMJ N30GDE
Fig. 12 a Time series of 6-hourly cumulative maximum rainfall from different experiments andcorresponding observed rainfall recorded at Santa Cruz and Colaba. b Bias score for various precipitationthreshold (mm) for last 24 h forecasts from the different experiments. c Same as in (b) but for threat score.d Same as in (b) but for ETS
Nat Hazards (2010) 52:117–142 135
123

when compared to the BMJ scheme for the precipitation up to 200 mm. It is also noted
from the Fig. 12b and c that high bias has helped for the TS values for higher precipitation
thresholds in the experiments N10GDE, S10GDE, S20GDE, and N30GDE, respectively.
The equitable TS for the last 24-h simulation for the different thresholds are also shown in
Fig. 12d. The experiment S10GDE has shown a maximum score of 0.53 at 10 mm rainfall
threshold, which then decreases gradually, while S10BMJ has shown scores of 0.30 at the
same threshold. At all precipitation thresholds up to 200 mm, the S10GDE has outper-
formed the S10BMJ simulations. The outer (N30GDE) and inner (N10GDE) domains of
the GDE scheme have also shown maximum scores of 0.27 and 0.32 at 10 mm rainfall
threshold, while the corresponding BMJ scheme has shown a maximum score of 0.32 at
10 mm threshold in the inner domain (N10BMJ) and 0.30 at 30 mm threshold in the outer
domain (N30BMJ), respectively. In the experiment S20GDE, the maximum score was 0.36
at 10 mm threshold, while the corresponding S20BMJ has a maximum score of 0.27 at this
threshold. Except N30BMJ, in all the cases, the ETS score was higher in the GDE scheme
when compared with the corresponding experiments with the BMJ scheme for all
Threat Score (TS) for different precipitation thresholds
0
0.1
0.2
0.3
0.4
0.5
0.6
0.7
0.8
Th
reat
Sco
re
N10BMJ N10GDE
S10BMJ S10GDE
S20BMJ S20GDE
N30BMJ N30GDE
ETS for different precipitation thresholds(d)
(c)
0
0.1
0.2
0.3
0.4
0.5
0.6
ET
S
N10BMJ N10GDE
S10BMJ S10GDE
S20BMJ S20GDE
N30BMJ N30GDE
0 20 40 60 80 100 120 140 160 180 200
Threshold (mm)
0 20 40 60 80 100 120 140 160 180 200
Threshold (mm)
Fig. 12 continued
136 Nat Hazards (2010) 52:117–142
123

precipitation thresholds. Quantitatively, as a whole, the simulation using the GDE scheme
was better as compared to the BMJ scheme for this specific case, though both the schemes
have failed to simulate the exact location of intense rainfall over Mumbai.
The simulated 850-hPa temperature valid for 12Z July 26, 2005 (Fig. 13) from all the
experiments resembles well with the observed features. It is observed that the structure of
the isotherms was almost the same in all the experiments except some small scale features
were simulated in fine resolution (viz. 10 Km) experiments (Fig. 13a, b, e, f). The simu-
lated 300-hPa temperatures valid for 12Z July 26, 2005 (Fig. 14) also show the warmer
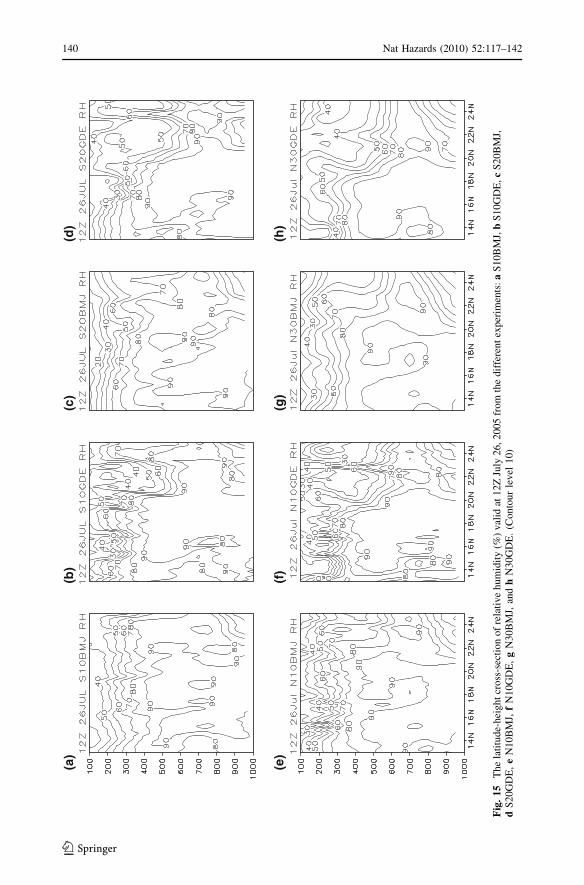
isotherm in the upper level when compared with the NCEP analysis. Figure 15 represents
the simulated latitude-height cross-section of relative humidity from the different experi-
ments around Mumbai (average along 72.5� E–73.5� E) for 12Z July 26, 2005. All
experiments have simulated the observed features of relative humidity reasonably well at
different resolutions. The fine resolution experiments like S10BMJ, S10GDE, N10BMJ,
and N10GDE (Fig. 15a, b, e, f) were showing very high relative humidity, maximum up to
95%, through out 400-hPa over Mumbai. One interesting feature was that vertical area
covering more than 95% relative humidity was more in all experiments using the GDE
scheme than the corresponding experiments using the BMJ scheme. This shows that the
GDE scheme is more sensitive to the tropical extreme event like the Mumbai rainfall of
July 26, 2005.
4 Conclusions
A qualitative assessment of the simulation of unprecedented rainfall event of July 26, 2005
over Mumbai has attempted with the WRF model at different resolutions both in single and
nested domains using the BMJ and GDE schemes. The large-scale circulation features
including moisture and temperature patterns both at upper- and lower-level in all simu-
lations resemble well with the NCEP analyses. The localized heavy precipitation around
Mumbai was not captured very well using both the schemes, but in 20 Km, the GDE
scheme (S20GDE) has simulated the observed rainfall structure around Mumbai. However,
the simulated rainfall in the GDE scheme has come very close to the observation in the
10 km resolution of single domain and nested domains experiments both inner (10 Km)
and outer (30 Km), though there were some differences in their actual positions. The GDE
scheme has outperformed the BMJ scheme in all experiments for the simulation of rainfall
both in fine as well as coarse resolution. The dynamic control of the GDE scheme is based
on CAPE or low-level moisture convergence, and finer grid results from this scheme
matched well with the observations. Though, CAPE or low-level moisture convergence
play important role in the development of convection anywhere in the globe, however, its
influence in the tropical convection is very crucial. Thus, it might be concluded that the
CAPE and low-level moisture convergence might be one of the factors responsible for the
high vertical instability of the atmosphere around Mumbai on this extreme event. Probably,
the most encouraging aspect of this study is the very significant forecast skill displayed,
though in hindcast mode, on the very complex system of extreme rainfall event of Mumbai,
in the WRF model with the GDE scheme with 10-Km horizontal resolution both in single
and nested domain within 30–50 Km east of actual position. This was a very preliminary
attempt with the WRF model and further testing of more case studies with higher and
improved version of the WRF model as well as incorporation of different satellite data,
Doppler Radar data, through the WRF data assimilation system is required. Although the
above conclusions are based on very limited number of experiments, this study can provide
Nat Hazards (2010) 52:117–142 137
123

(a)
(e)
(b)
(f)
(c)
(g)
(d)
(h)
Fig
.1
3T
he
85
0h
Pa
sim
ula
ted
tem
per
atu
re(K
)v
alid
at1
2Z
July
26
,2
00
5fr
om
the
exp
erim
ent
aS
10B
MJ,
bS
10G
DE
,c
S2
0B
MJ
and
dS
20G
DE
(up
per
pa
nel
);e
N1
0B
MJ,
fN
10
GD
E,
gN
30B
MJ,
and
hN
30
GD
E(l
ow
erp
an
el).
(Co
nto
ur
lev
el1
.5)
138 Nat Hazards (2010) 52:117–142
123

(a)
(e)
(b)
(f)
(c)
(g)
(d)
(h)
Fig
.1
4T
he
30
0h
Pa
sim
ula
ted
tem
per
atu
re(K
)v
alid
at1
2Z
July
26
,2
00
5fr
om
the
exp
erim
ent
aS
10B
MJ,
bS
10
GD
E,
cS
20
BM
Jan
dd
S2
0G
DE
(up
per
pa
nel
);e
N1
0B
MJ,
fN
10
GD
E,
gN
30
BM
J,an
dh
N3
0G
DE
(lo
wer
pa
nel
).(C
onto
ur
lev
el1
)
Nat Hazards (2010) 52:117–142 139
123
(a)
(e)
(b)
(f)
(c)
(g)
(d)
(h)
Fig
.1
5T
he
lati
tud
e-h
eig
ht
cro
ss-s
ecti
on
of
rela
tiv
eh
um
idit
y(%
)v
alid
at1
2Z
July
26
,2
00
5fr
om
the
dif
fere
nt
exp
erim
ents
:a
S1
0B
MJ,
bS
10
GD
E,
cS
20
BM
J,d
S2
0G
DE
,e
N1
0B
MJ,
fN
10
GD
E,
gN
30B
MJ,
and
hN
30
GD
E.
(Co
nto
ur
lev
el1
0)
140 Nat Hazards (2010) 52:117–142
123

some insight to the WRF model users over the Indian region and prompt the modeling
community to pursue and evaluate real-time quantitative precipitation forecasting.
Acknowledgments The authors thank the two anonymous reviewers for their critical and insightfulcomments/valuable suggestions, which were helpful in substantially improving the content and quality ofthe presentation of this manuscript. The author also acknowledges the use of the WRF model, which isavailable on Internet, by NCEP/NCAR and the WRF User Support Group for useful suggestions during themodel installation. The use of reanalyzed data by the NCEP/NCAR, the TRMM rainfall maps fromhttp://trmm.gsfc.nasa.gov, the rainfall maps from the IMD are thankfully acknowledged. The Director,Space Applications Centre (SAC), the Deputy Director, RESA SAC, and the Head ASD/MOG SAC ISROAhmedabad are thanked for their encouragement and help.
References
Betts AK, Miller MJ (1986) A new convective adjustment scheme. Part-II: single column tests using GATEwave, BOMEX, and arctic air-mass data sets. Q J R Meteorol Soc 112:693–709
Bohra AK, Basu S, Rajagopal EN, Iyengar GR, Das Gupta M, Ashrit R, Athiyaman B (2006) Heavy rainfallepisode over Mumbai on 26 July 2005: assessment of NWP guidance. Curr Sci 90(9):1188–1194
Chang HI, Kumarl A, Niyogi D, Mohanty UC, Chen F, Dudhia J (2009) The role of land surface processeson the mesoscale simulation of the July 26, 2005 heavy rain event over Mumbai, India. Glob PlanetChange. doi:10.1016/j.gloplacha.2008.12.005
Chen F, Dudhia J (2001) Coupling an advanced land-surface/hydrology model with the Penn State/NCARMM5 modeling system. Part-I: model description and implementation. Mon Weather Rev 129:569–585.doi:10.1175/1520-0493(2001)129\0569:CAALSH[2.0.CO;2
Ching FC, Jou BJD, Lin PL, Hong JS (2005) A real-time MM5/WRF forecasting system in Taiwan.www.mmm.ucar.edu/MM5/workshops/ws04/PosterSession/Chien.Fang-Ching.pdf
Dudhia J (1989) Numerical study of convection observed during the winter monsoon experiment using a meso-scale two-dimensional model. J Atmos Sci 46:3077–3107. doi:10.1175/1520-0469(1989)046\3077:NSOCOD[2.0.CO;2
Dudhia J (1993) A non-hydrostatic version of the Penn State/NCAR mesoscale model: validation tests andsimulation of an Atlantic cyclone and cold front. Mon Weather Rev 121:1493–1513. doi:10.1175/1520-0493(1993)121\1493:ANVOTP[2.0.CO;2
Gallus WA Jr, Bresch J (2006) Comparison of impacts of WRF dynamic core, physics package, and initialconditions on warm season rainfall forecasts. Mon Weather Rev 134:2632–2641. doi:10.1175/MWR3198.1
Gandin LS, Murphy AH (1992) Equitable skill scores for categorical forecasts. Mon Weather Rev 120:361–370.doi:10.1175/1520-0493(1992)120\0361:ESSFCF[2.0.CO;2
George PA (1956) Effect of off-shore vortices on rainfall along the west coast of India. Indian J MeteorolGeophys 7:225–240
Grell GJ, Devenyi D (2002) A generalized approach to parameterizing convection combining ensemble anddata assimilation technique. Geophys Res Lett 29(14): Article 1693. doi:10.1029/2002GL015311
Grell GA, Dudhia J, Stauffer DR (1995) A description of the fifth-generation Penn State/NCAR mesoscalemodel (MM5). NCAR technical note, NCAR/TN-398?STR, 117 pp
Hong SY, Pan HL (1996) Nonlocal boundary layer vertical diffusion in a medium-range forecast model.Mon Weather Rev 124:2322–2339
Janjic ZI (1994) The step-mountain eta coordinate model: further developments of the convection, viscoussub-layer and turbulence closure schemes. Mon Weather Rev 122:927–945
Janjic ZI (2000) Comments on ‘‘Development and evaluation of a convection scheme for use in climatemodels’’. J Atmos Sci 57:3686
Jayaram M (1965) A preliminary study of an objective method of forecasting heavy rainfall over Mumbaiand neighborhood during the month of July. Indian J Meteorol Geophys 16:557–564
Jenamani RK, Bhan SC, Kalsi SR (2006) Observational/forecasting aspects of the meteorological event thatcaused a record highest rainfall in Mumbai. Curr Sci 90(10):1344–1362
Lagouvardos K, Kotroni V, Koussis A, Feidas C, Buzzi A, Malguzzi P (2003) The meteorological modelBOLAM at the National Observatory of Athens: assessment of two-year operational use. J ApplMeteorol 42:1667–1678
Nat Hazards (2010) 52:117–142 141
123

Laprise R (1992) The Eular equations of motion with hydrostatic pressure as independent variable. MonWeather Rev 120:197–207
Mandal M, Mohanty UC, Raman S (2004) A study of the impact of parameterization of physical processeson prediction of tropical cyclone over the Bay of Bengal with NCAR/PSU mesoscale model (MM5).Nat Hazards 31:391–414
Mazarakis N, Kotroni V, Lagouvardos K, Music NS (2006) Impact of the assimilation of conventional dataon the quantitative precipitation forecasts in the Eastern Mediterranean. Adv Geosci 7:237–242
Mesinger F (1996) Improvements in quantitative precipitation forecasts with the ETA regional model atnational centers for environmental prediction: the 48-Km upgrade. Bull Am Meteorol Soc 77:2637–2649
Mlawer EJ, Taubman SJ, Brown PD, Iacono M, Clough SA (1997) Radiative transfer for inhomogeneousatmosphere: RRTM, a validated correlated k-model for the longwave. J Geophys Res 102(D14):16663–16682
Mohanty UC, Mandal M, Raman S (2004) Simulation of Orissa super cyclone (1999) using PSU/NCARmesoscale model. Nat Hazards 31:373–390
Rao YP (1976) Southwest Monsoon. Synoptic meteorology, meteorology monograph, India. MeteorologicalDepartment, No. 1
Rostkier-Edelstein D, Lui L, Ge M, Warner T, Swaerdlin S, Pietrkowski A, Segev Y (2006) Simulation ofhigh impact weather event over Israel with WRF-RTFDDA system—a case study. www.ucar.edu/wrf/users/workshops/WS2006/abstracts/psession/P8_09_Rostkier_Edestien.pdf
Sharma VV (1965) A study of heavy rainfall occurrence over Santacruz (Mumbai) with special reference tosupersonic flight operations. Indian J Meteorol Geophys 20:263–266
Shyamala B, Bhadram CVV (2006) Impact of mesoscale-synoptic scale interactions on the Mumbai his-torical rain event during 26–27 July 2005. Curr Sci 91(12):1649–1654
Singh R, Pal PK, Kishtawal CM, Joshi PC (2005) Impact of bogus vortex for track and intensity predictionof tropical cyclone. J Earth Syst Sci 114:427–436
Skamarock WC, Klemp JB, Dudhia J, Gill DO, Barker DM, Wang W, Powers JG (2005) A description ofthe advanced research WRF version 2. NCAR technical note, NCAR/TN-468?STR, 88 pp. UCARCommunications, Boulder, CO
Vaidya SS (2006) The performance of two convective parameterization schemes in a mesoscale model overthe India region. Meteorol Atmos Phys 92(3–4):175–190
Vaidya SS (2007) Simulation of weather systems over Indian region using mesoscale models. MeteorolAtmos Phys 95(1–2):15–26
Vaidya SS, Kulkarni JR (2007) Simulation of heavy precipitation over Santacruz, Mumbai on 26 July 2005,using mesoscale model. Meteorol Atmos Phys 98:55–66
142 Nat Hazards (2010) 52:117–142
123