
THE SHAPE OF SOUND: ELLIPTIC FOURIER DESCRIPTORS (EFD) DISCRIMINATE THE ECHOLOCATION CALLS OF MYOTIS...
16
Bioacoustics The International Journal of Animal Sound and its Recording, 2011, Vol. 20, pp. 101–116 © 2011 AB Academic Publishers THE SHAPE OF SOUND: ELLIPTIC FOURIER DESCRIPTORS (EFD) DISCRIMINATE THE ECHOLOCATION CALLS OF MYOTIS BATS (M. DAUBENTONII, M. NATTERERI AND M. MYSTACINUS) MATHIEU LUNDY* 1,2 , EMMA TEELING 1,3 , EMMA BOSTON 1,3 , DAVID SCOTT 1,2 , DANIEL BUCKLEY 1,3 , PAULO PRODOHL 1,2 , FERDIA MARNELL 4 AND IAN MONTGOMERY 1,2 1 Centre for Irish Bat Research, University College Dublin & Queen’s University Belfast 2 School of Biological Sciences, Queen’s University Belfast, Medical and Biological, Belfast BT9 7BL, Northern Ireland 3 School of Biology and Environmental Science, University College Dublin, Belfield, Dublin 4, Ireland 4 National Parks and Wildlife Service, Department of the Environment, Heritage and Local Government, 7 Ely Place, Dublin, Ireland ABSTRACT Bats of the genus Myotis cannot be identified reliably using conventional acoustic analyses. Here we use morphology of echolocation calls to discriminate between Myotis spp. This method may be used to identify unknown roosts to species level. Echolocation calls of M. daubentonii, M. mystacinus and M. nattereri, were recorded in emergence flights from roosts. Images of echolocation calls were extracted for morphological analysis performed in SHAPE, a program that transforms two-dimensional outline data into Elliptic Fourier Descriptors. Species typical call shapes were described with Mahalanobis models. Discriminant Function Analyses (DFA) were applied with Mahalanobis scores of typical shape alone and with a spectral call parameter, maximum frequency. DFA achieved an overall correct classification rate of 88.9% using typical outline shapes alone. Correct classification of 100% of both M. daubentonii and M. mystacinus was achieved by both typical call outlines. For M. nattereri, 79.6% of calls were correctly classified by call morphology, but the addition of maximum frequency improved this to 96.3%. Shape analyses provide a quick and easy method of distinguishing Myotis species under field conditions and could be extended to include other species of bats that share conventional acoustic parameters. Keywords: Chiroptera, echolocation, Elliptic Fourier Descriptors, morphometrics, ultrasound. * Corresponding author: [email protected]
-
Upload
independent -
Category
Documents
-
view
3 -
download
0
Transcript of THE SHAPE OF SOUND: ELLIPTIC FOURIER DESCRIPTORS (EFD) DISCRIMINATE THE ECHOLOCATION CALLS OF MYOTIS...
BioacousticsThe International Journal of Animal Sound and its Recording, 2011, Vol. 20, pp. 101–116© 2011 AB Academic Publishers
THE SHAPE OF SOUND: ELLIPTIC FOURIER DESCRIPTORS (EFD) DISCRIMINATE THE ECHOLOCATION CALLS OF MYOTIS BATS (M. DAUBENTONII, M. NATTERERI AND M. MYSTACINUS)
MATHIEU LUNDY*1,2, EMMA TEELING1,3, EMMA BOSTON1,3, DAVID SCOTT1,2, DANIEL BUCKLEY1,3, PAULO PRODOHL1,2, FERDIA MARNELL4 AND IAN MONTGOMERY1,2 1 Centre for Irish Bat Research, University College Dublin & Queen’s University
Belfast2 School of Biological Sciences, Queen’s University Belfast, Medical and Biological,
Belfast BT9 7BL, Northern Ireland3 School of Biology and Environmental Science, University College Dublin, Belfield,
Dublin 4, Ireland4 National Parks and Wildlife Service, Department of the Environment, Heritage
and Local Government, 7 Ely Place, Dublin, Ireland
ABSTRACT
Bats of the genus Myotis cannot be identified reliably using conventional acoustic analyses. Here we use morphology of echolocation calls to discriminate between Myotis spp. This method may be used to identify unknown roosts to species level. Echolocation calls of M. daubentonii, M. mystacinus and M. nattereri, were recorded in emergence flights from roosts. Images of echolocation calls were extracted for morphological analysis performed in SHAPE, a program that transforms two-dimensional outline data into Elliptic Fourier Descriptors. Species typical call shapes were described with Mahalanobis models. Discriminant Function Analyses (DFA) were applied with Mahalanobis scores of typical shape alone and with a spectral call parameter, maximum frequency. DFA achieved an overall correct classification rate of 88.9% using typical outline shapes alone. Correct classification of 100% of both M. daubentonii and M. mystacinus was achieved by both typical call outlines. For M. nattereri, 79.6% of calls were correctly classified by call morphology, but the addition of maximum frequency improved this to 96.3%. Shape analyses provide a quick and easy method of distinguishing Myotis species under field conditions and could be extended to include other species of bats that share conventional acoustic parameters.
Keywords: Chiroptera, echolocation, Elliptic Fourier Descriptors, morphometrics, ultrasound.
*Corresponding author: [email protected]
102
INTRODUCTION
Many bat species use ultrasonic echolocation to orientate in their environment. In many cases these are species specific calls that can be used to easily identify a species. However, identification of a number of species using recorded echolocation calls can be difficult, due mainly to the overlap between species and plasticity of echolocation calls within species (Kalko & Schnitzler 1993; Parsons & Jones 2000). During flight, discrete echolocation calls are produced regularly. Both spectral parameters such as frequency of maximum energy and frequency ranges, and temporal parameters like call duration are used for species identification (Zingg 1990; Obrist 1995; Vaughan et al. 1997; Jones et al. 2000; Parsons & Jones 2000; Russo & Jones 2002; Papadatou et al. 2008). Adaption of echolocation calls due to immediate habitat structure or foraging can introduce problems when identifying species (Broaders et al. 2004). Depending on environmental conditions a bat species can modify calls in the immediate situation, such as reduction of call intensity (Brinkløv et al. 2010) or increase in minimum frequency and call rate when foraging in more cluttered environments (Kalko & Schnitzler 1993; Jones 1995).
Multivariate analyses of call parameters, such as linear Discriminant Function Analysis (DFA), and Artificial Neural Networks (ANN), are used to identify unknown echolocation calls using spectral and temporal parameters from recorded calls of known species. These techniques have been shown to achieve high rates of correct species identification (Zingg 1990; Obrist 1995; Vaughan et al. 1997; Jones et al. 2000; Parsons & Jones 2000; Russo & Jones 2002; Papadatou et al. 2008) and can outperform the correct classification rates of experienced humans (Jennings et al. 2008). High rates of misclassification, however, particularly for the Myotis spp. are common. For example, Vaughan et al. (1997) examining the calls of 15 British bat species achieved correct classification rates for M. mystacinus of 12% whilst Parsons and Jones (2000) achieved average correct classification rates of 63.4% and 80.4% by DFA and ANN respectively, for five species of Myotis bats, in a study of 14 species. Significant advances have been made toward more reliable methods by creating Ensembles of Neural Networks (ENNs). While these methods are computationally expensive Redgewell et al. (2009) constructed an ENNs for 14 bat species. The correct classification rates for calls of five species of Myotis spp. were high including 97%, 99% and 100% for M. mystacinus, M. nattereri and M. daubentonii respectively. Development of effective systems of classification relies on measurements which are conserved across the geographic range and habitats in which they are recorded. Additionally, variation due to geographic region necessitates regionally specific systems,
103
each requiring a new training dataset (Thomas et al. 1987). Current methods, therefore, are labour intensive and impractical under field conditions. In the present study we concentrate on the identification of three co-occurring Myotis spp. only.
In Ireland and Britain Myotis spp. represent 30 – 40% of the resident bat species (Harris & Yalden 2008; Marnell et al. 2009). Monitoring schemes often rely on bat echolocation detector surveys (Ahlén & Baagøe 1999), whereby the species are identified based on their echolocation calls. Therefore, the high degree of uncertainty associated with classification of Myotis spp. remains a significant issue for bat conservation and ecological studies. Ultrasonic calls of Myotis bats are often unresolved to species when calls cannot be confidently assigned to a single species allowing only generalisations of habitat use for the genus to be made (Hayes 1997; Russo & Jones 2003; Lundy & Montgomery 2010).
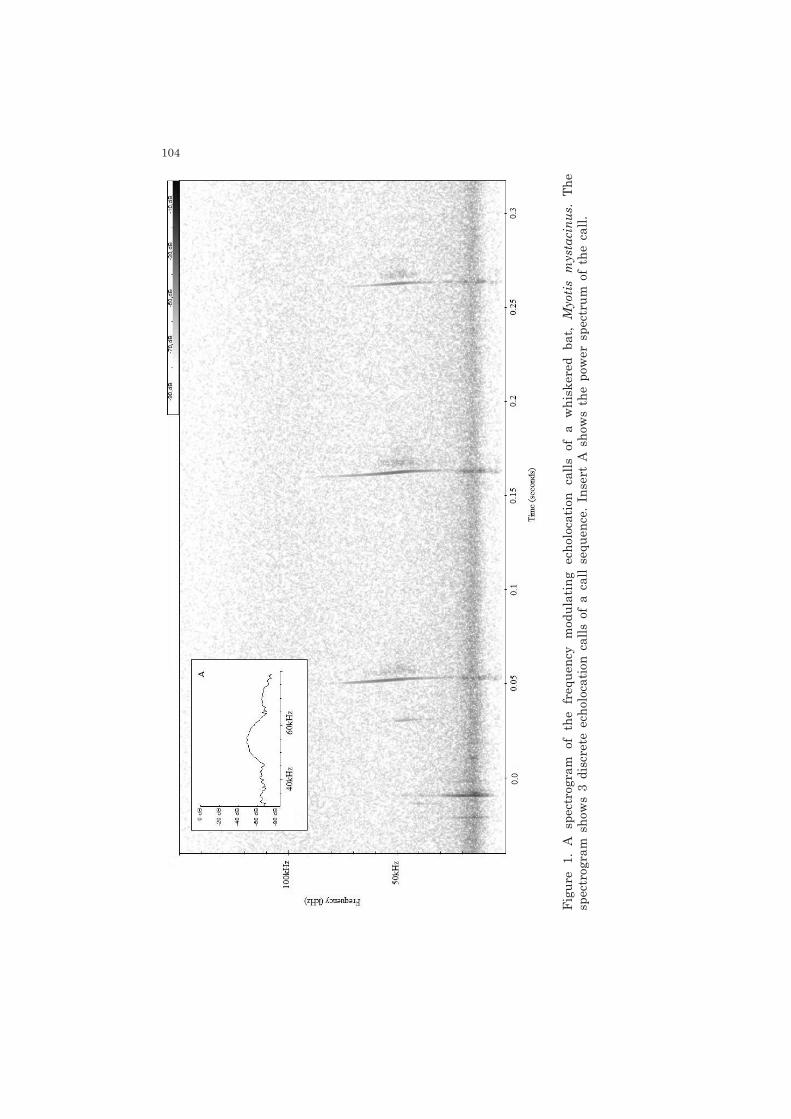
Myotis spp. typically produce a frequency modulated call dominated by sweeps from high to low frequencies (Figure 1). The maximum frequencies can be subjected to atmospheric attenuation (Griffin 1971), whereas minimum frequencies may be masked by background noise. Myotis bats produce calls with broadly equal intensity across their frequency range, dictating that frequency of maximum energy is of limited use for species identification (Figure 1). In addition to call parameters, Parsons and Jones (2000) used curve fitting to the frequency time course to describe call ‘shape’ for species identification using both ANN and DFA. However, this parameter did not assist significantly in correctly classifying calls.
Morphometric analyses can be applied to identify species (Neto et al. 2006) and explore important shape variations within species, such as in stock assignment of pelagic fish (Silvia 2003; Tracey et al. 2006), or identification of populations of conservation importance (Preston et al. 2010). Elliptic Fourier Descriptors (EFDs), proposed by Kuhl and Giardina (1982), can delineate any type of shape with a closed two-dimensional contour and have been applied effectively to the evaluation of various biological shapes (Bierbaum & Ferson 1986; Innes & Bates 1999; Neto et al. 2006). Such analyses may allow more information concerning shape to be captured than curve fitting, and lead to parameterisation of asymmetries and a description of shape dimensional ratios which are lost through curve fitting methods. Given the potential difficulties in classification of echolocation calls of Myotis spp. from call parameters alone, the present study concerns the potential for analysis of shape to classify echolocation calls of bats. This is the first attempt to classify echolocation calls of bat species using morphometrics.
104
Figu
re 1
. A
spec
trog
ram
of
the
freq
uenc
y m
odul
atin
g ec
holo
catio
n ca
lls o
f a
whi
sker
ed b
at,
Myo
tis m
ysta
cinu
s. Th
e sp
ectr
ogra
m s
how
s 3
disc
rete
ech
oloc
atio
n ca
lls o
f a
call
sequ
ence
. Ins
ert
A sh
ows
the
pow
er s
pect
rum
of
the
call.
105
METHOD
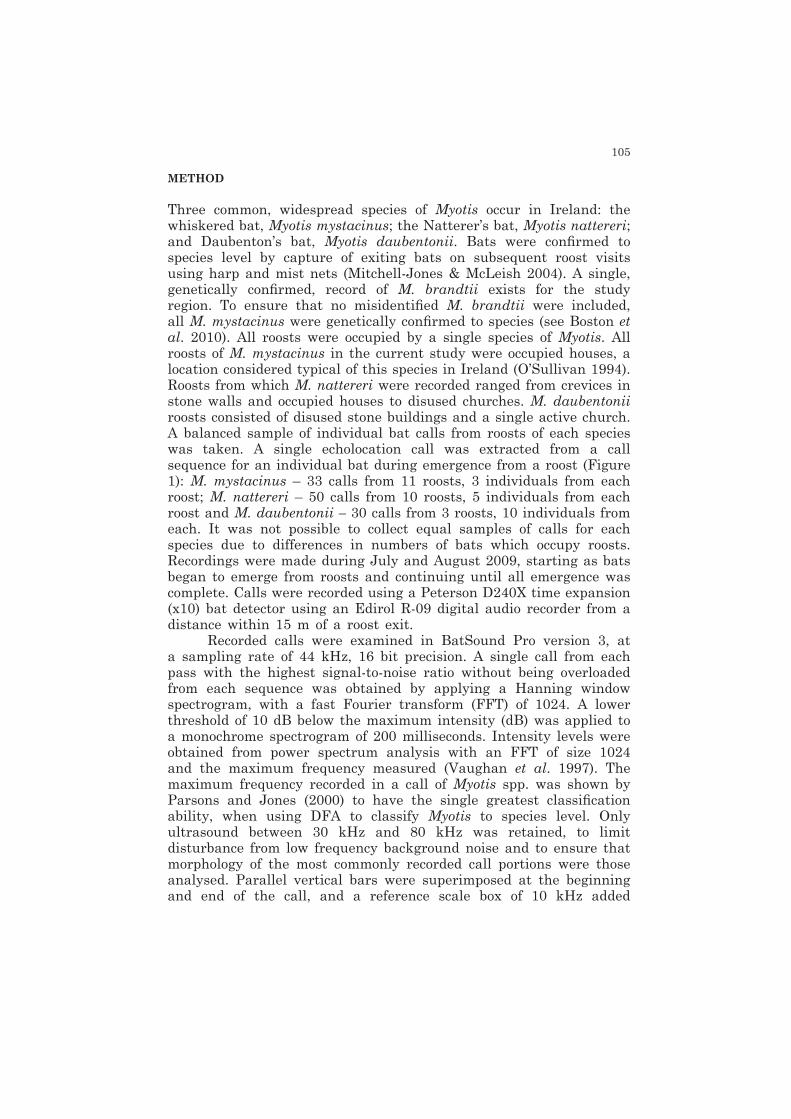
Three common, widespread species of Myotis occur in Ireland: the whiskered bat, Myotis mystacinus; the Natterer’s bat, Myotis nattereri; and Daubenton’s bat, Myotis daubentonii. Bats were confirmed to species level by capture of exiting bats on subsequent roost visits using harp and mist nets (Mitchell-Jones & McLeish 2004). A single, genetically confirmed, record of M. brandtii exists for the study region. To ensure that no misidentified M. brandtii were included, all M. mystacinus were genetically confirmed to species (see Boston et al. 2010). All roosts were occupied by a single species of Myotis. All roosts of M. mystacinus in the current study were occupied houses, a location considered typical of this species in Ireland (O’Sullivan 1994). Roosts from which M. nattereri were recorded ranged from crevices in stone walls and occupied houses to disused churches. M. daubentonii roosts consisted of disused stone buildings and a single active church. A balanced sample of individual bat calls from roosts of each species was taken. A single echolocation call was extracted from a call sequence for an individual bat during emergence from a roost (Figure 1): M. mystacinus – 33 calls from 11 roosts, 3 individuals from each roost; M. nattereri – 50 calls from 10 roosts, 5 individuals from each roost and M. daubentonii – 30 calls from 3 roosts, 10 individuals from each. It was not possible to collect equal samples of calls for each species due to differences in numbers of bats which occupy roosts. Recordings were made during July and August 2009, starting as bats began to emerge from roosts and continuing until all emergence was complete. Calls were recorded using a Peterson D240X time expansion (x10) bat detector using an Edirol R-09 digital audio recorder from a distance within 15 m of a roost exit.
Recorded calls were examined in BatSound Pro version 3, at a sampling rate of 44 kHz, 16 bit precision. A single call from each pass with the highest signal-to-noise ratio without being overloaded from each sequence was obtained by applying a Hanning window spectrogram, with a fast Fourier transform (FFT) of 1024. A lower threshold of 10 dB below the maximum intensity (dB) was applied to a monochrome spectrogram of 200 milliseconds. Intensity levels were obtained from power spectrum analysis with an FFT of size 1024 and the maximum frequency measured (Vaughan et al. 1997). The maximum frequency recorded in a call of Myotis spp. was shown by Parsons and Jones (2000) to have the single greatest classification ability, when using DFA to classify Myotis to species level. Only ultrasound between 30 kHz and 80 kHz was retained, to limit disturbance from low frequency background noise and to ensure that morphology of the most commonly recorded call portions were those analysed. Parallel vertical bars were superimposed at the beginning and end of the call, and a reference scale box of 10 kHz added
106
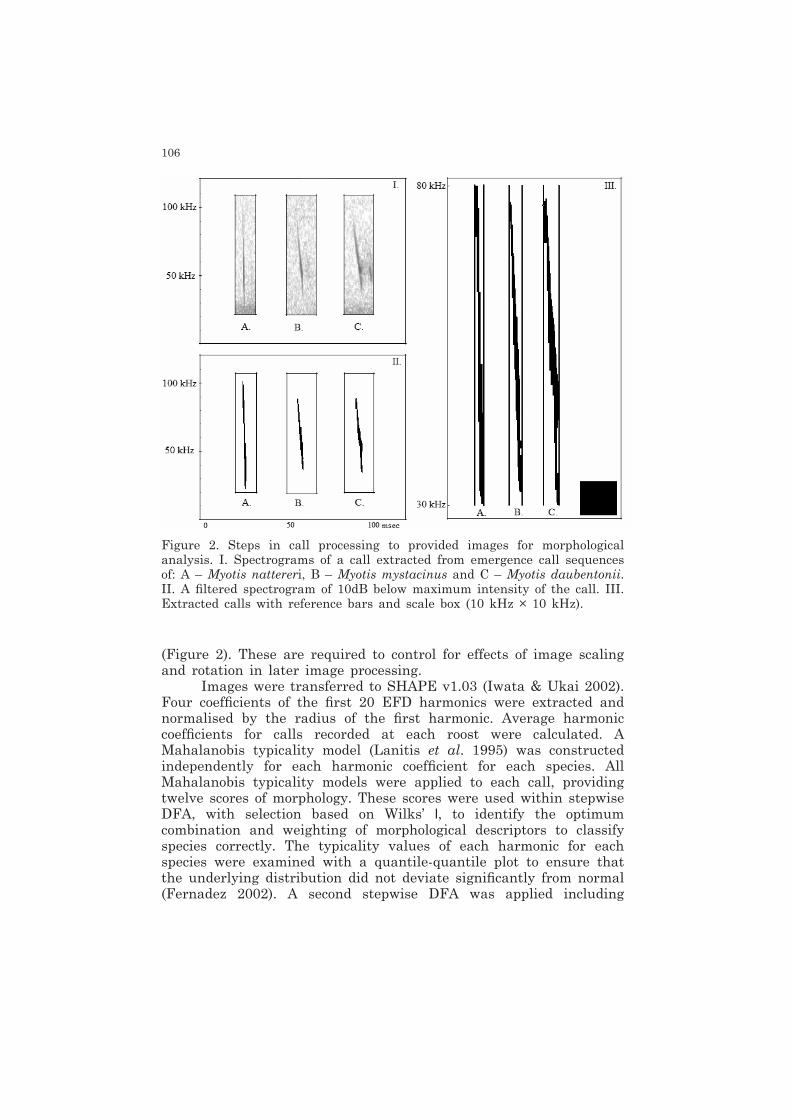
(Figure 2). These are required to control for effects of image scaling and rotation in later image processing.
Images were transferred to SHAPE v1.03 (Iwata & Ukai 2002). Four coefficients of the first 20 EFD harmonics were extracted and normalised by the radius of the first harmonic. Average harmonic coefficients for calls recorded at each roost were calculated. A Mahalanobis typicality model (Lanitis et al. 1995) was constructed independently for each harmonic coefficient for each species. All Mahalanobis typicality models were applied to each call, providing twelve scores of morphology. These scores were used within stepwise DFA, with selection based on Wilks’ l, to identify the optimum combination and weighting of morphological descriptors to classify species correctly. The typicality values of each harmonic for each species were examined with a quantile-quantile plot to ensure that the underlying distribution did not deviate significantly from normal (Fernadez 2002). A second stepwise DFA was applied including
Figure 2. Steps in call processing to provided images for morphological analysis. I. Spectrograms of a call extracted from emergence call sequences of: A – Myotis nattereri, B – Myotis mystacinus and C – Myotis daubentonii. II. A filtered spectrogram of 10dB below maximum intensity of the call. III. Extracted calls with reference bars and scale box (10 kHz × 10 kHz).
107
maximum frequency of each call in addition to morphology parameters. Fisher’s linear discriminant coefficients were obtained for each species extracted for both DFAs. The classification success of DFAs was tested using correct classification rates based on the data used to construct the DFA and set of calls excluded from morphological typicality modelling. The test set comprised one call from each roost which was not used in construction of the model (N=24). The DFA equation outputs were averaged for each roost to test the correct classification rate of roosts.
RESULTS
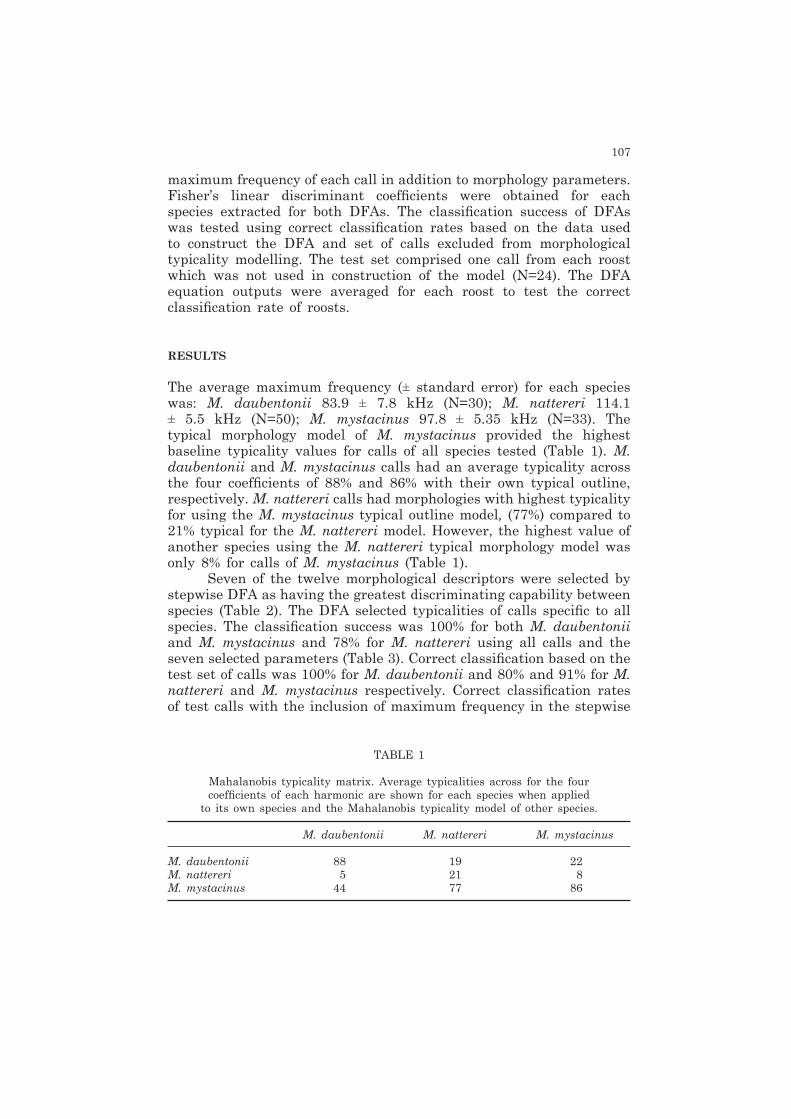
The average maximum frequency (± standard error) for each species was: M. daubentonii 83.9 ± 7.8 kHz (N=30); M. nattereri 114.1 ± 5.5 kHz (N=50); M. mystacinus 97.8 ± 5.35 kHz (N=33). The typical morphology model of M. mystacinus provided the highest baseline typicality values for calls of all species tested (Table 1). M. daubentonii and M. mystacinus calls had an average typicality across the four coefficients of 88% and 86% with their own typical outline, respectively. M. nattereri calls had morphologies with highest typicality for using the M. mystacinus typical outline model, (77%) compared to 21% typical for the M. nattereri model. However, the highest value of another species using the M. nattereri typical morphology model was only 8% for calls of M. mystacinus (Table 1).
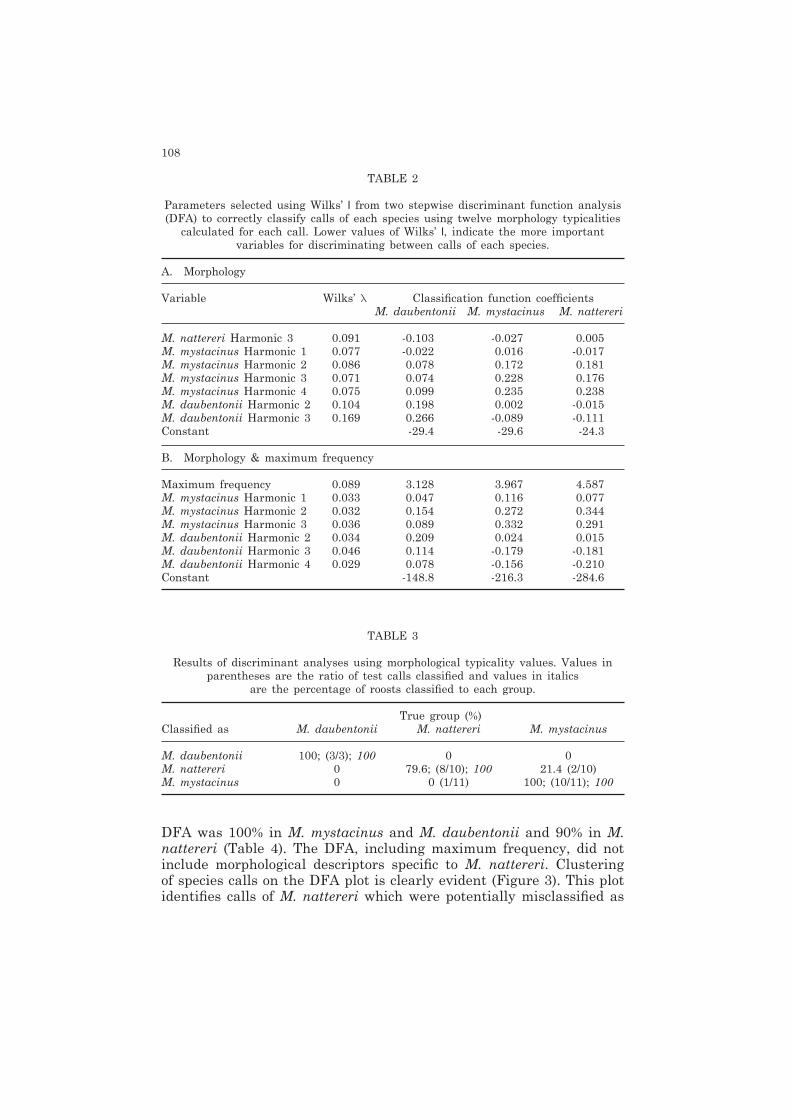
Seven of the twelve morphological descriptors were selected by stepwise DFA as having the greatest discriminating capability between species (Table 2). The DFA selected typicalities of calls specific to all species. The classification success was 100% for both M. daubentonii and M. mystacinus and 78% for M. nattereri using all calls and the seven selected parameters (Table 3). Correct classification based on the test set of calls was 100% for M. daubentonii and 80% and 91% for M. nattereri and M. mystacinus respectively. Correct classification rates of test calls with the inclusion of maximum frequency in the stepwise
TABLE 1
Mahalanobis typicality matrix. Average typicalities across for the four coefficients of each harmonic are shown for each species when applied
to its own species and the Mahalanobis typicality model of other species.
M. daubentonii M. nattereri M. mystacinus
M. daubentonii 88 19 22M. nattereri 5 21 8M. mystacinus 44 77 86
108
TABLE 2
Parameters selected using Wilks’ l from two stepwise discriminant function analysis (DFA) to correctly classify calls of each species using twelve morphology typicalities
calculated for each call. Lower values of Wilks’ l, indicate the more important variables for discriminating between calls of each species.
A. Morphology
Variable Wilks’ l Classification function coefficients M. daubentonii M. mystacinus M. nattereri
M. nattereri Harmonic 3 0.091 -0.103 -0.027 0.005M. mystacinus Harmonic 1 0.077 -0.022 0.016 -0.017M. mystacinus Harmonic 2 0.086 0.078 0.172 0.181M. mystacinus Harmonic 3 0.071 0.074 0.228 0.176M. mystacinus Harmonic 4 0.075 0.099 0.235 0.238M. daubentonii Harmonic 2 0.104 0.198 0.002 -0.015M. daubentonii Harmonic 3 0.169 0.266 -0.089 -0.111Constant -29.4 -29.6 -24.3
B. Morphology & maximum frequency
Maximum frequency 0.089 3.128 3.967 4.587M. mystacinus Harmonic 1 0.033 0.047 0.116 0.077M. mystacinus Harmonic 2 0.032 0.154 0.272 0.344M. mystacinus Harmonic 3 0.036 0.089 0.332 0.291M. daubentonii Harmonic 2 0.034 0.209 0.024 0.015M. daubentonii Harmonic 3 0.046 0.114 -0.179 -0.181M. daubentonii Harmonic 4 0.029 0.078 -0.156 -0.210Constant -148.8 -216.3 -284.6
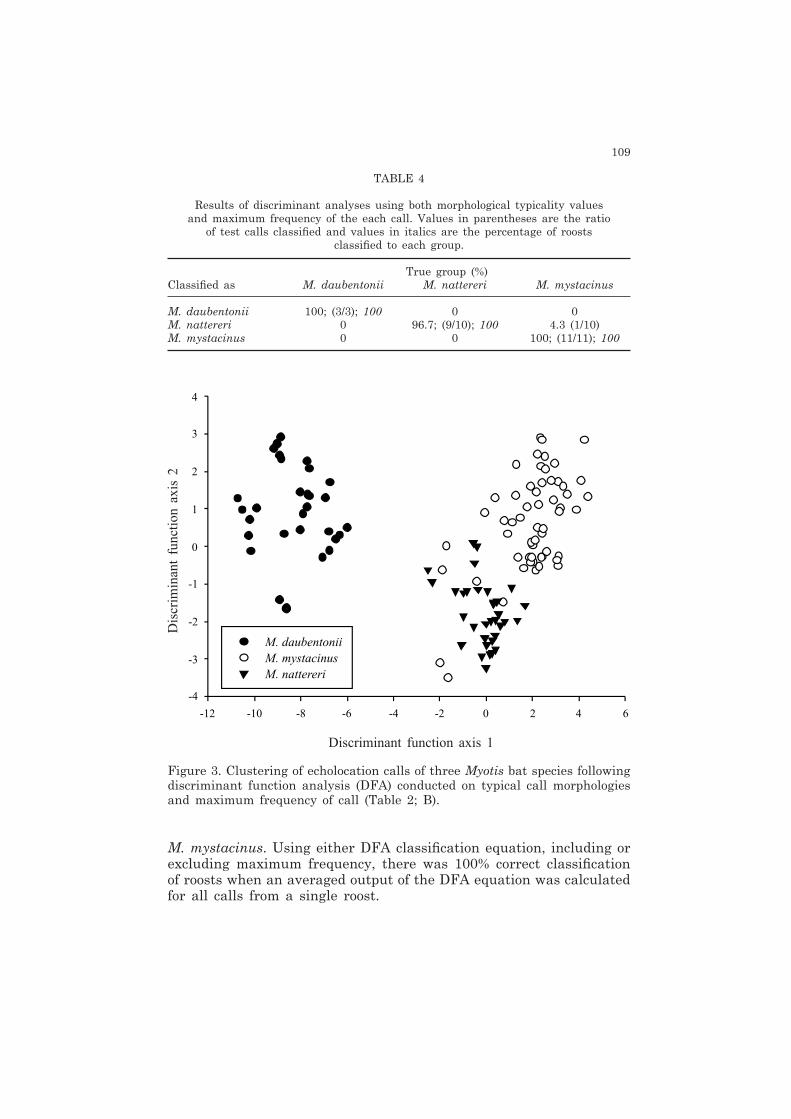
DFA was 100% in M. mystacinus and M. daubentonii and 90% in M. nattereri (Table 4). The DFA, including maximum frequency, did not include morphological descriptors specific to M. nattereri. Clustering of species calls on the DFA plot is clearly evident (Figure 3). This plot identifies calls of M. nattereri which were potentially misclassified as
TABLE 3
Results of discriminant analyses using morphological typicality values. Values in parentheses are the ratio of test calls classified and values in italics
are the percentage of roosts classified to each group.
True group (%)Classified as M. daubentonii M. nattereri M. mystacinus
M. daubentonii 100; (3/3); 100 0 0M. nattereri 0 79.6; (8/10); 100 21.4 (2/10)M. mystacinus 0 0 (1/11) 100; (10/11); 100
109
TABLE 4
Results of discriminant analyses using both morphological typicality values and maximum frequency of the each call. Values in parentheses are the ratio
of test calls classified and values in italics are the percentage of roosts classified to each group.
True group (%)Classified as M. daubentonii M. nattereri M. mystacinus
M. daubentonii 100; (3/3); 100 0 0M. nattereri 0 96.7; (9/10); 100 4.3 (1/10)M. mystacinus 0 0 100; (11/11); 100
Figure 3. Clustering of echolocation calls of three Myotis bat species following discriminant function analysis (DFA) conducted on typical call morphologies and maximum frequency of call (Table 2; B).
Dis
crim
inan
t fu
nctio
n ax
is 2
Discriminant function axis 1
M. mystacinus. Using either DFA classification equation, including or excluding maximum frequency, there was 100% correct classification of roosts when an averaged output of the DFA equation was calculated for all calls from a single roost.
110
DISCUSSION
The present study demonstrates how morphometric analysis can be used to classify echolocation calls of Myotis bats to species level. Given that Myotis spp. are considered to have morphologically similar calls the potential for application to other bat species groups is promising. Morphometric analysis is widely used to describe shape independent of size and orientation (Zelditch et al. 2004). In the present study, calls are scaled by intensity and are placed in the context of a standard frequency and time window. It is important that calls are not rescaled and orientation changed during morphological analysis as these relate to frequency range, call duration and the frequency time course. These aspects are maintained by inclusion of temporal and frequency baselines and fixed frequency time scales. In doing so, the EFDs and morphological typicalities created capture aspects of call duration, frequency ranges, energy distribution and aspects of the frequencies time course which independent measurements and curve fitting do not fully describe.
The morphometric analyses of echolocation calls also demonstrate differing levels of call plasticity within species. A greater level of call variation in M. nattereri than in M. mystacinus and M. daubentonii, results in a greater difficulty in classifying calls. This may arise from the having a broader range of roost types and, generally, a wider foraging niche (Shiel et al. 1991; Smith & Racey 2008; Dietz et al. 2009). However, it may also result as a direct response to relatively larger sample size and the increased environmental variability encountered (Rydell 1990; Kalko & Schnitzler 1993; Jones, 1995). M. nattereri produced calls which were most difficult to identify by call morphology alone. This is contrary to the classification success of other studies, in which the classification of M. nattereri was generally high using spectral and temporal parameters alone (Jones et al. 2000; Parsons & Jones 2000; Russo & Jones 2002; Papadatou et al. 2008). The inclusion of the maximum frequency of the call significantly improved rates of the correct classification for M. nattereri. The increased classification powers of this parameter are reduced when EDFs are examined alone as only frequencies up from 30 kHz to 80 kHz are examined, to reduce the impact of frequency attenuation and disturbance form background noise.
Calls of M. nattereri and M. mystacinus clustered closely on the DFA axis, whilst the calls of M. daubentonii were most distinct. These differences may reflect ecological distance between the species. Both M. mystacinus and M. nattereri are regarded as woodland foraging species, although M. nattereri is also associated with marginal agricultural and riparian areas, whilst M. daubentonii is an aquatic habitat specialist (Rydell 1990; Shiel et al. 1991; Kalko & Schnitzler 1993; Jones, 1995; Smith & Racey 2008; Dietz et al. 2009).
111
Both M. mystacinus and M. nattereri forage by gleaning prey off surfaces and catching prey in flight (Dietz et al. 2009) whereas M. daubentonii typically forages over water collecting prey from the water surface (Jones & Rayner 1988; Kalko & Schnitzler 1989). Of the three species examined here the typical morphology model created for M. mystacinus gave the highest baseline for calls of other species, suggesting that the typical morphology of M. mystacinus described is contained within the morphological parameters of other species. Therefore, it may be that it is the extreme elements of other calls which lead to high rates of successful classification, particularly the morphology of M. daubentonii calls. Safi and Kerth (2003) reviewed the niche breadth of temperate microbats reporting that M. mystacinus had the broadest niche (4.45) in comparison to M. nattereri (2.66) and M. daubentonii (1.47). The generalist foraging strategy of M. mystacinus and specialised strategy of M. daubentonii and the intermediate status of the foraging niche of M. nattereri may be reflected in the morphology of the echolocation calls described here.
The present analyses demonstrate that there is a sufficient level of conservation of call morphology within species to allow reliable species identification. The discriminant equation for species identification could be applied to EFDs of call outlines from recordings made in other studies. While the results presented here show promise for the use of EFDs for the identification of bat species the protocol outlined relies on a consistent method of call recording and a standardised method of processing high quality recordings. Under certain conditions, and with ultrasound detectors of reduced sensitivity, it is not always possible to obtain high quality calls under field conditions which may impact on the accuracy of the EFDs derived. Additionally, high frequencies are likely to be attenuated more than lower frequencies resulting in inaccurate representations of calls (Pye 1993). The impact of this on the extraction of EFDs is reduced by only extracting calls from the restricted frequency range, but significant impacts may persist in a classification system which relies on the addition of spectral parameters. In the present study all calls were collected from bats emerging from roosts. This limits the environmentally induced variability within the recorded calls but the effect of environmental conditions, such as clutter, should be considered in future applications of this technique and other species classification studies (Broders et al. 2004). Collection of calls from a greater range of environments is often hindered by difficulties in accurately identifying calls to species level recorded away from known roosts or from release of captive bats. Further novel techniques, therefore, may be required to fully characterise the call shape of bats under different environmental conditions (Hiryu et al. 2007). The use of EFDs presented here compares favourably to the results of the rates achieved by Redgewell et al. (2009) using ENN.
112
The present technique could be applied reliably to identify unknown roosts to species level without the need to capture bats or enter roosts, reducing the potential to disturb roosts. In the current study the maximum frequency recorded for each species was within the range of the maximum frequencies described by other authors (Vaughan et al. 1997; Parsons & Jones 2000; Russo & Jones 2002). However, geographic differences may occur and further development of the method should apply the technique to a wider geographic range and incorporate other Myotis spp. and other genera. Integrating the morphometric analysis demonstrated here into classification techniques such as ANN may increase classification power, particularly with the addition of other species. In contrast to ANN or other forms of DFA, linear DFA allows species identification without the need to access the original calls, using coefficients derived from DFA (Papadatou et al. 2008). Future development of the technique should examine the morphology of calls in situations other than emergence calls to test the use of EFDs in other situations. It is not feasible to apply the current model to the calls of bats obtained under other environmental conditions as it is known that bats will alter calls to meet the acoustic requirements of the immediate environment (Kalko & Schnitzler 1993; Jones 1995; Broders et al. 2004; Brinkløv et al. 2010).
Morphometric analysis is frequently used in the classification of biological specimens and to assess morphological responses to different environmental conditions within species (Bierbaum & Ferson 1986; Innes & Bates 1999; Neto et al. 2006; Preston et al. 2010). The present study is the first application of morphometric analysis to sound and, more specifically, the echolocation calls of bats. It may be feasible to extend its application to other aspects of ultrasonic systems in mammals, particularly the social call form and structure (Pfalzer & Kusch 2003) and intraspecific differences associated with age and sex in bats (Master et al. 1995; Siemers et al. 2005). It remains a priority that classification and identification of bat species by echolocation calls is explored to develop effective monitoring tools to establish conservation status.
ACKNOWLEDGEMENTS
The work was funded by the National Parks and Wildlife Service. We are grateful to Prof. P. Racey and Dr. M Ruedi for comments on the methodology and project proposal, the cooperation of all landowners for allowing access to roosts and the comments of two anonymous reviewers.
113
REFERENCES
Ahlén, I. & Baagøe, H.J. (1999). Use of ultrasound detectors for bat studies in Europe: experiences from field identification, surveys, and monitoring. Acta Chiropterol., 1, 137-150.
Bierbaum, R. M. & Ferson, S. (1986). Do symbiotic pea crabs decrease growth rate in mussels? The Biol. Bull., 170, 51-61.
Brinkløv, S., Kalko, E.K.V. & Surlykke, A. (2010). Dynamic adjustment of biosonar intensity to habitat clutter in the bat Macrophyllum macrophyllum (Phyllostomidae). Behav. Ecol. Socio., DOI: 10.1007/s00265-010-0998-9
Broders, H. G., Findlay, C. S. & Zheng, L. (2004). Effect of clutter on echolocation call structure of Myotis septentrionalis and M. lucifugus. J. Mammal., 85, 273-281.
Dietz, C., von Helversen, O. & Nill, D. (Eds.) (2009). Bats of Britain, Europe and Northwest Africa. London: A&C Black.
Fernandez, C.G.Z. (2002), Discriminant analysis: a powerful classification technique in data mining. Proc. SAS Int. Conf., 247-256
Griffin, D. R. (1971), Importance of atmospheric attenuation for echolocation of bats (Chiroptera). Anim. Behav. 19, 55-61.
Harris, S. & Yalden, D.W. (Eds.) (2008). Mammals of the British Isles handbook (4th edition). The Mammal Society: UK.
Hayes, J. P. (1997). Temporal variability in activity of bats and design on echolocation monitoring studies. J. Mammal., 78, 514-524.
Hiryu, S., Hagino, T. & Riquimaroux, H. (2007). Echo-intensity compensation in echolocating bats (Pipistrellus abramus) during flight measured by a telemetry microphone. J. Acoust. Soc. Am., 121, 1749-1757.
Innes, D. J. & Bates, J. A. (1999). Morphological variation of Mytilus edulis and Mytilus trossulus in eastern Newfoundland. Mar. Biol., 133, 691-699.
Iwata, H. & Ukai Y. (2002). SHAPE: A Computer Program Package for Quantitative Evaluation of Biological Shapes Based on Elliptic Fourier Descriptors. J. Hered., 93, 384-385.
Jennings, N. Parsons, S. & Pocock, M. J. O. (2008). Human vs. machine: identificanton of bat species from their echolocation calls by humans and by artificial neural networks. Can. J. Zool., 86, 371-377.
Jones, G. & Rayner, J. M. V. (1988). Flight performance, foraging tactics and echolocation in free-living Daubenton’s bats Myotis daubentoni (Chiroptera: Vespertilionidae). J. Zool., 215, 113-132.
Jones, G., Vaughan, N. & Parsons, S. (2000). Acoustic identification of bats from directly sampled and time expanded recordings of vocalizations. Acta Chiropterol., 2, 155-170.
Jones, G. (1995). Flight performance, echolocation and foraging behaviour in noctule bats Nyctalus noctula. J. Zool., 237. 303-312.
Kalko, E. K. V. & Schnitzler. H. U. (1993). Plasticity in echolocation signals of European pipistrelle bats in search flight: implications for habitat use and prey detection. Behav. Ecol. Socio., 33, 41-428.
Kuhl, F. P. & Giardina, C. R. (1982). Elliptic Fourier features of a closed contour. Comp.Vison. Graph., 18, 236-258.
Lanitis, A. Taylor, C. J. & Cootes. T. F. (1995). Automatic face identification system using flexible appearance models. Image. Vision. Comput., 13, 393-401.
Lundy, M. & Montgomery, I. (2010). Summer habitat associations of bats between riparian landscapes and within riparian areas. Eur. J. Wildlife Res., DOI.10.1007/s10344-009-0330-z
Marnell, F., Kingston, N. & Looney, D. (Eds.) (2009). Ireland Red List No. 3: Terrestrial Mammals. Dublin: National Parks and Wildlife Service, Department of the Environment, Heritage and Local Government.
114
Masters, W. M., Raver, K. A. S. & Kazial, K. A. (1995). Sonar signals of big brown bats, Eptesicus fuscus, contain information about individual identity, age and family affiliation. Anim. Behav., 50, 1243-1260.
Mitchell-Jones, A. J. & McLeish, A. P. (2004). The Bat Works Manual (3rd edition). Peterborough: English Nature.
Neto, J. C., Meyer, G. E., Jones, D. D. & Samal, A. K. (2006). Plant species identification using Elliptic Fourier leaf shape analysis. Comput. Electron. Agr., 50, 121-134.
O’Sullivan, P. (1994). Bats in Ireland. Ir. Nat. J., Special Zoological Supplement.Obrist, M. K. (1995). Flexible bat echolocation: the influence of individual habitat and
conspecifics on sonar signal design. Behav.Ecol. Socio., 36, 207-219.Papadatou, E., Butlin, R. K. & Altringham, J. D. (2008). Identification of bat species
in Greece from their echolocation calls. Acta Chiropterol., 10, 127-143.Parsons, S. & Jones, G. (2000). Acoustic identification of twelve species of echolocating
bats by discriminant function analysis and artificial neural networks. J. Exp. Biol., 203, 2641-2656
Pfalzer, G. & Kusch, J. (2003). Structure and variability of bat social calls: implications for specificity and individual recognition. J. Zool., 261, 21-33.
Pye, J.D. (1993). Is fidelity futile? The ‘true’ signal is illusory, especially with ultrasound. Bioacoustics, 4, 271-286.
Preston, S. J., Harrison, A., Lundy, M., Roberts, D., Beddoe, N. & Rogowski, D. (2010). Square pegs in round holes – the implications of shell shape variation on the translocation of adult Margaritifera margaritifera (L.). Aquat. Conserv., 20, 568-573.
Redgewell, R. D., Szewczak, J. M., Jones, G. & Parsons, S. (2009) Classification of Echolocation Calls from 14 Species of Bat by Support Vector Machines and Ensembles of Neural Networks. Algorithms, 2, 907-924.
Russ, J. M. (1999). The bats of Britain and Ireland. Echolocation calls, sound analysis and species identification. UK: Alana Books
Russo, D. & Jones, G. (2003). Use of foraging habitats by bats in a Mediterranean area determined by acoustic surveys: conservation implications. Ecography, 26, 197-209.
Rydell, J. (1990). Behavioural variation in echolocation pulses of the northern bat, Eptisicus nilssoni. Ethology, 85, 103-113.
Shiel, C. B., McAney, C. M. & Fairley, J. S. (1991). Analysis of diet of Natterer’s bat Myotis nattereri and the common long-eared bat Plecotus auritus in the West of Ireland. J. Zool., 223, 299-305.
Siemers, B. M., Beedholm, K., Dietz, C., Dietz, I. & Ivanova, T. (2005). Is species identity, sex, age or individual quality conveyed by echolocation call frequency in European horseshoe bats? Acta Chiropterol., 7, 259-274.
Safi, K. & Kerth, G. (2004) A comparative analysis of specialization and extinction risk in temperate-zone bats. Conserv. Biol., 18, 1293-1303.
Silvia, A. (2003). Morphometric variation among sardine (Sardina pilchardus) populations from the northeastern Atlantic and the western Mediterranean. J. Mar.Sci., 60, 1352-1360.
Smith, S. M. & Racey P. A. (2008). Natterer’s bats prefer foraging in broad-leaved woodlands and river corridors. J. Zool., 275, 314-322.
Thomas, D. W., Bell, G. P. & Fenton, M. B. (1987). Variation in echolocation call frequencies recorded from North American vespertilionid bats: a cautionary note. J. Mammal., 68, 842-847.
Tracey S. R., Lyle, J. M. & Duhamel, G. (2006). Application of elliptical Fourier analysis to otolith form as a tool for stock identification. Fish. Res., 77, 138-147.
Vaughan, N., Jones, G. & Harris, S. (1997). Identification of British bat species by multivariate analysis of echolocation parameters. Bioacoustics, 7, 189-207.

115
Zelditch, M. L., Swiderski, D. L., Sheets, H. D. & Fink. W. L. (Eds.) (2004). Geometric morphometrics for biologists: a primer.San Diego: Elsevier Academic Press.
Zingg, P. E. (1990). Akustische Artidentifikation von Fledermausen (Mammalia: Chiroptera) in der Schweiz. Rev.Suisse Zool.. 97, 263-294.
Received 20 May 2009, revised 5 July 2010 and accepted 9 July 2010.