The Rotation Curves of Dwarf Galaxies: A Problem for Cold Dark Matter
30
arXiv:astro-ph/0311020v3 27 Sep 2004 The rotation curves of dwarf galaxies: a problem for Cold Dark Matter? George Rhee Physics Department, University of Nevada, Box 454002, Las Vegas, NV 89154 and Octavio Valenzuela Astronomy Department, University of Washington Box 351580, Seattle, WA 98195 Anatoly Klypin, Jon Holtzman and Bhasker Moorthy Astronomy Department, New Mexico State University, PO Box 30001, Las Cruces NM 88003 ABSTRACT We address the issue of accuracy in recovering density profiles from observations of rotation curves of galaxies. We “observe” and analyze our models in much the same way as observers do the real galaxies. Our models include stellar disks, disks with bars, and small bulges. We find that the tilted ring model analysis produces an underestimate of the central rotational velocity. In some cases the galaxy halo density profile seems to have a flat core, while in reality it does not. We identify three effects, which explain the systematic biases: (1) inclination (2), small bulge, and (3) bar. Inclination effects are due to finite thickness of disk, bar, or bulge. Admixture of a non-rotating bulge component reduces the rotation velocity. A small (200-500 pc) bulge may be overlooked leading to systematic bias even on relatively large ∼ 1 kpc distances. In the case of a disk with a bar, the underestimate of the circular velocity is larger due to a combination of non-circular motions and random velocities. The effect of the bar depends on the angle that the bar makes with the line of sight. Signatures of bars can be difficult to detect in the surface brightness profiles of the model galaxies. The variation of inclination angle and isophote position angle with radius are more reliable indicators of bar presence than the surface brightness profiles. The systematic biases in the central ∼ 1kpc of galaxies are not large. Each effect separately gives typically a few km/serror, but the effects add up. In some cases the error in circular velocity was a factor of two, but typically we get about 20 percent effect. The result is the false inference that the density profile of the halo flattens in the central parts. Our observations of real galaxies show that for a large fraction of galaxies the velocity of gas rotation (as measured by emission lines) is very close to the rotation of stellar component (as measured by absorption lines). This implies that the systematic effects discussed in this paper are also applicable both for the stars and emission-line gas. Subject headings: galaxies: halos—galaxies: local group—galaxies: dwarf—galaxies: kinematics and dynamics—cosmology: dark matter— 1
Transcript of The Rotation Curves of Dwarf Galaxies: A Problem for Cold Dark Matter

arX
iv:a
stro
-ph/
0311
020v
3 2
7 Se
p 20
04
The rotation curves of dwarf galaxies: a problem for Cold Dark
Matter?
George RheePhysics Department, University of Nevada,
Box 454002, Las Vegas, NV 89154
and
Octavio ValenzuelaAstronomy Department, University of Washington
Box 351580, Seattle, WA 98195
Anatoly Klypin, Jon Holtzman and Bhasker MoorthyAstronomy Department, New Mexico State University,
PO Box 30001, Las Cruces NM 88003
ABSTRACT
We address the issue of accuracy in recovering density profiles from observations of rotationcurves of galaxies. We “observe” and analyze our models in much the same way as observers dothe real galaxies. Our models include stellar disks, disks with bars, and small bulges. We findthat the tilted ring model analysis produces an underestimate of the central rotational velocity.In some cases the galaxy halo density profile seems to have a flat core, while in reality it does not.We identify three effects, which explain the systematic biases: (1) inclination (2), small bulge,and (3) bar. Inclination effects are due to finite thickness of disk, bar, or bulge. Admixture ofa non-rotating bulge component reduces the rotation velocity. A small (200-500 pc) bulge maybe overlooked leading to systematic bias even on relatively large ∼ 1 kpc distances. In the caseof a disk with a bar, the underestimate of the circular velocity is larger due to a combinationof non-circular motions and random velocities. The effect of the bar depends on the angle thatthe bar makes with the line of sight. Signatures of bars can be difficult to detect in the surfacebrightness profiles of the model galaxies. The variation of inclination angle and isophote positionangle with radius are more reliable indicators of bar presence than the surface brightness profiles.The systematic biases in the central ∼ 1kpc of galaxies are not large. Each effect separately givestypically a few km/serror, but the effects add up. In some cases the error in circular velocitywas a factor of two, but typically we get about 20 percent effect. The result is the false inferencethat the density profile of the halo flattens in the central parts. Our observations of real galaxiesshow that for a large fraction of galaxies the velocity of gas rotation (as measured by emissionlines) is very close to the rotation of stellar component (as measured by absorption lines). Thisimplies that the systematic effects discussed in this paper are also applicable both for the starsand emission-line gas.
Subject headings: galaxies: halos—galaxies: local group—galaxies: dwarf—galaxies: kinematics and
dynamics—cosmology: dark matter—
1

1. Introduction
The cosmological cold dark matter (CDM)model and its present variant with cosmologi-cal constant (ΛCDM) have been very successfulin accounting for the properties of galaxies andtheir distribution in space. A current problem forCDM lies in observations of dwarf and low sur-face brightness galaxies. The rotation curves andderived density profiles of these galaxies appearto be in conflict with the CDM model (Moore1994; Flores & Primack 1994; Burkert 1995;Hernandez & Gilmore 1998). The problem arisesbecause numerical simulations of the formationof halos in the CDM model reveal steeply cuspeddensity profiles while observations favor shallow(core) profiles. The theory predicts that the massdensity in the inner parts of the dark matter ha-los is best described as an r−α, α = 1 power law(Navarro, Frenk, & White 1997; Power et al.2003; Colin, Klypin, Valenzuela, Gottloeber 2004)or possibly by a power-law with a slightly steeperα = 1.2 − 1.5 slope (Moore et al. 1999; Ghigna etal. 2000; Klypin, Kravtsov, Bullock, & Primack2001; Reed et al. 1999; Tasitsiomi, Kravtsov, Got-tloeber, & Klypin 2004). The observed rotationcurves of a significant fraction of dwarf galaxies,however, suggest that their cores do not have steepdensity cusps (de Blok & McGaugh 1997; Blais-Ouellette, Amram & Carignan 2001; de Blok,McGaugh, Bosma, & Rubin 2001; McGaugh, Ru-bin, & de Blok 2001; Bolatto, Simon, Leroy, &Blitz 2002; Weldrake, de Blok & Walter 2002;Simon, Bolatto, Leroy, & Blitz 2002). Note thatthis is not true for some galaxies and that someobservational results are still consistent with cos-mological predictions (van den Bosch et al. 1999;Swaters, Madore, & Trewhella 2000; van denBosch & Swaters 2001). McGaugh, Rubin, & deBlok (2001) have analyzed Hα observations of50 low surface brightness galaxies of which 36 areof sufficient quality that rotation curves can bederived. The spatial resolution is improved by anorder of magnitude over old 21 cm data. In acompanion paper de Blok, McGaugh, Bosma, &Rubin (2001) conclude that at small (0.5-1 kpc)radii, the mass density distribution is dominatedby a nearly constant density core. The distri-bution of inner slopes is strongly peaked aroundα = −0.2 with clear contradiction with the CDMpredictions. Thus, there appears a controversy
concerning the density distribution of matter inthe inner parts of dwarf galaxies.
We propose a somewhat different approach tothis problem which we believe can help to clarifythese debates. We construct realistic models ofgalaxies and “observe” them as real galaxies usingthe same techniques or algorithms that observersapply to real data. We study the details of theanalysis of observations and we find discrepanciesbetween recovered and true properties of the sim-ulated galaxies. We investigate projection effectsand the effects of bars and bulges on the observedrotation curves. We show that these effects areoften far from negligible.
Some of the effects which we study, have al-ready been discussed. Athanassoula (1984) dis-cussed the biases in the observed rotation curves ofhigh surface brightness galaxies created by strongbars. More recently, Koda & Wada (2002) haveinvestigated the effects of a weak bar on mass de-termination in the central parts of spiral galaxies.They examine rotation curves of edge-on modelgalaxies observed from different viewing angles.The models had a two-dimensional solid rotatingbarred potential. Motion of gas in this potentialwas followed using an SPH code. Koda & Wada(2002) find that the mass estimated from rotationcurves is larger than the true mass by a factorof 5 for 15% of the viewing angles. Overestima-tion in mass occurs more frequently than under-estimation. Koda & Wada (2002) focus on rota-tion curves defined as the highest velocity envelopeof position-velocity diagrams. When the rotationcurve is defined as the intensity weighted mean ofposition-velocity diagrams, the rotation velocity isunderestimated for most of the view angles. Koda& Wada (2002) conclusions are only for edge-ongalaxies; the situation with less inclined galaxiescould be more complex. Another important aspectstudied by Wada, Meurer & Norman (2002) andWada & Koda (2001) is the gravity driven tur-bulence induced by a weak bar in a clumpy andfilamentary gaseous media. If was found that thevelocity dispersion of a cold neutral gas as wellas of an ionized component is significantly lagerthan naively expected if the distribution is clumpy(Wada, Meurer & Norman 2002) or filamentary(Wada & Koda 2001). These results challengethe common expectation that the gas componentin a galaxy is a cold medium with low velocity
2

dispersion.
The effect of bulges on the observed kinemat-ics of galaxies has its own history (e.g., Fillmore,Boroson, & Dressler 1986; Kormendy & Westpfahl1989; Bertola et al. 1995; Vega Beltran et al. 2001;Funes et al. 2002; Pizzella, Corsini, Vega-Beltran& Bertola 2004). An interesting issue here is thedifference between the rotation of stars and rota-tion of gas in the central 1-2 kpc region. Becauseour simulations have only the stellar component(no gas), it is important to know how different arerotation of gas and of stars. Naively, one expectsthat gas as a “colder” component should rotatefaster. The reality is more complicated. A de-tailed discussion of this issue is given in §2. Wealso use our own observations to measure rotationvelocities in stellar and gas components. To sum-marize, like other workers in this field, we find thatoften in the central region the rotation of gas (asmeasured by Hα and NII emission) is not verydifferent from the rotation of the stellar compo-nent.
Some other systematic effects were consideredby Swaters, Madore, van den Bosch, & Balcells(2003) who discuss effects of seeing, finite slitwidth, and slit misalignment for ideal thin expo-nential disks. It is found that all effects systemat-ically underestimate the central slope. The mag-nitude of the bias depends on the distance to thegalaxy and on slit misalignment. de Blok, Bosma,& McGaugh (2003) considered the effects of anoffset between optical and kinematical centers, aswell as a very simplistic attempt to quantify the ef-fects of non-circular motions. Both effects tend tolower the estimated density profile slope. Hayashiet al. (2003) discuss effects of triaxial halos on therotation of gas in CDM simulations, which lead tonon-circular motions.
This paper is organized as follows. In §2 wepresent results of our observations of rotation ve-locities as measured by gas and stars. In §3 wediscuss different observations, focusing on system-atic biases, which may affect rotation curves. Wealso present results of our observations of rotationof gas and stars. In §4 we present and describeour models. Simulations are discussed in §5. Wehave constructed four detailed galaxy models andrun them as N-body simulations. In §6 we presentour methods of analysis of the models and in §7 weshow our results. In §8 we present our conclusions.
2. Observational measurements of rota-
tion curves: gas vs stars
Most observational results which address the is-sue of cusps and cores, provide rotation for gasas measured by either Hα emission or by 21 cmline. The rotation of the stellar component isnot studied because it is difficult to measure fordwarf and LSB galaxies. Nevertheless, there areobservational results for stellar rotation curves fora substantial number of galaxies (e.g., Fillmore,Boroson, & Dressler 1986; Kormendy & Westp-fahl 1989; Bertola et al. 1995; Vega Beltran et al.2001; Funes et al. 2002; Pizzella, Corsini, Vega-Beltran & Bertola 2004). The observed set ofgalaxies cover a wide range of morphological types(from S0’s to Sc’s) and magnitudes. Most of thegalaxies are normal high surface brightness galax-ies, but some are similar to dwarfs studied for the“cusps and cores” problem.
Let’s start with what one naively should ex-pect. Close to the center stars are expected tohave relatively large random (non-circular) veloc-ities. For example, if the stars are in a disk witha constant height, the velocities perpendicular tothe plane of the disk should increase exponentiallyas one gets close to the center in order to react tothe exponentially increasing disk density. Otherrandom velocity components are coupled with thevertical velocities with the radial rms velocity be-ing typically twice larger than the vertical velocity.Non-circular stellar velocities may be even largerif there is a bulge. Large non-circular velocities re-sult in significant asymmetric drift. In turn, thiswould imply that rotational stellar velocity fallssignificantly below the circular velocity. In thecase of gas, one naively expects that rotation isfaster because gas cools and settles in the plane ofthe disk.
The problem with this picture, which is sharedby many astronomers, is that it is too naive. Ithas some justification in the outer parts of diskgalaxies. Indeed, in our own galaxy at the solarneighborhood molecular gas has a smaller heightthan stars. Thus, gas has smaller non-circular ve-locities and must rotate faster. Young stars, whichhave formed relatively recently from the gas, havesmaller asymmetric drift than the older stars. Thispicture of a cold thin gaseous disk inside a thickerslower rotating disk or a bulge is naively applied
3

to the central parts galaxies. Unfortunately, closeto the galactic center the naive picture has lit-tle justification. For example, the disk cannot beconsidered as thin because at distances 0.3-0.5 kpcfrom the center the disk thickness is comparablewith the distance to the center. Gas motions alsoincrease substantially (Vega Beltran et al. 2001;Funes et al. 2002; Pizzella, Corsini, Vega-Beltran& Bertola 2004)
Rotation curves of ionized gas (Hα) as wellas rotation and velocity dispersion curves for thestellar component (absorption lines) were studiedby Fillmore, Boroson, & Dressler (1986). It wasfound that for some galaxies the stellar componentrotates faster than the ionized gas in the centralregion. For other galaxies the rotation of bothcomponents is comparable. In particular, for theSab galaxy NGC 4569, it was found that at 300 pcthe ionized gas rotates with a speed of ∼50 km/s,while the rotation detected in the stellar compo-nent is ∼100 km/s and the stellar velocity disper-sion is ∼150 km/s. The situation is similar inside500 pc. This led Fillmore, Boroson, & Dressler(1986) to suggest that gas rotation might not rep-resent the true circular velocity. NGC 5879, anSb galaxy, shows the same rotation speed for ion-ized gas and for the stellar component up to thedistance of 1 kpc. However, in addition to therotation velocity the stellar component has a ran-dom component. At 200 pc both stars and ionizedgas have a rotation speed of 40 km/s, but the stel-lar component also shows a velocity dispersion of70 km/s. Based on these observations as well as ontheir mass models, Fillmore, Boroson, & Dressler(1986) suggest that ionized gas in these galaxiesis likely to be supported not only by rotation butalso by pressure.
For NGC 4594 (M104) Kormendy & Westp-fahl (1989) measured the rotation of ionized gas(HII regions) and inter-arm gas using Hα obser-vations. The rotation of the stellar componentwas measured using absorption lines. It was foundthat in the central region ionized gas rotates witha 200 km/s, while the stellar component rotatesfaster: its rotation velocity is about 300 km/s.Kormendy & Westpfahl (1989) suggest that ion-ized gas in M104 has smaller rotation because itis either shed by the bulge stars or is somehowrelated with the x-ray halo. The situation forgalaxies with small bulges is not clear. Gas in
small (few hundred parsec) bulges with an effec-tive radius comparable to the disk characteristicheight is probably dense enough to harbor starformation. A coupling between young stars andionized gas could produce non-circular motions inthe gas kinematics and lead to an underestima-tion of the central mass content. Other possi-bilities are discussed and explored by Cinzano etal. (1999). Among these, is a model where gas ismade of clouds. A similar situation was discussedalso by Wada & Koda (2001) and Wada, Meurer& Norman (2002). The clumpy and filamentarystructure of a gaseous component considerably in-creases the asymmetric drift too. Wada, Meurer& Norman (2002) discuss the case of NGC2915, ablue compact dwarf galaxy, that shows a bar anda large velocity dispersion in the H-I kinematics.
There are no strict rules as far as rotation ofgas and stars in the central parts of galaxies areconcerned. In some cases the gas rotates fasteras naively expected (e.g., Sb galaxies NGC772and NGC 7782 (Pignatelli et al. 2001)). In manycases, the rotation of gas and stars in the central1-2 kpc is nearly the same (e.g., Sc NGC 5530and Sb NGC 615 (Pizzella, Corsini, Vega-Beltran& Bertola 2004)). Nevertheless, there is a gen-eral trend that late spirals with small bulges havegaseous and stellar components rotating with al-most the same velocities (e.g., Cinzano et al. 1999;Vega Beltran et al. 2001).
The observational data used in our paper arefrom a program aimed at understanding linestrengths and line strength gradients in bulges.Long-slit spectra were obtained along the ma-jor axes of 37 spiral galaxies using the DoubleImaging Spectrograph (DIS) on the ARC 3.5mtelescope at Apache Point Observatory. The spec-tra cover a large wavelength range (4000 to 7500A or larger) at the cost of spectral resolution (6-8A per pixel). The galaxies span a wide range ofinclination angles and Hubble types. Some of theinclinations are too low to measure rotation andthe condition that Hα is present in emission elim-inates several, mostly early-type, galaxies. Fromthe sample galaxies with different morphologicaltypes and inclinations we selected all 8 galaxies,that had inclinations in the range 45-80 degreesand had Hα in emission at the very center andthrough the most of galaxy. We did not specif-ically target late type galaxies, but, as one may
4

expect, the condition that Hα is in emission atthe galactic center eliminates most early types.
Spectra extracted at different positions alongthe slit were cross-correlated with the spectrum atthe galaxy center. For stellar rotation, the cross-correlation was performed within the wavelengthrange 4100 to 5400 A after masking out emis-sion features and sky lines. For 6 galaxies, rota-tion in the gas component was measured by crosscorrelating within the wavelength ranges 6550 to6600 A to include Hα and NII λ6583. For theremaining two galaxies (NGC 6368 and IC 1029)we used SII doublet (6548-6583 A ) because it pro-vided higher signal-to-noise ratio than the Hα. Adetailed description of the observations and dataanalysis will be presented in an upcoming paper(Moorthy & Holtzman, in preparation). Table 1gives properties of these galaxies.
Rotation curves of the galaxies are shown inFigure 1. Surface brightness profiles along thespectrograph slit are shown in Figure 2. Both thevelocities and the surface brightnesses are mea-sured along the major axis of the galaxies. Forbarred galaxies they are long the bars. A largefraction (but not all) galaxies in our sample showstellar rotation close to that of the gas. All threebarred galaxy in our sample, have complicated ve-locity patterns. In case of NGC5719 there is lit-tle stellar rotation along the bar. Yet, the bar inthe galaxy is quite extreme: more than 10 kpc.This galaxy also presents a peculiar morphologywith a single strong dust lane oriented in differentdirection with respect to the galaxy major axis.A large bulge dominates the central light distri-bution. Based on spectroscopic observations invisible, near and far infrared light as well as inradio wavelengths Hill, et al. (1999) and Hillet al. (2001) conclude that NGC5719 is a com-posite of an AGN and a starburst galaxy. Thisevidence combined with the large size of the barand the existence of a companion NGC 5713, sug-gests that NGC5719 is suffering a strong interac-tion. Hunter et al. (2002) recently presented thecase of NGC4449. This galaxy is also stronglybarred and shows no rotation in the stellar com-ponent. Hunter et al. (2002) propose a modelwhere the orientation of a gaseous younger diskand the stellar component are different as a re-sult of an interaction. The model introduced byHunter et al. (2002) supports our interpretation
of NGC5719, however a detailed modeling of thispeculiar galaxy is beyond the scope of this paper.The other barred galaxies in our sample show largeand strong bars too.
We clearly find a tendency that stars in galaxieswith smaller bulges rotate as fast as the gas. Thisis compatible with previous results (e.g., Cinzanoet al. 1999; Vega Beltran et al. 2001). There areimportant conclusions, which we get form theseresults. (1) Because the stars and the gas movein the same gravitational potential, observed Hαrotation curves must experience the same system-atic biases as the stellar rotation curves. (2) Wecan use stellar-dynamic simulations to study thoseeffects. (3) The environment of a galaxy shouldbe taken in account in the interpretation of thekinematics, specifically for the case of strongly in-teracting galaxies.
3. Observational measurements of rota-
tion curves: systematic effects
For most galaxies corrections for finite diskthickness seems to be quite small. Indeed, at fewkiloparsec distance from the galactic center correc-tions for disk height of few hundred parsec are notsignificant. As far as we know, no correction for fi-nite disk thickness was ever made. Is this justifiedfor central regions (0.5-1kpc) of dwarf galaxies? Itis far from obvious. Observations of edge-on galax-ies indicate that as the function of decreasing cir-cular velocity the disk height decreases slower thanthe exponential disk scale length (Kregel, van derKruit, & de Grijs 2002; Dalcanton 2003). In otherwords, dwarf galaxies are relatively thicker thangiants. Using I-band photometry for 34 edge-onspiral galaxies Kregel, van der Kruit, & de Grijs(2002) give estimates of the exponential heights.For 6 galaxies with maximum circular velocity be-low 100 km/s their results give the average heightof 440 pc. One of the thinnest galaxies is UGC7321 (Matthews 2000) with an exponential heightof 150 pc, which is about what we use for ourmodel IV “Disk”. Interestingly enough Matthews& Wood (2003) find that the neutral hydrogen hasabout the same height as the stellar component.If the galaxies, which are used to study rotationcurves and the dark matter density have the sameheights as those observed edge-on, it is clear thatin the central sub-kiloparsec region, the disks can-
5

not be treated as thin at all.
The effect of finite disk thickness increases withincreasing galaxy inclination. As part of our studywe have examined the data of McGaugh, Rubin, &de Blok (2001) and de Blok, McGaugh, Bosma,& Rubin (2001) to see if we can find evidenceof observational effects involving inclination andgalaxy morphology. McGaugh, Rubin, & de Blok(2001) list the inclinations for a sample of 50 galax-ies which they observed in Hα. de Blok, McGaugh,Bosma, & Rubin (2001) list values for the innerpower law slope (α) of ρ(r) for 48 galaxies. Thereis a partial overlap with the sample of de Blok,McGaugh, & Rubin (2001), other galaxies beingculled from data published by de Blok, & Bosma(2002), Swaters, Madore, & Trewhella (2000) andVerheijen (1997). We have combined these datato produce a list of 43 galaxies. These data areshown in Figure 3. If the estimates of the innerdensity slope α had no biases, there would be nodependence of α with the inclination. This clearlyis not so: the top left corner of the plot does nothave points.
Also note that galaxies identified as barredgalaxies tend to have larger values of α than theaverage. All but one have α > −0.25. We do nothave morphological information for all galaxies inthe sample. The data in Figure 3 suggest thatgalaxies with high inclinations have large α val-ues. Galaxies with inclinations & 60 have α val-ues greater than -1. The evidence suggests thatprojection effects and the presence of bars influ-ences must be taken into account when determin-ing density distributions from rotation curves.
Recent observations of galaxies suggest thatgalactic bars occur more frequently than had beenpreviously suspected. Eskridge et al. (2002) havepresented BVRJHK imaging of a sample of 205bright nearby spiral galaxies. An examination ofTable I in their paper reveals that in the B-band103 of the galaxies are classified as barred spiralswhereas in the H band 140 or ∼70% of the sampleare classified as barred spirals. The conclusionswe draw concerning the effects of bars on the in-terpretation of spiral galaxy rotation curves maywell be relevant to the majority of spiral galaxies.
Dwarf and LSB galaxies used for analysis of ro-tation curves and the dark matter content typi-cally are selected to be “bulge-less”: types Sc-Sd.Yet, it appears that many of them still have small
bulges. Boker, Stanek & van der Marel (2003)have obtained HST WFPC2 images of a sample of19 nearby spiral galaxies of late Hubble type. Forthese galaxies bulges are not evident in the groundbased optical data for these galaxies. The HSTimages were combined with the existing groundbased optical images to obtain surface brightnessprofiles. The conventional wisdom has it that thesequence from early to late-type galaxies rangesfrom bulge dominated to disk dominated galax-ies. The reality seems to be that only ∼30% ofthe galaxies in the sample are pure disk galax-ies (Boker, Stanek & van der Marel 2003). Theremainder are well fitted by adding a bulge com-ponent. Some of these bulges are small, extend-ing out to ∼ 300 pc. Larger bulges extend out to2 kpc. As in the case of bars, the evidence suggeststhat the presence of bulges in spiral galaxies mustbe taken into account in the investigation of rota-tion curves of spiral galaxies. Galaz, Dalcanton,Infante, & Treister (2002) confirm these obser-vations in a near infrared study of 88 low surfacebrightness galaxies and normal spirals. They notethat many of the low surface brightness galaxiesclassified as late types based on optical B-bandimages show a dramatic bulge in the near-IR. Thedata support the conclusion of Beijersbergen, deBlok & van der Hulst (1999) that many low sur-face brightness galaxies could be regarded as highsurface brightness bulges embedded in low surfacebrightness disks. Since the surface brightness inthe near-IR closely reflects the stellar surface den-sity it is important to take bulges into accountwhen modeling the rotation curves of low surfacebrightness galaxies.
Note that the bulges are really small. A 300 pcbulge is hardly thicker than the disk. Physicalconditions in such small bulges are not much dif-ferent from those in the disk. Stars can form inthose bulges.
The next important point to keep in mind isthat of accuracy. How accurately can one de-termine the inclination of a galaxy? We referto NCG 3109, a Magellanic type spiral that wehave attempted to model in some detail (Valen-zuela, Rhee & Klypin 2004). Jobin & Carig-nan (1990) quote several values of inclination forthis galaxy of 80 ± 2 based on B-band photom-etry. The same authors find a value of 75 ± 2
based on photometry of an I-band plate taken us-
6

ing the U.K. Schmidt telescope. In a more recentstudy, Blais-Ouellette, Amram & Carignan (2001)present CFHT Fabry-Perot H-α observations ofNCG 3109. These data show an inclination be-tween 85 and 90 with one inner point at 74.Although the formal uncertainty in inclination ina given waveband may be as small as 2, a morerealistic value is at least 5 for the uncertainty ina galaxy’s inclination. Barnes & Sellwood (2003))support this conclusion. Based on a study of 74spiral galaxies they find that systematic uncertain-ties in position angle and inclination due to thepresence of nonaxisymmetric structure are of or-der ∼ 5. These estimates are of course lower lim-its on the real errors. Weldrake, de Blok & Walter(2002) publish inclinations and position angles ofthe local group dwarf NGC 6822 as a function ofradius based on radio data obtained with the Aus-tralia Telescope Compact Array. The values forthe inclination angle of this galaxy as a functionof radius fluctuate between ∼ 80 and 20! In theiranalysis, a constant value 60 is adopted withoutfurther explanation. The position angle for thisgalaxy varies between 100 and 140 according tothese data.
To summarize, there are three key points thathave guided our analysis. Firstly, the central den-sity profile obtained for a given galaxy appears tobe influenced by the inclination of the galaxy, forinclinations greater than 60 at least (it is difficultto determine the inclination of these dwarf galax-ies to better than several degrees; ∼ 5). Secondly,the data seem to indicate that galaxies with barshave densities that flatten in their centers whenthe standard analysis is performed. Errors of sev-eral degrees (∼ 5) can occur when determininginclinations. Thirdly, given increasing evidence forbulges in spiral galaxies of all morphological types,it is important to examine the biases that bulges(as well as bars) introduce into the determinationof central density profiles.
4. Models
We use N -body simulations to produce mod-els of galaxies. The models include realistic darkmatter and stellar component, but do not havegas. Gas would significantly complicate numer-ical models making predictions less certain. Indwarf galaxies gas is very patchy and often has
significant non-circular motions (e.g., Bolatto, Si-mon, Leroy, & Blitz 2002; Simon, Bolatto, Leroy,& Blitz 2002). The stellar component has its owncomplications as we find below, but those are rel-atively simple and easy to interpret as comparedwith the gas motions. In dwarf galaxies, the gashas all the complications of stars and in additionit brings its own problems. Studying the stellarcomponent is definitely a good starting point.
We study the kinematics and spatial distribu-tion of stellar component in four models. Parame-ters of the models are given in Table 2. All themodels are scaled to have a maximum circularvelocity of approximately 60 km/s, which is thevalue for dwarf galaxies such as NGC3109 (Jobin& Carignan 1990) and NGC6822 (Weldrake, deBlok & Walter 2002). The virial masses for thesemodels are in the range (4 − 7) × 1010M⊙. In allcases the baryonic component represents a verysmall fraction (1%-2%) of the virial mass, whichis a factor of ten smaller than the cosmologicalratio of the baryons to the dark matter.
All models have extended (∼ 100 kpc) halos,which have high concentration NFW density pro-files. We did not try to make more realistic fitsfor the dark matter halos. In reality the halosshould be slightly perturbed in the central partbecause of the presence of baryons. We decidedto neglect this effect in favor of simplicity of themodels. Most of our models have very thin disks.Real disks are typically thicker than what we as-sume for our models. The only model, which hasa realistic disk is the “Disk” model V.
The first two models (dubbed “Bar” and“Dwarf”) start with a pure stellar disk embed-ded in an extended dark matter halo. Initially thedisks in the models are submaximal: about 50%of mass in central 1 kpc is in the disk the rest isin the dark matter. The disks are relatively cold(stability parameter Q is 1.2). As the result of thiscombination of parameters, the disks are unstableand produce bars. The main difference betweenthe models is that the disk in the model “Bar”is significantly more massive than in the model“Dwarf”.
Models “Bulge”, “Thin Disk”, and “Disk” donot have bars. The models are stable - they donot evolve much. Nevertheless, we run the modelsfor about 1.5-2 Gyrs to ensure detailed equilib-rium. Indeed, small variations are found in the
7

models. Initially the rotational velocity does notdepend on the distance z to the disk plane. Af-ter evolution we find that the rotational decreaseswith z. This tendency increases effects of galaxyinclination. Models “Thin/Thick Disk” have rela-tively hot disks (Q = 3.0). The disks are also moreextended, which make them sub-dominant even inthe center. The disks did not develop a bar.
Figure 4 presents details of the distribution ofdifferent quantities for models II and III. The mod-els to some degree are similar and are representa-tive for the other two models (I and IV). In mod-els II and III the dark matter is dominant in theouter regions, but is sub-dominant in the central500 pc. Velocity dispersions of baryonic compo-nents are very small. For example, for models IIand III the rms velocities are smaller than 15 km/seven at 1kpc radius.
5. The Numerical Simulations
The procedure of generating of initial condi-tions is described in detail in Valenzuela, & Klypin(2003). We use the following approximation forthe density of the stellar disk in cylindrical coor-dinates:
ρd(R, z) =Md
4πz0R2d
e−
R
Rd sech2(z/z0), (1)
where Md is the mass of the disk, Rd is the expo-nential length, and z0 is the scale height. Thelater was assumed to be constant through thedisk. Effective exponential scale height (height atwhich the density decreases by e−times) is equalto ze = 1.085z0. The disk is truncated at fiveexponential lengths and at three scale heights:R < 5Rd, z < 3z0. Disk mass was slightly cor-rected to include the effects of truncation. Thevertical velocity dispersion σz is related to the sur-face stellar density Σ and the disk height z0:
σ2z(R) = πGz0Σ(R), (2)
where G is the gravitational constant. The ra-dial velocity dispersion σR is also assumed to bedirectly related to the surface density:
σ2R(R) = Ae
−R
Rd . (3)
The normalization constant A in eq. (3) is fixedin such a way that at any radius R the rms ra-dial random velocity is Q times the critical value
needed to stabilize a differentially rotating diskagainst local perturbations. The tangential (φ)component of the rotational velocity and its dis-persion are found using the asymmetric drift andthe epicyclic approximations. For the disk compo-nent we use the thin-disk approximation.
For model “Bulge” we also add a spherical non-rotating component with the Hernquist densityprofile:
ρdm(r) =ρs
x(1 + x)3, x = r/rH , (4)
where rH is the 1/4-mass radius. For the modelrH = 125 pc, which gives half-mass radius 250 pc.
We assume that the dark matter density profileis described by the NFW profile (Navarro, Frenk,& White 1997):
ρdm(r) =ρs
x(1 + x)2, x = r/rs, (5)
Mvir = 4πρsr3
[
ln(1 + C) −C
1 + C
]
, (6)
C =rvir
rs
, (7)
where Mvir and C are the virial mass and theconcentration of the halo. For given virial massthe virial radius of the halo is found assuming aflat cosmological model with matter density pa-rameter Ω0 = 0.3 and the Hubble constant H0 =70km/sMpc−1.
Knowing the mass distribution of the systemM(r), we find the radial velocity dispersion of thedark matter:
σ2r,dm =
1
ρdm
∫ ∞
r
ρdm
GM(r)
r2dr.. (8)
The other two components of the velocity disper-sion are equal to σ2
r,dm. In other words, the ve-locity distribution is isotropic, which is a goodapproximation for the central parts of the darkmatter halos. At each radius we find the escapevelocity and remove particles moving faster thanthe escape velocity. The dark matter halo is trun-cated at the virial radius,
Velocities are picked from an appropriate Gaus-sian distribution truncated at the escape velocity.The disks are realized with particles of an equalmass. The dark matter halo is composed of parti-cles of variable mass with small particles placed in
8

the central region and larger particles at larger dis-tances. We double the particle mass as we movefurther and further from the center. The regioncovered by small mass particles is ∼ 20 kpc – muchlarger than the size of the disk. In order to reducethe two-body scattering each dark matter particlein the central region has the same mass as a diskparticle. This procedure is designed to reduce thenumber of particles and, at the same time, to allowus to cover a very large volume.
We use the Adaptive-Refinement-Tree (ART)N -body code (Kravtsov et al. 1997; Kravtsov1999) to run the numerical simulations analyzedin this paper. The code starts with a uniform grid,which covers the whole computational box. Thisgrid defines the lowest (zeroth) level of resolutionof the simulation. The standard Particles-Mesh al-gorithm is used to compute the density and grav-itational potential on the zeroth-level mesh withperiodical boundary conditions. The code thenreaches high force resolution by refining all highdensity regions using an automated refinement al-gorithm. The refinements are recursive. A refinedregion can also be refined. Each subsequent re-finement level has half of the previous level’s cellsize. This creates a hierarchy of refinement meshesof different resolution, size, and geometry coveringregions of interest. Because each individual cubiccell can be refined, the shape of the refinementmesh can be arbitrary and effectively match thegeometry of the region of interest. This algorithmis well suited for simulations of a selected regionwithin a large computational box, as in the simu-lations presented below.
The criterion for refinement is the local densityof particles. If the number of particles in a meshcell (as estimated by the Cloud-In-Cell method)exceeds the level nthresh, the cell is split (“refined”)into 8 cells of the next refinement level. The refine-ment threshold depends on the refinement level.The threshold for cell refinement was low on thezeroth level: nthresh(0) = 2. Thus, every zeroth-level cell containing two or more particles was re-fined. The threshold was higher on deeper levelsof refinement: nthresh = 3 and nthresh = 4 for thefirst level and higher levels, respectively.
During the integration, spatial refinement is ac-companied by temporal refinement. Namely, eachlevel of refinement is integrated with its own timestep, which decreases by factor two with each re-
finement. This variable time stepping is very im-portant for accuracy of the results. As the forceresolution increases, more steps are needed to in-tegrate the trajectories accurately.
6. Analysis
We have analyzed the N-body simulations usingseveral methods or algorithms that mimic thoseused by the observers. Our data consist of ve-locities, positions and masses of the particles thatconstitute the disk of the model galaxy. The sim-ulations are set up so that the plane of the diskis the x − y plane. During our ’observations’ we’look’ down the z−axis of the simulation. To ob-serve our galaxy at various inclinations we simplyrotate y − z plane about the x−axis by varyingangles.
The object of the exercise is to calculate rota-tion curves for our model galaxies as well as re-construct the density profile. We have also con-structed velocity field diagrams in the form of ve-locity contour plotted on the sky. One methodfrequently used by optical observers is long slitspectroscopy. In our case, we place a rectangularslit running parallel to and centered on the x-axis.We then select all particles whose x−y coordinatesplace them within the slit boundaries. We definepixels along the slit and we assign particles fallingin the slit to these pixels. We compute the line-of-sight velocity of each particle. We then computethe average velocity of the particles in each pixel.This average velocity, determined as a function ofdistance along the slit, is our “observed” rotationcurve. By comparing this average rotation veloc-ity with the true average velocity as well as thecircular velocity, we can estimate the accuracy ofthe method.
In the case of HI observations in the radio andFabry-Perot measurements in the optical, one hasvelocity information over the whole galaxy imagenot just along a narrow slit. In this case, observersdetermine the rotation curve using a tilted ringmodel of the velocity field. The method has beendescribed by Begeman (1989). We reproduce thesalient points below
6.1. The Tilted Ring Model
The model is based on the assumption that arotating disk galaxy can be described by a set of
9

concentric rings. Each ring has a constant cir-cular velocity Vc and two orientation angles (theinclination angle, i, and the position angle of themajor axis, φ). The values of the ring parametersare determined from the observed radial velocitiesin a set of concentric elliptic annuli in the planeof the sky. The ellipticity of the annuli, deter-mined from isophotal analysis, fixes the inclina-tion of each ring. V0 is the systemic velocity ofthe galaxy (in our case 0 km/s). For a given ring,the observed radial velocities recorded on a set ofsky coordinates (x, y) are related to the basic pa-rameters by:
V (x, y) = V0 + Vc(R) sin(i) cos(θ). (9)
In the expression above, θ is the azimuthal angle inthe plane of the galaxy, related to the parametersi, φ, x0 and y0 through:
cos(θ) =−(x − x0) sin(φ) + (y − y0) cos(φ)
R(10)
sin(θ) =−(x − x0) cos(φ) + (y − y0) sin(φ)
R cos(i), (11)
where R is the mean radius of the ring in the planeof the galaxy.
The first step in such a procedure is to deter-mine the the position angle and ellipticity of the‘isophotes’ of the model galaxy image. To do thiswe project all the particle positions on the skyplane. We then form an image in FITS formatthat we process using IRAF 1. We use a packagewithin IRAF called STSDAS 2. Within STSDASwe use the ELLIPSE task which to fit a set of el-liptical isophotes over the image. The method hasbeen described by Jedrzejewski (1987).
Line-of-sight velocities measured at positionsclose to the minor axis carry less informationabout the underlying circular velocity than thosemeasured at positions close to the major axis. Wehave excluded all values of the angle θ > 45 where
1IRAF is written and supported by the IRAF programminggroup at the National Optical Astronomy Observatories(NOAO).
2This is the software for reducing and analyzing data fromthe Hubble Space Telescope. It is layered on top of IRAFand provides general purpose tools for astronomical dataanalysis as well as routines specifically designed for HSTanalysis.
θ is the angle with respect to the major axis in theplane of the galaxy. Weldrake, de Blok & Wal-ter (2002) experimented with different weightingschemes, such as down weighting the minor axis by| cos θ| and cos2 θ. They also varied the exclusionby angle between 45and 15and found no differ-ence in the curves produced for their analysis ofthe galaxy NGC 6822.
Once we know the values of φ, i and R wecan compute Vc for the each elliptical annulus andthus obtain Vc(R), the rotation curve. As withthe long slit method, we can compare Vc(R) withthe known rotational velocities and true circularvelocities for the model galaxy.
6.2. Density profiles
One can invert the observed rotation curve todetermine the parent mass distribution (de Blok,McGaugh, Bosma, & Rubin 2001) using the equa-tion
4πGρ(r) =2v
r
∂v
∂r+
(
v
r
)2
. (12)
This procedure assumes that the galaxy is spher-ically symmetric, completely dark matter domi-nated and that the gas moves in circular orbits ina planar disk. It is worth checking the reliabilityof the method using a realistic model of a galaxy.
7. Results
7.1. Long Slit Observations
7.1.1. Models IV and V (no bar, no bulge)
We observe the models IV and V in a mannerdesigned to mimic long slit observations. In thefollowing discussion we take circular velocity tomean the velocity at which a particle would moveif it was moving in uniform circular motion aroundthe center of the galaxy. The term rotational ve-locity refers to the speed at which a particle actu-ally is rotating about the center of the galaxy; thetotal velocity of the particle can of course be largerthan this. The term ”observed velocity” refers tothe mean observed velocity at a given radius fromthe center. As we shall show, this latter numbercan have a value that is considerably smaller thanthe rotational velocity which in turn can be con-siderably smaller than the circular velocity.
Figure 5 compares the rotation curve obtainedin this manner with true rotation velocities in the
10

disk which we can measure directly. We also de-termine the total circular velocity that would bemeasured if there were no random velocities in thedisk (i.e. perfect circular motion in the galaxypotential). In order to mimic slit observations,we incline the model by some angle and find line-of-sight velocities for “stars” inside a long slit of100 pc width.
A clear trend is that the discrepancy betweenthe “observed” and true rotation curves increaseswith inclination of the galaxy. By the time onereaches an inclination angle of 80 the discrepancyis ∼ 8 km/s at a radius of 0.5 kpc. This is a 30%in the estimation of velocity in the central part ofthe galaxy.
Why does the long slit mode of observation leadto underestimates of the rotational velocities inthe disk? Let us consider a simple example. Formodel IV we take a line of sight through the planeof the disk whose closest approach to the centerof the galaxy is 0.7 kpc. We choose this numbersince it is within the central kiloparsec of dwarfgalaxies that mismatch between theory and ob-servation is greatest. Averaging the velocities ofN-body particles along this line of sight is equiva-lent to measuring the rotation velocity at one pixellocation of a long slit observation. The velocitiesare weighted by the density of material along theline of sight. Ironically, the smallest rotational ve-locity occurs for the points that are located closestto the center of the galaxy. Since we are averag-ing this velocity with velocities of points furtherfrom the center that thus have larger circular ve-locities, how can the average be lower? The pointof course is that we measure radial velocities alongthe line of sight. For example, a particle located5 kpc away from the center of our model rotates at60 km/s. However, the projected velocity of thisparticle on a line of sight 0.7 kpc from the centerof the model is only 9 km/s. The rotational veloc-ity of the disk 0.7 kpc from the center is 30 km/s.The average velocity that we measure along thisline of sight is 20.4 km/s or 70% of the true ve-locity. One might well expect this difference tobe even larger given that we are including radialvelocities as low as 9 km/s. The answer is thatthe integral is intensity weighted so that pointsnear the center carry considerably more weight inthe mean determination than those near the edgeof the galaxy. For example, for the whole line of
sight we get a mean velocity of 20.4 km/swhile weget 26 km/sif we include only the central kpc.
The discussion above refers to the model viewededge-on. The effect of viewing the galaxy at alower inclination is to include particles that areabove and below the galactic plane in the inte-gral. Figure 6 shows the radial velocity versus lineof sight distance for particles viewed with an in-clination angle of 75. The points in the plot onthe left are selected at location along the slit of0.6 to 0.8 kpc, those in the right hand plot areselected from 4. to 4.2 kpc. It is clear (as ex-pected) that particles located above the plane ofthe galaxy have slower rotational velocities. Themean velocity measured as a function of distancealong the line of sight matches the rotation curvecomputed for particles 0.25 kpc above the disk atabout 1 kpc, which is where one would expect itto for an inclination angle of 75. Note that par-ticles further than 0.25 kpc from the plane of thegalaxy are not substantially affecting the velocitymeasurement because the density out there is toolow.
One might ask why, given these projection ef-fects, the rotational velocity is only underesti-mated for lines of sight passing close to the centerof the galaxy. Lines of sight that pass more than∼2 kpc from the center the measured velocitiesare in good agreement with the true rotational ve-locities for our models. The right hand plot ofFigure 6 illustrates this; we do a good job recover-ing the rotational velocity of the particles at largeradii. When the distance of the line of sight fromthe center of the galaxy is comparable to the sizeof the disk, the projection effects are quite differ-ent to those discussed in the previous case. Firstly,the spread in radii of particles in the line of sightis smaller at for lines of sight at larger distancesfrom the center. Secondly, the projection effectsare less pronounced at larger radii. Particles goingat a given rotational speed have higher measuredradial velocities because of the inherent geometry.These points are illustrated in Figure 7.
7.1.2. Model I: The Barred Galaxy Model
We refer to Model I in Table I as the barredgalaxy model. For the case of this model, the sit-uation is much more complex. We have examined3 cases which span the range of possible geome-tries. One with the bar at 45 degrees to the line of
11

sight (referred to as bar45), one case with the baraligned along the line of sight (bar0) and thirdly acase where the bar is aligned perpendicular to theline of sight (bar90). In each case we use the samegalaxy model; we just change the viewing angle.For each of these three cases we choose differentinclination angles.
In the bar45 geometry viewed at an inclinationof 60 we recover the true rotation curve with anaccuracy 2 km/s. In the case of a bar aligned withthe line of sight (bar0) one gets larger rotationalvelocities measured in the central kpc region ofthe galaxy than are truly present. This is dueto motions within the bar that are not rotationalbut contribute to the perceived rotational velocity.Such a bar viewed lengthwise would not be classi-fied as a bar but most likely as bulge and likely willbe discarded. The velocity differences observed inthis situation can be large; ∼ 10 − 15km/s. Thethird case when the bar is perpendicular to theline of sight and clearly visible as a bar, resultsin observed rotational velocities that are smallerthan the true rotational velocities in the disk. Themismatch between the long slit result and the ro-tational velocities for a galaxy viewed at an incli-
nation angle of 75
is of about 25% at a 1 kpcradius. Inclination angle determinations are sub-ject to rather large uncertainties as we mentionedabove. If an inclination angle of 65 had beendetermined this galaxy the mismatch between thetrue and observed velocities would be increased byseveral km/s. As we showed in Figure 3 it is galax-ies with bars that tend to have the lower rotationalvelocities in their centers.
The conclusion from the long slit analysis isthat it is possible to underestimate the rotationalmotions in the central parts of dwarf galaxies byas much as 10 km/s using long slit data. This isa 30% error in the rotational velocity. The erroris simply due to the way the line of sight samplesthe velocities in a rotating disk of finite thickness.Adding a bar into the picture can enhance or de-crease this effect depending on the orientation ofthe bar relative to the observer. When the barlies in the plane of the sky the differences are in-creased. Bars are not always easy to detect. How-ever the inclination angle and position angle mea-sured as a function of radius can give indicationsas to the presence of a bar.
7.2. The Tilted Ring Model: Results
7.2.1. Model IV (no bar, no bulge)
At low inclinations we find that a small error inthe inclination measurement can affect the veloc-ity results substantially. For example, we viewedmodel IV with at an inclination of 10 but theellipse fitting software estimated an inclination14 resulting in underestimates of the rotationalvelocity of 10-15 km/s about 40%. At inclinationsof ∼ 60 the measured velocities accurately matchthe rotational velocities over the measured rangeof 0.2 to 4 kpc. At an inclination of 75we find thatunderestimates of the velocity of ∼ 5km/s occurat radii of less than 0.4 kpc, a 20% error in veloc-ity. At an inclination of 80 the velocity under-estimates occur at radii smaller than 0.7 kpc. At0.2 kpc the mismatch is about 8km/s, a 25% errorin the velocity estimate. These results are shownin figure 8.
7.2.2. Model I:Effect of a bar on the tilted ringresults
The tilted ring analysis described above is theone adopted to calculate rotation curves using wellresolved high signal to noise data. The methodis applied to datasets where velocity informationis available over the whole image plane, not justalong a narrow slit. In practice observers haveassumed a fixed or slowly varying position angleand inclination as a function of radius when imple-menting this method (Weldrake, de Blok & Walter2002).
To see the effect of the bar on rotation velocity,we selected disk particles in a ring from 1 kpc to1.1 kpc and examined their rotation velocity as afunction of azimuthal angle. The signature of thebar is clear. Particles located close to the positionangle of the bar have significantly smaller rota-tional velocities on average. The bar is locatedtwo quadrants of the galaxy. We compute the av-erage velocity of all the particles in the ring andobtained a value of 38.6km/s. When we excludethe quadrants containing the bar we obtain a valueof 43.5 km/s. We have plotted the mean rotationvelocities of particles in the disk, computed by ex-cluding particles in the bar, this is the dotted lineshown in Figure 9. We also show as a dashed linethe circular velocity in Figure 9. The point is thatthere are a number of significant mismatches in the
12

center of the galaxy. The tilted ring method doesnot recover the average rotational velocities in thedisk. Even if it did, this would not be sufficient,since the average is lowered by the presence of abar. Even if one has a good measure of the rota-tional velocities in the disk, one needs an accuratemethod of calculating asymmetric drift to recoverthe circular velocity. The bottom line is that largemismatches occur between the observed and truevelocities in the central part of the disk when a baris present. At 1 kpc from the center of the galaxythe observed velocity is 30% less than the true ve-locity. At 0.5 kpc from the center of the galaxythe observed velocity is 50% of the true velocity.
It does not take a very large error in velocityto produce a significant error in the power lawslope of ρ(r). Let us suppose we compute ρ(r)at 1 kpc and 2 kpc from the center of the galaxyand that we get the correct answer at 2 kpc butunderestimate the rotation velocity and 1 kpc. Letus say we think the velocity is 31km/s when thetrue velocity is 35km/s. The percentage error is ∼10%. The rotational velocity enters as the squarein the mass measurement so the resulting error inthe density is ∼ 20% such that a power law index-1 is measured to be -0.65.
7.2.3. Model I: Recognizing a Bar
CCD imaging studies reveal that ∼70% of spi-ral galaxies are barred (Eskridge et al. 2002). Toavoid complications, galaxies should be selectedfor rotation curve studies from the remaining 30%.However, our models suggest that bars may well bepresent in galaxies where imaging does not revealtheir presence. We have demonstrated that barsin galactic disks give rise to errors when inferringgalaxy masses from rotation curves. One mightargue that barred galaxies are easily recognizableand hence can be easily excluded from galaxy sam-ples. This is not the case. We show in figures 10and 11 contour plots of the surface density of par-ticles for the barred galaxy model viewed at an in-clination of 75. The surface density is measuredas magnitudes and the contours are equally spacedin magnitude to mimic observational plots. It iscertainly difficult to see the presence of a bar fromdensity contours alone. Bars do cause variationsin the inclination angle and position angles mea-sured as a function of radius but warps and bulgescan produce similar effects. We also show next to
the contour plots, the “luminosity profiles” of ourmodel disks. These plots also reveal the presenceof the bar in an indirect way.
It is striking to what extent the signature ofthe bar can vary in the surface density profile de-pending on the viewing angle. The bar can havethe appearance of a bulge, or produce a suddendecrease in surface brightness, or have no markedeffect.
7.2.4. Model II:Evolution of a bar
We use model II to study effects of bar evolutionon rotation curves. We have examined outputs ofthe simulation at three stages of the bar forma-tion. The first snapshot was made 1.4 Gyr afterthe start of the simulation when the bar is stillweak. The second snapshot was made 1.62 Gyrafter the start of the simulation at which pointthe bar is strong. The final snapshot was taken2.15 Gyr after the start of the simulation whenthe bar has buckled. Buckling refers to the bend-ing of the bar into a peanut shape forming a thick-ened double lobed structure (Combes & Sanders1981). The rotation curve results are shown inFigure 12. As expected there is a large increase inmismatch between the circular and observed ve-locities as the strength of the bar increases. Afterthe bar has buckled, the observed velocity is lessthan 50% of the circular velocity 0.5 kpc from thecenter of the galaxy. Figure 13 shows the incli-nation based on the isophote analysis. One canclearly see the effect of the bar extending to largerradii as the simulation evolves. Since we are view-ing the bar perpendicular to the line of sight thereare no isophote twists although these would bepresent if one viewed the bar at some angle eitherthan perpendicular or parallel to the line of sight.
7.2.5. Model III: Effect of a bulge on the tiltedring results
Infrared studies of spiral galaxies and low sur-face brightness galaxies (Boker, Stanek & van derMarel 2003; Galaz, Dalcanton, Infante, & Treis-ter 2002; Beijersbergen, de Blok & van der Hulst1999) show that the majority of these systems con-tain bulges. We have run a simulation to explorewhat effect the presence of a bulge has on thetilted ring results. Model III “Bulge” is designedto mimic the bulges detected by Boker, Stanek &
13

van der Marel (2003): it has a very small bulgewith half mass radius is 250 pc. Figure 14 showsthe results of the tilted ring analysis for model III.It is clear that bulges as well as bars can resultin low rotational measurements in the central re-gions of galaxies where the circular velocity is infact high. The differences are of order 10-20km/sin the central 0.5 kpc. The velocity error rangesfrom ∼20% at 1 kpc to ∼ 50% at 0.2 kpc. In thecase of a barred model the greatest cause of themismatch are the non-circular motions producedby the bar. Due to the presence of the bar, a largefraction of stars and gas parcels have velocitiesorthogonal to the line of sight. These velocitiesare undetected by the emission line observations.This effect strongly depends on the bar orienta-tion and is maximum when the bar is perpendic-ular to the line of sight. The case of galaxies withsmall bulges is slightly different. A bulge is a sys-tem substantially supported by random motions.An observer performed an average along the lineof sight taking into account all particles belong-ing to either the disk or the bulge. For disk par-ticles the detected radial velocity is close to theprojected circular velocity along the line of sight,a small correction should be applied because ofthe asymmetric drift. For bulge particles the de-tected radial velocity component is comparable tothe velocity components orthogonal to the line ofsight. Systematically bulge particles show smallervelocity along the line of sight compared with diskparticles, for the same circular velocity. There-fore the avenge or the observed rotation velocityis artificially biased toward lower values.
When models are viewed at low inclinations,error in the inclinations can cause large system-atic errors in the rotation velocity estimates. Forexample the tilted ring algorithm produces an in-clination value of 26.7 for the model viewed atan inclination of 20. The resulting error in sin iresults in a ∼25% error in velocity. A 25% errorin velocity translates as a 50% error in the densityin the outer parts of the galaxy.
The dynamical signatures of the bulge modelextend to larger radii than its signature in thesurface density profile plots. For an inclinationof 60, the small bulge does not make a significantcontribution to the surface density profile beyond400pc, but rotation velocities are determined tobe significantly lower due to its presence beyond
1.2 kpc. By comparison, the model with no barand no bulge, model IV, when viewed at an incli-nation of 60 shows good agreement between therotation velocity and the observed velocity downto 200 pc.
7.2.6. Model V: Effect of disk thickness on thetilted ring results
The motivation for Model V “Disk” is to gaugethe effect of disk thickness on the underestima-tion of rotational velocity in the central Kpc ofthe models. Figure 15 shows velocity and inclina-tion for the disk model viewed at an inclinationof 75. The mismatch between the “observed” ve-locity and the rotational velocity is 10 km/s at0.4 Kpc and 6 km/s at 0.2 Kpc. The thin diskmodel IV analysis reveals a smaller mismatch of3 km/s at 0.4 Kpc and 6 km/s at 0.2 Kpc. Asexpected the mismatch increases with disk thick-ness at the largest inclinations.
7.2.7. Surface Density Profiles
Using the Ellipse task in the package STSDASwe can produce surface density profiles for ourmodels. This is the same package used by Boker,Stanek & van der Marel (2003) among others toproduce surface density profiles of galaxies. Weare thus processing our N−body “data” in as simi-lar a manner as possible to the observers. The sur-face density profile for the barred galaxy model isshow in the four panels of Figure 16. We are view-ing the galaxy at an inclination of 75and showinghow the surface density profile is affected by vary-ing the angle the that bar makes with the line ofsight. The bottom right panel showing the profilethat results in viewing the bar along the line ofsight, illustrates the point that in this geometry abar can be mistaken for a bulge. When the baris viewed perpendicular to the line of sight we seea sudden dip in the surface brightness at about2 kpc. This dip is not so prominent when thebar is only slightly rotated from the perpendicu-lar (upper right panel). It is clear that a numberof the features found in these surface brightnessplots qualitatively resemble features found in thedata presented by Boker, Stanek & van der Marel(2003).
Figure 17 shows the same analysis for model III(bulge model). By varying the inclination angle
14

we vary the contribution of the disk to the surfacebrightness. The slope of the disk contribution alsovaries depending on the viewing angle. The bulgesignature in the surface brightness plot does notextend beyond ∼ 0.6 kpc whereas the rotation ve-locity is underestimated out to ∼ 1.2 kpc.
Figure 18 shows the effect of viewing the modelat constant inclination during its evolution. Onecan see the growth of the bar as a shift in the loca-tion of the point at which the profile slop changes.This point occurs at roughly 0.5 kpc in the upperpanel, shifts to 1.5 kpc in the lower left panel andback inward to about 1 kpc as the bar buckles.
Figures 16 to 18 illustrate the variety of profilesthat can be produced by adding bulges and barsto rotating disks. In few cases, based on surfacedensity profiles alone, is it immediately clear thata bar or bulge must be present. Bars can appearas bulges or disappear almost entirely dependingon the viewing angle. Bulges can affect only thecentral 200 pc or extend as far as 1 kpc depend-ing on the intrinsic bulge size and viewing angle.The bar signature also changes as the instabilityevolves in the disk. We have shown earlier thatbars and bulges significantly affect the interpre-tation of rotation curves. The figures discussedin this section show that is is difficult to unam-biguously identify these features based on surfacedensity profiles alone. This section is intended asa cautionary note to researchers who ignore thesefeatures in the analysis of galaxy rotation curves.
7.3. Density Profiles From Rotation Curves
As explained in section 5.2, one can infer thedensity distribution in a galaxy from its rotationcurve using eq. 12. Under the assumption thatgas and stellar mass contribution is negligible, itis possible to recover the dark matter halo densityprofile. LSB and Dwarf galaxies are considered toclosely satisfy the assumption of being completelydark matter dominated and it is the applicationof this is the method to LSB and Dwarf galaxieswhich gives rise to the inference of flat cores in thecentral density distributions of galaxies. With ourmodels we can check the accuracy of this method.
For model IV (with no bar and no bulge) theellipse fitting method does a reasonable job recov-ering the true density. The density versus radiusis shown for the model with no bar viewed at an
inclination of 80 in Figure 19. At radii of lessthan 1 kpc the density is underestimated by about30%. The underestimates vary from 10% to 50%depending on the inclination angle.
These effects are much more pronounced for thebarred galaxy model. In figure 20 we show thedensity for the barred model viewed at an inclina-tion of 75. Figure 21 and Figure 22 show the sameanalysis with the bar in the plane of the sky andperpendicular to the plane of the sky. The effectsare most pronounced on the latter case. When thebar is perpendicular to the line of sight it is easyto see how an observer would infer the presence ofa constant density core in the center of the galaxy.The orientation of the bar with respect to the lineof sight has a strong effect on the inferred densityprofile.
We have computed the the slope of the ρ(r)curve at locations smaller than 1 kpc for the threebarred models. We show these in the histogram inFigure 23. The key points is that for barred galaxymodels viewed at an inclination greater than orequal to 60we always measure a slope that is shal-lower than the true slope. For a true slope of -2we can obtain slopes as shallow as 0. Note thatthe NFW profile has a slope of -1, in the light ofour findings it is not surprising that slopes of shal-lower than -1 are being found near the centers ofdwarf galaxies.
8. Conclusion
The rotation curves of dwarf and LSB galax-ies arguably present the most challenging prob-lem for current cosmological models. The key tothis problem lies in reliably estimating the accu-racy with which one can recover the mass distri-bution and, thus, the dark matter density usingobserved rotation curves. This is the main ques-tion which we address in this paper by studyingrealistic numerical models. The models mimic realgalaxies in many respects. For example, they havethin (∼ 100 pc) and cold (∼ 10 km/s) exponen-tial disks. The latter condition is very importantbecause many effects are related to the magnitudeof random motions.
The main lesson to be learned from our analy-sis is that there are many systematic biases. Eachbias can be very small (only few km/s), yet theyall add up to produce significant effects. We find
15

that the tilted ring analysis of spectroscopic dataresults in large 30% to 50% underestimates of therotation velocity in the central 1 kpc region of thegalaxy models. These underestimates in velocityin turn result in the inference of slopes in the cen-tral density distributions of our models that areshallower than the true slopes.
A quantitative understanding of these biases isimportant if one is to accurately interpret rotationcurves. If one ignores these biases, the analysisof rotation curves can produce misleading results.The extent to which this has occurred for realgalaxies can only be resolved by detailed analysesof individual objects. One cannot be sure that theanalysis of real observations data was done prop-erly when the same analysis produces false resultswhen applied to realistic models.
One of the difficulties in interpreting observa-tional data lies in the fact that galaxies are treatedin an overly simplified manner (e.g., cold gas insidethin exponential disks). Observational results (in-cluding those presented in this paper) suggest thatthis is far too naive a picture. In the central region,the stellar component often rotates as fast as theemission-line gas - in contradiction with the pre-diction of a naive picture of a cold gas embeddedin a hot stellar component. The presence small(200-500 pc) bulges and bars, which can be easilyoverlooked, further complicates the interpretationof the data.
We acknowledge financial support of NSF andNASA grants to NMSU. Our simulations weredone at the National Center for SupercomputingApplications (NCSA), at the National Energy Re-search Center (NERSC), and at the DireccionGeneral de Servicios de Computo Academico,UNAM, Mexico, whose support we also acknowl-edge. GR is thankful to NMSU for hospitality.We are grateful to R.Walterbos, J.Dalcanton , J.Gallagher, and E. Athanassoula for helpful discus-sions.
REFERENCES
Athanassoula, L., 1984, Physics Reports, Vol 114,Numbers 5 & 6, 319
Barnes, E.I. & Sellwood J.A. 2003, AJ, 125, 1164
Blais-Ouellette, S., Amram, P., Carignan, Claude.2001, AJ, 121, 1952
Begeman, K.G., 1989, A&A, 223 47
Beijersbergen, M., de Blok, W. J. G. & van derHulst, J. M., 1999, AJ, 124, 1360
Bertola, F., Cinzano, P., Corsini, E. M., Rix, H.,& Zeilinger, W. W. 1995, ApJ, 448, L13
de Blok W.J.G. & McGaugh S.S., 1997, MNRAS,290, 533
de Blok, W. J. G. & Bosma, A., 2002,A&A, 385,816 V. C. 2001, ApJ, 552, L23 pJ, 552, L23
de Blok, W. J. G., McGaugh, S. S., Bosma, A., &Rubin, V. C., 2001, ApJ, 552, L23 pJ, 552, L23
de Blok, W. J. G., McGaugh, S. S. & Rubin, V.C., 2001, ApJ, 122,2396
Boker, T., Stanek, R. & van der Marel, R.P., 2003,AJ,125, 1073
Bolatto, A. D., Simon, J. D., Leroy, A., & Blitz,L. 2002, ApJ, 565, 238
Burkert A., 1995, ApJ, 477, L25
Cinzano, P., Rix, H.-W., Sarzi, M., Corsini, E. M.,Zeilinger, W. W., & Bertola, F. 1999, MNRAS,307, 433
Colin, P., Klypin, A., Valenzuela, O., & Gottloe-ber, 2004, ApJ, accepted
Combes, F. & Sanders, R.H., 1981, A&A, 96,164
Dalcanton, J. J., 2003, privite communication.
de Blok, W. J. G., Bosma, A., & McGaugh, S.2003, MNRAS, 340, 657
Eskridge, P.B., Frogel, J.A., Pogge, R.W., Quillen,A.C., Berlind, A.A., Davies, R.L., DePoy, D.L., Gilbert, K.M., H, Mark L., Kuchinski, L.E.,Ramirez, S.V., Sellgren, K., Stutz, A, Tern-drup, D.M. & Tiede, G.P., 2002, ApJS, 143,73
Fillmore, J. A., Boroson, T. A., & Dressler, A.1986, ApJ, 302, 208
Flores R., & Primack J.R. 1994, ApJ, 427, L1
16

Funes, J. G., J., S., Corsini, E. M., Cappellari, M.,Pizzella, A., Vega Beltran, J. C., Scarlata, C.,& Bertola, F. 2002, A&A, 388, 50
Galaz, G., Dalcanton, J. J., Infante, L., & Treister,E., 2002, AJ, 124, 1360
Ghigna, S., Moore, B., Governato, F., Lake, G.,Quinn, T., & Stadel, J. 2000, ApJ, 544, 616
Hayashi, E., Navarro, J.F., Power, C., Jenkins, A.,Frenk, C.S., S. D. M. White, S.D.M., Springel,V., Stadel, J., Quinn, T., astro-ph/0310576
Hernandez X., & Gilmore G. 1998, MNRAS, 294,595
Hill, T. L., Heisler, C. A., Norris, R. P., Reynolds,J. E., & Hunstead, R. W. 2001, AJ, 121, 128
Hill, T. L., Heisler, C. A., Sutherland, R., & Hun-stead, R. W. 1999, AJ, 117, 111
Hunter, D. A., Rubin, V. C., Swaters, R. A.,Sparke, L. S., & Levine, S. E. 2002, ApJ,580,194
Jedrzejewski, R. 1987, MNRAS, 226, 747
Jobin, C. & Carignan, C., 1990, AJ, 100,648
Klypin, A., Kravtsov, A. V., Bullock, J. S., & Pri-mack, J. R. 2001, ApJ, 554, 903
Koda, J. and Wada K., 2002, A&A, 396, 867
Kormendy, J. & Westpfahl, D. J. 1989, ApJ, 338,752
Kravtsov A. V., Klypin A. A., Khokhlov A. M.,1997, ApJS, 111, 73
Kravtsov A. V., 1999, PhD
Kregel, M., van der Kruit, P. C., & de Grijs, R.2002, MNRAS, 334, 646
Matthews, L. D. 2000, AJ, 120, 1764
Matthews, L. D. & Wood, K. 2003, ApJ, 593, 721
McGaugh, S. S., Rubin, V. C., & de Blok, W. J.G., 2001, AJ, 122, 2381
Moore B., 1994, Nature, 370, 629
Moore, B., Quinn, T., Governato, F., Stadel, J.,& Lake, G. 1999, MNRAS, 310, 1147
Navarro, J.F., Frenk, C.S., & White, S.D.M.,1997, ApJ, 490,493
Pignatelli, E., et al. 2001, MNRAS, 323, 188
Pizella, A., Corsini, E.M., Vega-Beltran, J.C.,& Bertola, F., 2004, A&A, submitted, astro-ph/0404558
Power, C., Navarro, J. F., Jenkins, A., Frenk,C. S., White, S. D. M., Springel, V., Stadel,J., & Quinn, T. 2003, MNRAS, 338, 14
Reed, D., Governato, F., Verde, L.,Gardner, J.,Quinn, T., Stadel, J., Merrit, D.,& Lake, G.2003, astro-ph/031254
Simon, J. D., Bolatto, A. D., Leroy, A., & Blitz,L. 2003, ApJ, accepted
Swaters, R.A., Madore, B.F., & Trewhella, M.,2000, ApJ, 531, L107
Swaters, R. A., Madore, B. F., van den Bosch,F. C., & Balcells, M. 2003, ApJ, 583, 732
Swaters, R. A., Verheijen, M. A. W., Bershady,M. A., & Andersen, D. R. 2003, ApJ, 587, L19
Tasitsiomi, A., Kravtsov, A.V., Gottloeber, S., &Klypin, A., 2004, ApJ, accepted.
van den Bosch, F.C., & Swaters, R.A., 2001, MN-RAS, 325, 1017
Vega Beltran, J. C., Pizzella, A., Corsini, E. M.,Funes, J. G., Zeilinger, W. W., Beckman, J. E.,& Bertola, F. 2001, A&A, 374, 394
Verheijen, M.A.W., 1997, Ph.D. thesis, Univ.Groningen
van den Bosch, F., Robertson, B.E, Dalcanton,J.J, & de Blok, W.J.G., 1999, AJ, submitted(astro-ph/9912004)
Valenzuela, O., & Klypin, A., 2003, MNRAS, 345,406
Valenzuela, O., Rhee G. & Klypin, A., 2004, inpreparation
Wada K.,Meurer G. & Norman C. A. 2002, ApJ,577, 197
Wada K.& Koda J. 2002, PASJ, 53, 1163
17

Weldrake D.T.F., de Blok W.J.G. & Walter, F,2002, MNRAS, 340, 12
This 2-column preprint was prepared with the AAS LATEXmacros v5.2.
18

Fig. 1.— Stellar and gas rotation velocities ofobserved galaxies. Symbols show velocities mea-sured using emission lines. The full curves witherror bars are for absorption lines. Galaxies onthe left panels have similar rotation in gas and instars. For galaxies on the right gas rotates typi-cally faster than stars. Of those three galaxies arebarred.
Fig. 2.— Surface brightness profiles. Dashedcurves show disk/bulge double exponential ap-proximations. In the case of barred galaxies theexponentials do not join though the outer disk arestill clearly exponential. The spike at 10 kpc inprofile of NGC5746 is due to a star. The ring ofNGC5389 is seen at 6kpc as a hump overlaid onexponential disk.
19

Fig. 3.— Inclination angle versus inner power lawslope α for the galaxies in the de Blok, McGaugh,Bosma, & Rubin (2001) sample. The circledpoints correspond to galaxies that have been iden-tified by McGaugh, Rubin, & de Blok (2001) asbeing barred galaxies. There should be no correla-tion of slopes with the inclination. Lack of slopesat left top corner clearly indicates significant bi-ases in the sample.
Fig. 4.— Profiles for the final moments of themodel II (“Dwarf”, left panels) and the model III(“Bulge”, right panels). Lower panels show circu-lar velocities of different components in the mod-els. The dotted curves show the rotation velocityof the disk components. For both models the bary-onic component (disk+bulge) dominates inside thecentral 700 pc radius. Middle panels show velocitydispersions for the baryonic components. The dot-dashed curves are for the vertical (z) velocity. Thefull and dashed curves are for tangential (in theplain of the disk) and radial velocities correspond-ingly. Note that velocities are very small. Onlyinside central 500 pc do they go above 20 km/s.The top panels present the surface density profilesof the baryonic components scaled to magnitudeunits with arbitrary zero points. For the barred“Dwarf” the full curve is for the surface brightnessalong the bar and the dashed curve is perpendic-ular to the bar. The length of the bar is 1.8 kpc.The full curve for the “Bulge” model shows thetotal disk+bulge surface brightness. Disk compo-nent is shown by the dashed curve.
20
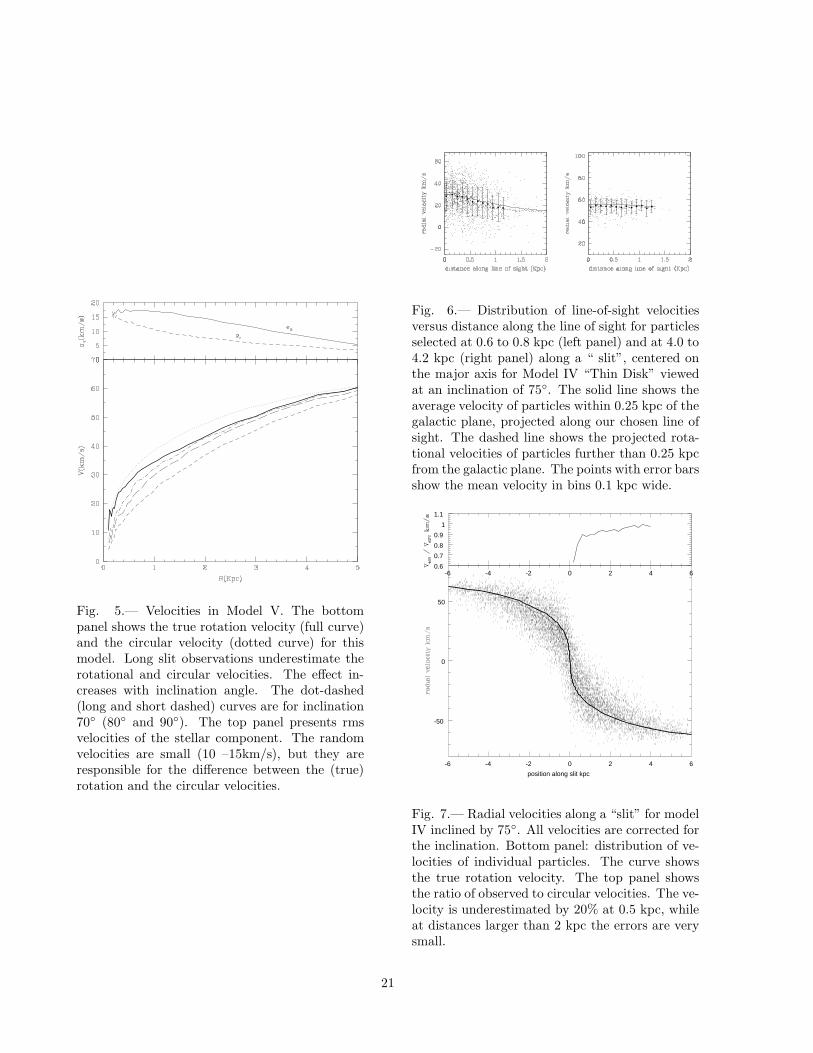
Fig. 5.— Velocities in Model V. The bottompanel shows the true rotation velocity (full curve)and the circular velocity (dotted curve) for thismodel. Long slit observations underestimate therotational and circular velocities. The effect in-creases with inclination angle. The dot-dashed(long and short dashed) curves are for inclination70 (80 and 90). The top panel presents rmsvelocities of the stellar component. The randomvelocities are small (10 –15km/s), but they areresponsible for the difference between the (true)rotation and the circular velocities.
Fig. 6.— Distribution of line-of-sight velocitiesversus distance along the line of sight for particlesselected at 0.6 to 0.8 kpc (left panel) and at 4.0 to4.2 kpc (right panel) along a “ slit”, centered onthe major axis for Model IV “Thin Disk” viewedat an inclination of 75. The solid line shows theaverage velocity of particles within 0.25 kpc of thegalactic plane, projected along our chosen line ofsight. The dashed line shows the projected rota-tional velocities of particles further than 0.25 kpcfrom the galactic plane. The points with error barsshow the mean velocity in bins 0.1 kpc wide.
-6 -4 -2 0 2 4 6
-50
0
50
position along slit kpc
-6 -4 -2 0 2 4 60.6
0.7
0.8
0.9
1
1.1
Fig. 7.— Radial velocities along a “slit” for modelIV inclined by 75. All velocities are corrected forthe inclination. Bottom panel: distribution of ve-locities of individual particles. The curve showsthe true rotation velocity. The top panel showsthe ratio of observed to circular velocities. The ve-locity is underestimated by 20% at 0.5 kpc, whileat distances larger than 2 kpc the errors are verysmall.
21

Fig. 8.— Rotation curves for model IV, the modelwith no bar and no bulge. The solid line showsthe true circular velocity. The dashed line showsthe rotational velocity. The points show the “ob-served” velocities for the model viewed at inclina-tions of 60, 75and 80. The effects of inclina-tion are very small for 60and for radii larger than1 kpc. The mismatch between the observed veloc-ities and the true velocities at small radii increaseswith increasing inclination.
Fig. 9.— Solid line in the bottom panel showsthe average rotation velocity of particles in thedisk as a function of radius. The dotted line is thesame as the solid line but particles belonging to thebar have been excluded from the calculation. Thedashed line is the circular velocity of particles inthe disk. This is the velocity that particles wouldhave if they moved in pure circular motion in thegalaxy potential. At 0.5 kpc the measured velocityis 40% of the true circular velocity.
Fig. 10.— Left hand side shows contour plot of thesurface density of particles in the barred galaxyviewed at an inclination of 75. The bar is per-pendicular to the line of sight. Right hand sideshows surface brightness versus semi-major axislength for the same model. The surface brightnessis measured on a magnitude scale. Presence of thebar is hardly noticeable in the contours of bright-ness. In the surface brightness the bars shows asa 0.5 mag feature at 2 kpc.
22

Fig. 11.— Same as Figure 10, except the az-imuthal angle of the bar is 45resulting in twist-ing isophotes. The bar is not visible in the sur-face brightness profile. Presence of the bar is indi-cated only by the change in the position angle ofisophots.
Fig. 12.— Evolution with time of the mismatchbetween the circular velocity and the observedrotation velocity. The mismatch gets larger asbar grows. Circular velocity (solid line), rota-tional velocity (dashed line) and ‘observed veloc-ity’ (points) for the dwarf galaxy model viewedduring the formation and buckling of the bar. Themodel is viewed at an inclination of 60. The baris oriented perpendicular to the line of sight.
Fig. 13.— Inclination angle as a function of ra-dius for the dwarf galaxy model viewed during theformation and buckling of the bar. The model isviewed at an inclination of 60. The bar is ori-ented perpendicular to the line of sight.The solidline shows the true inclination of the galaxy. Theamplitude of the variation in the inclination an-gle does not change with time, but the radius ofthe transition to the true value increases with timeand is a good measure of the bar length.
23

Fig. 14.— Rotational velocity (bottom panel) andinclination angle (top panel) as a function of radiusfor model III (bulge) viewed at an inclination angleof 60. The solid line in the bottom panel showsthe circular velocity of particles in the disk. Thedashed line shows the rotational velocity and thepoints show the observed velocity. The solid linein the upper panel is the mean inclination anglecomputed as the mean evaluated between 4 and5 kpc.
Fig. 15.— Model V “Disk” observed at an inclina-tion of 75. The solid line shows the true circularvelocity. The dashed line shows the rotational ve-locity. The points show the “observed” velocitiesfor the model. The effects of inclination are verysmall for 60and for radii larger than 1 kpc. Themismatch between the observed velocities and thetrue velocities at small radii increases with increas-ing inclination.
24

Fig. 16.— The four panels show the barred galaxymodel viewed at an inclination of 75for varyingangle that the bar makes with respect to the lineof sight. In the upper left panel the bar is viewedperpendicular to the line of sight. In the bottomright panel the bar is viewed along the line of sight.The two other panels are intermediate cases.
Fig. 17.— Surface brightness profiles for modelIII (bulge model) viewed at an inclination of20(dotted line) 60(long dashed line) 80(shortdashed line). The solid line shows the surfacebrightness profile of the bulge on its own. Thebulge contribution to the observed profile getssmaller as the inclination increases. Surprisingly,such a small bulge affects the rotation curve andthe measured inclination angle up to 1 kpc as in-dicated in figure 14.
25

Fig. 18.— Dwarf galaxy model viewed at varyingtimes during its evolution. 1.4 Gyr correspondsto the beginning of bar formation. By 1.62 Gyra strong bar has formed, at 2.15 Gyr the bar hasbuckled as described in the text. The bar is viewedat 45to the line of sight in each instance
26

Fig. 19.— Density versus radius for model IV (nobar, no bulge) viewed at an inclination angle of80. The solid line is the actual density of themodel. The points show the observed density andthe dashed line is a fit to the observed density.
Fig. 20.— Density versus radius for model I(barred model) viewed at an inclination angle of75. The solid line is the actual density of themodel. The points show the observed density andthe dashed line is a fit to the observed density. Theorientation of the bar is 45to the line of sight.
Fig. 21.— Density versus radius for model I(barred model) viewed at an inclination angle of75. The solid line is the actual density of themodel. The points show the observed density andthe dashed line is a fit to the observed density.The bar is perpendicular to the line of sight.
27

Fig. 22.— Density versus radius for the barredmodel viewed at an inclination angle of 75. Thesolid line is the actual density of the model. Thepoints show the observed density and the dashedline is a fit to the observed density. The bar isviewed along the line of sight.
Fig. 23.— Histogram of the slopes obtained frommodel I (bar) viewed at inclination angles of 80 75and 60 . The slopes where measured at positionsevenly spaced between 0.2 and 1 kpc. The trueslope of the model is -2.
28

Table 1
Parameters of galaxies with measured rotation curves
Galaxy MB VLG Type Incl. Rdisk/Rbulge Scale Commentskm/s deg kpc kpc/“
IC 267 -19.91 3577 SBb 45.0 2.0/ 0.4 0.248 Very long 10 kpc bar. Compactbulge.
IC 1029 -21.00 2520 Sb 76.0 5.0/ 0.4 0.175 Compact bulge. Gas rotation ismeasured using SII emission line.
NGC 5389 -19.17 1996 SABa 78.5 3.0/ 0.45 0.14 Strong ring at 6 kpc.NGC 5746 -20.51 1676 SABb 80.5 2.5/ 1.2 0.12 Large peanut-shape bulge/barNGC 5719 -18.79 1676 SABab 70.0 2.2/ 1.1 0.116 Barred galaxy with a large bulge.NGC 5793 -19.11 3387 Sb 70.5 4.2/ 1.1 0.234NGC 6368 -19.98 2904 Sb 75.5 6.0/ 0.7 0.201 Gas rotation is measured using
SII emission line.NGC 7537 -9.42 2888 Sbc 70.0 5.5/ 1.4 0.200
29

Table 2
Parameters of the Models
Parameter Model Model I Model II Model III Model IV Model V“Bar” “Dwarf” “Bulge” “Thin Disk” “Disk”
Halo mass Mhalo, M⊙ 4.3×10¹⁰ 6.0×10¹⁰ 6.8×10¹⁰ 6.0×10¹⁰ 6.0×10¹⁰
Disk mass Mdisk, M⊙ 9.5×10⁸ 5.7×10⁸ 6.8×10⁸ 5.7×10⁸ 5.7×10⁸
Bulge mass Mbulge, M⊙ – – 8.2 ×10⁷ – –Initial disk scale length Rd, kpc 1.16 0.7 1.75 2.14 1.75Final disk scale length Rd, kpc 1.50 0.7 1.75 2.14 1.75Initial disk scale height zd, pc 90 108 55 150 300Final disk scale height zd, pc 135 120 70 150 300Disk stability parameter Q 1.2 1.2 1.5 3.0 3.0Bulge half-mass radius, pc – – 250 – –Number of halo particles 3.3×10⁶ 3.45×10⁶ 2.2×10⁶ 3.45×10⁶ 3.45×10⁶
Number of disk particles 2 ×10⁵ 1.6×10⁵ 8×10⁴ 1.6×10⁵ 1.6×10⁵
Number of bulge particles – – 9.7 ×10³ – –Halo concentration C 11.5 12.0 11.0 12.0 12.0Maximum Force Resolution, pc 11 16 19 16 16Duration of evolution, Gyrs 4.2 2.2 1.4 1.6 1.2Time-step, yrs 4 × 10⁴ 1.4 × 10⁴ 9.1 × 10⁴ 1.4 × 10⁴ 1.4 × 10⁴
30