The role of Ultrabithorax negative autoregulation in ...
161
The role of Ultrabithorax negative autoregulation in Drosophila melanogaster. Vikram Ranade Submitted in partial fulfillment of the requirements for the degree of Doctor of Philosophy in the Graduate School of Arts and Sciences COLUMBIA UNIVERSITY 2013
-
Upload
khangminh22 -
Category
Documents
-
view
2 -
download
0
Transcript of The role of Ultrabithorax negative autoregulation in ...

The role of Ultrabithorax negative autoregulation
in Drosophila melanogaster.
Vikram Ranade
Submitted in partial fulfillment of the requirements for the degree of
Doctor of Philosophy in the Graduate School of Arts and Sciences
COLUMBIA UNIVERSITY
2013

© 2013
Vikram Ranade
All rights reserved
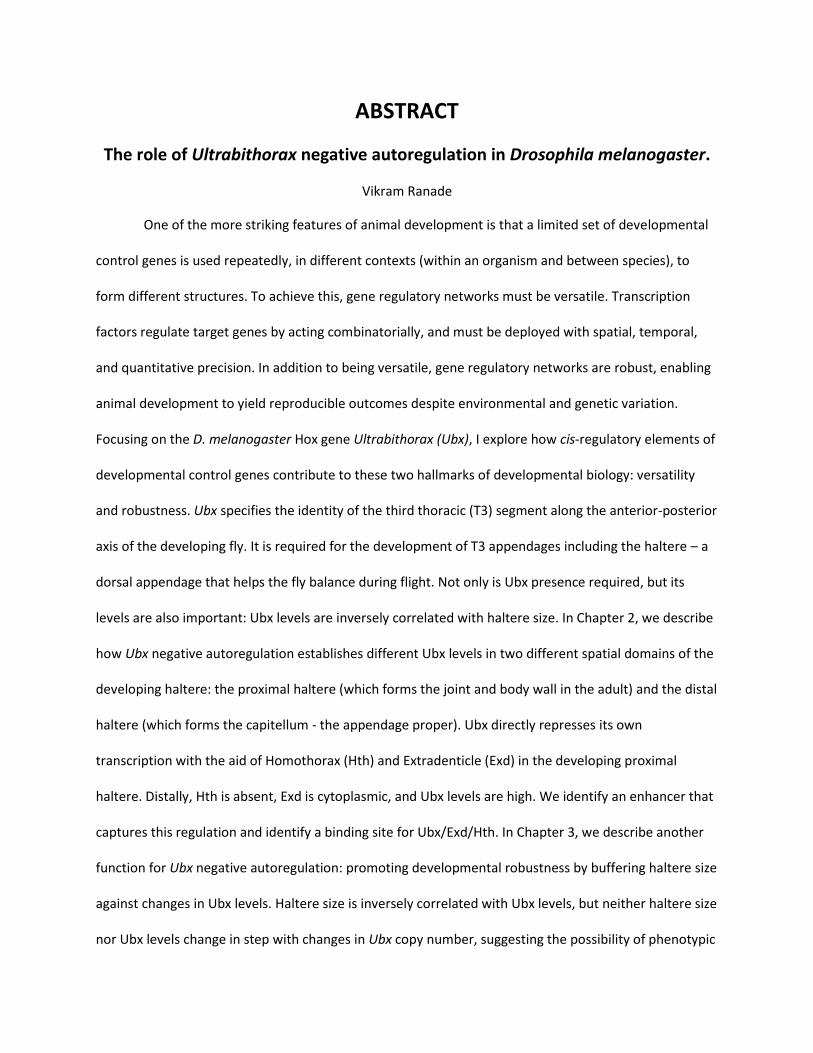
ABSTRACT
The role of Ultrabithorax negative autoregulation in Drosophila melanogaster.
Vikram Ranade
One of the more striking features of animal development is that a limited set of developmental
control genes is used repeatedly, in different contexts (within an organism and between species), to
form different structures. To achieve this, gene regulatory networks must be versatile. Transcription
factors regulate target genes by acting combinatorially, and must be deployed with spatial, temporal,
and quantitative precision. In addition to being versatile, gene regulatory networks are robust, enabling
animal development to yield reproducible outcomes despite environmental and genetic variation.
Focusing on the D. melanogaster Hox gene Ultrabithorax (Ubx), I explore how cis-regulatory elements of
developmental control genes contribute to these two hallmarks of developmental biology: versatility
and robustness. Ubx specifies the identity of the third thoracic (T3) segment along the anterior-posterior
axis of the developing fly. It is required for the development of T3 appendages including the haltere – a
dorsal appendage that helps the fly balance during flight. Not only is Ubx presence required, but its
levels are also important: Ubx levels are inversely correlated with haltere size. In Chapter 2, we describe
how Ubx negative autoregulation establishes different Ubx levels in two different spatial domains of the
developing haltere: the proximal haltere (which forms the joint and body wall in the adult) and the distal
haltere (which forms the capitellum - the appendage proper). Ubx directly represses its own
transcription with the aid of Homothorax (Hth) and Extradenticle (Exd) in the developing proximal
haltere. Distally, Hth is absent, Exd is cytoplasmic, and Ubx levels are high. We identify an enhancer that
captures this regulation and identify a binding site for Ubx/Exd/Hth. In Chapter 3, we describe another
function for Ubx negative autoregulation: promoting developmental robustness by buffering haltere size
against changes in Ubx levels. Haltere size is inversely correlated with Ubx levels, but neither haltere size
nor Ubx levels change in step with changes in Ubx copy number, suggesting the possibility of phenotypic

buffering. Consistently, certain Ubx enhancer traps are silenced in response to increases in Ubx gene
dose. Here, we show that functional Ubx protein must exceed a certain threshold to silence Ubx
enhancer traps, confirming the idea that it reflects Ubx negative autoregulation at work. Together with
the results from Chapter 2, this shows that a single gene can employ the same mechanism to achieve
two seemingly opposing purposes: conferring variation and robustness to its expression. Finally, we
investigate Ubx enhancer trap silencing in response to naturally occurring genetic variation. We
previously described that the same Ubx enhancer traps that are silenced by increases in Ubx copy
number are also silenced in F1 offspring of outcrosses to certain wild populations of D. melanogaster.
Although it is unclear if this is due to Ubx negative autoregulation or an independent mechanism, our
data argue that the Ubx locus, and not the P-element insertions themselves, are being silenced.
Interestingly, we find that i) silencing is suppressed by a gain-of-function mutation in a gene that
opposes the spread of heterochromatin and ii) the expression of Position Effect Variegation reporters
also changes when outcrossed to certain wild populations of D. melanogaster. Together, these results
suggest that there are considerable fluctuations in the transcriptional landscape between different
populations of a given species.

i
Table of Contents
List of Figures ............................................................................................................................................... iv
Acknowledgements ....................................................................................................................................... v
CHAPTER 1 .................................................................................................................................................... 1
GENERAL INTRODUCTION ............................................................................................................................. 1
ABSTRACT .................................................................................................................................................. 1
AN INTRODUCTION TO TRANSCRIPTION FACTORS ................................................................................... 1
HOX GENES, ULTRABITHORAX, AND DROSOPHILA ................................................................................... 5
The history of Hox genes and discovery of Ubx .................................................................................... 6
Expression and regulation of Hox genes during Drosophila development ........................................... 7
Polycomb and trithorax group genes .................................................................................................. 11
Cis-regulatory architecture of the Ubx locus ...................................................................................... 16
The Ubx gene regulatory network in the haltere ............................................................................... 18
Ubx levels and autoregulation ............................................................................................................ 20
Ubx binding specificity ........................................................................................................................ 23
TRANSCRIPTION FACTOR EXPRESSION LEVELS ....................................................................................... 26
Transcription factor levels and human disease .................................................................................. 27
Transcription factor levels and development ..................................................................................... 28
Transcription factor levels and evolution ........................................................................................... 31
NEGATIVE AUTOREGULATORY LOOPS IN BIOLOGICAL SYSTEMS ........................................................... 33
Negative autoregulatory loops enable precise gene expression ........................................................ 34
Negative autoregulatory loops enable robust gene expression ......................................................... 36
Negative autoregulatory loops create variability in gene expression: induction of oscillatory gene
expression in the vertebrate segmentation clock .............................................................................. 37
PROTEIN-DNA INTERACTIONS ................................................................................................................. 39
Specificity of transcription factor-DNA binding .................................................................................. 40
Affinity of transcription factor-DNA binding ....................................................................................... 43
CHAPTER 2 .................................................................................................................................................. 47
The Drosophila Hox gene Ubx autoregulates via a low-affinity binding site to alter its levels along the
proximal-distal axis of the developing haltere ........................................................................................... 47
ABSTRACT ................................................................................................................................................ 47

ii
INTRODUCTION ....................................................................................................................................... 47
RESULTS .................................................................................................................................................. 51
Ubx works with Hth and Exd to keep its levels low in the proximal haltere ...................................... 51
Ubx does not repress hth in the developing haltere .......................................................................... 53
A Ubx negative autoregulatory enhancer ........................................................................................... 53
A Ubx autoregulatory binding site ...................................................................................................... 55
UbxAE is ~10-fold weaker than the consensus Ubx/Exd/HthHM binding site ..................................... 57
Biological relevance of low Ubx levels in the proximal haltere disc ................................................... 58
DISCUSSION ............................................................................................................................................. 59
Establishing a PD bias of Ubx levels in the haltere is a functionally and mechanistically new form of
Ubx negative autoregulation .............................................................................................................. 59
Low-affinity binding sites in vitro are functional in vivo ..................................................................... 60
MATERIALS AND METHODS ................................................................................................................ 62
FIGURES ................................................................................................................................................... 66
CHAPTER 3 .................................................................................................................................................. 77
Naturally occurring genetic variation in D. melanogaster can silence Ubx enhancer traps ....................... 77
ABSTRACT ................................................................................................................................................ 77
INTRODUCTION ....................................................................................................................................... 78
RESULTS .................................................................................................................................................. 80
Ubx enhancer trap silencing in response to increases in Ubx copy number ...................................... 80
Variation at trans acting loci contributes to Ubx enhancer trap silencing induced by wild
populations ......................................................................................................................................... 82
Regulatory elements of the Ubx locus are being targeted for silencing ............................................. 83
Ubx protein activity contributes to outcross induced Ubx-Gal4lac1 silencing ..................................... 85
What molecular machinery silences Ubx-Gal4lac1 in response to genetic variation? ......................... 86
Are enhancer traps or transgenic reporters from loci other than Ubx silenced? ............................... 88
The genetic etiology of Ubx-Gal4lac1silencing is complex ................................................................... 90
DISCUSSION ............................................................................................................................................. 91
Is Ubx-Gal4lac1 silencing a manifestation of Ubx negative autoregulation? ........................................ 92
Ubx-Gal4lac1 silencing is associated with complex genetic etiology .................................................... 93
Implications for enhancer function ..................................................................................................... 94
MATERIALS AND METHODS ................................................................................................................ 95

iii
FIGURES ............................................................................................................................................... 97
CHAPTER 4 ................................................................................................................................................ 109
GENERAL DISCUSSION ............................................................................................................................... 109
Binding site affinities and gene regulation ........................................................................................... 110
Other roles of Ubx negative autoregulation ......................................................................................... 112
Stochastic enhancer silencing at Ubx.................................................................................................... 113
Genetic variation silences Ubx enhancer traps..................................................................................... 114
Is the global transcriptional landscape affected by genetic variation? ................................................ 115
Extensive differences in transcript levels between individuals within human populations ............. 116
REFERENCES .............................................................................................................................................. 119
APPENDIX 1 ............................................................................................................................................... 131
The abx1 deletion: other enhancers at Ubx contribute to the bias in Ubx levels along the haltere P-D
axis ........................................................................................................................................................ 131
More than one Ubx binding site in the 1.3kb abxF element? .............................................................. 131
Increases in Ubx+ copy number reduce the P-D expression ratio. ....................................................... 132
An anterior-posterior bias for hs:Ubx induced negative autoregulation ............................................. 133
Spalt binds the Ubx locus ...................................................................................................................... 134
APPENDIX 2 ............................................................................................................................................... 136
RNA PolII binding at Ubx in SR1 ............................................................................................................ 136
H3K4me3 binding at Ubx in SR1 ........................................................................................................... 137
H3K27me3 binding at Ubx in F1 outcross hybrid versus lab strain animals ......................................... 139
APPENDIX 3 ............................................................................................................................................... 141

iv
List of Figures
Figure 1.1 Principles of TF action .................................................................................................................. 3
Figure 1.2: Embryonic expression patterns of Drosophila Hox genes .......................................................... 9
Figure 1.3: Ubx expression in imaginal discs .............................................................................................. 10
Figure 1.4: The Ubx locus ............................................................................................................................ 18
Figure 1.5: Negative feedback loops enable precise gene expression ....................................................... 35
Figure 1.6: Crystal structure of Ubx-Exd bound to DNA ............................................................................. 41
Figure 2.1: Ubx expression bias along the haltere PD axis ......................................................................... 66
Figure 2.2: Hth and Exd repress Ubx in the proximal haltere ..................................................................... 67
Figure 2.3: The Ubx negative autoregulatory enhancer ............................................................................. 68
Figure 2.4: Identification of the Ubx binding site ....................................................................................... 69
Figure 2.5: In vitro characterization of the Ubx negative autoregulatory binding site .............................. 70
Figure 2.6: Combining abxF with PREs and Ubx embryonic enhancers ...................................................... 71
Figure 2.7: Ubx1 mutant clones. .................................................................................................................. 71
Figure 2.8: exdRNAi clones .......................................................................................................................... 72
Figure 2.9: Mutating the low affinity UbxAE site to a high-affinity consensus site. ................................... 73
Figure 2.10: Controls for EMSAs ................................................................................................................. 74
Figure 2.11: Does achaete respond to changes in Ubx levels?: .................................................................. 75
Figure 2.12: Upregulating Ubx in the proximal haltere .............................................................................. 76
Figure 3.1: Ubx enhancer trap silencing in response to increases in Ubx gene dose ................................. 97
Figure 3.2: Loci capable of silencing Ubx-Gal4lac1 are dispersed throughout the genome ......................... 98
Figure 3.3: Elements at the Ubx locus, and not the P-elements themselves, are being silenced. ............. 99
Figure 3.4: Ubx-Gal4lac1 is activated before being silenced by genetic variation ..................................... 100
Figure 3.5: Ubx protein contributes to outcross induced Ubx-Gal4lac1 silencing ...................................... 101
Figure 3.6: Pcl and Dcr-2 mutant clones do not suppress Ubx-Gal4lac1 silencing ..................................... 102
Figure 3.7: Candidate suppressors of Ubx-Gal4lac1 silencing by genetic variation. ................................... 103
Figure 3.8: Are other enhancer traps and transgenes silenced by genetic variation? ............................. 104
Figure 3.9: PEV reporters are also affected by genetic variation. ............................................................ 105
Figure 3.10: Ubx-Gal4lac1 has a complex genetic etiology. ........................................................................ 106
Figure 3.11 Two approaches to identify loci in wild populations that cause Ubx-Gal4lac1 silencing ........ 107
Figure 3.12: Two models to explain Ubx-Gal4lac1 silencing by genetic variation ...................................... 108
Figure A1.1: Analysis of the abx1 deletion: .............................................................................................. 133
Figure A1.2: Spalt ChIP from haltere chromatin: ...................................................................................... 135
Figure A2.1: ChIP for RNAPolII and H3K4me3 in SR1 haltere discs: ......................................................... 138
Figure A2.2: H3K27me3 binding in F1 hybrid and lab strain imaginal discs: ............................................ 139

v
Acknowledgements I have many people to thank for the opportunity to pursue a doctorate at Columbia University
and the quality of training that I have received here. I am grateful to the Department of Genetics and
Development’s training faculty, not only for accepting me into the program, but also for designing and
teaching the most intellectually rewarding classes I have taken here.
I thank my faculty advisor, Dr. Richard Mann, for his patient support over the past 6+ years. His
scientific guidance has been invaluable. I also hope I have absorbed some of the other lessons he has
tried to impart: the importance of thoroughness, perseverance, setting the highest standard for one’s
own work, and making every effort to meet that standard.
I am very grateful to all the members of my training and thesis committees: Dr. Gary Struhl, Dr.
Timothy Bestor, Dr. Iva Greenwald, and Dr. Alla Grishok; especially Gary Struhl for agreeing to be the
first reader of my thesis. Thanks also to my qualifying committee members, Dr. Angela Christiano and
Dr. Eric Schon, and my rotation mentors: Dr. Iva Greenwald and Dr. Angela Christiano.
All members of the Mann Lab, past and present, have contributed enormously to my work and
overall intellectual development. They are also collectively responsible for creating a tremendously
supportive, positive, and fun work environment. Some specific acknowledgements: Matt Slattery,
Roumen Voutev, Namiko Abe, and Katherine Lelli provided close guidance with various technical
protocols. Michael Crickmore, Chenshu Liu, Mohammed Rahman, and Rich Allan worked with me
directly at various times; their specific contributions to the work in this thesis are acknowledged in the
preface to Chapter 3. Carlos Estella and Matt Giorgianni taught me the basics of Drosophila genetics
when I first joined the lab. Aurelie Jory and Namiko Abe provided comments on a draft of my thesis
introduction. I am also grateful for the help of Dr. David Stern and Serge Picard, and Dr. Trudy Mackay
and Mike McGwire; they have helped with parts of the work in Chapter 3 and their specific contributions
are mentioned in the text.

vi
Finally, I am deeply indebted to the handful of people who have helped me face the existential
valleys I have walked through as a graduate student. From the Mann lab: Cesar Mendes, Roumen
Voutev , and Jonathan Enriquez. My college roommate, Selom Doamekpor, currently finishing his Ph.D.
at Cornell. And my family, immediate and extended, for providing me with the opportunities, guidance,
and inspiration to reach this point.

1
CHAPTER 1
GENERAL INTRODUCTION
ABSTRACT
My work has centered on transcriptional regulation by and at the Drosophila Hox gene
Ultrabithorax (Ubx). To place this work in a broader context, in this section I introduce Transcription
Factors (TFs): their discovery and the role they play in gene regulation. I then provide background on
Hox genes – the group of TFs that I have been studying. I discuss Hox genes with a particular emphasis
on the role and regulation of Ubx during Drosophila development. Given that the mechanism of
establishment of different Ubx levels is central to my work, I devote a section to the importance of TF
levels. It has long been known that different levels of TFs can trigger distinct gene expression programs. I
provide examples illustrating the importance of TF levels in human disease, animal development, and
evolution. Given this, molecular mechanisms must exist to ensure that TF levels are tightly and reliably
regulated. I discuss one such mechanism in detail: negative feedback loops. Negative autoregulation
adds precision and robustness to gene regulatory networks. I summarize the evidence behind these
claims and provide examples that negative autoregulation can also serve a seemingly opposing purpose:
adding variability and versatility to gene expression networks. In the last section, I discuss another key
issue of TF biology: how these proteins bind DNA in a sequence specific manner. I also explore the issue
of TF-DNA binding affinity and how different binding site affinities can impact target gene regulation.
AN INTRODUCTION TO TRANSCRIPTION FACTORS
Just over fifty years ago, Francois Jacob and Jacques Monod identified the first members of a
new class of genes. These genes did not play a structural or a metabolic role, but instead served a
regulatory function (Jacob and Monod, 1961). By studying the bacterial lac operon (a group of co-
regulated genes), Jacob and Monod discovered that certain gene-products could act in trans to repress

2
gene transcription. These repressors are now known to be transcription factors (TFs), an abundant class
of genes that bind DNA directly and are responsible for transcriptional activation and repression. They
are estimated to comprise up to 7% of protein-coding genes in humans, and a slightly smaller fraction in
Drosophila and yeast (~5%) (Levine and Tjian, 2003; Vaquerizas et al., 2009).
A key question in developmental biology has been how a limited set of TFs can elicit such
tremendous diversity between cells in a single organism. This complexity seems to arise due to multiple,
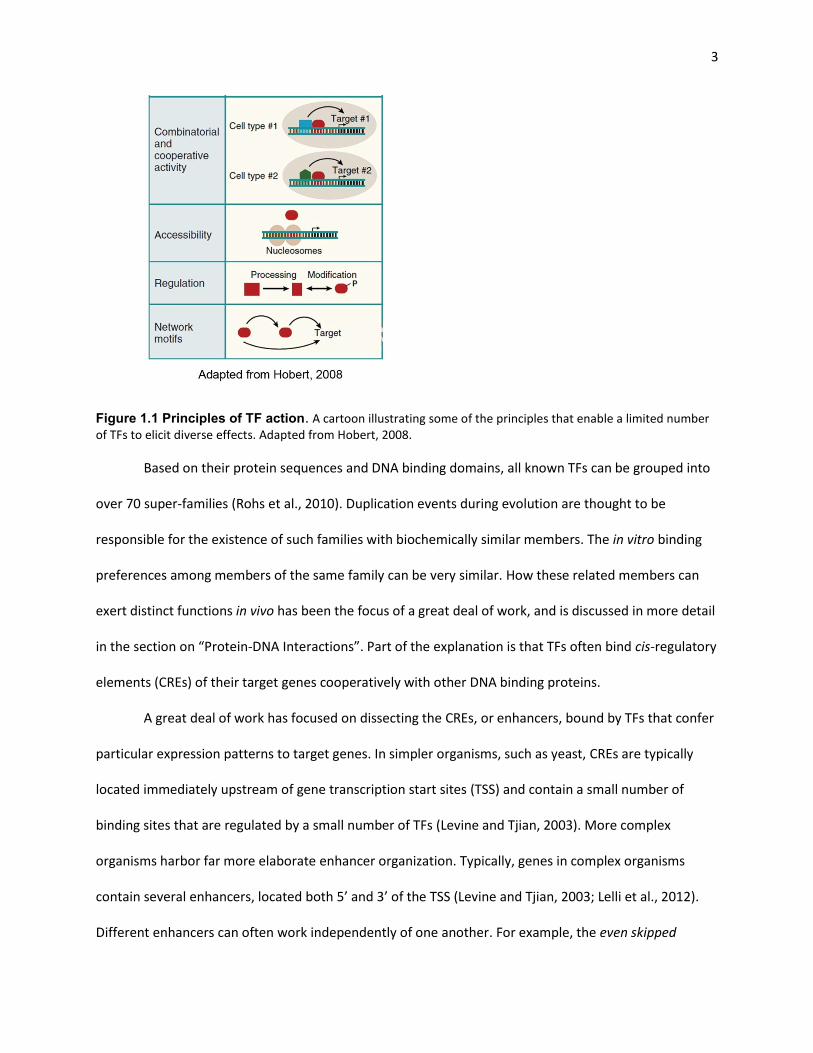
intersecting levels of gene regulatory control (Figure 1.1). First, TFs tend to work in groups with other
DNA-binding factors. Sets of combinatorially expressed TFs are able to confer greater precision to cell-
type specification. Indeed, most eukaryotic genes require multiple inputs for expression in any given
cell-type. Alternative splicing also contributes to TF variety, especially in complex organisms. Second, the
activity of TFs can be modified and regulated by post-translational modifications that control their sub-
cellular localization and activity. Third, as discussed in detail later in this introduction, different levels of
a single TF can trigger different genetic programs. Fourth, network motifs (such as negative
autoregulation, which is discussed in detail in a later section) can also add versatility and variability to
gene regulatory networks. Finally, DNA accessibility – which varies between tissue and cell types – limits
the ability of TFs to bind to target gene cis-regulatory elements. A complete understanding of the role
that TFs play in transcriptional regulation must consider all of these aspects.
3
Figure 1.1 Principles of TF action. A cartoon illustrating some of the principles that enable a limited number of TFs to elicit diverse effects. Adapted from Hobert, 2008.
Based on their protein sequences and DNA binding domains, all known TFs can be grouped into
over 70 super-families (Rohs et al., 2010). Duplication events during evolution are thought to be
responsible for the existence of such families with biochemically similar members. The in vitro binding
preferences among members of the same family can be very similar. How these related members can
exert distinct functions in vivo has been the focus of a great deal of work, and is discussed in more detail
in the section on “Protein-DNA Interactions”. Part of the explanation is that TFs often bind cis-regulatory
elements (CREs) of their target genes cooperatively with other DNA binding proteins.
A great deal of work has focused on dissecting the CREs, or enhancers, bound by TFs that confer
particular expression patterns to target genes. In simpler organisms, such as yeast, CREs are typically
located immediately upstream of gene transcription start sites (TSS) and contain a small number of
binding sites that are regulated by a small number of TFs (Levine and Tjian, 2003). More complex
organisms harbor far more elaborate enhancer organization. Typically, genes in complex organisms
contain several enhancers, located both 5’ and 3’ of the TSS (Levine and Tjian, 2003; Lelli et al., 2012).
Different enhancers can often work independently of one another. For example, the even skipped

4
segmentation gene is expressed in seven stripes along the anterior-posterior axis of the developing
Drosophila embryo. Expression of these seven stripes is driven by five different enhancers that function
independently (Small et al., 1993; Fujioka et al., 1999). Insulator elements are also found in loci with
complex transcriptional inputs. These elements, bound by DNA-binding proteins like Su(Hw) and CTCF,
prevent inappropriate long-range interactions between enhancers and promoters (Bell et al., 2001). In
cases where enhancers are very far away from the TSS they work with, various looping models have
been proposed that bring these distal elements close together to initiate transcription (Agelopoulos et
al., 2012).
Inside the nucleus, DNA is tightly wound around proteins called histones to form a structure
known as chromatin. The nucleosome, considered the basic unit of chromatin, consists of 147bp of DNA
wrapped around two copies each of four proteins: H2A, H2B, H3 and H4 (Li and Reinberg, 2011; Luger et
al., 1997). Being wrapped around histones limits the accessibility of DNA to TFs; the degree of chromatin
compaction is inversely associated with transcriptional activity. In fact, certain techniques assay DNA
accessibility in vivo as a way to identify cis-regulatory regions. Chromatin was originally thought to exist
in two possible states: euchromatin and heterochromatin. This distinction was made based on
cytological observations made over 70 years ago. Heterochromatin was the dark-staining, more
condensed chromatin in the nucleus and euchromatin the light-staining, less compacted DNA (Zacharias,
1995). Heterochromatin is gene poor, transposon rich, largely transcriptionally repressed (although
several genes are encoded in heterochromatin), late-replicating, and recombinationally inert. It is also
required for chromosome protection and segregation; centromeres and telomeres are heterochromatic.
More recent work indicates that there is actually a broader range of chromatin states, with several
active and inactive varieties (Filion et al., 2010). Distinct chromatin states are correlated with specific
histone modifications; e.g. H3K9me3 is associated with repression; H3K4me3 is associated with active
transcription; and H3K27me3 is associated with Polycomb Group mediated repression.

5
HOX GENES, ULTRABITHORAX, AND DROSOPHILA
My work has focused on transcriptional regulation by and at the Drosophila Hox gene
Ultrabithorax (Ubx). In this section, I introduce Hox genes provide a detailed overview of Drosophila Hox
genes, in particular, Ubx.
Hox genes are a family of homeodomain containing TFs that are expressed in specific patterns
along the anterior-posterior (A-P) axis of nearly all metazoans - both vertebrates and invertebrates. Hox
genes, which number between 4 and 48 per genome, specify the identities of segments along the A-P
axis (Lewis, 1978; Lemons and McGinnis, 2006). It is thought that the last common bilaterian ancestor –
a marine, soft-bodied, wormlike creature – possessed a collinear cluster of eight Hox genes (de Rosa et
al., 1999; Garcia-Fernandez et al., 2005; Lemons and McGinnis, 2006). Over the course of evolution,
duplications and recombination seem to have produced a wide array of Hox complements and
configurations in different species (Lemons and McGinnis, 2006). Collinearity is conserved in many
lineages – indicating that it is evolutionarily constrained – but not all lineages. For example, mammals
have four Hox clusters with 39 genes; Telostei (ray-finned fish) have seven partial Hox clusters; the sea
urchin Strongylocentrotus purpuratus has a single, scrambled, non-collinear cluster (Lemons and
McGinnis, 2006). This diversity is thought to have made a significant contribution to the evolution of
body plans and morphological traits (Lewis, 1978). Hox genes have not been found in plants, but the
MADS-box proteins – although structurally unrelated to Hox proteins – appear to play analogous roles in
developmental patterning (Ng and Yanofsky, 2001).
Consistent with their role in specifying segmental identity, Hox mutants can be associated with
duplications or deletions of entire body segments (Lewis, 1978).Hox genes are considered master
regulators of segment identity: they were initially thought to act by activating and repressing large
numbers of downstream realizator genes which directly influence cellular properties such as adhesion,
growth, apoptosis, etc. (Garcia-Bellido, 1975). While this is partly true, Hox genes are now known to

6
exert their influence by acting at multiple levels of gene regulatory hierarchies. Their targets are not
limited to realizator genes, but include other TFs, other Hox genes, and in several cases, themselves
(Struhl and White, 1985; Bergson et al., 1990; Weatherbee et al. 1998).
The history of Hox genes and discovery of Ubx
‘Homeosis’ refers to the transformation of one body part into another. The first homeotic
mutation in Drosophila melanogaster was isolated in 1910, here at Columbia University, by Calvin
Bridges and Thomas Morgan. Bridges and Morgan discovered two mutations that both caused the same
phenotype: a transformation of halteres into wings. Now known to be mutants in regulatory elements of
the Hox gene Ubx, these two alleles were named bithorax (bx) and bithoraxoid (bxd) (Bridges and
Morgan, 1923).
A more complete picture of these Drosophila homeotic genes emerged from Ed Lewis’ work,
published in a landmark paper in 1978. The broad strokes of Lewis’ model for the function and
organization of the bithorax complex (BX-C) have withstood half a century of further study and remain
intact today (Lewis, 1978). Lewis postulated that the genes of the BX-C collaborate in an additive fashion
to specify the identities of the body segments from T2 (the second thoracic segment) through A8 (the
eighth abdominal segment) (Lewis, 1978). In other words, an additional Hox gene is activated in each
successive segment along the A-P axis of the animal. Lewis also discovered that the BX-C is “collinear”:
these genes are arranged on the chromosome in the same order that they are expressed in the
developing organism (Lewis, 1978). Genes located more proximally with respect to the centromere are
expressed more anteriorly along the body axis, and so on. This striking property of the Drosophila BX-C is
highly conserved among Hox gene clusters in various species, including humans, indicating that it is
evolutionarily constrained. However, there are a number of species in which collinearity has not been
preserved; in these species, Hox genes are dispersed through the genome (Lemons and McGinnis, 2006).

7
The six “regulatory rules” that Lewis laid out for the BX-C have proven to be largely true (Lewis,
1978). For instance: Drosophila Hox genes are individually, rather than coordinately regulated; they are
repressed by Polycomb; a gene de-repressed in one segment will be de-repressed in all segments
posterior to it; the more posterior a segment, the more BX-C genes are active (Lewis, 1978).
One key aspect Lewis got wrong, however, was the number of genes at the BX-C. Lewis’ analysis
had identified a minimum of eight genes in the complex; later complementation analyses, using a
deletion of the entire BX-C, demonstrated that there were in fact only three: Ultrabithorax, abdominal-
A, and Abdominal-B (Sanchez-Herrero et al., 1985). Some of the elements Lewis had inferred to be genes
were in fact different regulatory elements of Ubx that controlled its expression in different spatial
regions. These findings were confirmed with the cloning of the BX-C and the generation of an antibody
against Ubx (Bender et al., 1983; Beachy et al., 1985; White and Wilcox, 1985).
Expression and regulation of Hox genes during Drosophila development
Segmentation genes activate Hox genes in the embryo
Drosophila embryogenesis begins with 12 synchronized rounds of mitosis, without cell division,
resulting in about 6000 nuclei in a shared cytoplasm. This is called the syncytial blastoderm stage, and is
reached roughly 3 hours after fertilization. At the 13th cell division, these nuclei start to become
separate, individually enclosed cells, and differences start to be seen amongst them; this stage is called
the cellular blastoderm. The cells are soon organized into a series of segments along the anterior-
posterior axis, each one with a specific identity.
Conceptually, patterning of the early Drosophila embryo can be broken down into two steps: 1)
the establishment of a series of reiterated segments along the anterior-posterior (A-P) axis; 2) the
specification of their individual identities.
An understanding of the first step began to take shape with a tour de force screen to identify
genes involved in embryonic segmentation (Nusslein-Volhard and Wieschaus, 1980; Nusslein-Volhard et

8
al., 1982). Three classes of genes – gap genes, pair-rule genes, and segment-polarity genes – collectively
referred to as “segmentation genes” divide the initially uniform field of cells into a series of separate
segments (reviewed in Akam, 1987 and Scott and Carroll, 1987). These genes form a regulatory cascade,
and are expressed in a specific temporal progression with precise, and increasingly complex, spatial
patterns. Their expression is initiated by maternally deposited transcripts of bicoid and caudal, which are
present in opposing gradients along the A-P axis. A significant body of work has shown how different
thresholds of Bicoid are capable of activating/repressing certain target genes, thus explaining how the
Bicoid gradient can establish distinct target gene expression patterns. For example, the segmentation
gene hunchback (hb) contains multiple Bicoid binding sites; the number and quality of these binding
sites are critical to ensure that Hb is activated starting at the proper point along the A-P axis (Driever et
al., 1989; Struhl et al., 1989).
The second step – the specification of segment identities – is accomplished by Hox genes. Hox
genes, whose transcripts are first detectable in the late syncytial blastoderm stage, are activated in
specific expression patterns by segmentation genes (Akam and Martinez-Arias, 1985; White and
Lehmann, 1986; Reinitz and Levine, 1990). The gap genes hb and tailless (tll), for instance, repress Ubx
to set up its anterior (hb) and posterior (tll) expression boundaries (White and Lehmann, 1986; Reinitz
and Levine, 1990).
Distribution of Ubx during development
Although Hox genes are expressed in specific regions along the A-P axis in the embryo, their
domains of expression are out of frame with classically defined body segments. The borders of Hox gene
expression instead coincide with parasegmental boundaries. Parasegments comprise the posterior
compartment of one segment and the anterior compartment of the adjacent posterior segment.
The eight Drosophila Hox genes are located in two different chromosomal clusters – the
Antennapedia (AntP) Complex and the Bithorax Complex (BX-C). The AntP complex contains the Hox

9
genes labial (lab), proboscipedia (pb), Deformed (Dfd), Sec combs reduced (Scr), and AntP. These genes
control head and thorax development. The genes of the BX-C: Ubx, abdominal-A (abd-A), and
Abdominal-B (Abd-B) control development of the thorax and abdomen. Their expression patterns are
consistent with these developmental roles (Figure 1.2).
Figure 1.2: Embryonic expression patterns of Drosophila Hox genes. In situ hybridizations of a stage 11 Drosophila embryo showing the expression patterns of seven Hox genes: lab, Dfd, Scr, AntP, Ubx, abd-A, and Abd-B. (Adapted from Lemons and McGinnis, 2006.)
In the embryonic epidermis, Ubx is expressed from the posterior compartment of the second
thoracic segment (T2p) to the posterior end of the embryo (eighth abdominal segment, A8). In
parasegmental (PS) units, this region stretches from PS5 to PS13 (Beachy et al., 1985; White and Wilcox,
1985). Notably, the levels of Ubx are not uniform across these segments. Ubx transcripts and protein are
strongest in PS6 (T3p+A1a), and more weakly present in PS5, and at gradually decreasing levels from PS7
to PS13 (Akam and Martinez-Arias, 1985; Beachy et al., 1985; White and Wilcox, 1985). The levels of Ubx
vary not only between parasegments, but also within individual parasegments. Ubx levels are highest in
the anterior compartment and lower in the posterior compartments (Martinez-Arias and White, 1988;
Mann, 1994).
In the third larval instar stage, Ubx protein is detectable at high levels in two types of imaginal
discs: the haltere imaginal disc and the third thoracic (T3) leg disc (Figure 1.3 and White and Wilcox,
1985). Ubx is also present in peripodial cells of the wing imaginal disc – these are cells that will not form

10
part of the adult structure. Ubx is expressed in all cells of the haltere imaginal disc. Like in the embryo,
however, it is not expressed at uniform levels in all cells. Ubx levels are higher in the distal haltere,
referred to as the pouch (this region forms the capitellum, or the appendage proper, in the adult), and
more weakly in the proximal cells which give rise to the joint and a small part of the body wall in the
adult (White and Wilcox, 1985; Brower, 1987). It is this difference in Ubx levels along the P-D axis of the
developing haltere that my work has explored, and is described in chapter two. Within the pouch, Ubx
protein is detectable at higher levels in the posterior compartment than the anterior compartment
(Figure 1.3). Ubx is also expressed in all cells of the T3 leg imaginal disc. Its levels are higher in the
posterior relative to anterior compartment, but do not show any other spatial bias at this stage (Figure
1.3; White and Wilcox, 1985). Later in development (pupal and adult stages), however, Ubx displays a PD
expression bias, with higher levels proximally and lower levels distally (Stern, 1998).The mechanisms
behind these differences in levels and their functional consequences, where known, are discussed in
detail later in the section titled “Ubx levels and autoregulation”.
Figure 1.3: Ubx expression in imaginal discs. Ubx is expressed throughout the haltere and T3 leg imaginal discs. Its levels are higher in the posterior (P) compartment of the T3 leg and haltere pouch. The P compartment is marked by engrailed-Gal4>UAS-GFP.
11
Polycomb and trithorax group genes
PcG and trxG genes maintain Hox expression patterns through development
The segmentation genes that establish Hox expression patterns are only transiently expressed,
and are no longer detectable after gastrulation (6 hours after fertilization). Two classes of genes, both of
which are ubiquitously expressed, maintain Hox expression patterns after they are initially set up. They
are the Polycomb Group (PcG) and Trithorax Group (trxG) genes (Lewis, 1978; Struhl and Akam, 1985).
PcG genes function as repressors and keep Hox genes off in cells where they are initially
inactive. In PcG mutants Hox gene expression spreads outside their normally spatially restricted domains
(Struhl and Akam, 1985). To date, 18 genes in Drosophila have been classified as members of the
Polycomb Group, based on the fact that mutants misexpress Hox genes. TrxG genes play the
complementary role and ensure that Hox genes remain active in the cells in which they are initially
expressed. Mutations in trxG genes show a loss of Hox gene expression; however, in double mutants of
PcG and trxG genes, Hox genes are still expressed (Klymenko and Muller, 2004). This indicates that trxG
genes are not strictly required to maintain Hox gene expression, but rather oppose PcG repression and
act as anti-repressors (Klymenko and Muller, 2004).
Classical studies of PcG genes focused on the regulation of Drosophila Hox genes and led to the
notion that the PcG silencing is complete and irreversible. It was thought of as a cellular memory system
that kept genes in a stable transcriptional state – off or on – from one cell cycle to the next. While this is
still thought to be true in the case of PcG regulation at Drosophila Hox genes, recent work in both
Drosophila and mammalian systems has shown that this is not necessarily the case for all PcG targets: in
several contexts PcG repression is reversible and can be overturned (Lee et al., 2006; Boyer et al., 2006;
Oktaba et al., 2008). In light of these findings, it seems that Hox genes – although the first identified
targets of the PcG – may not be representative targets.
PcG genes function as distinct multiprotein complexes

12
18 genes in Drosophila are classified as PcG genes based on the fact that Hox genes are
misexpressed in animals that are mutant for these proteins. PcG genes are thought to act in four
principal complexes in Drosophila: Polycomb Repressive Complex 1 (PRC1), Polycomb Repressive
Complex 2 (PRC2), Pho Repressive Complex (PhoRC), and Polycomb Repressive Deubiquitinase (PR-DUB)
(Shao et al., 1999; Czermin et al., 2002; Klymenko et al., 2006; Muller et al., 2002). Variants for some of
these complexes, such as Pcl-PRC2 and a PRC1-like dRaf complex, have also been reported (Nekrasov et
al., 2007; Lagarou et al., 2008; Scheuermann et al., 2010).
PRC1 includes the chromodomain protein Polycomb (Pc), Sex Combs Extra (Sce), Posterior Sex
combs (Psc) or its paralog Suppressor of zeste-2 (Su(z)2), and two highly related proteins Polyhomeotic
proximal (Ph-p) and Polyhomeotic-distal (Ph-d) (Francis et al., 2001; Lo and Francis, 2010; Strubbe et al.,
2011). PRC1 inhibits nucleosome remodeling and transcription and compacts chromatin in vitro,
primarily due to the activity of the Psc/Su(z)2 subunit (Levine et al., 2004).
PRC2, which contains the SET domain protein E(z) (Enhancer of zeste), functions as a histone
methyltransferase (HMTase) that methylates the lysine 27 residue of histone 3 (H3K27me) in vitro. E(z)
is the catalytic component of this complex but other components such as Su(z)12, ESC and ESCL are
necessary for this enzymatic activity. In Drosophila, all H3K27me, mono-, di-, and tri-, has been shown to
be PRC2 dependent. Mutants of E(z) or ESC lose all H3K27me. A variant of the PRC2 complex containing
the Polycomb-like (Pcl) protein has been shown to generate high levels of H3K27me3 at Polycomb target
genes (Nekrasov et al., 2007). Mutants for the Pcl gene fail to exhibit high H3K27me3 levels when
assayed in imaginal disc cells (Nekrasov et al., 2007).
Early models proposed that PRC2 and PRC1 were recruited to Polycomb target sites
sequentially. The chromodomain of Pc (in PRC1) has a specific affinity for H3K27me3 and it was widely
thought that PRC2, which deposited this mark, would thereby recruit PRC1. However, two recent
findings cast doubt on this model of sequential recruitment. First, experiments in which a PRC1 or a

13
PRC2 component protein is targeted to a reporter gene by fusing it to a GAL4 DNA binding domain have
shown that each complex is capable of recruiting the other. Second, both PRC1 and PRC2 have been
shown to interact with the PhoRC complex; PhoRC contains the DNA-binding protein Pleiohomeotic
(Pho). Pho and pleiohomeotic-like (pho-like) are the only Drosophila PcG genes that have the ability to
bind DNA directly, and PhoRC is thus the only principal PcG complex that can bind DNA in a sequence
specific manner (Brown et al., 1998; Brown et al., 2003). Pho and Pho-like have very similar DNA binding
domains, seem to bind the same DNA sequence in vitro, and act mostly redundantly (Klymenko et al.,
2006; Brown et al., 2003). Although the DNA binding ability of Pho is important to recruit PcG complexes
to their target sites, other DNA-binding proteins, namely GAGA factor, Pipsqueak, Zeste, DSP-1 have
been implicated in this process; however, mutants in those genes do not show Hox misexpression or
other PcG phenotypes (Dejardin et al., 2005; reviewed in Muller and Kassis, 2006).
Polycomb Response Elements (PREs)
PcG genes act on specific cis-regulatory elements called Polycomb Response Elements (PREs).
The first PRE to be identified was the 1.6kb long bxdPRE at the Ubx, located 24kb upstream of the Ubx
transcription start site (Chan et al., 1994). The bxdPRE is bound directly by PcG genes in vivo in
Drosophila salivary glands, as well as in vitro by the DNA-binding PcG protein Pho (Chan et al., 1994 and
Fritsch et al., 1999). Mutating Pho binding sites in transgenic reporter constructs containing this PRE
impair its ability to silence reporter expression. Work done with transgenic reporter constructs has also
shown that the bxdPRE can potently silence heterologous promoters and enhancers from genes other
than Ubx, including those from genes that are not known to be repressed by PcG genes during normal
development (Sengupta et al., 2004). Finally, using transgenic constructs in which a PRE is flanked by FRT
sites, it has been shown that excising the PRE leads to a loss of silencing within one cell generation
(Sengupta et al., 2004; Busturia et al., 1997). This has been shown for two separate PREs – one from the
Ubx locus and one from the AbdB locus (Sengupta et al., 2004; Busturia et al., 1997).

14
With the application of genome-wide binding protocols, many other PREs have subsequently
been identified (Negre et al., 2006; Schwartz et al., 2006; Tolhuis et al., 2006; Oktaba et al., 2008). In
contrast to Hox genes – which often contain multiple PREs located far from their transcription start sites
(TSS), it seems that most target genes only contain a single PRE, usually located within ~1kb of the TSS
(Oktaba et al., 2008). Predicting PREs based on binding site motifs for Pho and other DNA-binding
proteins found at PREs (GAF/Trl, Zeste) has proven very tricky. Genome-wide binding experiments have
found that PhoRC is bound at only 15% of PREs predicted in silico in this manner (Ringrose et al., 2003;
Oktaba et al., 2008).
PREs have recently been identified in the mouse and the human (including a PRE in the human
HOXD cluster); these mammalian PREs seem to obey the same genetic and molecular rules as Drosophila
PREs and are functional as silencing elements when injected as transgenic constructs into Drosophila
(Woo et al., 2009; Sing et al., 2009; Cuddapah et al., 2012).
Insights from genome-wide studies of PcG regulation
Genome-wide ChIP and DamID studies suggest that there are around 200 PcG target genes in
Drosophila (Negre et al., 2006; Schwartz et al., 2006; Tolhuis et al., 2006; Oktaba et al., 2008). Genes
encoding developmental regulators are found to be highly overrepresented among these presumptive
PcG targets (Oktaba et al., 2008). These studies indicate that PRC1, PRC2 and the PhoRC complex are co-
bound at a large set (but not all) of presumptive target genes, and that their binding is sharply localized
at presumptive PREs. However, the chromatin marks associated with PcG silencing, like H3K27me3, are
present in broad regions that tend to encompass entire coding regions as well as regulatory elements
(Schwartz et al., 2006). This finding is borne out when analyzing chromatin marks and PcG/trxG protein
binding at individual loci including Ubx (Papp and Muller, 2006; Langlais et al., 2012).
In vivo protein binding assays at the Ubx, en, and invected (inv) loci have shown that, at least in
these cases, PcG proteins are bound to PREs regardless of gene activity. In fact, both PcG and trx

15
proteins appear constitutively bound at PREs of these genes (Papp and Muller, 2006; Langlais et al.,
2012). These findings are at odds with previous ideas that transcription through a gene displaces PcG
complexes and thereby switches a gene from a heritable off state to a heritable on state (Bender and
Fitzgerald, 2002; Schmitt et al., 2005).
PcG regulation can be dynamic and nuanced
Among the most exciting advances in the field of PcG biology over the past six years has been
the mounting evidence that PcG regulation need not be absolute or irreversible. Rather, PcG regulation
can be nuanced and dynamic. Evidence for this revised view of PcG regulation comes from Drosophila as
well as mammalian systems.
The first indications that PcG repression is reversible came from mammalian stem cells. In
mouse and human ES cells, genome-wide ChIP data has shown that PcG targets include a large number
of developmentally important transcription factors (Lee et al., 2006; Boyer et al., 2006). However, while
these genes are repressed in ES cells, specific sets of them are activated in particular lineages during
differentiation and development. This indicates that not all PcG targets are repressed permanently.
In line with these findings, many PcG target genes are found in a “bivalent” chromatin state –
containing chromatin modifications associated with silenced (H3K27me3) and active (H3K4me3)
transcription (Bernstein et al., 2006; Azuara et al; 2006). These bivalent states are resolved into a purely
on or off state as development continues and lineages become committed to a particular program of
differentiation. Corroborating the idea that H3K37me3 is not necessarily a mark of permanently silenced
chromatin, H3K27me3 demethylases have now been identified in mammals (Agger et al., 2007).
There is evidence that PcG repression is dynamic in Drosophila as well. Oktaba et al examined
the genome-wide binding profile of PhoRC at two different stages of Drosophila development: 6-12hr
old embryos as well as larval imaginal discs. Among the PcG targets they identified (and functionally
validated by genetic mosaic analysis) were apterous (ap), Distal-less (Dll), and pannier (pnr). All three

16
genes are inactive in the embryonic wing primordium, but become active later in development and are
expressed in spatially restricted parts of the larval wing imaginal disc. These three loci were bound by
PhoRC and associated with the silencing mark H3K27me3 in embryos. Oktaba et al propose that the
signaling pathways that activate these genes later in development (wg signaling for Dll and dpp signaling
for pnr) override and reverse the PcG and H3K27me3 mediated silencing at these loci in embryos. While
these results are consistent with emerging findings in mammalian systems, it remains possible that they
are the result of mixed cell populations in the starting materials. The H3K27me3 and PhoRC binding
signals seen at the ap and Dll loci in embryos could arise from other parts of the embryo, and not the
embryonic wing primordium.
Work that has linked PcG regulation to cell cycle control in vivo has shown that PcG regulation is
not necessarily associated with a binary, “all or nothing”, transcriptional output (Martinez et al. 2005;
Oktaba et al., 2008). Clones of cells mutant for the PcG genes Psc-Su(z)2 or ph in Drosophila wing
imaginal discs exhibit a hyper-proliferative, tumor-like phenotype; and overexpression of Bmi-1 (the Psc
homolog) in transgenic mice causes lymphomas (Beuchle et al., 2001; Lund and van Lohuizen, 2004).
Follow up work, from the labs of Jurg Muller and Giacomo Cavalli, has solidified this link. Drosophila cells
mutant for Pc, Psc-Su(z)2, and ph have an altered cell cycle profile and PcG complexes directly bind and
repress the cell cycle genes Cyclin A and Cyclin B in vivo (Martinez et al., 2005; Oktaba et al., 2008).
These findings clearly demonstrate that PcG repression need not be absolute and irreversible, because
cell cycle genes must be dynamically and repeatedly re-expressed in actively proliferating cells.
Cis-regulatory architecture of the Ubx locus
The wealth of mutations that have been isolated at the BX-C provided early insights into the cis-
regulatory architecture of the locus. Many transgenic reporter constructs have also been generated over
the years, using cloned regulatory DNA from the Ubx locus; this has added to our understanding of the
location and function of many Ubx enhancers.

17
The Ubx gene spans about 100kb and its transcription unit alone is 77kb. Ubx is alternatively
spliced into 6 known isoforms. All isoforms share a 247 amino acid N-terminal region and a 99 amino
acid C-terminal region but differ in the region connecting these two. The differences lie in the presence
or absence of three optional elements: “b”, encoded by 9 amino acids at the end of the common 5’
exon; “mI” and “mII”, independent microexons of 17 amino acids (Kornfeld et al., 1989; O’Connor et al.,
1988). Antibodies raised against these optional elements have shown that different isoforms have
different expression patterns during development (Lopez and Hogness, 1991). However, mutations that
eliminate all but one isoform (UbxIVa) have only mild developmental phenotypes, and there is debate
about how relevant the various isoforms may be to Ubx function in vivo (Busturia et al., 1990;
Subramaniam et al., 1994; Reed et al., 2010). The situation is complicated by differences in levels; recent
work has shown that when expressed at higher levels, certain isoforms can play the role of one another
(de Navas et al., 2010).
The Ubx regulatory elements are grouped into two distinct units based on genomic location and
function (Figure 1.4). The Upstream Control Region (UCR), which begins at the Ubx transcription start
site and extends 35kb upstream, and is associated with the pbx and bxd mutations; and the Downstream
Control Region (DCR), which lies in the third intron of Ubx, and is the site of the abx and bx mutations. In
accordance with the principles of collinearity, the DCR (which is centromere proximal) is responsible for
expression in PS5 (T2p+T3a) in the embryo and anterior compartment expression of the haltere and
third leg imaginal discs, while the UCR drives expression in PS6 of the embryo and the P compartment of
the haltere and T3 leg discs. For both the UCR and the DCR, large (35kb and 20kb, respectively) regions
have been cloned into reporter constructs and confirm the function of these regulatory elements
predicted based on the analysis of classical alleles. Importantly, the UCR and DCR each contain their own
PRE, allowing the A-P expression borders of these elements to stay defined till the larval stages, long
after the segmentation genes that establish Hox expression patterns have decayed.
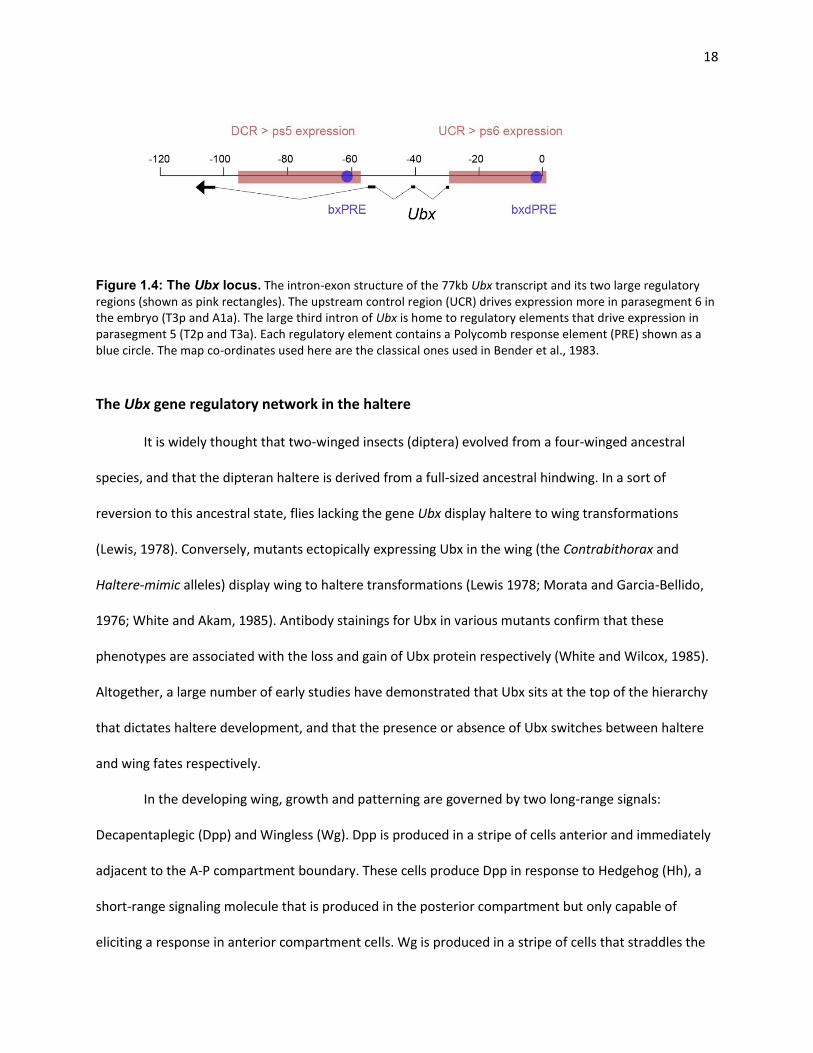
18
Figure 1.4: The Ubx locus. The intron-exon structure of the 77kb Ubx transcript and its two large regulatory regions (shown as pink rectangles). The upstream control region (UCR) drives expression more in parasegment 6 in the embryo (T3p and A1a). The large third intron of Ubx is home to regulatory elements that drive expression in parasegment 5 (T2p and T3a). Each regulatory element contains a Polycomb response element (PRE) shown as a blue circle. The map co-ordinates used here are the classical ones used in Bender et al., 1983.
The Ubx gene regulatory network in the haltere
It is widely thought that two-winged insects (diptera) evolved from a four-winged ancestral
species, and that the dipteran haltere is derived from a full-sized ancestral hindwing. In a sort of
reversion to this ancestral state, flies lacking the gene Ubx display haltere to wing transformations
(Lewis, 1978). Conversely, mutants ectopically expressing Ubx in the wing (the Contrabithorax and
Haltere-mimic alleles) display wing to haltere transformations (Lewis 1978; Morata and Garcia-Bellido,
1976; White and Akam, 1985). Antibody stainings for Ubx in various mutants confirm that these
phenotypes are associated with the loss and gain of Ubx protein respectively (White and Wilcox, 1985).
Altogether, a large number of early studies have demonstrated that Ubx sits at the top of the hierarchy
that dictates haltere development, and that the presence or absence of Ubx switches between haltere
and wing fates respectively.
In the developing wing, growth and patterning are governed by two long-range signals:
Decapentaplegic (Dpp) and Wingless (Wg). Dpp is produced in a stripe of cells anterior and immediately
adjacent to the A-P compartment boundary. These cells produce Dpp in response to Hedgehog (Hh), a
short-range signaling molecule that is produced in the posterior compartment but only capable of
eliciting a response in anterior compartment cells. Wg is produced in a stripe of cells that straddles the

19
dorsal-ventral (D-V) boundary. These cells are induced to express Wg by the activation of the Notch (N)
receptor by the membrane-bound ligands Delta (the ventral to dorsal signal) and Serrate (the dorsal to
ventral signal). Both Dpp and Wg are secreted from these AP and DV boundaries and are present as
morphogenic gradients across the field of wing imaginal disc cells. They act via their receptors
(thickveins and frizzled) and downstream transcription factors (Mad and TCF) to regulate many target
genes in a concentration-dependent manner (Nellen et al, 1996).
One of the more striking differences between the wing and haltere is the size of the appendage.
At the end of larval development, the wing imaginal disc has 50,000 cells compared with the haltere
disc’s 10,000. In the embryo, at the time these two primordia are specified, the wing has only twice as
many cells as the haltere. These observations indicate that Ubx must limit cellular proliferation in the
haltere. Several studies have shown that Ubx achieves this in large part by regulating the Dpp pathway.
Dpp is required for imaginal disc growth; ectopic expression of Dpp yields enlarged appendages, and
mutants lowering Dpp levels are associated with size reductions.
In the haltere, Ubx limits both the production and the mobility of Dpp (Crickmore and Mann,
2006;2007). Ubx impedes Dpp mobility by at least two mechanisms: First, the Dpp receptor, thickveins
(tkv), is derepressed in the presence of Ubx in the haltere (Crickmore and Mann, 2006). This prevents
the secreted Dpp molecule from being able to travel as feely and as far as it does in the wing. Higher tkv
levels also mean greater Dpp signal transduction in the AP organizer cells, thus feeding back on and
reducing Dpp production in the haltere versus the wing (Crickmore and Mann, 2006). Second, Ubx limits
Dpp mobility by repressing the glypican dally, an extracellular protein known to facilitate morphogen
diffusion. Ubx, in conjunction with engrailed, represses dally specifically in the posterior compartment of
the haltere. This not only reduces the overall size of the appendage, but also reduces the P:A size ratio
of the haltere relative to the wing (Crickmore and Mann, 2007). The actions outlined here are only part

20
of the story of how Ubx limits haltere size. It seems likely that Ubx regulates the Dpp pathway in
additional, as yet undetermined, ways.
Ubx levels and autoregulation
As described in the section on “Distribution of Ubx during development”, Ubx is expressed at
different levels in different spatial-temporal contexts during development. In this section I discuss the
molecular mechanisms and functional consequences of the various differences in Ubx levels during
development.
In the embryo, Ubx is expressed most strongly in ps6, at lower levels in ps5, and at gradually
decreasing levels from ps7 – 13. The reduction in Ubx levels in ps7-13 is due in large part to
transcriptional repression by the more posterior Hox proteins – abd-A and Abd-B (Struhl and White,
1985). In embryos mutant for abdA and AbdB, the level of Ubx protein in ps7-13 resembles the high
levels normally found in ps6 (Struhl and White, 1985). Furthermore, in embryos mutant for PcG genes,
Ubx levels are uniformly low (ps13 like) due to the ubiquitous presence of more posterior Hox proteins
(Struhl and Akam, 1985). The biological relevance of this transcriptional downregulation of Ubx by abdA
and AbdB remains unclear. Overexpression of Ubx in ps7-13 is not associated with any obvious
abnormalities in the morphology of embryonic cuticles (Mann and Hogness, 1990).
In the developing embryo, Ubx levels also vary within individual parasegments. Ubx levels are
lower in the posterior than anterior compartment, due to downregulation by the segmentation TF
engrailed (en) (Martinez-Arias and White, 1988; Mann, 1994). Unlike the repression of Ubx in ps7-14,
the functional significance of Ubx downregulation within the posterior compartment of a parasegment
(at least in the case of PS6, where Ubx is most strongly expressed) has been demonstrated. High levels
of Ubx repress Distal-less (Dll), the transcription factor necessary to generate larval sensory structures
called the Keilin’s organs. Dll is normally repressed by high levels of Ubx in the anterior compartment,

21
but Ubx levels must be kept low by en in the P compartment to ensure that Dll is expressed there
(Mann, 1994).
Ubx levels also vary spatially in the imaginal discs in which it is expressed – the T3 leg and
haltere. In the T3 leg disc, Ubx levels are higher in the posterior compartment than the anterior
compartment in the T3 leg, but there is no visible change in Ubx levels along proximal-distal axis (White
and Wilcox, 1985). Later in development, however, Ubx displays a proximal-distal (PD) expression bias,
with higher levels proximally and lower levels distally (Stern, 1998). High Ubx levels in the proximal leg
are required for the formation of a naked patch of cuticle – devoid of non-sensory bristles called
trichomes – on the posterior T3 femur (Stern, 1998). Overexpressing Ubx along the length of the T3 leg
during pupal stages represses these trichomes across most of the adult T3 leg, indicating a functional
relevance for this difference in Ubx levels (Stern, 1998). Differences in Ubx levels in this region are also
associated with morphological differences between Drosophila species in this region (Stern, 1998). This
is discussed in more detail in the section “Transcription Factor Levels in Evolution”.
In the haltere imaginal disc, Ubx levels are highest in the distal region (pouch) and lower
proximally (White and Wilcox, 1985). My work has uncovered the mechanistic basis for this difference in
levels (chapter two). Work done with artificial manipulations has shown that Ubx has concentration
dependent functions in the haltere pouch. Increasing the dose of Ubx using duplications of the entire
locus leads to reduced haltere (capitellum) size in the adult fly while decreasing the dose of Ubx –
hemizygous animals – increases haltere size (Smolik-Utlaut, 1990; Crickmore et al., 2009). This is
presumably in large part because Ubx regulates the dpp pathway in a dose dependent manner. These
observations imply that Ubx levels in the pouch must be maintained within a precise range if haltere size
is to be phenotypically robust. They do not, however, speak to the importance of Ubx levels in the
proximal haltere disc, or the importance of the difference in Ubx levels between the proximal and distal
regions of the haltere disc – explored here, in Chapter Two.

22
Consistent with a gene known to play concentration dependent roles, Ubx is known to
autoregulate. To date, three distinct modes of Ubx autoregulation have been identified. 1) Ubx
positively and indirectly autoregulates to maintain its expression in PS7 of the visceral mesoderm (Bienz
and Tremml, 1988; Thuringer and Bienz, 1993). 2) Ubx negatively autoregulates in the embryo and
imaginal discs in response to ectopic pulses of Ubx overexpression. Clones of cells completely and
heritably lose Ubx protein expression in a PcG dependent mechanism (Irvine et al., 1993; Garaulet et al.,
2008; Crickmore et al., 2009). 3) Increasing the dose of Ubx using chromosomal aberrations that
duplicate the Ubx locus silences certain regulatory elements, but not the Ubx protein, in clusters of
imaginal disc cells (Crickmore et al., 2009). These three known modes of Ubx autoregulation are
discussed below. My work, in Chapter Two, describes a novel function for Ubx negative autoregulation.
Ubx positively autoregulates in the visceral mesoderm during embryogenesis
In the visceral mesoderm of the Drosophila embryo, unlike in the ectoderm, Ubx expression is
restricted to ps7. It has been found that Ubx protein is required to maintain its expression there; Ubx
expression is lost in Ubx mutant embryos (Bienz and Tremml, 1988). This positive autoregulation is
indirect and mediated via the extracellular signals dpp and wg (Thuringer et al., 1993a). Ubx directly
activates dpp in ps7 of the visceral mesoderm; dpp activates wg in the adjacent ps8 compartment of the
visceral mesoderm (Thuringer et al., 1993b). Both wg and dpp then feed back on Ubx to maintain its
expression in ps7 by acting on a 1.4kb regulatory element that stretches from 1.7 to 3.1kb upstream of
the Ubx transcription start site (Thuringer et al., 1993b). Notably, this is the only context in Drosophila
where Ubx positively autoregulates.
Ubx is heritably silenced in response to ectopic pulses of Ubx
Pulses of Ubx overexpression, delivered via a transgenic construct placing Ubx under control of a
heat shock promoter (hs-Ubx), shut down Ubx production in clones of cells in the embryonic epidermis
and imaginal discs (Irvine et al., 1993). Adults that have been treated with hs-Ubx pulses in

23
embryogenesis display haltere to wing transformations, consistent with a maintained loss of Ubx (Mann
and Hogness, 1990; Irvine et al., 1993). Repression of Ubx is complete – no Ubx is detectable by
antibody staining in these cells – and heritably maintained by maintained by PcG proteins long after the
pulse is delivered (Garaulet et al., 2008; Crickmore et al., 2009). No Ubx binding sites have been
identified for this phenomenon; it is therefore not known conclusively whether this regulation is direct.
This seems likely though, since analysis of clones of cells overexpressing Ubx indicate that it is cell-
autonomous. The large UCR seems to contain the elements that compute negative autoregulation as a
transgenic reporter construct containing 35kb of the UCR and the Ubx promoter (35UZ) captures this
negative autoregulatory behavior.
Increasing Ubx copy number represses Ubx regulatory elements in the imaginal discs
The phenomenon described in the previous paragraph leads to complete silencing of Ubx in
response to the overexpression of Ubx beyond physiological levels. Our work has shown that elevating
Ubx levels more modestly, by increasing Ubx copy number with chromosomal duplications can also elicit
a form of negative autoregulation (Crickmore et al., 2009). These dosage increases of Ubx do not silence
Ubx production completely, but rather shut down the expression of a Gal4 enhancer trap line expression
in clusters of imaginal disc cells. Unlike ectopic pulses of Ubx overexpression, a complete loss of Ubx is
never seen in imaginal discs with extra copies of Ubx. This is presumably because there are more alleles
of Ubx that would need to be silenced in these discs, and also that the Ubx levels are not being elevated
to the extent that they are in the hs:Ubx condition.
Ubx binding specificity
Although different Hox proteins perform different tasks in vivo, the in vitro binding preferences
of their DNA binding domains are strikingly similar (Noyes et al., 2008). All homeodomain proteins bind
to “AT” rich sequences in vitro and use the same highly conserved residues to contact DNA. Four
residues in the third alpha helix of the HD make contacts in the major groove of DNA and one residue in

24
the unstructured N-terminal region of the HD makes a minor groove contact (Gehring et al. 1994). While
the issues of TF-DNA binding are discussed in more detail in a later section of this chapter (“Protein-DNA
Interactions”), I discuss some issues directly related to Ubx DNA binding in this section.
Hox cofactors: Extradenticle and Homothorax
As with many TFs, Hox proteins bind DNA cooperatively along with other DNA-binding proteins
in vivo. This is at least part of the explanation for how a family of closely related proteins, with nearly
identical in vitro binding preferences, can regulate distinct target genes in vivo. Two Hox cofactors in
Drosophila have been well characterized: extradenticle (exd) and homothorax (hth). Their relationship
with Hox proteins seems highly conserved across species; the vertebrate homologs of exd (Pbx) and hth
(Meis) bind DNA cooperatively with vertebrate Hox proteins. Exd and Hth are obligate partners in
Drosophila; Hth is required for Exd to translocate into the nucleus and Exd is required for Hth stability
(Rieckhof et al., 1997; Abu-Shaar et al., 1999). Exd and Hth have many functions during development,
extending beyond their role as Hox cofactors. For example, they are master regulators of the antennal
development program (Casares and Mann, 1998).
Exd/Hth bind Hox proteins directly via their TALE (three amino-acid loop extension) domains.
The TALE domain generally binds the YPWM motif of the partner Hox protein. Although all Drosophila
Hox proteins have this YPWM domain, recent work has shown that the more posterior Hox proteins – in
particular Ubx and AbdA – can interact with Exd/Hth using several different domains (Lelli et al., 2011).
In the case of Ubx, at least 4 domains appear sufficient to mediate this Ubx-cofactor interaction: YPWM,
PDWM, UbdA and QAQA (Merabet et al., 2007; Lelli et al., 2011). Whether or not these different
interaction modes lead to different conformations and different DNA-binding specificities is unknown.
Hth is spliced into two different types of isoforms: a full-length isoform (which contain the Hth
homeodomain) and two homeodomain-less isoforms (Noro et al., 2006). All known isoforms contain the
HM domain, which mediates Hth’s interaction with Exd; thus, all Hth isoforms are able to translocate

25
Exd into the nucleus (Knoepfler et al., 1997; Noro et al., 2006). Interestingly, while the full-length version
of Hth is critical for certain functions – such as antennal specification – the HDless isoforms are sufficient
for PD axis formation in the developing leg (Noro et al., 2006). Consistent with the fact that the HDless
isoform is capable of a range of tasks in vivo, the mouse Hth ortholog – Meis1 – also encodes an HDless
isoform (Noro et al., 2006).
While Exd and Hth remain the best characterized Hox cofactors, they are not the only ones. In
Drosophila, the homeodomain protein Engrailed (En) is also known to be a Hox cofactor (Gebelein et al.,
2004). En binds cooperatively with Ubx and Abd-A to a regulatory element in the Dll gene (Gebelein et
al., 2004).
A number of other DNA-binding proteins, often called “collaborators” also work with Hox
proteins to regulate their target genes. For example, the Mad proteins (downstream TFs in the
Drosophila Dpp pathway) have been shown to work with Ubx to repress the gene spalt in a spatial
domain that lacks Exd and Hth (Walsh et al., 2007).
In vitro binding preferences of Ubx complexes
A recent study used SELEX-seq to determine the DNA-binding preferences for all eight
Drosophila Hox proteins in complexes with Exd and the homeodomain-less isoform of Hth (HthHM)
(Slattery et al., 2011). The highest affinity 8-mer binding sequence for Ubx/Exd/Hth from the SELEX-seq
data is TGATTTAT, where TGAT represents the Exd half-site and TTAT the Ubx half-site (Slattery et al.,
2011). Although this is the highest affinity binding site in vitro, it is not represented amongst any of the
in vivo verified Ubx binding sites in Drosophila to date. Ubx is known to regulate a relatively large
number of target genes, but only eight targets have been analyzed to the point of identifying a Ubx
binding site and conclusively proving that Ubx regulation is direct. However, it is worth mentioning that
for at least three in vivo validated target genes, of these targets – spalt, knot, and CG13222 – Ubx binds

26
without the aid of Exd/Hth. Issues of DNA binding affinity are dealt with more thoroughly in the section
titled “Protein-DNA Interactions”. These issues are also discussed in Chapter Two.
TRANSCRIPTION FACTOR EXPRESSION LEVELS
Since the first work on TFs, starting with lambda repressor, it has been known that different
concentrations of the same TF can elicit different cellular responses. This was shown to be true in
eukaryotes as well, through work on the Bicoid gradient in the early Drosophila embryo. Yet, the
majority of work on TFs has focused on how their presence or absence switches between cellular fates;
the presence of a TF eliciting one genetic program and the absence another. The role of TF spatial and
temporal expression patterns in creating diversity, between tissues within an organism and between
species, has been intensively studied. The levels of TF expression, however, have become a somewhat
underappreciated layer of regulatory control. My work (in chapter two) describes the establishment of
different levels of the Drosophila TF Ultrabithorax (Ubx) in different spatial domains of one developing
tissue. In order to place this work in a broader context, in this section I discuss the functional relevance
of TF levels in disease, evolution, and development, with a particular emphasis on development.
Three key questions emerge from the finding that changes in TF levels have functional
consequences. 1) What are the molecular mechanisms that establish different levels of the same TF in
different contexts? Several examples are known, and my work (in chapter two) provides another. In the
section below, I discuss in detail an example of such a mechanism in a developmental context: Hox
paralog-specific down-regulation of FoxP1. 2) Given that TFs have dose-dependent functions, what are
the mechanisms to ensure that in a given spatial and temporal context, TFs are expressed within a
precise and proper range of levels? I discuss a mechanism known to confer precision to gene expression
in the following section: “Negative autoregulatory loops in biological systems”. Interestingly, this same
mechanism can also be employed to establish differences in TF levels, as discussed in my work in
chapter two. 3) Mechanistically, how do different levels of the same TF elicit different gene expression

27
profiles? This remains incompletely understood, but it seems to involve – at least in part – the ability of
TFs to bind certain cis-regulatory elements in a dose-dependent manner. Certain low-affinity TF binding
sites have been shown to be sensitive to TF concentrations. Some of these examples are discussed later
in the section titled “Protein-DNA interactions”.
Transcription factor levels and human disease
Aberrant TF levels have been implicated in a number of human pathologies. For example, lower
levels of Pax6 in humans are associated with developmental disorders (discussed in the next section).
Haplo-insufficiency of the T-box gene Tbx-5 is associated with Holt-Oram syndrome, a rare congenital
heart disease (Basson et al., 1997). This has been successfully modeled in Tbx+/- mice (Bruneau et al.,
2001).
TF levels are also associated with non-developmental diseases. Higher levels of the transcription
factor Forkhead BoxM1 (FoxM1) has been shown to accelerate prostate carcinoma progression in
transgenic mice; FoxM1 is also found to be overexpressed in a number of aggressive human carcinomas
(Kalin et al., 2006). An interesting case is that of CTCF levels in breast cancer cell lines. As assayed by
Western blots, CTCF protein levels were elevated in 15 breast cancer cell lines as compared to two cell
lines derived from normal breast epithelium (Docquier et al., 2005). In 90% of these 15 breast cancer cell
lines, CTCF levels were upregulated by at least a factor of 2 (Docquier et al., 2005). Knock-down of CTCF
in breast cancer cell lines increased the rate of apoptosis, suggesting that higher CTCF levels protect
cancerous cells from apoptosis. Consistent with this idea, overexpression of CTCF in cancer cell lines
reduced the extent of apoptosis that was induced by pro-apoptotic treatments (addition of exogenous
Bax protein or sodium butyrate). Furthermore, the levels of the apoptotic protein Bax were found to be
downregulated in cell lines overexpressing CTCF, and present at relatively higher levels in cell lines in
which CTCF had been knocked down; although this was only assayed in one of the 15 breast cancer cell
lines used in the study. This suggests that CTCF may be a concentration dependent regulator of

28
apoptosis in certain cell lines, perhaps by negatively regulating the proapoptotic protein Bax (Docquier
et al., 2005). Given that CTCF is known to have a broad range of functions, however, this hypothesis
remains to be conclusively proven.
Transcription factor levels and development
It has been shown in several cases that altering the levels of a transcription factor can switch
between developmental fates. In this section, I discuss two examples in detail. The first involves Pax6, a
transcription factor that is highly conserved among vertebrates and invertebrates, and is known to have
dosage-dependent effects in humans and mice. Pax6 levels control the balance between self-renewal
and neurogenesis in mouse neural stem cells (Sansom et al., 2009). Pax6 is a positive transcriptional
regulator of both self-renewal and neurogenesis; but higher Pax6 levels favor one developmental choice
and lower Pax6 levels another. The second example concerns FoxP1, a Hox protein accessory factor,
which acts as a dose-dependent determinant of motor neuron columnar fate. High levels of FoxP1 drive
one columnar identity, low levels another. Switching FoxP1 levels is sufficient to switch between the two
identities (Dasen et al., 2008).
Pax6 levels regulate the balance between neural stem cell self-renewal and neurogenesis
Pax6 is a highly conserved paired-domain and homeodomain containing TF and is essential for
development of much of the nervous system, including the eye, spinal cord, and cerebral cortex.
Heterozygous Pax6 mutants in the human and mouse display developmental phenotypes including
aniridia (an absence of irises) and forebrain abnormalities (Sisodiya et al., 2001). In the mouse,
overexpression of Pax6 is associated with similar phenotypes: microphthalmia (small eyes) and forebrain
abnormalities (Schedl et al., 1996).
In an attempt to get at a mechanistic basis for these Pax6 dosage phenotypes, Frederick Livesey
and colleagues attempted to determine the transcriptional regulatory network of Pax6 in stem cells of
the developing mouse cerebral cortex (Sansom et al., 2009). The entire mouse brain is derived from

29
neural stem cells. During development, these cells – like all stem cells – must strike a balance between
self-renewal, to maintain enough neural stem cells, and differentiation into the different lineages and
neuronal subtypes that will constitute the adult brain. A failure to strike the right balance will lead to
abnormal brain development. Too much self-renewal leads to a small brain with an insufficient number
of neurons and abnormal connections. Too little self-renewal depletes the pool of neural stem cells too
soon and also leads to an abnormally small brain.
Sansom et al. combined ChIP-chip data with gene expression data from Pax6 loss of function
and overexpression (2-fold increase in levels) conditions. This enabled them to predict direct
transcriptional targets of Pax6 in these cells as well as the direction of the regulation – positive or
negative (Sansom et al., 2009). Surprisingly, they found that Pax6 positively regulates target genes that
promote self-renewal (Hmga2 and Cdk4) as well as genes that promote neurogenesis. Why does the
same transcription factor promote two opposing developmental choices?
In vivo analysis adds color to this picture. Homozygous Pax6 mutants lose neuronal stem cell
self-renewal because Pax6 positively regulates genes required for self-renewal. A Pax6 gain-of-function
mutant (2-fold increase in Pax6 levels) indicates that excess Pax6 tips the scales in favor of neurogenesis
at the expense of self-renewal. In other words, the neurogenic functions of Pax6 are dominant over the
self-renewal functions. Thus, in both cases – loss or overexpression of Pax6 – the same phenotypic
consequence arises albeit due to different mechanisms. It is presumed that in order to strike the right
balance between self-renewal and neuronal differentiation, the right levels of Pax6 must be achieved. It
is also possible that Pax6 levels vary temporally during development, but this has not yet been observed.
Interestingly, a similar situation is seen in embryonic stem (ES) cells, where Oct-3/4, a TF
required for ES cell self-renewal, also exhibits dosage dependent effects (Niwa et al., 2000). Repression
of Oct-3/4 leads to a loss of pluripotency and dedifferentiation to trophectoderm; in contrast, increasing

30
Oct-3/4 levels, by less than a factor of two, causes differentiation into primitive endoderm and
mesoderm (Niwa et al., 2000).
Different Levels of FoxP1 specify different motor neuron columnar identities
In vertebrates, developing spinal motor neurons segregate into discrete columns, each one
innervating a different domain. Medial motor column neurons (MMCs) innervate axial muscles; hypaxial
motor column neurons (HMCs) innervate body wall muscles; preganglionic motor column neurons
(PGCs) innervate sympathetic ganglia; and lateral motor columns (LMC) innervate limb musculature.
This topographic motor map is constructed by Hox gene profiles, which are established by morphogen
gradients. Graded Hh and Wnt4/5 signals control Hox gene expression along the dorso-ventral axis to
specify MMC and HMC fates; a rostro-caudal FGF gradient establishes Hox expression in specific
domains to specify PGC and LMC neurons.
Even though Hox proteins are expressed in all spinal MNs, only PGC and LMC neurons depend
on Hox function (Dasen et al., 2003). This is because the Hox accessory factor, FoxP1, is only present in
PGC and LMC neurons, and absent in HMCs and MMCs. Although FoxP1 is expressed in both the LMCs
and PGCs, it is present at ~6-fold higher levels in LMCs relative to PGCs (Dasen et al., 2008).
The FoxP1 expression pattern in these MN columns, including the difference in levels in LMCs
and PGCs, is set by the particular Hox paralog profile in these domains (Dasen et al., 2008). By altering
the profile of Hox proteins along the rostro-caudal axis of the developing chick spinal cord, it was shown
that such changes were accompanied by changes in FoxP1 expression levels.
Interestingly, the levels of FoxP1 are crucial to specify proper columnar identity. Ectopic
expression of FoxP1 in prospective HMCs (which usually do not express FoxP1) converted them to PGCs
(which usually express low levels of FoxP1). Furthermore, increasing FoxP1 levels in PGCs converts them
to LMCs (which usually express high levels of FoxP1). Thus, incremental increases in FoxP1 levels lead to

31
a stepwise change in columnar fate from HMCs to PGCs to LMCs even without changing Hox paralog
expression profiles.
Transcription factor levels and evolution
Slightly over 35 years ago, Mary-Claire King and Allan Wilson postulated that the vast
differences between humans and chimpanzees could not be explained by the small (by their
calculations, <1%) differences in coding sequences between the two species (King and Wilson, 1975).
They proposed that mutations in regulatory DNA must have played a major role in this evolutionary
divergence.
Consistent with this idea, two recent studies found that although TF’s DNA-binding preferences
are highly conserved between vertebrate species, their in vivo genome-wide binding profiles are highly
species specific (Odom et al., 2007; Schmidt et al., 2010). Schmidt et al performed ChIP-seq for two TFs
(CCAAT/enhancer binding protein alpha and hepatocyte nuclear factor 4 alpha) across five vertebrate
species (Schmidt et al., 2010). Odom et al compared the binding profiles of four TFs (FOXA2, HNF1A,
HNF4A and HNF6) at 4,000 gene pairs in hepatocytes purified from human and mouse livers. Their
results indicate that between 41 to 89% of binding events for these TFs, in hepatocytes, are species
specific. Based on these data, as well as a number of more detailed analyses at individual loci, it is widely
thought that both mutations in coding sequences as well as regulatory regions can and do contribute to
the evolution of morphological traits, and presumably other traits as well (reviewed in Carroll, 2005).
Mutations in cis-regulatory elements lead to changes in gene regulatory networks not only by
affecting the ability of TFs to regulate target genes, but also by affecting the regulation of TFs
themselves. In the case of the Drosophila Hox transcription factor Ubx, it has been shown that changes
in its expression levels contribute to evolutionary diversity. A change in Ubx levels between two
Drosophila species has altered the pattern of trichomes (non-sensory bristles) on the midleg femur
between them (Stern, 1998). Normally high levels of Ubx in the posterior femur of the Drosophila midleg

32
repress trichome formation resulting in a naked patch of cuticle (Stern, 1998). Lowering Ubx levels
decreases the size of the naked patch while raising Ubx levels increases its size (Stern, 1998). Variation in
the size of this patch of naked cuticle between Drosophila species is associated with corresponding
changes in Ubx levels. For example, D. virilis has no naked cuticle and expresses Ubx at very low levels in
this region (Stern, 1998). Comparing flies that contain only a single copy of Ubx (from D. virilis or from D.
melanogaster) in an otherwise hybrid genetic background confirms that the lack of a naked cuticle patch
in D. virilis is due to mutations in the cis-regulatory region of this species’ copy of the gene (Stern, 1998).
The example described above indicates that it is possible for differences in TF levels to
contribute to evolutionary change. However, it is unclear whether this is a major contributor to
evolutionary change. Kevin White and colleagues assayed gene expression levels across three species of
Drosophila (simulans, yakuba and melanogaster) and found that TF levels are stable across these species
but the expression of their downstream targets are more likely to have evolved (Rifkin et al., 2003). One
caveat to this study, however, is that mRNA was extracted from the entire animal (at the prepupa stage)
and not in a tissue-specific manner. A study in primates, also by Kevin White’s group, paints a different
picture. When comparing gene expression profiles from liver tissue of humans, chimpanzees,
orangutans and rhesus macaques, TFs were found to be enriched among the set of genes with a human-
specific increase in expression (Gilad et al., 2006). These experiments were done using a cDNA array to
assay relative expression levels of 1,056 orthologous genes across these species, which represent
approximately 70 million years of evolution (Gilad et al., 2006). Although TFs represented 10% of the
genes being tested on the chip, they comprised 42% of the genes upregulated specifically in humans
(Gilad et al., 2006). While fascinating, these results should be interpreted with caution because the raw
numbers are small: of the 1,056 genes assayed, only 12 showed human-specific upregulation, 5 of which
were TFs (i.e. 42%) (Gilad et al., 2006).

33
Thus, although changes in TF levels contribute to evolutionary diversity in certain cases, the
extent to which this occurs is unclear. However, given that a) cis-regulatory elements and gene
regulatory networks contribute to evolutionary change and that b) the levels of many TFs are known to
have functional consequences in development, the idea that TF levels make a significant contribution to
evolutionary divergence seems plausible at the least.
NEGATIVE AUTOREGULATORY LOOPS IN BIOLOGICAL SYSTEMS
What mechanisms are in place to ensure that genes that play concentration dependent roles in
biology are expressed at precise, robust, and proper levels? One mechanism that serves this purpose in
biological systems is negative feedback. The Drosophila Hox gene Ubx, which is the focus of my work, is
known to negatively autoregulate for this exact purpose (Crickmore et al., 2009). In chapter two, I
describe how Ubx uses negative autoregulation for a different and seemingly opposing purpose in the
same context: to create variability in Ubx expression levels. Specifically, to establish different expression
levels in different spatial domains of the same tissue. In this section, I discuss negative autoregulation
and the various purposes it has been shown to play in biological circuits.
Feedback, or autoregulation, is defined as the ability of a system to adjust its output in response
to monitoring itself (Freeman, 2000). In a direct negative autoregulatory loop, increased accumulation of
a molecule dampens its own production. In an indirect loop, a signal induces the expression of its own
inhibitor. These loops can prevent excessive accumulation of a gene product and narrow the range of
observed expression levels. Consistent with this idea, several transcription factors whose levels are
known to be important – TAR DNA binding protein 43 (TDP-43) and Wilms Tumor 1 (WT1) – are known
to negatively autoregulate in such a manner (Malik et al., 1994; Inoue et al., 1997; Ayala et al., 2010).
Negative autoregulation is widely observed in transcriptional networks. In Escherichia coli, over
40% of known transcription factors negatively autoregulate (Thieffry et al., 1998; Shen-Orr et al., 2002).
In light of this fact, it is not surprising that negative autoregulation has been implicated in a broad range

34
of biological functions including, but not limited to, its role in controlling levels of concentration
sensitive genes. The observed functions of negative autoregulation can be grouped into three functional
categories based on their ability to impart 1) precision; 2) robustness; and 3) variability/versatility to
gene expression and regulatory networks. The first two categories are intimately linked; both are
reflections of reducing noise associated with gene expression. The third category encompasses a range
of behaviors including: a) establishing pulses or oscillations of gene expression (Hirata et al., 2002; Hirata
et al., 2004; Lewis, 2003); b) limiting the duration of a signal in signal-response pathways (Freeman,
2000; Brandman and Meyer, 2008); c) limiting the spatial range of action of a signal; d) allowing faster
transcriptional response times (Rosenfeld et al., 2002; Denby et al., 2012).
Below, I explore the first two functions of negative feedback loops (precision and robustness)
and discuss an example of the third category (variability) – specifically, how negative autoregulatory
circuits lead to oscillating gene expression patterns in vertebrate segmentation.
Negative autoregulatory loops enable precise gene expression
Among the more intuitive theoretically predicted functions for negative autoregulation was that
such motifs would reduce noise and intercellular variation in gene expression (Thattai and van
Oudenaarden, 2001). Several genes that play concentration dependent biological roles are known to be
negatively autoregulate, but this correlation does not prove that negative feedback enables more
precise gene expression.
A direct experimental test of this idea was done with synthetic gene regulatory circuits in E. coli
(Becskei and Serrano, 2000). Two types of circuits were created: one that was capable of negative
autoregulation and one that was incapable of negative autoregulation (Figure 1.5). The autoregulatory
circuit consisted of a single transgene with the lambda promoter, modified to contain two Tet Operator
(TetO) sites, driving production of the Tet Repressor protein (TetR) fused to eGFP. In this circuit, the TetR
protein is capable of binding the TetO sites and repressing its own (and eGFP) production. Two control

35
circuits incapable of autoregulation were also created: in one, the TetO sites were mutated; in the other,
a mutant TetR protein was used (Figure 1.5; Becskei and Serrano, 2000). Quantifying fluorescence in
large numbers of cells revealed that cells containing the transgene capable of negatively autoregulation
had a much narrower fluorescence distribution than cells with either of the other two transgenes
(Figure 1.5; Becskei and Serrano, 2000). This demonstrates that negative autoregulation is capable of
reducing gene expression noise and cell-to-cell gene expression variation. Later work using similar but
different artificial circuits in Saccharomyces cerevisiae have confirmed and expanded on these results
(Nevozhay et al., 2008).
Figure 1.5: Negative feedback loops enable precise gene expression. This figure, adapted from Becskei and Serrano, 2000, summarizes their findings that negative autoregulatory circuits produce narrower gene expression profiles than non-autoregulatory circuits. Each of the three panels has a schematic of a transgene (synthetic circuit) on the left and corresponding fluorescence expression profile on the right. Each transgenes contains a form of the tetO promoter linked to a sequence encoding TetR-EGFP, a protein in which the TetR

36
repressor is fused to the EGFP fluorescent protein. (A) The wild type transgene, in which TetR binds tetO and limits its own production, and associated histogram of gene expression. (B) A transgene containing a mutant form of TetR that cannot bind tetO and thus cannot negatively autoregulate. (C) A transgene containing mutant tetO sites that cannot be bound by TetR. Thus, this circuit cannot negatively autoregulate either. (Adapted from Becskei and Serrano, 2000).
Negative autoregulatory loops enable robust gene expression
Robustness, or the stability of systems in response to environmental or genetic variation, is a
hallmark of developmental processes. In 1942, Waddington coined the term “canalization” to describe
this remarkable stability that allows animals to develop in a reproducible and stereotyped fashion under
a wide range of environmental conditions (Waddington, 1942). What are the mechanisms, at the
molecular level, that confer this developmental robustness? Redundancy of gene function – presumably
arising from gene duplication events during evolution – is thought to be responsible for the lack of
abnormal phenotypes in gene knockouts in several species (Wagner, 2000). Recent work in Drosophila
has shown that multiple copies of regulatory elements present at certain genes contribute to robust
gene expression (Hong et al., 2008; Perry et al., 2010; Frankel et al., 2010). Such secondary or redundant
enhancer elements have been termed “shadow enhancers” (Hong et al., 2008). Thus, redundancy at the
level of genes, as well as their regulatory elements, together account for at least part of the remarkable
robustness of animal development.
Negative feedback loops in gene regulatory networks have also been shown to confer
robustness. Work done on synthetic autoregulatory circuits in E. coli, described in the previous section,
demonstrates that the presence of a negative autoregulatory loop reduces the variability and steady-
state levels of protein concentration (Becskei and Serrano, 2000).
Recent work in yeast provides the first direct experimental evidence that the direct negative
autoregulation of a TF confers stability against naturally occurring genetic variation (Denby et al., 2012).
Rox1, the master regulator of the hypoxia response in yeast, is induced under normal oxygen conditions
and repressed under hypoxic conditions. Rox1 negatively autoregulates directly by binding its own

37
promoter sequence at four sites (Denby et al., 2012). Comparing a wild type (WT) Rox1:GFP fusion
transgene to a mutant Rox1:GFP transgene (in which autoregulation is blocked by mutating Rox1
binding sites) revealed the effect of Rox1 autoregulation under various conditions. In wild type yeast
strains, autoregulation allows a very rapid transcriptional activation of Rox1 in response to oxygen
exposure. When autoregulation is abolished, Rox1 is overexpressed to a degree that is toxic to the cells.
By crossing these transgenic Rox1:GFP strains to a range of other yeast strains, from different laboratory
and environmental origins, the effects of naturally occurring genetic variation in S. cerevisiae
populations on Rox1 was assayed. Both reporters – the wild type and mutant (unable to autoregulate) –
reporters showed variation in Rox1-GFP levels as compared to lab strain expression levels, however this
variation was two to five-fold greater without negative autoregulation (Denby et al., 2012). This
evidence strongly implicates direct negative autoregulation as a mechanism to minimize the effects of
naturally occurring genetic variation on the expression levels of certain genes.
Negative autoregulatory loops create variability in gene expression: induction of oscillatory
gene expression in the vertebrate segmentation clock
The work summarized in the previous two sections shows how negative autoregulation can
confer precision and robustness to gene expression. But negative autoregulation can also induce
versatility to gene regulatory networks, and variability to gene expression levels and patterns. One
striking example of this occurs during vertebrate somitogenesis, when negative autoregulation enables
oscillations in gene expression. This is discussed below.
In most animal species the anterior-posterior (AP) axis is generated by dividing the developing
embryo into reiterated segments. In Drosophila these segments form simultaneously starting in the late
blastoderm stage (discussed in another section). This is in contrast to most vertebrate species where
segmentation is not simultaneous but sequential, starting at the anterior end of a cellularized embryo
and moving rhythmically to the posterior end (reviewed in Pourquie, 2011). These segments are known
38
as somites. Pairs of somites bud off the anterior tip of the presomitic mesoderm (PSM) at a pace that is
constant within a species: 120 min for mice and 30 min for zebrafish (Schroter et al., 2008; Tam, 1981).
This periodic addition of somites is triggered by a molecular oscillator – called the segmentation clock –
that integrates three signaling pathways: Notch, Wnt, and Fibroblast Growth Factor (FGF) (reviewed in
Pourquie, 2011). The oscillations can be observed at the molecular level by visualizing expression of
genes in these three signaling pathways during somitogenesis. A key question in the field has been to
identify the molecular circuitry that drives these oscillations.
The bHLH transcription factor hes7, which lies downstream of the Notch pathway, is a gene that
shows such pulses of expression coinciding with somite addition. Its cyclic expression in the PSM has
been mimicked in a mouse cell culture system by the bHLH transcription factor hes1. In these cells it has
been shown that hes1 negative autoregulation explains its cyclic expression with a 2 hour periodicity.
Hes1 represses its own transcription, but is rapidly degraded by the proteasome, thus allowing the next
bout of transcription (Hirata et al., 2002). Follow up work in mice in vivo corroborated these findings by
examining the Hes7 gene itself, and showed that the half-life of Hes7 determines the period of gene
expression oscillation (Hirata et al., 2004). It is unclear whether this hes7 autoregulatory loop is the key
element of the mouse segmentation clock; nevertheless this work serves as a proof of principle that a
negative autoregulatory loop can drive oscillatory gene expression.
Work in the zebrafish suggests that a similar negative autoregulatory loop to the one described
above is the central pacemaker for zebrafish somitogenesis. In this model, the Hes7 homologues – her1
and her7- are not unstable and rapidly degraded, but there is time lag associated with their
transcription. The length of this transcriptional delay determines the period of the gene expression
oscillation. Mathematical modeling as well as in vivo work has shown that this model explains her1 and
her7 gene expression with the same period as found in the zebrafish PSM – 30 mins (Oates and Ho,
2002; Lewis, 2003).

39
Taken together, the work described above indicates that negative autoregulation of a
transcription factor – when coupled with protein instability or transcriptional lag time – can result in
oscillatory gene expression patterns that can be used as biological timekeepers.
PROTEIN-DNA INTERACTIONS
My work, described in chapter two, involves the characterization of a novel binding site for the
Drosophila Hox gene Ubx. To provide appropriate background for those data, in this section I discuss
protein-DNA interactions in general, as well as the key and interrelated issues of binding specificity and
binding affinity.
Proteins bind DNA by forming a large number of electrostatic and van der Waals interactions.
The majority of contacts are made between the protein and the sugar-phosphate DNA backbone. These
contacts are numerous and confer stability to protein-DNA binding, but are usually not sufficient for
specificity (Luscombe et al., 2001). The molecular basis of protein-DNA specificity was traditionally
thought to rely on the formation of hydrogen bonds between DNA base pairs – primarily in the major
groove – and amino acid side chains. Each base pair has a unique hydrogen bonding signature in the
major but not the minor groove of the DNA helix (Seeman et al., 1976). While these interactions are
certainly critical for specific protein-DNA binding, they are now known to be only part of the story.
A newer paradigm for specificity in protein-DNA interactions emphasizes that both
macromolecules have complex and dynamic three dimensional structures. DNA cannot be thought of as
a linear sequence because its shape also contributes to specific protein-DNA interactions. This model of
protein-DNA interactions divides them into two categories: base readouts, in which the unique chemical
signatures of base pairs are recognized by proteins; and shape readouts, in which a protein recognizes
sequence dependent DNA shape that differs from classical B-DNA (Rohs et al., 2010). Base readouts can
be further subdivided into major groove and minor groove contacts. Although base pairs do not have
unique hydrogen bond signatures in the minor groove, some proteins rely on changes in DNA shape and
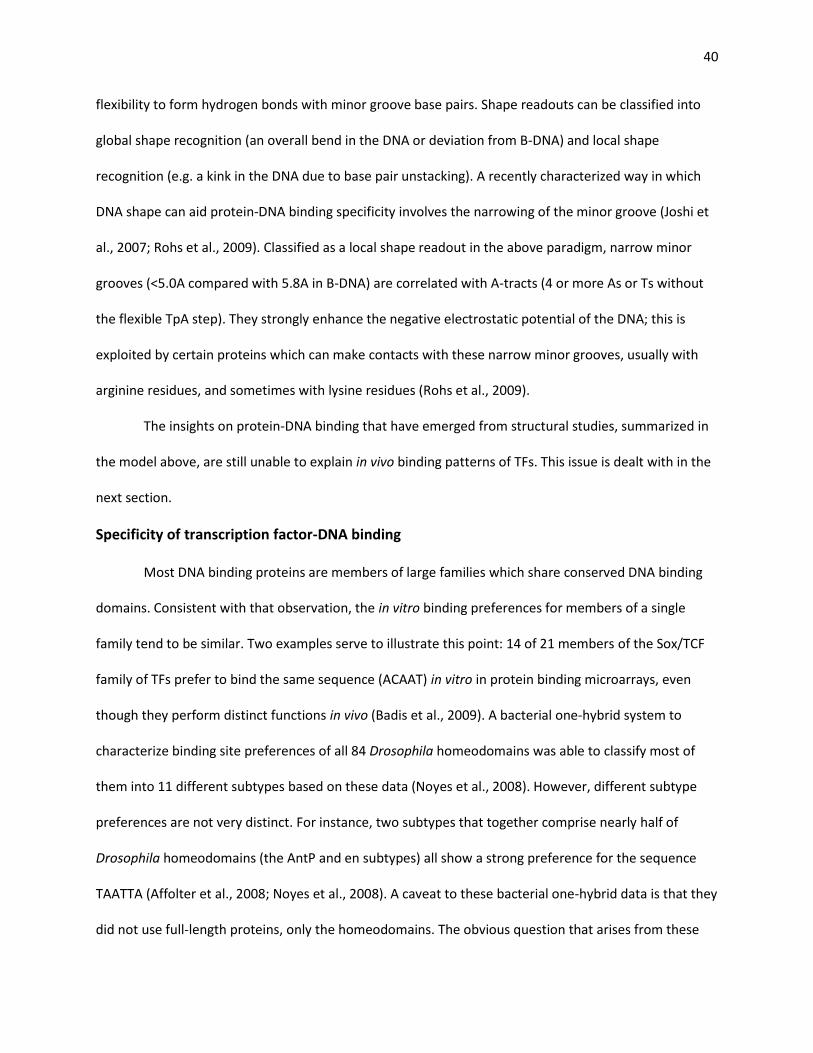
40
flexibility to form hydrogen bonds with minor groove base pairs. Shape readouts can be classified into
global shape recognition (an overall bend in the DNA or deviation from B-DNA) and local shape
recognition (e.g. a kink in the DNA due to base pair unstacking). A recently characterized way in which
DNA shape can aid protein-DNA binding specificity involves the narrowing of the minor groove (Joshi et
al., 2007; Rohs et al., 2009). Classified as a local shape readout in the above paradigm, narrow minor
grooves (<5.0A compared with 5.8A in B-DNA) are correlated with A-tracts (4 or more As or Ts without
the flexible TpA step). They strongly enhance the negative electrostatic potential of the DNA; this is
exploited by certain proteins which can make contacts with these narrow minor grooves, usually with
arginine residues, and sometimes with lysine residues (Rohs et al., 2009).
The insights on protein-DNA binding that have emerged from structural studies, summarized in
the model above, are still unable to explain in vivo binding patterns of TFs. This issue is dealt with in the
next section.
Specificity of transcription factor-DNA binding
Most DNA binding proteins are members of large families which share conserved DNA binding
domains. Consistent with that observation, the in vitro binding preferences for members of a single
family tend to be similar. Two examples serve to illustrate this point: 14 of 21 members of the Sox/TCF
family of TFs prefer to bind the same sequence (ACAAT) in vitro in protein binding microarrays, even
though they perform distinct functions in vivo (Badis et al., 2009). A bacterial one-hybrid system to
characterize binding site preferences of all 84 Drosophila homeodomains was able to classify most of
them into 11 different subtypes based on these data (Noyes et al., 2008). However, different subtype
preferences are not very distinct. For instance, two subtypes that together comprise nearly half of
Drosophila homeodomains (the AntP and en subtypes) all show a strong preference for the sequence
TAATTA (Affolter et al., 2008; Noyes et al., 2008). A caveat to these bacterial one-hybrid data is that they
did not use full-length proteins, only the homeodomains. The obvious question that arises from these
41
observations is: what drives protein-DNA specificity and why is it so hard to observe in vitro? Two
possible explanations, which presumably both contribute to form part of the answer, involve
cooperative TF binding and chromatin accessibility.
Figure 1.6: Crystal structure of Ubx-Exd bound to DNA. (A) the Ubx (red), Exd (cyan), DNA (yellow) complex. The Ubx and Exd homeodomains bind opposite faces of the DNA. Dashed red line is the disordered linker between the homeodomain and linker domain of Ubx. The YPWM domain of Ubx is shown reaching into a hydrophobic pocket on the surface of the Exd homeodomain. (B) Summary of Protein-DNA contacts in the Ubx/Exd/DNA structure. The Ubx half-site (TTAT) is in red and Exd half-site (TGAT) in cyan. Hydrogen bonds are represented by solid lines and nonpolar interactions by dotted lines. Green circles are water molecules and interactions involving the protein main chain are underlined. (Adapted from Passner et al., 1999).
First, TFs often work act in a combinatorial fashion in vivo, by binding cis-regulatory elements
cooperatively with other DNA-binding proteins called cofactors. Such cooperative binding has long been
known to enhance the affinity of TF binding (“classical cooperativity”). Recently, it has been shown that
cooperative binding with a cofactor can also change the specificity of TFs; this variation on classical
cooperativity is called “latent specificity” (Slattery et al., 2011). This was demonstrated using a

42
technique called SELEX-seq, in which traditional SELEX is coupled with deep sequencing to test the
affinity of all possible 12mer sequences for all eight Drosophila Hox paralogs along with their well-
established cofactors, Extradenticle (Exd) and the HM isoform of Homothorax (HthHM) (Slattery et al.,
2011). In the presence of Exd and HthHM, the different Hox paralogs had distinct DNA-binding
preferences from one another, as well as from their own monomer binding preferences (Slattery et al.,
2011). A similar result was obtained using protein-binding microarrays (PBMs) for the S. cerevisiae TFs
Cbf1, Met4 and Met28 (Siggers et al., 2011). When binding along with Met4 and Met28, Cbf1 recognizes
additional sequences than it does when binding alone (Siggers et al., 2011). Cofactors can elicit an even
wider range of effects on TF binding preferences because they need not always interact with a given
protein in the same way. For example, the Drosophila Hox proteins Ubx and Abd-A have multiple
domains capable of interacting with the TALE domain of Exd and Hth (Lelli et al., 2011). While it is not
known if the different ways these proteins can interact with one another would have implications for
the binding specificity of the complex, it is an intriguing possibility.
Second, higher order chromosome architecture and chromatin effects may aid or impair TF
binding in vivo, but are hard to account for in vitro. In a given cell type at a given developmental time
point, only a limited set of the potential cis-regulatory elements that a given TF can bind to may be in an
accessible chromatin state; this would limit the range of potential binding sites a TF can occupy in vivo
relative to its in vitro preferences. An interesting flipside to this idea has also been suggested. TFs with
distinct functions as well as in vitro binding preferences are often found colocalized in a large number of
regions in vivo, raising the possibility that all accessible cis-regulatory elements are bound by a very
broad range of TFs, in many cases with no functional consequences (MacArthur et al., 2009). Eisen and
colleagues have collected ChIP-chip data for 21 Drosophila TFs in embryos and have found a high degree
of overlap in bound regions among these TFs (MacArthur et al., 2009). They propose that high
concentrations of TFs that are found in nuclei, coupled with broad TF binding specificities, directs TFs to

43
regions of open chromatin. They further propose that the difference between functional binding and
non-functional binding lies in the degree of occupancy of a TF at a given site (MacArthur et al., 2009). It
is unclear what the relationship is between the degree of occupancy of a TF at a particular ChIP peak,
and the binding affinity of a TF for the DNA sequence at those loci.
Affinity of transcription factor-DNA binding
Unlike with specificity, all contacts between a DNA binding protein and the DNA double helix
contribute to binding affinity. While most studies aiming to identify transcription factor binding sites
have focused on high affinity sites, it is not clear that the highest affinity sites are the most relevant
targets in vivo. For example, a recent SELEX-seq data set identified all possible 12-mer sequences that
bound the Drosophila Hox protein along with its cofactors, extradenticle and the homeodomain-less
isoform of homothorax (Slattery et al., 2011). However, the highest-affinity sequence is not represented
in any of the in vivo validated Ubx target gene binding sites, most of which have weaker relative
affinities (Slattery et al., 2011; Mann et al., 2009). Computational models have also shown that low-
affinity sites are just as important as high-affinity binding sites to predict gene expression patterns
accurately during Drosophila segmentation; similar analyses have also shown that low-affinity binding
sites are widely used in yeast (Segal et al., 2008; Tanay, 2006).
Low-affinity sites may add value to transcriptional networks in several ways. One interesting
possibility is raised by a recent “competition-ChIP” study of the RAP1 transcription factor in S. cerevisiae
(Lickwar et al., 2012). Low-affinity sites, although bound by RAP1 in vivo, are associated with higher
rates of turnover of RAP1 and low transcriptional activity (Lickwar et al., 2012). This high-turnover
behavior is called “treadmilling”, and turnover rate has been shown to be more strongly linked to TF
function at a particular locus than binding site occupancy (Lickwar et al., 2012). The authors propose
that TF turnover provides an additional point of transcriptional regulation (Lickwar et al., 2012). Exactly
how this mechanism is used remains unknown. In principle, high-turnover binding could be contributing

44
to transcriptional repression: by binding an enhancer in a non-functional way, a TF could prevent
activation signals from acting on that same enhancer. Alternatively, it is possible that treadmilling is a
way to keep TFs bound to their targets without conferring regulation, such that they are poised to
regulate them with fast response times in response to the appropriate molecular cues.
Another possibility is that varying binding site affinity varies the dose-dependency of a target
gene on a particular TF. This idea was perhaps first demonstrated in the case of the Bicoid gradient in
the early Drosophila embryo, where the number and quality of Bicoid binding sites in regulatory DNA for
the segmentation gene hunchback was shown to determine the Bicoid dose-response threshold for this
target gene (Driever et al., 1989; Struhl et al., 1989). The Bicoid binding sites found in hb are thought to
be relatively high-affinity sites, however. In this section, I discuss two examples of low-affinity binding
sites – for PHA-4 in C. elegans and Prep1 in the mouse – which support the idea that binding site affinity
is linked to dose-dependency of target genes on TFs (Gaudet and Mango, 2002; Rowan et al., 2010).
Relative affinity of C. elegans PHA-4 target gene binding sites regulates onset of gene expression
PHA-4, which encodes a Forkhead box-A homolog, specifies the identity of the C. elegans
pharynx – a neuromuscular organ that pumps food into the animal and initiates digestion. Pha4 is
required in all cells of the pharynx and directly activates most or all pharyngeal genes (Gaudet and
Mango, 2002). Although Pha-4 is required throughout pharyngeal development, its levels are lower
earlier than later (Horner et al., 1998; Gaudet and Mango, 2002).
Using a combination of microarray analysis and enhancer bashing, Gaudet and Mango identified
binding sites for eight PHA-4 target genes. All eight were a form of the consensus binding site for the rat
PHA-4 ortholog: TRTTKRY (where R=A/G; K=T/G; Y=T/C) (Overdier et al., 1994; Gaudet and Mango,
2002). However, the different target gene binding sites had different affinities for PHA-4. For example,
the ceh-22 binding site (TATTTGT) had a 4-fold lower affinity for PHA-4 than the previously identified
myo-2 binding site (TGTTTGC) (Kalb et al., 1998; Gaudet and Mango, 2002). Generating reporters

45
constructs that changed the PHA-4 binding site from a lower to a higher-affinity sequence accelerated
the onset of reporter expression by up to 3 hours; whereas mutating the PHA-4 binding site from a
higher to a lower-affinity sequence delayed reporter expression by up to 3 hours (Gaudet and Mango,
2002). Interestingly, the strength of reporter expression was unaffected at later stages; only the time of
reporter expression onset was altered (Gaudet and Mango, 2002).
Based on these data, PHA-4 target genes are thought to demonstrate temporally restricted
threshold responses such that genes required early in pharynx development (e.g., regulators) are
expressed before those required later in development (e.g., differentiation markers). It is proposed that
high-affinity sites bind PHA-4 in early embryos when PHA-4 levels are relatively low, whereas low-
affinity sites do not bind until later, until after PHA-4 levels increase (Gaudet and Mango, 2002).
A low-affinity binding site for Prep1 in a Pax6 enhancer confers dosage sensitive regulation
A more recent example indicates that the same principle described above in C. elegans is also at
work in more complex vertebrate enhancers. A low-affinity binding site in a Pax6 enhancer allows Pax6
to respond to varying levels of Prep1. Similar to the C. elegans example described above, this confers
precise temporal regulation during development: Pax6 is not activated early in development, when
Prep1 levels are low; only when Prep1 levels are elevated, later in development, is Pax6 activated.
Changing binding site affinity changes time of onset of a Pax6 reporter, but not the final expression
pattern or intensity.
Pax6 is a key regulator of metazoan eye development and has been shown to play a dose-
dependent role in this context. Prep1 is a homeobox and TALE domain containing transcription factor,
closely related to the vertebrate hth homologs (the Meis proteins). Prep1 directly activates Pax6 during
lens development via two low-affinity binding sites located 34bp apart from one another (Rowan et al.,
2010). Mutating these to high-affinity binding sites (as identified by protein-binding microarray) did not
affect the expression of a Pax6 reporter construct later in development; but earlier in development,

46
when Prep1 levels are lower (before E10.5), the high-affinity mutant construct was expressed at higher
levels. Thus, TF binding site affinity can regulate the temporal control of gene expression in vertebrates,
by providing sensitivity to TF levels. This sheds light on the molecular mechanisms that help gene
regulatory networks interpret TF levels.

47
CHAPTER 2
The Drosophila Hox gene Ubx autoregulates via a low-affinity binding site to alter its levels
along the proximal-distal axis of the developing haltere
All of the experiments carried out and described in this chapter were done by me. People who
provided tools and reagents have been thanked for their specific contributions at the end of this chapter.
This work has not yet been published, but we plan to submit it for publication within the next few
months.
ABSTRACT
Several transcription factors (TFs) are known to play concentration dependent roles in
development. The Drosophila melanogaster Hox gene Ultrabithorax (Ubx) is one such TF. Increases in
Ubx dose are inversely correlated with the size of the haltere – a dorsal appendage that helps the fly
balance during flight. We have previously shown that Ubx is capable of negatively autoregulating during
haltere development, presumably to keep its levels within a narrow and precise range in order to ensure
appropriate haltere sizes. Here, we find that Ubx negative autoregulation serves another, seemingly
opposing purpose, in the same tissue: it establishes different expression levels of Ubx along the
proximal-distal (P-D) axis of the developing haltere. Ubx works with its cofactors, Homothorax (Hth) and
Extradenticle (Exd) to dampen its own transcription proximally. Hth is absent and Exd is cytoplasmic and
non-functional in the distal disc; Ubx levels are therefore high in this region. We locate the cis-regulatory
element that confers this P-D expression bias to Ubx and find that it contains a non-canonical and low-
affinity Ubx/Exd/Hth binding site.
INTRODUCTION
It has long been known that the expression levels of transcription factors (TFs) vary spatially and
temporally during development, and that in several cases, such differences in levels can have functional
consequences. For example, mice or humans heterozygous for the homeodomain TF Pax6 display
developmental phenotypes including aniridia (absence of irises) and forebrain abnormalities (Sisodiya et

48
al., 2001). In the mouse, overexpressing Pax6 is associated with similar phenotypes (Schedl et al., 1996).
Mechanistically, two questions arise from such findings: First, how are different TF levels established?
Second, at the molecular level, how do different levels of the same TF elicit different target gene
responses?
We address the first of these two questions by studying the Drosophila melanogaster Hox gene
Ultrabithorax (Ubx), a TF whose expression levels vary spatially and temporally during development. In
the embryonic epidermis, although Ubx is expressed from parasegment (ps) 5 to ps13, its levels vary
between parasegments (Beachy et al., 1985; White and Wilcox, 1985). Ubx expression is highest in ps6,
lower in ps5, and gradually diminishes from ps7 through ps13 (Akam and Martinez-Arias, 1985; Beachy
et al., 1985; White and Wilcox, 1985). Ubx is downregulated in ps7 through 13 at the transcriptional
level by the action of the more posterior Hox proteins Abd-A and Abd-B (Struhl and Akam, 1985). The
functional relevance of this downregulation, however, remains unclear. Upregulation of Ubx in this
region is not associated with any observed abnormalities on larval cuticles (Mann and Hogness, 1990).
The levels of Ubx vary not only between embryonic parasegments, but also within individual
parasegments. Ubx levels are higher in the anterior compartments and lower in the posterior
compartments, in large part due to repression by engrailed (en) – a segmentation gene that is expressed
in all posterior compartment cells (Martinez-Arias and White, 1988; Mann, 1994; Castelli-Gair and Akam,
1995; Gebelein and Mann, 2007). Unlike the Ubx downregulation in PS7-13, the functional significance
of Ubx downregulation within parasegmental posterior compartments (at least in the case of PS6, where
Ubx is most strongly expressed) has been demonstrated. High levels of Ubx repress Distal-less (Dll), a TF
necessary to generate larval sensory structures called Keilin’s organs. Dll is repressed by high levels of
Ubx found in the anterior compartment (Mann, 1994). In the P compartment, Ubx levels are kept low by
en to prevent a similar Dll repression, which would impair Keilin’s organ generation (Mann, 1994).

49
In the larval stages, Ubx is expressed throughout the developing third (T3) leg and haltere
imaginal discs. In the T3 leg imaginal disc, Ubx levels are higher in the posterior relative to anterior
compartment, but do not show any other spatial bias (White and Wilcox, 1985). Later in development
(pupal and adult stages), however, Ubx displays a PD expression bias, with higher levels proximally and
lower levels distally (Stern, 1998). High Ubx levels in the proximal leg at this developmental stage are
required for the formation of a naked patch of cuticle (i.e. without non-sensory bristles called trichomes)
on the posterior T3 femur (Stern, 1998). Overexpressing Ubx along the length of the T3 leg during pupal
stages represses these trichomes across most of the adult T3 leg, indicating a functional relevance for
this difference in Ubx levels (Stern, 1998).
Ubx is perhaps best known for its role in the development of the haltere, a balloon shaped
dorsal appendage that is thought to have evolved from an ancestral hindwing and helps the fly balance
during flight (Carroll et al., 1995; Dickinson, 1999). Ubx is a master regulator for haltere development
and controls all of the differences between the wing and haltere. Genetic analyses have confirmed that
the presence of Ubx drives haltere fate, while its absence yields wing fate (Lewis, 1963, 1978, 1982;
Morata and Garcia-Bellido, 1976). Consistent with these functional analyses, Ubx is expressed in all cells
of the developing haltere but is almost entirely absent from the developing wing (White and Wilcox,
1984; Beachy et al., 1985). As in the embryo, however, Ubx levels are not uniform across the developing
haltere. Ubx levels are higher in the distal haltere disc, which forms the appendage proper (capitellum),
and lower in the proximal haltere disc (which forms the joint and a small portion of the dorsal body wall)
(Figure 2.1A, White and Wilcox, 1985). It is this difference in Ubx levels that we explore here. Within the
haltere pouch, Ubx levels are also higher in the posterior compartment than the anterior compartment.
Changing the dose of Ubx, using chromosomal aberrations containing duplications of the entire
gene, inversely affects haltere (capitellum) size in the adult (Smolik-Utlaut, 1990; Crickmore et al., 2009).
Notably, neither haltere (capitellum) size, nor Ubx levels (assayed by immunostains in the haltere pouch)

50
change in step with Ubx gene dose. Doubling Ubx copy number (form 2 to 4 copies; 100% increase)
decreases the size of the haltere capitellum by <20% and increases Ubx levels by ~40% (Crickmore et al.,
2009). This apparent buffering of Ubx levels and haltere size against Ubx gene dose is presumably due to
Ubx negative autoregulation, which is known to occur in the developing haltere and embryo (Irvine et
al., 1993; Garaulet et al., 2008; Crickmore et al., 2009). In other systems, negative autoregulation has
been demonstrated to confer precision to gene expression levels (Becskei and Serrano, 2000).
Consistent with this, it is thought that one function of Ubx negative autoregulation is to keep Ubx levels
within a narrow and appropriate range during haltere development, thus ensuring precise and
reproducible haltere sizes (Irvine et al., 1993; Crickmore et al., 2009).
A second function that has been proposed for Ubx negative autoregulation is to turn Ubx off in
the developing wing during larval development (Irvine et al., 1993; Garaulet et al., 2008). In stage 12
embryos, Ubx is expressed in the posterior compartment of the incipient wing disc; but later in
embryogenesis, by stage 16, this expression is lost (Garaulet et al., 2008). This repression of Ubx in the
developing wing, although known to be maintained by Polycomb group genes, is thought to be triggered
by Ubx itself (Irvine et al., 1993). Consistent with this idea, a reporter transgene containing 35kb of Ubx
regulatory DNA and the Ubx promoter, normally silent in the wing imaginal disc, is ectopically activated
in some posterior wing disc cells in Ubx mutant animals (Irvine et al., 1993). Although a plausible
function for Ubx negative autoregulation, this result is the only evidence to date that supports this
hypothesis.
Here, we describe another function for Ubx negative autoregulation. We show that Ubx
negatively autoregulates directly, aided by its cofactors Homothorax and Extradenticle, to establish
different Ubx levels in the proximal and distal haltere during development. Thus, Ubx employs the same
mechanism – negative autoregulation – to achieve two seemingly opposing purposes in the same
developmental context: maintaining precise levels within a region, and establishing distinct levels
51
between regions. These two functions are computed by different cis-regulatory elements at Ubx. We
locate the cis-regulatory element conferring the haltere P-D expression bias and characterize the
Ubx/Hth/Exd binding site. Interestingly, it is a low-affinity binding site that differs from the established
consensus sequence (Noyes et al., 2008; Slattery et al., 2011).
RESULTS
Ubx works with Hth and Exd to keep its levels low in the proximal haltere
In the third larval instar haltere imaginal disc, Ubx is expressed at higher levels in the distal
region (which forms the appendage proper in the adult) than the proximal region (which forms the joint
and part of the body wall) (Figure 2.1A). Quantifying pixel intensities from immunostainings indicates
that in the proximal haltere, Ubx is expressed at ~40% of its levels in the distal haltere.
Several enhancer traps in the Ubx locus, such as Ubx-lacZ166, recapitulate the difference in Ubx
expression levels along the PD axis of the haltere, indicating that it is set up at least in part at the
transcriptional level (Figure 2.1A and B). Knocking down Ubx levels in clones of cells in the proximal
haltere, using a Ubx-RNAi construct, elevates Ubx-lacZ166 to distal levels (Figure 2.1C). This indicates that
Ubx represses its own transcription in the proximal haltere, thereby establishing a PD expression bias.
While these results do not indicate whether this regulation is direct or indirect, they imply that the cis-
regulatory elements captured by the Ubx-lacZ166 enhancer trap compute this regulation.
What restricts Ubx negative autoregulation to the proximal haltere? One possibility is that in
order to negatively autoregulate effectively, Ubx must work with homothorax (hth) and extradenticle
(exd), well-established Hox cofactors. Hth is present in the proximal but not distal haltere. In other
words, Hth expression in the haltere is correlated with low Ubx levels (Figure 2.2A). To test if Hth
represses Ubx transcription in the proximal haltere, we generated hthP2 mutant clones and stained these
52
discs for Ubx protein. We find that Ubx levels are elevated in hthP2 mutant clones, indicating that Hth
does in fact downregulate Ubx in the proximal haltere.
hth is alternatively spliced to encode three known isoforms: a full length isoform that contains
the homeodomain (HthFL) and two homeodomain-less (HD-less) isoforms (Noro et al. 2006). Although
the Hth HD is required for other functions, such as proper antennal development, the HD-less isoforms
are able to bind Exd and Hox proteins and are sufficient for several Hth functions, such as forming a
correct PD axis in ventral appendages (Noro et al. 2006). To test if the Hth HD is required for Ubx
negative autoregulation we generated clones of the hth100-1 allele, which only produces the HD-less
isoforms of Hth (Noro et al., 2006). Ubx is not upregulated in these clones, indicating that the HD-less
isoforms of Hth are sufficient, and the Hth HD is dispensable, for Ubx negative autoregulation in the
proximal haltere (Figure 2.2C).
Given the involvement of hth, we tested the role of exd – an obligate binding partner of Hth. Hth
interacts directly with Exd and is required to translocate Exd from the cytoplasm to the nucleus
(Rieckhof et al., 1997). In the distal haltere disc, where Hth is absent, Exd is cytoplasmic and seemingly
non-functional. To test if Exd works with Hth and Ubx to repress Ubx transcription in the proximal
haltere, we generated mitotic clones that are mutant for exd. We find that Ubx is upregulated in clones
of cells mutant for each of two different null mutants - exd1 or exd2 (Figure 2.2D and E). This result is at
odds with a previous report showing that Ubx protein is lost in exd2 mutant clones in haltere imaginal
discs, which would imply that exd positively regulates Ubx in these cells (Azpiazu and Morata 1998). Due
to this conflict, we examined Ubx expression in clones of haltere disc cells expressing exd-RNAi. In these
clones too, we find that Ubx is upregulated (Figure 2.8). Thus, two exd null mutant alleles as well as the
exd-RNAi knock-down all indicate that Ubx is upregulated in the absence of Exd. Furthermore, because
Exd is cytoplasmic and non-functional in the absence of Hth, the fact that Ubx is upregulated in hth

53
mutant clones provides additional evidence that exd does not positively regulate Ubx, but rather
represses Ubx.
The model that emerges from these genetic data is that Ubx works with its cofactors, Exd and
Hth, to downregulate its own transcription in the proximal haltere. In the distal haltere, where hth is
absent and exd is cytoplasmic and non-functional, Ubx is unable to dampen its own expression, and is
therefore expressed at high levels.
Ubx does not repress hth in the developing haltere
Given that (1) the Hth expression pattern in the haltere is complementary to that of Ubx and (2)
hth represses Ubx, we explored the possibility of mutual repression between these two genes. To test if
high levels of Ubx repress hth in the distal haltere, we examined Hth expression in Ubx mutant clones.
We tested two different null alleles of Ubx (Ubx9-22 and Ubx1) and found Hth expression to be unaffected
in both cases (Figure 2.2F and 2.7). Hth was not ectopically activated in Ubx mutant clones in the distal
haltere and no change in Hth levels was seen in Ubx mutant clones in the proximal haltere. This stands
in contrast to recently published data showing that Hth protein is lost in Ubx1 mutant clones in the
proximal haltere (Agrawal et al 2011). Due to this contradiction we confirmed our result by staining for
Exd protein in Ubx mutant clones. Hth is required for Exd’s translocation into the nucleus, thus the sub-
cellular localization of Exd serves as a readout of Hth function. Exd should be cytoplasmic if Hth is in fact
lost in Ubx mutant clones (Rieckhof et al., 1997). We find this not to be the case: Exd levels and
localization are unchanged in Ubx mutant clones in the proximal haltere, consistent with our finding that
Ubx does not regulate hth in the proximal haltere (Figure 2.2G).
A Ubx negative autoregulatory enhancer
Ubx negative autoregulation in the haltere imaginal disc has previously been reported and a
35kb cis-regulatory region of Ubx (35UZ), cloned into a transgenic reporter construct, captures this

54
regulation (Irvine et al., 1990; Irvine et al., 1993). However, 35UZ does not recapitulate the PD
expression bias of Ubx, and we find that it is not upregulated in clones of cells in which Ubx levels have
been knocked down using RNAi (data not shown). This suggests that Ubx negative autoregulation is
mediated through different Ubx cis-regulatory elements.
To find the cis-regulatory element that confers the Ubx PD expression bias, we examined the
genome-wide binding profile of Ubx in the haltere imaginal disc, as determined by ChIP-chip (Slattery et
al. 2011). According to these data, the Ubx protein binds the Ubx locus in haltere imaginal disc cells at
two separate locations, both within the large third intron of Ubx. One of the peaks (1.3kb) lies within the
genetically defined abx regulatory element of Ubx, known to be required for proper Ubx expression in
ps5 (Simon et al., 1990). Furthermore, a previously cloned 9kb abx enhancer construct that contains the
entire ChIP peak is reported to have imaginal disc expression (Simon et al. 1990).
We created a transgenic lacZ reporter with the 1359bp of Ubx regulatory DNA comprising the
Ubx ChIP binding peak. This reporter construct, abxF-lacZ, is expressed throughout the haltere imaginal
disc and recapitulates the PD expression bias of Ubx (Figure 2.3A, B). abxF-lacZ is also expressed in the
wing, even though Ubx not expressed there (Figure 2.3A). This is presumably because abxF lacks a
Polycomb Response Element (PRE). Notably, reporter constructs that combine abxF with a PRE and a
Ubx embryonic enhancer are repressed in much of the wing while retaining the PD expression bias in the
haltere (Figure 2.6). Given that the wing and haltere are serially homologous organs, the wing can be
thought of as a haltere that lacks Ubx. Therefore, the fact that abxF-lacZ is expressed throughout the
wing disc at uniform levels corroborates the idea that the Ubx expression bias along the haltere PD axis
is generated by Ubx itself.
Similar to the endogenous locus, the abxF-lacZ enhancer is upregulated in clones of cells that
are mutant for Ubx, hth or exd (Figure 2.3C, D and E). This confirms that the abxF element captures the
transcriptional inputs of these three genes. Notably, the levels of abxF-lacZ are also slightly upregulated
55
in the haltere pouch, indicating that Ubx is capable of repressing abxF without Exd and Hth, although
less effectively (Figure 2.3C). We observed a similar mild upregulation in the distal haltere with the
enhancer trap Ubx-lacZ166 (data not shown). The levels of abxF-lacZ are unaffected in hth100-1 mutant
clones indicating that, as with the native Ubx locus, the Hth HD is not required for downregulation
(Figure 2.3F). Clones of cells that overexpress Ubx in the wing or the haltere silence abxF-lacZ strongly
and, in most cases, completely (Figure 2.3G). These results demonstrate that the Ubx autoregulatory
element is a concentration-sensitive target of Ubx. Low levels of Ubx, as are normally found in the
proximal haltere, dampen Ubx transcription while high levels of Ubx completely silence the enhancer.
A Ubx autoregulatory binding site
Given that the abxF enhancer recapitulates the Ubx expression bias along the haltere disc PD
axis, and that ChIP-chip results indicate that Ubx is bound at this location, we attempted to identify a
Ubx binding site in abxF (Figure 2.1A, 2.3A; Slattery et al., 2011). As a first step, we cloned smaller pieces
of the 1.3kb abxF enhancer element and identified a 539bp minimal autoregulatory enhancer, abxN,
which recapitulates the expression pattern of the larger fragment (Figure 2.3A and 2.4A, top left panel).
Truncating 112 highly conserved base pairs from the 5’ end of abxN kills reporter construct expression,
indicating that this region contains essential inputs. We mutated four putative Hox/Exd sites this 112bp
region. Mutations in three putative sites (TGAA, ATTTA, and AATTTATTTATTTATATA) in the context of
abxN-lacZ did not alter reporter expression (data not shown). But mutating a fourth site, ATATTTTATA,
greatly diminishes the PD expression bias of abxN-lacZ; we call this mutation Nm8R (Figure 2.4A, D).
Quantifying Nm8R-lacZ expression in the proximal and distal haltere, by measuring pixel intensities from
immunostains, reveals that the P-D expression bias in abxN-lacZ is mostly eliminated (Figure 2.4E, F).
Analyzing Nm8R-lacZ expression in Ubx mutant clones confirms that this mutant fails to capture Ubx
mediated repression (Figure 2.4A, bottom row).

56
We also performed chromatin immunoprecipitation (ChIP) to determine the effect of the Nm8R
mutation on Ubx binding in vivo. Chromatin was isolated from L3 haltere imaginal discs of two
genotypes: animals containing the wild type transgene (abxN-lacZ) and animals containing the mutant
transgene (abxN-m8R-lacZ). After performing an IP with an antibody against Ubx, we did qPCR using
primers that specifically amplified the endogenous Ubx enhancer or the transgenic enhancer. The ChIP
results confirm that Ubx is not bound to the transgenic mutant construct (abxN-m8R-lacZ) but is bound
to the wild type transgenic construct (abxN-lacZ). In both genotypes, Ubx is bound to the autoregulatory
enhancer at the endogenous Ubx locus, as expected based on previous ChIP-chip findings (Figure 2.4B).
The binding site we have identified here (ATATTTTATA, which we call “UbxAE”) is quite different
from the consensus Ubx/Exd/HthHM binding site that was established by SELEX-seq experiments (“Red”:
TGATTTAT) (Slattery et al., 2011). The UbxAE 10mer is present in five different 12-mers bound by
UbxIVa/Exd/HthHM, with relative affinities ranging from 0.04 (TCATATTTTATA) to 0.02 (AATATTTTATAT).
The highest affinity site overall for UbxIVa/Exd/HthHM, ATGATTTATTAC, has a relative affinity of 0.91.
Notably, no 12-mers containing the same flanking nucleotides found in our enhancer region were found
to be bound in the SELEX experiments. The ATATTTTATA 10mer is not found in any of the 12-mers
bound by UbxIa/Exd/HthHM (Slattery et al., 2011).
Given that our binding site is not represented at high affinity among the SELEX-seq determined
binding sites, we performed a series of in vitro electrophoretic mobility shift assays (EMSAs) for further
characterization. Binding at the wild-type sequence is cooperative in vitro; neither Ubx nor Exd/HthHM
can bind the site in the absence of the other (Figure 2.4B). Furthermore, the Ubx/Exd/HthHM trimer is
unable to bind the Nm8R probe, indicating that the mutation that abrogates in vivo regulation and
binding also eliminates in vitro binding (Figure 2.4B). Running EMSAs using probes with more precise
mutations in the binding site reveals that, with the exception of the last two base pairs in this sequence,
mutating any pair of nucleotides completely eliminates trimer binding in vitro (Figure 2.5A and B, m7).
57
Mutating the last two 3’ base pairs does have an effect on binding, but weakens rather than eliminates
trimer formation (Figure 2.5A and B; m7).
Most identified Ubx/Exd/Hth binding sites have an Exd-half site that is closely related to the
consensus Exd binding site: either TGAT or TGAC. The UbxAE binding site we identify here lacks an
obvious Exd-half site. Yet, we know that Exd is required for binding in vitro because there is no binding
on the wild-type probe in the Ubx only lane. To test the possibility that Exd aids trimer binding in a way
that does not involve its ability to bind DNA in a sequence specific manner, we assayed in vitro binding
with an Exd-N51A mutant. All homeodomains (HDs) contain an Asparagine residue at position 51 and
this residue is considered an important determinant of HD binding specificity (Ades and Sauer, 1995). A
crystal structure of a Ubx-Exd-DNA complex shows that Asn51 of the Exd HD makes a contact with the
DNA major groove, specifically at the A in TGAT (Passner et al., 1999). In our EMSAs, Exd-N51A reduces
trimer binding at the UbxAE probe relative to wild type protein binding (Figure 2.5D, E). A similar
reduction was seen at the consensus binding site, Red, where Exd is known to bind the DNA directly
(Figure 2.5D,E). This is consistent with the Ubx/Exd/Hth trimer binding DNA in a similar manner for both
sequences.
UbxAE is ~10-fold weaker than the consensus Ubx/Exd/HthHM binding site
Given the non-canonical nature of the UbxAE binding site, as well as its low relative-affinity in
SELEX-seq tables, we sought to characterize its strength relative to the consensus Ubx/Exd/HthHM site,
“Red” (Slattery et al., 2011). We performed competition EMSAs, in which the binding of Ubx/Exd/HthHM
to radioactively-labeled Red probe was assayed in response to increasing concentrations of unlabeled
competitor probe. To reduce Ubx/Exd/HthHM binding to labeled-Red by 50% required ~10-fold more
unlabeled competitor when UbxAE was used as the cold competitor probe than when Red was used as
the competitor probe (Figure 2.5C). Thus, the UbxAE has slightly more than a 10-fold weaker binding
affinity for Ubx/Exd/HthHM than the consensus sequence, Red (Figure 2.5C).
58
To test if the low-affinity nature of this binding site conferred some specific function, we
engineered mutant forms of both the minimal enhancer, abxN, and the larger fragment, abxF, that
contained the high-affinity binding site (Red) instead of the endogenous binding site (UbxAE) (Figure
2.9). Neither mutant construct displays any difference in expression pattern relative to their wild type
forms in third instar imaginal discs (Figure 2.9).
Biological relevance of low Ubx levels in the proximal haltere disc
We have shown that Ubx negative autoregulation lowers Ubx levels in the proximal haltere disc.
To identify a biological purpose for low Ubx levels in the proximal haltere imaginal disc, we devised an
assay to generate distal-like Ubx levels in the dorsal proximal haltere (Figure 2.11 and 2.12). Driving
UAS-Ubx with apterous-Gal4 in a temporally defined manner (using Gal80ts) we deliver a 12 hour pulse
of Ubx expression immediately before dissection (as wandering L3 larvae). This drives distal haltere-like
Ubx levels across the dorsal compartments of the haltere and wing (Figure 2.12). We know that these
experimental conditions are sufficient to observe changes in Ubx target gene expression because dorsal
wing disc expression of Spalt (Sal) and achaete (Ac), both of which are known Ubx targets, is changed to
a haltere-like pattern (Figure 2.11 and 2.12). However, for the battery of genes that we tested (Hth, Tsh,
Dll, Sal, Ac), we do not see changes in haltere imaginal disc expression that would indicate differential
regulation by low (proximal-like) versus high (distal-like) Ubx levels. Dll, Sal, and Ac, are all differentially
expressed between the wing and haltere and either presumed or confirmed Ubx target genes in this
context (Weatherbee et al., 1998; Slattery et al., 2011). Sal is a Zn finger TF that is expressed in the
dorsal proximal region of the wing and haltere discs; genetically, it controls the development of the wing
hinge and notum (Grieder et al., 2009). achaete is one of four genes of the achaete-scute (AS-C) gene
complex. These are bHLH TFs that drive epidermal cells toward neural fate; their functions include
promoting the formation of sensory organs (bristles) in the adult (Skeath and Carroll, 1991; Garcia-

59
Bellido and de Celis, 2009). Thus, the biological purpose of a mechanism to keep Ubx levels low in the
developing proximal haltere remains an open question.
DISCUSSION
Starting with studies on the lambda repressor, which was among the first TFs to be
characterized, changes in TF levels were known to have functional consequences (Jacob and Monod,
1961). Numerous examples in multiple systems – from bacteria to humans – have confirmed this idea.
This is known to be true for the Drosophila Hox gene Ubx, whose levels vary spatially and temporally
during development (Beachy et al., 1985; White and Wilcox, 1985). Certain differences in Ubx levels in
the embryo, leg, and haltere are associated with functional consequences (White and Wilcox, 1985;
Smolik-Utlaut, 1990; Mann, 1994; Stern, 1998). In the leg, high levels of Ubx in the proximal region are
required during pupal development to generate a patch of naked cuticle in the adult femur (Stern,
1998). In the embryo, Ubx levels are kept low in the anterior compartment of ps6 for the first 7 hours of
embryonic development to ensure that Dll is not repressed and Keilin’s organs develop properly (Mann,
1994; Castelli-Gair and Akam, 1995). Ubx levels are kept low here by a genetic circuit involving
repression by engrailed and abd-A and upregulation by sloppy-paired (Gebelein and Mann, 2007). In the
haltere, artificially induced changes in Ubx gene dose are known to correlate inversely with haltere size
(Smolik-Utlaut, 1990; Crickmore et al., 2009). Here, we describe the mechanism that establishes the
difference in Ubx levels along the P-D axis of the developing haltere.
Establishing a PD bias of Ubx levels in the haltere is a functionally and mechanistically new
form of Ubx negative autoregulation
Although Ubx negative autoregulation has been previously reported, it was studied in response
to elevating Ubx levels beyond their naturally occurring range. Overexpressing Ubx led to permanent
and heritable transcriptional silencing of the endogenous Ubx locus in the embryo as well as imaginal
60
discs (Irvine et al., 1993; Garaulet et al., 2008; Crickmore et al., 2009). Two functions were proposed for
Ubx negative autoregulation. (1) To serve as a buffer to protect phenotypes (specifically, haltere size)
from environmental or genetic noise (Crickmore et al., 2009). (2) To silence Ubx in the wing, where it is
transiently expressed early during development (Irvine et al., 1993; Garaulet et al., 2008). Furthermore,
a cloned 35kb enhancer fragment was shown to respond to the artificially high Ubx levels used in these
studies.
We find that direct Ubx negative autoregulation establishes two distinct Ubx levels in the
proximal and distal region of the developing haltere. In the proximal region, Ubx works with its cofactors
Hth and Exd to downregulate its expression. Distally, where Hth is absent and Exd is cytoplasmic, Ubx is
unable to downregulate its levels to the same extent. Thus, it seems that Ubx negative autoregulation
plays seemingly opposing roles in the same developmental context: to ensure precise and invariant Ubx
expression levels in the developing haltere; and to establish different Ubx expression levels in distinct
spatial domains within the developing haltere.
The phenomenon we describe here is functionally and mechanistically distinct from previously
described modes of Ubx negative autoregulation in the following ways: (1) This form of Ubx negative
autoregulation serves a previously unknown function: establishing different Ubx levels in the proximal
and distal haltere during development. (2) We demonstrate that this downregulation is directly
mediated by Ubx through an enhancer that does not overlap with the 35kb fragment previously shown
to respond to Ubx overexpression (Irvine et al., 1990; Irvine et al., 1993). (3) This form of negative
autoregulation requires the Hox cofactors Exd and Hth, and therefore is spatially restricted to the
proximal domain of the haltere.
Low-affinity binding sites in vitro are functional in vivo
Gene regulation by Hox proteins is often thought of as a two-step process, with the first step
being target sequence recognition and binding by the Hox protein and its cofactors and the second step

61
being recruitment of co-activator/co-repressor proteins that regulate the target gene activity (Mann et
al., 2009). It has been assumed that while target DNA selection is dictated by the Hox gene and its
cofactors, the sign of regulation is determined by the collaborating proteins recruited at the second
step. In this paradigm, what is the in vivo consequence – if any – of low versus high TF binding site
affinity?
Low-affinity binding sites are thought to be widespread in gene regulatory networks (Segal et
al., 2008; Tanay, 2006). At least two cases have been well characterized. A Prep1 binding site in a
regulatory element of the mouse Pax6 gene is six to seven times weaker than the Prep1 consensus
binding site, as identified in protein binding microarrays (Rowan et al., 2010). A PHA-4 binding site in the
C. elegans gene ceh-22 is four times weaker than the PHA-4 binding site at the myo-2 locus, which also
happens to be the PHA-4 consensus binding sequence (Gaudet and Mango, 2002). Consistent with our
work on the Ubx negative autoregulatory element, both of these studies found that replacing the native
low-affinity sites with high-affinity consensus sites did not affect the intensity or spatial expression
pattern of reporter constructs (Gaudet and Mango, 2002; Rowan et al., 2010). They did, however, notice
an earlier onset of expression with the high-affinity binding sites. They postulate that the high-affinity
sites make their reporters more sensitive to lower concentrations of the TFs, which are found earlier in
development in these two cases.
In the case of the Ubx autoregulatory enhancer, the purpose of the low-affinity binding site
remains unclear. It is possible that, like in the case of Pax6 and ceh-22, this low-affinity site confers less
sensitivity to lower levels of Ubx. Another possibility is that the low in vitro affinity is not reflective of the
situation in vivo. This may be due to chromatin architecture, or the presence and function of additional,
as yet unidentified, factors that work with Ubx/Exd/Hth at the Ubx autoregulatory element. One
important caveat to our finding that Ubx negative autoregulation acts through a low-affinity binding site
is that there may be other enhancers with other binding sites that contribute to this bias in Ubx levels

62
along the P-D axis of the haltere disc. Within the minimal abxN element, however, it seems clear that
the site we have identified is the sole Ubx/Exd/HthHM binding site because i) we scanned the entire
element using EMSA probes and found no other sequences within abxN that bound these proteins and
ii) the Nm8R mutant construct is no longer upregulated in clones of cells mutant for Ubx in the proximal
haltere disc.
MATERIALS AND METHODS
Fly Strains and genetic manipulations: Ubx-lacZ166 is from Welcome Bender and is described in Bender
and Hudson, 2000. UAS-UbxRNAi was created by Myungin Baek using these primer sets: UbxF-NheI-
GATCGCTAGCAACTCGTACTTTGAACAGGCC; Ubx-F-AvrII–GATCCCTAGGAACTCGTACTTTGAACAGGCC;Ubx-R-XbaI–
GATCTCTAGAGCTGACACTCACATTACCGC; Ubx-R-EcoRI–GATCGAATTCGCTGACACTCACATTACCGC. UAS-exdRNAi
was obtained from the Vienna stock center (VDRC). Flip-out clones were generated by
crossing act<y<Gal4, UAS-GFP to different hs-flp;UAS lines and heat-shocking larvae for between 8 to 10
min at 37°C. The FRT18D exd2 fly line was requested from Natalia Azpiazu. Other fly strains used include
ywhs-flp122; FRT 82BhthP2 /TM6B and ywhs-flp122; FRT 82B hth100-1, described in Noro and Mann, 2006.
ywhs-flp122; FRT82B Ubx9-22/TM6B and ywhs-flp122; FRT82B Ubx1/TM6B were used to generate Ubx
mutant clones. All mitotic clones were generated by heat shocking for 1hr at 37°C. Ubx overexpression
analysis in Figure 2.11 was done crossing ap-Gal4;Gal80ts flies to UAS-UbxIa;Gal80ts flies and growing the
progeny at 18°C. Flies were the shifted to 29°C for the 12 hrs immediately before dissection at the L3
wandering stage.
Reporter constructs: All lacZ reporter constructs were generated by cloning the regulatory DNA into
pRVV54-lacZ using the NotI and HindIII restriction enzyme sites. Peaks of conservation were determined
using the UCSC genome browser. The coordinates of abxF are chr3R:12512279..12513637 and the
coordinates of abxN are chr3R:12513101..12513637. The PRE reporter constructs were cloned into
pRVV75-Gal4. To generate the abx6.8+abxPRE or bxdPRE construct, abx6.8 was inserted using NotI and

63
HindIII; abxPRE or bxdPRE was inserted using NheI and HindIII. To generate abxF+abxPRE+pbxSB, abxF
was inserted using NotI and HindIII; abxPRE was inserted using NheI and HindIII; and pbxSB was inserted
using NheI and NsiI. The coordinates of pbxSB are chr3R:12598960..12599583; abxPRE are
3R:12528131..12529406 and bxdPRE are chr3R:12590509..12589356. All sequence coordinates are from
the Apr. 2006 BDGP R5/dm3 sequence assembly. All lacZ reporter constructs were inserted into the
attP40 landing site. The Gal-4 PRE reporter constructs were inserted into the 86Fa landing site. Site
directed mutagenesis was done using the QuikChange II Site-directed mutagenesis kit. Mutagenesis PCR
was done in the backbone of the pcr8/GW/TOPO-TA vector (Invitrogen); mutant constructs were then
cloned into pRVV54 using NotI and HindIII sites, generated by PCR. The following mutagenesis primers
were used to generate Nm8R from the abxF-pcr8/GW/TOPO-TA vector:
atttatttatttatataaggcgaatCCCCttCCCCacccggagcaaatgcagccagcac and
gtgctggctgcatttgctccgggtGGGGaaGGGGattcgccttatataaataaataaat.
Antibodies and Immunostaining: Mouse anti-Ubx (1:10, FP3.38 from DSHB, White and Wilcox, 1985).
Rabbit anti-b-gal (1:5000, Cappell). Rabbit anti-sal (1:500; from Tiffany Cook), guinea-pig anti-Dll
(1:3,000, Estella et al., 2008), guinea-pig anti HthHD (1:500, Noro and Mann, 2006) and guinea-pig anti-
Hth (1:5,000; Ryoo and Mann, 1999). Guinea-pig anti-Tsh (from G. Struhl), rabbit andi-Exd (Mann and
Abu-Shaar, 1996), and mouse anti-achaete (1:2, DSHB, Skeath and Carroll, 1991). Secondary antibodies
used were Alexa-Fluor488 (1:1,000), AlexaFluor555 (1:1,000), and AlexaFluor647 (1:500) conjugates
from Molecular Probes. Imaginal discs were mounted in Vectashield and imaged on a Leica SP5 confocal
microscope.
Chromatin Immunoprecipitation: Wandering third-instar larvae from the two different genotypes (abxN
and abxNm8R) were dissected and haltere imaginal discs were collected in PBS on ice. Discs were fixed
with 1.8% formaldehyde, crosslinked chromatin was sonicated, and chromatin preparation and
immunoprecipitation was performed as described in Estella et al., 2008. The IP was done with rabbit

64
anti-Ubx (Ubx1, generated by modENCODE,http://intermine.modencode.org/release-2
2/portal.do?class=Antibody&externalids=UBX1) at a final concentration of 1.5 µg/ml for each IP. Rabbit
IgG (Sigma) was used for the control IP. The following primer pairs were used for qPCR: Endogenous
abxF: TGGAGCTCCAAATGAAACGC and CGCTCAACATTGTTAGTGGC; transgenic enhancer (abxN or
abxNm8R): CAGTGCTGGCTGCATTTGCT and ACAACTGATGCTCTCAGCCA; intergenic control:
CCGAACATGAGAGATGGAAAA and AAAGTGCCGACAATGCAGTTA. qPCR was done on an Applied
Biosystems 7300 machine and calculations were done using the 2-ddCt method in MS Excel. IPs were
done in triplicate.
Protein purification and Electrophoretic Mobility Shift Assays (EMSAs): Ubx proteins were His-tagged and
purified from Escherichia coli (BL21 or BL21pLysS; Agilent) after 2 h (UbxIVa) or 4 h (UbxIa and Exd-
HthHM) of induction with isopropyl-β-D-thiogalactopyranoside using Co-chromatography (Xie et al.,
2007). The Exd-N51A mutant construct is from B. Gebelein. Exd-HthHM was coexpressed and purified
from E. coli and used for all the EMSAs. Protein concentrations were determined by the Bradford assay
and then confirmed by SDS/PAGE and Blue Coomassie analysis (SimplyBlue SafeStain; Invitrogen).
EMSAs were carried out as previously described (Xie et al., 2007). For the EMSA in Figure 2.4, UbxIa was
used at 250ng/lane (high conc) and 200ng/lane (low conc) and Exd/HthHM was used at 150g/lane. For
the EMSAs in Figure 2.5A, UbxIVa was used at 60ng/lane (high conc) and 45ng/lane (low conc). For the
competition EMSAs, UbxIa was used at 60ng/lane and Exd/HthHM was used at 60ng/lane. For the
ExdN51A EMSAs, UbxIVa was used at 45ng/lane (low) and 60ng/lane (high) and Exd/HthHM was used at
150ng/lane.
The DNA probe for Red was: CCTCGTCCCACAGCTcgaatgatttatgacc (uppercase is the “linker” sequence).
The reverse complement of the upper case sequence was ordered separately and radio-labeled before
performing a Klenow reaction to generate double stranded, labeled probe. Other probes were prepared

65
similarly; the probe for UbxAE WT is: CCTCGTCCCACAGCTcgaatatattttataacccggagcaaatgcagcca. Mutant
probes were identical to this except for the nucleotide changes drawn in Figure 2.4 and 2.5.
For the competition-EMSAs, DNA probes were first annealed and then purified (using the Qiagen
MinElute kit). OD was measured using a nanodrop and concentrations were then equalized across the
different probe sets. “Red” was then labeled, and both of the unlabeled “cold competitor” probes were
diluted appropriately. The following sequences, and their reverse complements, were used as DNA
probes. Red: CAAACCCAGTTCAGAGcgaATGATTTATgaccGGTCAAGGTCGTTTCC and UbxAE:
CAAACCCAGTTCAGAGcgaatATATTTTATAaccGGTCAAGGTCGTTTCC. A control EMSA was done to ensure
that no binding was due to the flanking sequences; Control probe:
CAAACCCAGTTCAGAGcgaaCCCCCCCCgaccGGTCAAGGTCGTTTCC. The competition EMSAs were done in
triplicate. DNA binding was calculated using phosphoimaging as detected by a Typhoon (Amersham) and
quantified by Image-Quant (Amersham). Quantifications were done in Adobe Photoshop CS3 and graphs
were generated in MS Excel. IC-50 calculations were doe in GraphPad Prism.

66
FIGURES
Figure 2.1: Ubx expression bias along the haltere PD axis is established at the transcriptional level,
by Ubx negative autoregulation. (A) A third larval instar haltere imaginal disc stained for Ubx protein.
(B) The Ubx-lacZ166 enhancer trap partially recapitulates the Ubx expression pattern, including the PD
expression bias. (C) Ubx-lacZ166 is upregulated to distal-like levels in proximal cells in which Ubx levels
have been knocked down via RNAi.

67
Figure 2.2: Hth and Exd repress Ubx in the proximal haltere. (A) A wild type L3 haltere imaginal disc
stained for Ubx and hth. Hth expression correlates with low Ubx levels. (B) Ubx protein levels are
elevated in mitotic clones of hthP2 in the proximal haltere. (C) Ubx protein levels are unaffected in
mitotic clones of the hth100-1 allele, indicating that the Hth homeodomain is not required to repress Ubx
in the proximal haltere. (D and E) Ubx protein levels are elevated in clones of the exd1 or exd2 null
mutants. (F and G) Neither hth nor exd protein levels change in mitotic clones mutant for Ubx.

68
Figure 2.3: The Ubx negative autoregulatory enhancer. (A) A schematic indicating the approximate
location of the autoregulatory enhancers, abxF and abxN. Conservation, from the UCSC genome
browser, is also shown. Black regions are conserved within 12 Drosophila species, mosquito, honeybee
and beetle. (B) abxF-lacZ is expressed in imaginal discs, and recapitulates the Ubx PD expression bias in
the haltere. (C,D, and E) abxF-lacZ levels are elevated in Ubx mutant clones (C), hth mutant clones (D)
and exd mutant clones (E). abxF-lacZ is unaffected in hth100-1 mutant clones (F). abxF-lacZ is strongly
repressed, and in most cases completely silenced, in Ubx overexpression clones (G).

69
Figure 2.4: Identification of the Ubx binding site. (A) Top row, left to right: Wild type expression of the
minimal autoregulatory element, abxN-lacZ; abxN-lacZ in Ubx mutant clones. Bottom row, left to right: expression
pattern of mutant abxN-m8R-lacZ construct in WT discs and discs with Ubx mutant clones. (B) ChIP-qPCR data
showing Ubx binding at chromatin isolated from haltere imaginal discs containing the abxN (top chart) or abxN-
m8R (bottom chart) transgenic reporters. Ubx and IgG control binding are shown at the abxF region of the native
locus, “Endogenous enhancer”; the abxN transgenic reporter, “abxN transgene”; and an intergenic control region.
(C) EMSA showing co-operative binding of Ubx/Exd/HthHM
trimer at the wild type but not Nm8R mutant binding
site. (D) Schematic indicating approximate binding site location; WT and Nm8R sequences. Same mutation used in
in vivo and in vitro experiments. (E) Ratio of proximal to distal expression of Ubx protein and several reporter
constructs. (F) Schematic indicating where “proximal” and “distal” expression levels were measured in discs.

70
Figure 2.5: In vitro characterization of the Ubx negative autoregulatory binding site. (A) EMSAs
comparing Ubx/Exd/HthHM binding at wild type and mutant probes for the autoregulatory site. (B)
Mutant probes sequences. (C) Quantified results from 3 trials of a competition EMSA; radiolabeled
“Red” probe (the consensus Ubx/Exd/HthHM binding site) was competed with varying amounts of
unlabeled competitor. Red line plots labeled Red competed with unlabaled Red. Green line plots labeled
Red competed with unlabaled Ubx-AE. Error bars represent standard error of the mean. (E) EMSAs
comparing trimer binding with a wild type and mutant (N51A) form of Exd at the consensus (Red) and
autoregulatory (UbxAE) binding site. These experiments were done in triplicate and the quantified
results are plotted in (D). Error bars represent standard error of the mean.

71
Figure 2.6: Combining abxF with PREs and Ubx embryonic enhancers partially eliminates wing
expression while preserving the P-D expression bias in the haltere disc. (A) Schematic showing
approximate locations of abxF, the abxPRE, the bxdPRE, and the pbxSB embryonic enhancer. (B) Haltere
and wing expression of “PRE1” - a construct linking a 6.8kb region that encompasses abxF but also
contains embryonic enhancer elements, linked to the abxPRE. (C) Haltere and wing expression of “PRE2”
– the same as PRE1 except with a different PRE, the bxdPRE. (D) Haltere (top) and wing (bottom)
expression of “PRE3” – a construct linking abxF with the abxPRE and the pbxSB embryonic enhancer.
Figure 2.7: Ubx1 mutant clones. Ubx1 mutant tissue (marked by the absence of GFP) is stained for Hth.
No change in Hth expression is seen in its expression domain in the proximal haltere, and no ectopic Hth
activation is seen in the haltere pouch. This confirms the result in Figure 2.2 indicating that Hth
expression is not lost in clones mutant for another null allele, Ubx9-22.

72
Figure 2.8: exdRNAi clones. Knocking down Exd levels in flipout clones expressing an exdRNAi
construct as well as Dicer2 (to boost RNAi effectiveness) upregulates Ubx protein. This confirms the
results in Figure 2.2D and E (which used exd null mutant clones) and provides further evidence that Ubx
expression is upregulated (and not lost, as reported by Azpiazu and Morata, 1998) in the absence of Exd.

73
Figure 2.9: Mutating the low affinity UbxAE site to a high-affinity consensus site. Creating reporter
transgenes in which the UbxAE binding site has been replaced with “Red”, the highest-affinity site from
SELEX-seq results, (C) does not affect the haltere imaginal disc expression pattern when in the context of
the 1359bp abxF-lacZ (A and D) element or the minimal 536bp abxN-lacZ element (B and E). The
orientation of the high-affinity binding site (TGATTTAT) was chosen based on the mutational analysis of
the UbxAE binding site (Figure 2.5A and B). Because the last two nucleotides only weakened
Ubx/Exd/HthHM binding, without eliminating it, we hypothesized that this would be a better location for
the Exd-half site (TGAT).

74
Figure 2.10: Controls for EMSAs (A) Control EMSA indicating that the ExdN51A mutant protein is unable
to bind DNA in a sequence specific manner as a dimer with HthHM. All three lanes use the same probe: a
consensus Exd-Exd binding site that was also used in Slattery et al., 2011. The exact sequence is: 5’-
GCTATACTGTGCTATCCACAGTTCAGAGTCGTTGACATGTTTGACATGCTGGTCACTGGTCGTTTCCCTCTT. The
Exd binding sites (two copies of TGAC) are in red. The first lane in the EMSA contains probe only (no
proteins); second lane contains wild type Exd/HthHM; third lane contains ExdN51A/HthHM. (B) Control
EMSA demonstrating that the flanks for the probes used for the competition EMSAs (Figure 2.4C) cannot
bind to Ubx/Exd/HthHM alone, and thus any binding seen is due to the Red or UbxAE binding sites
contained between these flanks. Both lanes in the EMSA contain Ubx/Exd/HthHM. Left lane contains the
UbxAE probe used in the competition experiments (5’-
CAAACCCAGTTCAGAGcgaatATATTTTATAaccGGTCAAGGTCGTTTCC) and the right lane contains the same
flanks with a mutated UbxAE sequence (5’-
CAAACCCAGTTCAGAGcgaaCCCCCCCCgaccGGTCAAGGTCGTTTCC). The same flanking sequences were
used in Slattery et al., 2011 and used to characterize the various Hox-Exd/HthHM SELEX-seq binding sites
(found in Table S1).
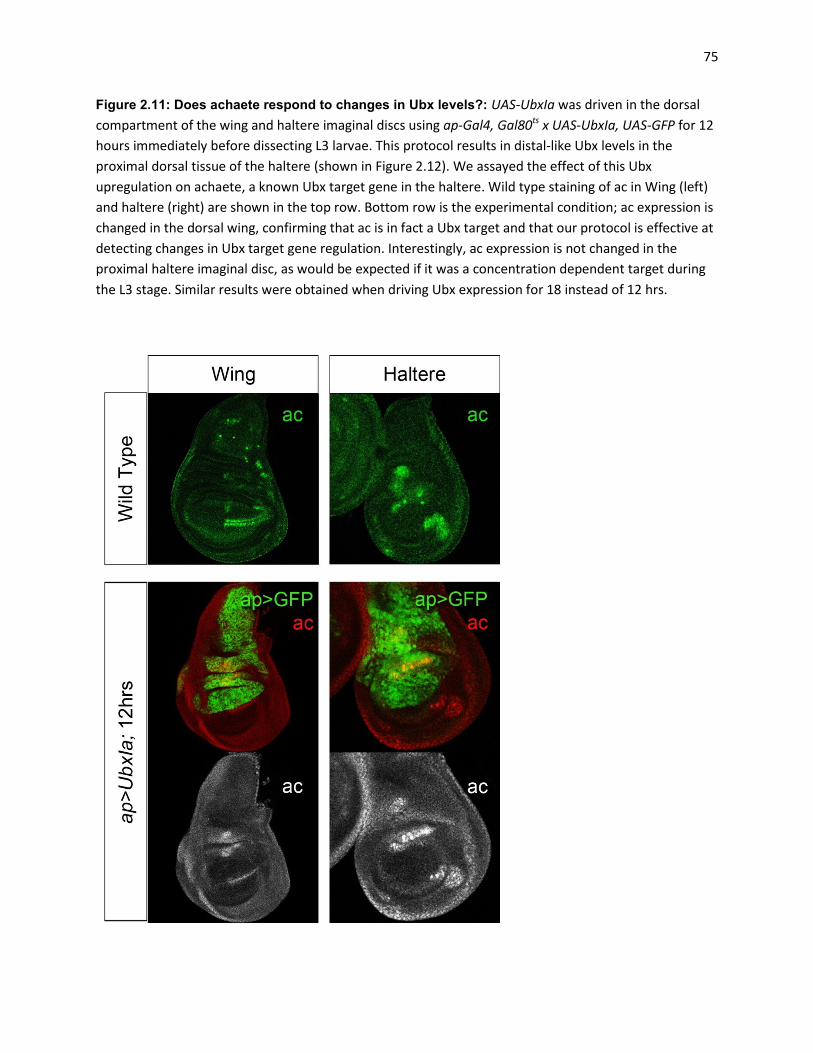
75
Figure 2.11: Does achaete respond to changes in Ubx levels?: UAS-UbxIa was driven in the dorsal
compartment of the wing and haltere imaginal discs using ap-Gal4, Gal80ts x UAS-UbxIa, UAS-GFP for 12
hours immediately before dissecting L3 larvae. This protocol results in distal-like Ubx levels in the
proximal dorsal tissue of the haltere (shown in Figure 2.12). We assayed the effect of this Ubx
upregulation on achaete, a known Ubx target gene in the haltere. Wild type staining of ac in Wing (left)
and haltere (right) are shown in the top row. Bottom row is the experimental condition; ac expression is
changed in the dorsal wing, confirming that ac is in fact a Ubx target and that our protocol is effective at
detecting changes in Ubx target gene regulation. Interestingly, ac expression is not changed in the
proximal haltere imaginal disc, as would be expected if it was a concentration dependent target during
the L3 stage. Similar results were obtained when driving Ubx expression for 18 instead of 12 hrs.

76
Figure 2.12: Upregulating Ubx in the proximal haltere. Using the same protocol used in the previous
Figure, 2.11, we examined a larger battery of presumptive concentration-dependent Ubx target genes.
We assayed the effect of this Ubx upregulation on spalt (A), Hth (C), Tsh (D), Dll (E). None of these
genes’ expression patterns are altered in the haltere in response to increased Ubx levels in the dorsal
compartment. We find that Spalt is specifically downregulated in the ap domain of the wing pouch (B),
confirming that the conditions of our assay are sufficient to elicit changes in target gene regulation.

77
CHAPTER 3
Naturally occurring genetic variation in D. melanogaster can silence Ubx
enhancer traps The work described in this chapter is a continuation of the publication attached as an Appendix
(Crickmore et al., 2009), on which I was the second author. My specific contributions to that paper are
listed in the Appendix preface. All the work described in this chapter was done by me, with the exception
of the data in Figures 3.8 and 3.9. The experiments summarized in Figure 3.9B were done entirely by a
rotation student, Chenshu Liu; the experiments summarized in Figure 3.9A were done entirely by a high
school student, Mohammed Rahman; the experiments summarized in Figure 3.8 were done in part by me
and in part by a rotation student at the time, Rich Allan. All three students worked under my supervision
to generate these data. The data in this chapter are not published.
ABSTRACT
Ubx dosage is inversely correlated with haltere size: increasing Ubx copy number decreases
haltere size and vice-versa. However, neither haltere size nor Ubx levels change in step with Ubx gene
dose. Ubx is known to negatively autoregulate in response to pulses of Ubx overexpression. We
proposed that Ubx negative autoregulation may occur in response to the more subtle increases in Ubx
levels associated with increases in Ubx copy number, and that this may buffer haltere size against
developmental noise. Consistent with this idea, we found that certain Gal-4 and lac-Z enhancer traps at
the Ubx locus are silenced when Ubx copy number is increased. Here, we show that functional Ubx
protein levels must exceed a certain threshold to silence Ubx enhancer traps in this context,
demonstrating that this phenomenon represents Ubx negative autoregulation at work. We have
previously shown that the same Ubx enhancer traps that are silenced by increases in Ubx copy number
are also silenced in F1 offspring of crosses between our lab population and certain wild populations of D.
melanogaster. Here, we follow up on these observations. Although we are unable to determine whether
outcross induced Ubx enhancer trap silencing is a manifestation of Ubx negative autoregulation or a
completely separate phenomenon, we have made several mechanistic insights. We find that the Gal-4
or UAS-GFP transposon insertions themselves are not the targets of silencing, but that the Ubx locus is
being targeted. We find that the genetic loci in certain wild populations that trigger Ubx enhancer trap

78
silencing are numerous and dispersed throughout the genome. We find that outcross-induced silencing
is not suppressed in Polycomb-like mutant clones, suggesting (but not proving) that silencing is PcG
independent. Finally, we find that a gain-of-function mutation in JIL-1, a gene that opposes the spread of
heterochromatin, alleviates outcross induced Ubx enhancer trap silencing. This, coupled with the finding
that the expression of two Position Effect Variegation reporters also fluctuates when outcrossed, argues
that transcriptional states at certain genomic locations vary with changes in genetic background, and
that the Ubx gene is one such locus.
INTRODUCTION
Haltere sizes are inversely correlated with Ubx gene dose, but these two parameters do not
change in step with one another. For example, a 100% increase in gene dose (2xUbx+ to 4xUbx+)
reduces adult haltere size by less than 20% (Crickmore et al., 2009). Ubx levels, as assayed by
immunostaining, also do not change in step with Ubx+ dose. Adding two extra copies of Ubx (100%
increase in gene dose) brings about a 40% increase Ubx protein levels in the pouch of the haltere
imaginal disc (Crickmore et al., 2009). Taken together, these observations suggest that haltere size may
be buffered against changes in Ubx dose, and that this buffering may occur, at least in part, by
regulating Ubx levels.
Ubx has previously been show to negatively autoregulate: it represses its own transcription in
response to transient pulses of Ubx overexpression (Irvine et al., 1993; Garaulet et al., 2008; Crickmore
et al., 2009). We previously showed that the lacZ and Gal-4 enhancer traps at the Ubx locus that are
silenced by pulses of Ubx overexpression are also silenced by increases in Ubx+ gene dose (Crickmore et
al., 2009). The fact that Ubx negatively autoregulates in the haltere in response to subtle increases in
Ubx levels (the same range in which we see phenotypic buffering) suggests that one function of Ubx
negative autoregulation may be to buffer haltere size against genetic and environmental noise
(Crickmore et al., 2009). Notably, Ubx protein levels are not altered in cells in which the Ubx enhancer

79
traps are silenced. This is in contrast to pulses of Ubx overexpression, which silence both the Ubx
enhancer traps as well as total Ubx protein (Crickmore et al., 2009). It is possible that this mild
overexpression of Ubx, elicited by increases in Ubx gene dose, transcriptionally inactivates subsets of
Ubx enhancers but not all Ubx enhancers (and therefore not entire alleles). Thus, a completely intact
copy of Ubx, which captures all enhancer inputs, may produce normal levels of Ubx protein; however,
enhancer traps that only capture a subset of Ubx enhancer inputs may display more pronounced and
non-uniform silencing (Crickmore at al., 2009).
Ubx-Gal4 and lacZ enhancer traps that are silenced by increases in Ubx+ gene dose are also
silenced in response to genetic variation that exists in different populations of D. melanogaster. When
outcrossed to 32 different wild (defined here as non-lab) populations of D. melanogaster and analyzed
in F1 imaginal discs, we found the Ubx-Gal4lac1 enhancer trap to be strongly silenced by 12 populations,
weakly silenced by 6 populations, and unaffected by 14 populations (Crickmore et al., 2009). The extent
of Ubx-Gal4lac1 silencing was highly consistent within a given cross, demonstrating a strong genetic basis
for this trait (Crickmore et al., 2009). In no cases was ectopic expression of Ubx-Gal4lac1 outside its
normal expression domain observed. Strikingly, the silencing of Ubx enhancer traps was not associated
with any phenotypic abnormalities or changes in Ubx protein levels in these F1 hybrid animals
(Crickmore et al., 2009). Furthermore, variation in Ubx protein levels between the lab strain and
homozygous parent wild stocks (as measured by Ubx immunostaining in haltere imaginal discs) did not
correlate with the degree of silencing induced by these stocks (Crickmore et al., 2009). Notably, Ubx-
Gal4lac1, which is also expressed in the T3 leg imaginal disc, is also silenced there, and to the same degree
as it is silenced in the haltere imaginal disc.
We postulated that the Ubx enhancer trap silencing in these F1 hybrid discs may represent a
biologically relevant function of Ubx negative autoregulation. Ubx may negatively autoregulate in
response to certain genetic variation by silencing subsets of Ubx enhancers (reflected in enhancer trap

80
expression patterns) in order to maintain Ubx levels within a precise and uniform range (Crickmore et
al., 2009). However, we also proposed that Ubx negative autoregulation was unlikely to be the only
factor contributing to enhancer trap silencing. This is because the severity of Ubx-Gal4lac1 silencing in
certain F1 hybrid animals is far greater than the severity of Ubx-Gal4lac1 silencing associated with
increases Ubx dose. In F1 hybrid offspring with certain wild populations, Ubx-Gal4lac1 is silenced in
~100% of its haltere disc expression domain, whereas haltere discs from animals with 4 copies of Ubx
silence Ubx-Gal4lac1 in 20-30% of its haltere expression domain. Given this, it is likely that genetic
differences beyond fluctuations in Ubx levels contribute to this enhancer trap silencing. In this chapter, I
describe the experiments I have done to follow up on this work and explore the genetic and mechanistic
basis of outcross induced Ubx enhancer trap silencing.
RESULTS
Ubx enhancer trap silencing in response to increases in Ubx copy number
We have previously shown that certain Gal4 and lacZ insertions into the Ubx locus (enhancer
traps) are downregulated or silenced in clusters of cells when Ubx copy number is increased using
genomic duplications of the entire locus (Crickmore et al., 2009). We proposed that this enhancer trap
silencing represents Ubx negative autoregulation at work to maintain Ubx levels within a precise and
narrow range. This hypothesis was based on the fact that 1) these enhancer traps are silenced by pulses
of Ubx overexpression and that 2) Ubx seems to negatively autoregulate at the modest increases in its
levels that are associated with increases in copy number (Doubling Ubx+ dose increases Ubx protein
levels in the haltere disc pouch by ~40%) (Crickmore et al., 2009).
However, a variety of other models may also explain Ubx enhancer trap silencing in response to
increases in Ubx copy number. To test if Ubx enhancer trap silencing in flies with 4xUbx (in which 1 of
the 4 copies is the hypomorphic enhancer trap allele) was in fact caused by the increase in Ubx protein

81
levels, we sought to rescue this dosage dependent silencing of the Ubx-Gal4lac1 enhancer trap. Driving
Ubx-RNAi from Ubx-Gal4lac1 in 4xUbx animals completely eliminates Gal4 silencing in haltere imaginal
discs (Figure 3.1A, B). This indicates that Ubx mRNA or protein must exceed a certain threshold to trigger
Ubx-Gal4lac1 silencing. To distinguish between the possibility that Ubx mRNA is the trigger, as opposed to
Ubx protein being the trigger, we tested Ubx-Gal4lac1 silencing in 4xUbx animals in which 1 of the 4
copies was the Ubx9-22 allele. The Ubx9-22 allele contains a short deletion in the third intron of Ubx,
associated with a frameshift, and produces a non-functional, HD-less, protein. Effectively, this allele
produces Ubx mRNA but not protein. We find that these animals also suppress Ubx-Gal4lac1 silencing,
implying that functional Ubx protein must exceed a certain threshold to trigger Ubx-Gal4lac1 silencing
(Figure 3.1A).
Although increases in Ubx protein levels trigger Ubx-Gal4lac1 silencing, it is still unclear if this is
due to transcriptional repression of subsets of Ubx enhancers, or some other mechanism. Because we
are monitoring Ubx enhancer activity using two P-elements (the Gal-4 P-element at the Ubx locus and a
UAS-GFP P-element) we sought to rule out the possibility that enhancer trap silencing is due to a form of
P-element repression that is independent of Ubx enhancer activity. To distinguish between these
possibilities, we simultaneously analyzed (in the same animal) the expression of two insertions of the
same Gal-4 P-element in different loci visualized through the same UAS-GFP P-element insertion, in
response to increases in Ubx dose (Figure 3.1D). If the Gal-4 transcript, or the Gal-4 P-element DNA is
being targeted for silencing, both Gal-4 insertions should be affected. Similarly, if the UAS-GFP P-
element is being silenced, both Gal-4 expression patterns should be affected, since both are being
visualized through the same UAS-GFP element. We find that increasing Ubx copy number silences Ubx-
Gal4lac1 but does not affect expression of an identical Gal-4 P-element into the apterous locus (Figure
3.1D). This suggests that the Ubx enhancers that drive expression of the Ubx-Gal4lac1 enhancer trap, and
not the inserted element itself, are the target of silencing. Notably, we cannot rule out the possibility

82
that the Gal-4 P-element is being silenced in a context dependent manner: i.e., the Gal-4 element, and
not the Ubx enhancers that drive its expression, is being silenced, but this silencing requires it to be
inserted into particular chromosomal positions, such as the Ubx locus.
To determine if the Ubx-Gal4lac1 enhancer trap was being silenced post-activation, or if the lack
of Ubx-Gal4lac1 expression is in fact a lack of activation itself, we performed a lineage trace experiment.
We examined 4xUbx haltere discs with the Ubx-Gal4lac1 enhancer trap as well as an actin>flipout>lacZ
construct that would be expressed in Gal4 expressing cells as well as cells descended from Gal4
expressing cells (Figure 3.1C). We find that the lacZ is much more broadly expressed than the Gal4 in
these discs, indicating that the Ubx-Gal4lac1 element is activated earlier in development, before being
silenced (Figure 3.1C). This result is consistent with the model we have proposed, as Ubx enhancers
must initially be active to drive sufficient Ubx production to exceed the threshold required to silence
Ubx regulatory elements.
Taken together, the results above indicate that copy number associated Ubx enhancer trap
silencing is 1) due to functional Ubx protein levels exceeding a certain threshold; 2) due to silencing of
Ubx enhancers and not the Gal4 or UAS-GFP P-elements used to monitor them; 3) due to silencing of
enhancers after they have initially been activated and not merely a failure to activate expression.
Variation at trans acting loci contributes to Ubx enhancer trap silencing induced by wild
populations
We sought to determine if the genetic loci in wild populations of D. melanogaster that cause
Ubx-Gal4lac1 silencing are linked to the Ubx locus. Performing a series of crosses between our lab strain
and CO-3, a population that strongly silences Ubx-Gal4lac1, we generated animals with various CO-3/Lab-
strain chromosomal complements (Figure 3.2). Tracking the origin of both copies of chromosome 2 and
3, we determined that a single copy of chromosome 2 or 3 from CO-3 was sufficient to silence Ubx-
Gal4lac1 (Figure 3.2B, C). The extent of silencing in both of these cases is similar to that in the typical F1

83
hybrid condition (Figure 3.2A). These results were also observed when the above crosses were done
with a moderately silencing stock, NC2-76 (data not shown). Furthermore, we find that more than 50%
of chromosomes that are recombinant between the Ubx-Gal4lac1 lab chromosome and a CO-3
chromosome 3, can silence Ubx-Gal4lac1 (Figure 3.2D). This indicates that there are variants on CO-3
chromosome 3 that are unlinked to Ubx and capable of silencing Ubx-Gal4lac1. Different recombinant
chromosomes silence Ubx-Gal4lac1 to different degrees; some silence as effectively as the F1 hybrid
situation, some do not silence Ubx-Gal4lac1 at all, and some silence it to intermediate degrees. This
suggests the presence of multiple causative genetic variants on CO-3 chromosome 3. Taken together,
these results indicate that 1) multiple variants within a single wild strain are sufficient to induce Ubx-
Gal4lac1 silencing; 2) genetic variation at the Ubx locus is not necessary to induce Ubx-Gal4lac1 silencing.
These results corroborate our earlier hypothesis that variation at Ubx, and fluctuations in its levels,
cannot be solely responsible for outcross-induced silencing of Ubx-Gal4 enhancer traps. Variation in the
levels or activities of trans-regulators must also contribute to silencing.
Regulatory elements of the Ubx locus are being targeted for silencing
We sought to determine if Ubx-Gal4lac1 silencing in F1 hybrid animals reflected reductions in Ubx
enhancer activity (which drive the expression of Gal-4), or silencing of the Gal-4 reporter itself. In the
experiments described above, we were assaying the expression of a Gal-4 P-element insertion into the
Ubx locus via another P-element, containing a UAS-GFP sequence. Importantly, the Gal-4 transcript
produced from the P-element insertion into Ubx is independent of the Ubx transcript. Thus, there are at
least three possible targets for silencing: 1) The DNA or transcript from the Gal-4 P-element; 2) The DNA
or transcript from the UAS-GFP P-element; 3) the Ubx regulatory elements that drive Ubx-Gal4lac1
expression.
To distinguish between these three possibilities, we simultaneously monitored the expression of
two different insertions of the same Gal-4 element, via a single UAS-GFP transgene, in response to wild
84
population DNA capable of silencing Ubx-Gal4 (Figure 3.3). We generated lab strains containing the two
Gal4 elements as well as the UAS-GFP insertion and then crossed in a single copy of chromosome 3 from
the strongly silencing CO-3 wild population to trigger silencing. We examined two different
combinations of Gal-4 elements: Ubx-Gal4 with engrailed-Gal4 (Figure 3.3A) and Ubx-Gal4 with
apterous-Gal4 (Figure 3.3B). For both combinations, the two different Gal-4 insertions drive expression
in distinct but overlapping patterns in the haltere imaginal disc, allowing us to monitor expression from
each insertion independently in the same animal. If the UAS-GFP P-element is being silenced, then both
Gal-4 expression patterns should be equally affected, as both are being visualized through the same
UAS-GFP insertion. If the Gal4 transcript or Gal-4 P-element DNA is being silenced, then too both Gal-4
expression patterns should be affected because both are insertions of the identical element. In both
versions of our experiment, however, we find that Ubx-Gal4lac1 is specifically silenced and there is no
effect on the ap-Gal4 or en-Gal4 expression patterns (Figure 3.3A, B). These results suggest that the Ubx
enhancers that drive expression of the Ubx-Gal4lac1 enhancer trap, and not the inserted element itself,
are the target of silencing. Notably, we cannot rule out the possibility that the Gal-4 P-element is being
silenced in a context dependent manner: i.e., the Gal-4 element, and not the Ubx enhancers that drive
its expression, is being silenced, but this silencing requires it to be inserted into particular chromosomal
positions, such as the Ubx locus.
We also wanted to know if the Ubx-Gal4lac1 element was not being activated at all, or was being
silenced after it was initially activated – as was found to be the case in Ubx+ copy number induced
enhancer trap silencing. We conducted a lineage trace experiment that labels cells expressing Ubx-
Gal4lac1, as well as cells descended from Ubx-Gal4lac1 expressing progenitors, in the SR1 silenced
chromosome. Our results indicate that the Ubx-Gal4lac1 enhancer trap is activated normally but
subsequently silenced in the SR1 condition (Figure 3.4A). Consistent with this result, we find that Ubx-
Gal4lac1 is not silenced in F1 hybrid embryos (Figure 3.4B).

85
Taken together, the results in this section indicate that 1) the Gal-4 or UAS-GFP P-elements
themselves are not being silenced, but the genomic context of the Ubx-Gal4lac1 insertion is critical for its
silencing; 2) the Ubx-Gal4lac1 element is activated before being silenced; 3) specific Ubx enhancers (the
ones driving imaginal disc expression) are silenced, while others (embryonic enhancers) are unaffected.
Ubx protein activity contributes to outcross induced Ubx-Gal4lac1 silencing
As mentioned earlier, while doubling Ubx+ dose silences Ubx-Gal4lac1 in 20-30% of its normal
haltere disc expression domain, F1 hybrid offspring with certain wild populations silence Ubx-Gal4lac1 in
close to 100% of its expression domain. Based on this observation, we had predicted that other factors,
in addition to possible fluctuations in Ubx protein levels or activity, may contribute to Ubx-Gal4lac1
silencing when outcrossed to wild populations. However, we had yet to determine if Ubx is playing any
role at all in Ubx-Gal4lac1 silencing.
To test this, we took advantage of a recombinant chromosome containing both Ubx-Gal4lac1
recombined with an unmapped stretch of CO-3 DNA capable of strongly silencing Ubx-Gal4lac1 (shown in
Figure 3.2D). Crossing this chromosome, called SR1, to various Ubx mutants allowed us to examine Ubx-
Gal4lac1 silencing in discs with drastically reduced levels of Ubx protein (Figure 3.5). SR1/SR1
homozygotes, which are homozygous for both the CO-3 DNA as well as the Ubx-Gal4lac1 hypomorphic
allele, have low levels of Ubx protein and modestly suppressed Ubx-Gal4lac1 silencing (Figure 3.5E).
However, this partial reduction in Gal4 silencing may be because the reporter (Ubx-Gal4lac1) is also
present in two copies. Confirming the idea that lowering Ubx levels partially suppresses Ubx-Gal4lac1
silencing, four other chromosomal complements that reduce Ubx levels without affecting reporter copy
number also reduce Ubx-Gal4lac1 silencing: SR1/Def109 (a deficiency of the entire BX-C locus); SR1/TM2
(a chromosome with a rearrangement breakpoint in Ubx, creating the Ubx130 null allele); SR1/Ubx9-22 (a
1.6kb deletion and associated frame-shift in Ubx that produces a non-functional protein that lacks a full
homeodomain); and SR1/UbxI.7 (deletion of the Ubx promoter due to a P-element transposition). In all of

86
these cases, the extent of Ubx-Gal4lac1 silencing is reduced (Figure 3.5). Knocking down Ubx levels using
two copies of UAS-Ubx-RNAi, driven by the Ubx-Gal4lac1 in the SR1 chromosome itself, also alleviates
Ubx-Gal4lac1 silencing (Figure 3.5C). Taken together, these results indicate that when Ubx levels are
lowered below a certain threshold, silencing is reduced. Strikingly, these reductions in Ubx levels,
although dramatic, have only modest suppressive effects on Ubx-Gal4lac1 silencing. The most severe Ubx
mutation (Def109) completely eliminates Ubx protein (measured by immunostaining) in the region of
the haltere disc in which Ubx-Gal4lac1 is expressed, yet silencing is only reduced from ~59% in SR1/+ to
~47% in SR1/Def109 (Figure 3.5 and Figure 3.7). This is perhaps because while Ubx protein contributes
to Ubx-Gal4lac1 silencing in F1 hybrid animals, it is not the only contributor.
What molecular machinery silences Ubx-Gal4lac1 in response to genetic variation?
Ubx-Gal4lac1 silencing is not suppressed in Polycomb-like or Dicer-2 mutant clones.
Polycomb Group (PcG) genes not only keep Ubx silenced in the wing, during normal
development, but also silence Ubx in the haltere in response to ectopic pulses of Ubx overexpression
(Garaulet et al., 2008; Crickmore et al., 2009). We therefore tested the possibility that PcG genes are
involved in outcross induced silencing. Our tools were limited, however, because most known PcG
mutants silence Ubx in the haltere by derepressing the more posterior Hox genes, abd-A and Abd-B
(Crickmore et al., 2009). One PcG gene, Polycomb-like (Pcl), which is required to generate high levels of
H3K27me3 and is a component of the Pcl-PRC2 complex, is an exception (Nekrasov et al., 2007). Pcl
homozygous mutant clones do not derepress abd-A and Abd-B in the haltere and therefore do not
silence Ubx (Crickmore et al., 2009). However, Pcl is necessary for Ubx negative autoregulation in the
haltere in response to ectopic Ubx overexpression (Garaulet et al., 2008; Crickmore et al., 2009).These
observations imply that Pcl mutant clones are a good test of PcG function in Ubx-Gal4lac1 silencing in the
haltere.
87
Making homozygous mutant clones of PclD5 (an amorphic allele), in animals in which Ubx-Gal4lac1
is silenced by a single copy of CO-3 chromosome 3, reveals that Pcl is not required for Ubx-Gal4lac1
silencing in this context (Figure 3.6A). Pcl mutant clones do derepress Ubx and Ubx-Gal4lac1 in the wing
(where both are inactive), confirming the nature of the mutant allele (Figure 3.6A). Importantly, because
PcG function may not be fully eliminated in Pcl mutant clones, this experiment cannot definitively rule
out the involvement of the PcG in Ubx-Gal4lac1 silencing.
Dicer-2 (Dcr-2) is required for siRNA generation in Drosophila. A growing body of work has
established a link between RNAi machinery and heterochromatin formation in S. pombe and Drosophila.
Loss of Dcr-2 in Drosophila is correlated with defects in heterochromatin formation and retrotransposon
silencing (Peng and Karpen, 2006; Kawamura et al., 2008). Heterozygous Dcr-2 mutants have also been
shown to suppress Position Effect Variegation (PEV) (Kavi and Birchler, 2009). Given this, we tested the
role of Dcr-2 in Ubx-Gal4lac1 silencing induced by genetic variation. Generating Dcr-2 homozygous mutant
clones in haltere imaginal discs that contain a single copy of CO-3 chromosome (to trigger silencing) 3
did not relieve Ubx-Gal4lac1 silencing (Figure 3.6B). This argues against a role for Dcr-2 in Ubx-Gal4lac1
silencing in F1 hybrid animals.
Loss of heterochromatin components does not suppress Ubx-Gal4lac1 silencing; a gain-of-function mutant
in a euchromatic component does.
We also tested other components of the heterochromatin machinery in Drosophila. The roles of
these genes were assessed by crossing the SR1 recombinant chromosome to various mutant alleles and
quantifying the extent of silencing in the heterozygous haltere imaginal discs (Figure 3.7). Heterozygous
loss-of-function mutations in four dominant suppressors of PEV: Su(var)2-5 (Heterochromatin Protein 1),
Su(var)2-1 (contributes to H4 deacetylation), Su(var)3-9 (a histone methyltransferase that methylates
H3K9), and SuUR (required for Su(var)3-9 binding to chromosomes) did not have any effect on Ubx-
Gal4lac1 silencing in the SR1 chromosome (Dorn et al., 1986; Schotta et al., 2002; Koryakov et al., 2011).

88
A gain-of-function mutation in the gene JIL-1 (also known as Su(var)3-1), which encodes a
protein that is not a core component of heterochromatin but is linked to heterochromatic gene
silencing, strongly suppress Ubx-Gal4lac1 silencing in SR1. JIL-1 encodes an essential H3S10 kinase that
localizes specifically to euchromatic regions in Drosophila salivary gland polytene chromosomes (Jin et
al., 1999). In loss of function alleles of JIL-1, H3K9me2 and HP1 spread to ectopic chromosomal locations
(Schotta et al., 2002; Zhang et al., 2003). Furthermore, using a LacI-tethering system to direct JIL-1 to
heterochromatic regions of the genome, in which it is not normally present, induces a change to an
open, euchromatic like state; notably, this change in chromosomal conformation is not accompanied by
a change in transcriptional activity (Deng et al., 2008). JIL-1 thus promotes euchromatic states and
opposes the spread of heterochromatin; a gain-of-function mutation in JIL-1 (JIL-13), shown to be a
suppressor of PEV, also suppresses Ubx-Gal4lac1 silencing in the SR1 chromosome (Bao et al., 2007).
Are enhancer traps or transgenic reporters from loci other than Ubx silenced?
We sought to determine if enhancer traps associated with loci other than Ubx could also be
silenced when outcrossed to wild populations of D. melanogaster. We crossed 19 lines associated with
11 different genes - enhancer traps as well as transgenic reporters with cloned enhancer DNA - to wild
populations that strongly (Tw2) and moderately (NC2-76) silence Ubx-Gal4lac1. The tested lines included
genes regulated by PcG (engrailed), genes known to autoregulate (Distal-less), targets of Ubx (vestigial,
spalt), and regulators of Ubx (homothorax). We also tested reporter fragments from ubiquitously
expressed genes: Actin, Ubiquitin, and armadillo. None of the 19 lines were silenced in F1 offspring
when crossed to two different wild populations (Figure 3.8). We also tested six transgenic reporters
containing cloned Ubx regulatory DNA. Four of these transgenes capture Ubx negative autoregulatory
inputs (35UZ, abx9, abx6.8, abxF) and two contain Polycomb Response Elements (35UZ and 206.11)
(Irvine et al., 1990; Simon et al., 1990; Fritsch et al., 1999). None of these transgenes were silenced
when outcrossed (Figure 3.8). In total, the only lines whose expression changed upon outcrossing were
89
the four Ubx enhancer traps previously reported to be silenced: Ubx-Gal4lac1; Ubx-Gal4M2; Ubx-Gal4LDN;
Ubx-166lacZ.
We next tested PEV reporters, as they are naturally prone to silencing and particularly sensitive
to changes in levels of stoichiometric heterochromatin components. PEV reporters are euchromatic
genes placed in the vicinity of heterochromatin – either by chromosomal rearrangements or transgenic
insertions – that exhibit clonally inherited variegating expression patterns associated with alterations in
chromatin structure (Wallrath and Elgin, 1995). We crossed two different PEV reporters, both of which
have variegated expression patterns in their native strains, to a range of wild populations that silence
Ubx-Gal4lac1 to different degrees. T(2;3)SbV , a translocation of a dominant Stubble (Sb1) mutant from its
endogenous location on chromosome 3R to a pericentromeric region on chromosome 2, produces a
mixture of short (allele is expressed) and long (allele is silenced) bristles (Moore et al., 1983). When
crossed to RAL-301, which silences Ubx-Gal4lac1 weakly, or CO-3, which silences Ubx-Gal4lac1 strongly,
T(2;3)SbV exhibits increased expression (more short bristles) (Figure 3.9A). Both stocks increase the
expression of the SbV allele to the same extent. This stands in contrast to their effect on the Ubx-Gal4lac1
insertion, in which case both induce silencing to different degrees. The experiments with T(2;3)SbV were
performed by a high school student working under my supervision, Mohammed Rahman.
The other PEV reporter, 118E10, is an insertion of an hsp70-white transgene into the pericentric
fourth chromosome (Wallrath and Elgin, 1995). 118E-10 shows variegated red eye color in its native
strain; red eye color indicates that the hsp70-white transgene is being expressed and white eye color
indicates repression. As with the previous PEV reporter we tested, the extent of 118E-10 variegation is
changed upon outcrossing (Figure 3.9B). Interestingly, as with the Tp(2;3)SbV reporter, neither the
direction nor degree of this change matches the pattern seen for Ubx-Gal4lac1. For example, RAL-313,
RAL-315, and RAL-41 all strongly silence Ubx-Gal4lac1. However, they have different effects on 118E-10:
RAL-313 and RAL-315 suppress 118E-10 silencing, but RAL-41 modestly enhances hsp70-white silencing

90
(Figure 3.9B). Thus, although variegation of these two PEV reporters, 118E-10 and Tp(2;3)SbV, is
affected by outcrossing, neither the direction nor the extent of silencing matches the pattern seen for
Ubx-Gal4lac1 when it is outcrossed to these same strains. This presumably indicates that although several
reporter genes are affected by naturally occurring genetic variation in D. melanogaster, the causative
variants and the effects they have, differ from one reporter to another. The experiments with 118E-10
were performed by a rotation student working under my supervision, Chenshu Liu.
The genetic etiology of Ubx-Gal4lac1silencing is complex
To assess the impact of genetic variation among different members within a single population,
we crossed Ubx-Gal4lac1 to 187 isogenic strains established from individual mated female flies isolated at
the same place and time – thus thought to be members of the same population (Mackay et al., 2012).
This collection of strains, called the Drosophila Genetic Reference Panel (DGRP), has been fully
sequenced to enable genome wide association studies to identify QTL associated with various
phenotypic traits (Mackay et al., 2012). Strikingly, we observe the full range of silencing phenotypes
observed in the F1 hybrid progeny of our Ubx-Gal4lac1, similar to when we cross Ubx-Gal4lac1 to different
populations of D. melanogaster (Figure 3.10B). This speaks to the extent of genetic variation between
flies in the wild. An analysis of SNPs in these strains that correlate with the extent of Ubx-Gal4lac1
silencing was done by the Mackay lab and the top hits generated from their analysis are generated in
Figure 3.11B.
Perhaps even more strikingly, when 216 animals with chromosomes recombinant for lab strain
and CO-3 DNA were generated, and crossed to Ubx-Gal4lac1 (such that the recombinant chromosomes
were analyzed in the heterozygous condition), the entire range of silencing phenotypes was also
observed (Figure 3.10A). This is reminiscent of the effects seen with recombinant chromosomes
described earlier (Figure 3.2D). These observations indicate that a single strongly silencing wild
population contains several genetic variants, different sets of which can elicit the full range of silencing

91
phenotypes: from no silencing to complete silencing (even stronger than the F1 hybrid with CO-3 alone).
This speaks to the complexity of the genetic etiology of Ubx-Gal4lac1 silencing.
DISCUSSION
We have previously reported that certain Gal4 and lacZ enhancer traps in the Ubx locus are
silenced in response to increases in Ubx copy number (Crickmore et al., 2009). We proposed that this
Ubx enhancer trap silencing was a manifestation of Ubx negative autoregulation – which was known to
occur at these Ubx enhancer traps as well as the endogenous Ubx locus in response to overexpression of
functional Ubx protein (Irvine et al., 1993; Garaulet et al., 2008; Crickmore et al., 2009). Here, we
provide evidence that Ubx enhancer trap silencing in response to increases in Ubx copy number is due to
functional Ubx protein levels exceeding a certain threshold. Ubx-Gal4lac1 silencing induced by increases
in Ubx copy number is suppressed when Ubx levels are knocked down using Ubx-RNAi or Ubx mutants
that produce non-functional forms of the Ubx protein. These results disprove alternative explanations
for Ubx-Gal4lac1 silencing in response to increases in Ubx copy number and demonstrate that this
phenomenon is indeed a manifestation of Ubx negative autoregulation.
There are reports of seemingly similar phenomena in the literature, in which increases in
transgene copy number leads to diminished overall expression (Americo et al., 2002; Pal-Bhadra et al.,
2002; Kavi et al., 2005). I discuss one example in detail, due to its apparent resemblance to the
phenomenon we describe here. James Birchler and colleagues have shown that adding six to ten, full-
length, transgenic copies of the Alcohol dehydrogenase (Adh) gene into Drosophila leads to progressively
decreased Adh mRNA abundance, as assayed by Northern blots (Pal-Bhadra et al., 1997; Pal-Bhadra et
al., 2002). This type of silencing is post-transcriptional (as determined by nuclear-run on assays) and
requires Adh mRNA levels to exceed a certain threshold. Pulses of Adh overexpression, delivered via
hsp70-Adh constructs, can also induce this reduction in expression (Pal-Bhadra et al., 2002). This type of
silencing, however, is not known to require functional Adh protein to trigger silencing, and there is

92
evidence that Adh mRNA is the trigger, and is processed into short RNAs that induce silencing (Pal-
Bhadra et al., 2002).
Our data indicate that Ubx enhancer trap silencing in response to increases in Ubx copy number
is distinct from Adh transgene silencing for the following reasons: 1) Functional Ubx protein, not only
Ubx mRNA, triggers Ubx enhancer trap silencing. 2) Given that the enhancer traps are transcriptional
reporters (the Gal4 is an independent transcript), Ubx enhancer trap silencing represents
transcriptional, and not a post-transcriptional silencing. 3) Unlike Adh, which is an enzyme, Ubx is a
transcription factor that is known to negative autoregulate by repressing its own transcription.
Is Ubx-Gal4lac1 silencing a manifestation of Ubx negative autoregulation?
We previously proposed that the silencing of Ubx enhancer traps in F1 offspring of outcrosses to
wild populations of D. melanogaster is a reflection of Ubx negative autoregulation at work, buffering
Ubx levels and haltere size against genetic variation. Here, we tested a role for functional Ubx protein in
this outcross induced silencing. We crossed the SR1 chromosome, which contains the Ubx-Gal4lac1
reporter recombined with a stretch of CO-3 DNA capable of silencing Ubx-Gal4lac1, to a range of Ubx
mutants. Although Ubx-RNAi as well as all four Ubx mutants that we tested reduced Ubx-Gal4lac1
silencing, the extent to which they did so was modest. When heterozygous over wild type
chromosomes, SR1 silences Ubx-Gal4lac1 in 56-59% of its normal expression domain. In SR1/Ubx null
mutants (TM2 and Def109), Ubx-Gal4lac1 is silenced in 42-47% of its normal expression domain. This
suppression effect is modest, even though SR1/Def109 reduces Ubx protein levels below the threshold
of detection with immunostaining.
The fact that drastically lowering Ubx levels modestly reduces silencing can be interpreted in
two ways (Figure 3.12). In one model, Ubx may be induced by genetic variation in certain wild
populations to silence enhancer traps at its native locus (Figure 3.12A). This may occur via elevated or
fluctuations in Ubx levels. It is likely that this would be one of multiple mechanisms contributing to Ubx

93
silencing. Therefore, reducing Ubx protein levels (as in the experiments summarized in Figure 3.5) would
impair Ubx-Gal4 silencing only partly, by eliminating just one of several mechanisms contributing to Ubx-
Gal4lac1 silencing. In another model, Ubx protein function does not contribute to the silencing of Ubx-
Gal4lac1 seen in response to genetic variation (Figure 3.12B). In this model, Ubx mutants suppress SR1
silencing due to an independent effect. Ubx negative autoregulation is an ongoing phenomenon during
normal haltere development. Reducing Ubx levels would therefore eliminate Ubx negative
autoregulation and boost the activity of Ubx enhancers. This increase in activity of the Ubx enhancers
that drive Ubx-Gal4lac1 expression could oppose a silencing mechanism that is completely independent
of Ubx function (Figure 3.12B).
Ubx-Gal4lac1 silencing is associated with complex genetic etiology
The experiments summarized above indicate that numerous genetic variants in a single wild
population of D. melanogaster contribute to Ubx-Gal4lac1 silencing. These loci appear to be distributed
throughout the genome – on both chromosome 2 and 3 – and variation at the Ubx locus is not necessary
to cause Ubx-Gal4lac1 silencing. This suggests that variation in trans acting factors affects the expression
of the Ubx-Gal4lac1 element, and is consistent with our prediction, based on the fact that the extent of
silencing induced by many of the wild populations is far greater (~100%) than the extent of silencing
induced by doubling Ubx+ gene dose (<20%).
Strikingly, the same range of silencing phenotypes is observed when Ubx-Gal4lac1 is crossed to i)
different populations of D. melanogaster, ii) different strains derived from a single population of D.
melanogaster, iii) recombinant chromosomes containing different stretches of DNA from a single
isogenic strain of D. melanogaster. This is indicative of the genetic diversity among individual flies in the
wild, even within a single population, and also underscores the genetic complexity of this phenomenon.
We are now attempting to identify Quantitative Trait Loci (QTL) in the CO-3 strain associated
with Ubx-Gal4lac1 silencing. To do this, we have established ~200 balanced stocks containing
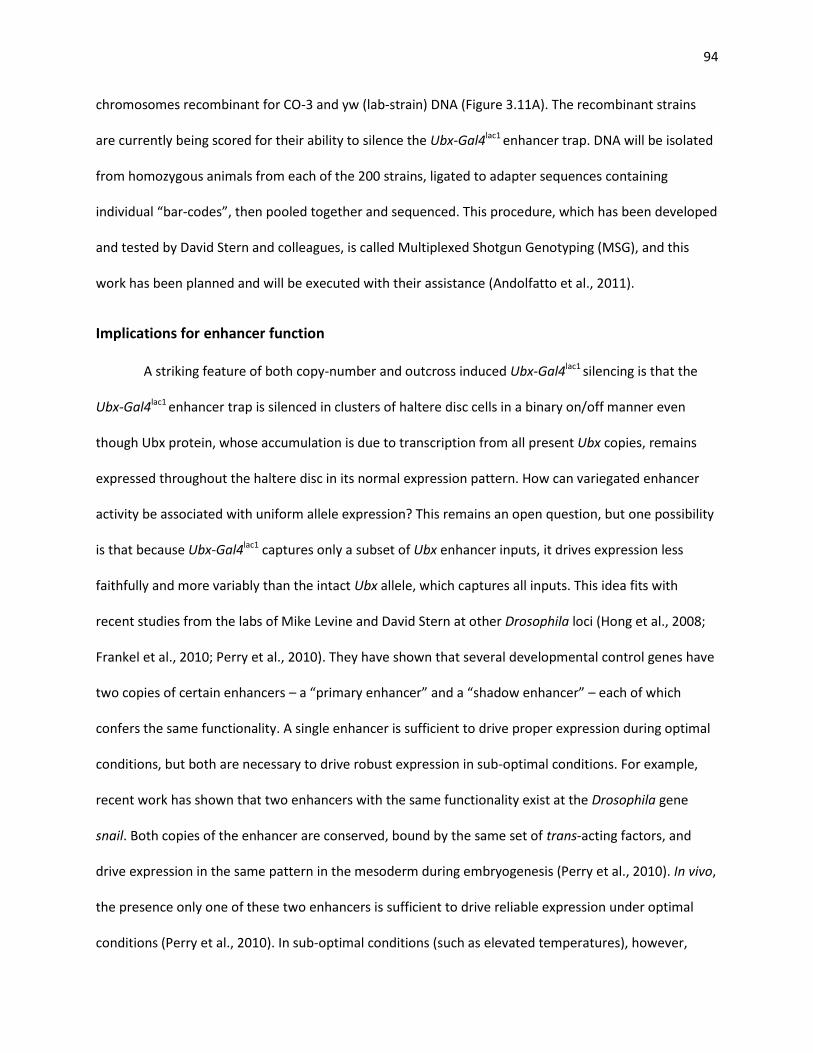
94
chromosomes recombinant for CO-3 and yw (lab-strain) DNA (Figure 3.11A). The recombinant strains
are currently being scored for their ability to silence the Ubx-Gal4lac1 enhancer trap. DNA will be isolated
from homozygous animals from each of the 200 strains, ligated to adapter sequences containing
individual “bar-codes”, then pooled together and sequenced. This procedure, which has been developed
and tested by David Stern and colleagues, is called Multiplexed Shotgun Genotyping (MSG), and this
work has been planned and will be executed with their assistance (Andolfatto et al., 2011).
Implications for enhancer function
A striking feature of both copy-number and outcross induced Ubx-Gal4lac1 silencing is that the
Ubx-Gal4lac1 enhancer trap is silenced in clusters of haltere disc cells in a binary on/off manner even
though Ubx protein, whose accumulation is due to transcription from all present Ubx copies, remains
expressed throughout the haltere disc in its normal expression pattern. How can variegated enhancer
activity be associated with uniform allele expression? This remains an open question, but one possibility
is that because Ubx-Gal4lac1 captures only a subset of Ubx enhancer inputs, it drives expression less
faithfully and more variably than the intact Ubx allele, which captures all inputs. This idea fits with
recent studies from the labs of Mike Levine and David Stern at other Drosophila loci (Hong et al., 2008;
Frankel et al., 2010; Perry et al., 2010). They have shown that several developmental control genes have
two copies of certain enhancers – a “primary enhancer” and a “shadow enhancer” – each of which
confers the same functionality. A single enhancer is sufficient to drive proper expression during optimal
conditions, but both are necessary to drive robust expression in sub-optimal conditions. For example,
recent work has shown that two enhancers with the same functionality exist at the Drosophila gene
snail. Both copies of the enhancer are conserved, bound by the same set of trans-acting factors, and
drive expression in the same pattern in the mesoderm during embryogenesis (Perry et al., 2010). In vivo,
the presence only one of these two enhancers is sufficient to drive reliable expression under optimal
conditions (Perry et al., 2010). In sub-optimal conditions (such as elevated temperatures), however,

95
both copies of the enhancer are required for reliable expression; having only one of the two copies
drives variable expression and increases the fraction of nuclei that should but do not express the snail
reporter (Perry et al., 2010). This is similar to the fluctuation in expression of the Ubx-Gal4lac1 enhancer
trap that we observe here. In normal animals, Ubx-Gal4lac1 is expressed uniformly in a part of the Ubx
expression domain of the haltere imaginal disc. In response to certain stresses – increases in Ubx copy
number or genetic variation – the enhancer trap expression pattern becomes variable and its expression
is lost in clusters of cells. This silencing is not evident at the level of entire alleles, as Ubx protein
expression does not fluctuate similarly. Thus, a full set of enhancers drives robust and uniform
expression while a subset of enhancers drives variable expression.
MATERIALS AND METHODS
Ubx fly strains: The 4xUbx+ condition was generated using a transposition of a tandem duplication of
Ubx: Dp(3;2)P10. This duplication also duplicates the gene ss, and partially duplicates abd-A. The Ubx-
RNAi construct was created by Myungin Baek and is described in more detail in the Materials and
Methods section of Chapter 2. The Ubx-Gal4lac1 construct is described in Pallavi and Shashidhara, 2003.
Several different Ubx mutants were used: Ubx9-22, which produces a truncated, non-functional form of
the protein. The TM2 balancer chromosome contains the Ubx130 mutation, which contains a
rearrangement breakpoint within the Ubx locus. UbxI.7 is a lacZ insertion into the Ubx locus that was
transposed to yield a 1.7kb deletion of the Ubx promoter; the allele was obtained from Ernesto Sanchez-
Herrero. The Def109 chromosome deletes Ubx and abd-A (Sanchez-Herrero et al., 1985). The 35UZ
reporter was obtained from K. Irvine (Irvine et al., 1990); 206.11 is from G. Struhl; abx9 and abx6.8 are
from J. Simon. sal1.1 is from S. Carroll.
Wild population fly strains: All wild populations of D. melanogaster were obtained from Bloomington,
including the set of 188 Drosophila Genetic Reference Panel strains. *CO-3 (Commack-3) is no longer
available at the Bloomington Stock Center.

96
Other fly strains and genetics: Two PEV reporters were used. 118E10 is from Sarah Elgin and Tp(2;3)SbV
was obtained from the Bloomington Stock Center. The Su(var)2-5[5], Su(var)2-1[1], Su(var)3-9[1], JIL-
1[3], SuUR[ES], SuUR[m102726], and FRT42D Pcl[5] fly strains were all obtained from the Bloomington
Stock Center.
Lineage trace analysis for copy number induced Ubx enhancer trap silencing was done by crossing yw;
DpP10x2/Cyo; Ubx-Gal4lac1 UAS-GFP/TM6B to UAS-flp; act>y>lacZ/Cyo. Lineage trace analysis for wild
population induced Ubx enhancer trap silencing was done by crossing yw; SR1/TM6B to UAS-flp;
act>y>lacZ/Cyo.
Quantifications: % Silencing values were calculated as follows: 1) the % area of the haltere disc that
normally expresses Ubx-Gal4lac1>UAS-GFP was measured for animals of the genotype: yw122; If/Cyo
Ubx-Gal4lac1/TM6B. This was done by dividing the GFP+ expressing area of haltere discs (measured using
magnetic lasso or magic wand tools in Photoshop) from the total disc area (measured in Photoshop
using the DAPI channel). An n of >30 was used and the average value was calculated. 2) The same
procedure was used to calculate the % GFP+ area of haltere discs for various other experimental
genotypes. 3) Experimental values were subtracted from the average %GFP+ area of yw122; If/Cyo Ubx-
Gal4lac1/TM6B animals to obtain the % Silencing values.
All graphs were plotted using GraphPad Prism. Each data point represents a haltere imaginal disc from a
separate animal. Bars for all graphs represent the Means and Standard Error of the Means. P-values
were calculated in Prism and were generated using unpaired, two-tailed, T-tests.
Antibodies: Mouse anti-Ubx (1:10; FP3.38, White and Wilcox, 1985). Rabbit anti-bgal (1:5,000; Cappell).
97
FIGURES
Figure 3.1: Ubx enhancer trap silencing in response to increases in Ubx gene dose. (A)Left to right,
representative images showing the expression pattern at the Ubx-Gal4lac1
enhancer trap in a 2xUbx haltere disc;
4xUbx haltere disc; 4xUbx in which 1 of the 4 copies of Ubx produces a truncated and non-functional protein; 4x
Ubx disc in which Ubx-Gal4lac1
drives 2xUbx-RNAi. (B) Quantifications of a set of the above genotypes. Each data
point represents a haltere disc from a different animal. Lines represent the mean and the Y-axis represents the
area of the disc that has been silenced. (C) Haltere disc from a lineage trace experiment in animals of the
genotype: UAS-flp; DpP10x2 (2xUbx) / actin>flipout>lacZ; Ubx-Gal4lac1
/+. (D) Increasing Ubx copy number silences
Ubx-Gal4 but not another insertion of the same Gal4 P-element into the apterous locus.

98
Figure 3.2: Loci capable of silencing Ubx-Gal4lac1
are dispersed throughout the genome. A cartoon
representing the chromosomal origins and configurations associated with outcross induced Ubx-Gal4lac1
enhancer trap silencing. Purple lines represent wild population DNA and black lines represent lab strain
DNA. The black arrow indicates the Gal-4 insertion. (A) An F1 hybrid offspring between a lab and wild
strain. A single copy of chromosome 2 (B) or chromosome 3 (C) from a wild population can triggerUbx-
Gal4lac1 silencing. (D) Recombination on chromosome 3 between a lab strain with the Ubx-Gal4lac1
insertion and CO-3 yields chromosomes that silence Ubx-Gal4lac1 at a greater than 50% frequency,
indicating that variation on chromosome 3, unlinked to Ubx is capable of triggering silencing.

99
Figure 3.3: Elements at the Ubx locus, and not the P-elements themselves, are being silenced.
Insertions of the same Gal-4 P-element into other genes are not silenced by outcrossing; neither is the
UAS-GFP P-element that is used to visualize Ubx-Gal4lac1. (A) On the left, a cartoon showing the
expression patterns of two different insertions of the same Gal-4 P-element; into the Ubx locus and the
engrailed locus. Creating a fly with both of these insertions, as well as a UAS-GFP insertion, and crossing
it to CO-3 DNA (yielding the chromosome complement diagrammed on the right) exclusively silences the
Ubx-Gal4lac1 insertion. (B) The same experiment as in A, but with a different combination of Gal-4 lines:
Ubx-Gal4lac1 and apterous-Gal4.

100
Figure 3.4: Ubx-Gal4lac1
is activated before being silenced by genetic variation. (A) A lineage trace
experiment in the SR1 silenced condition, marking cells that currently express Ubx-Gal4lac1 as well as
cells descended from Ubx-Gal4lac1expressing cells (lacZ+). The genotype of the animal is: UAS-flp/+;
actin>flipout>lacZ/Cyo; SR1 (recombinant for Ubx-Gal4lac1 and CO-3)/TM6B. (B) Embryonic stainings
indicate that Ubx-Gal4lac1 is expressed similarly in the lab stock (top) and SR1 stock (bottom), indicating
that silencing does not occur till later in development. In both A and B, anterior is to the left and
posterior is to the right.

101
Figure 3.5: Ubx protein contributes to outcross induced Ubx-Gal4lac1
silencing. (A) The endogenous
expression pattern of Ubx-Gal4lac1 ; the cartoon beneath the images represents the two homologs of
chromosome 3. Cartoon legend is in the bottom right panel, labeled “key”. (B) Ubx-Gal4lac1 expression in
the SR1recombinant fly strain (described in Figure 3.1D). (C) Driving UAS-UbxRNAi from the Ubx-Gal4lac1
reporter itself alleviates Ubx-Gal4lac1 silencing in the SR1 strain. (D – H) Crossing SR1 to different Ubx
mutants alleviates Ubx-Gal4lac1 silencing. Mutants are described in more detail in the text.

102
Figure 3.6: Pcl and Dcr-2 mutant clones do not suppress Ubx-Gal4lac1
silencing. (A) Pcl null mutant
clones (marked by absence of lacZ) derepress both Ubx and Ubx-Gal4lac1in the wing, where they are
usually repressed (left panel). These clones do not suppress Ubx-Gal4lac1 silencing in the haltere in the
SR1 strain (right panel). (B) Dcr-2 mutant clones (absence of lacZ) do not derepress Ubx-Gal4lac1 when
silenced by a single copy of CO-3 chromosome 3.

103
Figure 3.7: Candidate suppressors of Ubx-Gal4lac1
silencing by genetic variation. This chart is a
quantification of Ubx-Gal4lac1 silencing in the SR1 chromosome when heterozygous with balancer, Ubx mutant, or
other mutant chromosomes. Each data point represents a haltere imaginal disc from a different animal. %
Silencing, as indicated on the Y-axis, represents the area of the L3 haltere imaginal disc that normally expresses
Ubx-Gal4lac1
but is silenced in a particular condition. Bars for each condition represent the Mean and the Standard
Error of the Mean. P-values were calculated using unpaired, two-tailed T-Tests in Excel or GraphPad Prism. The
first three conditions, in gray, represent SR1 in an otherwise lab strain background. The next two columns, in light
blue, indicate Ubx-Gal4lac1
silencing when crossed to two different Ubx null mutants – TM2 and Def109. Crossing
SR1 back to its parent wild stock, CO-3, increases the extent of silencing. Heterozygous mutants in Su(var)2-1,
Su(var)2-5, Su(var)3-9, SuUR, all fail to rescue silencing. A heterozygous mutant for a gain-of-function allele in the
H3S10 kinase JIL-1 rescues silencing (far right column).

104
Figure 3.8: Are other enhancer traps and transgenes silenced by genetic variation? Enhancer traps
and transgenic reporter constructs in several other tested loci are not silenced when outcrossed. The
strains above, which contain insertions of reporters into endogenous loci, or are transgenic reporters
created with regulatory DNA from these loci, were crossed to Tw2 (a wild population that strongly
silences Ubx-Gal4lac1) or NC2-76 (a wild population that moderately silences Ubx-Gal4lac1). Strains in
green did not exhibit any noticeable changes in expression patterns or levels in the F1 progeny imaginal
discs. Only the four strains in yellow, the four insertions in Ubx previously shown to be silenced, showed
altered expression.

105
Figure 3.9: PEV reporters are also affected by genetic variation. Position Effect Variegation (PEV)
reporters are silenced when outcrossed to wild populations of D. melanogaster, but the pattern of
silencing does not match the pattern seen with Ubx-Gal4lac1. (A) The Sb[V] allele is a PEV reporter that
affects bristle length: short bristles indicate that the allele is expressed and long bristles indicate that the
allele is repressed. The same eight major dorsal thorax bristles were scored for length in the parent
strain (Sb[V]), F1 hybrids of the parent strain crossed to RAL-301, which weakly silences Ubx-Gal4lac1 and
CO-3, which strongly silences Ubx-Gal4lac1. The Sb[V] strain was also crossed to an HP-1 mutant allele,
Su(var)2-5[5], as a positive control. (B) 118E-10 is a PEV reporter that exhibits variegated eye color. Eye
color intensity, for the entire eye, was measured for the genotypes listed in the chart. Higher intensities
indicate more white (repression) and less red (expression). The heterozygous parent strain is the first
column on the left and the next column to the right is a control, F1 offspring of 118E-10 x Su(var)2-5[5].
The other columns are F1 hybrids between the parent PEV stock and the various wild populations from
the RAL collection. In both cases, bars represent the Mean and the Standard Error of the Mean. P-values
for certain comparisons are shown. P-values were calculated using unpaired, two-tailed T-Tests in Excel
or GraphPad Prism. *The raw data in panel A were generated by Mohammed Rahman and the raw data
in panel B were generated by Chenshu Liu.

106
Figure 3.10: Ubx-Gal4lac1
has a complex genetic etiology. Variation in Ubx-Gal4lac1 expression when
crossed to strains from a single population, or recombinants containing portions of DNA from a single
strain, show similar distributions of silencing. (A) Ubx-Gal4lac1 was crossed to CO-3 (which strongly
silences Ubx-Gal4lac1) to generate F1 hybrid virgin females. These flies were then crossed to balancer
males to obtain F2 recombinant males with one set of recombinant chromosomes and one set of
balancer chromosomes. These F2 males were crossed with Ubx-Gal4lac1 to assess the degree of silencing
induced by the recombinant chromosomes in the heterozygous condition. The distribution of silencing
for these strains is plotted above the representative images for the five different silencing categories:
class A to E. (B) Ubx-Gal4lac1 was crossed to 187 isogenic lines of D. melanogaster isolated from the same
population (called the DGRP) and silencing was scored in F1 hybrid haltere discs. The silencing
distribution of these strains is plotted beneath the representative images for the five different silencing
categories: A – E.

107
Figure 3.11 Two approaches to identify loci in wild populations that cause Ubx-Gal4lac1
silencing.
(A) In collaboration with David Stern, we are using Multiplexed Shotgun Genotyping (MSG) to identify
QTL. For this, we have established 200 strains recombinant between our lab stock and a single isogenic
wild stock (CO-3) that strongly silences Ubx-Gal4lac1. These strains are being scored for their ability to
silence Ubx-Gal4lac1 and will then be sequenced. (B) Results from a GWAS associating the extent of
silencing in F1 discs of Ubx-Gal4lac1 when crossed to each of 187 isognic and sequenced lines from the
DGRP collection. The results listed here are the most significant SNP associations.

108
Figure 3.12: Two models to explain Ubx-Gal4lac1
silencing by genetic variation. (A) In the first
model, Ubx represses Ubx regulatory elements independently of the mechanism that silences Ubx-
Gal4lac1 in response to genetic variation. In this model, the modest suppression of Ubx-Gal4lac1 seen in
SR1/Ubx- conditions, shown in Figure 3.4, is due to the loss of Ubx negative autoregulation, which occurs
normally during haltere development, and consequent de-repression of enhancers captured by Ubx-
Gal4lac1. (B) In the second model, the genetic variation in different strains induces Ubx, perhaps by
elevating its levels, to repress Ubx regulatory elements, thereby silencing Ubx-Gal4lac1 enhancer trap
expression.

109
CHAPTER 4
GENERAL DISCUSSION
One of the more striking features of developmental genetics is that the same molecular toolkit
can be used in different contexts to generate diverse structures. This applies to the development of
different structures within an organism, and the development of the analogous structure between
organisms (Carroll, 2008). For example, in Drosophila, the Decapentaplegic (Dpp) signaling pathway is
involved in dorso-ventral axis polarity in the embryo, gut morphogenesis, and the generation of diverse
adult appendages such as legs, wings, and halteres (Gelbart, 1989). The same sets of genes can also
develop very different versions of the analogous structure between species. An eye-popping example of
this involves the TF Pax6, a master regulator of eye development in vertebrates and invertebrates. Even
though the mouse and fly eye have vast structural differences, expressing the mouse Pax6 protein in
Drosophila leads to ectopic eye formation; the ectopic eyes resemble Drosophila eyes and not mouse
eyes (Halder et al., 1995). How do the same sets of developmental control genes drive different outputs
in different contexts? This versatility arises, in part, at the level of transcriptional regulatory networks.
Gene regulation involves the coordinated action of multiple TFs, a principle called ‘combinatorial
control’. The same TF can regulate distinct sets of target genes depending on which other TFs are
present. Cis-regulatory elements of developmental control genes enable them to be deployed in precise
and complex spatial and temporal expression patterns and at various expression levels during
development, allowing this precise combinatorial control (reviewed in Levine, 2010). Enhancers
contribute not only to versatility, but also to another hallmark of development: robustness (Hong et al.,
2008; Perry et al., 2010; Frankel et al., 2010). Despite environmental and genetic noise, development
results in reproducible and stereotyped outcomes. This property has been termed “canalization”, for the
visual metaphor of canals through which developmental processes flow; the deeper the canals, the less

110
likely developmental programs are to deviate from them (Waddington, 1942). Thus, enhancers that
regulate developmental control genes contribute to both the versatility and robustness of
developmental processes. My work is focused on the enhancers of one specific developmental control
gene – the Drosophila Hox gene Ubx – and their role in promoting both of these developmental traits.
In Chapter 2, we describe the genetic circuit that establishes different levels of Ubx in the
proximal and distal haltere imaginal disc. We find that Ubx directly negatively autoregulates, aided by its
cofactors Hth and Exd, to downregulate Ubx transcription in the proximal haltere disc. In the distal
haltere disc, where Hth is absent and Exd is cytoplasmic, Ubx is transcribed at high levels. We also
identify a Ubx cis-regulatory element and binding site that capture this regulation. This is an example of
how enhancers work to deploy the same gene at different levels in two distinct domains, thus adding
versatility to gene function and presumably contributing to the development of distinct structures. It is
worth noting that the difference in Ubx levels along the P-D axis is unlikely to be the master switch
between proximal and distal haltere fates. Other developmental control genes (e.g. Hth, Exd, Tsh)
exhibit differences in expression between the proximal and distal haltere imaginal disc that are
unaffected by changes in Ubx levels (Chapter 2). It is likely, however, that the different levels of Ubx in
these two domains contribute to morphological differences between the proximal and distal haltere.
Changes in Ubx levels during Drosophila development have known functional consequences in various
contexts including embryogenesis and leg development (reviewed in Chapter 1 and Chapter 2; Mann
1994; Stern 1998).
Binding site affinities and gene regulation
An interesting feature of the Ubx autoregulatory enhancer we identify in Chapter 2 is that it
contains a low-affinity binding site for Ubx/Exd/HthHM. In vitro, this UbxAE binding site has ~10-fold
lower affinity for the Ubx/Exd/HthHM trimer than the SELEX-seq derived highest-affinity site. Work at

111
other TF binding sites has shown that binding site affinity determines the minimum level of the TF to
which the enhancer can respond. For example, the gap gene hunchback (hb) is activated by high
concentrations of Bicoid in the anterior portion of the early Drosophila embryo. hb regulatory DNA
contains multiple Bicoid binding sites (Driever et al., 1989; Struhl et al., 1989). Changing the affinity or
number of these sites alters the spatial domain of Hb activation in a way that indicates that lower
affinity Bicoid binding sites require higher levels of Bicoid protein for activation (Driever at al., 1989;
Struhl et al., 1989). Two other studies – in C. elegans and the mouse – corroborate the notion that
lower-affinity binding sites require higher TF levels for regulation (Gaudet and Mango, 2002; Rowan et
al., 2010; discussed in Chapter 2). In these two cases, unlike with Bicoid, the TF gradient is temporal not
spatial. Therefore, changing the affinities of the TF binding site in reporter constructs alters the onset of
expression as opposed to the spatial domain of expression. Our work, in Chapter 2, does not identify a
biologically relevant function for the low-affinity nature of the UbxAE binding site. It is possible that, like
the examples described above, the affinity of the UbxAE binding sites determines the threshold level of
Ubx to which this enhancer responds. A second possibility is that the affinity of this binding site does not
determine its sensitivity to Ubx levels, but the degree of the regulatory response. Consistent with this
idea, a recent study examining in vivo binding of the S. cerevisiae TF Rap1 found that low-affinity binding
sites correlate with higher Rap1 turnover and higher nucleosome occupancy whereas high-affinity sites
have more stable Rap1 binding and lower nucleosome occupancy (Lickwar et al., 2012). Transcriptional
activity was found to be more strongly correlated with TF binding turnover than TF occupancy (Lickwar
et al., 2012). In this study, high-turnover binding was associated with weaker transcriptional activation
responses, consistent with the idea that binding site affinity may be contribute to the degree of the
regulatory response.
It is worth mentioning that the Ubx autoregulatory element we describe in Chapter 2 may not
be the only enhancer that contributes to the Ubx expression bias along the haltere P-D axis. Other, as
112
yet unidentified, enhancers and binding sites may also play a role. Consistent with this, abx1, a 6.8kb
deletion that encompasses the abxF enhancer which we describe in Chapter 2, does not eliminate the P-
D expression bias of Ubx in the haltere. Without knowing if the abxF enhancer element and associated
binding site are the sole determinants of P-D bias in Ubx haltere expression levels, it is difficult to
speculate on the role that binding site affinity plays in this particular context.
Other roles of Ubx negative autoregulation
Ubx negative autoregulation has been reported to play two other roles during Drosophila
development: i) silencing Ubx in the wing, after an initial bout of expression in the wing primordium
early in development; ii) buffering haltere size against developmental noise. Overexpressing functional
Ubx protein silences transcription at the endogenous Ubx locus in a heritable, PcG dependent manner
(Irvine et al., 1993; Garaulet et al., 2008; Crickmore et al., 2009). A reporter construct called 35UZ, which
contains 35kb of Ubx upstream regulatory DNA but does not overlap with the abxF element (or
recapitulate the haltere disc PD expression bias) is silenced in response to such pulses of Ubx
overexpression (Irvine et al., 1993). In a Ubx mutant that does not express Ubx in the developing wing
(where it is usually present early in development), 35UZ is ectopically activated in the wing imaginal disc
(Irvine et al., 1993). Based on this, it was proposed that one function of Ubx negative autoregulation is
to silence Ubx transcription in the wing after its initial period of expression (Irvine et al., 1993; Garaulet
et al., 2008).
We have previously proposed that another function of Ubx negative autoregulation also
functions to buffer haltere size against developmental noise (Crickmore et al., 2009). Modest increases
in Ubx levels, brought about by adding extra copies of the Ubx gene, are associated with reductions in
haltere size (Smolik-Utlaut, 1990). However, haltere size does not change in step with the increase in
Ubx dose, and neither do Ubx levels (Crickmore et al., 2009). This suggests the presence of phenotypic

113
buffering. Furthermore, certain Ubx enhancer traps are silenced in clusters of cells in haltere imaginal
discs of animals with (as few as two) extra copies of the Ubx gene (Crickmore et al., 2009). Here, in
Chapter 3, we have shown that this Ubx enhancer trap silencing requires functional Ubx protein to
exceed a certain threshold. Together, these results indicate that Ubx negatively autoregulates by
silencing Ubx enhancers in response to subtle increases in Ubx levels, and this mechanism may buffer
haltere size against developmental noise that could perturb Ubx levels.
Stochastic enhancer silencing at Ubx
One curious aspect of Ubx enhancer trap silencing induced by increases in Ubx gene dose is the
binary pattern in which some enhancer traps are silenced. The Ubx-Gal4lac1 and Ubx-Gal4LDN enhancer
traps, which capture a subset of Ubx transcriptional inputs (based on their haltere disc expression
patterns), respond to increases in Ubx gene dose by being completely silenced in some clusters of cells
while remaining active in others (Crickmore et al., 2009; Chapter 3). If this enhancer trap silencing is
indeed a reflection of a buffering mechanism at work, how does stochastic enhancer silencing lead to
precise and uniform levels of gene expression? One possibility is that although subsets of enhancers, or
individual enhancers, may be silenced in a stochastic manner, the complete set of enhancers act in
concert to drive uniform gene expression. This idea has experimental support from recent work showing
that several Drosophila genes contain enhancers in two copies, which confers robustness to gene
expression (Hong et al., 2008; Perry et al., 2010; Frankel et al., 2010). The presence of so-called “shadow
enhancers” allows uniform and robust gene expression in spite of genetic of environmental
perturbations. BAC constructs containing only one of the two enhancers (primary or shadow) display
fluctuating expression patterns in response to stresses (e.g. temperature and mutations) but BAC
constructs containing both enhancers (primary and shadow) still drive robust expression (Perry et al.,
2010; Frankel et al., 2010). Although the mechanistic basis for this is not entirely clear, these results
empirically demonstrate the principle that multiple copies of an enhancer can work together to drive

114
robust and uniform expression even though individual enhancers may be associated with fluctuating and
variable expression. Given this, it is possible that Ubx-Gal4lac1 and Ubx-Gal4LDN, show stochastic silencing
because they do not contain the complete set of Ubx regulatory inputs. In this model, a reporter
containing the full set of Ubx enhancers would drive robust and uniform expression in the face of
increases in Ubx gene dose.
Genetic variation silences Ubx enhancer traps
The same Ubx enhancer traps that respond to increases in Ubx gene dose are also silenced in
the imaginal discs of F1 cross progeny between our lab strain and certain wild populations of D.
melanogaster (Crickmore et al., 2009). No phenotypic abnormalities or perturbations in Ubx protein
levels are associated with this Ubx enhancer trap silencing (Crickmore et al., 2009). The extent of Ubx
enhancer trap silencing is highly reproducible within a given cross, indicating that this trait has a strong
genetic basis (Crickmore et al., 2009). We previously ruled out the possibility that this Ubx enhancer trap
silencing is a consequence of hybrid dysgenesis by performing qPCR from haltere imaginal discs of
silenced and non-silenced animals; these results show that the Ubx enhancer trap DNA is equally
abundant in silenced and non-silenced discs (Crickmore et al., 2009). My work here indicates that
genetic etiology of this Ubx enhancer trap silencing is complex and that multiple, dispersed loci within a
single strain contribute to silencing (Figure 3.2). We find that this silencing is not suppressed in clones of
cells mutant for Polycomb-like, arguing against a role for the PcG in silencing, and showing that it is
mechanistically distinct from Ubx enhancer trap silencing in response to Ubx overexpression (Figure
3.6). We do not know if Ubx-Gal4lac1 silencing induced by genetic variation is a manifestation of Ubx
negative autoregulation. Although lowering Ubx protein levels in F1 outcross animals modestly relieves
Ubx enhancer trap silencing, this may be due to the reduction of Ubx negative autoregulation which is
ongoing during haltere development; lowering Ubx levels boosts the activity of Ubx enhancers and this

115
may oppose an independent mechanism that, triggered by genetic variation, silences Ubx enhancer
traps (Figure 3.12).
Is the global transcriptional landscape affected by genetic variation?
Our data strongly suggest that Ubx enhancer trap silencing is a consequence of fluctuations in
Ubx enhancer activity and the transcriptional state at certain regulatory regions the Ubx locus (Figure
3.3 and 3.4). Two other findings corroborate this: First, a gain-of-function mutant allele in JIL-1, an
H3S10 kinase that promotes euchromatic states and opposes the spread of heterochromatin,
suppresses outcross induced enhancer trap silencing (Figure 3.7). Second, the expression of two PEV
reporters also fluctuates when outcrossed to certain wild populations of D. melanogaster (Figure 3.9).
Taken together, these observations suggest that Ubx enhancer trap silencing in F1 hybrid animals is
indicative of changes in chromatin/transcriptional states, and that these effects are not limited to the
Ubx locus.
This variation in transcriptional states may be related to cryptic genetic variation, defined as
standing genetic variation that does not contribute to the normal range of phenotypes observed in a
population, but that is available to modify a phenotype that arises after environmental change or the
introduction of novel alleles (Gibson and Dworkin, 2004). The fact that developmental processes are so
robust, or “canalized”, allows this genetic variation to build up and remain unexpressed at the
phenotypic level. Because this type of genetic variation is silent, it has been dubbed “the dark matter” of
the genome, and it is thought to provide raw material for evolution.
The changes in transcriptional activity that we observe – both at Ubx enhancer traps and PEV
reporters – in different genetic backgrounds of D. melanogaster may be due to the effects of such
cryptic variation. Although this variation is not frequently visible at the phenotypic – or even gene
expression level – is may be evident when monitoring individual enhancers (or subsets of enhancers, like
116
the Ubx enhancer traps) or particularly sensitive reporters (PEV) as we have done in Chapter 3. It would
be interesting to identify, at the molecular level, how the genome-wide chromatin landscape changes. Is
there a chromatin mark associated with inactive enhancers? ChIP-seq for histone modifications
(H3K9me3 and H3K4me3) from haltere imaginal discs from different populations may reveal more
subtle changes in enhancer activity that may not be associated with changes in expression of those
genes. RNA-seq from these same tissues would allow one to match up changes in chromatin marks
along a locus with any changes – or lack thereof – in gene expression. Recent work in the Drosophila
brain has corroborated the idea that different populations of the same species can exhibit tissue specific
changes in gene expression profiles. The expression of over 340 genes differed between flies from
African and European populations of Drosophila melanogaster (Catalan et al., 2012). The differentially
expressed genes were involved in various processes including stress response, olfaction, and
detoxification (Catalan et al., 2012).
Extensive differences in transcript levels between individuals within human populations
Variation in gene expression between individuals within a population is not unique to
Drosophila. Studies in various complex species, including humans, have made parallel observations.
Joshua Akey and colleagues characterized patterns of naturally occurring gene-expression variation in B
lymphoblastoid cells derived from eight unrelated individuals of northern and western European
ancestry (CEU) and eight unrelated individuals from the Yoruba of Ibadan, Nigeria (YRI). Using an array
of ∼8,500 genes, 5,194 of which were expressed in lymphoblastoid cells, they found extensive variation
(Storey et al., 2007). Furthermore, they found that most of the differences were among individuals
within a population as opposed to between populations: ∼83% of genes are differentially expressed
among individuals and ∼17% are differentially expressed among populations (Storey et al., 2007). This
parallels our observation that Ubx-Gal4lac1 expression in D. melanogaster varies as dramatically between

117
individuals within a population as it does between populations. In humans, this pattern seems to be
borne out at the genetic level as well; studies in humans estimate that variation within populations
accounts for 93 – 95% of genetic differences whereas differences among major groups accounts for only
3 – 5% of genetic differences (Rosenberg et al., 2002).
A striking example of the extent to which transcript levels can differ between humans comes
from microarray work done by Svante Paabo’s group. Using an array containing ~12,000 genes, they
compared mRNA levels of chimpanzee and human brains (samples taken from the left prefrontal lobe;
three individuals from each species). They found significant variation between individuals within a
species (Enard et al., 2002). In fact, gene expression in one human brain sample differed more from the
other human samples than from the chimpanzee samples (Enard et al., 2002). Sample prep and
measurements were done in duplicate for each individual minimizing the chance of experimental errors,
and indicating that these measurements reflect real differences.
These findings raise interesting questions as to the extent of robustness and variability in gene
regulatory networks. They also indicate that although it has not yet received much attention, gene
expression varies considerably between and within populations of various species, including humans.
Changes in mRNA transcript levels presumably reflect changes in enhancer activity of at least some of
these genes, and could be attributable to variation in both cis and trans acting factors. A couple of
caveats are worth noting: first, some of these differences may be due to post-transcriptional variations
such as changes in miRNA action, and not due to changes in enhancer activity or transcriptional states.
Second, some of the variation at the level of mRNA abundance may not be manifested at the level of
protein abundance due to downstream buffering mechanisms. Nevertheless, these findings indicate that
gene expression, and thus in many cases, presumably enhancers activity fluctuates between individuals
within species and even populations. Importantly, as with our observations of Ubx enhancer traps, it is
118
possible that individual or subsets of enhancers fluctuate between individuals even more dramatically
than the expression of entire genes. This has not yet been demonstrated in complex organisms, in large
part due to the difficulty of doing these experiments but also the difficulty of locating enhancers. As
more cis-regulatory elements in these organisms are discovered (by projects such as ENCODE and
modENCODE) this question will hopefully be addressed.

119
REFERENCES
Abu-Shaar, M., and Mann, R.S. (1998). Generation of multiple antagonistic domains along the proximodistal axis during Drosophila leg development. Development 125, 3821-3830.
Agelopoulos, M., McKay, D.J., and Mann, R.S. (2012). Developmental regulation of chromatin conformation by Hox proteins in Drosophila. Cell reports 1, 350-359.
Agger, K., Cloos, P.A., Christensen, J., Pasini, D., Rose, S., Rappsilber, J., Issaeva, I., Canaani, E., Salcini, A.E., and Helin, K. (2007). UTX and JMJD3 are histone H3K27 demethylases involved in HOX gene regulation and development. Nature 449, 731-734.
Agrawal, P., Habib, F., Yelagandula, R., and Shashidhara, L.S. (2011). Genome-level identification of targets of Hox protein Ultrabithorax in Drosophila: novel mechanisms for target selection. Scientific reports 1, 205.
Akam, M.E., and Martinez-Arias, A. (1985). The distribution of Ultrabithorax transcripts in Drosophila embryos. The EMBO journal 4, 1689-1700.
Americo, J., Whiteley, M., Brown, J.L., Fujioka, M., Jaynes, J.B., and Kassis, J.A. (2002). A complex array of DNA-binding proteins required for pairing-sensitive silencing by a polycomb group response element from the Drosophila engrailed gene. Genetics 160, 1561-1571.
Ayala, Y.M., De Conti, L., Avendano-Vazquez, S.E., Dhir, A., Romano, M., D'Ambrogio, A., Tollervey, J., Ule, J., Baralle, M., Buratti, E., et al. (2011). TDP-43 regulates its mRNA levels through a negative feedback loop. The EMBO journal 30, 277-288.
Azpiazu, N., and Morata, G. (1998). Functional and regulatory interactions between Hox and extradenticle genes. Genes & development 12, 261-273.
Azuara, V., Perry, P., Sauer, S., Spivakov, M., Jorgensen, H.F., John, R.M., Gouti, M., Casanova, M., Warnes, G., Merkenschlager, M., et al. (2006). Chromatin signatures of pluripotent cell lines. Nature cell biology 8, 532-538.
Badis, G., Berger, M.F., Philippakis, A.A., Talukder, S., Gehrke, A.R., Jaeger, S.A., Chan, E.T., Metzler, G., Vedenko, A., Chen, X., et al. (2009). Diversity and complexity in DNA recognition by transcription factors. Science 324, 1720-1723.
Bao, X., Deng, H., Johansen, J., Girton, J., and Johansen, K.M. (2007). Loss-of-function alleles of the JIL-1 histone H3S10 kinase enhance position-effect variegation at pericentric sites in Drosophila heterochromatin. Genetics 176, 1355-1358.
Beachy, P.A., Helfand, S.L., and Hogness, D.S. (1985). Segmental distribution of bithorax complex proteins during Drosophila development. Nature 313, 545-551.
Becskei, A., and Serrano, L. (2000). Engineering stability in gene networks by autoregulation. Nature 405, 590-593.
Bell, A.C., West, A.G., and Felsenfeld, G. (2001). Insulators and boundaries: versatile regulatory elements in the eukaryotic genome. Science 291, 447-450.
Bender, W., Akam, M., Karch, F., Beachy, P.A., Peifer, M., Spierer, P., Lewis, E.B., and Hogness, D.S. (1983). Molecular Genetics of the Bithorax Complex in Drosophila melanogaster. Science 221, 23-29.

120
Bender, W., and Fitzgerald, D.P. (2002). Transcription activates repressed domains in the Drosophila bithorax complex. Development 129, 4923-4930.
Bender, W., and Hudson, A. (2000). P element homing to the Drosophila bithorax complex. Development 127, 3981-3992.
Bergson, C., and McGinnis, W. (1990). An autoregulatory enhancer element of the Drosophila homeotic gene Deformed. The EMBO journal 9, 4287-4297.
Bernstein, E., Duncan, E.M., Masui, O., Gil, J., Heard, E., and Allis, C.D. (2006). Mouse polycomb proteins bind differentially to methylated histone H3 and RNA and are enriched in facultative heterochromatin. Molecular and cellular biology 26, 2560-2569.
Beuchle, D., Struhl, G., and Muller, J. (2001). Polycomb group proteins and heritable silencing of Drosophila Hox genes. Development 128, 993-1004.
Bienz, M., and Tremml, G. (1988). Domain of Ultrabithorax expression in Drosophila visceral mesoderm from autoregulation and exclusion. Nature 333, 576-578.
Boyer, L.A., Plath, K., Zeitlinger, J., Brambrink, T., Medeiros, L.A., Lee, T.I., Levine, S.S., Wernig, M., Tajonar, A., Ray, M.K., et al. (2006). Polycomb complexes repress developmental regulators in murine embryonic stem cells. Nature 441, 349-353.
Brandman, O., and Meyer, T. (2008). Feedback loops shape cellular signals in space and time. Science 322, 390-395.
Brower, D.L. (1987). Ultrabithorax gene expression in Drosophila imaginal discs and larval nervous system. Development 101, 83-92.
Brown, J.L., Fritsch, C., Mueller, J., and Kassis, J.A. (2003). The Drosophila pho-like gene encodes a YY1-related DNA binding protein that is redundant with pleiohomeotic in homeotic gene silencing. Development 130, 285-294.
Brown, J.L., Mucci, D., Whiteley, M., Dirksen, M.L., and Kassis, J.A. (1998). The Drosophila Polycomb group gene pleiohomeotic encodes a DNA binding protein with homology to the transcription factor YY1. Molecular cell 1, 1057-1064.
Busturia, A., Wightman, C.D., and Sakonju, S. (1997). A silencer is required for maintenance of transcriptional repression throughout Drosophila development. Development 124, 4343-4350.
Carroll, S.B. (2008). Evo-devo and an expanding evolutionary synthesis: a genetic theory of morphological evolution. Cell 134, 25-36.
Casares, F., and Mann, R.S. (1998). Control of antennal versus leg development in Drosophila. Nature 392, 723-726.
Casares, F., and Mann, R.S. (2000). A dual role for homothorax in inhibiting wing blade development and specifying proximal wing identities in Drosophila. Development 127, 1499-1508.
Catalan, A., Hutter, S., and Parsch, J. (2012). Population and sex differences in Drosophila melanogaster brain gene expression. BMC genomics 13, 654.
Chan, C.S., Rastelli, L., and Pirrotta, V. (1994). A Polycomb response element in the Ubx gene that determines an epigenetically inherited state of repression. The EMBO journal 13, 2553-2564.
Crickmore, M.A., and Mann, R.S. (2006). Hox control of organ size by regulation of morphogen production and mobility. Science 313, 63-68.

121
Crickmore, M.A., and Mann, R.S. (2007). Hox control of morphogen mobility and organ development through regulation of glypican expression. Development 134, 327-334.
Crickmore, M.A., Ranade, V., and Mann, R.S. (2009). Regulation of Ubx expression by epigenetic enhancer silencing in response to Ubx levels and genetic variation. PLoS genetics 5, e1000633.
Cuddapah, S., Roh, T.Y., Cui, K., Jose, C.C., Fuller, M.T., Zhao, K., and Chen, X. (2012). A novel human polycomb binding site acts as a functional polycomb response element in Drosophila. PloS one 7, e36365.
Czermin, B., Melfi, R., McCabe, D., Seitz, V., Imhof, A., and Pirrotta, V. (2002). Drosophila enhancer of Zeste/ESC complexes have a histone H3 methyltransferase activity that marks chromosomal Polycomb sites. Cell 111, 185-196.
Dasen, J.S., De Camilli, A., Wang, B., Tucker, P.W., and Jessell, T.M. (2008). Hox repertoires for motor neuron diversity and connectivity gated by a single accessory factor, FoxP1. Cell 134, 304-316.
Dasen, J.S., Liu, J.P., and Jessell, T.M. (2003). Motor neuron columnar fate imposed by sequential phases of Hox-c activity. Nature 425, 926-933.
Davis, G.K., Srinivasan, D.G., Wittkopp, P.J., and Stern, D.L. (2007). The function and regulation of Ultrabithorax in the legs of Drosophila melanogaster. Developmental biology 308, 621-631.
de Navas, L.F., Reed, H., Akam, M., Barrio, R., Alonso, C.R., and Sanchez-Herrero, E. (2011). Integration of RNA processing and expression level control modulates the function of the Drosophila Hox gene Ultrabithorax during adult development. Development 138, 107-116.
de Rosa, R., Grenier, J.K., Andreeva, T., Cook, C.E., Adoutte, A., Akam, M., Carroll, S.B., and Balavoine, G. (1999). Hox genes in brachiopods and priapulids and protostome evolution. Nature 399, 772-776.
Dejardin, J., Rappailles, A., Cuvier, O., Grimaud, C., Decoville, M., Locker, D., and Cavalli, G. (2005). Recruitment of Drosophila Polycomb group proteins to chromatin by DSP1. Nature 434, 533-538.
Denby, C.M., Im, J.H., Yu, R.C., Pesce, C.G., and Brem, R.B. (2012). Negative feedback confers mutational robustness in yeast transcription factor regulation. Proceedings of the National Academy of Sciences of the United States of America 109, 3874-3878.
Deng, H., Bao, X., Cai, W., Blacketer, M.J., Belmont, A.S., Girton, J., Johansen, J., and Johansen, K.M. (2008). Ectopic histone H3S10 phosphorylation causes chromatin structure remodeling in Drosophila. Development 135, 699-705.
Dickinson, M.H. (1999). Haltere-mediated equilibrium reflexes of the fruit fly, Drosophila melanogaster. Philosophical transactions of the Royal Society of London Series B, Biological sciences 354, 903-916.
Docquier, F., Farrar, D., D'Arcy, V., Chernukhin, I., Robinson, A.F., Loukinov, D., Vatolin, S., Pack, S., Mackay, A., Harris, R.A., et al. (2005). Heightened expression of CTCF in breast cancer cells is associated with resistance to apoptosis. Cancer research 65, 5112-5122.
Driever, W., and Nusslein-Volhard, C. (1989). The bicoid protein is a positive regulator of hunchback transcription in the early Drosophila embryo. Nature 337, 138-143.
Enard, W., Khaitovich, P., Klose, J., Zollner, S., Heissig, F., Giavalisco, P., Nieselt-Struwe, K., Muchmore, E., Varki, A., Ravid, R., et al. (2002). Intra- and interspecific variation in primate gene expression patterns. Science 296, 340-343.
Estella, C., McKay, D.J., and Mann, R.S. (2008). Molecular integration of wingless, decapentaplegic, and autoregulatory inputs into Distalless during Drosophila leg development. Developmental cell 14, 86-96.

122
Filion, G.J., van Bemmel, J.G., Braunschweig, U., Talhout, W., Kind, J., Ward, L.D., Brugman, W., de Castro, I.J., Kerkhoven, R.M., Bussemaker, H.J., et al. (2010). Systematic protein location mapping reveals five principal chromatin types in Drosophila cells. Cell 143, 212-224.
Francis, N.J., Saurin, A.J., Shao, Z., and Kingston, R.E. (2001). Reconstitution of a functional core polycomb repressive complex. Molecular cell 8, 545-556.
Frankel, N., Davis, G.K., Vargas, D., Wang, S., Payre, F., and Stern, D.L. (2010). Phenotypic robustness conferred by apparently redundant transcriptional enhancers. Nature 466, 490-493.
Freeman, M. (2000). Feedback control of intercellular signalling in development. Nature 408, 313-319.
Fritsch, C., Brown, J.L., Kassis, J.A., and Muller, J. (1999). The DNA-binding polycomb group protein pleiohomeotic mediates silencing of a Drosophila homeotic gene. Development 126, 3905-3913.
Fujioka, M., Emi-Sarker, Y., Yusibova, G.L., Goto, T., and Jaynes, J.B. (1999). Analysis of an even-skipped rescue transgene reveals both composite and discrete neuronal and early blastoderm enhancers, and multi-stripe positioning by gap gene repressor gradients. Development 126, 2527-2538.
Garaulet, D.L., Foronda, D., Calleja, M., and Sanchez-Herrero, E. (2008). Polycomb-dependent Ultrabithorax Hox gene silencing induced by high Ultrabithorax levels in Drosophila. Development 135, 3219-3228.
Garcia-Bellido, A. (1975). Genetic control of wing disc development in Drosophila. Ciba Foundation symposium 0, 161-182.
Garcia-Bellido, A., Ripoll, P., and Morata, G. (1976). Developmental compartmentalization in the dorsal mesothoracic disc of Drosophila. Developmental biology 48, 132-147.
Garcia-Bellido, A., and de Celis, J.F. (2009). The complex tale of the achaete-scute complex: a paradigmatic case in the analysis of gene organization and function during development. Genetics 182, 631-639.
Garcia-Fernandez, J. (2005). The genesis and evolution of homeobox gene clusters. Nature reviews Genetics 6, 881-892.
Gaudet, J., and Mango, S.E. (2002). Regulation of organogenesis by the Caenorhabditis elegans FoxA protein PHA-4. Science 295, 821-825.
Gehring, W.J., Qian, Y.Q., Billeter, M., Furukubo-Tokunaga, K., Schier, A.F., Resendez-Perez, D., Affolter, M., Otting, G., and Wuthrich, K. (1994). Homeodomain-DNA recognition. Cell 78, 211-223.
Gelbart, W.M. (1989). The decapentaplegic gene: a TGF-beta homologue controlling pattern formation in Drosophila. Development 107 Suppl, 65-74.
Gibson, G., and Dworkin, I. (2004). Uncovering cryptic genetic variation. Nature reviews Genetics 5, 681-690.
Gilad, Y., Oshlack, A., Smyth, G.K., Speed, T.P., and White, K.P. (2006). Expression profiling in primates reveals a rapid evolution of human transcription factors. Nature 440, 242-245.
Grieder, N.C., Morata, G., Affolter, M., and Gehring, W.J. (2009). Spalt major controls the development of the notum and of wing hinge primordia of the Drosophila melanogaster wing imaginal disc. Developmental biology 329, 315-326.
123
Halder, G., Callaerts, P., and Gehring, W.J. (1995). Induction of ectopic eyes by targeted expression of the eyeless gene in Drosophila. Science 267, 1788-1792.
Hirata, H., Bessho, Y., Kokubu, H., Masamizu, Y., Yamada, S., Lewis, J., and Kageyama, R. (2004). Instability of Hes7 protein is crucial for the somite segmentation clock. Nature genetics 36, 750-754.
Hirata, H., Yoshiura, S., Ohtsuka, T., Bessho, Y., Harada, T., Yoshikawa, K., and Kageyama, R. (2002). Oscillatory expression of the bHLH factor Hes1 regulated by a negative feedback loop. Science 298, 840-843.
Hong, J.W., Hendrix, D.A., and Levine, M.S. (2008). Shadow enhancers as a source of evolutionary novelty. Science 321, 1314.
Inoue, K., Ogawa, H., Sonoda, Y., Kimura, T., Sakabe, H., Oka, Y., Miyake, S., Tamaki, H., Oji, Y., Yamagami, T., et al. (1997). Aberrant overexpression of the Wilms tumor gene (WT1) in human leukemia. Blood 89, 1405-1412.
Irvine, K.D., Botas, J., Jha, S., Mann, R.S., and Hogness, D.S. (1993). Negative autoregulation by Ultrabithorax controls the level and pattern of its expression. Development 117, 387-399.
Irvine, K.D., Helfand, S.L., and Hogness, D.S. (1991). The large upstream control region of the Drosophila homeotic gene Ultrabithorax. Development 111, 407-424.
Jacob, F., and Monod, J. (1961). Genetic regulatory mechanisms in the synthesis of proteins. Journal of molecular biology 3, 318-356.
Jin, Y., Wang, Y., Walker, D.L., Dong, H., Conley, C., Johansen, J., and Johansen, K.M. (1999). JIL-1: a novel chromosomal tandem kinase implicated in transcriptional regulation in Drosophila. Molecular cell 4, 129-135.
Joshi, R., Passner, J.M., Rohs, R., Jain, R., Sosinsky, A., Crickmore, M.A., Jacob, V., Aggarwal, A.K., Honig, B., and Mann, R.S. (2007). Functional specificity of a Hox protein mediated by the recognition of minor groove structure. Cell 131, 530-543.
Kalin, T.V., Wang, I.C., Ackerson, T.J., Major, M.L., Detrisac, C.J., Kalinichenko, V.V., Lyubimov, A., and Costa, R.H. (2006). Increased levels of the FoxM1 transcription factor accelerate development and progression of prostate carcinomas in both TRAMP and LADY transgenic mice. Cancer research 66, 1712-1720.
Kavi, H.H., and Birchler, J.A. (2009). Interaction of RNA polymerase II and the small RNA machinery affects heterochromatic silencing in Drosophila. Epigenetics & chromatin 2, 15.
Kawamura, Y., Saito, K., Kin, T., Ono, Y., Asai, K., Sunohara, T., Okada, T.N., Siomi, M.C., and Siomi, H. (2008). Drosophila endogenous small RNAs bind to Argonaute 2 in somatic cells. Nature 453, 793-797.
King, M.C., and Wilson, A.C. (1975). Evolution at two levels in humans and chimpanzees. Science 188, 107-116.
Klymenko, T., and Muller, J. (2004). The histone methyltransferases Trithorax and Ash1 prevent transcriptional silencing by Polycomb group proteins. EMBO reports 5, 373-377.
Klymenko, T., Papp, B., Fischle, W., Kocher, T., Schelder, M., Fritsch, C., Wild, B., Wilm, M., and Muller, J. (2006). A Polycomb group protein complex with sequence-specific DNA-binding and selective methyl-lysine-binding activities. Genes & development 20, 1110-1122.

124
Knoepfler, P.S., Calvo, K.R., Chen, H., Antonarakis, S.E., and Kamps, M.P. (1997). Meis1 and pKnox1 bind DNA cooperatively with Pbx1 utilizing an interaction surface disrupted in oncoprotein E2a-Pbx1. Proceedings of the National Academy of Sciences of the United States of America 94, 14553-14558.
Kornfeld, K., Saint, R.B., Beachy, P.A., Harte, P.J., Peattie, D.A., and Hogness, D.S. (1989). Structure and expression of a family of Ultrabithorax mRNAs generated by alternative splicing and polyadenylation in Drosophila. Genes & development 3, 243-258.
Koryakov, D.E., Walther, M., Ebert, A., Lein, S., Zhimulev, I.F., and Reuter, G. (2011). The SUUR protein is involved in binding of SU(VAR)3-9 and methylation of H3K9 and H3K27 in chromosomes of Drosophila melanogaster. Chromosome research : an international journal on the molecular, supramolecular and evolutionary aspects of chromosome biology 19, 235-249.
Lagarou, A., Mohd-Sarip, A., Moshkin, Y.M., Chalkley, G.E., Bezstarosti, K., Demmers, J.A., and Verrijzer, C.P. (2008). dKDM2 couples histone H2A ubiquitylation to histone H3 demethylation during Polycomb group silencing. Genes & development 22, 2799-2810.
Langlais, K.K., Brown, J.L., and Kassis, J.A. (2012). Polycomb Group Proteins Bind an engrailed PRE in Both the "ON" and "OFF" Transcriptional States of engrailed. PloS one 7, e48765.
Lee, T.I., Jenner, R.G., Boyer, L.A., Guenther, M.G., Levine, S.S., Kumar, R.M., Chevalier, B., Johnstone, S.E., Cole, M.F., Isono, K., et al. (2006). Control of developmental regulators by Polycomb in human embryonic stem cells. Cell 125, 301-313.
Lelli, K.M., Noro, B., and Mann, R.S. (2011). Variable motif utilization in homeotic selector (Hox)-cofactor complex formation controls specificity. Proceedings of the National Academy of Sciences of the United States of America 108, 21122-21127.
Lelli, K.M., Slattery, M., and Mann, R.S. (2012). Disentangling the many layers of eukaryotic transcriptional regulation. Annual review of genetics 46, 43-68.
Lemons, D., and McGinnis, W. (2006). Genomic evolution of Hox gene clusters. Science 313, 1918-1922.
Levine, M. (2010). Transcriptional enhancers in animal development and evolution. Current biology : CB 20, R754-763.
Levine, M., and Tjian, R. (2003). Transcription regulation and animal diversity. Nature 424, 147-151.
Levine, S.S., King, I.F., and Kingston, R.E. (2004). Division of labor in polycomb group repression. Trends in biochemical sciences 29, 478-485.
Lewis, E.B. (1978). A gene complex controlling segmentation in Drosophila. Nature 276, 565-570.
Lewis, E.B. (1982). Control of body segment differentiation in Drosophila by the bithorax gene complex. Progress in clinical and biological research 85 Pt A, 269-288.
Lewis, J. (2003). Autoinhibition with transcriptional delay: a simple mechanism for the zebrafish somitogenesis oscillator. Current biology : CB 13, 1398-1408.
Li, G., and Reinberg, D. (2011). Chromatin higher-order structures and gene regulation. Current opinion in genetics & development 21, 175-186.
Lickwar, C.R., Mueller, F., Hanlon, S.E., McNally, J.G., and Lieb, J.D. (2012). Genome-wide protein-DNA binding dynamics suggest a molecular clutch for transcription factor function. Nature 484, 251-255.
Lo, S.M., and Francis, N.J. (2010). Inhibition of chromatin remodeling by polycomb group protein posterior sex combs is mechanistically distinct from nucleosome binding. Biochemistry 49, 9438-9448.
125
Lopez, A.J., and Hogness, D.S. (1991). Immunochemical dissection of the Ultrabithorax homeoprotein family in Drosophila melanogaster. Proceedings of the National Academy of Sciences of the United States of America 88, 9924-9928.
Lund, A.H., and van Lohuizen, M. (2004). Polycomb complexes and silencing mechanisms. Current opinion in cell biology 16, 239-246.
Luscombe, N.M., Laskowski, R.A., and Thornton, J.M. (2001). Amino acid-base interactions: a three-dimensional analysis of protein-DNA interactions at an atomic level. Nucleic acids research 29, 2860-2874.
MacArthur, S., Li, X.Y., Li, J., Brown, J.B., Chu, H.C., Zeng, L., Grondona, B.P., Hechmer, A., Simirenko, L., Keranen, S.V., et al. (2009). Developmental roles of 21 Drosophila transcription factors are determined by quantitative differences in binding to an overlapping set of thousands of genomic regions. Genome biology 10, R80.
Mackay, T.F., Richards, S., Stone, E.A., Barbadilla, A., Ayroles, J.F., Zhu, D., Casillas, S., Han, Y., Magwire, M.M., Cridland, J.M., et al. (2012). The Drosophila melanogaster Genetic Reference Panel. Nature 482, 173-178.
Malik, K.T., Poirier, V., Ivins, S.M., and Brown, K.W. (1994). Autoregulation of the human WT1 gene promoter. FEBS letters 349, 75-78.
Mann, R.S. (1994). Engrailed-mediated repression of Ultrabithorax is necessary for the parasegment 6 identity in Drosophila. Development 120, 3205-3212.
Mann, R.S., and Hogness, D.S. (1990). Functional dissection of Ultrabithorax proteins in D. melanogaster. Cell 60, 597-610.
Mann, R.S., Lelli, K.M., and Joshi, R. (2009). Hox specificity unique roles for cofactors and collaborators. Current topics in developmental biology 88, 63-101.
Martinez, A.M., Colomb, S., Dejardin, J., Bantignies, F., and Cavalli, G. (2006). Polycomb group-dependent Cyclin A repression in Drosophila. Genes & development 20, 501-513.
Merabet, S., Saadaoui, M., Sambrani, N., Hudry, B., Pradel, J., Affolter, M., and Graba, Y. (2007). A unique Extradenticle recruitment mode in the Drosophila Hox protein Ultrabithorax. Proceedings of the National Academy of Sciences of the United States of America 104, 16946-16951.
Moore, G.D., Sinclair, D.A., and Grigliatti, T.A. (1983). Histone Gene Multiplicity and Position Effect Variegation in DROSOPHILA MELANOGASTER. Genetics 105, 327-344.
Muller, J., Hart, C.M., Francis, N.J., Vargas, M.L., Sengupta, A., Wild, B., Miller, E.L., O'Connor, M.B., Kingston, R.E., and Simon, J.A. (2002). Histone methyltransferase activity of a Drosophila Polycomb group repressor complex. Cell 111, 197-208.
Muller, J., and Kassis, J.A. (2006). Polycomb response elements and targeting of Polycomb group proteins in Drosophila. Current opinion in genetics & development 16, 476-484.
Negre, N., Hennetin, J., Sun, L.V., Lavrov, S., Bellis, M., White, K.P., and Cavalli, G. (2006). Chromosomal distribution of PcG proteins during Drosophila development. PLoS biology 4, e170.
Nekrasov, M., Klymenko, T., Fraterman, S., Papp, B., Oktaba, K., Kocher, T., Cohen, A., Stunnenberg, H.G., Wilm, M., and Muller, J. (2007). Pcl-PRC2 is needed to generate high levels of H3-K27 trimethylation at Polycomb target genes. The EMBO journal 26, 4078-4088.

126
Nellen, D., Burke, R., Struhl, G., and Basler, K. (1996). Direct and long-range action of a DPP morphogen gradient. Cell 85, 357-368.
Nevozhay, D., Adams, R.M., Murphy, K.F., Josic, K., and Balazsi, G. (2009). Negative autoregulation linearizes the dose-response and suppresses the heterogeneity of gene expression. Proceedings of the National Academy of Sciences of the United States of America 106, 5123-5128.
Ng, M., and Yanofsky, M.F. (2001). Function and evolution of the plant MADS-box gene family. Nature reviews Genetics 2, 186-195.
Niwa, H., Miyazaki, J., and Smith, A.G. (2000). Quantitative expression of Oct-3/4 defines differentiation, dedifferentiation or self-renewal of ES cells. Nature genetics 24, 372-376.
Noro, B., Culi, J., McKay, D.J., Zhang, W., and Mann, R.S. (2006). Distinct functions of homeodomain-containing and homeodomain-less isoforms encoded by homothorax. Genes & development 20, 1636-1650.
Noro, B., Lelli, K., Sun, L., and Mann, R.S. (2011). Competition for cofactor-dependent DNA binding underlies Hox phenotypic suppression. Genes & development 25, 2327-2332.
Noyes, M.B., Christensen, R.G., Wakabayashi, A., Stormo, G.D., Brodsky, M.H., and Wolfe, S.A. (2008). Analysis of homeodomain specificities allows the family-wide prediction of preferred recognition sites. Cell 133, 1277-1289.
Nusslein-Volhard, C., and Wieschaus, E. (1980). Mutations affecting segment number and polarity in Drosophila. Nature 287, 795-801.
Oates, A.C., and Ho, R.K. (2002). Hairy/E(spl)-related (Her) genes are central components of the segmentation oscillator and display redundancy with the Delta/Notch signaling pathway in the formation of anterior segmental boundaries in the zebrafish. Development 129, 2929-2946.
O'Connor, M.B., Binari, R., Perkins, L.A., and Bender, W. (1988). Alternative RNA products from the Ultrabithorax domain of the bithorax complex. The EMBO journal 7, 435-445.
Oktaba, K., Gutierrez, L., Gagneur, J., Girardot, C., Sengupta, A.K., Furlong, E.E., and Muller, J. (2008). Dynamic regulation by polycomb group protein complexes controls pattern formation and the cell cycle in Drosophila. Developmental cell 15, 877-889.
Orenic, T.V., Held, L.I., Jr., Paddock, S.W., and Carroll, S.B. (1993). The spatial organization of epidermal structures: hairy establishes the geometrical pattern of Drosophila leg bristles by delimiting the domains of achaete expression. Development 118, 9-20.
Overdier, D.G., Porcella, A., and Costa, R.H. (1994). The DNA-binding specificity of the hepatocyte nuclear factor 3/forkhead domain is influenced by amino-acid residues adjacent to the recognition helix. Molecular and cellular biology 14, 2755-2766.
Pal Bhadra, M., Bhadra, U., and Birchler, J.A. (1998). Role of multiple trans-acting regulators in modifying the effect of the retrotransposon copia on host gene expression in Drosophila. Molecular & general genetics : MGG 259, 198-206.
Pal-Bhadra, M., Bhadra, U., and Birchler, J.A. (1997). Cosuppression in Drosophila: gene silencing of Alcohol dehydrogenase by white-Adh transgenes is Polycomb dependent. Cell 90, 479-490.
Pal-Bhadra, M., Bhadra, U., and Birchler, J.A. (2002). RNAi related mechanisms affect both transcriptional and posttranscriptional transgene silencing in Drosophila. Molecular cell 9, 315-327.

127
Pal-Bhadra, M., Bhadra, U., and Birchler, J.A. (2004). Interrelationship of RNA interference and transcriptional gene silencing in Drosophila. Cold Spring Harbor symposia on quantitative biology 69, 433-438.
Pal-Bhadra, M., Leibovitch, B.A., Gandhi, S.G., Rao, M., Bhadra, U., Birchler, J.A., and Elgin, S.C. (2004). Heterochromatic silencing and HP1 localization in Drosophila are dependent on the RNAi machinery. Science 303, 669-672.
Pallavi, S.K., and Shashidhara, L.S. (2003). Egfr/Ras pathway mediates interactions between peripodial and disc proper cells in Drosophila wing discs. Development 130, 4931-4941.
Papp, B., and Muller, J. (2006). Histone trimethylation and the maintenance of transcriptional ON and OFF states by trxG and PcG proteins. Genes & development 20, 2041-2054.
Passner, J.M., Ryoo, H.D., Shen, L., Mann, R.S., and Aggarwal, A.K. (1999). Structure of a DNA-bound Ultrabithorax-Extradenticle homeodomain complex. Nature 397, 714-719.
Peng, J.C., and Karpen, G.H. (2007). H3K9 methylation and RNA interference regulate nucleolar organization and repeated DNA stability. Nature cell biology 9, 25-35.
Perry, M.W., Boettiger, A.N., Bothma, J.P., and Levine, M. (2010). Shadow enhancers foster robustness of Drosophila gastrulation. Current biology : CB 20, 1562-1567.
Pourquie, O. (2011). Vertebrate segmentation: from cyclic gene networks to scoliosis. Cell 145, 650-663.
Reed, H.C., Hoare, T., Thomsen, S., Weaver, T.A., White, R.A., Akam, M., and Alonso, C.R. (2010). Alternative splicing modulates Ubx protein function in Drosophila melanogaster. Genetics 184, 745-758.
Reinitz, J., and Levine, M. (1990). Control of the initiation of homeotic gene expression by the gap genes giant and tailless in Drosophila. Developmental biology 140, 57-72.
Rieckhof, G.E., Casares, F., Ryoo, H.D., Abu-Shaar, M., and Mann, R.S. (1997). Nuclear translocation of extradenticle requires homothorax, which encodes an extradenticle-related homeodomain protein. Cell 91, 171-183.
Ringrose, L., Rehmsmeier, M., Dura, J.M., and Paro, R. (2003). Genome-wide prediction of Polycomb/Trithorax response elements in Drosophila melanogaster. Developmental cell 5, 759-771.
Rohs, R., Jin, X., West, S.M., Joshi, R., Honig, B., and Mann, R.S. (2010). Origins of specificity in protein-DNA recognition. Annual review of biochemistry 79, 233-269.
Rohs, R., West, S.M., Sosinsky, A., Liu, P., Mann, R.S., and Honig, B. (2009). The role of DNA shape in protein-DNA recognition. Nature 461, 1248-1253.
Rosenberg, N.A., Pritchard, J.K., Weber, J.L., Cann, H.M., Kidd, K.K., Zhivotovsky, L.A., and Feldman, M.W. (2002). Genetic structure of human populations. Science 298, 2381-2385.
Rosenfeld, N., Elowitz, M.B., and Alon, U. (2002). Negative autoregulation speeds the response times of transcription networks. Journal of molecular biology 323, 785-793.
Rowan, S., Siggers, T., Lachke, S.A., Yue, Y., Bulyk, M.L., and Maas, R.L. (2010). Precise temporal control of the eye regulatory gene Pax6 via enhancer-binding site affinity. Genes & development 24, 980-985.
Ryoo, H.D., and Mann, R.S. (1999). The control of trunk Hox specificity and activity by Extradenticle. Genes & development 13, 1704-1716.
Sanchez-Herrero, E., Vernos, I., Marco, R., and Morata, G. (1985). Genetic organization of Drosophila bithorax complex. Nature 313, 108-113.

128
Sansom, S.N., Griffiths, D.S., Faedo, A., Kleinjan, D.J., Ruan, Y., Smith, J., van Heyningen, V., Rubenstein, J.L., and Livesey, F.J. (2009). The level of the transcription factor Pax6 is essential for controlling the balance between neural stem cell self-renewal and neurogenesis. PLoS genetics 5, e1000511.
Schedl, A., Ross, A., Lee, M., Engelkamp, D., Rashbass, P., van Heyningen, V., and Hastie, N.D. (1996). Influence of PAX6 gene dosage on development: overexpression causes severe eye abnormalities. Cell 86, 71-82.
Scheuermann, J.C., de Ayala Alonso, A.G., Oktaba, K., Ly-Hartig, N., McGinty, R.K., Fraterman, S., Wilm, M., Muir, T.W., and Muller, J. (2010). Histone H2A deubiquitinase activity of the Polycomb repressive complex PR-DUB. Nature 465, 243-247.
Schmidt, D., Wilson, M.D., Ballester, B., Schwalie, P.C., Brown, G.D., Marshall, A., Kutter, C., Watt, S., Martinez-Jimenez, C.P., Mackay, S., et al. (2010). Five-vertebrate ChIP-seq reveals the evolutionary dynamics of transcription factor binding. Science 328, 1036-1040.
Schmitt, S., Prestel, M., and Paro, R. (2005). Intergenic transcription through a polycomb group response element counteracts silencing. Genes & development 19, 697-708.
Schotta, G., Ebert, A., Krauss, V., Fischer, A., Hoffmann, J., Rea, S., Jenuwein, T., Dorn, R., and Reuter, G. (2002). Central role of Drosophila SU(VAR)3-9 in histone H3-K9 methylation and heterochromatic gene silencing. The EMBO journal 21, 1121-1131.
Schroter, C., Herrgen, L., Cardona, A., Brouhard, G.J., Feldman, B., and Oates, A.C. (2008). Dynamics of zebrafish somitogenesis. Developmental dynamics : an official publication of the American Association of Anatomists 237, 545-553.
Schwartz, Y.B., Kahn, T.G., Nix, D.A., Li, X.Y., Bourgon, R., Biggin, M., and Pirrotta, V. (2006). Genome-wide analysis of Polycomb targets in Drosophila melanogaster. Nature genetics 38, 700-705.
Seeman, N.C., Rosenberg, J.M., and Rich, A. (1976). Sequence-specific recognition of double helical nucleic acids by proteins. Proceedings of the National Academy of Sciences of the United States of America 73, 804-808.
Segal, E., Raveh-Sadka, T., Schroeder, M., Unnerstall, U., and Gaul, U. (2008). Predicting expression patterns from regulatory sequence in Drosophila segmentation. Nature 451, 535-540.
Sengupta, A.K., Kuhrs, A., and Muller, J. (2004). General transcriptional silencing by a Polycomb response element in Drosophila. Development 131, 1959-1965.
Shao, Z., Raible, F., Mollaaghababa, R., Guyon, J.R., Wu, C.T., Bender, W., and Kingston, R.E. (1999). Stabilization of chromatin structure by PRC1, a Polycomb complex. Cell 98, 37-46.
Shen-Orr, S.S., Milo, R., Mangan, S., and Alon, U. (2002). Network motifs in the transcriptional regulation network of Escherichia coli. Nature genetics 31, 64-68.
Siggers, T., Duyzend, M.H., Reddy, J., Khan, S., and Bulyk, M.L. (2011). Non-DNA-binding cofactors enhance DNA-binding specificity of a transcriptional regulatory complex. Molecular systems biology 7, 555.
Simon, J., Peifer, M., Bender, W., and O'Connor, M. (1990). Regulatory elements of the bithorax complex that control expression along the anterior-posterior axis. The EMBO journal 9, 3945-3956.
Sing, A., Pannell, D., Karaiskakis, A., Sturgeon, K., Djabali, M., Ellis, J., Lipshitz, H.D., and Cordes, S.P. (2009). A vertebrate Polycomb response element governs segmentation of the posterior hindbrain. Cell 138, 885-897.
129
Sisodiya, S.M., Free, S.L., Williamson, K.A., Mitchell, T.N., Willis, C., Stevens, J.M., Kendall, B.E., Shorvon, S.D., Hanson, I.M., Moore, A.T., et al. (2001). PAX6 haploinsufficiency causes cerebral malformation and olfactory dysfunction in humans. Nature genetics 28, 214-216.
Skeath, J.B., and Carroll, S.B. (1991). Regulation of achaete-scute gene expression and sensory organ pattern formation in the Drosophila wing. Genes & development 5, 984-995.
Slattery, M., Ma, L., Negre, N., White, K.P., and Mann, R.S. (2011). Genome-wide tissue-specific occupancy of the Hox protein Ultrabithorax and Hox cofactor Homothorax in Drosophila. PloS one 6, e14686.
Slattery, M., Riley, T., Liu, P., Abe, N., Gomez-Alcala, P., Dror, I., Zhou, T., Rohs, R., Honig, B., Bussemaker, H.J., et al. (2011). Cofactor binding evokes latent differences in DNA binding specificity between Hox proteins. Cell 147, 1270-1282.
Small, S., Arnosti, D.N., and Levine, M. (1993). Spacing ensures autonomous expression of different stripe enhancers in the even-skipped promoter. Development 119, 762-772.
Smolik-Utlaut, S.M. (1990). Dosage requirements of Ultrabithorax and bithoraxoid in the determination of segment identity in Drosophila melanogaster. Genetics 124, 357-366.
Stern, D.L. (1998). A role of Ultrabithorax in morphological differences between Drosophila species. Nature 396, 463-466.
Storey, J.D., Madeoy, J., Strout, J.L., Wurfel, M., Ronald, J., and Akey, J.M. (2007). Gene-expression variation within and among human populations. American journal of human genetics 80, 502-509.
Strubbe, G., Popp, C., Schmidt, A., Pauli, A., Ringrose, L., Beisel, C., and Paro, R. (2011). Polycomb purification by in vivo biotinylation tagging reveals cohesin and Trithorax group proteins as interaction partners. Proceedings of the National Academy of Sciences of the United States of America 108, 5572-5577.
Struhl, G., and Akam, M. (1985). Altered distributions of Ultrabithorax transcripts in extra sex combs mutant embryos of Drosophila. The EMBO journal 4, 3259-3264.
Struhl, G., Struhl, K., and Macdonald, P.M. (1989). The gradient morphogen bicoid is a concentration-dependent transcriptional activator. Cell 57, 1259-1273.
Struhl, G., and White, R.A. (1985). Regulation of the Ultrabithorax gene of Drosophila by other bithorax complex genes. Cell 43, 507-519.
Subramaniam, V., Bomze, H.M., and Lopez, A.J. (1994). Functional differences between Ultrabithorax protein isoforms in Drosophila melanogaster: evidence from elimination, substitution and ectopic expression of specific isoforms. Genetics 136, 979-991.
Tam, P.P. (1981). The control of somitogenesis in mouse embryos. Journal of embryology and experimental morphology 65 Suppl, 103-128.
Tanay, A. (2006). Extensive low-affinity transcriptional interactions in the yeast genome. Genome research 16, 962-972.
Thattai, M., and van Oudenaarden, A. (2001). Intrinsic noise in gene regulatory networks. Proceedings of the National Academy of Sciences of the United States of America 98, 8614-8619.
Thieffry, D., Salgado, H., Huerta, A.M., and Collado-Vides, J. (1998). Prediction of transcriptional regulatory sites in the complete genome sequence of Escherichia coli K-12. Bioinformatics 14, 391-400.

130
Thuringer, F., and Bienz, M. (1993). Indirect autoregulation of a homeotic Drosophila gene mediated by extracellular signaling. Proceedings of the National Academy of Sciences of the United States of America 90, 3899-3903.
Thuringer, F., Cohen, S.M., and Bienz, M. (1993). Dissection of an indirect autoregulatory response of a homeotic Drosophila gene. The EMBO journal 12, 2419-2430.
Tolhuis, B., de Wit, E., Muijrers, I., Teunissen, H., Talhout, W., van Steensel, B., and van Lohuizen, M. (2006). Genome-wide profiling of PRC1 and PRC2 Polycomb chromatin binding in Drosophila melanogaster. Nature genetics 38, 694-699.
Vaquerizas, J.M., Kummerfeld, S.K., Teichmann, S.A., and Luscombe, N.M. (2009). A census of human transcription factors: function, expression and evolution. Nature reviews Genetics 10, 252-263.
Waddington, C.H. (1959). Canalization of development and genetic assimilation of acquired characters. Nature 183, 1654-1655.
Wagner, A. (2000). Robustness against mutations in genetic networks of yeast. Nature genetics 24, 355-361.
Wallrath, L.L., and Elgin, S.C. (1995). Position effect variegation in Drosophila is associated with an altered chromatin structure. Genes & development 9, 1263-1277.
Weatherbee, S.D., Halder, G., Kim, J., Hudson, A., and Carroll, S. (1998). Ultrabithorax regulates genes at several levels of the wing-patterning hierarchy to shape the development of the Drosophila haltere. Genes & development 12, 1474-1482.
White, R.A., and Lehmann, R. (1986). A gap gene, hunchback, regulates the spatial expression of Ultrabithorax. Cell 47, 311-321.
White, R.A., and Wilcox, M. (1984). Protein products of the bithorax complex in Drosophila. Cell 39, 163-171.
White, R.A., and Wilcox, M. (1985). Distribution of Ultrabithorax proteins in Drosophila. The EMBO journal 4, 2035-2043.
Woo, C.J., Kharchenko, P.V., Daheron, L., Park, P.J., and Kingston, R.E. (2010). A region of the human HOXD cluster that confers polycomb-group responsiveness. Cell 140, 99-110.
Zacharias, H. (1995). Emil Heitz (1892-1965): chloroplasts, heterochromatin, and polytene chromosomes. Genetics 141, 7-14.
Zhang, W., Jin, Y., Ji, Y., Girton, J., Johansen, J., and Johansen, K.M. (2003). Genetic and phenotypic analysis of alleles of the Drosophila chromosomal JIL-1 kinase reveals a functional requirement at multiple developmental stages. Genetics 165, 1341-1354.

131
APPENDIX 1 The first section of this appendix contains data that is relevant to the work discussed in Chapter
2. The second figure is not directly related to the work in Chapter 2, but also concerns Ubx regulation in
the developing haltere imaginal disc.
The abx1 deletion: other enhancers at Ubx contribute to the bias in Ubx levels along the
haltere P-D axis
While the enhancer element that we identify, abxF, is sufficient to capture Ubx negative
autoregulation and establish the haltere disc P-D bias in Ubx levels, it may not be the only such enhancer
element at Ubx. An analysis of the Ubx expression pattern in abx1 mutants is consistent with this idea.
abx1 is a 6.8kb deletion at the Ubx locus that encompasses abxF (Figure A1.C). The Ubx
expression pattern in abx1/Def109 haltere discs is shown in Figure A1.1A. Ubx is lost from the A
compartment in most animals, and is expressed exclusively in the P compartment. Interestingly, Ubx
levels in the posterior pouch are still ~2-fold higher than Ubx levels in the proximal P compartment in
these animals (Figure A1.1D and A1.1A). This indicates that there is an enhancer element outside the
abx1 deleted region that is capable of conferring this P-D bias, and thus Ubx negative autoregulation. In
some animals, Ubx expression is still seen in the A compartment.
Making mitotic clones that are homozygous for abx1 eliminates Ubx expression in almost all
anterior compartment clones in both the pouch and proximal domains of the haltere (Figure A1.B). This
indicates that the deleted region contains elements critical to drive anterior compartment expression.
Consistent with the haltere expression pattern of abx1/Def109 animals, these clones have no effect on
clones in the posterior compartment.
More than one Ubx binding site in the 1.3kb abxF element?
We have created an abxF transgenic enhancer that lacks the most distal 112bp from the abxN
element, called abxFd112. This region, which represents a peak of high conservation, also contains all

132
four of the binding sites tested in vivo in the context of abxN, including the binding site we ultimately
found, UbxAE. The expression pattern of abxFd112 indicates that the P-D bias is mostly, but not entirely
gone (Figure A1.E). In most of the pouch, lacZ levels look the same as they do proximally. However,
there is still high lacZ expression in a stripe across the dorsal pouch. This may indicate that this element
captures other inputs that drive high lacZ expression in this region, or it may indicate an incomplete
elimination of the Ubx autoregulatory repressive inputs at this enhancer.
Increases in Ubx+ copy number reduce the P-D expression ratio.
Although increasing Ubx+ copy number increases Ubx expression levels in both the proximal and
distal domains, proximal expression levels are increased to a lesser extent than distal levels. Performing
confocal imagery on thick slices using the same settings for 2xUbx and 6xUbx discs reveals that although
the Proximal/Distal (P/D) ratio in 2x animals is 0.41, the P/D ratio in 6x animals is 0.33 (Figure A1.D).
This decrease in proximal relative to distal levels is due to the fact that proximal levels have increased
less relative to distal levels. Proximal levels in 6xUbx animals are 1.68 times their 2x levels; Distal levels
in 6x animals are 2.2 times their 6x levels. This suggests a link between the Ubx negative autoregulatory
mechanism we describe in Chapter 2, and the buffering mechanism discussed in Chapter 3. Stronger
Ubx negative autoregulation in the proximal relative to distal domain may lead to more effective
buffering of Ubx levels in response to Ubx dose in the proximal relative to distal domain.

133
Figure A1.1: Analysis of the abx1 deletion: (A) Haltere expression pattern of the abx1 allele, as visualized in abx1/Def109 animals. All Ubx in these animals is derived from the abx1 allele, and there is no effect from transvection. abx1 drives Ubx throughout the posterior compartment, at higher levels distally than proximally. There is no anterior compartment expression in most discs. Occasionally, anterior compartment expression is observed at what look to be uniform but low (proximal-like) levels. (B) Making mitotic clones that are homozygous for abx1 have consistent effects on Ubx expression. Ubx expression is unaffected in P compartment clones, but lost in A compartment clones. In rare cases, Ubx is not lost, but unaffected in A compartment clones (yellow arrow). (C) A map of the Ubx locus showing approximate relative locations of the abxF enhancer and the abx1 deletion. (D) Quantifications, taken via pixel intensities from confocal slices, of the proximal versus distal (P/D) expression ratio of Ubx in 2xUbx+, 6xUbx+, and abx1/Def109 animals. (E) The expression pattern of the abxFd112-lacZ construct. This construct is the 1.3kb abxF element, containing an internal deletion for 112bp that comprise the distal tip of the abxN element. These 112bp represent a peak of high conservation, and also contain the UbxAE binding site we identified in Chapter 2.
An anterior-posterior bias for hs:Ubx induced negative autoregulation
Driving Ubx overexpression using hs:Ubx constructs has been shown to elicit a clonal and
heritable loss of Ubx in haltere imaginal disc cells, as well as in the embryonic epidermis (Irvine et al.,
1993). We noticed that such loss of Ubx clones, in response to hs:Ubx driven pulses of Ubx

134
overexpression, is only observed in the anterior compartment of the haltere, not the posterior. In our
experiments, we found over 40 clones in the anterior compartment that showed a loss of Ubx, whereas
no clones in the posterior compartment lost Ubx in response to hs:Ubx. This difference is too great to be
accounted for by the difference in size between the anterior and posterior compartments (roughly a 3:1
ratio) of the haltere (Crickmore and Mann, 2006).
Spalt binds the Ubx locus
We performed a Chromatin Immunoprecipitation starting from haltere imaginal discs for the
transcription factor Spalt. Spalt is expressed broadly in the dorsal proximal domain of both the wing and
the haltere. In the wing, Spalt is also expressed in a broad A-P stripe in the pouch. In the haltere, its
expression here is repressed by Ubx. Although Ubx represses spalt in the distal haltere, it is unclear if
Spalt regulates Ubx (Galant et al., 2002). We find that it is bound at the Ubx locus at our abxF enhancer
as well as the Ubx transcription start site (Figure A1.2). The biological relevance of this binding is
unclear. We tested two Spalt antibodies and found that only one (Rb26) works well in ChIP assays. These
data represent results from a single immunoprecipitation; replicates were not done.
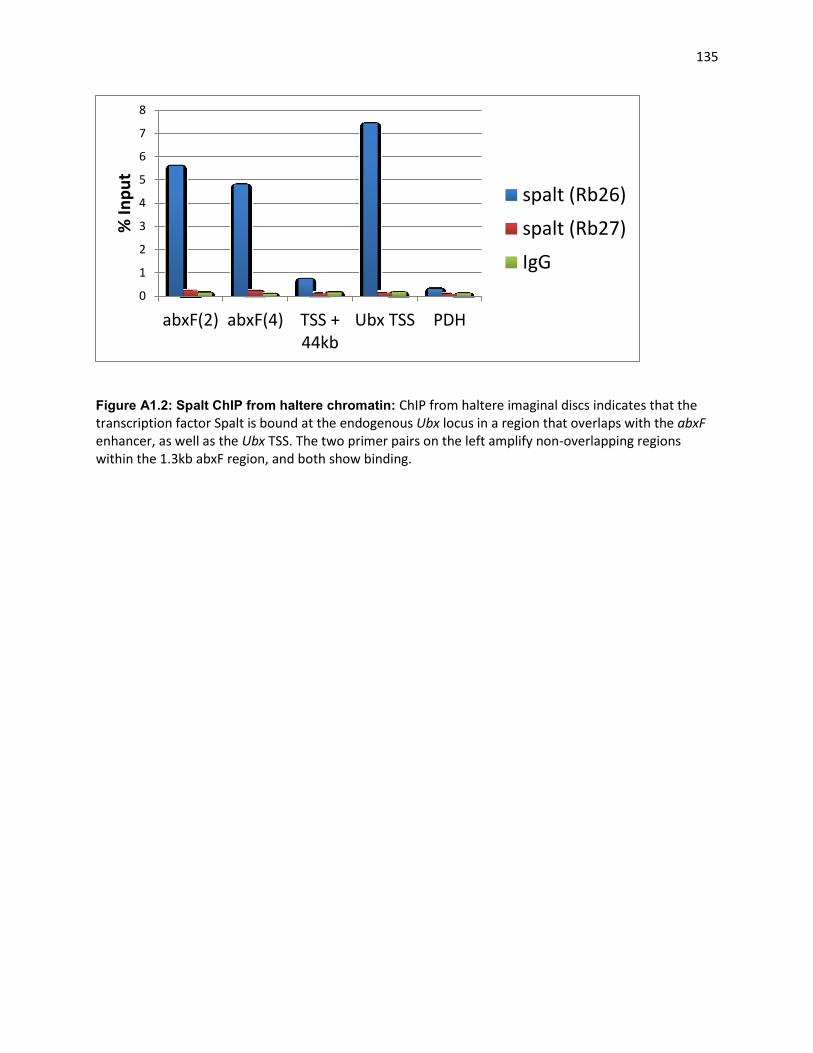
135
Figure A1.2: Spalt ChIP from haltere chromatin: ChIP from haltere imaginal discs indicates that the transcription factor Spalt is bound at the endogenous Ubx locus in a region that overlaps with the abxF enhancer, as well as the Ubx TSS. The two primer pairs on the left amplify non-overlapping regions within the 1.3kb abxF region, and both show binding.
0
1
2
3
4
5
6
7
8
abxF(2) abxF(4) TSS +44kb
Ubx TSS PDH
% In
pu
t
spalt (Rb26)
spalt (Rb27)
IgG

136
APPENDIX 2
This appendix contains data related to the work described in Chapter 3. All of the experiments
summarized here are ChIP-qPCR for various proteins in lab strain versus outcross induced silenced
conditions. In all cases, chromatin was isolated from imaginal discs.
RNA PolII binding at Ubx in SR1
Starting from haltere imaginal disc chromatin, we assayed the binding of total RNA PolII and
elongating RNA PolII (CTD Ser2p) at various locations along the Ubx locus. Importantly, because
chromatin was isolated from heterozygous animals of two genotypes – SR1/TM6B and Ubx-
Gal4lac1/TM6B – these results cannot distinguish between RNA PolII binding at the two different alleles
within a genotype. The exception to this is the primers used to probe this region are specific for one
allele (the allele containing the Gal4 insertion).
Nevertheless, we can make several conclusions. First, we find that elongating RNA PolII is bound
at lower levels in the SR1 strain than the lab Ubx-Gal4 strain. This is consistent with our observations
that Gal4 is transcriptionally silenced in SR1. Secondly, we find that elongating RNA PolII is bound at
higher levels across the length of the Ubx locus in the SR1 relative to lab Ubx-Gal4 strain. These signals
reflect binding at both copies of Ubx in each genotype: the Ubx-Gal4lac1 allele and the TM6B allele. Given
our finding that RNA-PolII is decreased at the Gal4 locus in SR1/TM6B animals, it is likely that this
reflects an increase in transcriptional elongation at the TM6B allele, but not the SR1 allele. Total RNA
PolII levels looks mostly similar across the Ubx locus, except at the Ubx transcription start site and the
bxPRE. At both of these locations, RNAPolII binding is greater in the SR1 than lab condition. The
relevance of this is unclear.

137
H3K4me3 binding at Ubx in SR1
The binding of H3K4me3, a histone modification associated with active chromatin, is present at
lower levels in SR1/TM6B haltere chromatin relative to the lab Ubx-Gal4lac1/TM6B haltere chromatin.
This is consistent with our genetic data showing that Ubx-Gal4lac1 is transcriptionally silenced in the SR1
condition. It also extends our observations at the Gal-4 insertion to the entire Ubx-Gal4 allele, because
these primers amplidy sequences outside the Gal-4 sequence.

138
Figure A2.1: ChIP for RNAPolII and H3K4me3 in SR1 haltere discs: (A) ChIP for elongating RNA-PolII, done with an antibody specific for RNA-PolII CTD Ser2p. All coordinates listed are relative to the Ubx transcription start site (TSS). Dark green bars represent binding in the SR1 (silenced) genotype; black bars represent binding in the lab (Ubx-Gal4lac1/TM6B) genotype. (B) A schematic indicating various landmarks at the Ubx locus, including the approximate location of the Gal-4lac1 insertion. (C) A ChIP for total RNA PolII. (D) A ChIP for H3K4me3, a chromatin modification associated with active transcription. Again, dark green bars represent binding in the SR1 genotype and black bars represent binding in the lab genotype.

139
H3K27me3 binding at Ubx in F1 outcross hybrid versus lab strain animals
We assayed the binding of H3K27me3 in our lab strain versus F1 outcross hybrid conditions by
performing ChIP from imaginal discs. H3K27me3 is a mark that is associated with PcG mediated
repression. Consistent with our genetic data in Chapter 3, in which we fail to see a relief of wild-DNA
induced silencing in Pcl mutant clones, we also fail to see a change in H3K27me3 in silenced versus lab
(non-silenced) conditions. We probed H3K27me3 at four regions across the Ubx locus. Given that PcG
induced silencing is associated with broad regions of H3K27me3, the resolution of our assay should be
sufficient to detect any such changes in chromatin modifications. Together with our genetic data, these
results argue against a role for the PcG genes in outcross induced Ubx-Gal4lac1 silencing. It is worth
noting that these ChIP data represent results from a single immunoprecipitation; replicates have not
been done.
Figure A2.2: H3K27me3 binding in F1 hybrid and lab strain imaginal discs: Chromatin was isolated
from haltere and 3rd leg imaginal discs of two genotypes: Ubx-Gal4lac1/TM6B and F1 hybrids between
Ubx-Gal4lac1 and CO-3. Binding to H3K27me3 was assayed via ChIP followed by qPCR. No significant

140
change was found in H3K27me3 occupancy at the Ubx locus between the two genotypes. The primers
are the same ones used in Papp and Muller, 2006 (sequences are in their Supplementary Methods).
Papp1 is 38kb upstream of the Ubx TSS; Papp4 is at the bxdPRE, about 30kb upstream of the Ubx TSS;
Papp7 is 16kb upstream of the Ubx TSS; Papp16 is in the third intron of Ubx, about 71kb downstream of
the Ubx TSS; Papp 18 is a control primer pair, located in Abd-B.

141
APPENDIX 3
Crickmore M., Ranade V., and Mann, R.S. “Regulation of Ubx Expression by Epigenetic Enhancer
Silencing in Response to Ubx Levels and Genetic Variation” PLoS Genetics, 2009 Sep;5(9):e1000633. doi:
10.1371/journal.pgen.1000633. Epub 2009 Sep 4.
This paper, included as an appendix, forms the foundation of my work in Chapter 3. I was second
author on this paper and my specific contributions are as follows: Figure 6 and Supplementary Figure 3
are entirely my work. I also generated half of the data in Supplementary Figure 4 and contributed
partially to Figure 4 and Figure 5. The remainder of the work in this paper was done by Michael
Crickmore, a former graduate student in the lab.
Regulation of Ubx Expression by Epigenetic EnhancerSilencing in Response to Ubx Levels and GeneticVariationMichael A. Crickmore1¤, Vikram Ranade2, Richard S. Mann3*
1 Department of Biological Sciences, Columbia University, New York, New York, United States of America, 2 Department of Genetics and Development, Columbia
University, New York, New York, United States of America, 3 Department of Biochemistry and Molecular Biophysics, Columbia University, New York, New York, United
States of America
Abstract
For gene products that must be present in cells at defined concentrations, expression levels must be tightly controlled toensure robustness against environmental, genetic, and developmental noise. By studying the regulation of theconcentration-sensitive Drosophila melanogaster Hox gene Ultrabithorax (Ubx), we found that Ubx enhancer activitiesrespond to both increases in Ubx levels and genetic background. Large, transient increases in Ubx levels are capable ofsilencing all enhancer input into Ubx transcription, resulting in the complete silencing of this gene. Small increases in Ubxlevels, brought about by duplications of the Ubx locus, cause sporadic silencing of subsets of Ubx enhancers. Ubx enhancersilencing can also be induced by outcrossing laboratory stocks to D. melanogaster strains established from wild flies fromaround the world. These results suggest that enhancer activities are not rigidly determined, but instead are sensitive togenetic background. Together, these findings suggest that enhancer silencing may be used to maintain gene product levelswithin the correct range in response to natural genetic variation.
Citation: Crickmore MA, Ranade V, Mann RS (2009) Regulation of Ubx Expression by Epigenetic Enhancer Silencing in Response to Ubx Levels and GeneticVariation. PLoS Genet 5(9): e1000633. doi:10.1371/journal.pgen.1000633
Editor: David L. Stern, Princeton University, Howard Hughes Medical Institute, United States of America
Received July 13, 2009; Accepted August 5, 2009; Published September 4, 2009
Copyright: � 2009 Crickmore et al. This is an open-access article distributed under the terms of the Creative Commons Attribution License, which permitsunrestricted use, distribution, and reproduction in any medium, provided the original author and source are credited.
Funding: This work was supported by NIH grants GM054510 and GM058575 to RSM. MAC was supported by NIH training grants DK07328 and GM008798. Thefunders had no role in study design, data collection and analysis, decision to publish, or preparation of the manuscript.
Competing Interests: The authors have declared that no competing interests exist.
* E-mail: [email protected]
¤ Current address: Laboratory of Neurogenetics and Behavior, The Rockefeller University, New York, New York, United States of America
Introduction
The transcriptional control of gene expression in eukaryotes is
governed by cis-regulatory elements, also known as enhancers, that
integrate cell-type and temporal information by binding combina-
tions of transcription factors. Genes that exhibit complex expression
patterns are typically controlled by multiple cis-regulatory elements,
some of which have overlapping, partially redundant activities
[1,2,3,4]. Current estimates suggest that from 10 to 80% of the non-
coding DNA of higher eukaryotes is devoted to gene regulation
[5,6,7], raising the question of how all of this regulatory information
is integrated to generate accurate and stereotyped patterns of gene
expression in space and time. A third dimension of gene regulation
is quantity, which is especially relevant for genes that must be
expressed within a narrow range of levels. One possible solution is
that enhancers are precisely tuned to generate the appropriate level
of transcription that is required in each cell. However, the precision
that this type of mechanism demands seems difficult to achieve and
especially vulnerable to genetic, environmental, and developmental
noise. An alternative solution is that feedback or other regulatory
mechanisms exist that modulate enhancer activities in response to
the levels of gene product. Although feedback autoregulation is a
well-known motif in transcriptional networks [8], mechanisms that
might be used to tune expression levels are not well understood.
This problem is particularly challenging for genes that have
multiple, partially redundant regulatory inputs.
We have begun to study this problem in the fruit fly, Drosophila
melanogaster, by analyzing the mechanisms that control the expression
of the Hox gene Ultrabithorax (Ubx) in the haltere–a dorsal appendage
on the third thoracic segment (T3) that helps the fly balance during
flight [9]. Although Ubx protein is detected in all cells of the
developing haltere imaginal disc, its pattern of expression is not
uniform [10] (Figure 1A). Subsets of the complex regulatory input
into the Ubx locus can be monitored by examining the expression
patterns of Ubx enhancer traps, which exhibit different, overlapping
subsets of the Ubx expression pattern (Figure 1). Ubx-Gal4lac1, for
example, (monitored with UAS-GFP) is expressed uniformly through-
out the anterior (A) compartment of the haltere disc, but only in the
distal portion of the posterior (P) compartment (Figure 1B). In
contrast, Ubx-Gal4LDN is expressed in distal regions (in both the A and
P compartments) but is not expressed proximally (Figure 1D).
Results/Discussion
Ubx negative autoregulationSomewhat paradoxically, transient ectopic expression of Ubx,
induced either by heat shock or Gal4-mediated expression,
resulted in Ubx loss-of-function transfomations that can be
visualized both in the adult (as haltere to wing transformations;
[11]) and in 3rd instar haltere imaginal discs (as groups of cells that
showed a reduction or complete loss of Ubx protein) [12]
PLoS Genetics | www.plosgenetics.org 1 September 2009 | Volume 5 | Issue 9 | e1000633
fabio
Typewritten Text
fabio
Typewritten Text
fabio
Typewritten Text
142
fabio
Typewritten Text

(Figure 2). Thus, a transient pulse of high Ubx protein levels can
lead to the complete and heritable silencing of all Ubx expression,
implying that Ubx is being silenced by its own gene product.
Transient pulses of ectopic Ubx also resulted in the stable
silencing of Ubx enhancer traps, including Ubx-Gal4lac1, Ubx-
Gal4M1, Ubx-Gal4LDN, and Ubx-lacZ166 (Figure 2 and Table S1).
When the absence of Ubx protein was observed, these cells also
had no enhancer trap expression (Figure 2). However, in many
cases enhancer trap silencing was observed in cells that had
normal Ubx protein levels (Figure 2). In these cases we suggest that
only the enhancers captured by the enhancer trap were silenced,
and that other, partially redundant, enhancers in the Ubx locus
remained active, resulting in an apparently normal pattern of Ubx
expression. We also find, consistent with previous results [12], that
the patches of Ubx-silenced cells in the haltere are clonal events
and that the Polycomb system of epigenetic regulators is required
for silencing (Figure S1 and Figure S2).
To obtain initial mechanistic insights into Ubx autoregulatory
silencing, we carried out experiments that suggest it requires specific
DNA binding by Ubx. For these experiments, we monitored the
ability of chimeric Hox proteins to induce haltere-to-wing
transformations when expressed via the vg-Gal4 driver. Although
the more anterior Hox protein Antennapedia (Antp) was unable to
induce Ubx silencing, transient overexpression of Antp-Ubx
chimeric proteins revealed that the Ubx homeodomain and
adjacent C-terminal sequences were both necessary and together
sufficient to induce robust Ubx silencing (Figure 3). These findings
suggest that Ubx protein, and not Ubx mRNA, is responsible for the
induction of silencing. Further, as both the homeodomain and
adjacent sequences are implicated in Ubx specificity and DNA
binding [13,14,15], these results suggest that Ubx triggers silencing
Figure 1. Ubx enhancer traps. (A) Haltere disc stained for Ubx protein. Note the higher levels in the center of the disc and in the P compartment(arrow). (B–G) Patterns of Ubx enhancer trap expression in wild type haltere discs. The Gal4 inserts were monitored using a UAS-GFP transgene. (H)Map of the Ubx locus showing the location of the Ubx enhancer traps as described previously [28,29,30].doi:10.1371/journal.pgen.1000633.g001
Author Summary
Gene expression is generally governed by cis-regulatoryelements, also called enhancers. For genes whose expres-sion levels must be tightly controlled, enhancer activitiesmust be tightly regulated. In this work, we show thatenhancers that control the expression of the Hox geneUltrabithorax (Ubx) in Drosophila are regulated by anegative autoregulatory feedback mechanism. Negativeautoregulation can be triggered by less than a two-foldincrease in Ubx levels or by varying the genetic back-ground. Together, these data reveal that enhanceractivities are not always hardwired, but instead may besensitive to genetic and environmental variation and, insome cases, to the amount of gene product they regulate.The finding that enhancers are sensitive to geneticbackground suggests that the regulation of gene expres-sion is more plastic than previously thought and hasimportant implications for how transcription is controlledin vivo.
Enhancer Silencing at Ubx
PLoS Genetics | www.plosgenetics.org 2 September 2009 | Volume 5 | Issue 9 | e1000633
fabio
Typewritten Text
143

by binding to Ubx-specific cis-regulatory elements. Consistently, the
Hox protein Abdominal-A (Abd-A), which is very similar to Ubx in
both domains, also induced Ubx silencing when transiently
expressed during haltere development (Figure 3).
Ubx enhancer silencing triggered by additional copies ofthe Ubx+ gene
We next tested whether more subtle increases in Ubx levels
could also induce silencing. For these experiments, we monitored
the expression of Ubx lacZ or Gal4 enhancer traps in flies that had
extra copies of the wild type Ubx locus. Ubx-Gal4lac1 and Ubx-
Gal4LDN were silenced in groups of haltere cells of 3x Ubx+ and 4x
Ubx+ flies (100% of 4x Ubx+ haltere discs had at least one group of
silenced cells) (Figure 4A–4D; Table S1). In these haltere discs,
probably because the flies had multiple copies of Ubx+, the pattern
of Ubx protein was invariably wild type (Figure 4A, 4B, 4D).
Interestingly, the amount of silencing induced by 4 copies of Ubx
was significantly decreased when one of these copies encoded a
non-functional Ubx protein (the Ubx9–22 allele; data not shown).
This result supports the idea that Ubx protein, not Ubx mRNA, is
Figure 2. Ubx enhancer silencing in response to hs-Ubx. (A) Wild type haltere disc stained for Ubx protein. Note the higher levels in the distalregion. (B) Haltere disc in which an HA-tagged Ubx protein was expressed via the vg-Gal4 driver, which is transiently expressed in all haltere cells. Thedisc was stained for HA (green) and Ubx (red). At this stage, the vg-Gal4 driver is active along the dorso-ventral boundary (strong green and yellowstain). Groups of cells that do not stain for Ubx (arrow) are observed. (C) Adult haltere from a vg.Ubx fly showing a transformation from haltere towing. Both wing margin (arrow) and wing blade (arrowhead) tissue is observed. (D,E) Ubx-Gal4M1 (D) and Ubx-Gal4lac1 (E) haltere discs that were givena transient pulse of Ubx expression by heat shock during the 2nd instar, stained for GFP (green, to monitor enhancer trap activities) and Ubx (red).Some cells no longer express the enhancer traps and Ubx (arrows). Some cells no longer express the enhancer traps, but still express Ubx(arrowheads). (F) Wild type Ubx-Gal4LDN haltere disc stained for GFP (green, to monitor the enhancer trap) and Ubx (red). (G) A Ubx-Gal4LDN halteredisc that was given a transient pulse of Ubx expression by heat shock during the 2nd instar, stained for Ubx (red) and GFP (green, to monitor theenhancer trap). Silencing of both Ubx and the enhancer trap are observed (arrows). Surrounding the Ubx silenced cells, some cells have reduced Ubxlevels but still express the enhancer trap.doi:10.1371/journal.pgen.1000633.g002
Enhancer Silencing at Ubx
PLoS Genetics | www.plosgenetics.org 3 September 2009 | Volume 5 | Issue 9 | e1000633
fabio
Typewritten Text
144

the inducer of silencing in response to extra copies of the Ubx
locus.
Ubx-Gal4M1 and Ubx-lacZlac1 responded differently to 4x Ubx+:
instead of being silenced in clones, these enhancer traps were no
longer expressed in proximal regions of the haltere disc, but distal
expression remained unchanged (Figure 4E, 4F). For Ubx-lacZ166,
the levels were strongly reduced in 4x Ubx+ flies compared to 2x
Ubx+ flies (Table S1). Note, however, that Ubx-lacZ166 can be
completely silenced in clones in response to hs-Ubx (Figure S3 and
Table S1). Finally, the expression of Ubx-Gal4M3 did not change in
the presence of four copies of the Ubx+ locus (Figure 4G and Table
S1). Taken together, these results allow us to make three important
conclusions. First, silencing is occurring at the level of Ubx
enhancers, not entire Ubx alleles, because different Ubx enhancer
traps respond in different ways. Second, silencing can be triggered
by the presence of only one or two additional Ubx+ loci, suggesting
that less than doubling Ubx levels is sufficient to silence some
enhancers. Third, although all Ubx enhancers can be silenced by
high Ubx levels, lower Ubx levels result in a range of responses
that depend on which enhancer trap, and therefore which subset
of Ubx enhancers, is being monitored. Thus, we conclude that
different Ubx enhancers are sensitive to different levels of Ubx
protein. We also generated flies to monitor two different enhancer
trap insertions into the Ubx locus (Ubx-lacZ166 and Ubx-Gal4lac1) at
the same time. When silencing was triggered by heat shock-
induced Ubx, we observed silencing of both enhancer traps, but at
different frequencies: Ubx-Gal4lac1 was silenced to a greater extent
than Ubx-lacZ166 (Figure S3). This finding provides additional
support for the idea that individual enhancer traps, and thus
different subsets of Ubx enhancers, respond differently to the same
increase in Ubx levels.
Haltere size and Ubx levels are buffered in response toincreased Ubx+ copy number
The above results show that epigenetic autoregulatory
silencing of Ubx enhancers occurs in response to elevated Ubx
levels. Interestingly, increasing the dose of Ubx+ results in smaller
halteres [16], but this size change does not scale linearly with the
number of Ubx+ genes. Haltere size is similar to wild type in flies
with 3x Ubx+ or 4x Ubx+, while in flies with 6 copies of Ubx+,
haltere size is greatly reduced (Figure 5A and Figure S4A). These
results suggest that haltere size is buffered against increasing
doses of the Ubx+ gene. A similar buffering can be observed when
Ubx protein levels are quantified in haltere discs from animals
with different numbers of Ubx+ genes. When one copy of Ubx is
inactivated (1x Ubx+), Ubx protein levels are nearly halved
(Figure S4A). However, when the Ubx+ complement is doubled
(4x Ubx+) or tripled (6x Ubx+) only 39% and 60% increases in
Ubx protein levels were detected, respectively (Figure S4A). The
less-than-expected increases in Ubx levels seen in Ubx duplica-
tions is not because they fail to express wild type levels, as they are
sufficient to fully rescue a Ubx null mutation, both phenotypically
[17,18] and with respect to Ubx protein levels (data not shown).
Together with the results described above, we suggest that the
buffering of Ubx levels and haltere size is due, at least in part, to
the epigenetic silencing of Ubx enhancers in response to higher
than normal doses of Ubx+.
Ubx enhancer silencing induced by genetic variationIn wild type animals, we hypothesized that enhancer silencing
may be used to ensure uniform Ubx levels in response to naturally
occurring genetic variation in the cis- and trans-regulation of Ubx
expression. We tested this idea by out-crossing our laboratory Ubx-
Gal4lac1 flies to 32 D. melanogaster strains established from wild
Figure 3. Ubx Silencing requires the Ubx homeodomain and C-terminus. (A) Wild type haltere. (B) vg-Gal4 UAS-Ubx halteres showhaltere to wing transformations due to Ubx silencing. (C) vg-Gal4 UAS-Antp halteres fail to produce any haltere to wing transformations. (D)vg-Gal4 UAS-AbdA halteres show haltere to wing transformations thatare indistinguishable from those seen with UAS-Ubx. AbdA and Ubxhave very similar homeodomains and also share the UbdA motif in theC-terminus, consistent with these domains playing a critical role insilencing. (E) vg-Gal4 UAS-AUA (Antp N-terminus, Ubx homeodomain,Antp C-terminus) halteres show no transformation to wing in 8/10samples and mild transformations in 2/10 samples. (F) vg-Gal4 UAS-AAU(Antp N-terminus, Antp homeodomain, Ubx C-terminus) halteres showno haltere to wing transformations. (G) vg-Gal4 UAS-UU* (Ubx N-terminus, Ubx homeodomain, deletion of the C-terminus) halteres showno haltere to wing transformations. (H) vg-Gal4 UAS-AUU (Antp N-terminus, Ubx homeodomain, Ubx C-terminus) halteres show haltere towing transformations indistinguishable from those seen with UAS-Ubx.doi:10.1371/journal.pgen.1000633.g003
Enhancer Silencing at Ubx
PLoS Genetics | www.plosgenetics.org 4 September 2009 | Volume 5 | Issue 9 | e1000633
fabio
Typewritten Text
145

populations around the world. In our lab stock, less than 5% of
haltere discs showed any evidence of Ubx-Gal4lac1 silencing.
However, when outcrossed to wild D. melanogaster strains, we
frequently observed silencing of Ubx-Gal4lac1 in haltere discs of the
F1 generations (Figure 5 and Table S2). Although the frequency of
silencing varied between wild stocks, it was consistent for each wild
stock in a statistically significant manner (Figure 6). Of the 32
stocks crossed to Ubx-Gal4lac1, 14 resulted in no detectable silencing
in the F1 generation, 6 showed weak silencing in the F1
generation, and 12 showed strong silencing in the F1 generation
Figure 4. Ubx enhnacer trap silencing in response to increasing Ubx+ dose. (A) Ubx-Gal4lac1 is silenced in groups of cells by 4 copies of theUbx+ locus (arrows), but Ubx protein levels are normal. (B) Ubx-Gal4lac1 is silenced in groups of cells by 3 copies of the Ubx+ locus (arrows), but Ubxprotein levels are normal. (C) Wild type haltere expression pattern of Ubx-Gal4LDN. (D) Ubx-Gal4LDN is partially silenced by 4 copies of the Ubx+ locus.(E–G) Wild type haltere expression patterns of Ubx-lacZlac1 (E), Ubx-Gal4M1 (F), and Ubx-Gal4M3 (G). (H–J) Ubx-lacZlac1 (H) and Ubx-Gal4M1 (I), but notUbx-Gal4M3 (J), are partially silenced by 4 copies of Ubx+. Note that for Ubx-lacZlac1 and Ubx-Gal4M1, silencing does not occur in random clones, butinstead is manifest by a loss of expression in proximal regions of the disc (arrows).doi:10.1371/journal.pgen.1000633.g004
Enhancer Silencing at Ubx
PLoS Genetics | www.plosgenetics.org 5 September 2009 | Volume 5 | Issue 9 | e1000633
fabio
Typewritten Text
146

Figure 5. Ubx enhancer silencing in response to natural genetic variation. (A) Halteres decrease in size with increasing Ubx+ copy number.UbxDf(109)/+(1xUbx+); Wild Type (2xUbx+); Dp(P5)/+(3xUbx+); Dp(P10)2x/+(4xUbx+); Dp(P10)2x/+; Dp(P5)/Dp(P5) (6xUbx+). (B–U) All images showhaltere discs stained for enhancer trap expression. (B–Q) Ubx-Gal4lac1 driven UAS-GFP reporter expression in the lab stock (B) and outcrossed tovarious wild type stocks (C–Q). Stocks beginning with ‘‘NC2’’ were collected in North Carolina. Other wild type stocks were obtained from theBloomington Stock Center. See Table S1 and Table S2 for a complete summary of these results. (C–H) Outcrossing to these stocks does not cause Ubx-Gal4lac1 silencing. (I–L) Outcrossing to these wild type stocks causes mild to moderate Ubx-Gal4lac1 silencing. (M–Q) Outcrossing to these wild typestocks causes moderate to strong Ubx-Gal4lac1 silencing. (R,S) Ubx-Gal4LDN in the lab background (R) and in F1 progeny when crossed to Tw2 (S).Strong clonal silencing is observed. (T,U) Ubx-Gal4M1 in the lab background (T) and in F1 progeny when crossed to NC2-76 (U). Loss of proximalexpression (arrows) is observed.doi:10.1371/journal.pgen.1000633.g005
Enhancer Silencing at Ubx
PLoS Genetics | www.plosgenetics.org 6 September 2009 | Volume 5 | Issue 9 | e1000633
fabio
Typewritten Text
147

(Figure 5 and Table S2). Because the amount of silencing can, in
some cases, approach 100% (e.g. Tw2 F1), while 4x Ubx+ resulted
in ,20–30% silencing (Figure 6), we suggest that differences
beyond Ubx levels contribute to silencing in these F1 outcrosses.
Genetic variation may, for example, result in differences in the
levels or activities of the trans-regulators of Ubx. Silencing was also
observed when Ubx-lacZlac1 and Ubx-Gal4LDN were outcrossed to
wild populations, demonstrating that this effect is not limited to
Ubx-Gal4lac1 (Figure 5R–5U and Table S1). Despite the silencing of
Ubx enhancer traps, the pattern and levels of Ubx protein were
similar in the wild stocks, our laboratory stocks, and in their F1
progeny (Figure S4B). We ruled out that the lack of enhancer trap
expression in these outcrosses was due to a failure to initiate
expression by carrying out a lineage tracing experiment, which
demonstrates that Ubx-Gal4lac1 was expressed prior to silencing (see
Materials and Methods). We also ruled out that transposon
instability (e.g. hybrid dysgenesis [19]) was responsible for the loss
of enhancer trap expression using several criteria (see Materials
and Methods). Most importantly, silencing occurred at the same
frequency when the male or female parent was from the wild (non-
laboratory) stock and the amount of enhancer trap DNA,
measured by qPCR, was unchanged between the parental and
F2 generations. Further, silencing of enhancer traps in other genes,
including Distalless-Gal4, homothorax-lacZ, and teashirt-lacZ was not
observed by crossing these insertions to the same wild strains (data
not shown).
We postulate that silencing induced in these outcrosses may be
due to an incompatibility between the trans-acting factors (largely
derived from the wild stocks) and cis-regulatory elements (linked to
the monitored Ubx locus of the laboratory stock) controlling Ubx
expression. In support of this idea, when Ubx-Gal4lac1 was further
introgressed into weakly or strongly silencing wild stocks, which
effectively increases the genetic complement from the wild strain
background, an increase in the severity of silencing was observed
when compared to the F1 generation (Figure 6 and Figure S5). We
also never observed the complete absence of Ubx protein or
haltere-to-wing transformations in any of these outcrosses, arguing
that only a subset of enhancer inputs into Ubx is silenced in
response to genetic variation. Consistently, individual enhancer
traps responded differently when crossed to the same wild strains
(Table S1).
Together, these results demonstrate that Ubx enhancer
silencing is triggered when Ubx is present at higher than normal
levels. When Ubx concentration is especially high (when Ubx is
ectopically expressed via Gal4 or heat-shock promoters) all
enhancer input into Ubx can be silenced, resulting in the
complete absence of Ubx expression and haltere-to-wing
transformations. Although such high levels of Ubx are not
physiological, we also find that Ubx enhancer silencing can be
triggered by additional copies of Ubx+, which in principle results
in less than double the amount of Ubx protein. In this case, we
find that the expression of some Ubx enhancer traps is clonally
silenced (e.g. Ubx-Gal4lac1), while the expression of other
enhancer traps (e.g. Ubx-lacZ166) is reduced. Thus, different
Ubx enhancers are differentially sensitive to negative autoregu-
lation; some are shut off by relatively low Ubx levels, while others
require high Ubx levels to be silenced.
Enhancer silencing and natural genetic variationMost remarkably, we found that enhancer silencing can occur
simply by varying the genetic background. In Drosophila melanoga-
ster, due in part to its large population size, the frequency of DNA
polymorphisms between individuals in the wild is estimated to be
as high as 1 in 100 basepairs [20]. Due to these polymorphisms, we
imagine that different strains of D. melanogaster, when kept in
isolation from each other, may have subtly different ways of
regulating Ubx. These may be due to strain-specific differences in
the Ubx cis-regulatory elements, in the trans regulators of Ubx
expression, or both. Consistent with this idea, it is of interest that
gene expression levels, when assayed across entire genomes, show
a lot of variability in natural populations [21,22,23,24,25].
Although we find that the final Ubx expression pattern and levels
are very similar between lab and wild D. melanogaster strains, when
two strains are bred together genetic differences may result in
fluctuations in the initial Ubx levels. The silencing system
described here may function to compensate for these fluctuations
and thus ensure that the correct Ubx levels are produced
throughout the haltere.
Plasticity of enhancer activitiesIn the crosses to wild D. melanogaster strains, we found that the
expression of genetically marked Ubx alleles varied tremendously,
depending on the genetic background. Extrapolating from these
results suggests that there is a lot of previously undetected
variability in enhancer activities at the Ubx locus in wild files that
would not have been detected using traditional assays. Thus, these
results challenge the standard view that a given transcriptional
enhancer integrates the same inputs and produces the same
Figure 6. Quantification of silencing. Each point records the %silencing of the Ubx-Gal4lac1 enhancer trap for a single haltere disc. %silencing is defined as the amount of non-stained tissue relative to wildtype controls measured in parallel (see Materials and Methods fordetails). Unless otherwise indicated, all measurements were of halterediscs from F1 animals grown under non-crowded conditions producedby crossing our laboratory Ubx-Gal4lac1 stock to the indicated geneticbackgrounds (46 Ubx, orange circles; NC2-80, black triangles; NC2-76,pink diamonds; Ber2, green squares; Tw2, blue triangles; Harwich, tancircles). Silencing was measured in two independent sets of crosses,separated in time by two weeks, and are graphed in neighboringcolumns. The thick black bars correspond to averages and the thinnerbars show the standard error of the mean. For each cross, a minimum of10 haltere discs, from 10 different animals, were scored. An analysis ofvariance (ANOVA) shows that the differences among the five wild typegenotypes (NC2-80, NC2-76, Ber2, Tw2 and Harwich) in % silencingwere highly significant (t ratio = 9.4, p = 0.0007) with 83% of thevariance among lines, and no differences between replicates. Alsographed is the % silencing measured in 10 independent haltere discsresulting from the continued introgression (F3 generations) of Ubx-Gal4lac1 into the NC2-80 background (black circles) and into the NC2-76background (pink circles). The average % silencing increased in the F3generations compared to the F1 generations.doi:10.1371/journal.pgen.1000633.g006
Enhancer Silencing at Ubx
PLoS Genetics | www.plosgenetics.org 7 September 2009 | Volume 5 | Issue 9 | e1000633
fabio
Typewritten Text
148

outputs, regardless of genetic background. Instead, due to natural
genetic variation, the activity of a particular enhancer may vary
widely between individuals in wild populations. Additionally, our
results show that the activity of an enhancer can even vary among
the cells within its expression domain (e.g. the haltere) in a single
individual. We suggest that plasticity in enhancer activities is
essential to compensate for genetic and perhaps environmental
variation. Moreover, given that many genes may have multiple,
partially redundant enhancers, enhancer silencing may be essential
to buffer gene expression levels so that they remain within a
narrow, biologically tolerable range. On the other hand, small
differences in enhancer activities in flies in the wild may serve as a
potential source of phenotypic variation that can be acted upon by
natural selection. Since population genetic theory predicts that
selection differentials of a small fraction of a percent are seen in
natural populations with the effective population size of Drosophila
[20], it is plausible that this variation is functionally significant,
perhaps through a subtle influence of haltere morphology on flight
performance.
Materials and Methods
Genetic variation experimentsThe NC2 stocks were obtained from Greg Gibson (N.C. State
University); all other wild stocks were obtained from the
Bloomington Stock Center (Table S2).
To show that the lack of expression in these outcrosses was not
due to a failure to initiate enhancer trap expression in the wild
backgrounds, we carried out a lineage tracing experiment. The
genotype of the stock was: Ubx-Gal4lac1 UAS-flp; actin.stop.GFP.
The combination of UAS-flp and actin.stop.GFP records the
history (i.e. marks the lineage) of Gal4 expression. When
outcrossed to wild backgrounds, GFP expression was not silenced
(in contrast to when the direct UAS-GFP readout was monitored).
Together, these results suggest that Ubx-Gal4lac1 was initially
activated but then silenced.
Hybrid dysgenesis was ruled out as a reason for loss of
expression from P transposons by the following tests: 1) silencing
occurs equally well, regardless of the direction the cross was set up,
2) silencing occurs equally well at 18u and 25uC (while hybrid
dysgenesis is suppressed at 18uC), 3) silencing was not observed for
some other transposon insertions (inside or outside of the Ubx
locus) when crossed to the same wild stocks, 4) the miniwhite gene
associated with the P element insertions did not lead to a
variegated eye phenotype as would be expected for somatic
transposon excision, and 5) quantitative PCR analysis confirmed
that the amount of transposon DNA was the same in the parent
(unsilenced) and F2 (silenced) generations. Finally, enhancer trap
expression can be recovered when back-crossed into the
laboratory stock background.
Quantification of Ubx protein levelsTo measure Ubx protein levels in different genetic back-
grounds, we stained haltere discs obtained from uncrowded yw
(2x Ubx+), yw;If/Cyo;TM2/TM6B (1x Ubx+), yw;If/Cyo;DpP5/
TM6B (3x Ubx+), yw;DpP10x2/CyoGFP;MKRS/TM6B (4x Ubx+),
yw; DpP10x2/CyoGFP;DpP5/DpP5 (6x Ubx+),Hikone-R, Berlin-K,
NC2-76, NC2-80, yw x NC2-76 F1s, Tw2, yw x Tw2 F1s, Florida-9,
Reids-2, and Harwich wandering larvae with anti-Ubx (FP3.38) and
a fluorescent secondary antibody. Stainings and confocal
imaging were done identically and in parallel for $8 haltere
discs from each genotype. The pixel intensities in identically sized
regions of the distal anterior compartments were measured using
Adobe Photoshop. This region was quantified because it is a
relatively large area that expresses Ubx at uniform levels and
gives rise to the main body of the haltere (the same portion
measured in Figure 5A and Figure S4A). Similar trends were
observed when average pixel intensities for the entire distal
haltere were measured. The average intensities for each wild
population differed by no more than 16%, suggesting that final
Ubx levels are very similar despite differences in genetic
background and silencing.
Quantification of Ubx reporter silencingTo quantify the extent of silencing of the Ubx-Gal4lac1 reporter
in response to Ubx+ copy number and outcrosses to wild
populations, third instar haltere discs were dissected from
wandering larvae of yw122; DpP10x2/CyoGFP; Ubx-Gal4lac1UAS-
GFP/TM6B (4xUbx+), and the GFP positive, F1 progeny of yw122;
If/Cyo; Ubx-Gal4lac1UAS-GFP/TM6B crossed with NC2-80, NC2-
76, Ber-2, Tw-2, and Harwich. GFP positive F3 progeny of yw122;
If/Cyo; Ubx-Gal4lac1UAS-GFP/TM6B crossed with NC2-80 and
NC2-76 were also dissected. For the outcrosses, we always used
females from the wild populations. Haltere discs were fixed,
mounted, and imaged for GFP and DAPI on a confocal
microscope. Images were made binary in ImageJ. The GFP
expressing area relative to the total disc area was measured for
each disc, and this value was subtracted from the average GFP
expressing area (relative to total disc size) of yw122; If/Cyo; Ubx-
Gal4lac1UAS-GFP/TM6B haltere discs to yield a ‘% silencing’ value
for each disc.
Heat-shock induced Ubx overexpressionLarvae bearing the hs-UbxIa22 transgene [26] were heat-
shocked at 37uC for 15–20 minutes 3 or 4 days after egg laying.
Larvae were dissected at least 48 hours after heat shock to allow
for total dissipation of exogenous Ubx. hs-UbxIa22 larvae that were
not heat shocked showed no Ubx silencing. Neutral clones were
induced using the same heat shock regime in flies of the genotype
yw hsflp; FRT 42D Ub-GFP/FRT 42D; hs-UbxIa22/+.
Ubx enhancer traps and duplicationsUbx-Gal4lac1 [27]; Ubx-lacZlac1 [28]; Ubx-Gal4LDN [29]; Ubx-
Gal4M1 [29]; Ubx-lacZ166 [30]; and Ubx-Gal4M3 [29]. Although
these lines are hypomorphic mutations of the Ubx locus, this is
unlikely to contribute to our results because decreased production
of Ubx would, if anything, cause an underestimate of the amount
of silencing that occurs at the Ubx locus.
3x Ubx+ flies contain a tandem duplication of the Ubx locus
(Dp(3;3)P5).
4x Ubx+ flies contain a tandem duplication of a transpositon of
the Ubx locus onto the 2nd chromosome (Dp(3;2)P10). Further
increases in Ubx+ copy number were created by combining these
duplications [16]. Ubx9–22 expresses a non-functional Ubx protein
due to a ,1500 bp deletion that removes a splice acceptor site and
part of the Ubx homeodomain-encoding exon [31].
Before crossing to enhancer traps, Ubx duplications were
introduced into stocks containing marked chromosomes that do
not cause silencing (yw hsflp; If/cyo; Dp(P5)/Tm6B and yw hsflp;
Dp(3;2)P10x2/CyoGFP; MKRS/Tm6B).
To monitor silencing of Ubx-lacZ166 and Ubx-Gal4lac1 simulta-
neously (Figure S3), flies of the genotype, Dp(3;2)P10x2/heat shock-
Ubx; Ubx-lacZ166/Ubx-Gal4lac1 UAS-GFP were given a 15 min. heat
shock at 37uC 48 to 96 hrs after egg laying. Imaginal discs were
dissected at wandering stage and stained for Ubx, bgal, and GFP.
Silencing was not observed in flies of the same genotype without
heat shock.
Enhancer Silencing at Ubx
PLoS Genetics | www.plosgenetics.org 8 September 2009 | Volume 5 | Issue 9 | e1000633
fabio
Typewritten Text
149

PcG mutationsFRT101 ph504
FRT2A PcXT109
FRT42D Su(Z)2l.b8
FRT82B ScmD1
FRT42D PclD5
Of these mutations, when analyzed in loss-of-function clones, all
but Pcl resulted in repression of Ubx in the haltere (due to
derepression of more posterior Hox genes; data not shown) and
therefore could not be used to assess their role in silencing.
Other lines usedUAS-GFP Ubx-Gal4lac1/TM6B
UAS-GFP (X); Ubx-Gal4LDN/TM6B
UAS-GFP (X); Ubx-Gal4M1/TM6B
FRT 82B UbxDf(109)/TM6B
hs-UbxIa22/TM6B [26]
Ubx9–22/TM6B
vg-Gal4 UAS-GFP
vg-Gal4 UAS-GFP UAS-flp act.cd2.Gal4
UAS-UbxHA
FRT42D Ub-GFP
FRT42D Ub-GFP; hs-UbxIa22/Tm6B
FRT42D
UAS-GFP; FRT42D arm-lacZ; Ubx-Gal4Lac1
hs-Gal4
Antp-Ubx chimeras(Previously described by [14]
UAS-Antp
UAS-AUA
UAS-UU* (* refers to a stop codon inserted immediately
following the homeodomain)
UAS-AAU
UAS-AUU
Quantitative PCRWhole-fly genomic DNA was isolated from the lab stock
containing the Ubx-Gal4lac1 enhancer trap (yw122; If/CyoGFP; Ubx-
Gal4lac1 UAS-GFP/TM6B) and the GFP+ F2 progeny of the Ubx-
Gal4lac1 stock crossed to strains Tw2, NC2-76, and NC2-80.
Silencing was confirmed to be occurring in these crosses. The F2
progeny were generated by crossing Gal4lac1UAS-GFP F1 males to
wild population females, precluding the possibility of recombina-
tion between chromosomes of the lab and wild genotypes. Primers
were designed to amplify ,200 bp in the Gal4 and UAS transgenes
to determine their relative abundance in each genotype. A
,200 bp sequence in the 59UTR of homothorax was amplified to
normalize for different amounts of template DNA. PCR
amplification was performed in triplicate using Applied Biosystems
7300 Real Time PCR System, and SYBR Green PCR Master
Mix. Product dissociation curves were examined to ensure that
each primer set only amplified a single product. CT values and
amplification curves were consistent with an equal abundance of
the Gal4 and UAS sequences in all genotypes.
Antibody stainingStandard protocols were used with the following primary
antibodies:
Rabbit anti-b-Gal 1:10,000 (Cappel)
Mouse anti-En 1:10 (Hybridoma Bank)
Mouse anti-Ubx 1:20
Rat anti-HA 1:100
Supporting Information
Figure S1 Neutral clones respect the borders of Ubx silencing.
(A,B) Two examples of haltere discs with neutral clones (marked
by the absence of GFP) and Ubx silencing (induced by hs-Ubx). In
(A), there is no crossing between the neutral clones and Ubx-
silenced patches. In (B), although most of the neutral clones respect
the Ubx-silenced patches, there are two small exceptions (arrows).
Ubx- silenced patches are outlined in yellow and the neutral clones
are outlined in blue. The exceptions observed in these experiments
are likely due to multiple neutral clones that were scored as a single
clone because they fused during growth.
Found at: doi:10.1371/journal.pgen.1000633.s001 (9.78 MB TIF)
Figure S2 PcG functions are required for Ubx autoregulatory
silencing. (A) Wing disc with Pcl- clones (absence of GFP) stained
for Ubx (red) and GFP. Ubx expression is observed in pouch
clones. (B) Haltere disc with Pcl- clones (absence of GFP) stained
for Ubx (red) and GFP. Ubx expression is unaffected by the
absence of Pcl. Pcl was the only PcG gene we tested to show strong,
autonomous Ubx derepression in the wing disc, and no affect on
Ubx expression in the haltere disc; the PcG mutations Pc, Scm, ph,
and Su(Z)2 could not be used for this experiment because they
result in a loss of Ubx expression in the haltere, due to the
derepression of more posterior Hox genes in these clones (data not
shown). (C) A Ubx-Gal4lac1 haltere disc in which both silencing (by
hs-Ubx) and Pcl- clones were induced. Pcl- tissue is outlined in
yellow. Silencing of both Ubx and the enhancer trap are observed,
but not in Pcl- tissue. Note that Pcl- clones only affect Ubx
expression in the distal, ‘‘pouch’’ domain of the wing and haltere
(Beuchle D, Struhl G, Muller J (2001) Polycomb group proteins
and heritable silencing of Drosophila Hox genes. Development
128: 993-1004).
Found at: doi:10.1371/journal.pgen.1000633.s002 (7.73 MB TIF)
Figure S3 Simultaneous monitoring of silencing for two Ubx
enhancer traps. (A,B) hs-Ubx/DpP10x2; UbxGal4lac1 UAS-GFP/
UbxlacZ166 haltere disc from animals that were not given a heat
shock (A) or were given a 15 min heat shock (B). The discs were
stained for Ubx (blue), GFP (green), and bgal (red). Individual
channels are shown as indicated. For (B), where silencing was
observed, the outlines of the silenced clones are shown as follows:
in the bgal channel (B’) the outlines of Ubx (yellow outline)
silenced clones are shown. In the GFP channel (B’) the outlines of
Ubx (yellow outline) silenced clones are shown. B’ shows the GFP
channel with the Ubx-lacZ166 (red outline) silenced clones. Note
that the extent of silencing of Ubx-Gal4lac1 is greater than that of
Ubx-lacZ166, and that Ubx-lacZ166 silencing is a subset of Ubx-
Gal4lac1 silencing.
Found at: doi:10.1371/journal.pgen.1000633.s003 (3.13 MB TIF)
Figure S4 Quantification of haltere sizes and Ubx levels. (A)
Quantifications of Ubx protein levels (blue bars) and haltere sizes
(red bars) in genotypes with differing numbers of wild type Ubx+alleles. Both measurements are shown relative to wild type (2x
Ubx+). Note that neither measurement scales quantitatively with
increases in Ubx+ dose, illustrating that these phenotypes are
buffered. In contrast, one copy of Ubx+ shows a ,60% reduction
in Ubx protein levels and a ,50% increase in haltere size
compared to wild type (2x Ubx+). Error bars represent standard
error of the mean. (B) Quantifications of Ubx levels in 8 different
wild genetic backgrounds (Hikone-R, Berlin-K, NC2-80, NC2-76,
Tw2, Florida-9, Reids-2, and Harwich) and two F1s (yw X NC2-
76 and yw X Tw2) are all within ,16% of those measured in yw.
Moreover, this variation does not correlate with the degree of
silencing (shown in the thumbnail images below the graph). For
Enhancer Silencing at Ubx
PLoS Genetics | www.plosgenetics.org 9 September 2009 | Volume 5 | Issue 9 | e1000633
fabio
Typewritten Text
150

comparison, halving the dose of Ubx+ decreases Ubx levels by
,40% (left-most bar). Error bars represent standard error of the
mean.
Found at: doi:10.1371/journal.pgen.1000633.s004 (0.36 MB TIF)
Figure S5 Ubx silencing increases with introgression into wild
genetic backgrounds. (A) Ubx-Gal4lac1 expression in the F1 progeny
of a cross to the Tw2 wild type line. (B) Silencing increases when
Ubx-Gal4lac1 is introgressed by backcrossing into the Tw2 line.
Shown here is a haltere disc after 2 backcrosses (the F3
generation). (C) Ubx-Gal4lac1 expression in the F1 progeny of a
cross to the NC2-80 wild type line. (D) Silencing increases when
Ubx-Gal4lac1 is introgressed by backcrossing into the NC2-80 line.
Shown here is a haltere disc after 2 backcrosses (the F3
generation).
Found at: doi:10.1371/journal.pgen.1000633.s005 (1.47 MB TIF)
Table S1 Summary of Ubx enhancer traps and their responses
to changes in Ubx levels and genetic variation
Found at: doi:10.1371/journal.pgen.1000633.s006 (0.08 MB
DOC)
Table S2 Summary of Ubx-Gal4lac1 silencing in F1 crosses to wild
stocks
Found at: doi:10.1371/journal.pgen.1000633.s007 (0.07 MB
DOC)
Acknowledgments
We thank G. Gibson, I. Dworkin, B. Gebelein, T. Jessell, L. Johnston, and
D. Rogulja for helpful discussions and/or comments on the manuscript, G.
Gibson for carrying out the ANOVA analysis, and L. Vosshall for hosting
MAC during the final stages of experiments. We thank E. Sanchez-
Herrero, W. Bender, G. Gibson, and J. Muller for providing fly stocks.
Author Contributions
Conceived and designed the experiments: MAC VR RSM. Performed the
experiments: MAC VR. Analyzed the data: MAC VR RSM. Wrote the
paper: MAC VR RSM.
References
1. Yuh CH, Davidson EH (1996) Modular cis-regulatory organization of Endo16, a
gut-specific gene of the sea urchin embryo. Development 122: 1069–1082.
2. Keys DN, Lee BI, Di Gregorio A, Harafuji N, Detter JC, et al. (2005) A
saturation screen for cis-acting regulatory DNA in the Hox genes of Ciona
intestinalis. Proc Natl Acad Sci U S A 102: 679–683.
3. Davidson EH (2001) Genomic Regulatory Systems. New York: Academic Press.
261 p.
4. Arnosti DN (2003) Analysis and function of transcriptional regulatory elements:
insights from Drosophila. Annu Rev Entomol 48: 579–602.
5. Cameron RA, Oliveri P, Wyllie J, Davidson EH (2004) cis-Regulatory activity of
randomly chosen genomic fragments from the sea urchin. Gene Expr Patterns 4:
205–213.
6. Birney E, Stamatoyannopoulos JA, Dutta A, Guigo R, Gingeras TR, et al.
(2007) Identification and analysis of functional elements in 1% of the human
genome by the ENCODE pilot project. Nature 447: 799–816.
7. Pfeiffer B, Jenett A, Hammonds A, Ngo T, Misra S, et al. (2008) Tools for
Neuroanatomy and Neurogenetics in Drosophila. Proc Natl Acad Sci U S A. In
press.
8. Alon U (2007) Network motifs: theory and experimental approaches. Nat Rev
Genet 8: 450–461.
9. Dickinson MH (1999) Haltere-mediated equilibrium reflexes of the fruit fly,
Drosophila melanogaster. Philos Trans R Soc Lond B Biol Sci 354: 903–916.
10. White RA, Wilcox M (1984) Protein products of the bithorax complex in
Drosophila. Cell 39: 163–171.
11. Irvine KD, Botas J, Jha S, Mann RS, Hogness DS (1993) Negative
autoregulation by Ultrabithorax controls the level and pattern of its expression.
Development 117: 387–399.
12. Garaulet DL, Foronda D, Calleja M, Sanchez-Herrero E (2008) Polycomb-
dependent Ultrabithorax Hox gene silencing induced by high Ultrabithorax
levels in Drosophila. Development 135: 3219–3228.
13. Chan SK, Mann RS (1993) The segment identity functions of Ultrabithorax are
contained within its homeo domain and carboxy-terminal sequences. Genes Dev
7: 796–811.
14. Gebelein B, Culi J, Ryoo HD, Zhang W, Mann RS (2002) Specificity of
Distalless repression and limb primordia development by abdominal Hox
proteins. Dev Cell 3: 487–498.
15. Merabet S, Saadaoui M, Sambrani N, Hudry B, Pradel J, et al. (2007) A unique
Extradenticle recruitment mode in the Drosophila Hox protein Ultrabithorax.
Proc Natl Acad Sci U S A 104: 16946–16951.
16. Smolik-Utlaut SM (1990) Dosage requirements of Ultrabithorax and bithoraxoidin the determination of segment identity in Drosophila melanogaster. Genetics
124: 357–366.17. Struhl G (1984) Splitting the bithorax complex of Drosophila. Nature 308:
454–457.
18. Lewis EB (1978) A gene complex controlling segmentation in Drosophila. Nature276: 565–570.
19. Castro JP, Carareto CM (2004) Drosophila melanogaster P transposableelements: mechanisms of transposition and regulation. Genetica 121: 107–118.
20. Aquadro CF, Bauer DuMont V, Reed FA (2001) Genome-wide variation in the
human and fruitfly: a comparison. Curr Opin Genet Dev 11: 627–634.21. Schadt EE, Monks SA, Drake TA, Lusis AJ, Che N, et al. (2003) Genetics of
gene expression surveyed in maize, mouse and man. Nature 422: 297–302.22. Morley M, Molony CM, Weber TM, Devlin JL, Ewens KG, et al. (2004)
Genetic analysis of genome-wide variation in human gene expression. Nature430: 743–747.
23. Rockman MV, Kruglyak L (2006) Genetics of global gene expression. Nat Rev
Genet 7: 862–872.24. Ronald J, Brem RB, Whittle J, Kruglyak L (2005) Local regulatory variation in
Saccharomyces cerevisiae. PLoS Genet 1: e25. doi:10.1371/journal.pgen.0010025.
25. Raser JM, O’Shea EK (2005) Noise in gene expression: origins, consequences,
and control. Science 309: 2010–2013.26. Mann RS, Hogness DS (1990) Functional dissection of Ultrabithorax proteins in
D. melanogaster. Cell 60: 597–610.27. Pallavi SK, Shashidhara LS (2003) Egfr/Ras pathway mediates interactions
between peripodial and disc proper cells in Drosophila wing discs. Development130: 4931–4941.
28. Casares F, Bender W, Merriam J, Sanchez-Herrero E (1997) Interactions of
Drosophila Ultrabithorax regulatory regions with native and foreign promoters.Genetics 145: 123–137.
29. de Navas L, Foronda D, Suzanne M, Sanchez-Herrero E (2006) A simple andefficient method to identify replacements of P-lacZ by P-Gal4 lines allows
obtaining Gal4 insertions in the bithorax complex of Drosophila. Mech Dev 123:
860–867.30. Bender W, Hudson A (2000) P element homing to the Drosophila bithorax
complex. Development 127: 3981–3992.31. Weinzierl RO, Axton JM, Ghysen A, Akam ME (1987) Ultrabithorax mutations
in constant and variable regions of the protein coding sequence. Genes Dev 1:386–397.
Enhancer Silencing at Ubx
PLoS Genetics | www.plosgenetics.org 10 September 2009 | Volume 5 | Issue 9 | e1000633
fabio
Typewritten Text
151