The Role of Surface Hydroxylation, Lattice Vacancies and ...
26
Z. Phys. Chem. 2020; 234(5): 787–812 Hong Nhan Nong, Hoang Phi Tran, Camillo Spöri, Malte Klingenhof, Lorenz Frevel, Travis E. Jones, Thorsten Cottre, Bernhard Kaiser, Wolfram Jaegermann, Robert Schlögl, Detre Teschner* and Peter Strasser* The Role of Surface Hydroxylation, Lattice Vacancies and Bond Covalency in the Electrochemical Oxidation of Water (OER) on Ni-Depleted Iridium Oxide Catalysts https://doi.org/10.1515/zpch-2019-1460 Received May 2, 2019; accepted July 7, 2019 Abstract: The usage of iridium as an oxygen-evolution-reaction (OER) electrocata- lyst requires very high atom efficiencies paired with high activity and stability. Our efforts during the past 6 years in the Priority Program 1613 funded by the Deutsche *Corresponding authors: Detre Teschner, Department of Heterogeneous Reactions, Max-Planck-Institute for Chemical Energy Conversion, 45470 Mülheim an der Ruhr, Germany; and Department of Inorganic Chemistry, Fritz-Haber-Institute of the Max-Planck- Society, Faradayweg 4–6, 14195 Berlin, Germany, e-mail: [email protected]; and Peter Strasser, Department of Chemistry, Chemical and Materials Engineering Division, Technical University Berlin, Straße des 17. Juni 124, 10623 Berlin, Germany, e-mail: [email protected] Hong Nhan Nong: Department of Chemistry, Chemical and Materials Engineering Division, Technical University Berlin, Straße des 17. Juni 124, 10623 Berlin, Germany; and Department of Heterogeneous Reactions, Max-Planck-Institute for Chemical Energy Conversion, 45470 Mülheim an der Ruhr, Germany Hoang Phi Tran, Camillo Spöri and Malte Klingenhof: Department of Chemistry, Chemical and Materials Engineering Division, Technical University Berlin, Straße des 17. Juni 124, 10623 Berlin, Germany Lorenz Frevel and Travis E. Jones: Department of Inorganic Chemistry, Fritz-Haber-Institute of the Max-Planck-Society, Faradayweg 4–6, 14195 Berlin, Germany Thorsten Cottre, Bernhard Kaiser and Wolfram Jaegermann: Surface Science Division, Department of Materials Science, Technical University Darmstadt, Otto-Berndt-Strasse 3, Darmstadt, 64287, Germany Robert Schlögl: Department of Heterogeneous Reactions, Max-Planck-Institute for Chemical Energy Conversion, 45470 Mülheim an der Ruhr, Germany; and Department of Inorganic Chemistry, Fritz-Haber-Institute of the Max-Planck-Society, Faradayweg 4–6, 14195 Berlin, Germany Open Access. © 2020 Detre Teschner, Peter Strasser et al., published by De Gruyter. This work is licensed under the Creative Commons Attribution-NonCommercial-NoDerivatives 4.0 International License.
-
Upload
khangminh22 -
Category
Documents
-
view
0 -
download
0
Transcript of The Role of Surface Hydroxylation, Lattice Vacancies and ...
Z. Phys. Chem. 2020; 234(5): 787–812
Hong Nhan Nong, Hoang Phi Tran, Camillo Spöri, MalteKlingenhof, Lorenz Frevel, Travis E. Jones, Thorsten Cottre,Bernhard Kaiser, Wolfram Jaegermann, Robert Schlögl,Detre Teschner* and Peter Strasser*The Role of Surface Hydroxylation, LatticeVacancies and Bond Covalency in theElectrochemical Oxidation of Water (OER)on Ni-Depleted Iridium Oxide Catalystshttps://doi.org/10.1515/zpch-2019-1460Received May 2, 2019; accepted July 7, 2019
Abstract: The usage of iridiumas an oxygen-evolution-reaction (OER) electrocata-lyst requires very high atomefficiencies pairedwith high activity and stability. Ourefforts during the past 6 years in the Priority Program 1613 funded by theDeutsche
*Corresponding authors: Detre Teschner, Department of Heterogeneous Reactions,Max-Planck-Institute for Chemical Energy Conversion, 45470 Mülheim an der Ruhr,Germany; and Department of Inorganic Chemistry, Fritz-Haber-Institute of the Max-Planck-Society, Faradayweg 4–6, 14195 Berlin, Germany, e-mail: teschner@�i-berlin.mpg.de;and Peter Strasser, Department of Chemistry, Chemical and Materials EngineeringDivision, Technical University Berlin, Straße des 17. Juni 124, 10623 Berlin, Germany,e-mail: [email protected] Nhan Nong: Department of Chemistry, Chemical and Materials Engineering Division,Technical University Berlin, Straße des 17. Juni 124, 10623 Berlin, Germany; and Departmentof Heterogeneous Reactions, Max-Planck-Institute for Chemical Energy Conversion, 45470Mülheim an der Ruhr, GermanyHoang Phi Tran, Camillo Spöri and Malte Klingenhof: Department of Chemistry, Chemical andMaterials Engineering Division, Technical University Berlin, Straße des 17. Juni 124, 10623Berlin, GermanyLorenz Frevel and Travis E. Jones: Department of Inorganic Chemistry, Fritz-Haber-Institute ofthe Max-Planck-Society, Faradayweg 4–6, 14195 Berlin, GermanyThorsten Cottre, Bernhard Kaiser and Wolfram Jaegermann: Surface Science Division,Department of Materials Science, Technical University Darmstadt, Otto-Berndt-Strasse 3,Darmstadt, 64287, GermanyRobert Schlögl: Department of Heterogeneous Reactions, Max-Planck-Institute for ChemicalEnergy Conversion, 45470 Mülheim an der Ruhr, Germany; and Department of InorganicChemistry, Fritz-Haber-Institute of the Max-Planck-Society, Faradayweg 4–6, 14195 Berlin,Germany
Open Access. © 2020 Detre Teschner, Peter Strasser et al., published by De Gruyter. Thiswork is licensed under the Creative Commons Attribution-NonCommercial-NoDerivatives 4.0 InternationalLicense.
788 | H. N. Nong et al.
Forschungsgemeinschaft (DFG) were focused to mitigate the molecular origin ofkinetic overpotentials of Ir-based OER catalysts and to design new materials toachieve that Ir-based catalysts are more atom and energy efficient, as well as sta-ble. Approaches involved are: (1) use of bimetallic mixed metal oxide materialswhere Ir is combined with cheaper transition metals as starting materials, (2) useof dealloying concepts of nanometer sized core-shell particle with a thin noblemetal oxide shell combined with a hollow or cheap transition metal-rich alloycore, and (3) use of corrosion-resistant high-surface-area oxide supportmaterials.In this mini review, we have highlighted selected advances in our understandingof Ir–Ni bimetallic oxide electrocatalysts for the OER in acidic environments.
Keywords: iridium; IrNi(Ox); multi-junction photoelectrochemical cell; oxygen-evolution-reaction.
1 IntroductionSolar light is a virtually inexhaustible, hence, renewable energy source. Harvest-ing and storing its radiation power efficiently and densely, however, continues tobe one of today’s techno-scientific Grand Challenges [1, 2]. High energy chemi-cal bonds of molecular energy vectors consisting of elements in low redox statesformed using free electrons is considered one the most attractive strategies forscalable, future energy storage. Themost popular of such energy carriers is hydro-gen. Hydrogen can be produced on varying scales by water electrolysis and con-verted back into electricity using fuel cells. Hydrogen can be used for stationaryas well as mobile applications; it can be safely stored and transported over largedistances [3]. This is why electrolytic hydrogen has been the center of a vision ofa future hydrogen economy [4].
Solar hydrogen (and oxygen) can be produced from the combination of photo-voltaic deviceswith “dark”water electrolyzers, or else using integrated photoelec-trochemical cell (PEC) devices incorporating semiconductors and water splittingelectrocatalysts, where the semiconductor may or may not be in direct contactwith the liquid electrolyte (classic “non-buried” semiconductor-electrolyte junc-tions vs. buried multi-junction devices with protecting oxide/catalyst top layers)[5–9].
Low-temperature dark water electrolysis can be carried out using (i) liquidalkaline water electrolyzers (AWE), (ii) proton exchange membrane electrolyzers(PEM) and (iii) alkaline exchange membrane electrolyzers (AEM), which howeverare still at a somewhat lower technology readiness level [10, 11]. Although allow-ing the use of low-cost non-noble electrodes [12, 13], alkaline electrolysis suffers
The Role of Surface Hydroxylation, Lattice Vacancies | 789
from lower electrolyte conductivities and lower load flexibilities (less capable tobe operated at varying low partial current loads) [4, 14]. On the other hand, thePEM acidic electrolysis requires noble metal catalysts for both electrodes, theloading of which must be kept at a minimum [15, 16]. The PEC device schemes,on the other hand, require the deployment of at least one, either the hydrogenevolution reaction (HER) or the oxygen evolution reaction (OER) electrocatalyst,or in some configurations also of both electrocatalysts in a layered format on topofconducting oxidic interlayers (buried junctions) or on the semiconductor directly(classical junctions) [17]. While the catalyst materials employed are typically sim-ilar Pt and Ir formulations as used in dark electrolyzers, the PEC-based watersplitting catalysts operate under distinct boundary conditions and at quite differ-ent current densities. In simple terms, catalysts in dark electrolyzersmust operatevery energy and voltage efficient, while the catalyst in PECs must be particularlyinexpensive or deployed in particularly low mass loadings.
While Pt is a nearly ideal catalyst for the HER, on the anodic electrode, theOER is the kinetic bottleneck of water electrolysis due to its sluggish elementarycatalytic reaction steps resulting in relative high over-potential [4]. In the 1950s,John Bockris’ group explored the OER kinetics and established early mechanis-tic hypotheses on the critical role of reactive oxygenated surface intermediates,such as hydroxyl (OH), atomic oxygen (O), and peroxide (OOH), using reactiveschemes which have kept their principle validity until today [18]. Later, Trasattiestablished volcano relations between the enthalpy of reaction of the transitionof different binary metal oxides from a lower to a higher metal oxidation stateand the corresponding experimental OER over-potentials. He found the oxidesof Ru and Ir near the top [19, 20]. Much later, density functional theory (DFT)calculations of the anodic electrocatalytic OER provided deeper insight into theorigin of the kinetic overpotentials. Computational work using a stepwise OERmechanism, virtually following the scheme set up byBockris decades earlier, nowshowed that the oxide surface, where adsorbed oxygen (Oad) is destabilized rela-tive to adsorbed peroxide intermediate (OOHad), is the expected catalyst [21]. Therelatively high kinetic activities of IrO2 and RuO2 are attributed to their near opti-mal binding energy of Oad and OOHad and their good conductivity [16, 22–24].Based on the overpotential of OER at a geometric current density of 5 mA cm−2,the general activity trend established for oxidized forms of noble metals was:Ru > Ir > Rh > Pt > Au, and the stability was found in the following trend:Pt > Rh > Ir > Au ≥ Ru [25–27]. Thereby, Ir has always shown the best trade-offbetween catalytic activity and stability in acidic electrolyzers, but its extreme lowabundance requires atom-efficient low-content chemical architectures to keep thenoble metal loading at a scalable level, while maintaining sufficient activity andstability.
790 | H. N. Nong et al.
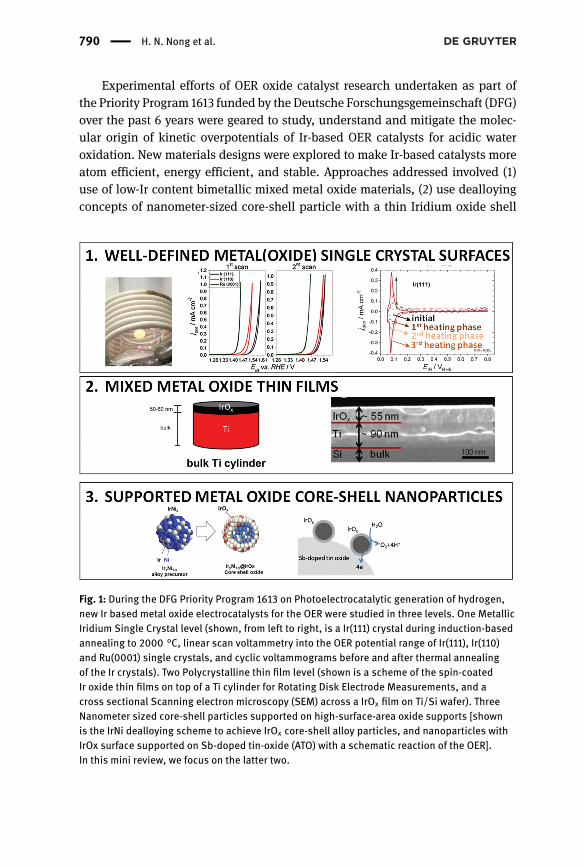
Experimental efforts of OER oxide catalyst research undertaken as part ofthe Priority Program 1613 funded by the Deutsche Forschungsgemeinschaft (DFG)over the past 6 years were geared to study, understand and mitigate the molec-ular origin of kinetic overpotentials of Ir-based OER catalysts for acidic wateroxidation. New materials designs were explored to make Ir-based catalysts moreatom efficient, energy efficient, and stable. Approaches addressed involved (1)use of low-Ir content bimetallic mixed metal oxide materials, (2) use dealloyingconcepts of nanometer-sized core-shell particle with a thin Iridium oxide shell
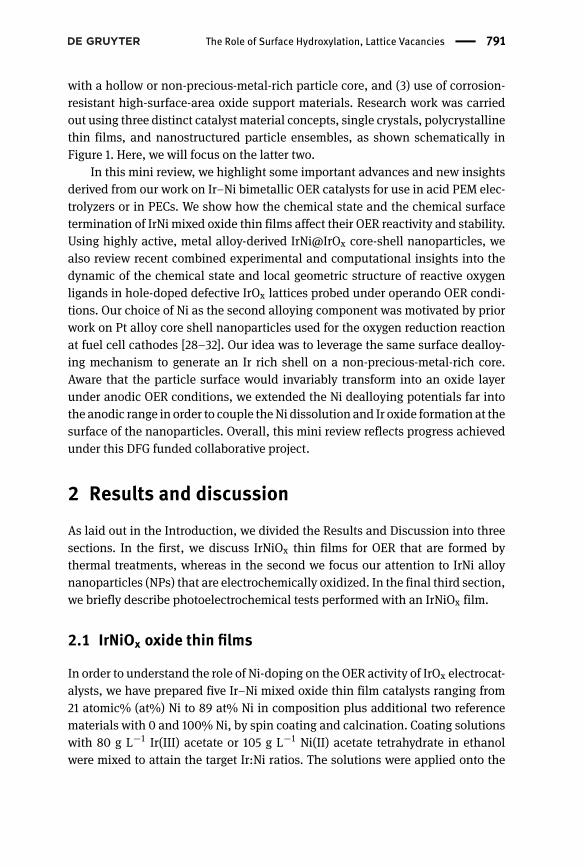
Fig. 1: During the DFG Priority Program 1613 on Photoelectrocatalytic generation of hydrogen,new Ir based metal oxide electrocatalysts for the OER were studied in three levels. One MetallicIridium Single Crystal level (shown, from left to right, is a Ir(111) crystal during induction-basedannealing to 2000 °C, linear scan voltammetry into the OER potential range of Ir(111), Ir(110)and Ru(0001) single crystals, and cyclic voltammograms before and after thermal annealingof the Ir crystals). Two Polycrystalline thin film level (shown is a scheme of the spin-coatedIr oxide thin films on top of a Ti cylinder for Rotating Disk Electrode Measurements, and across sectional Scanning electron microscopy (SEM) across a IrOx film on Ti/Si wafer). ThreeNanometer sized core-shell particles supported on high-surface-area oxide supports [shownis the IrNi dealloying scheme to achieve IrOx core-shell alloy particles, and nanoparticles withIrOx surface supported on Sb-doped tin-oxide (ATO) with a schematic reaction of the OER].In this mini review, we focus on the latter two.
The Role of Surface Hydroxylation, Lattice Vacancies | 791
with a hollow or non-precious-metal-rich particle core, and (3) use of corrosion-resistant high-surface-area oxide support materials. Research work was carriedout using three distinct catalyst material concepts, single crystals, polycrystallinethin films, and nanostructured particle ensembles, as shown schematically inFigure 1. Here, we will focus on the latter two.
In this mini review, we highlight some important advances and new insightsderived from our work on Ir–Ni bimetallic OER catalysts for use in acid PEM elec-trolyzers or in PECs. We show how the chemical state and the chemical surfacetermination of IrNi mixed oxide thin films affect their OER reactivity and stability.Using highly active, metal alloy-derived IrNi@IrOx core-shell nanoparticles, wealso review recent combined experimental and computational insights into thedynamic of the chemical state and local geometric structure of reactive oxygenligands in hole-doped defective IrOx lattices probed under operando OER condi-tions. Our choice of Ni as the second alloying component was motivated by priorwork on Pt alloy core shell nanoparticles used for the oxygen reduction reactionat fuel cell cathodes [28–32]. Our idea was to leverage the same surface dealloy-ing mechanism to generate an Ir rich shell on a non-precious-metal-rich core.Aware that the particle surface would invariably transform into an oxide layerunder anodic OER conditions, we extended the Ni dealloying potentials far intothe anodic range in order to couple theNi dissolution and Ir oxide formation at thesurface of the nanoparticles. Overall, this mini review reflects progress achievedunder this DFG funded collaborative project.
2 Results and discussionAs laid out in the Introduction, we divided the Results and Discussion into threesections. In the first, we discuss IrNiOx thin films for OER that are formed bythermal treatments, whereas in the second we focus our attention to IrNi alloynanoparticles (NPs) that are electrochemically oxidized. In the final third section,we briefly describe photoelectrochemical tests performed with an IrNiOx film.
2.1 IrNiOx oxide thin films
In order to understand the role of Ni-doping on the OER activity of IrOx electrocat-alysts, we have prepared five Ir–Ni mixed oxide thin film catalysts ranging from21 atomic% (at%) Ni to 89 at% Ni in composition plus additional two referencematerials with 0 and 100%Ni, by spin coating and calcination. Coating solutionswith 80 g L−1 Ir(III) acetate or 105 g L−1 Ni(II) acetate tetrahydrate in ethanolwere mixed to attain the target Ir:Ni ratios. The solutions were applied onto the
792 | H. N. Nong et al.
spinning substrate at 200 revolutions per minute (rpm) ensuring full coverage.Thereafter, the rotation velocity was increased to 2000 rpm and dwelled at thisvelocity for 45 s to finish the spin coating process. The coated samples were cal-cined in a pre-heatedmuffle furnace at 450 °C for 15 min. For detailed descriptionof sample preparation and characterization, see [33]. The Ir–Ni mixed oxide cata-lysts will be referred to as x%Ni–MO (MO for Ir–Ni mixed oxide). Thereby, x spec-ifies the fraction of Ir atoms substituted by Ni (in at%) in the as-prepared mixedoxide. The abbreviation “ap” or “OER” refers to the state of the film “as-prepared”or after “OER”, respectively.
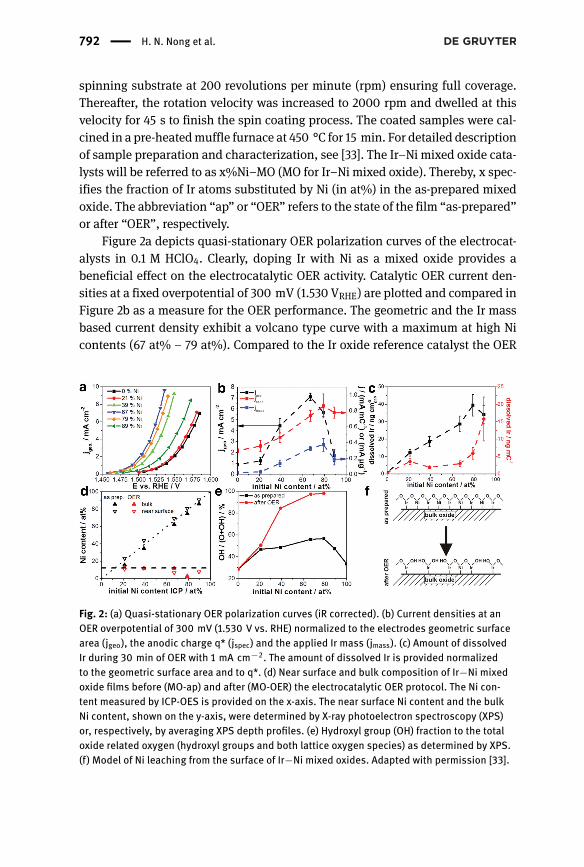
Figure 2a depicts quasi-stationary OER polarization curves of the electrocat-alysts in 0.1 M HClO4. Clearly, doping Ir with Ni as a mixed oxide provides abeneficial effect on the electrocatalytic OER activity. Catalytic OER current den-sities at a fixed overpotential of 300 mV (1.530 VRHE) are plotted and compared inFigure 2b as a measure for the OER performance. The geometric and the Ir massbased current density exhibit a volcano type curve with a maximum at high Nicontents (67 at% – 79 at%). Compared to the Ir oxide reference catalyst the OER
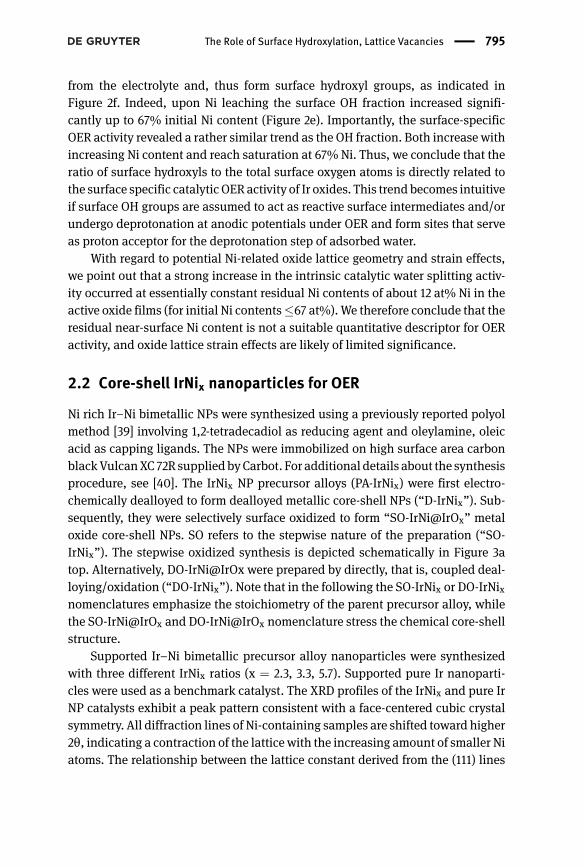
Fig. 2: (a) Quasi-stationary OER polarization curves (iR corrected). (b) Current densities at anOER overpotential of 300 mV (1.530 V vs. RHE) normalized to the electrodes geometric surfacearea (jgeo), the anodic charge q* (jspec) and the applied Ir mass (jmass). (c) Amount of dissolvedIr during 30 min of OER with 1 mA cm−2. The amount of dissolved Ir is provided normalizedto the geometric surface area and to q*. (d) Near surface and bulk composition of Ir−Ni mixedoxide films before (MO-ap) and after (MO-OER) the electrocatalytic OER protocol. The Ni con-tent measured by ICP-OES is provided on the x-axis. The near surface Ni content and the bulkNi content, shown on the y-axis, were determined by X-ray photoelectron spectroscopy (XPS)or, respectively, by averaging XPS depth profiles. (e) Hydroxyl group (OH) fraction to the totaloxide related oxygen (hydroxyl groups and both lattice oxygen species) as determined by XPS.(f) Model of Ni leaching from the surface of Ir−Ni mixed oxides. Adapted with permission [33].
The Role of Surface Hydroxylation, Lattice Vacancies | 793
performance increased by a factor of ∼8, based on the geometric current density(jgeo), or even more remarkably, by a factor of ∼20, based on the Ir mass-basedcurrent density (jmass). The surface specific catalytic current density (current nor-malized by the anodic charge obtained in a fixed window of 0.4–1.4 V RHE) againincreased with the Ni content up to 67% Ni–MO (see Figure 2c), but leveled off athigher Ni contents within the accuracy of the measurement. Compared to pure Iroxide, the surface specific OER activity of sampleswith an initial Ni content at andabove 67% was increased by a factor of about 2.6.
Besides the electrocatalytic activity, the stability is another major concernof OER catalysts. Here the stability against Ir dissolution was measured usingpotential-resolved online ICP-MS analysis [34, 35] on samples, which previouslyunderwent the electrocatalytic OER protocol. In Figure 2c, the total mass of dis-solved Ir during 30 min galvanostatic water electrolysis at 1 mA cm−2 is shownas function of the initial Ni content. For our stability discussion, the dissolvedIr mass was normalized to the geometric (black) as well as the surface-charge-normalized catalyst area. Looking at the geometric stability, the amount of dis-solved Ir first increased with increasing Ni content and peaked at 79% Ni–MO.At this maximum, the Ir dissolution rate is approximately 47 times higher thanthat of pure Ir oxide, while in the case of 67%-MO it is 34 times higher. Althoughthis is a substantial drop in Ir stability relative to the pure Ir oxide, we note thateven the least stable thermally prepared film catalysts of this study exhibited anIr dissolution rate that was comparable to electrochemically oxidized Ir metal,and evenmuch lower than electrochemically oxidizedRumetal [35]. Interestingly,geometric OER performance and geometric Ir dissolution rate peaked at differentNi contents. Furthermore, 21% Ni–MO-OER showed a dissolution rate 14 timeshigher than pure Ir oxide although the geometric OER activity was rather similar.Both observations indicate that the OER activity and stability are not necessarily(anti)correlated. Also, when the amount of dissolved Ir is normalized to the elec-trochemically active Ir oxide surface area a broad plateau appears at Ni contents≤67 at% (red in Figure 2c). The data in Figure 2b and c evidence that, although theIr dissolution rate is rather constant across the plateau, the specific OER activitycan be tuned and increases with the Ni content. This provides further evidencefor the principle possibility of decoupling OER activity and catalyst’s stability.
Recently, the stability number (S-number) was introduced as a metric for sta-bility benchmarking of electrocatalysts [36]. The S-number is defined for OERactivity-stability of Ir-based catalysts as the ratio of the amount of evolved oxygenand the amount of dissolved Ir. The higher the ratio, the more stable the catalystis. We calculated the S-numbers of the IrNi mixed oxides for the measurementsat a current density of 1 mA/cm2 for 30 min, assuming 100% Faraday efficiency.
794 | H. N. Nong et al.
As the result, allmixed oxides showed the S-numbers in the range of 104–105, sim-ilar to those of hydrous IrOx and SrIrOx films [36]. Scanning electron microscopy(SEM) imaging after OER (not shown) indicated that catalysts with≤39 at% initialNi content remained morphologically stable, while the others showed increasingsponge like porosity increasing with higher Ni content. This observation suggeststhat Ni was increasingly leached out of the materials.
To understand Ni leaching, bulk and near surface composition of MO-ap andMO-OER catalysts were determined and plotted against the initial Ni content, seeFigure 2d. The bulk Ni content was determined by averaging X-ray photoelec-tron spectroscopy (XPS)-sputter depth profiles (solid triangles) and for MO-apadditionally by ICP-OES. Both approaches are in excellent agreement for MO-ap,validating the method of averaging XPS depth profiles for bulk Ni content deter-mination. After OER catalysis, bulk and surface Ni content (red symbols) evidencestrong, yet incomplete Ni dissolution. For initial Ni contents ≤67 at%, residual Nivalues levelled at around 12 at%, likely stabilized through interactionwith Ir. Thisobservation is important, as it demonstrates that about 12 at%Ni can be stabilizedin the mixed oxide matrix and may contribute to electronic and geometric effectsbeneficial for the water splitting catalysis.
Grazing incidence X-ray diffraction suggests that themixed oxides in themostinteresting range of 39–89 at% Ni are X-ray amorphous. Selected area electrondiffraction, however, evidenced nano-crystallinity with continuous evolution ofthe broad diffraction pattern. The pattern changed from rutile type structures atlow Ni content toward a brucite-like layered structure at high Ni content.
XPS was used to characterize the chemical state of Ir, Ni and O in MO-ap andMO-OER film catalysts. Herewe focus our attention to theO 1s region,more detailscan be found in [33]. Fits of the O 1s spectra (not shown) revealed up to 4 differentoxygen species at about 529.2, 529.9, 531.4 and 533.1 eV. The species at ∼533.1 eVcan be assigned to adsorbed water, whereas the species at 529.9 eV and 531.4 eVare related to lattice oxygen andhydroxyl groups, respectively [37, 38]. The speciesat 529.2 eV appeared with mixed oxides. The binding energy of lattice oxygen inthe metal oxides is a weak function of the Ni content, the pure NiO being locatedat 529.6 eV. Figure 2e depicts the fraction of surface hydroxyl species (OH-fraction)to the surface oxide related species (OH and both lattice oxygen species). In MO-ap the OH-fraction was just a weak function of the Ni content. The OH fractionafter Ni leaching and OER catalysis, however, increased depending on the initialNi content. Pure Ir oxide showed almost no change in the OH fraction, while filmswith higher initial Ni contents revealed amuch-increasedOH fraction; value closeto 100% was reached for 67–79% Ni–MO-OER.
When Ni is leached from MO-ap films, oxygen atoms lose binding partners,and to assure electroneutrality, theNi-depleted oxygen atomswill take up protons
The Role of Surface Hydroxylation, Lattice Vacancies | 795
from the electrolyte and, thus form surface hydroxyl groups, as indicated inFigure 2f. Indeed, upon Ni leaching the surface OH fraction increased signifi-cantly up to 67% initial Ni content (Figure 2e). Importantly, the surface-specificOER activity revealed a rather similar trend as the OH fraction. Both increase withincreasing Ni content and reach saturation at 67% Ni. Thus, we conclude that theratio of surface hydroxyls to the total surface oxygen atoms is directly related tothe surface specific catalytic OER activity of Ir oxides. This trend becomes intuitiveif surface OH groups are assumed to act as reactive surface intermediates and/orundergo deprotonation at anodic potentials under OER and form sites that serveas proton acceptor for the deprotonation step of adsorbed water.
With regard to potential Ni-related oxide lattice geometry and strain effects,we point out that a strong increase in the intrinsic catalytic water splitting activ-ity occurred at essentially constant residual Ni contents of about 12 at% Ni in theactive oxide films (for initial Ni contents≤67 at%).We therefore conclude that theresidual near-surface Ni content is not a suitable quantitative descriptor for OERactivity, and oxide lattice strain effects are likely of limited significance.
2.2 Core-shell IrNix nanoparticles for OER
Ni rich Ir–Ni bimetallic NPs were synthesized using a previously reported polyolmethod [39] involving 1,2-tetradecadiol as reducing agent and oleylamine, oleicacid as capping ligands. The NPs were immobilized on high surface area carbonblackVulcanXC72R suppliedbyCarbot. For additional details about the synthesisprocedure, see [40]. The IrNix NP precursor alloys (PA-IrNix) were first electro-chemically dealloyed to form dealloyed metallic core-shell NPs (“D-IrNix”). Sub-sequently, they were selectively surface oxidized to form “SO-IrNi@IrOx” metaloxide core-shell NPs. SO refers to the stepwise nature of the preparation (“SO-IrNix”). The stepwise oxidized synthesis is depicted schematically in Figure 3atop. Alternatively, DO-IrNi@IrOx were prepared by directly, that is, coupled deal-loying/oxidation (“DO-IrNix”). Note that in the following the SO-IrNix or DO-IrNixnomenclatures emphasize the stoichiometry of the parent precursor alloy, whilethe SO-IrNi@IrOx and DO-IrNi@IrOx nomenclature stress the chemical core-shellstructure.
Supported Ir–Ni bimetallic precursor alloy nanoparticles were synthesizedwith three different IrNix ratios (x = 2.3, 3.3, 5.7). Supported pure Ir nanoparti-cles were used as a benchmark catalyst. The XRD profiles of the IrNix and pure IrNP catalysts exhibit a peak pattern consistent with a face-centered cubic crystalsymmetry. All diffraction lines of Ni-containing samples are shifted toward higher2θ, indicating a contraction of the lattice with the increasing amount of smaller Niatoms. The relationship between the lattice constant derived from the (111) lines
796 | H. N. Nong et al.
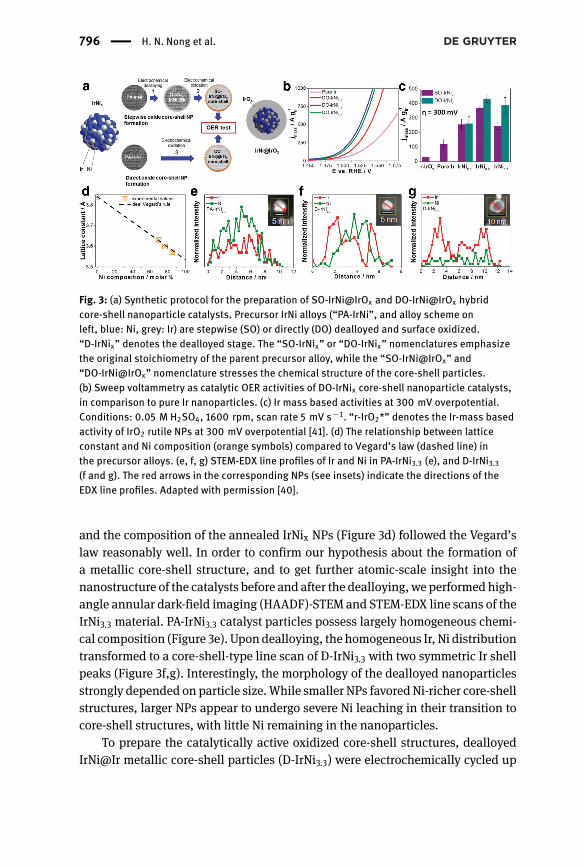
Fig. 3: (a) Synthetic protocol for the preparation of SO-IrNi@IrOx and DO-IrNi@IrOx hybridcore-shell nanoparticle catalysts. Precursor IrNi alloys (“PA-IrNi”, and alloy scheme onleft, blue: Ni, grey: Ir) are stepwise (SO) or directly (DO) dealloyed and surface oxidized.“D-IrNix” denotes the dealloyed stage. The “SO-IrNix” or “DO-IrNix” nomenclatures emphasizethe original stoichiometry of the parent precursor alloy, while the “SO-IrNi@IrOx” and“DO-IrNi@IrOx” nomenclature stresses the chemical structure of the core-shell particles.(b) Sweep voltammetry as catalytic OER activities of DO-IrNix core-shell nanoparticle catalysts,in comparison to pure Ir nanoparticles. (c) Ir mass based activities at 300 mV overpotential.Conditions: 0.05 M H2SO4, 1600 rpm, scan rate 5 mV s−1. “r-IrO2*” denotes the Ir-mass basedactivity of IrO2 rutile NPs at 300 mV overpotential [41]. (d) The relationship between latticeconstant and Ni composition (orange symbols) compared to Vegard’s law (dashed line) inthe precursor alloys. (e, f, g) STEM-EDX line profiles of Ir and Ni in PA-IrNi3.3 (e), and D-IrNi3.3(f and g). The red arrows in the corresponding NPs (see insets) indicate the directions of theEDX line profiles. Adapted with permission [40].
and the composition of the annealed IrNix NPs (Figure 3d) followed the Vegard’slaw reasonably well. In order to confirm our hypothesis about the formation ofa metallic core-shell structure, and to get further atomic-scale insight into thenanostructure of the catalysts before and after the dealloying, we performed high-angle annular dark-field imaging (HAADF)-STEM and STEM-EDX line scans of theIrNi3.3 material. PA-IrNi3.3 catalyst particles possess largely homogeneous chemi-cal composition (Figure 3e). Upon dealloying, the homogeneous Ir, Ni distributiontransformed to a core-shell-type line scan of D-IrNi3.3 with two symmetric Ir shellpeaks (Figure 3f,g). Interestingly, the morphology of the dealloyed nanoparticlesstrongly depended on particle size.While smaller NPs favoredNi-richer core-shellstructures, larger NPs appear to undergo severe Ni leaching in their transition tocore-shell structures, with little Ni remaining in the nanoparticles.
To prepare the catalytically active oxidized core-shell structures, dealloyedIrNi@Ir metallic core-shell particles (D-IrNi3.3) were electrochemically cycled up

The Role of Surface Hydroxylation, Lattice Vacancies | 797
to+1.5 V, where surface Ir atoms are oxidized. For comparison, the homogeneousprecursor alloys PA-IrNi3.3 were subjected to the same cycling protocol in order toachieve simultaneous Ni dealloying and surface Ir oxidation. Synchrotron-basedXPS experiments indicated an essentially complete removal of near-surface Niupon oxidation. Depth resolved Ir 4f core level spectra confirmed the oxidationof near-surface Ir and the retention of somemetallic iridium at larger informationdepth, indicating an oxidized surface and metallic alloy bulk nanostructure.
SO-IrNi@IrOx and DO-IrNi@IrOx core-shell catalysts were subjected to asweep voltammetry protocol in 0.05 M H2SO4. The sweep voltammetry and theIr-mass-based activities of the samples at 300 mV overpotential are presented inFigure 3b,c. All Ni-containing nanoparticle catalysts are more active for the OERthan pure Ir. The most active catalysts are the SO-IrNi3.3 and DO-IrNi3.3 showinga three times higher mass activity compared to pure Ir. Directly oxidized core-shell catalysts showedeven slightly higherOERmass activity than that of stepwiseoxidized samples.
Since carboncanundergooxidativedegradationunderharshOERconditions,an attempt wasmade to prepare high surface area conductive oxide supports. Thepreparation ofmesoporous Sb-, F-, and In-doped SnO2 powders with high surfacearea as catalyst supports are described in [42]. Antimony-doped tin oxide showedhigh surface area, mesoporous structure, good electrical conductivity, and highcorrosion resistance, and thus we utilized this material for our IrNi nanoparticles.IrNi3.3 nanoparticle precursor alloys supported on mesoporous antimony dopedtin oxide (IrNi3.3/Meso-ATO) were prepared starting with the synthesis of Meso-ATO powder support using a soft-templating process involving tetradecylamine(TDA) as a template. Thereafter, IrNixmetallicNPswere synthesizedusing apolyolmethod in the presence of 1,2-tetradecandiol as reducing agent and oleic acid,oleylamine as capping agents. Meso-ATO powder was introduced into the reac-tionmixture before starting themetal reduction. The supported NPs were washedwith ethanol, freeze dried and then thermally treated. The preparation of metal-lic alloy NPs supported on redox active oxides and the removal of capping agentsrequire a careful optimization of a balanced annealing protocol to maintain thechemical state of alloy and support. In order to find an appropriate condition,the materials were annealed at different temperatures (T = 180, 250, 300, 400,500 °C) in inert N2 gas, as opposed to our previous procedure in H2 with the car-bon support, to prevent the reduction of the ATO support. The obtained precursoralloys were denoted as PA-IrNi3.3/Meso-ATO-T, and later used for synthesis of thecore-shell structured catalysts (IrNiOx/Meso-ATO-T). For comparison, pure Ir NPssupported on carbon (Ir/C) were also prepared. The detailed protocols for the syn-thesis, electrode preparation and characterization of all samples can be foundin [43].
798 | H. N. Nong et al.
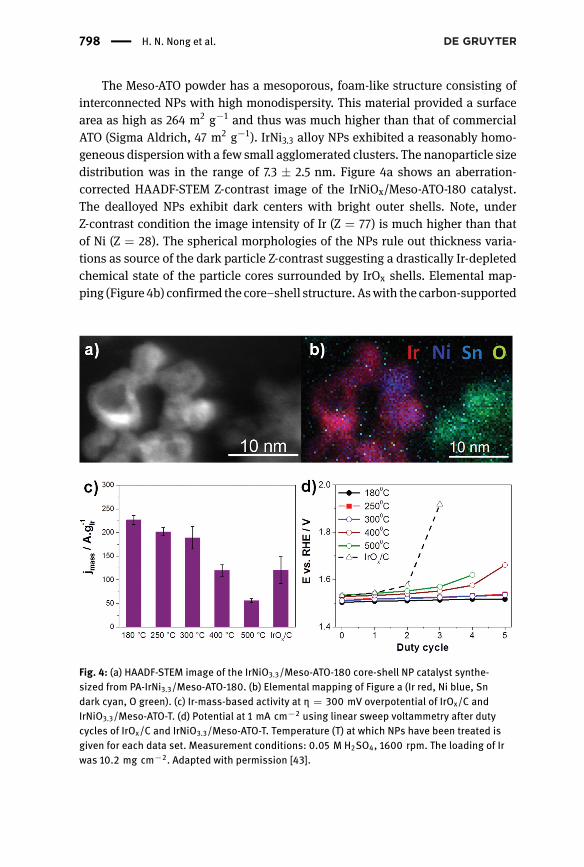
The Meso-ATO powder has a mesoporous, foam-like structure consisting ofinterconnected NPs with high monodispersity. This material provided a surfacearea as high as 264 m2 g−1 and thus was much higher than that of commercialATO (Sigma Aldrich, 47 m2 g−1). IrNi3.3 alloy NPs exhibited a reasonably homo-geneous dispersionwith a few small agglomerated clusters. The nanoparticle sizedistribution was in the range of 7.3 ± 2.5 nm. Figure 4a shows an aberration-corrected HAADF-STEM Z-contrast image of the IrNiOx/Meso-ATO-180 catalyst.The dealloyed NPs exhibit dark centers with bright outer shells. Note, underZ-contrast condition the image intensity of Ir (Z = 77) is much higher than thatof Ni (Z = 28). The spherical morphologies of the NPs rule out thickness varia-tions as source of the dark particle Z-contrast suggesting a drastically Ir-depletedchemical state of the particle cores surrounded by IrOx shells. Elemental map-ping (Figure 4b) confirmed the core–shell structure. Aswith the carbon-supported
Fig. 4: (a) HAADF-STEM image of the IrNiO3.3/Meso-ATO-180 core-shell NP catalyst synthe-sized from PA-IrNi3.3/Meso-ATO-180. (b) Elemental mapping of Figure a (Ir red, Ni blue, Sndark cyan, O green). (c) Ir-mass-based activity at η = 300 mV overpotential of IrOx/C andIrNiO3.3/Meso-ATO-T. (d) Potential at 1 mA cm−2 using linear sweep voltammetry after dutycycles of IrOx/C and IrNiO3.3/Meso-ATO-T. Temperature (T) at which NPs have been treated isgiven for each data set. Measurement conditions: 0.05 M H2SO4, 1600 rpm. The loading of Irwas 10.2 mg cm−2. Adapted with permission [43].
The Role of Surface Hydroxylation, Lattice Vacancies | 799
IrNi3.3, depth-resolved XPS (not shown) confirmed that upon cycling into OERelectrode potentials, the largely metallic precursor alloy gradually depleted in Niand transformed to a thin IrOx shell.
The catalysts were subjected to a sweep voltammetry protocol in 0.05 MH2SO4, and their Ir-mass-based reactivity at an overpotential of 300 mV arepresented in Figure 4c. The IrNiOx/Meso-ATO-T catalysts with T ≤ 300 °C aresignificantly more OER active as compared to the IrOx/C benchmark sample.XPS and HE-XRD PDF results indicated that the precursor alloys annealed atT ≤ 300 °Cmaintained the desired IrNi metallic alloy phase. In contrast, the cat-alysts annealed at 400 °C and 500 °C, showed significantly lower OER activitiesdue to the phase segregation into a NiO and an Ir-rich nanophase. To test thedurability of the catalysts under conditions closer to the operating conditions ofPEM electrolyzers, we applied a potential-step duty-cycle protocol. In this pro-tocol, the potential was first kept at E0.5 (potential at which the current densityreached 0.5 mA cm−2) for a period of 10 min, then increased by 20 mV and keptat the new value for 10 min. This increasing step was repeated for five times untilthe last holding potential Efinal equaled to E0.5 + 100 mV. The process was calledone duty cycle. The duty cycle was repeated five times, and after each duty cycle,the OER activity was tested. Figure 4d plots the electrode potentials at a currentdensity of 1 mA cm−2 measured by linear sweep voltammetry after each dutycycle. The electrode potential of IrOx/C reached>1.9 V after only two duty cycles,indicating the complete degradation of the catalyst. It is noteworthy to mentionthe potential passivation of the glassy carbon substrate under high anodic poten-tial and prolonged polarization, which might contribute to the degradation of thecatalytic performance [44]. Nevertheless, the duty cycle protocol was set suchthat the potentials were in the range of 1.5–1.6 V vs. RHE, where the passivationof the glassy carbon was not severe during the course of the measurement [44].Only in the case of IrOx/C, after two duty cycles the catalyst performance droppeddrastically, requiring higher potentials applied for the 3rd duty cycle and, as theresult, contribution of the substrate passivationmight be larger. IrNiOx/Meso-ATOannealed at lower T showed higher activity and durability than those samplesannealed at 400 and 500 °C. Again, the most active and stable catalyst was theIrNiOx/Meso-ATO-180 material evidencing a successful combination of the activ-ity advantages of core–shell architectures and the durability benefits of an oxidesupport.
To gain insights into the electronic structure of IrNiOx core–shell catalysts,we performedX-ray absorption near-edge structure (XANES)measurements usingIr(Ni)Ox (with and without Ni doping) at the iridium L3 edge [45]. The iridium L3-edge XANES of iridium compounds are characterized by broad white lines, whichprimarily correspond to transition from occupied 2p to empty 5d states [46–48].
800 | H. N. Nong et al.
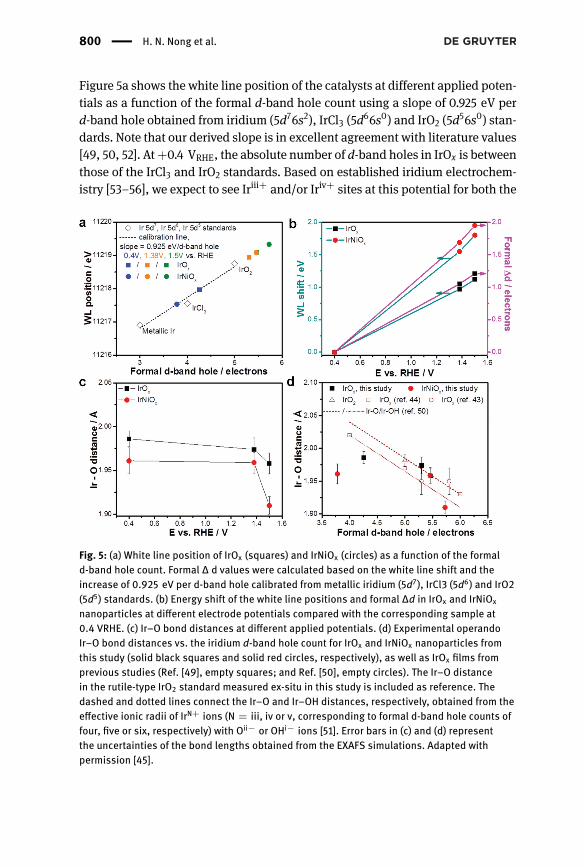
Figure 5a shows the white line position of the catalysts at different applied poten-tials as a function of the formal d-band hole count using a slope of 0.925 eV perd-band hole obtained from iridium (5d76s2), IrCl3 (5d66s0) and IrO2 (5d56s0) stan-dards. Note that our derived slope is in excellent agreement with literature values[49, 50, 52]. At+0.4 VRHE, the absolute number of d-band holes in IrOx is betweenthose of the IrCl3 and IrO2 standards. Based on established iridium electrochem-istry [53–56], we expect to see Iriii+ and/or Iriv+ sites at this potential for both the
Fig. 5: (a) White line position of IrOx (squares) and IrNiOx (circles) as a function of the formald-band hole count. Formal ∆ d values were calculated based on the white line shift and theincrease of 0.925 eV per d-band hole calibrated from metallic iridium (5d7), IrCl3 (5d6) and IrO2(5d5) standards. (b) Energy shift of the white line positions and formal ∆d in IrOx and IrNiOx
nanoparticles at different electrode potentials compared with the corresponding sample at0.4 VRHE. (c) Ir–O bond distances at different applied potentials. (d) Experimental operandoIr–O bond distances vs. the iridium d-band hole count for IrOx and IrNiOx nanoparticles fromthis study (solid black squares and solid red circles, respectively), as well as IrOx films fromprevious studies (Ref. [49], empty squares; and Ref. [50], empty circles). The Ir–O distancein the rutile-type IrO2 standard measured ex-situ in this study is included as reference. Thedashed and dotted lines connect the Ir–O and Ir–OH distances, respectively, obtained from theeffective ionic radii of IrN+ ions (N = iii, iv or v, corresponding to formal d-band hole counts offour, five or six, respectively) with Oii− or OHi− ions [51]. Error bars in (c) and (d) representthe uncertainties of the bond lengths obtained from the EXAFS simulations. Adapted withpermission [45].

The Role of Surface Hydroxylation, Lattice Vacancies | 801
IrOx and IrNiOx samples. In fact, linear combination fitting of the IrOx and IrNiOxXANES regions at +0.4 VRHE confirmed the coexistence of Iriii+ and Iriv+ in bothsamples at such a low electrode potential, along with a small contribution of theIr0 core (12.5%) to the XANES region of IrOx. For IrNiOx, the larger contributionfrom themetallic Ir0 core (61.1%) actually depressed the experimentally observedaverage number of d-band holes below that of IrOx. When the applied potentialwas increased from 0.4 to 1.38 VRHE, the white line position of IrOx and IrNiOxshifted to higher energy due to the oxidation of iridium sites, as observed in thecyclic voltammogram.
To better understand the OER electrochemistry, we correlated the relativewhite line shifts with changes in the formal number of iridium d-band holes (∆d)in IrOx and IrNiOx at the two higher electrode potentials with respect to the num-ber at +0.4 VRHE using the 0.925 eV per d-band hole slope. Data in Figure 5bsuggests that iridium d states in IrNiOx nanoparticles depopulate more rapidlywith electrode potential than those in IrOx. Given the coexistence of Iriii+ andIriv+ sites in both IrOx and IrNiOx at +0.4 VRHE, the experimentally observed ∆dof 1.21 holes for IrOx at +1.5 VRHE is consistent with the generation of formal Iriv+
and Irv+ sites in IrOx under OER conditions. On the other hand, the much larger∆d of 1.95 holes for IrNiOx suggests formal oxidation states approaching Irvi+ inthe nickel-leached oxide particle shell under operando oxygen evolution condi-tions. Even though there is no unanimous consensus on whether redox statesabove the absolute value of IV+ are sustainable in aqueous solutions, we canunequivocally conclude that nickel-depleted IrNiOx nanoparticles exhibit signif-icantly increased d-band holes (hence, formally higher iridium chemical redoxstates) during the OER than IrOx nanoparticles or crystalline rutile-type IrO2. Inother words, the electrochemical removal of nickel atoms from the surface ofIrNiOx nanoparticles and the concomitant electro-oxidation of iridiumatoms gen-erates a catalytically highly active type of iridium oxide in the particle shells witha uniquely high number of d-band holes. Based on their electronic fingerprint, wewill refer to this surface IrOx phase as hole-doped IrOx.
To explore the local geometric structure and ligand environment around irid-ium sites, we performed extended X-ray absorption fine structure (EXAFS) mea-surements and EXAFS simulations. The simulations of EXAFS spectra revealedthe presence of characteristic Ir–O bond distances in the oxidic particle shellsand Ir–M (M = Ir or Ni) distances in the metallic cores, confirming the metaloxide hybrid core–shell structures of both IrOx and IrNiOx. To track the near-est Ir coordination environment of our catalysts under OER conditions, Figure 5cdepicts the evolution of Ir–O bond distances in both IrOx and IrNiOx with theapplied electrode potential. It is common that transition metal–oxygen bonddistances decrease with increasing redox state of the central metal ion [52, 57]
802 | H. N. Nong et al.
because its effective ionic radius decreases. However, when stepping from +0.4to+1.38 VRHE, the Ir–O distances for each sample stay comparable, although irid-ium reaches higher redox states. This observation canbe explainedbased on char-acteristic differences in the iridium ligands, which range from oxo (O), hydroxo(OH) to aqua (OH2). In anodic IrOx films prepared by potential cycling metalliciridium films in an acidic environment – similar to the electrochemical proto-col applied for the nanoparticles in this study – hydroxo species are dominantat low electrode potential (+0.24 VRHE) [55]. The species undergo deprotonationto oxo species at higher electrode potential (+1.14 and +1.49 VRHE, respectively),while aqua ligands seem to have no strong interaction with the surface [55]. Thetheoretical Ir–OH distance is shorter than the theoretical Ir–O distance if the irid-ium oxidation state and coordination number remain the same [51]. In fact, thecoordination numbers are comparable at the three electrode potentials; therefore,the deprotonation of hydroxo to oxo ligands offsets redox state effects on bondlengths, thus accounting for the nearly constant Ir–O bond distance in IrOx andIrNiOx during iridium oxidation between +0.4 and +1.38 VRHE. The observed Ir–O bond lengths in the IrOx nanoparticles are in good quantitative agreement withother in situ EXAFS studies on IrOx films and IrO2 nanoparticles [49, 50, 58]. Incontrast, unusually short Ir–O bond lengths in the shells of IrNiOx nanoparticles,in particular under conditions of oxygen evolution at +1.5 VRHE, were observed.
To emphasize the correlationof the electronic andgeometric structures of IrOxand IrNiOx, Figure 5d shows Ir–O bond distances in IrOx and IrNiOx nanoparticlesas a function of the formal d-band hole count, together with previously reportedIr–O distances in IrOx films [49, 50]. Theoretical Ir–O and Ir–OH distances (dottedand dashed lines) computed from the effective ionic radii of IrN+ ions with Oii−
or OHi− ions are also shown as references [51]. The correlation between datasetsin Figure 5d testifies to the very unusual oxygen ligand environment of iridiumcentres in the shell of IrNiOx nanoparticles. In particular, our data reveal substan-tially shorter Ir–O bond lengths (1.91 Å) in nickel-leached electrochemical oxideparticle shells compared with conventional iridium oxides [49, 50, 58].
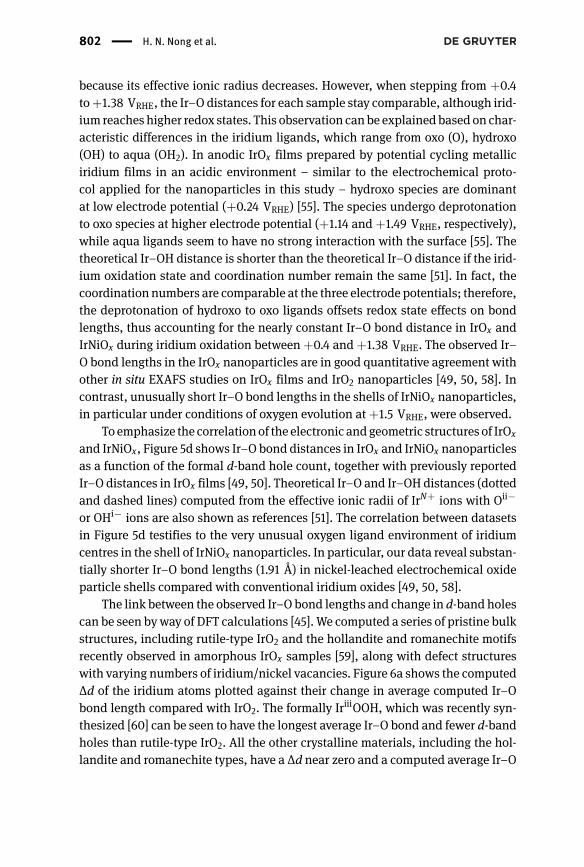
The link between the observed Ir–O bond lengths and change in d-band holescan be seen byway of DFT calculations [45].We computed a series of pristine bulkstructures, including rutile-type IrO2 and the hollandite and romanechite motifsrecently observed in amorphous IrOx samples [59], along with defect structureswith varying numbers of iridium/nickel vacancies. Figure 6a shows the computed∆d of the iridium atoms plotted against their change in average computed Ir–Obond length compared with IrO2. The formally IriiiOOH, which was recently syn-thesized [60] can be seen to have the longest average Ir–O bond and fewer d-bandholes than rutile-type IrO2. All the other crystalline materials, including the hol-landite and romanechite types, have a ∆d near zero and a computed average Ir–O
The Role of Surface Hydroxylation, Lattice Vacancies | 803
Fig. 6: Computed electronic structure of iridium oxides with various metal-vacancy densities.(a) Computed ∆d of the iridium atoms plotted against their change in average computed Ir–Obond length compared with that in rutile-type IrO2. (b) Computed ∆p – the change in the oxy-gen hole character relative to oxygen in rutile-type IrO2 – plotted against the computed ∆d.(c–e) Projected density of iridium 5d and oxygen 2p states for rutile-type IrO2 (c), iridium andoxygen at an iridium vacancy in Ir47O96 (d) and iridium and oxygen in the vacancy-rich Ir3O8 (e).E, energy; Ef, energy of the Fermi level. Reproduced with permission [45].
bond length near that of rutile-type IrO2. Introducing defects increases ∆d of theiridium atoms near the metal vacancy while simultaneously decreasing the aver-age Ir–O bond length. For the lowest density ofmetal vacancies, Ir47O96, ∆d is lessthan 0.1 electron and the average Ir–O bond remains nearly unchanged comparedwith that in IrO2. At higher metal-vacancy densities (that is, Ir7O16), the averageIr–O bond length of the iridium atoms near the vacancy drops by nearly 0.02 Å,consistent with the IrOx samples investigated here, although ∆d remains below0.2 electron. It is not until the material becomes extremely defective – with a sto-ichiometry (Ir3O8) – that the average Ir–O bond length drops to values observedfor IrNiOx, with a concomitant increase in ∆d to ∼0.3–0.4 electron.
The calculations also reveal a profound effect of these short Ir–O bonds onthe ligands. To see this, we define (in analogy to ∆d) ∆p as the change in theoxygen hole character relative to oxygen in rutile-type IrO2 (Figure 6b), whereonly the oxygen atoms near the iridium vacancies are considered for the defectstructures. At the lowest metal-vacancy density, where ∆d < 0.1 electron, ∆p on
804 | H. N. Nong et al.
the oxygen atoms near the defect can reach 0.2 electron; that is, the oxygen isoxidized, becoming more electrophilic than in rutile-type IrO2. In the case ofthe highly defective structures, with an Ir3O8 stoichiometry, the short Ir–O bondlength leads to increased orbital overlap and a ∆p of 0.3 electron. This behaviourcan also be seen in the projected density of states (PDOS), where, as the iridiumvacancy density increases, the amount of iridium 5d and oxygen 2p character at∼1 eV above the Fermi energy grows (see Figure 6c–e). In the most extreme case,the average Ir–O bond length reaches those observed for IrNiOx, and the oxygenhole contribution to the ground state becomes so large that the unoccupied statesjust above the Fermi energy are a near-equal mix of oxygen 2p and iridium 5d (seeFigure 6e).
While bond length contraction could lead to oxygen 2p hole formation,inspection of the occupied states suggests that a lowering of the iridium 5d statesdue to an increase in ∆d might instead be responsible. The occupied PDOS val-ues show that as the number of iridium vacancies increases, the character ofthe σ-bonding state at around −7 eV changes from equally mixed oxygen 2p andiridium 5d to strongly iridium 5d. These changes are reminiscent of entering a neg-ative charge-transfer or self-doped regime, where the metal d states lie below theoxygen 2p before hybridization [61]. Such a situation would result in the appear-ance of ground-state oxygenholes–whichwe formally call OI− or,more generally,O(ii-δ)−. We confirmed that the lowering of the iridium 5d states with increasingiridium vacancy concentration is sufficient to produce oxygen holes by comput-ing the PDOS for the vacancy-rich structures without including atomic relaxation.Thus, the increase in ∆d drives oxygen hole formation because it pushes theiridium 5d states below the oxygen 2p.
To see oxygen hole character experimentally, the method of choice is X-rayabsorption spectroscopy (XAS) at the O K-edge. We performed such O K-edgeXASmeasurements with the core-shell IrNiOx nanoparticles under potential con-trol in 0.05 M H2SO4. The precursor alloy IrNi3.3 NPs were deposited onto Nafionmembranes, which were previously sputtered with ca. 1.4 nm carbon. During NPdeposition 8 µL of the NP suspensionwas added onto themembrane and a poten-tial of +2V were applied to the membrane (as working electrode) for 75 min.Afterwards, membranes were rinsed shortly with absolute ethanol to removeexcess NP suspension. Finally, two layers of graphene were deposited onto IrNiNPs/Nafion samples. Graphene was prepared by etching away the Cu side of aGraphene/Cu foil (Graphenea) in 40 g/L ammonium persulfate overnight. TheO K-edge spectra were acquired using our homemade cell and a high-pressureXPS/XAS spectrometer. The cell consists of an electrolyte compartment with flow-ing 0.05 M H2SO4, a vacuum chamber, and the Nafion membrane with graphene
The Role of Surface Hydroxylation, Lattice Vacancies | 805
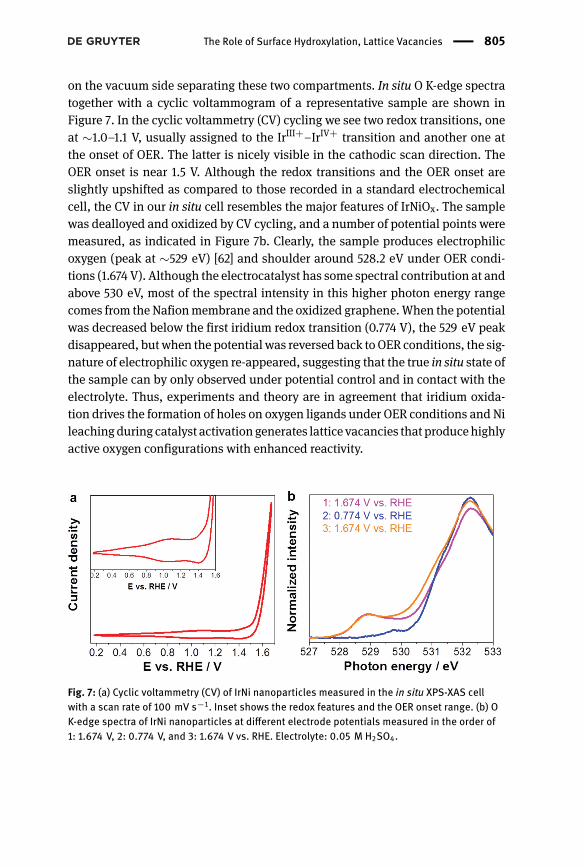
on the vacuum side separating these two compartments. In situ O K-edge spectratogether with a cyclic voltammogram of a representative sample are shown inFigure 7. In the cyclic voltammetry (CV) cycling we see two redox transitions, oneat ∼1.0–1.1 V, usually assigned to the IrIII+–IrIV+ transition and another one atthe onset of OER. The latter is nicely visible in the cathodic scan direction. TheOER onset is near 1.5 V. Although the redox transitions and the OER onset areslightly upshifted as compared to those recorded in a standard electrochemicalcell, the CV in our in situ cell resembles the major features of IrNiOx. The samplewas dealloyed and oxidized by CV cycling, and a number of potential points weremeasured, as indicated in Figure 7b. Clearly, the sample produces electrophilicoxygen (peak at ∼529 eV) [62] and shoulder around 528.2 eV under OER condi-tions (1.674 V). Although the electrocatalyst has some spectral contribution at andabove 530 eV, most of the spectral intensity in this higher photon energy rangecomes from the Nafionmembrane and the oxidized graphene.When the potentialwas decreased below the first iridium redox transition (0.774 V), the 529 eV peakdisappeared, butwhen the potential was reversed back toOER conditions, the sig-nature of electrophilic oxygen re-appeared, suggesting that the true in situ state ofthe sample can by only observed under potential control and in contact with theelectrolyte. Thus, experiments and theory are in agreement that iridium oxida-tion drives the formation of holes on oxygen ligands under OER conditions and Nileachingduring catalyst activationgenerates lattice vacancies that producehighlyactive oxygen configurations with enhanced reactivity.
Fig. 7: (a) Cyclic voltammetry (CV) of IrNi nanoparticles measured in the in situ XPS-XAS cellwith a scan rate of 100 mV s−1. Inset shows the redox features and the OER onset range. (b) OK-edge spectra of IrNi nanoparticles at different electrode potentials measured in the order of1: 1.674 V, 2: 0.774 V, and 3: 1.674 V vs. RHE. Electrolyte: 0.05 M H2SO4.
806 | H. N. Nong et al.
2.3 Photovoltaic-biased electrosynthetic cell (PV-EC) test withIrNiOx
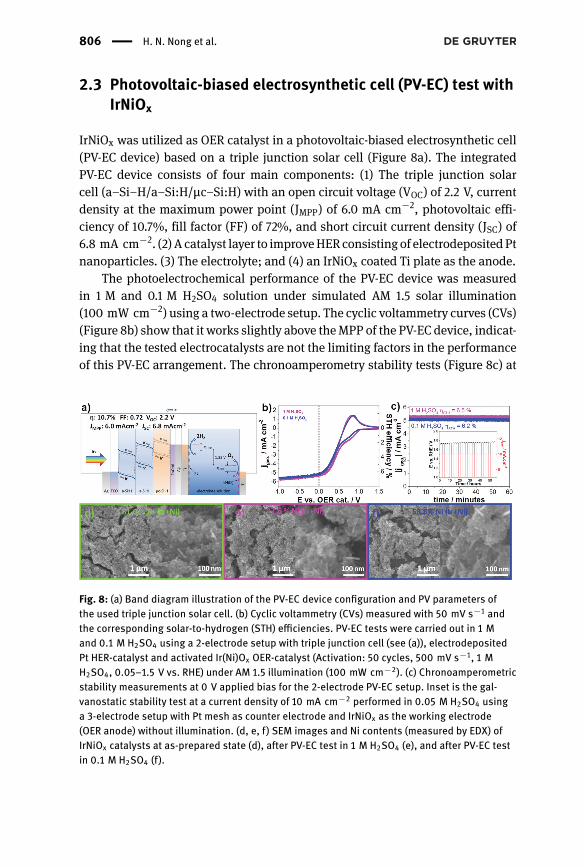
IrNiOx was utilized as OER catalyst in a photovoltaic-biased electrosynthetic cell(PV-EC device) based on a triple junction solar cell (Figure 8a). The integratedPV-EC device consists of four main components: (1) The triple junction solarcell (a–Si–H/a–Si:H/µc–Si:H) with an open circuit voltage (VOC) of 2.2 V, currentdensity at the maximum power point (JMPP) of 6.0 mA cm−2, photovoltaic effi-ciency of 10.7%, fill factor (FF) of 72%, and short circuit current density (JSC) of6.8 mA cm−2. (2) A catalyst layer to improveHERconsisting of electrodepositedPtnanoparticles. (3) The electrolyte; and (4) an IrNiOx coated Ti plate as the anode.
The photoelectrochemical performance of the PV-EC device was measuredin 1 M and 0.1 M H2SO4 solution under simulated AM 1.5 solar illumination(100 mW cm−2) using a two-electrode setup. The cyclic voltammetry curves (CVs)(Figure 8b) show that it works slightly above theMPP of the PV-EC device, indicat-ing that the tested electrocatalysts are not the limiting factors in the performanceof this PV-EC arrangement. The chronoamperometry stability tests (Figure 8c) at
Fig. 8: (a) Band diagram illustration of the PV-EC device configuration and PV parameters ofthe used triple junction solar cell. (b) Cyclic voltammetry (CVs) measured with 50 mV s−1 andthe corresponding solar-to-hydrogen (STH) eflciencies. PV-EC tests were carried out in 1 Mand 0.1 M H2SO4 using a 2-electrode setup with triple junction cell (see (a)), electrodepositedPt HER-catalyst and activated Ir(Ni)Ox OER-catalyst (Activation: 50 cycles, 500 mV s−1, 1 MH2SO4, 0.05–1.5 V vs. RHE) under AM 1.5 illumination (100 mW cm−2). (c) Chronoamperometricstability measurements at 0 V applied bias for the 2-electrode PV-EC setup. Inset is the gal-vanostatic stability test at a current density of 10 mA cm−2 performed in 0.05 M H2SO4 usinga 3-electrode setup with Pt mesh as counter electrode and IrNiOx as the working electrode(OER anode) without illumination. (d, e, f) SEM images and Ni contents (measured by EDX) ofIrNiOx catalysts at as-prepared state (d), after PV-EC test in 1 M H2SO4 (e), and after PV-EC testin 0.1 M H2SO4 (f).
The Role of Surface Hydroxylation, Lattice Vacancies | 807
0 V applied bias show stable photocurrents over the course of 1 h for both elec-trolytes, the current densities correspond to solar-to-hydrogen (STH) efficienciesof 6.5% and 6.2% (assuming 100% faradaic efficiency) for the measurements in1 M and 0.1 M H2SO4, respectively. Galvanostatic test of the IrNiOx catalyst at acurrent density of 10 mA cm−2 using a 3-electrode setup without illumination(Figure c inset) highlights the stability of the OER catalyst. The electrode potentialwas stable under the course of over 50 h.
SEM images of the as-prepared IrNiOx anode (Figure 8d) show theporousmor-phology of the catalyst layer with a mud-crack structure. At high magnification,besides theprimarily interconnected spherical particles, some fineneedle-shapedstructures are observed, which can presumably be attributed to segregated irid-ium oxide [33]. After PV-EC tests in 1 M and 0.1 M H2SO4, the grains became lessdefined and more porous. EDX indicates the morphology changes are linked toNi leaching, the Ni content (vs. total Ir and Ni) decreased from 81.0% in the as-prepared sample to 37.6% and 58.8% in 1 M and 0.1 M H2SO4-tested samples,respectively.
3 Conclusions and outlookIn this mini review, we have highlighted selected advances in our understandingof Ir–Ni bimetallic oxide electrocatalysts for the OER in acidic environments.
Ir–Ni bimetallic oxide thin films offer significantly improved geometric,mass-based, and real surface based electrocatalytic OER reactivities, even if the cata-lyst synthesis is conducted at elevated annealing temperatures, such as 450 °C,where pure Ir oxide catalyst yield consistently lower OER reactivities. The ele-vated annealing temperature are beneficial for the mechanical and electrochem-ical stability of the bimetallic oxide films. Data showed that the Ni doping of Iroxides delay the crystallization of the bimetallic Ir–Ni oxide films. Upon expo-sure to acidic electrolytes, the electrochemical dissolution of Ni ion into the elec-trolyte leaves behind an amorphous hydrous IrOx surface characterized by a veryhigh degree of surface hydroxylation, which, for pure Ir oxide films, can only beobtained at much lower film annealing temperatures that are associated withstronger corrosive instabilities of these films of around 2.5 ngIr mC−1. In otherwords, Ni atoms aided in achieving preferable chemical surface terminationsunder preparation conditions that are beneficial from a stability point of view.
Further experimental studies explored the chemical nature and chemicalstate of the reactive surface hydroxyls in Ni-depleted Ir oxide films and dealloyedIrNi@IrOx nanoparticles. The generation of Ir lattice vacancies in the activatedOER catalysts, caused by acidic Ni leaching, increased the d holes character of Ir
808 | H. N. Nong et al.
and resulted in much shortened local Ir–O bond distances. In addition, Ni leach-ing from Ir–Nimixedoxides also resulted in the concurrent generation ofOpholesin the activated catalysts. DFT-based computational results indicated that Ni dop-ing into rutile IrO2 lattices, replacing Ir with Ni, followed by Ni dissolution fromthe lattice results in a lattice-vacancy-rich, electronhole-doped lattice,where pos-itive holes are located on both the metal ion centers and on the oxygen ligands inagreement with the spectroscopic measurements. Increases in Ir d hole characteris closely correlated with increases in O p hole character. As a result of this, theelectrophilic oxygen ligands, owing to their hole character, offer reduced kineticbarriers to the nucleophilic attack by water molecules. In that process bridgingor terminal O ligands in sufficient proximity act as hydrogen acceptors. It is ourconviction that most, if not all, other previously described Ir-based multimetalliccatalyst concepts and systems, for instancemulti-metal Iridate perovskite materi-als, follow closely the outlined activationmechanism in acidic solutions involvinginitial surfacemetal leaching. After themetal leaching has reached completion ora low reaction rate, a core-shell type structure is established. The highly latticedefective, hydroxylated Ir oxide displays favorable OER reaction rates due to the(re)generation of catalytically active electrophilic oxygen ligands in their highlydefective Ir oxide lattices.
More generally, the presented data suggests that electrochemically leached,hydroxyl-rich Ir oxide of any kind should follow the geometric and electronicstructure transformation outlined above. Their enhanced hole-doped state withelectrophilic oxygen ligands is highly conducive to improved catalytic water oxi-dation rates, at least up to the range of 10 mA cm−2 tested. Whether or not sac-rificial dopants such as Ni discussed here provides a beneficial effect on the OERrates at industrially relevant current densities, this still needs to be confirmed. Theactivated Ni-depleted Ir oxide OER catalyst were finally deployed as anode cata-lysts on the oxidic passivation layer of multi-junction photoelectrochemical cellsand exhibited good solar to hydrogen efficiencies and sustained STH efficienciesover 1 h of continued operation.
In a somewhat broader context, the comparison of the catalytic performanceof leached IrNiOx core-shell nanocatalysts [33, 45] to other Ir-based nanopar-ticle catalyst concepts [41, 63–65] as well as non-precious metal-based elec-trocatalyst concepts, such as electrodeposited hydrous Cobalt oxides or Nickeloxides [66, 67], reveals a significant efficiency benefit of the present Ni-leachedIrNiOx-based nanoparticles in terms of kinetic overpotential of the OER as wellas stability benefit due to the corrosive nature of the noble metal-free conceptsin acidic electrolyzes. In alkaline conditions, the present IrNiOx catalysts as wellas previously reported Ir-based catalysts [68] perform comparable to their noble
The Role of Surface Hydroxylation, Lattice Vacancies | 809
metal free counterparts in terms of efficiency and stability. However, a direct com-parison of catalysts that unfold their optimumperformance under vastly differentoperating conditions, such as Ni–Fe-oxides in strongly alkaline or Iridium-basedcatalysts in strongly acidic conditions, is notoriously problematic and of littlepracticalmerit. In addition, it should be noted that the catalyst cost, be it preciousor non-precious, at today’s production scales are rather insignificant compared toinput electricity cost (PV-Electrolyzer schemes) or cost of other PEC cell compo-nents. Acidic conditions are considered the preferred mode of operation of Poly-mer Electrolyte Membrane Water Electrolyzers (PEMWEs) where cell efficiency isthe primary focus, because input electricity is controlling the overall total cost ofownership. This is because alkaline operating conditions generally cause addi-tional efficiency losses at the HER catalysts as well as the OER catalysts, and, ontop, additional ohmic losses arise due to lower hydroxyl ionmobility. On the otherhand, alkaline conditions are preferred where efficiency considerations are sec-ondary and focus is entirely placed on catalyst or device cost. Thismay be the casefor small-scale PEC systems. The lower alkaline efficiency, however, will even-tually require larger active cell areas at a given required hydrogen yield, whichtypically drives up the total cost of larger-scale PEC systems due to the need oflarger quantities of the non-catalyst cell components (membrane, semiconductor,electrolyte, etc.). Hence, for both PEMWEs and PECs, catalyst and cell efficiencyoften trumps catalyst cost.
Concerning future deployment of leached bimetallic Ir oxides on the anode ofphotoelectrochemical cells, more work needs to be done to understand the inter-action of oxidic catalysts with their supporting backing layers. This is becausecatalyst studies to date often do not include the effect of supports and backingspertinent toPECs.Here futureworkmust focuson the typical backing layermateri-als used in both buried junction PEC schemes, as well as selected oxidicmaterialsof non-buried junction PECs [69].
Acknowledgements: Financial support by the German Research Foundation(DFG) under the Priority Program 1613 is gratefully acknowledged. We thank theHZB for allocation of synchrotron radiation beamtime.
References1. J. L. Sawin, F. Sverrisson, J. Rutovitz, S. Dwyer, S. Teske, H. E. Murdock, R. Adib,
F. Guerra, H. E. Murdock, L. H. Blanning, F. Guerra, V. Hamirwasia, A. Misra, K. Satzinger,L. E. Williamson, M. Lie, A. Nilsson, E. Aberg, S. Weckend, H. Wuester, R. Ferroukhi,C. Garcia, A. Khalid, M. Renner, M. Taylor, B. Epp, K. Seyboth, J. Skeen, G. Kamiya,L. Munuera, F. Appavou, A. Brown, B. Kondev, E. Musolino, A. Brown, L. Mastny, L. Arris,
810 | H. N. Nong et al.
Renewables 2018 – Global status report A comprehensive annual overview of the state ofrenewable energy Advancing the global renewable energy transition – Highlights of theREN21 Renewables 2018 Global Status Report in perspective; 978-3-9818911-3-3; France(2018), P. 542.
2. N. S. Lewis, D. G. Nocera, Proc. Natl. Acad. Sci. U.S.A. 103 (2006) 15729.3. T. da Silva Veras, T. S. Mozer, D. da Costa Rubim Messeder dos Santos, A. da Silva César,
Int. J. Hydrogen Energy 42 (2017) 2018.4. F. M. Sapountzi, J. M. Gracia, C. J. Weststrate, H. O. A. Fredriksson, J. W. Niemantsverdriet,
Progr. Energy Combust. Sci. 58 (2017) 1.5. F. F. Abdi, L. Han, A. H. M. Smets, M. Zeman, B. Dam, R. van de Krol, Nat. Commun. 4 (2013)
2195.6. J. W. Ager, M. R. Shaner, K. A. Walczak, I. D. Sharp, S. Ardo, Energy Environ. Sci. 8 (2015)
2811.7. M. M. May, H.-J. Lewerenz, D. Lackner, F. Dimroth, T. Hannappel, Nat. Commun. 6 (2015)
8286.8. D. G. Nocera, Acc. Chem. Res. 45 (2012) 767.9. F. Urbain, V. Smirnov, J.-P. Becker, A. Lambertz, F. Yang, J. Ziegler, B. Kaiser,
W. Jaegermann, U. Rau, F. Finger, Energy Environ. Sci. 9 (2016) 145.10. M. Carmo, D. L. Fritz, J. Merge, D. Stolten, Int. J. Hydrogen Energy 38 (2013) 4901.11. J. Mergel, M. Carmo, D. Fritz, In: Transition to Renewable Energy Systems, D. Stolten,
V. Scherer, Eds. Wiley-VCH Verlag GmbH & Co. KGaA, Weinheim, Germany (2013),P. 423–450.
12. F. Dionigi, T. Reier, Z. Pawolek, M. Gliech, P. Strasser, ChemSusChem. 9 (2016) 962.13. F. Dionigi, P. Strasser, Adv. Energy Mater. 6 (2016) 1600621.14. T. Reier, M. Oezaslan, P. Strasser, ACS Catal. 2 (2012) 1765.15. D. Todd, M. Schwager, W. Mérida, J. Power Sources 269 (2014) 424.16. C. Spöri, J. T. H. Kwan, A. Bonakdarpour, D. P. Wilkinson, P. Strasser, Angew. Chem. Int. Ed.
56 (2017) 5994.17. F. E. Osterloh, Chem. Soc. Rev. 42 (2013) 2294.18. J. O. Bockris, J. Chem. Phys. 24 (1956) 817.19. S. Trasatti, J. Electroanal. Chem. 111 (1980) 125.20. W. T. Hong, M. Risch, K. A. Stoerzinger, A. Grimaud, J. Suntivich, Y. Shao-Horn, Energy
Environ. Sci. 8 (2015) 1404.21. J. Rossmeisl, A. Logadottir, J. K. Nørskov, Chem. Phys. 319 (2005) 178.22. H. Dau, C. Limberg, T. Reier, M. Risch, S. Roggan, P. Strasser, ChemCatChem. 2 (2010) 724.23. I. C. Man, H.-Y. Su, F. Calle-Vallejo, H. A. Hansen, J. I. Martínez, N. G. Inoglu, J. Kitchin,
T. F. Jaramillo, J. K. Nørskov, J. Rossmeisl, ChemCatChem. 3 (2011) 1159.24. J. Rossmeisl, Z. W. Qu, H. Zhu, G. J. Kroes, J. K. Nørskov, J. Electroanal. Chem. 607 (2007)
83.25. T. Reier, H. N. Nong, D. Teschner, R. Schlögl, P. Strasser, Adv. Energy Mater. 7 (2017)
1601275.26. S. Cherevko, S. Geiger, O. Kasian, N. Kulyk, J.-P. Grote, A. Savan, B. R. Shrestha,
S. Merzlikin, B. Breitbach, A. Ludwig, K. J. J. Mayrhofer, Catal. Today 262(Supplement C)(2016) 170.
27. S. Cherevko, T. Reier, A. R. Zeradjanin, Z. Pawolek, P. Strasser, K. J. J. Mayrhofer,Electrochem. Commun. 48(Supplement C) (2014) 81.
28. L. Gan, M. Heggen, R. O’Malley, B. Theobald, P. Strasser, Nano Lett. 13 (2013) 1131.
The Role of Surface Hydroxylation, Lattice Vacancies | 811
29. C. Cui, L. Gan, H. H. Li, S. H. Yu, M. Heggen, P. Strasser, Nano Lett. 12 (2012) 5885.30. B. Han, C. E. Carlton, A. Kongkanand, R. S. Kukreja, B. R. Theobald, L. Gan, R. O’Malley,
P. Strasser, F. T. Wagner, Y. Shao-Horn, Energy Environ. Sci. 8 (2015) 258.31. C. Baldizzone, L. Gan, N. Hodnik, G. P. Keeley, A. Kostka, M. Heggen, P. Strasser,
K. J. J. Mayrhofer, ACS Catal. 5 (2015) 5000.32. S. Rudi, L. Gan, C. Cui, M. Gliech, P. Strasser, J. Electrochem. Soc. 162 (2015) F403.33. T. Reier, Z. Pawolek, S. Cherevko, M. Bruns, T. Jones, D. Teschner, S. Selve, A. Bergmann,
H. N. Nong, R. Schlögl, K. J. J. Mayrhofer, P. Strasser, J. Am. Chem. Soc. 137 (2015) 13031.34. S. Cherevko, A. Topalov, A. Zeradjanin, G. Keeley, K. J. Mayrhofer, Electrocatalysis 5 (2014)
235.35. S. Cherevko, A. R. Zeradjanin, A. A. Topalov, N. Kulyk, I. Katsounaros, K. J. J. Mayrhofer,
ChemCatChem. 6 (2014) 2219.36. S. Geiger, O. Kasian, M. Ledendecker, E. Pizzutilo, A. M. Mingers, W. T. Fu,
O. Diaz-Morales, Z. Li, T. Oellers, L. Fruchter, A. Ludwig, K. J. J. Mayrhofer, M. T. M. Koper,S. Cherevko, Nat. Catal. 1 (2018) 508.
37. A. P. Grosvenor, B. A. Kobe, N. S. McIntyre, Surf. Sci. 572 (2004) 217.38. T. Reier, D. Teschner, T. Lunkenbein, A. Bergmann, S. Selve, R. Kraehnert, R. Schlögl,
P. Strasser, J. Electrochem. Soc. 161 (2014) F876.39. K. Ahrenstorf, O. Albrecht, H. Heller, A. Kornowski, D. Görlitz, H. Weller, Small 3 (2007)
271.40. H. N. Nong, L. Gan, E. Willinger, D. Teschner, P. Strasser, Chem. Sci. 5 (2014) 2955.41. Y. Lee, J. Suntivich, K. J. May, E. E. Perry, Y. Shao-Horn, J. Phys. Chem. Lett. 3 (2012) 399.42. H.-S. Oh, H. N. Nong, P. Strasser, Adv. Funct. Mater. 25 (2015) 1074.43. H. N. Nong, H. S. Oh, T. Reier, E. Willinger, M. G. Willinger, V. Petkov, D. Teschner, P.
Strasser, Angew. Chem. Int. Ed. 54 (2015) 2975.44. S. Geiger, O. Kasian, A. M. Mingers, S. S. Nicley, K. Haenen, K. J. J. Mayrhofer, S. Cherevko,
ChemSusChem. 10 (2017) 4140.45. H. N. Nong, T. Reier, H.-S. Oh, M. Gliech, P. Paciok, T. H. T. Vu, D. Teschner, M. Heggen,
V. Petkov, R. Schlögl, T. Jones, P. Strasser, Nat. Catal. 1 (2018) 841.46. M. Brown, R. E. Peierls, E. A. Stern, Phys. Rev. B 15 (1977) 738.47. J. H. Choy, D. K. Kim, G. Demazeau, D. Y. Jung, J. Phys. Chem. 98 (1994) 6258.48. J. P. Clancy, N. Chen, C. Y. Kim, W. F. Chen, K. W. Plumb, B. C. Jeon, T. W. Noh, Y.-J. Kim,
Phys. Rev. B 86 (2012) 195131.49. Y. Mo, I. C. Stefan, W.-B. Cai, J. Dong, P. Carey, D. A. Scherson, J. Phys. Chem. B 106 (2002)
3681.50. A. R. Hillman, M. A. Skopek, S. J. Gurman, Phys. Chem. Chem. Phys. 13 (2011) 5252.51. R. Shannon, Acta Cryst. 32 (1976) 751.52. J.-H. Choy, D.-K. Kim, S.-H. Hwang, G. Demazeau, D.-Y. Jung, J. Am. Chem. Soc. 117 (1995)
8557.53. B. E. Conway, J. Mozota, Electrochim. Acta 28 (1983) 9.54. E. J. Frazer, R. Woods, J. Electroanal. Chem. 102 (1979) 127.55. R. Kötz, H. Neff, S. Stucki, J. Electrochem. Soc. 131 (1984) 72.56. J. Mozota, B. E. Conway, Electrochim. Acta 28 (1983) 1.57. M. Görlin, P. Chernev, J. Ferreira de Araújo, T. Reier, S. Dresp, B. Paul, R. Krähnert, H. Dau,
P. Strasser, J. Am. Chem. Soc. 138 (2016) 5603.58. D. F. Abbott, D. Lebedev, K. Waltar, M. Povia, M. Nachtegaal, E. Fabbri, C. Copéret,
T. J. Schmidt, Chem. Mater. 28 (2016) 6591.
812 | H. N. Nong et al.
59. E. Willinger, C. Massué, R. Schlögl, M. G. Willinger, J. Am. Chem. Soc. 138 (2017) 12093.60. D. Weber, L. M. Schoop, D. Wurmbrand, J. Nuss, E. M. Seibel, F. F. Tafti, H. Ji, R. J. Cava,
R. E. Dinnebier, B. V. Lotsch, Chem. Mater. 29 (2017) 8338.61. A. V. Ushakov, S. V. Streltsov, D. I. Khomskii, J. Phys. Condens. Matter. 23 (2011) 445601.62. V. Pfeifer, T. E. Jones, J. J. Velasco Velez, R. Arrigo, S. Piccinin, M. Havecker,
A. Knop-Gericke, R. Schlogl, Chem. Sci. 8 (2017) 2143.63. C. Wang, Y. Sui, G. Xiao, X. Yang, Y. Wei, G. Zou, B. Zou, J. Mater. Chem. A 3 (2015) 19669.64. P. Lettenmeier, L. Wang, U. Golla-Schindler, P. Gazdzicki, N. A. Cañas, M. Handl, R.
Hiesgen, S. S. Hosseiny, A. S. Gago, K. A. Friedrich, Angew. Chem. Int. Ed. 55 (2016) 742.65. A. Grimaud, A. Demortière, M. Saubanère, W. Dachraoui, M. Duchamp, M.-L. Doublet,
J.-M. Tarascon, Nat. Energy 2 (2016) 16189.66. M. W. Kanan, D. G. Nocera, Science 321 (2008) 1072.67. T. W. Kim, K.-S. Choi, Science 343 (2014) 990.68. L. C. Seitz, C. F. Dickens, K. Nishio, Y. Hikita, J. Montoya, A. Doyle, C. Kirk, A. Vojvodic,
H. Y. Hwang, J. K. Norskov, T. F. Jaramillo, Science 353 (2016) 1011.69. V. Andrei, R. L. Z. Hoye, M. Crespo-Quesada, M. Bajada, S. Ahmad, M. De Volder, R. Friend,
E. Reisner, Adv. Energy Mater. 8 (2018) 1801403.