Charge Distribution Near Oxygen Vacancies in Reduced Ceria
14
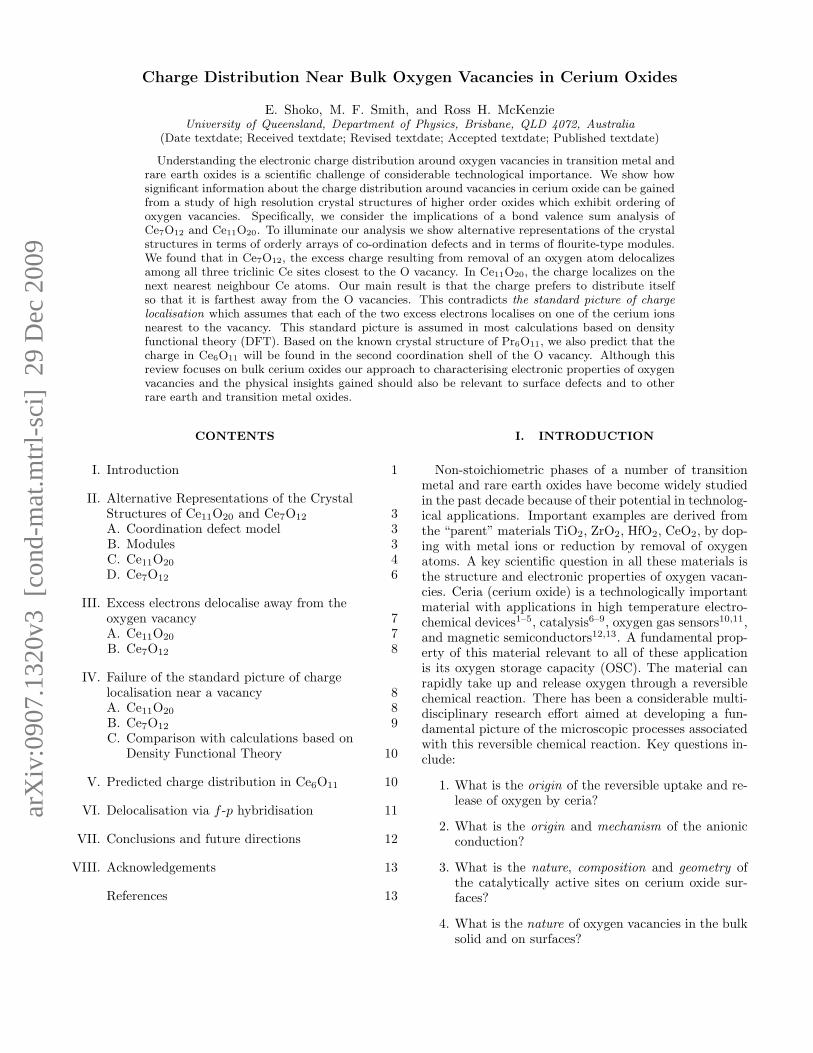
Charge Distribution Near Bulk Oxygen Vacancies in Cerium Oxides E. Shoko, M. F. Smith, and Ross H. McKenzie University of Queensland, Department of Physics, Brisbane, QLD 4072, Australia (Date textdate; Received textdate; Revised textdate; Accepted textdate; Published textdate) Understanding the electronic charge distribution around oxygen vacancies in transition metal and rare earth oxides is a scientific challenge of considerable technological importance. We show how significant information about the charge distribution around vacancies in cerium oxide can be gained from a study of high resolution crystal structures of higher order oxides which exhibit ordering of oxygen vacancies. Specifically, we consider the implications of a bond valence sum analysis of Ce7O12 and Ce11O20. To illuminate our analysis we show alternative representations of the crystal structures in terms of orderly arrays of co-ordination defects and in terms of flourite-type modules. We found that in Ce7O12, the excess charge resulting from removal of an oxygen atom delocalizes among all three triclinic Ce sites closest to the O vacancy. In Ce11O20, the charge localizes on the next nearest neighbour Ce atoms. Our main result is that the charge prefers to distribute itself so that it is farthest away from the O vacancies. This contradicts the standard picture of charge localisation which assumes that each of the two excess electrons localises on one of the cerium ions nearest to the vacancy. This standard picture is assumed in most calculations based on density functional theory (DFT). Based on the known crystal structure of Pr6O11, we also predict that the charge in Ce6O11 will be found in the second coordination shell of the O vacancy. Although this review focuses on bulk cerium oxides our approach to characterising electronic properties of oxygen vacancies and the physical insights gained should also be relevant to surface defects and to other rare earth and transition metal oxides. CONTENTS I. Introduction 1 II. Alternative Representations of the Crystal Structures of Ce 11 O 20 and Ce 7 O 12 3 A. Coordination defect model 3 B. Modules 3 C. Ce 11 O 20 4 D. Ce 7 O 12 6 III. Excess electrons delocalise away from the oxygen vacancy 7 A. Ce 11 O 20 7 B. Ce 7 O 12 8 IV. Failure of the standard picture of charge localisation near a vacancy 8 A. Ce 11 O 20 8 B. Ce 7 O 12 9 C. Comparison with calculations based on Density Functional Theory 10 V. Predicted charge distribution in Ce 6 O 11 10 VI. Delocalisation via f -p hybridisation 11 VII. Conclusions and future directions 12 VIII. Acknowledgements 13 References 13 I. INTRODUCTION Non-stoichiometric phases of a number of transition metal and rare earth oxides have become widely studied in the past decade because of their potential in technolog- ical applications. Important examples are derived from the “parent” materials TiO 2 , ZrO 2 , HfO 2 , CeO 2 , by dop- ing with metal ions or reduction by removal of oxygen atoms. A key scientific question in all these materials is the structure and electronic properties of oxygen vacan- cies. Ceria (cerium oxide) is a technologically important material with applications in high temperature electro- chemical devices 1–5 , catalysis 6–9 , oxygen gas sensors 10,11 , and magnetic semiconductors 12,13 . A fundamental prop- erty of this material relevant to all of these application is its oxygen storage capacity (OSC). The material can rapidly take up and release oxygen through a reversible chemical reaction. There has been a considerable multi- disciplinary research effort aimed at developing a fun- damental picture of the microscopic processes associated with this reversible chemical reaction. Key questions in- clude: 1. What is the origin of the reversible uptake and re- lease of oxygen by ceria? 2. What is the origin and mechanism of the anionic conduction? 3. What is the nature, composition and geometry of the catalytically active sites on cerium oxide sur- faces? 4. What is the nature of oxygen vacancies in the bulk solid and on surfaces? arXiv:0907.1320v3 [cond-mat.mtrl-sci] 29 Dec 2009
Transcript of Charge Distribution Near Oxygen Vacancies in Reduced Ceria
Charge Distribution Near Bulk Oxygen Vacancies in Cerium Oxides
E. Shoko, M. F. Smith, and Ross H. McKenzieUniversity of Queensland, Department of Physics, Brisbane, QLD 4072, Australia
(Date textdate; Received textdate; Revised textdate; Accepted textdate; Published textdate)
Understanding the electronic charge distribution around oxygen vacancies in transition metal andrare earth oxides is a scientific challenge of considerable technological importance. We show howsignificant information about the charge distribution around vacancies in cerium oxide can be gainedfrom a study of high resolution crystal structures of higher order oxides which exhibit ordering ofoxygen vacancies. Specifically, we consider the implications of a bond valence sum analysis ofCe7O12 and Ce11O20. To illuminate our analysis we show alternative representations of the crystalstructures in terms of orderly arrays of co-ordination defects and in terms of flourite-type modules.We found that in Ce7O12, the excess charge resulting from removal of an oxygen atom delocalizesamong all three triclinic Ce sites closest to the O vacancy. In Ce11O20, the charge localizes on thenext nearest neighbour Ce atoms. Our main result is that the charge prefers to distribute itselfso that it is farthest away from the O vacancies. This contradicts the standard picture of chargelocalisation which assumes that each of the two excess electrons localises on one of the cerium ionsnearest to the vacancy. This standard picture is assumed in most calculations based on densityfunctional theory (DFT). Based on the known crystal structure of Pr6O11, we also predict that thecharge in Ce6O11 will be found in the second coordination shell of the O vacancy. Although thisreview focuses on bulk cerium oxides our approach to characterising electronic properties of oxygenvacancies and the physical insights gained should also be relevant to surface defects and to otherrare earth and transition metal oxides.
CONTENTS
I. Introduction 1
II. Alternative Representations of the CrystalStructures of Ce11O20 and Ce7O12 3A. Coordination defect model 3B. Modules 3C. Ce11O20 4D. Ce7O12 6
III. Excess electrons delocalise away from theoxygen vacancy 7A. Ce11O20 7B. Ce7O12 8
IV. Failure of the standard picture of chargelocalisation near a vacancy 8A. Ce11O20 8B. Ce7O12 9C. Comparison with calculations based on
Density Functional Theory 10
V. Predicted charge distribution in Ce6O11 10
VI. Delocalisation via f -p hybridisation 11
VII. Conclusions and future directions 12
VIII. Acknowledgements 13
References 13
I. INTRODUCTION
Non-stoichiometric phases of a number of transitionmetal and rare earth oxides have become widely studiedin the past decade because of their potential in technolog-ical applications. Important examples are derived fromthe “parent” materials TiO2, ZrO2, HfO2, CeO2, by dop-ing with metal ions or reduction by removal of oxygenatoms. A key scientific question in all these materials isthe structure and electronic properties of oxygen vacan-cies. Ceria (cerium oxide) is a technologically importantmaterial with applications in high temperature electro-chemical devices1–5, catalysis6–9, oxygen gas sensors10,11,and magnetic semiconductors12,13. A fundamental prop-erty of this material relevant to all of these applicationis its oxygen storage capacity (OSC). The material canrapidly take up and release oxygen through a reversiblechemical reaction. There has been a considerable multi-disciplinary research effort aimed at developing a fun-damental picture of the microscopic processes associatedwith this reversible chemical reaction. Key questions in-clude:
1. What is the origin of the reversible uptake and re-lease of oxygen by ceria?
2. What is the origin and mechanism of the anionicconduction?
3. What is the nature, composition and geometry ofthe catalytically active sites on cerium oxide sur-faces?
4. What is the nature of oxygen vacancies in the bulksolid and on surfaces?
arX
iv:0
907.
1320
v3 [
cond
-mat
.mtr
l-sc
i] 2
9 D
ec 2
009

2
5. When an oxygen atom is removed to create a va-cancy, what happens to the two electrons that areleft behind?
Similar questions are also important in other oxides. Thisreview is primarily concerned with the last two questionsand the study is restricted to the case of bulk ceria. Inthis introduction, we briefly outline the current under-standing of the problem with respect to the last two ques-tions.
When CeO2 is reduced to the various defective phases,CeO2−x, according to Eq. 1, O vacancies are formed inthe lattice structure.
CeO2 CeO2−x +x
2O2 (g), 0 ≤ x ≤ 0.5 (1)
The crystal structure adopted by any such defectivephase, CeO2−x, is understood to be the one that pro-vides the most favourable energetics for the arrangementof all the O vacancies within the structure. In a widelyaccepted view of the microscopic description of O va-cancy formation and ordering in CeO2−x phases, the twoelectrons associated with a missing O atom when an Ovacancy forms fully localize on two of the four equivalentCe4+ ions which form a tetrahedron around the vacancysite as shown in Eq. 26,14–16:
4CeCe + OO 2CeCe + 2Ce′Ce + V ··O +12
O2 (g) (2)
where we have used the Kroger-Vink notation17 so thatthe symbols have the following meanings: CeCe - a Ce4+
ion on a Ce lattice site, OO - O2− ion on an O lattice site,Ce′Ce - a Ce3+ ion on a Ce lattice site and V ··O - neutralO vacancy site. This mechanism, which we will hence-forth refer to as the standard picture, is illustrated inthe schematic in Fig. 1. The localization of an electronon a Ce4+ ion converts it to the slightly larger Ce3+ ionwith one electron in the 4f orbital. In the reverse pro-cess where a defective phase, CeO2−x, is oxidized, two4f electrons from the two neighbouring Ce3+ ion sitesmove onto the site where an O atom is incorporated andthen delocalize into the O 2p valence band. Thus, thereversible processes of oxidation and reduction in Eq. 1have been considered to involve the extremal states ofthe Ce 4f electrons in which they are fully delocalizedand fully localized respectively15.
There have been, broadly speaking, three different ap-proaches for investigating this problem. Crystallogra-phers have attempted to establish general principles forO vacancy ordering in the reduced ceria phases. In 1974,Martin proposed the coordination defect model18. Hesuggested that when an O vacancy is created in the lat-tice of a rare-earth oxide, the local environment of thevacancy undergoes relaxations in such a way that thefour nearest neighbour Ce and six nearest neighbour Oatoms form a stable structural entity which is referredto as a coordination defect. The crystal structures ofthe higher rare-earth oxides are then determined and re-stricted by the topology of this coordination defect. In
FIG. 1. Schematic of the standard picture of charge redistri-bution following the formation of an oxygen vacancy in CeO2.The tetrahedron of Ce atoms (black circles) with an O atomat its centre (grey (orange in colour version) circle) is shownalong with the charges on these atoms in the simple ionic pic-ture description of CeO2. The process of reduction shown bythe arrow leads to a neutral O vacancy at the centre of thetetrahedron (empty circle) while two of the Ce ions have beenreduced to the +3 oxidation state.
1996, Kang and Eyring developed a different frameworkfor describing vacancy ordering based on structural ele-ments which are derived from the conventional unit cell ofCeO2 in a simple way19. As will be described in more de-tail later, there are thirteen of these structural elements,called modules, and they are the fundamental buildingblocks for all the crystal structures of the higher oxidesin the Kang-Eyring fluorite-type module theory. As aresult, it is possible to define what has been called amodular unit cell in which, instead of the usual atomicbasis, the different modules form the basis. The value ofthis approach is the simplicity and elegance with which itprovides insight into the superstructures observed in thereduced higher oxides in relation to the parent fluoritestructure from which they are derived.
Neither crystallographic approach sought to explicitlyaccount for the charge redistribution that occurs whenan O vacancy is formed. However, as we will show, theyprovide useful vantage points from which to examine theproblem. In contrast, the remaining two approaches inthe strategy sought to specifically establish the natureand occupation of the Ce 4f level in the Ce oxides andconsequently, the charge redistribution that occurs whenan oxygen vacancy is created. The earliest literature inthis direction emerged from spectroscopists20 with theirresults being interpreted using either cluster models21 orthe single impurity Anderson model22–24. This work in-vestigated the occupation of the Ce 4f level in the twoextremal phases, CeO2 and Ce2O3 and it was concludedthat CeO2 is mixed valence whereas Ce2O3 is a pure 4f1
configuration. The result that CeO2 is mixed valenceis inconsistent with the ionic description underlying thestandard picture. However, the models used to interpretthe spectroscopic results are not parameter-free and theconclusions drawn from them have been contested25.

3
Recently electronic structure calculations based of den-sity functional theory (DFT) have been performed. Ingeneral, DFT results for CeO2 assume empty Ce 4fstates which is the simple ionic picture of bonding inthis oxide, e.g., Ref.26. To describe vacancy formationin CeO2, the simplest case to consider is a 2× 2× 2 su-percell of CeO2 from which a single O atom is removed.This supercell has the composition Ce32O63 (CeO1.97).As this composition does not correspond to any knownphases of reduced ceria, it is customary to require thestructural parameters of the relaxed structure to matchthose of CeO2 based on Vergard’s rule27, i.e., there is alinear relationship between the lattice constant and theextent of reduction. As will be discussed in more detailin Section IV C, most of the DFT work supported thestandard picture. However, the approximate functionalsof DFT such as LDA, GGA, and LDA+U do not appearto describe well the electronic properties of the reducedphases28–30. Furthermore, recent calculations using hy-brid functionals31 and DFT+U30–32 do not appear tosupport the standard picture.
As far as we know, a study of the charge distribu-tion near bulk O vacancies in crystallographic phases ofreduced cerium oxide apart from Ce2O3 (and the cus-tomary supercell of DFT calculations, i.e., CeO1.97) hasnot been done. Our study of the charge distribution inthe well-characterized intermediate phases represents acomplementary approach to answering the fundamentalquestion of where the two electrons left behind when anO vacancy forms go. Furthermore, since no in-situ stud-ies have been done to identify the precise phases involvedin ceria-based catalysis, it is also possible that the inter-mediate phases may play an important role in the engi-neering applications of these materials.
In this study, we examine the standard picture for theoxidation and reduction in ceria described above, consid-ering primarily two intermediate phases namely Ce11O20
and Ce7O12. A brief discussion of Ce6O11 is also in-cluded. We discuss this in light of our recent results onCe site valencies obtained by an analysis of observed crys-tal structures using the bond valence method33. The twocases, Ce11O20 and Ce7O12, were chosen to illustrate theevolution of the charge distribution around O vacanciesthat occurs with reduction. Furthermore, apart from theextremal structures, namely CeO2 and Ce2O3, these twoexamples along with Ce3O5 were the only crystal struc-tures of the Ce oxides for which we were able to obtainhighly accurate crystallographic data to enable the typeof analysis we do here.
As is discussed later, both Ce11O20 and Ce7O12 havefluorite-related crystal structures. According to Kangand Eyring, Ce7O12 is the limiting intermediate oxidefor which any further reduction leads to loss of the flu-orite structure of CeO2
34. However, the fluorite-relatedCe3O5 phase was recently observed in the phase diagramof the Ce-O system35. In addition to the conventionalunit cells, we will generally use the Kang and Eyringstructural principle of modular units to discuss O va-
cancy ordering in reduced ceria phases19,34,36,37. Therewill be occasional references to Martin’s coordination de-fect model14,18,38 where this model may provide a betterconceptual framework.
This paper is organized as follows: In Section II wepresent the crystal structures of Ce11O20 and Ce7O12
both in the conventional way as well as in the represen-tation of the Kang-Eyring fluorite-type module theory.We show how the Kang-Eyring fluorite-type module the-ory helps to understand the structure of O vacancies inCe11O20 and Ce7O12 in relation to the parent fluoritestructure. In Section III, we consider the implications ofour bond valence calculations for the charge distributionin the local environment of the O vacancies. Section IVdiscusses how our results conflict with the standard pic-ture of charge localization in reduced ceria phases. Wethen make a prediction of the charge distribution to beexpected in the Ce6O11 crystal based on the bond va-lence model in Section V. The possibility of direct f -fcoupling between neighbouring Ce sites in crystals of theCe oxides. We assess the validity of this idea from theHarrison method of universal parameters in Section VI.Conclusions are presented in Section VII.
II. ALTERNATIVE REPRESENTATIONS OFTHE CRYSTAL STRUCTURES OF CE11O20 AND
CE7O12
A. Coordination defect model
Martin proposed describing an O vacancy in a Ce oxidecrystal as a structural entity made up of 4 Ce ions and 6 Oions around the vacancy site as illustrated in Fig. 214,18.The 4 Ce ions form the first coordination shell (a tetra-hedron) of the vacancy site while the 6 O atoms form thesecond coordination shell (an octahedron). Comparedto the perfect structure of CeO2, all 4 Ce ions are dis-placed 0.2A away from the vacant O site while the Oatoms are shifted 0.3A towards the vacancy. This struc-tural unit has been called the coordination defect and itmaintains its structural integrity in a crystal of the oxide(see Fig. 2). It is constructed from two types of sub-units called octants, one of composition Ce 1
2O called the
δ phase and the other incorporating an O vacancy, theλ phase, of composition Ce 1
2. The exploded view in Fig.
2 (b) shows these octants and how they are arranged toform the coordination defect. This model, in its originalformulation, does not explicitly account for the changesin the valences of the Ce ions and the four Ce ions whichare nearest neighbours to the O vacancy in the coordina-tion defect are implicitly identical.
B. Modules
Soon after the elaboration of Martin’s coordinationdefect model14, Kang and Eyring developed a simpler

4
FIG. 2. (a) Coordination defect showing characteristic topol-ogy. (b) Exploded view of the coordination defect showingthe central octant of what is called the ”λ phase” coordi-nated by six M 1
2O octants of what is called the ”δ phase”.
The λ phase only differs from the δ phase in that it has anO vacancy as shown. Black circles represent Ce atoms, grey(orange in colour version) circles - O atoms and the light greycircle inside the λ phase is an O vacancy. After Martin39.
model for constructing the crystal structures of the higherrare earth oxides, i.e., oxides from Ce7O12 to CeO2 basedon a different set of structural elements19. These so-called modules, include the CeO2 unit cell with the restderived from it by creating one or two O vacancies in cer-tain prescribed ways resulting in a total of thirteen mod-ules. These modules are the fundamental building blocksfor all the higher oxides under a prescription of rules de-fined by the authors34. In Fig 3, we show the ten modulesrelevant to Ce11O20 and Ce7O12 in addition to the unitcell of CeO2. Kang and Eyring’s method accounted forall the higher oxides known at the time and was success-ful in predicting the existence of new structures34. TheKang and Eyring method enables a relatively simple wayof visualizing vacancy sites which are otherwise difficultto decipher when the structure is cast in the conventionalsetting of its space group. This provides considerable fa-cility in the analysis of the local environment of the Ovacancy site. As a result, we will make frequent referenceto this framework in the rest of this paper.
FIG. 3. The ten different modules required to build the mod-ular unit cells of Ce11O20 and Ce7O12. The vertices of thetetrahedra denote the locations of the Ce ions surrounding anO vacancy. Module F is the conventional unit cell of CeO2.Except for W 3
1 which has two O vacancies along the bodydiagonal of the CeO2 unit cell, the rest of the modules haveonly one O vacancy in the positions shown. [Adapted from34]
C. Ce11O20
The conventional unit cell of Ce11O20 is shown in Fig.4. Note that for all ball and stick figures in this pa-per, the sticks between the Ce sites and the O vacancysite do not represent chemical bonds. Instead, the sticksare only included to show the geometric relationshipsbetween the atoms. The unit cell of Ce11O20 consistsof one formula unit per unit cell with inversion as itspoint group symmetry. It has six Ce and ten O distinctsites along with their inversion images with the Ce(1)site as the centre of inversion. However, for a descrip-tion of the vacancy structure and charge distributionin this crystal, it is convenient to view all the latticepoints in the O sublattice as roughly equivalent and todivide the Ce sublattice into two regions. The first re-gion consists of the Ce(1) and Ce(2) sites which, in theCe sublattice, occupy the second coordination shells ofthe O vacancies. The remainder of the Ce atoms are thefirst coordination shells of the O vacancies. The crys-tal structure of Ce11O20 can be readily related to thefluorite structure of CeO2 from which it is derived byreduction. This relationship becomes clearer with theKang-Eyring module representation. Kang and Eyring34
have shown that the modular unit cell of Ce11O20 hasthe modular composition 3F , 4D, 4U where the mod-ule types are as given in Fig. 3. They also providedthe modular sequences for the [100] and [010] direc-tions in this crystal as FFU3U2D3D2FU
4U1D4D1 andFU3D3FU
1D1FU2D2U
4D4 respectively. Using this in-formation along with their module juxtaposition rules, wederived the modular sequence for the [001] direction tobe D1D2FFFU
4U3U1U2D4D3. This then enabled us toconstruct the 3D modular unit cell of Ce11O20 shown inFig. 5. We note that this unit cell is not unique. There isonly one type of O vacancy in the crystal of Ce11O20 andif we only consider the Ce sublattice, each O vacancy hasthe four Ce(3)-Ce(6) sites forming its first coordinationshell. These four Ce sites form a distorted tetrahedron.

5
FIG. 4. The unit cell of Ce11O20 whose space group is P 1.There are six distinct Ce sites in this crystal. However, to fa-cilitate the discussion of vacancy structures and charge distri-bution, the Ce sublattice has been partitioned into two typesof lattice points as shown in the legend. The first set of lat-tice points consists of the Ce(1) and Ce(2) sites which, if weonly consider the Ce sublattice, occupy the second coordi-nation shells of the O vacancies. The second set consists ofthe remainder of the Ce sites and these form the first coor-dination shell of the O vacancies in the Ce sublattice of thecrystal. There are ten distinct O sites in the crystal but forour purposes, it is convenient to treat all the O sites in the Osublattice as roughly equivalent as indicated in the legend.
FIG. 5. The fluorite-type modular unit cell of Ce11O20 de-rived using the Kang and Eyring rules34. In (a), the modularunit cell is constructed from transparent modules to show thelocation of the O vacancy site as indicated by the shadedtetrahedra with the module types as identified in (c) andshown in detail in Fig. 3. A simplified block representa-tion of the modular unit cell given in (a) is shown in (b). Theexploded view with all the module types identified is givenin (c). The modular composition is: top layer - U1, F , U4;middle layer - D1, D4, F , F , U3; bottom layer - D2, D3, U2.These figures make clear the distribution of the O vacancieswithin the crystal in relation to the original fluorite structure.There are large contiguous regions, modules F, where thereare no O vacancies.
FIG. 6. The proposed vacancy cluster of Ce11O20 consistingof two O vacancies which are nearest neighbours and relatedto each other by inversion symmetry centred on the Ce(1)site. The various Ce sites are labelled as shown. The whiteand light grey (teal) circles represent O vacancies and variousO sites respectively.
The O vac - Ce(i) distances are shown in Table I wherei = 3, 4, 5, 6. The second coordination shell consists oftwelve Ce sites namely, two Ce(1), four Ce(2), two Ce(3),two Ce(4) and one of each of the Ce(5) and Ce(6) sitesas shown in Table I. Of these twelve Ce sites in the O va-cancy’s second coordination shell, only half a Ce(1) siteand one Ce(2) site can be assigned to the particular Ovacancy site. Thus, in total, an O vacancy in Ce11O20 isproportionately associated with five and half Ce sites. Itis convenient to work with an integral number of Ce siteswhen studying the charge distribution in the local envi-ronment of an O vacancy. In order to do this, we proposeto partition the lattice so that we consider a vacancy clus-ter consisting of two neighbouring O vacancies which canthen be associated with eleven Ce sites. Since the choiceof the Ce(1) site is the most difficult to establish, we picka Ce(1) site and construct the vacancy cluster around it.A Ce(1) site has four closest O vacancies all in the thirdcoordination shell. Two of the O vacancies are located4.558A away from the Ce(1) lattice point with the othertwo at 4.571A. Since the Ce(1) site is a centre of in-version, each of these pairs of O vacancies are related byinversion symmetry. We choose the pair with the shortestdistance from the Ce(1) site to define the vacancy clus-ter consisting of two O vacancies. The cluster obtainedby this procedure is illustrated in Fig. 6. This clustershould not be confused with the divacancy of Ce7O12 tobe discussed later. The divacancy of Ce7O12 is a uniquestructural entity of the crystal arising from long-range or-dering of the vacancies whereas the cluster we define hereis simply an analytic convenience. It cannot be strictlyconsidered to be specified in a unique way since the pairof O vacancies we chose is only 0.01A closer to the Ce(1)compared to the other. On the O vacancy sublattice,each O vacancy has four nearest neighbours 6.134A awayfor the first pair and 6.138A for the second. There isno difficulty in identifying the Ce(2) site associated witheach O vacancy since there is only one closest (4.495A)Ce(2) site. The distances are calculated from the crys-tallographic data of Kummerle and Heger40. Zhang etal.41 suggested another useful way of viewing the crys-

6
TABLE I. The first- and second coordination shells of the Ovacancy in the Ce sublattice of Ce11O20 and some selected dis-tances between the sites. These Ce-Ce distances show that theaverage intra-tetrahedral separation between Ce sites (4.2A)is larger than the inter-tetrahedral separation (3.9A).
Ce site Distance fromO vacancy, A
Direct Ce-Cetype
Direct Ce-Cedistance, A
First Coordination
Ce(6) 2.5106 Ce(6)-Ce(3) 4.169
Ce(3) 2.5674 Ce(6)-Ce(4) 4.194
Ce(4) 2.5817 Ce(6)-Ce(5) 4.207
Ce(5) 2.6185 Ce(3)-Ce(4) 4.219
Ce(3)-Ce(5) 4.144
Ce(4)-Ce(5) 4.234
Second Coordination
Ce(5) 4.3184 Ce(1)-Ce(5) 3.810
Ce(4) 4.4140 Ce(1)-Ce(4) 6.904
Ce(3) 4.4164 Ce(1)-Ce(3) 3.852
Ce(3) 4.4341
Ce(4) 4.4390
Ce(6) 4.4438 Ce(1)-Ce(6) 5.561
Ce(2) 4.4952 Ce(1)-Ce(2) 7.715
Ce(2) 4.5265 Ce(2)-Ce(3) 3.873
Ce(2) 4.5340 Ce(2)-Ce(4) 3.861
Ce(1) 4.5579 Ce(2)-Ce(5) 6.860
Ce(1) 4.5705 Ce(2)-Ce(6) 5.573
Ce(2) 4.6007
tal structure of Tb11O20 which is also directly applicableto Ce11O20 because these compounds are isostructural.Their perspective is based on the observation that the Ovacancies are more or less uniformly distributed withinthe crystal structure with no evidence of vacancy pair-ing. The vacant O sites are distributed in a way suchthat the separation between the defects is maximized andthus, the repulsive interactions are reduced. The Ce ionsin the first coordination shell relax outward in a moreor less isotropic way (Ce-V ··O ranges 2.51 − 2.62A, seeTable I). As the vacant Ce tetrahedra expand, the re-gions between them experience substantial compressionas indicated by the difference in the distances betweenthe intra-tetrahedral ions (4.2A) and those of the inter-tetrahedral ions (3.9A). These distances are given in Ta-ble I. In this table, the intra-tetrahedral ion distancesare given as the direct Ce-Ce distances in the first co-ordination shell while the inter-tetrahedral ion distancesrefer to these distances in the second coordination shell:Ce(1)-Ce(5), Ce(1)-Ce(3); Ce(2)-Ce(3) and Ce(2)-Ce(4).The inter-tetrahedral Ce ions have a coordination num-ber of 8 as in the parent fluorite structure. In discussingthe charge distribution in the local environment of thevacancy, we will notice that the charge is distributed ina manner which is distinctly different between the intra-tetrahedral and inter-tetrahedral Ce ions.
FIG. 7. The unit cell of Ce7O12 showing the two distinct Cesites: Ce(1) - black and Ce(2) - dark grey. The O(1) sites areshown in grey (teal) with the O(2) light grey (orange). TheCe(1) and Ce(2) sites are of S6 and i symmetries, respectively.The O vacancy sites are shown in white. A characteristicstructural unit of the Ce7O12 crystal is the divacancy, whichconsists of two O vacancy sites connected by an S6 Ce sitebetween them.
FIG. 8. (a) The modular unit cell of Ce7O12 showing the de-tails of the seven modules used to construct it. Each tetrahe-dron represents the four Ce atoms around the oxygen vacancy.(b) A simplified model of the modular unit cell. Adapted fromKang and Eyring34.
D. Ce7O12
Fig. 7 shows the unit cell of Ce7O12 in the conven-tional rhombohedral setting. In the Kang-Eyring frame-work, the modular composition of this crystal is D2, D3,D4, W 3
1 , U1, U2 and U434. The modular unit cell con-structed from this basis is depicted in Fig. 8. It isreadily apparent from Fig. 8 where the O vacancy sitesare located. There are two types of Ce sites, Ce(1) andCe(2), in the crystal lattice of Ce7O12 which are of S6
and i symmetry respectively40,42. These distinct sitesare indicated in the conventional unit cell of Fig. 7. Al-

7
though Kang and Eyring did not explicitly identify thedistinct sites in their modular unit cell according to theirsymmetries, it is apparent that by translating their unitcell in three dimensions, two distinct Ce sites are ob-tained; the S6 site with two nearest neighbour O vacan-cies around it and the i site with only one O vacancy.The S6 site has been called the divacancy site34 and itforms a shared corner between two coordination tetrahe-dra of the O vacancies as illustrated in Fig. 11. We listhere some interatomic distances that we will use in ouranalysis of the divacancy cluster: Ce(2)-Ce(2) = 4.09A,Ce(1)-Ce(2) = 4.11A, Ce(1)-O(2) = 2.19A and for Ce(2)-O(1), there are two relevant bond lengths, namely 2.23Aand 2.32A. The Ce-Ce distances are direct distances be-tween these sites, not distances along the Ce-O bondsconnecting them. It appears that the Ce sublattice hasnot changed much relative to CeO2.
It is helpful to visualize vacancy ordering in Ce7O12
by viewing the divacancy as a structural unit of the Ovacancies in this crystal. This clarifies why the ratio ofS6 to i sites is 1 : 6; all the Ce sites which are nearestneighbours to the two O vacancies forming a divacancyare of S6 symmetry. As there are seven Ce atoms inthe formula unit, the rest of the Ce atoms (six) mustbe the Ce(2) sites of i symmetry. The formation of thedivacancy structures as CeO2 is reduced to Ce7O12 isassociated with some relaxation of the crystal lattice al-though the Ce sublattice remains somewhat invariant34.We now examine this relaxation process which is illus-trated in Fig. 9 and based on Kummerle and Heger’sneutron diffraction data40. The bond lengths in CeO2 are2.434A and 2.706A for the Ce-O and O-O bonds respec-tively. When a divacancy is formed, the bonds withinthe divacancy relax and diffraction data show that inCe7O12 the ‘bond’ lengths are40: 2.505A for O(1)-V ··O ,2.364A for O(2)-V ··O , 2.418A for Ce(1)-V ··O and 2.543A forCe(2)-V ··O . This structural data indicates that comparedto CeO2, the bonds within the divacancy have changedas follows: the O(1)-V ··O and O(2)-V ··O ‘bonds’ contract by0.20A and 0.34A respectively while the Ce(2)-V ··O ‘bond’gets longer by 0.109A. The Ce(1)-V ··O ‘bond’ is prac-tically unchanged, showing only a small contraction ofabout 0.02A. Thus, we see that, just as was the case forCe11O20, the O atoms are attracted to the vacancy sitewhile the Ce(2) atoms are repelled away so that the Oatoms now become the nearest neighbours of the vacancysite. This appears to be a general feature of vacanciesin rare earth higher oxides14,34. We note that the sixO atoms around the vacancy relax by different amountswith the O(2) atoms being more strongly attracted to thevacancy site. We also note that according to the coordi-nation defect model, the crystal structure of Ce7O12 hasthe highest packing density of the coordination defect.
FIG. 9. The relaxation of atoms forming part of the divacancyin Ce7O12. The different lattice sites are indicated by thecolours as follows: Ce(1) - black, Ce(2) - dark grey, O(1)- grey (teal), O(2) - light grey (orange) and the O vacancy(V ··
O ) - white. The arrows indicate the direction in whichthe respective atoms relax relative to the O vacancy site andthe amounts by which the ‘bonds’ relax are shown in thelegend. This figure was produced from the crystal structuredetermined by neutron scattering40.
III. EXCESS ELECTRONS DELOCALISE AWAYFROM THE OXYGEN VACANCY
Having discussed the O vacancy ordering in Ce11O20
and Ce7O12 as well as proposing some vacancy clusterssuitable for the analysis of charge distribution in thesecrystals in the previous section, we now present the re-sults of the bond valence calculations, I, in these clusters.
A. Ce11O20
Fig. 10 shows the bond valence sums on the variousCe sites in the vacancy cluster of Ce11O20 which was in-troduced earlier, see Fig. 6. Clearly the charge from thevacancy does not localize on the Ce sites closest to thevacancy but rather, delocalizes onto the Ce(1) and Ce(2)sites. This contradicts the standard picture. The resultsof Fig. 10 can be compared with those of Tb11O20 withwhich it is isostructural. Based on a simple considerationof the crystal radii of the cations43, Zhang et al.41 sug-gested the following valencies for the cations: Tb(1) and

8
FIG. 10. Charges of the different Ce ions in the vacancycluster of Ce11O20 obtained from the bond valence model.The vacancy cluster consists of two vacancies connected bythe Ce(1) site which is also a centre of inversion for the cluster.The four excess electrons that arise due to the removal of thetwo oxygen atoms do not localise on the cerium atoms nearestthe vacancies. This is contrary to the standard picture.
Tb(2) - +3, Tb(3) and Tb(4) - +3.75, Tb(5) and Tb(6)- +4. Here the numbering of the sites is the same asfor Ce11O20 given in Fig. 6. Their assigment of the sitevalences qualitatively agrees well with our bond valenceresults for Ce11O20. The Tb3+ and Tb4+ ions are f8 andf7 configurations respectively and can be compared tothe corresponding f1 and f0 configurations respectivelyfor the Ce ions. They suggested the possibility of fastelectron transfer between the neighbouring Tb(2) sitesso that, instead of two Tb(2)3+ and one Tb(2)4+ instan-taneous states, an average is obtained from the neutrondiffraction data. It was suggested by the authors that thethermal ellipsoids of the atoms in Ce7O12 which are muchhigher than in CeO2 could be evidence of the dynamicdisorder arising from the fast electron transfer.
B. Ce7O12
The charge distribution in the divacancy of Ce7O12 isshown in Fig. 11. This figure clearly shows that, apartfrom the Ce(1) site which is of a different local site sym-metry compared to the Ce(2) sites, the charge delocal-izes over all three of the Ce atoms closest to the vacancy.Again, this contradicts the standard picture, which hasthe electrons completely localise on two of the neighbour-ing Ce atoms.
IV. FAILURE OF THE STANDARD PICTUREOF CHARGE LOCALISATION NEAR A
VACANCY
We now discuss the above results comparing them tothe standard picture and propose an alternative view ofhow the charge redistributes itself following O vacancyformation in ceria as deduced from the bond valencemodel. As already mentioned, the conventional descrip-tion of the electronic processes involved during O vacancy
FIG. 11. The divacancy of Ce7O12 showing the valences ofthe Ce atoms calculated from the bond valence model, I. Thecharge delocalizes on the three Ce(1) sites of triclinic symme-try which now have a valence of +3.21.
formation requires that the excess charge at the vacant Osite be shared between two of the four Ce ions which formthe first coordination shell of the vacancy. This meansthat the tetrahedron formed by the four Ce ions aroundthe O vacancy consists of two Ce3+ and two Ce4+ ions.This description is based on the ionic model for theseoxides although Kang and Eyring do indicate that theremay be some covalent character in these oxides34.
A. Ce11O20
If we assume that the four electrons which are leftwhen the two O vacancies are formed are localized withinthe cluster, then we can describe how the charge redis-tributes itself. In fact, from the bond valence results,which also showed mixed valence in CeO2, the valenceof Ce in CeO2 is +3.73 and the corresponding valence ofO is −1.87. A description of vacancy formation in CeO2
to form Ce11O20 can then be illustrated in the bond va-lence model as shown in Fig. 12. Thus, according tothe mixed valence description of the CeO2 crystal fromthe bond valence model (see Fig. 12(a)), when an Ovacancy is created in CeO2, a charge of −1.87 is left be-hind as opposed to a charge of −2.0 in the ionic picture.This then means that, if we consider the vacancy clus-ter of Fig. 10 and equivalently, Fig. 12(b), the creationof the two O vacancies leaves a total charge of −3.74 inthe cluster. From Fig. 10, we can see that comparedto their original valences in CeO2, the valences of Ce(5)and Ce(6) are virtually unchanged. Thus, consideringthe change in the valences of the remainder of the Cesites, the total charge accummulation on the Ce sites inthe cluster is −2.87. There is therefore a discrepancyof ∼ −1 between the total extra charge in the Ce11O20
crystal inferred from the bonding in CeO2 (i.e. −3.74)and that directly calculated for this crystal by the bond
9
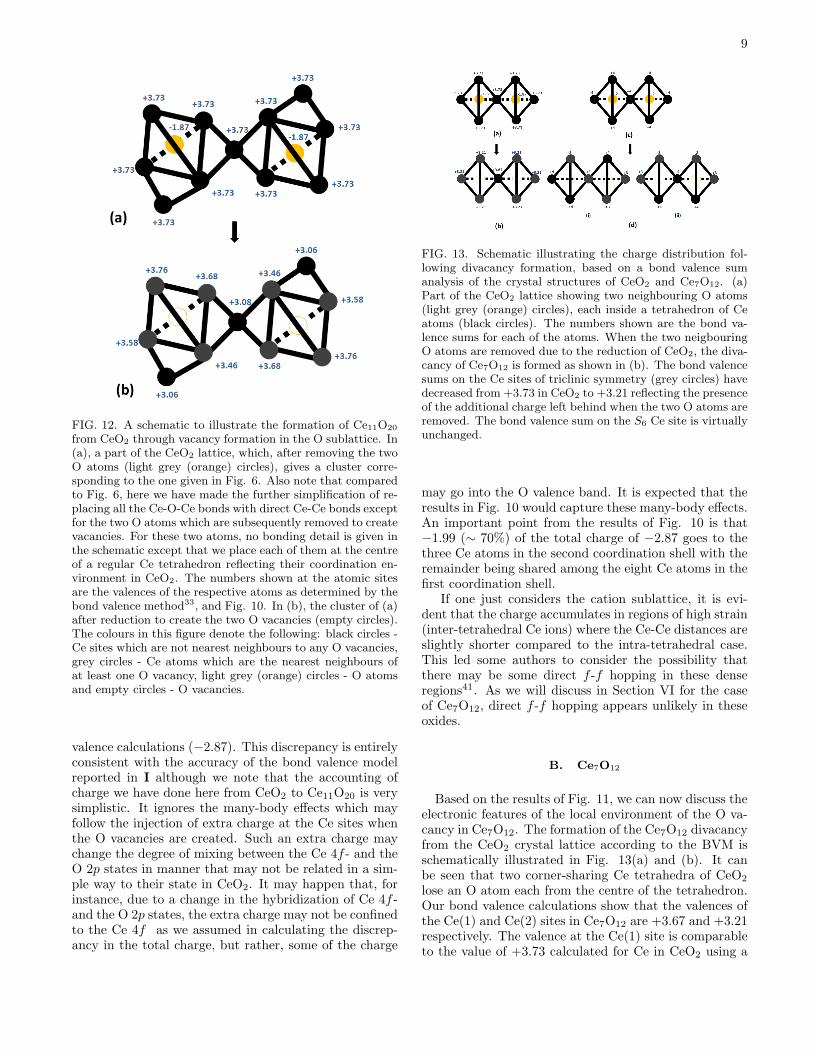
FIG. 12. A schematic to illustrate the formation of Ce11O20
from CeO2 through vacancy formation in the O sublattice. In(a), a part of the CeO2 lattice, which, after removing the twoO atoms (light grey (orange) circles), gives a cluster corre-sponding to the one given in Fig. 6. Also note that comparedto Fig. 6, here we have made the further simplification of re-placing all the Ce-O-Ce bonds with direct Ce-Ce bonds exceptfor the two O atoms which are subsequently removed to createvacancies. For these two atoms, no bonding detail is given inthe schematic except that we place each of them at the centreof a regular Ce tetrahedron reflecting their coordination en-vironment in CeO2. The numbers shown at the atomic sitesare the valences of the respective atoms as determined by thebond valence method33, and Fig. 10. In (b), the cluster of (a)after reduction to create the two O vacancies (empty circles).The colours in this figure denote the following: black circles -Ce sites which are not nearest neighbours to any O vacancies,grey circles - Ce atoms which are the nearest neighbours ofat least one O vacancy, light grey (orange) circles - O atomsand empty circles - O vacancies.
valence calculations (−2.87). This discrepancy is entirelyconsistent with the accuracy of the bond valence modelreported in I although we note that the accounting ofcharge we have done here from CeO2 to Ce11O20 is verysimplistic. It ignores the many-body effects which mayfollow the injection of extra charge at the Ce sites whenthe O vacancies are created. Such an extra charge maychange the degree of mixing between the Ce 4f - and theO 2p states in manner that may not be related in a sim-ple way to their state in CeO2. It may happen that, forinstance, due to a change in the hybridization of Ce 4f -and the O 2p states, the extra charge may not be confinedto the Ce 4f as we assumed in calculating the discrep-ancy in the total charge, but rather, some of the charge
FIG. 13. Schematic illustrating the charge distribution fol-lowing divacancy formation, based on a bond valence sumanalysis of the crystal structures of CeO2 and Ce7O12. (a)Part of the CeO2 lattice showing two neighbouring O atoms(light grey (orange) circles), each inside a tetrahedron of Ceatoms (black circles). The numbers shown are the bond va-lence sums for each of the atoms. When the two neigbouringO atoms are removed due to the reduction of CeO2, the diva-cancy of Ce7O12 is formed as shown in (b). The bond valencesums on the Ce sites of triclinic symmetry (grey circles) havedecreased from +3.73 in CeO2 to +3.21 reflecting the presenceof the additional charge left behind when the two O atoms areremoved. The bond valence sum on the S6 Ce site is virtuallyunchanged.
may go into the O valence band. It is expected that theresults in Fig. 10 would capture these many-body effects.An important point from the results of Fig. 10 is that−1.99 (∼ 70%) of the total charge of −2.87 goes to thethree Ce atoms in the second coordination shell with theremainder being shared among the eight Ce atoms in thefirst coordination shell.
If one just considers the cation sublattice, it is evi-dent that the charge accumulates in regions of high strain(inter-tetrahedral Ce ions) where the Ce-Ce distances areslightly shorter compared to the intra-tetrahedral case.This led some authors to consider the possibility thatthere may be some direct f -f hopping in these denseregions41. As we will discuss in Section VI for the caseof Ce7O12, direct f -f hopping appears unlikely in theseoxides.
B. Ce7O12
Based on the results of Fig. 11, we can now discuss theelectronic features of the local environment of the O va-cancy in Ce7O12. The formation of the Ce7O12 divacancyfrom the CeO2 crystal lattice according to the BVM isschematically illustrated in Fig. 13(a) and (b). It canbe seen that two corner-sharing Ce tetrahedra of CeO2
lose an O atom each from the centre of the tetrahedron.Our bond valence calculations show that the valences ofthe Ce(1) and Ce(2) sites in Ce7O12 are +3.67 and +3.21respectively. The valence at the Ce(1) site is comparableto the value of +3.73 calculated for Ce in CeO2 using a

10
bond valence method analysis of the crystal structure. Ifwe use the Kang and Eyring modular unit cell with its 8O vacancies, 4 Ce(1) and 24 Ce(2) sites and further as-sume that we start from mixed-valence CeO2 where thevalences are +3.73 and −1.87 for the Ce and O sitesrespectively, we can get some estimate of how the excesscharge on the O vacancy sites is distributed in the mod-ular unit cell. The valence of the Ce(1) sites does notchange much from its value before the O vacancy is cre-ated. Thus, virtually all the charge left at the vacancysite by an O atom is evenly distributed within the firstcoordination shell of the vacancy site among the (three)Ce(2) sites. On this basis and only considering a sim-ple analysis using the bond valence results for CeO2, thevalence at the Ce(2) sites is then readily calculated tobe +3.11 (i.e., 3.73− 1.87/3) which is comparable to theindependently calculated value of +3.21 within the errorbounds (±0.1) of the method. That the excess charge isnot distributed evenly among all four of the Ce atoms inthe first coordination shell contradicts the standard pic-ture. If the charge was evenly distributed among all fourCe atoms, the valences would be +2.79 and +3.26 for theS6 and i sites respectively.
The above picture from the BVM can be contrastedwith standard picture description of the same process asillustrated in Fig. 13(c) and (d). Here, there are twoways one could assign the valences of the Ce sites in thedivacancy. One way is to assign valences of +4 to threeof the i sites, two on the first tetrahedron and one on thesecond. The remainder of the Ce sites are then assignedthe valence of +3 as illustrated in Fig. 13(d)(i). Analternative arrangement of the charges is illustrated inFig. 13(d)(ii). Here, the three +4 valences are assignedone each to one of the i sites from the first and secondtetrahedra with the third being assigned to the S6 site.
C. Comparison with calculations based on DensityFunctional Theory
Most DFT calculations (performed in the supercellof composition Ce32O63) characterizing the location andcharacter of the excess charge near bulk O vacancies con-cluded that the charge localizes on two of the nearestneighbour Ce ions12,15,16,26,28,44–46. This is what we havecalled the standard picture. It appears that this picturewas first brought into question by Castleton et al.30 ina paper where the question of charge localization wasextensively explored. They concluded that it wasn’t pos-sible to fully localize the Ce 4f electrons on these Ce sitesin the DFT+U framework while at the same time pre-serving a correct description for all the other electrons.We are not aware of any subsequent DFT+U reports di-rectly addressing this question in the conventional super-cell. The more recent work used a periodic electrostaticembedded cluster method (PEECM)47. This work foundthat the charge preferred to localize well away from theO vacancy, being on Ce sites of the third coordination
shell. As this shell coincided with the boundary of thequantum mechanical part of the cluster used in the cal-culation, the authors raised the possibility that the resultmay be an artifact of the method.
We also note that Burow et al.47 obtained three differ-ent Ce-Ce distances of 4.07, 4.12 and 4.20A in the first co-ordination shell. These distances are shorter than thosereported in Table I for the vacancy cluster of Ce11O20.However, since the structures in question are different,one should be cautious about such comparisons.
Our results are also in agreement with some recent re-ports on the location and localization of the excess elec-trons for surface and subsurface O vacancies31,32. Theseauthors argued that the localization of charge on nextnearest neighbour Ce sites was mainly controlled by thelattice relaxation due to electrostatics as reflected in thelowering of the Madelung potential. However, it shouldbe remarked that a bulk O vacancy is in a different co-ordination environment relative to either a surface orsubsurface O vacancy. It is therefore possible that thecomparison between our results for bulk O vacanciesand those reported for surface/subsurface O vacanciesmay not be simple. Indeed, some authors have reporteddifferences in the location of the charge between sur-face/subsurface and bulk O vacancies47. Nevertheless,it is interesting to note that, until these more recent re-sults, the standard picture was considered applicable tosurface and subsurface O vacancies as well16,45,48.
V. PREDICTED CHARGE DISTRIBUTION INCE6O11
We make a few remarks about a possible charge dis-tribution around the O vacancies in this crystal whoseunit cell is shown in Fig. 14. Complete crystal struc-ture data is not available but we make predictions of thecharge distribution to be expected in this crystal froma generalization of the bond valence results of Ce7O12
and Ce11O20. The proposed vacancy cluster for study-ing the charge distribution in the local environment ofthe oxygen vacancy in this crystal is shown in Fig. 15.We did not find a full crystallographic characterizationof this crystal and therefore it is not possible to performaccurate bond valence calculations for it. The results re-ported in I for this crystal were based on the positionalparameters of Pr6O11. If one were to accept these re-sults (Table I of I), then since Ce(1), Ce(2), Ce(3) andCe(4) coordinate the O vacancy with Ce(5) and Ce(6) inthe second coordination shell for the Ce sublattice, wesee that the charge distribution does not quite follow thepattern one would expect from the results obtained forCe11O20 and Ce7O12. The overall charge in the vacancycluster is larger by about ∼ −1.2 compared to what onewould expect starting from mixed valence CeO2. Thisdiscrepancy is twice what we found in the case of Ce11O20
if the discrepancies are normalized to the total numberof Ce sites in each vacancy cluster. As a result, the three

11
FIG. 14. The unit cell of Ce6O11 which consists of four for-mula units. The Bravais lattice is monoclinic and of spacegroup P21/c.
Ce sites Ce(1), Ce(2) and Ce(3) which one would expectto have valences close to +3.7 have much lower valences.We do not believe that this is the correct charge distri-bution in the local environment of the O vacancy for thiscrystal. Instead, we prefer to extrapolate the argumentwhich emerges from the bond valence results of Ce11O20
and Ce7O12. Doing so leads to the prediction that thecorrect charge distribution for this crystal should be asillustrated in Fig. 15 where all the charge goes to thetwo Ce sites in the second coordination shell i.e. Ce(5)and Ce(6). Of the known crystal structures of the re-duced higher oxides of ceria, Ce6O11 is the closest to thecustomary supercell used in DFT in that it is the leastreduced. The prediction we have made here would sug-gest that, except in an artificial way, it should not bepossible to localize the electrons from the O vacancy sitein the first coordination shell for the customary supercellused in DFT for studying this problem. An experimentgiving the full crystallographic data for this phase wouldhelp resolve this question.
VI. DELOCALISATION VIA f-pHYBRIDISATION
The possibility of the direct hopping of electrons be-tween f -orbitals on neighbouring Ce sites has been sug-gested to explain the charge distribution in reduced ceriaphases41. We briefly explore this suggestion consideringthe example of Ce7O12. There are two immediate ques-tions one may like to answer about the charge distribu-tion obtained for this phase from the bond valence calcu-lations. First, how does an f -electron delocalize amongthe Ce(2) sites? Is this through direct f -f hopping orthrough the more indirect two-step process of f -p hop-ping which involves an O site bonded to both Ce sites?Second, why does this delocalization of the charge not
FIG. 15. The proposed vacancy cluster of Ce6O11 consistingof the six Ce sites as shown. The sites Ce(1) - Ce(4) are in thefirst coordination shell of the O vacancy and are coordinatedto 7 O atoms. The Ce(5) and Ce(6) sites are in the secondcoordination shell and have the full 8-coordination of the Cesite in CeO2. Bond valence sums are listed for each of these Cesites as estimated from the positional parameters of Pr6O11
and taken from I. We also show the site valences we predictfrom a generalization of the bond valence results of Ce7O12
and Ce11O20.
extend to include the Ce(1) which is also in the samefirst coordination shell of the O vacancy? We are not ina position to give a detailed answer to these questions inthe present paper but only some preliminary indicationsbased on Harrison’s method of universal parameters49.We do not believe that the delocalization of the f -levelcharge between the Ce(2) sites is a result of direct f -fcoupling between these sites.
We now consider the two relevant cases, i.e., direct f -fhopping between neighbouring Ce sites and the indirectf -p hopping which involves an O site between the Cesites in question. In each of these cases, we considertwo situations: electron hopping between two Ce(2) siteswhich delocalizes the charge between these sites and theelectron hopping between a Ce(2) and a Ce(1) site whichcould also delocalize the charge between these sites.
For the case of direct f -f coupling, the relevant dis-tances are: Ce(1)-Ce(2) - 4.11A. These distances arequite comparable and they give the same direct f -f hop-ping matrix element, tff , be estimated49,50 to be about0.01 eV. This matrix element is the most favourable ofall the four nonvanishing f -f matrix elements and rep-resents a σ-σ interaction between the two orbitals. Thisresult would suggest that, if direct f -f coupling werethe dominant mechanism of charge delocalization, then

12
charge would delocalize over all four Ce atoms which arenearest neighbours to the O vacancy.
In the case of f -p hopping, we again, consider twocases: hopping along the Ce(1)-O(2)-Ce(2) bonds whichwe designate ‘O(2) hopping’ and the ‘O(1) hopping whichoccurs along Ce(2)-O(1)-Ce(2). For O(2) hopping, therespective matrix elements, tfp, for electron hopping be-tween Ce(1) and O(2) as well as O(2) and Ce(2) are49,51
0.67 and 0.46 eV. These matrix elements refer to a σ-σ interaction between the two orbitals which are themore favourable of the two nonvanishing matrix ele-ments. Since, for f -p hopping to couple f states betweentwo Ce sites, a two-step process involving the hopping ofan f -electron from one Ce(2) site to an O 2p level fol-lowed by the hopping of an electron from the O 2p to the4f -level of the other Ce(2) site is required, the overallmatrix element for O(2) hopping, teff , becomes 0.15 eVcalculated from Eq. (3).
teff =t2fp
εf − εp(3)
Where we have assumed that the energy gap between theCe 4f - and the O 2p levels, εf −εp, is ∼ 2 eV30. The cor-responding matrix elements for O(1) hopping 0.50, 0.61and 0.15 eV respectively. We see that the overall matrixelement, teff , is the same in the two cases. Again, thiswould suggest that the charge should completely delocal-ize over all the Ce sites in the divacancy which contradictsthe results of the bond valence method. Thus, we con-clude that the Harrison parameters cannot fully explainthe charge delocalization in the Ce7O12 divacancy. How-ever, they appear to exclude the possibility of direct f -fhopping since teff is an order of magnitude larger thantff . These approximate results give some indication ofwhy the charge delocalization may not extend to includethe Ce(1) site. An alternative way of looking at the in-direct f -f coupling is to view it as a hybridization ofthe 4f states at the two Ce(2) sites and the O 2p statesat the O atom connecting them through Ce-O bonds.This indirect coupling is analogous to the superexchangemechanism first discussed by McConnell52.
VII. CONCLUSIONS AND FUTUREDIRECTIONS
The goal of this review was to answer the question:when an oxygen atom is removed from bulk cerium ox-ide where do the two excess electrons go? The approachtaken was to consider high resolution crystal structures ofCe11O20 and Ce7O12 and see how they could be viewedas ordered arrays of oxygen vacancies in an underlyingCeO2 crystal. The charge distribution in the local envi-ronments of the O vacancies can then be deduced fromthe bond valence model. An important conclusion is thatthe results are incompatible with the widely acceptedstandard picture of charge localization on two ceriumions next to the vacancy. Instead, we found that the
charge distributes itself predominantly in the second co-ordination shell of cerium ions. Furthermore, one excesselectron can be delocalised over more than one ceriumion.
Our conclusions concerning the charge distributionnear oxygen vacancies are significant for several reasons.First, they contradict many (but not all) atomistic sim-ulations based on density functional theory. Second, theactual charge distribution around the defect has impor-tant implications for the other questions we posed at thebeginning of this review. The charge distribution has asignificant effect on the relative stability of surface andsubsurface vacancies31. Also, if the charge around oxygensurface and subsurface vacancies is not simply localisedon Ce ions next to the vacancy this could change ourunderstanding of the catalytic activity of these surfacessince it has been claimed or assumed that it is associ-ated with Ce3+ ions at the surface.16,53 The charge dis-tribution around the vacancies has implications for elec-tronic and ionic conduction, a subject we have discussedelsewhere54.
Since our determination of the charge distributionaround vacancies is indirect it will be important to seewhether the same conclusions are obtained on experi-ments on these higher order oxides with complementaryprobes such as Electron Spin Resonance (ESR), nuclearmagnetic resonance, and photoemission spectroscopies.For example, ESR spectra should quite be distinct forthe standard picture of electrons localised onto Ce3+ ionsand our alternative picture of partial delocalisation overthe second co-ordination shell and unique charge (andspin) distributions associated which single vacancies anddivacancies.
A variety of spectroscopic probes have shown that theformation of oxygen vacancies is also associated with nextelectronic states located in energy between the valenceband of nominally “oxygen 2p” states and the “localised4f” states.55,56 DFT-based calculations which do not suf-ficiently include the effect of electronic correlations failto produce these states.29 Generally the energy of defectstates is correlated with the extent of electron localisationaround defects. Hence, we suggest that spectroscopicstudies of ordered phases of higher order oxides could bea fruitful approach to characterising the electronic prop-erties of defects and complementary to the structural ap-proach we have reviewed. We expect that the energies ofthe electronic states associated with each of the vacancieswe have considered will be different and correlated withthe extent of charge delocalisation that we find. Suchexperimental results will provide significant constraintson theories.
This review only considered bulk cerium oxides. How-ever, we believe our approach to characterising electronicproperties of oxygen vacancies in terms of a bond valencesum analysis and the physical insights gained should alsobe fruitful in the study of surface defects and to otherwidely studied oxidessuch as those of titanium, hafnium,vanadium, and zirconium.

13
VIII. ACKNOWLEDGEMENTS
This work was supported by the Australian ResearchCouncil. E.S. was supported by an Australian Common-wealth Government International Postgraduate ResearchScholarship and a University of Queensland InternationalPostgraduate Research Scholarship. He also received a
School of Mathematics and Physics Postgraduate TravelScholarship and a Travel award from the Australian Re-search Council Nanotechnology Network. We have ben-efited from discussions with A. Jacko, B.J. Powell, S.Olsen, D. Sholl, J. Reimers, N.S. Hush, W. Soboyejo,and G. Palenik.
1 High-temperature Solid Oxide Fuel Cells: Fundamentals,Design and Applications, edited by S. C. Singhal andK. Kendall (Elsevier Advanced Technology, UK, 2003).
2 H. Inaba and H. Tagawa, Solid State Ionics 83, 1 (1996).3 B. C. H. Steele, Solid State Ionics 129, 95 (2000).4 V. V. Kharton, F. M. Figueiredo, L. Navarro, E. N. Nau-
movich, A. V. Kovalevsky, A. A. Yaremchenko, A. P.Viskup, A. Carneiro, F. M. B. Marques, and J. R. Frade,J. Mater. Sci. 36, 1105 (2001).
5 D.-E. Zhang, X.-J. Zhang, X.-M. Ni, J.-M. Song, and H.-G.Zheng, ChemPhysChem 7, 2468 (2006).
6 Catalysis by Ceria and Related Materials, edited byA. Trovarelli (Imperial College Press, London, 2002) pp.15–50.
7 J. H. Blank, J. Beckers, P. F. Collignon, and G. Rothen-berg, ChemPhysChem 8, 2490 (2007).
8 H.-T. Chen, Y. M. Choi, M. Liu, and M. C. Lin,ChemPhysChem 8, 849 (2007).
9 L. Mo, X. Zheng, and C.-T. Yeh, ChemPhysChem 6, 1470(2005).
10 D. J. Fray, in Encyclopedia of Materials: Science and Tech-nology, edited by K. H. J. Buschow, R. W. Cahn, M. C.Flemings, B. I. (print), E. J. Kramer, S. Mahajan, , andP. V. (updates) (Elsevier, Oxford, 2001) pp. 8726 – 8730.
11 P. Jasinski, T. Suzuki, and H. U. Anderson, Sens. Actua-tors, B 95, 73 (2003).
12 P. R. L. Keating, D. O. Scanlon, and G. W. Watson, J.Phys.: Condens. Matter 21, 405502 (2009).
13 Y. Q. Song, H. W. Zhang, Q. H. Yang, Y. L. Liu, Y. X.Li, L. R. Shah, H. Zhu, and J. Q. Xiao, J. Phys.: Condens.Matter 21, 125504 (2009).
14 B. F. Hoskins and R. L. Martin, Aust. J. Chem. 48, 709(1995).
15 N. V. Skorodumova, S. I. Simak, B. I. Lundqvist, I. A.Abrikosov, and B. Johansson, Phys. Rev. Lett. 89, 166601(2002).
16 F. Esch, S. Fabris, L. Zhou, T. Montini, C. Africh, P. For-nasiero, G. Comelli, and R. Rosei, Science 309, 752 (2005).
17 F. A. Kroger and H. J. Vink, Solid State Physics 3, 307(1956).
18 R. L. Martin, J. Chem. Soc., Dalton Trans., 1335(1974).19 Z. C. Kang, J. Zhang, and L. Eyring, Z. anorg. allg. Chem.
622, 465 (1996).20 G. Thornton and M. J. Dempsey, Chem. Phys. Lett. 77,
409 (1981).21 A. Fujimori, Phys. Rev. B 28, 2281 (1983).22 A. Kotani, H. Mizuta, T. Jo, and J. C. Parlebas, Solid
State Commun. 53, 805 (1985).23 A. Kotani, T. Jo, and J. C. Parlebas, Adv. Phys. 37, 37
(1988).24 A. Kotani, Eur. Phys. J. B 47, 3 (2005).
25 T. K. Sham, R. A. Gordon, and S. M. Heald, Phys. Rev.B 72, 035113 (2005).
26 N. V. Skorodumova, R. Ahuja, S. I. Simak, I. A. Abrikosov,B. Johansson, and B. I. Lundqvist, Phys. Rev. B 64,115108 (2001).
27 M. Mogensen, N. M. Sammes, and G. A. Tompsett, SolidState Ionics 129, 63 (2000).
28 S. Fabris, S. de Gironcoli, S. Baroni, G. Vicario, andG. Balducci, Phys. Rev. B 71, 041102 (2005).
29 M. V. Ganduglia-Pirovano, A. Hofmann, and J. Sauer,Surf. Sci. Rep. 62, 219 (2007).
30 C. W. M. Castleton, J. Kullgren, and K. Hermansson, J.Chem. Phys. 127, 244704 (2007).
31 M. V. Ganduglia-Pirovano, J. L. F. D. Silva, and J. Sauer,Phys. Rev. Lett. 102, 026101 (2009).
32 H.-Y. Li, H.-F. Wang, X.-Q. Gong, Y.-L. Guo, Y. Guo,G. Lu, and P. Hu, Phys. Rev. B 79, 193401 (2009).
33 E. Shoko, M. F. Smith, and R. H. McKenzie, Phys. Rev.B 79, 134108 (2009).
34 Z. C. Kang and L. Eyring, Aust. J. Chem. 49, 981 (1997).35 M. Zinkevich, D. Djurovic, and F. Aldinger, Solid State
Ionics 177, 989 (2006).36 Z. C. Kang and L. Eyring, J. Alloys Compd. 275-277, 30
(1998).37 C. Lopez-Cartes, J. A. Perez-Omil, J. M. Pintado, J. J.
Calvino, Z. C. Kang, and L. Eyring, Ultramicroscopy 80,19 (1999).
38 D. J. M. Bevan and R. L. Martin, J. Solid State Chem.181, 2250 (2008).
39 R. L. Martin, . Chem. Soc., Dalton Trans., 3659(1997).40 E. A. Kummerle and G. Heger, J. Solid State Chem. 147,
485 (1999).41 J. Zhang, R. V. Dreele, and L. Eyring, J. Solid State Chem.
104, 21 (1993).42 S. P. Ray and D. E. Cox, J. Solid State Chem. 15, 333
(1975).43 R. D. Shannon, Acta Crystallogr. , Sect. A 32, 751 (1976).44 G. Kresse, P. Blaha, J. L. F. D. Silva, and M. V. Ganduglia-
Pirovano, Phys. Rev. B 72, 237101 (2005).45 M. Nolan, J. E. Fearon, and G. W. Watson, Solid State
Ionics 177, 3069 (2006).46 D. A. Andersson, S. I. Simak, B. Johansson, I. A.
Abrikosov, and N. V. Skorodumova, Phys. Rev. B 75,035109 (2007).
47 A. M. Burow, M. Sierka, J. Dobler, and J. Sauer, J. Chem.Phys. 130, 174710 (2009).
48 S. Torbrugge, M. Reichling, A. Ishiyama, S. Morita, andO. Custance, Phys. Rev. Lett. 99, 056101 (2007).
49 W. A. Harrison, Elementary Electronic Structure (WorldScientific, 2004) p. 607.
50 W. A. Harrison, Phys. Rev. B 28, 550 (Jul 1983).

14
51 W. A. Harrison and G. K. Straub, Phys. Rev. B 36, 2695(Aug 1987).
52 H. M. McConnell, J. Chem. Phys. 35, 508 (1961).53 C. T. Campbell and C. H. F. Peden, Science 309, 713
(2005).54 E. Shoko, M. F. Smith, and R. H. McKenzie,
arXiv:0910.0669v2 [cond-mat.str-el](2009).55 D. R. Mullins, P. V. Radulovic, and S. H. Overbury, Surf.
Sci. 409, 307 (1998).56 M. A. Henderson, C. L. Perkins, M. H. Engelhard, S. The-
vuthasan, and C. H. F. Peden, Surf. Sci. 526, 1 (2003),ISSN 0039-6028.