THE ROLE OF SPECULATION IN THE SOUTH AFRICAN FOREIGN EXCHANGE MARKET
38
THE ROLE OF SPECULATION IN THE SOUTH AFRICAN FOREIGN EXCHANGE MARKET HAMDAN BUKENYA NTARE 1 & ABDOU SEMIYOU RAFIOU 2 Abstract The purpose of this article is to assess the effect of speculation in the South African foreign exchange market. In particular, we investigate, prior the financial crisis period, whether speculation is a stabilizing or destabilizing factor. The former would indicate the efficiency of the foreign exchange market. The main finding of this paper is that speculation had a destabilizing effect on the South African foreign exchange market. Both linear and non- linear techniques are used for the empirical analysis. Because the exchange rate data is non-linear, the Kalman filter technique is used to capture the dynamics in Rand/USD exchange rate. Keywords: Speculation, foreign exchange, destabilizing, Kalman filter. 1 Advisor Economic and Investment at A1 Express Delivery (PTY)Ltd 2 Senior Economist at Coega Development Corporation
-
Upload
independent -
Category
Documents
-
view
3 -
download
0
Transcript of THE ROLE OF SPECULATION IN THE SOUTH AFRICAN FOREIGN EXCHANGE MARKET

THE ROLE OF SPECULATION IN THE SOUTH AFRICAN FOREIGN
EXCHANGE MARKET
HAMDAN BUKENYA NTARE1
&
ABDOU SEMIYOU RAFIOU2
Abstract
The purpose of this article is to assess the effect of speculation in the South
African foreign exchange market. In particular, we investigate, prior the
financial crisis period, whether speculation is a stabilizing or destabilizing
factor. The former would indicate the efficiency of the foreign exchange
market. The main finding of this paper is that speculation had a destabilizing
effect on the South African foreign exchange market. Both linear and non-
linear techniques are used for the empirical analysis. Because the exchange rate
data is non-linear, the Kalman filter technique is used to capture the dynamics
in Rand/USD exchange rate.
Keywords: Speculation, foreign exchange, destabilizing, Kalman filter.
1 Advisor Economic and Investment at A1 Express Delivery (PTY)Ltd 2 Senior Economist at Coega Development Corporation

1
1. INTRODUCTION
There is always debate as to whether speculation in foreign exchange markets
has a stabilizing (indicating that the foreign exchange market is efficient) or
destabilizing effect. In recent work3 where cognizance is taken of noise trading,
speculation is found to be destabilizing. But how can the effect of speculation
be measured so that we can investigate and determine whether it stabilizes or
destabilizes the foreign exchange market?
In Australia, where attempts have been made to investigate the role of
speculation in foreign exchange markets, commitments of traders4 have been
used as the proxy for speculation. These commitments are no different from
traders’ open positions, because in both cases traders take a view on the future
exchange rate movement. Based on their views, they commit themselves to
selling or buying a particular currency (Canova, 1991). Unlike in hedging and
arbitrage transactions, these positions are unhedged. The South African
Reserve Bank (SARB) provides these positions as open positions.
3 See Hodge (2005), Taylor (1995) and De Long (1990).
4 See Radalj (2006)

2
As for the effect of speculation in the foreign exchange market is concerned,
Friedman (1953) claims that speculation is stabilizing because speculators, in
the pursuit of profit, buy when the price is low (depreciated currency) and sell
when the price is high (appreciated currency). He adds that in doing so the
exchange rate always returns to its fundamental value. Therefore, speculation
ensures that the foreign exchange market is efficient (Johnson, 1976) and
(Isard, 1995).
However, Nurkse (1944) claims that speculation is destabilizing. This claim is
supported by Stein (1961) and, De Long et al. (1990). De Long et al. (1990)
say the following: “In the presence of positive feedback traders5, rational
speculation can be destabilizing …. informed rational speculators buy more
today and so drive up prices today higher than fundamental news warrant.
Tomorrow, positive feedback traders buy in response to today’s price increases
and so keep prices above fundamentals even as rational speculators are selling
out and stabilizing prices …. speculators may eventually stabilize prices but
their net effect can be destabilizing if they make positive feedback traders
sufficiently aggressive.” In South Africa, speculation has persisted (despite the
Exchange Control Act prohibiting exchange rate traders from issuing foreign
exchange not backed by virtual transactions in goods) for the following
reasons. First, speculators avoid exchange control regulations through leads-
and-lags events, where importers and exporters are at liberty not to take
forward cover if they expect favourable exchange rate movements. Importers
may, for example, prefer to pay earlier if they expect significant depreciation of
the rand, whereas exporters will prefer delayed receipt for their exports.
Second, exporters are exonerated from holding foreign currency receipts
offshore for a period of 180 days before these receipts have to be converted
5 Traders buying when prices rise and selling when prices fall (De long et al. (1990).

3
into rands. Converting these proceeds will ultimately affect the liquidity of the
foreign exchange market. Although they are eventually relaxed, these liquidity
constraints will have subversive effects over the short term. Third, offshore
dealings in rands are independent of exchange control regulations. Estimated at
30% of total turnover, these offshore dealings are implicitly speculative
(Hodge, 2005).
Therefore the effect of speculation in the South African foreign exchange
market may provide some insight into whether speculation is stabilizing or
destabilizing in nature. Reviewed work in this paper suggests that the
predominant academic view is that speculation is destabilizing. How trenchant
is such a view?
The questions this study will investigate are the following:
- How do we obtain the best measure of speculation in foreign exchange
in South Africa? How do participants in foreign exchange compile this
measure?
- How does the measure of speculation affect the expected future spot
(foreign exchange) rate?
- Is the finding of De Long et al. (1990) supported in the South African
foreign exchange market?
The objective of this study is to determine the appropriate measure of
speculation that applies to the South African foreign exchange market and to
analyze the effect of speculation in the South African foreign exchange market.

4
This paper is divided into five sections. The introduction, research questions
and hypotheses are presented in Section 1. Section 2 provides the literature
review and presentation of the models. In Section 3, we discuss the Kalman
filter method, while in Section 4 we report the findings from OLS and Kalman
filter regressions. Lastly, Section 5 provides the conclusion.
2. LITERATURE REVIEW
Studies conducted in developed countries such as Australia, USA and the
United Kingdom on whether speculation is stabilizing or destabilizing have
provided different conclusions. Some studies in the 1950s and 60s suggested
that speculation is stabilizing,6 whereas most studies between 1970 and 2008
suggest that speculation is destabilizing. In the following subsections, we
present the findings of these studies as well as some previous research on the
role of speculation in the foreign exchange market.
a) Does speculation in the foreign exchange market have a stabilizing effect?
Friedman (1953) claims that speculation has a stabilizing effect because
speculators, in the pursuit of profit, buy when the price is low (depreciated
currency) and sell when the price is high (appreciated currency). He adds that
in doing so, the exchange rate always returns to its fundamental value.
Therefore, speculation ensures that the foreign exchange market is efficient.
According to Hart (1977) and Rapping and Pulley (1985), speculation has a
stabilizing effect and is profitable. This is especially the case if speculators
6 A view pioneered by Stuart Mill (1921) and later shared by Baumol (1957, 1959), Farrel (1966), Friedman (1953), Kemp (1963), Schimmler (1973) and Telser (1959) among others (Hart, 1977).

5
predict the future accurately. Speculators will then buy when prices are low
(depreciated currency) and sell when prices are high (appreciated currency).
This nature of speculative activity will be evident when the exchange rate is
fluctuating over time. As a result, speculation will dampen exchange rate
fluctuations and in so doing ensure that the foreign exchange market is
efficient.
But even the earliest researchers on the subject of stabilizing speculation,
notably Baumol (1957), Farrel (1966), Kemp (1963) and Schimmler (1973),
admitted that profitable speculation may be stabilizing or destabilizing in
nature (Hart, 1977). Baumol (1957) suggests: “how often and to what extent
speculation is stabilizing remains a matter of empirical enquiry.” This is
because Baumol (1957) recognizes the presence of (at some times) buying
when the currency is appreciating and selling when the currency is
depreciating. This activity may be profitable but destabilizing because it
triggers price movements. However, the activity may also be stabilizing
because sales occur at higher prices. The net effect of speculation will be
determined by answering the question: which one predominates?
In fact, speculators who earn positive profits may be trading against the less
rational investors who move prices away from fundamentals. Such speculators
rationally minimize the deviations of prices from fundamentals and so stabilize
prices. However, because risk aversion keeps rational speculators from taking
large arbitrage positions, noise traders affect prices. Nonetheless, the effect of
rational speculators’ trades is to move prices towards fundamentals. Rational
speculators oppose noise-driven price movements and so dampen, but do not
eliminate them (De Long et al., 1990) and (Stein, 1961).

6
b) Does speculation in the foreign exchange market have a destabilizing effect?
The validity of the assumption speculation decreases exchange rate
fluctuations is questionable. This is especially so in an economy where there
are many uninformed traders and trading is characterized by ‘movement
trading.’ In addition, short selling, if allowed, destabilizes the exchange rate
more than it stabilizes it (Leeman, 1949) and (Taylor, 1995).
Nurkse (1944) claims that speculation in the foreign exchange market is
destabilizing. This claim is supported by Stein (1961), Schadler (1977) and De
Long et al. (1990). The inefficiency of the foreign exchange market is also
largely attributed to irrational market behaviour such as speculation (Canova,
1991).
Therefore, more recent models have taken cognizance of the presence of noise
trading in the foreign exchange market. Because noise traders buy when prices
rise (in anticipation of further increases in prices) or sell when the price falls,
they have been termed ‘positive feedback traders.’ Their actions lead to
inefficient foreign exchange markets. Consequently, the foreign exchange
market will be inefficient even in the presence of traders whose trades are
based on fundamental news concerning future movements in the exchange rate
(De Long et al., 1990).
At times, the absence of stabilizing speculation rather than destabilizing
speculation in relatively small economies - for example, the South African
foreign exchange market during the third and fourth quarter of 2001 - may
destabilize the market. As a consequence of traders selling the rand, the effect
of individual transactions was magnified considerably during this period as the

7
odds pointed towards the rand depreciating. Stabilizing speculators wishing to
take an opposing view avoided the market temporarily, and the rand
depreciated in self-fulfilling fashion (Hodge, 2005).
c) Presentation of models
The efficiency model7
In this paper we investigate the efficiency of the South African foreign
exchange market.8 In particular, we use the unbiased forward rate hypothesis
(UFRH) to investigate if the forward rate is an optimal predictor of the future
spot rate.9
We assume that the spot-forward market possesses the following
characteristics: First, the spot-forward market has many investors with
sufficient funds to enable them utilize arbitrage opportunities as they occur.
Second, there are no exchange controls, so funds can move freely. Third,
transaction costs, if any, are negligible.
In addition, two assumptions are made in regard to the application of the
efficient markets hypothesis (EMH) to the forward market for foreign
exchange.10
First, agents set the forward exchange rate, for maturity in period
t+1, equal to the expected future spot rate for period t+1:
7 The analysis of this paper is based on the forward rate as an unbiased (efficient) forecaster of the future spot rate. The forward rate and the random walk model are often used as the benchmarks for evaluating the efficiency of the foreign exchange market (Moosa, 2000). 8 Market efficiency can be represented by unbiasedness or the random walk model (Copeland, 1989). 9 The analysis here is based on Copeland (1989). 10 Analysis in this section is based on MacDonald (1993), Isard (1995) and Moosa (2000).

8
1 t
t
e fs (1)11
The assumption that speculators are risk neutral and that no limitations to
arbitrage exist, such as transaction costs and speculation, will ensure that (1)
holds continuously. Therefore (1) provides the market equilibrium relationship
(MacDonald, 1993).
The second assumption related to efficiency hypothesis states that speculators
are rational, so that:
11 t
e
tt uss (2)
In (2) above, e
tS is equal to E(St/It-1), E is the mathematical expectational
operator, It-1 is the information set for period t-1, on which expectations are
made and ut+1 is a white noise error term.
Combining (1) and (2), we obtain the market efficiency condition in (3) below.
1
1
1
t
t
tt ufs (3)
Equation (3) above states that the spot rate in period t+1 should be equal to the
corresponding forward rate plus a random error.
1
1
101
t
t
tt ufaas (4)12
11 In this paper the logarithms of the spot and forward exchange rates rather than actual values are considered. In using logarithms, we are trying to avoid the inequality paradox (Jensen’s inequality). This paradox states that the efficiency test based on the levels of spot and forward exchange rates would give two different answers depending on whether we used the domestic currency value of a unit of foreign exchange or the foreign currency value of a unit of domestic currency definition for our exchange rates (MacDonald, 1993) and (Copeland, 1989). Therefore if we used levels data, the mathematical expectation of St+1 would differ from that of 1/St+1. Thus, through out this paper we use st=lnSt, ftt+1=lnFt
t+1 etc.

9
In (4) above, the expectational or forecast errors ut+1 are assumed to be serially
uncorrelated (random) with zero means and the unbiasedness joint hypothesis
(a1 = 1, a0 = 0) holds13
. If the foreign exchange market is efficient, 1t
tf should
contain all relevant information14
for forecasting the future spot rate, st+1.
On the other hand, if agents are risk averse, a statistically significant constant
term (a0) may reflect a constant risk premium and a significant deviation of a1
from 1 could reflect a time-varying risk premium, irrationality or both
(Hallwood and MacDonald, 2000).
The biasedness of the forward rate is often taken as evidence of the existence
of a risk premium. However, if this were the case, the forward premium, which
encompasses the risk premium, should explain the features of ex ante profits.
Instead, fluctuations in realized profits are too large to be explained by a risk
premium and suggest the possibility of irrational market behaviour. Although
there is sufficient evidence supporting this observation, we cannot conclude
that agents act irrationally. This is because the risk premium is not the only
source of profits (Canova, 1991).
12 In our specification, the error term ut+1 will be serially correlated if 1-month forward exchange rate contract is used with weekly data. This is because when the observations are more frequent than the maturity period the error term will not be independent of past forecast errors. For example, for a 1-month forward rate data, information available in weeks 1 and 4 will be correlated with information available for weeks 2 and 5 (MacDonald, 1993). That is why we have used monthly data in this research. 13 Moosa (2000) refers to this efficiency as simple efficiency and that general efficiency is obtained by relaxing the restriction, a0 = 0 (risk neutrality), in which case, a0 would represent the existence of a risk premium. 14 Because in an efficient market the forward rate at time t incorporates all information available to
the market, it should contain all information in the forward rates 1
21,
t
t
t
t ff etc. Hence, adding
more lags should not improve the explanatory power, and the coefficients of these lags are expected to be zero (Frenkel and Johnson, 1978).

10
In addition, most empirical studies find that agents get the direction of the
exchange rate change completely wrong. This is through obtaining the value of
a1 closer to -1 than +1 (Hallwood and MacDonald, 2000).
MacDonald and Marsh (1999) suggest that although (4) has been estimated
based on OLS levels in many past empirical studies and in the process failed to
reject the implied joint null hypothesis of unbiasedness (a1 = 1, a0 = 0), the
standard regression-based tests are not valid. This is because 1ts and 1t
tf are
generally non-stationary I(1) processes. Thus, there is no guarantee that 1tu
will be a stationary white noise error term unless the spot and forward rates are
cointegrated.
Other tests that tried to avoid the non-stationary problem used regressions
based on (5) below.
1
1
1
tt
t
ttt usfss (5)
1
1
101 )(
tt
t
ttt usfaass (6)
From equation (5), equation (6) is obtained and estimated with OLS and the
Kalman filter technique. Subsequently, we apply least squares and the Kalman
filter techniques to our nonlinear exchange rate data for comparison purposes.
The Kalman filter technique, however, captures the exchange rate dynamics
more accurately than OLS. The dependent variable ( tt ss 1 ) in equation (6) is
known to be stationary and the forward premium ( t
t
t sf 1 ), because it is a
quasi-difference variable, is assumed to be stationary. Unbiasedness would
imply a1 = 1, a0 = 0 (MacDonald and Marsh, 1999).

11
However, should we test the UFRH using level specification in (4) or the
percentage change specification in (6)? According to Barnhart and Szakmary
(1991), most studies that have used the specification in (4) have failed to reject
the UFRH, whereas studies based on (6) have rejected the UFRH. In addition,
we are more interested in equation (6) because it captures the short-term15
behaviour of traders.
The speculation model
A speculator is an investor who exposes himself deliberately to the risk of
uncertainty in future exchange prices. Based on his views regarding what price
is likely to prevail, he trades in the expectation of making a profit (Canova,
1991). Certainly, speculation is believed to play a key role in explaining the
behaviour of exchange rates (Duarte and Stockman, 2001).
Speculation in foreign exchange is boosted by the existence of forward
exchange facilities, which enable speculators to take a longer view. They can
operate whenever they expect a wide exchange movement without having any
definite opinion of when it is likely to occur. This means an additional volume
of speculative operations besides those undertaken when exchange movements
are expected to take place within the next two days. Spot speculation is limited
by the availability of credit facilities for that purpose (Einzig, 1961); (Eaton,
1984) and (Turnovsky, 1984).
15 Most of foreign exchange trading happens in a space of minutes or hours. Trading in foreign exchange is mainly driven by information relevant in the short-term (Mosakowski and Srilata, 1999).

12
According to Beenstock (1979) and Phaup (1981), the speculative demand for
forward exchange would depend on the difference between the expected spot
rate ( es ) and the forward rate (F) since this difference is the expected profit on
buying forward exchange with the intention of selling it at the prevailing spot
rate on maturity. The speculator’s excess demand schedule is written in linear
form as ),( FsXD e 0 where is the slope of the speculation
schedule that is likely to vary inversely with the variance of the expected spot
rate and the degree of risk aversion. Therefore, is regarded as less than
infinitely large, to reflect the assumption of risk aversion. If exchange risk is
high and investors are risk averse, could be relatively small or even zero.
Equilibrium among forward speculators occurs when F is equal to the expected
spot rate, es . If es is greater than F, speculators will purchase foreign
exchange forward at F with the intention of later selling it at es . The greater the
extent to which the actual forward rate falls below the expected future rate, the
greater will be the demand for the forward currency by speculators.
Conversely, if the actual forward rate is above that expected by speculators to
prevail their supply will be an increasing function of the current forward rate
(MacDonald, 1993) and (Sohmen, 1969). However, if 0 speculators would
abandon the forward market.
The analysis of speculation can be extended to classification of speculators,
namely: chartists (noise traders, technical analysts) and fundamentalists.
Chartists use past movements of the exchange rates as indicators of market
sentiments and extrapolate these into the future. Their behavior, therefore, adds
a ‘positive feedback’ into the model and is the source of instability in the
foreign exchange rates. On the other hand, fundamentalists compute the
equilibrium value of the exchange rate as given by the model and consider the

13
exchange rate to be the one to which the market exchange rate will move.
Thus, if the market rate exceeds this equilibrium value, fundamentalists expect
it to decline in the future. The behaviour of the fundamentalists adds a
‘negative feedback’ into the model and is therefore a source of stability (De
Grauwe, 1993).
Another way of analyzing the concept of speculation in the foreign exchange
market is by analyzing the net open positions taken by speculators in foreign
exchange. This is the approach we use in this paper. Mussa (1990) provides an
equation that incorporates speculation into the efficiency equation, which
relates the expected future spot rate, ]/)([ tjteE , the expected true economic
fundamentals that influence the exchange rate, ]/)([ tktFE , the expected
false fundamentals that influence the exchange rate, ]/)([ tktGE , and the
rational speculative bubble, )./( tkB This equation is given as:
)./(]/)([]/)([]/)([ tkBtktGEtktFEtjteE
However, he suggests that the false fundamentals do not directly affect the
exchange rate. In addition, we may regard the forward rate as one of the true
fundamentals. Pentecost (1993) further defines speculative bubbles as
exchange rate movements that are inconsistent with the fundamentals and that
are driven by non-economic variables such as the belief of speculators,
independent of the fundamentals. In addition, Pentecost (1993) suggests that a
rational bubble occurs when market participants continue to buy a currency
that is overvalued in terms of its fundamentals, in the expectation of making a
short-run gain as the currency appreciates further, before falling back to the
long-run equilibrium level determined by the fundamentals.
14
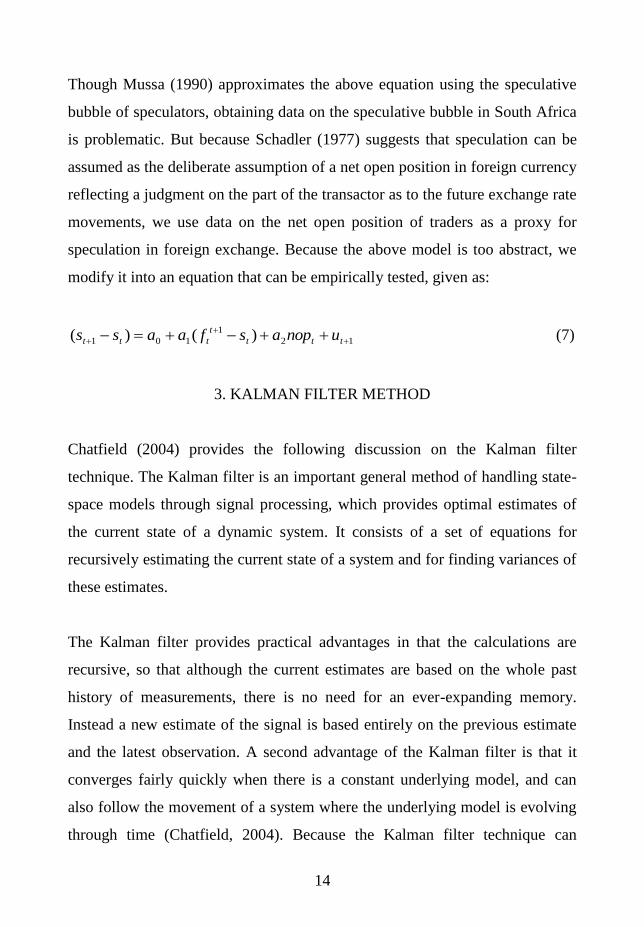
Though Mussa (1990) approximates the above equation using the speculative
bubble of speculators, obtaining data on the speculative bubble in South Africa
is problematic. But because Schadler (1977) suggests that speculation can be
assumed as the deliberate assumption of a net open position in foreign currency
reflecting a judgment on the part of the transactor as to the future exchange rate
movements, we use data on the net open position of traders as a proxy for
speculation in foreign exchange. Because the above model is too abstract, we
modify it into an equation that can be empirically tested, given as:
12
1
101 )()(
ttt
t
ttt unopasfaass (7)
3. KALMAN FILTER METHOD
Chatfield (2004) provides the following discussion on the Kalman filter
technique. The Kalman filter is an important general method of handling state-
space models through signal processing, which provides optimal estimates of
the current state of a dynamic system. It consists of a set of equations for
recursively estimating the current state of a system and for finding variances of
these estimates.
The Kalman filter provides practical advantages in that the calculations are
recursive, so that although the current estimates are based on the whole past
history of measurements, there is no need for an ever-expanding memory.
Instead a new estimate of the signal is based entirely on the previous estimate
and the latest observation. A second advantage of the Kalman filter is that it
converges fairly quickly when there is a constant underlying model, and can
also follow the movement of a system where the underlying model is evolving
through time (Chatfield, 2004). Because the Kalman filter technique can

15
capture the exchange rate dynamics more accurately than the OLS technique,
OLS is used only for the purposes of comparison for the interested reader.
In state-space modelling, the prime objective is usually to estimate the signal in
the presence of noise. In other words, we want to estimate the (m x 1) state
vector t , which cannot usually be observed directly. The Kalman filter
provides a general method for doing this. It consists of a set of equations that
allow us to update the estimate of t when a new observation becomes
available. This updating procedure has two stages, namely: the prediction stage
and the updating stage (Chatfield, 2004).
Using the analysis by Wang (2003), we apply the Kalman filter model to our
simple model in equation (7) above by using time-varying coefficients. The
result is shown in equation (8) below.
)()( 101 taass tt )( 1
t
t
t sf )(2 ta tnop + 1tu (8)
Where tvtata 111 )1()(
tvtata 222 )1()( , and
tnop is the speculators’ net open positions. Following Radalj (2006), we lag
speculators' open positions because they are taken a period in advance
depending on which direction speculators perceive the future spot rate to take.
The first equation is the observation equation and the next two equations are
the state/ transition equations. The coefficients )(1 ta and )(2 ta in this model
follow a random walk.

16
The errors in the observation and transition equations are generally assumed to
be serially uncorrelated and also to be uncorrelated with each other for all time
periods. We may further assume that 1tu ~ ),0( 2
N .
The main feature of state-space models is that the observation equation
involves a linear function of the state variables and yet does not restrict the
model to be constant through time. Instead they allow local features such as
trend and seasonality to be updated through time using the transition equation
(Chatfield, 2004).
In this paper we assume that the destabilizing role of speculators and not a
time-varying risk premium ( 0a ), is the cause of the biasedness in the expected
spot rate. Therefore, the risk premium is treated as constant in this paper to
enable us to isolate the effects of speculation on the expected future spot rate.
The coefficient 0a is expected to be zero and )(1 ta is expected to be equal to 1
if the market is efficient. In addition, )(2 ta is expected to be negative and
significant if speculation is destabilizing and positive if speculation is
destabilizing.
4. EMPIRICAL ANALYSIS
a) Data
Owing to the nature of this exercise, we used data for the period prior the
financial crisis to avoid interference of new post crisis reforms. Monthly data
obtained from I-Net Bridge for the R/$ spot and the forward exchange rate

17
were used. We also used data from the South African Reserve Bank (SARB)
on the net open position of speculators (nop). Following Moosa (1990) and
Schadler (1977), speculators’ net open positions are used as a proxy for
speculation in foreign exchange. Data on all variables is for the period
31/01/1994 – 29/02/2008. We have 170 observations in our data set for each of
the variables mentioned above, except for the net open position of traders,
where we have 138 observations from 31/01/1996 to 30/06/2007. Logarithm-
transformed data for all variables is used.
b) Unit root and cointegration test
Visual inspection of Figure 1 in the appendix suggests that both the spot and
forward R/USD exchange rates are non-stationary. Indeed, ADF unit root tests
in Table 1 in the appendix show that both spot and forward exchange rates are
integrated or I(1), and therefore, are non-stationary. However, Johansen
cointegration test results in Tables 2 and 3 in the appendix show that the two
series are cointegrated, and so, we would not obtain spurious results with OLS.
This is because, according to Clements and Hendry (1998), cointegration is a
relationship that may hold between integrated economic time series, and
implies that some of the series have common unit-root components that cancel
when we take appropriate linear combinations. We, therefore, proceed with the
regressions.
c) Efficiency model
We start by estimating a least squares regression equation relating the long-
term forward rate to the long-term spot rate over the period 1994M1 to
2008M2.

18
Table 4: OLS regression of equation: 1
1
101
t
t
tt ufaas
Dependent Variable: 1ts
Method: OLS
Newey-West HAC Standard Errors and Covariance
Period a0 a1 AIC Adj. R-
sq
01/1994 –
02/2008
0.0432***
0.9851***
-3.8551 0.9870
S.E 0.0159 0.0087 DW Log
likel.
P-value 0.0075 0.0000 1.2806 327.7565
Source: Own
For tables 4 -11, * (**) [***] denotes significant at the 10 (5) and [1] percent
significance level, respectively.
The results of the ordinary last squares (OLS) estimation (see Table 4) can be
interpreted as follows. The estimated coefficient of the forward rate is
significant during the period 1994M1 to 2008M2. Therefore a long-term
relationship exists between the forward rate and the expected future spot rate.
Although the coefficients are both positive and close to the hypothesized
values (a0 = 0, a1 = 1), the F-statistic suggests that the joint hypothesis required
for efficiency is rejected.
On the other hand, least squares estimation of the regression equation relating
the short-term forward rate to the short-term spot rate over the period 1994M1
to 2008M2 provides the results in Table 5 below.

19
Table 5: OLS regression of equation: 1
1
101 )()(
tt
t
ttt usfaass
Dependent Variable: tt ss 1
Method: OLS
Newey-West HAC Standard Errors and Covariance
Period a0 a1 AIC Adj. R-sq
01/1994 –
02/2008
-
0.0117***
-
1.0027***
-7.7069 0.9795
S.E 0.0004 0.0112 DW Log likel.
P-value 0.0000 0.0000 0.05316 653.2289
Source: Own
OLS results in Table 5 illustrate that the foreign exchange market is inefficient
due to the negative signs on the a0 and a1 coefficients. In addition, the joint null
hypothesis of spot-forward efficiency is rejected in the short-term specification.
The F-statistic in this specification is 8040.992 with a probability value of
0.0000. We should note that the short-term specification is the most important
specification in this paper due to its portrayal of the short-term behaviour in the
market.
We further investigate the efficiency of the foreign exchange market using the
Kalman filter technique. This technique is more powerful than OLS when one
is working with non-linear data.
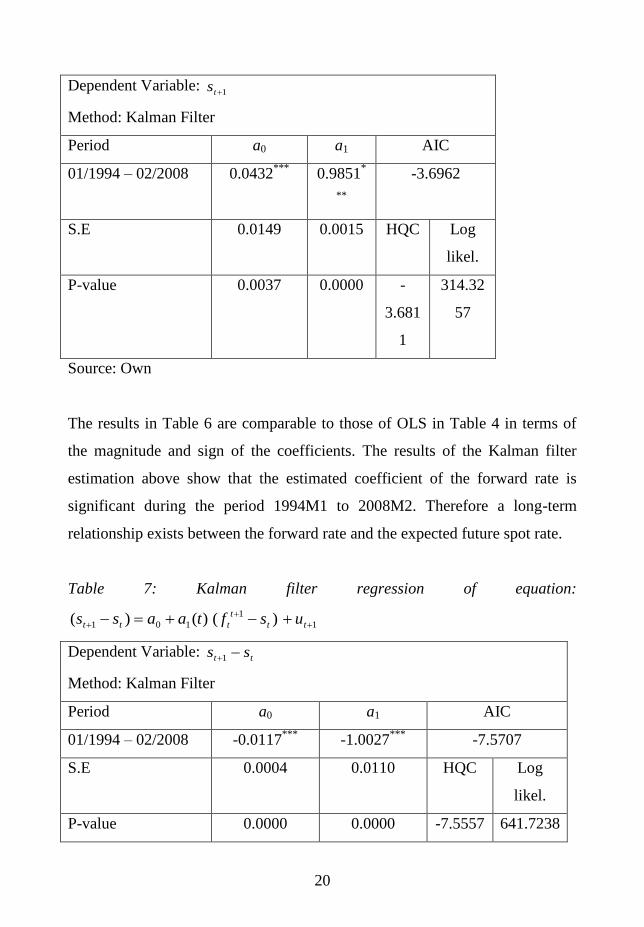
The Kalman filter results are presented in Tables 6 and 7.
Table 6: Kalman filter regression of equation: )(101 taast
1t
tf 1 tu
20
Dependent Variable: 1ts
Method: Kalman Filter
Period a0 a1 AIC
01/1994 – 02/2008 0.0432***
0.9851*
**
-3.6962
S.E 0.0149 0.0015 HQC Log
likel.
P-value 0.0037 0.0000 -
3.681
1
314.32
57
Source: Own
The results in Table 6 are comparable to those of OLS in Table 4 in terms of
the magnitude and sign of the coefficients. The results of the Kalman filter
estimation above show that the estimated coefficient of the forward rate is
significant during the period 1994M1 to 2008M2. Therefore a long-term
relationship exists between the forward rate and the expected future spot rate.
Table 7: Kalman filter regression of equation:
)()( 101 taass tt )( 1
t
t
t sf
1 tu
Dependent Variable: tt ss 1
Method: Kalman Filter
Period a0 a1 AIC
01/1994 – 02/2008 -0.0117***
-1.0027***
-7.5707
S.E 0.0004 0.0110 HQC Log
likel.
P-value 0.0000 0.0000 -7.5557 641.7238

21
Source: Own
As with the OLS results in Table 5, the Kalman filter results in Table 7 show
that market players get the direction of the future spot rate wrong during the
period 1994M1 to 2008M2. This could be due to irrational market behaviour.
We investigate this behaviour using the speculation model.
d) Speculation model
As in the efficiency model, the analysis in the speculation model was carried
out using both OLS and Kalman filter techniques for comparison purposes. The
results are shown in Tables 8 to 11 for the period 1994M1 to 2008M2.
Table 8: OLS regression of equation: 12
1
101
tt
t
tt unopafaas16
Dependent Variable: 1ts
Method: OLS
Newey-West HAC Standard Errors and Covariance
Period a0 a1 a2 AIC Adj. R-
sq
01/1994 –
02/2008
0.1536**
*
0.9708**
*
-
0.00676*
-
3.6782
0.9717
S.E 0.0490 0.0154 0.0038 DW Log
likel.
P-value 0.0022 0.0000 0.0811 1.3580 225.532
1
16 For the incorporation of the role of speculation in the spot-forward relationship see Mussa (1990: 10)

22
Source: Own
OLS regression findings in Table 8 contradict the most popular finding that
identification of speculation in the foreign exchange market means the market
is inefficient. In fact, whereas the OLS results in Table 4 suggested that the
market is inefficient, Table 8 results suggest that speculation is significant and
stabilizing over the long-term. This is due to a significant negative coefficient
of the nop variable.
We extend our analysis to the role of speculation in the foreign exchange
market over the short-term. The results for this exercise are presented in Table
9 below.
Table 9: OLS regression of equation:
12
1
101 )()(
ttt
t
ttt unopasfaass
Dependent Variable: tt ss 1
Method: OLS
Newey-West HAC Standard Errors and Covariance
Period a0 a1 a2 AIC Adj. R-
sq
01/1994 –
02/2008
-
0.0129**
-
1.0035**
*
0.00011
7
-
7.5979
0.9816
S.E 0.0065 0.0128 0.0005 DW Log
likel.
P-value 0.0495 0.0000 0.8277 0.0525 462.670
2
Source: Own

23
The results in Table 9 suggest that speculation does not play any role in the
foreign exchange market, as shown in an insignificant a2 coefficient. We
should note, however, that the OLS method may not capture the dynamics in
the nonlinear exchange rate data adequately. Baumol (1957: 263) warns against
using static analysis in empirical investigation of whether speculation is
stabilizing or not because the properties of the exchange rate may not be
adequately captured.
We therefore proceed to investigate the role of speculation in the South African
foreign exchange market using a more sophisticated dynamic technique. Unlike
the OLS technique, the Kalman filter technique is adequate when one is
working with non-linear exchange rate data.
Table 10: Kalman filter regression of equation:
)(101 taast
1t
tf )(2 ta tnop 1 tu
Dependent Variable: 1ts
Method: Kalman Filter
Period a0 a1 a2 AIC
01/1994 – 02/2008 0.1535**
*
0.9708***
-
0.0068**
*
-3.2609
S.E 0.0511 0.0141 0.0023 HQC Log
likel.
P-value 0.0027 0.0000 0.0029 -3.2422 199.287
5
Source: Own

24
The results in Table 10 show that speculation plays a significant and stabilizing
role in the South African foreign exchange market. This is because the
speculation coefficient (a2) is both significant and negative. However, we are
more concerned with the role of speculation over the short term, since
speculation is mainly encouraged by events over the short term. Results from
the short-term equation are presented in Table 11 below.
Table 11: Kalman filter regression of equation:
)()( 101 taass tt )( 1
t
t
t sf )(2 ta tnop 1 tu
Dependent Variable: tt ss 1
Method: Kalman Filter
Period a0 a1 a2 AIC
01/1994 – 02/2008 -0.0130*
-1.0035***
0.000118***
-7.1461
S.E 0.0070 0.0124 4.35E-05 HQC Log
likel.
P-value 0.0610 0.0000 0.0068 -
7.1273
434.336
1
Source: Own
The findings in Table 11 show that the time-varying coefficient of speculation
(a2) is statistically significant and positive. The positive sign on this variable
indicates that destabilizing speculation explains short term movements in the
future spot rate. In particular, our data shows positive feedback trading, which
has been identified as one of the major causes of inefficiency in the foreign
exchange market.
Therefore the above finding of market inefficiency may be a result of
speculation in the foreign exchange market. The nop coefficient value of

25
0.000118 is positive, indicating that whenever speculators expect that the
future spot rate will increase, they will increase their positions in foreign
exchange. Because speculators’ actions indicate that they expect the exchange
rate to increase even further, we can say that their actions are destabilizing. The
exchange rate will, therefore, tend to deviate from its equilibrium value, more
than rational speculation permits.
Certainly, R-squared from all OLS results shows that the models used provide
a good fit.
e) Comparison of the models
In comparison with the OLS results, the Kalman filter model captures the
dynamics in the exchange rate better. The speculation variable is insignificant
in the short-term specification with OLS whereas it is significant in the short-
term specification with the Kalman filter. In fact, the Kalman filter model
shows that the speculators’ positions are not only significant but also
destabilizing in the short term. This may be a result of high volatility in trading
volumes over the short term, which is corrected over the long term. Thus,
whereas Table 11 results indicate that speculation is destabilizing, Table 10
results indicate that speculation is stabilizing. These effects are captured by the
Kalman filter technique. In addition, with non-linear time series data, the OLS
model is inappropriate and the results of the coefficients are likely to be
misleading.
5. CONCLUSION
This paper analyzed and investigated the effect of speculation in the South
African foreign exchange market. In particular, we were interested in

26
determining whether speculation, especially of a destabilizing nature, is present
in the South African foreign exchange market.
Our findings suggested that the South African foreign exchange market is
inefficient. In addition, speculation was found to be statistically significant,
indicating that the inefficiency of the foreign exchange market could be a result
of the role of destabilizing speculation in the foreign exchange market. The
finding of foreign exchange market inefficiency may be due to speculation
especially over the short term. As suggested by MacDonald and Taylor (1992),
under the hypothesis of market efficiency, it should be impossible for a trader
to earn excess returns to speculation. We are assuming here that if speculators
were losing money, they would embark on stabilizing speculation. Certainly,
this indicates that positive feedback trading is rife in the South African foreign
exchange market.
Indeed, as suggested by De Long et al. (1990), rational speculators may benefit
from destabilizing the exchange rate by buying ahead of irrational (noise)
traders and exiting the market before noise traders exit. Therefore, we still
maintain that their actions are destabilizing because, as observed in many
empirical findings, the behaviour of positive feedback trading which results in
the correlation of asset returns, overreaction of prices to news, price bubbles
and expectations, is the norm rather than the exception (De Long et al., 1990).
This research has its limitations, however: for example, the investigation could
not be carried out on a much bigger data set due to insufficiency of high
frequency data on the net open positions of speculators in South Africa.
Therefore future research on a much bigger data set will undoubtedly yield
better results.

27
Another challenge worth undertaking is the investigation of the role of
speculation in different exchange rate regimes (fixed and floating). Our
emphasis was on the floating exchange rate period in South Africa.

28
REFERENCES
Barnhart, S.W. and Szakmary, A.C. (1991). Testing the Unbiased Forward
Rate Hypothesis: Evidence on Unit Roots, Cointegration and Stochastic
Coefficients. The Journal of Financial and Quantitative Analysis, Vol. 26 (2)
pp245 - 267.
Bassie, V.L. (1958). Economic Forecasting. McGraw-Hill Book Company, Inc
Beenstock, M. (1979). Arbitrage, speculation and Official Intervention: The
Cases of Sterling and the Canadian Dollar. The Review of Economics and
statistics, Vol. 61(1) pp 135 - 139.
Bilson, J.F.O. (1981). Profitability and Stability in International Currency
Markets. NBER Working Paper Series, No: 664 April, 1981
Bilson, J.F.O. and Ksieh, D.A. (1983). The Profitability of Currency
Speculation. NBER Working Paper Series, No: 1197 September, 1983
Blake, D. (1990). Financial Market Analysis. McGraw-Hill Series in Finance
Canova, F. (1991). An Empirical Analysis of Ex Ante Profits from Forward
Speculation in Foreign Exchange Markets. The Review of Economics and
Statistics, Vol. 73 (3) pp 489-496
Canterbery, E.J. (1971). A Theory of Foreign Exchange Speculation under
Alternative Systems. The Journal of Political Economy, Vol.79 (3) pp 407-436

29
Chang, E.C. (1985). Returns to Speculators and the Theory of Normal
Backwardation. The Journal of Finance, Vol. 40 (1) pp193-208
Chatfield, C (2004). The Analysis of Time Series (Sixth Edition). CRC Press
LLC
Chiang, T.C. (1988). The Forward Rate as a Predictor of the Future Spot Rate-
A Stochastic Coefficient Approach. Journal of Money, Credit and Banking,
Vol. 20 (2) pp 212-232
Clements, M.P. and Hendry, D.F. (1998). Forecasting Economic Time Series.
Cambridge University Press
Copeland, L.S. (1989). Exchange Rates and International Finance Addison-
Wesley Publishers Ltd
De Grauwe, P., Dewachter, H. and Embrechts, M. (1993). Exchange Rate
Theory. Blackwell Publishers
De Long, B.J., Shleifer, A., Summers, L.H. and Waldmann, R.J. (1990).
Positive Feedback Investment Strategies and Destabilizing Rational
Speculation. The Journal of Finance, Vol. 45 (2) pp 379-395
Duarte, M. and Stockman, A.C. (2001). Rational Speculation and Exchange
Rates. NBER Working Paper Series No: 8362, July 2001

30
Eaton, J. and Turnovsky, S.J. (1984). The Forward Exchange Market,
Speculation and Exchange Market Intervention. The Quarterly Journal of
Economics, Vol. 99 (1) pp 45-70
Einzig, P. (1961). A Dynamic Theory of Forward Exchange. St Martins Press
Inc.
Farrel, M.J. (1966). Profitable Speculation. Economica, New Series, Vol. 33
(130) pp 183-193
Grubel, H.G. (1966). Forward Exchange, Speculation and the International
Flow of Capital. Stanford University Press
Hallwood, C.P. and MacDonald, R. (2000). International Money and Finance
(Third Edition.) Blackwell Publishers
Hansen, L.P. and Hodrick, R.J. (1980). Forward Exchange Rates as Optimal
Predictors of Future Spot Rates: An Econometric Analysis. The Journal of
Political Economy, Vol. 88 (5) pp 829-853
Hart, O.D. (1977). On the profitability of speculation. The quarterly Journal of
Economics, Vol. 91 (4) pp 579-597
Hodge, D. (2005). Volatility of the Real Exchange Rate of the Rand: 1990 –
2004. Employment Growth and Development Initiative: HSRC
Isard, P. (1995). Exchange Rate Economics. Cambridge University Press

31
Johnson, H.G. (1976). Destabilizing Speculation: A General Equilibrium
Approach. The Journal of Political Economy, Vol. 84 (1) pp 101-108
Kimbrough, K.P. (1984). The Forward Rate as a Predictor of the Future Spot
Rate: The Role of Policy and Exchange Rate Regime Choice. International
Economic Review, Vol. 25(3) pp527 - 543
Leeman, W. A. (1949). An Evaluation of Organized Speculation. Southern
Economic Journal, Vol. 16(2) pp139-146
Levi, M.D. (1996). International Finance. McGraw-Hill, Inc.
MacDonald, R. (1993). Floating Exchange Rates: Theories and Evidence
Routledge
MacDonald, R. and Marsh, I. (1999). Exchange Rate Modelling. Kluwer
Academic Publishers
MacDonald, R. and Taylor, M.P. (1992). Exchange Rate Economics: A Survey
International Monetary Fund, Vol. 39 (1) pp 1 – 157
Moosa, I. A. (2000). Exchange Rate Forecasting: Techniques and Applications.
MacMillan Press Ltd.
Mosakowski, E. and Srilata, Z. (1999). The Global Configuration of a
Speculative trading operation: An Empirical study of Foreign Exchange
Trading. Organization Science, Vol. 10 (4) pp 401-423

32
Mussa, M. (1990). Exchange Rates in Theory and in Reality. International
finance section, Department of Economics, Princeton University
Pentecost, E.J. (1993). Exchange Rate Dynamics: A Modern Analysis of
Exchange Rate Theory and Evidence. Edward Elgar Publishing Limited
Pilbeam, K. (1998). International Finance (Second Edition). Palgrave
Radalj, K.F. (2006). Hedgers, speculators and forward markets: Evidence from
currency markets. Environmental Modelling & Software, Vol. 21 pp 1381-
1386
Rapping, L.A. and Pulley, L.B. (1985). Speculation, Deregulation and the
Interest Rate The American Economic Review, Vol. 75(2) pp 108-113
Schadler, S. (1977). Sources of Exchange Rate Variability: Theory and
Empirical evidence. Staff Papers- International Monetary Fund, Vol. 24(2) pp
253-296
Sohmen, E. (1969) Flexible Exchange Rates University of Chicago Press
Stein, J.L. (1961). Destabilizing Speculative Activity Can be Profitable. The
Review of Economics and Statistics, Vol. 43 (3) pp301 – 302.
Stekler, H.O. (1970). Economic Forecasting Praeger Publishers
Taylor, M.P. (1995). The economics of Exchange Rates. Journal of Economic
Literature, Vol. 33(1) pp 13-47

33
Towe, C.M. (1989). Exchange Rate Fundamentals versus Speculation in a
Developing Economy: An Illustrative Example using Lebanese Data. Staff
Papers- International Monetary Fund, Vol 36 (3) pp 678-707
Van der Merwe, E. J. (1996). Exchange rate management policies in South
Africa: Recent Experience and Prospects. South African Reserve Bank
Occasional Paper No. 9
Wang, P. (2003). Financial Econometrics: Methods and Models. Routledge

34
APPENDIX
Figure 1: Line graph for spot and forward R/USD exchange rate
Figure 2: Volatility clustering
-.10
-.05
.00
.05
.10
.15
.20
.25
25 50 75 100 125 150
DLZARUSDF DLZARUSDM
1.2
1.4
1.6
1.8
2.0
2.2
2.4
2.6
25 50 75 100 125 150
LZARUSDF LZARUSDM

35
Figure 3: Line graph for the speculators’ net open position in levels
Figure 4: Line graph for the speculators’ net open position in log
5
6
7
8
9
10
11
12
13
14
25 50 75 100 125 150
LNOP
Table 1: Augmented Dickey-Fuller test statistic
Null Hypothesis: has a unit root
Exogenous: Constant
Variables t-Statistic Prob.*
D(lzarusdm) -8.6345 0.0000
D(lzarusdf_1) -8.8351 0.0000
D(lnop_1) -10.6982 0.0000
*MacKinnon (1996) one-sided p-values.
-200,000
0
200,000
400,000
600,000
800,000
25 50 75 100 125 150
NOP

36
Table 2: Johansen Cointegration test Sample (adjusted): 7 170 Included observations: 164 after adjustments Trend assumption: Linear deterministic trend Series: ZARUSDM ZARUSDF_1 Lags interval (in first differences): 1 to 2
Unrestricted Cointegration Rank Test (Trace)
Hypothesized Trace 0.05
No. of CE(s) Eigen value Statistic Critical Value Prob.**
None * 0.233698 34.98366 15.46471 0.0001
At most 1 0.001979 0.243687 3.841466 0.6346
Unrestricted Cointegration Rank Test (Maximum Eigen value)
Hypothesized Max-Eigen 0.05
No. of CE(s) Eigen value Statistic Critical Value Prob.**
None * 0.343698 34.73997 14.28460 0.0000
At most 1 0.001969 0.2434687 3.841466 0.6346
Trace test indicates 1 cointegrating eqn(s) at the 0.05 level Max-Eigen value test indicates 1 cointegrating eqn(s) at the 0.05 level * denotes rejection of the hypothesis at the 0.05 level **MacKinnon-Haug-Michelis (1999) p-values
Table 3: Johansen Cointegration test Sample (adjusted): 7 170 Included observations: 164 after adjustments Trend assumption: Linear deterministic trend Series: ZARUSDM ZARUSDF_1 NOP_1 Lags interval (in first differences): 1 to 4
Unrestricted Cointegration Rank Test (Trace)
Hypothesized Trace 0.05
No. of CE(s) Eigen value Statistic Critical Value Prob.**
None * 0.185478 33.28932 28.79707 0.0243
At most 1 0.059716 7.452731 15.48471 0.5362
At most 2 0.002379 0.278430 3.847466 0.6023
Unrestricted Cointegration Rank Test (Maximum Eigen value)
Hypothesized Max-Eigen 0.05
No. of CE(s) Eigen value Statistic Critical Value Prob.**
None * 0.185478 24.82358 21.13162 0.0144
At most 1 0.059716 7.193302 14.26460 0.4665
At most 2 0.002379 0.278430 3.847466 0.6023

37
Trace test indicates 1 cointegrating eqn(s) at the 0.05 level Max-eigen value test indicates 1 cointegrating eqn(s) at the 0.05 level * denotes rejection of the hypothesis at the 0.05 level **MacKinnon-Haug-Michelis (1999) p-values