Understanding the foreign exchange market
41
SVERIGES RIKSBANK ECONOMIC REVIEW 2022 no. 1 38 Understanding the foreign exchange market Amanda Nordström * The author is a Senior Economist in the Riksbank's Monetary Policy Department The foreign exchange market is an essential part of the global financial system and plays an important role in the economy. Over the last four decades, it has undergone large structural changes, from an opaque and slow-moving, clearly two-tiered market to today’s fast-paced, interconnected yet fragmented market. Trading is becoming increasingly electronic and automated, and new participants, tools and strategies have entered the market. These structural changes have had considerable impact on the way foreign exchange is traded, priced and monitored. In this article I survey how the structure of the market has evolved over the last few decades, with a particular focus on the market for Swedish krona (SEK). I also discuss important mechanisms and features of the FX market; price discovery, liquidity and market functioning, and I present a measure of liquidity of the Swedish krona market. 1 Introduction The foreign exchange (FX) market is an essential part of the global financial system and plays an important role in the economy. It is crucial in sustaining efficiency and arbitrage conditions in most other international financial markets, including the bond, stock and derivatives markets. The pricing mechanisms of the FX market affect financial conditions, resource utilisation and inflation, and so a proper understanding of these mechanisms is at the heart of central bank mandates and operations in many countries around the world. For the Riksbank, an inflation targeting central bank in a small open economy, understanding the drivers and fundamentals of the krona exchange rate, and how the FX market structure is evolving, is important to monetary policy and financial stability. Over the last four decades, the FX market has undergone large structural changes. Beginning with the introduction of floating exchange rate regimes in the 1970s, currency trading has gone from an opaque and slow-moving, clearly two-tiered * I would like to express my warmest gratitude towards Benjamin Anderegg, Meredith Beechey Österholm, Henrik Erikson, Jens Iversen and Ulf Söderström for insightful and valuable comments. I am particularly grateful to Tommy von Brömsen for helping construct the liquidity indices and for valuable comments. I also would like to thank CLS for providing data. Any remaining errors or inaccuracies are mine. The opinions expressed in this article are the sole responsibility of the author and should not be interpreted as reflecting the views of Sveriges Riksbank.
-
Upload
khangminh22 -
Category
Documents
-
view
1 -
download
0
Transcript of Understanding the foreign exchange market

SVERIGES RIKSBANK ECONOMIC REVIEW 2022 no. 1
38
Understanding the foreign exchange market Amanda Nordström *
The author is a Senior Economist in the Riksbank's Monetary Policy Department
The foreign exchange market is an essential part of the global financial
system and plays an important role in the economy. Over the last four
decades, it has undergone large structural changes, from an opaque and
slow-moving, clearly two-tiered market to today’s fast-paced,
interconnected yet fragmented market. Trading is becoming increasingly
electronic and automated, and new participants, tools and strategies
have entered the market. These structural changes have had
considerable impact on the way foreign exchange is traded, priced and
monitored. In this article I survey how the structure of the market has
evolved over the last few decades, with a particular focus on the market
for Swedish krona (SEK). I also discuss important mechanisms and
features of the FX market; price discovery, liquidity and market
functioning, and I present a measure of liquidity of the Swedish krona
market.
1 Introduction The foreign exchange (FX) market is an essential part of the global financial system
and plays an important role in the economy. It is crucial in sustaining efficiency and
arbitrage conditions in most other international financial markets, including the bond,
stock and derivatives markets. The pricing mechanisms of the FX market affect
financial conditions, resource utilisation and inflation, and so a proper understanding
of these mechanisms is at the heart of central bank mandates and operations in many
countries around the world. For the Riksbank, an inflation targeting central bank in a
small open economy, understanding the drivers and fundamentals of the krona
exchange rate, and how the FX market structure is evolving, is important to monetary
policy and financial stability.
Over the last four decades, the FX market has undergone large structural changes.
Beginning with the introduction of floating exchange rate regimes in the 1970s,
currency trading has gone from an opaque and slow-moving, clearly two-tiered
* I would like to express my warmest gratitude towards Benjamin Anderegg, Meredith Beechey Österholm, Henrik Erikson, Jens Iversen and Ulf Söderström for insightful and valuable comments. I am particularly grateful to Tommy von Brömsen for helping construct the liquidity indices and for valuable comments. I also would like to thank CLS for providing data. Any remaining errors or inaccuracies are mine. The opinions expressed in this article are the sole responsibility of the author and should not be interpreted as reflecting the views of Sveriges Riksbank.

Understanding the foreign exchange market
39
market to today’s fast-paced and interconnected, yet fragmented, market with a
growing number of participants and trading venues. Both price discovery and
execution of trade, that is, the process by which trades are finalised, are to an
increasing degree taking place electronically and automatically. As a result, new
market participants, trading strategies and tools have emerged, affecting exchange
rate determination and market functioning. In addition, the technological advances
and increased competition between trading venues have resulted in enormous
amounts of data being available to researchers and practitioners, albeit non-uniform
in access and dispersed across multiple platforms.
Above and beyond changes to the structure of the FX market, exchange rate
movements themselves are often difficult to explain, and even harder to predict.
Conventional macroeconomic theory often assumes that exchange rates are
determined as a price that equilibrates the returns to investing in foreign and
domestic assets. In particular, these models rely on the so-called uncovered interest
rate parity (UIP) condition, stating that the expected change in the exchange rate is
determined by the interest rate differential between the two currencies in question.
More specifically, the currency with the higher interest rate is expected to depreciate
by the amount of the interest rate differential.
However, in reality, the empirical evidence of UIP remains elusive. Research offers
many different explanations to this puzzling empirical fact, often related to the
assumptions on which the UIP condition relies (for a survey of related research, see
for example, Engel 2016). First, the UIP is based on the assumption of risk neutrality
and, most often, empirical tests of UIP assume rational expectations among investors.
Second, it assumes symmetric information among participants and that market prices
immediately incorporate all available information. Since all participants have the
same information set, which at any given point in time reflects the latest available
information, only one price exists at any given point in time. Third, it requires a lack of
trading costs or barriers and equal liquidity, maturity and default risk of the assets
traded, see Engel (2014).
Few, if any, of these assumptions of market efficiency hold in the FX market and there
is an extensive literature studying modified models that better capture exchange rate
dynamics (see for example Fama 1984, Lyons 2001, Bacchetta and van Wincoop 2010
and Lustig and Verdelhan 2019). In fact, as this article will show in more detail, FX
market participants are heterogeneous, transparency is limited and information is
asymmetric. As a consequence, there are arbitrage opportunities that market
participants are unable, or unwilling, to exploit because of the features of the FX
market.
The structural changes to the FX market since the 1970s have had considerable
impact on the way FX is traded, priced and monitored. Technological advances have
made markets more efficient, reduced operational risks and lowered trading costs.
Barriers to entering the FX market have been lowered, with new participants, trading
venues and tools active in the market. The FX market of today is complex, fast-paced
and highly fragmented; liquidity is deep but dispersed over a large number of venues
that are to various extent interconnected to each other. Price formation is to an

SVERIGES RIKSBANK ECONOMIC REVIEW 2022 no. 1
40
increasing degree taking place outside of the conventional bank sphere, and as a
consequence, agents or organisations wanting to monitor the market have had to
turn to new venues and tools for information. The use of computers, algorithms and
the ever-increasing speed of the FX market has also given rise to new challenges and
risks. For instance, algorithms may amplify and intensify market movements, causing
disorderly price movements even in the most traded and liquid instruments.
In sum, the lack of empirical support for traditional modelling of exchange rates and
the rapid evolution of the FX market motivates a better understanding of the
structure and functioning of this unique and complex market. Moreover, the FX
market is integral to the international financial network and affects financial
conditions. Therefore, in this article I survey the structure of the FX market: its current
state and how it has evolved over the last few decades, with a particular focus on the
market for Swedish krona (SEK). I also discuss important mechanisms and features of
the FX market; price discovery, liquidity and market functioning, and present a
measure of liquidity of the Swedish krona market.
The rest of this paper is structured as follows: the next two sections explore the
evolution of the FX market structure from the 1970s to today. The fourth section
discusses the implications of these developments for market monitoring, efficiency
and market conditions. In addition, it covers the concept of market liquidity and
presents an index for systematic measuring of liquidity in the SEK. The last section
presents my conclusions.
2 FX market turnover and instruments With a daily average turnover in 2019 of approximately USD 6.6 trillion, the global FX
market is by far the largest and deepest of all financial markets.1 It consists of several
submarkets; the spot market, the FX swap market, the forwards market, the currency
swap market and the options market being the largest five, see BIS (2019).2 Every
third year, the Bank for International Settlements (BIS) publishes statistical
information on turnover in the FX market sorted by region, counterpart and
instrument in the BIS Triennial Survey. It is the most comprehensive source of
information on the size and structure of the global FX market, with data collections
starting in 1986.3 From this survey, we know that the Swedish krona, being one of the
smallest of the ten most traded currencies (G10 currencies), has a daily turnover of
around USD 134 billion. To put these numbers into perspective, daily global FX market
1 Turnover is defined as the gross value of all new deals entered into during a given period, and is measured in terms of the nominal or notional amount of the contracts adjusted for double-counting, see BIS (2019). 2 These five submarkets make up the majority of the total market in terms of turnover, although the list is not exhaustive. In addition, each submarket is divided into many additional markets depending on where and how contracts are traded. 3 The most recent edition, published in December 2019, took place in April 2019 and involved central banks and other authorities in 53 jurisdictions. These actors collected data from close to 1,300 banks and other dealers in their jurisdictions and reported national aggregates to the BIS, which then calculated global aggregates. Turnover data are reported by the sales desks of reporting dealers, regardless of where a trade is booked, and are reported on an unconsolidated basis, that is, including trades between related entities that are part of the same group, see BIS (2019).

Understanding the foreign exchange market
41
turnover is approximately 27 times as large as daily world GDP, and turnover in SEK is
over 90 times larger than the daily Swedish GDP.4
Non-financial customers, which is the client segment most closely linked to real
economic activity, are counterparties in only a fraction of all FX trading. SEK turnover
is, like the FX market in general, dominated by financial flows (see Figure 1 and 2).
Financial institutions are counterparties in nearly 90 per cent of the turnover of all
trades involving SEK.
Figure 1. Daily global turnover by counterpart
USD trillion
Source: BIS Triennial Survey (2019).
4 The average daily global GDP in 2019 was approximately USD 240 billion while the Swedish daily average was around USD 1.45 billion per day. Daily GDP is calculated using the gross domestic product of 2019 in current USD, as reported by the World Bank, for the World and Sweden respectively, divided by the number of days in 2019 (365).
0
1
2
3
4
5
6
7
1989 1992 1995 1998 2001 2004 2007 2010 2013 2016 2019
Total
With reporting dealers
With other financial institutions
With non-financial customers

SVERIGES RIKSBANK ECONOMIC REVIEW 2022 no. 1
42
Figure 2. Daily SEK turnover by counterpart
USD billion
Source: BIS Triennial Survey (2019).
The most direct form of FX trading is the spot market, which covers around 30 per
cent of the total global turnover, thereby making it the second largest of the
submarkets (see Figure 3). Spot transactions involve the exchange of two currencies
at a rate agreed on the date of the contract for value or delivery in two business days
or less. The FX forward market is the third largest, covering around 15 per cent of
reported turnover.5 Forward transactions are defined as contracts between two
parties for the delayed exchange of two currencies in which the buyer agrees to
purchase and the seller agrees to deliver, at an agreed future date at an agreed price,
see BIS (2016).
5 FX forward transactions should not be confused with FX futures, which are exchange-traded, standardised contracts. Forward contracts are traded OTC (over-the-counter) and are privately agreed upon between two parties. Futures contracts are traded on an exchange and have standardised terms. Futures contract prices are settled daily until expiry of the contract. With the exception of the futures for the Mexican peso and the South African rand, FX futures are physically delivered on the four International Money Market dates (the third Wednesday of March, June, September and December). Futures are not reported as part of the foreign exchange market in the BIS Triennial Survey, nor are they considered in this article.
0
20
40
60
80
100
120
140
160
1992 1995 1998 2001 2004 2007 2010 2013 2016 2019
Total
With reporting dealers
With other financial institutions
With non-financial customers

Understanding the foreign exchange market
43
Figure 3. Daily global turnover by instrument
USD trillion
Source: BIS Triennial Survey (2019).
The largest FX submarket in terms of turnover is the FX swap market, which with its
USD 3.2 trillion comprises almost half of the total turnover of the global FX market. An
FX swap is a transaction involving the exchange of two currencies on a specific date at
a rate agreed upon at the time of the start of the contract (the near leg), and a
reverse exchange of the same two currencies at a date further in the future at a rate
agreed at the time of the contract (the far leg), see Baba et al. (2008). The near leg
may be a spot transaction or a forward transaction, while the far leg is a forward
transaction. FX swaps are used to raise foreign currency, both for financial institutions
and their customers, including exporters and importers, as well as institutional
investors who wish to hedge their holdings of foreign assets. Swedish banks are
frequent users of FX swaps, using them to swap foreign currency denominated
financing (typically USD or EUR) into SEK. Swedish pension and investment funds and
corporates are typical counterparts in the swaps, having an interest in obtaining
foreign currency in exchange for SEK to invest abroad, at very little currency risk.
Swedish banks, on the other hand, obtain relatively cheap financing in SEK through
such swap agreements.6 FX swaps comprise more than half of total SEK turnover (see
Figure 4).
6 See for example Sveriges Riksbank (2020) and Bertsch (2022).
0
1
2
3
4
5
6
7
1989 1992 1995 1998 2001 2004 2007 2010 2013 2016 2019
Total
Spot transactions
Outright forwards
Foreign exchange swaps
Currency swaps
FX options

SVERIGES RIKSBANK ECONOMIC REVIEW 2022 no. 1
44
Figure 4. Daily SEK turnover by instrument
USD billion
Source: BIS Triennial Survey (2019).
FX swaps should not be confused with currency swaps, known also as cross-currency
swaps, which are contracts which commit two counterparties to exchange streams of
interest payments in different currencies for an agreed period of time and/or to
exchange principal amounts in different currencies at a pre-agreed exchange rate at
maturity, see Baba et al. (2008). Hence, FX swaps and currency swaps are technically
similar, but differ in that currency swaps also include the exchange of interest
payments and principal amounts. In general, currency swaps also tend to have longer
duration than FX swaps.
Finally, options are contracts that confer on the owner the right to buy or sell one
currency for another currency at a specified exchange rate at a specified point in time.
Currency swaps and options make up only a small part of the market as a whole and
are normally traded separately from spot and forward contracts and for different
purposes, see King et al. (2012).
Historically, most FX trading has been located in London and New York. In 2019, sales
desks in these two locations intermediated around 60 per cent of all FX trading;
43 and 17 per cent, respectively, according to the BIS Triennial Survey. Indeed, trading
has remained highly concentrated to a handful of trading hubs throughout the last
four decades, with the United Kingdom, the United States, Singapore, Hong Kong SAR
and Japan accounting for almost 80 per cent of all trading activity (see Figure 5). The
internal distribution between these has varied over time, but the United Kingdom
share has always been the largest.
0
20
40
60
80
100
120
140
160
1992 1995 1998 2001 2004 2007 2010 2013 2016 2019
Total
Spot
Outright forwards
FX swaps
Currency swaps
Options

Understanding the foreign exchange market
45
Figure 5. Geographic distribution of global FX turnover
Percentage of total, all instruments
Source: BIS Triennial Survey 1986-2019. Author’s own calculations.
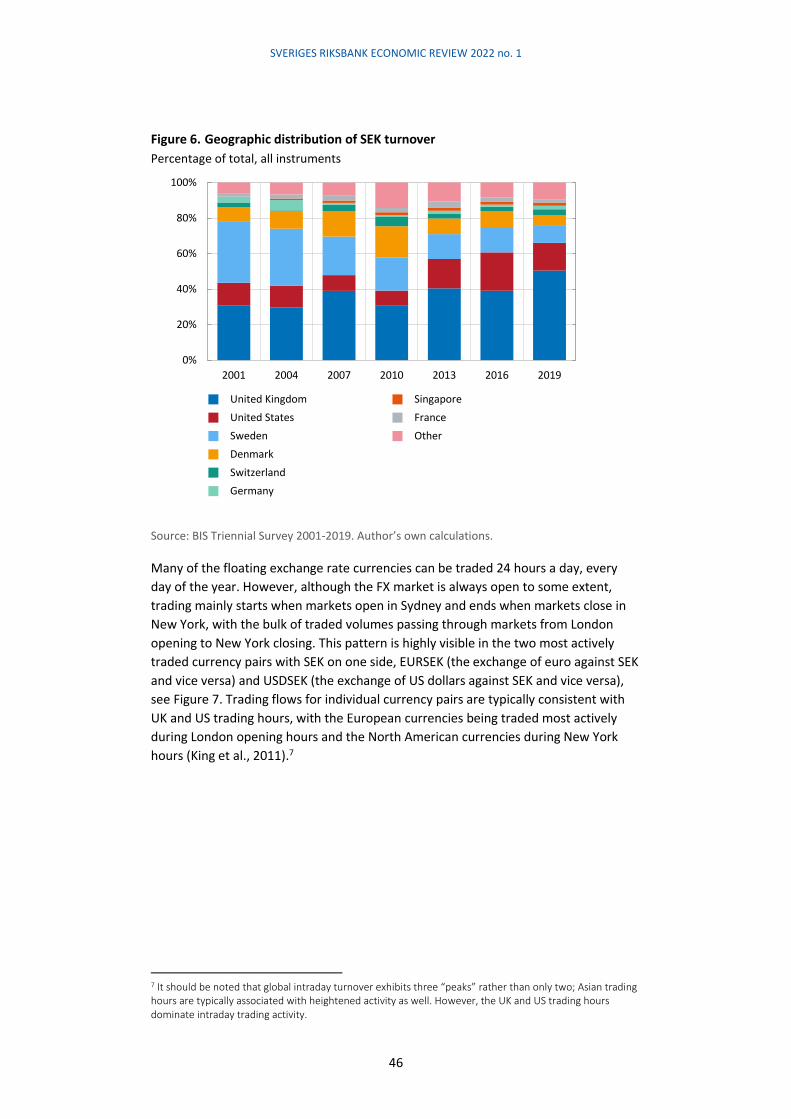
Data on the geographical distribution of SEK turnover have been collected since 2001.
The share of Sweden-based trading has decreased markedly since the beginning of
the survey sample. In 2019, only 10 per cent of the SEK trading flows were
intermediated by sales desks located in Sweden, compared to around 35 per cent in
2001 (see Figure 6). Similar to the situation globally, trading activity in SEK is highly
concentrated to the United Kingdom and the United States. Contrastingly, the three
remaining large trading hubs – Singapore, Hong Kong SAR and Japan – account for
only a small share of all trades; around 4 per cent in total in 2019. Instead, the third
largest geographical trading hub for the SEK is Sweden, followed by Denmark.
However, only approximately 3 per cent of spot trading in SEK takes place in Sweden;
the vast majority of spot SEK trading flows is done in the UK.
0%
20%
40%
60%
80%
100%
1986 1989 1992 1995 1998 2001 2004 2007 2010 2013 2016 2019
United Kingdom
United States
Singapore
Hong Kong
Japan
Switzerland
France
China
Other
SVERIGES RIKSBANK ECONOMIC REVIEW 2022 no. 1
46
Figure 6. Geographic distribution of SEK turnover
Percentage of total, all instruments
Source: BIS Triennial Survey 2001-2019. Author’s own calculations.
Many of the floating exchange rate currencies can be traded 24 hours a day, every
day of the year. However, although the FX market is always open to some extent,
trading mainly starts when markets open in Sydney and ends when markets close in
New York, with the bulk of traded volumes passing through markets from London
opening to New York closing. This pattern is highly visible in the two most actively
traded currency pairs with SEK on one side, EURSEK (the exchange of euro against SEK
and vice versa) and USDSEK (the exchange of US dollars against SEK and vice versa),
see Figure 7. Trading flows for individual currency pairs are typically consistent with
UK and US trading hours, with the European currencies being traded most actively
during London opening hours and the North American currencies during New York
hours (King et al., 2011).7
7 It should be noted that global intraday turnover exhibits three “peaks” rather than only two; Asian trading hours are typically associated with heightened activity as well. However, the UK and US trading hours dominate intraday trading activity.
0%
20%
40%
60%
80%
100%
2001 2004 2007 2010 2013 2016 2019
United Kingdom
United States
Sweden
Denmark
Switzerland
Germany
Singapore
France
Other

Understanding the foreign exchange market
47
Figure 7. Intraday spot trade volume
USD million
Note: Intraday spot trade volumes in EURSEK and USDSEK submitted to the settlement firm CLS on 2019-01-01 to 2019-02-02.8 London local time.
Source: CLS.
Technological advances in FX trading have generally begun within the spot, and to
some extent the forwards markets, and have also been most pronounced within these
segments. The more complex instruments, such as swaps and options, are following
the developments in spot and forwards, albeit with a slower uptake of the new
technologies. Given this, the rest of this article will focus mainly on the spot and
forward markets.
3 Structural developments of the FX market9
3.1 1970s to 1980s
Since the introduction of floating exchange rate regimes in many advanced economies
in the early 1970s, the global FX market has undergone large structural changes. Far
from today’s volumes, the global daily average turnover in 1989, the farthest the BIS
Triennial Survey goes back in time, was approximately USD 540 billion. The SEK, at
that time a managed exchange rate fixed to a basket of currencies, recorded an
average turnover of USD 6 billion per day.
During the 1970s and the 1980s, currencies were almost exclusively traded directly via
telephone, in an over-the-counter (OTC) market. The OTC market structure refers to
8 CLS is the world’s largest FX settlement firm, providing settlement for around USD 460 billion in daily spot volumes globally (November 2021). Their data are adjusted to equate to the same reporting convention used by the Bank for International Settlements (BIS). 9 Sections 3.1–3.2 are largely based on the extensive Handbook on Foreign Exchange, in particular King et al. (2013). More on the evolution of the FX market structure may also be found in Lyons (2001), Sager and Taylor (2006), King et al. (2012), Moore et al. (2016) and Schrimpf and Sushko (2019a,b).
0
100
200
300
400
500
600
700
800
900
1 000
22
:00
23
:00
00
:00
01
:00
02
:00
03
:00
04
:00
05
:00
06
:00
07
:00
08
:00
09
:00
10
:00
11
:00
12
:00
13
:00
14
:00
15
:00
16
:00
17
:00
18
:00
19
:00
20
:00
21
:00
22
:00
23
:00
EURSEK
USDSEK

SVERIGES RIKSBANK ECONOMIC REVIEW 2022 no. 1
48
bilateral transactions not conducted on a formal exchange. A small number of major
dealer banks were the main liquidity providers, financial institutions which
intermediate in the FX market by selling and buying the same currency. 10 In the FX
market, these dealers emerged to solve the search problem among market
participants to match opposing exchange flows. Non-bank financial institutions and
large corporations constituted the major part of the client base, the liquidity
consumers.11 Their motives for currency trading stemmed primarily from the
exchange of currencies due to international trade of goods and services, including
financial services, and hedging of FX exposures owing to foreign-currency assets and
liabilities.
The FX market consisted of a clearly delineated two-tiered system where dealers
constituted the primary market tier, called the interbank or interdealer market, and
dealer-to-client trades took place in the secondary market tier. In the interbank
market, dealer banks managed their currency flows between each other (dealer-to-
dealer trading). Interbank prices are the prices banks quote to each other. Trades in
both tiers took place directly and predominantly via phone, so called “voice trades”.
In the interbank market, dealers could also choose to trade indirectly, using a voice
broker as an intermediary.
Voice brokers are human intermediaries active in the interbank market, matching
dealer trades with each other. They receive quotes and orders via telephone from a
set of dealer banks connected to the brokerage, and then match corresponding
orders into trades without disclosing the identity of parties pre-trade, that is, before
the parties have agreed upon transaction. This type of brokering is referred to as
direct dealing, see Melvin and Wen (2013). Upon receiving an order to, for example,
sell US dollars against the Swedish krona, voice brokers would shout out the current
best bid and ask prices into all open telephone lines connected to dealers. The bid
price in this example is the price at which a dealer is willing to buy US dollars in
exchange for Swedish krona. Vice versa, the ask price (offer) is the price at which a
dealer is willing to sell US dollars in exchange for Swedish krona.
Since currency trading always involves the purchase of one currency and the sale of
another, the concept of a buyer and a seller might be somewhat confusing, especially
when both counterparts are dealers. In this article, and as is conventional in FX
trading, it will depend on who initiates the trade. If dealer A posts a bid price with the
voice broker, she wants to purchase the base currency (she is the price maker). If
dealer B accepts dealer A’s bid price, she sells the base currency to dealer A (she is the
price taker). Market practice is to always express the base currency first in labelling
currency pairs, that is, the units of a given currency to purchase one unit of the base
10 Dealers are financial intermediaries whose primary business is to enter both buy and sell transactions and which seek profit by taking the associated inventory risk, see Committee on the Global Financial System (2001). Liquidity provision is a term used to describe the practice of continually trading in and out of relatively short-term positions. Liquidity providers are essentially market-makers of the FX market: they sell and buy the same currency pairs, acting as intermediaries for other participants by entering and holding currency positions, normally to make a profit on the difference between the purchasing (bid) price and the selling (ask) price. 11 Liquidity consumers are clients of the liquidity providers. They typically buy or sell currencies for reasons such as international trade or hedging by entering one side of a trading agreement.

Understanding the foreign exchange market
49
currency. Most exchange rates are expressed as units of a currency in order to
purchase one US dollar (USD), with the exception of the euro (EUR), the British pound
(GBP), the Australian dollar (AUD) and the New Zealand dollar (NZD).12 For example,
the exchange rate of the Swedish krona (SEK) against the US dollar is conventionally
expressed as USDSEK, meaning SEK per USD. In this example, the US dollar is the base
currency. A buyer of USDSEK purchases USD using SEK as payment; a seller of USDSEK
sells USD and receives SEK as payment.
The FX market of the 1970s and the 1980s was characterised by an opaque price
discovery process (the process through which prices are determined and set) with
large discrepancies between the interbank market prices and the prices set to end
clients. Information about trades were proprietary to the two counterparties and no
market-wide source of information was accessible for end clients. Dealer banks,
however, arguably had an information advantage relative to end clients. In addition to
small, informal networks among banks, they had access to the voice brokers who
would continuously announce the current market prices. Brokers do not enter
positions, and could, at least in theory, not trade upon the information they
received.13 End clients would not see the prices traded interbank, only the final price
quoted by their dealer bank(s). Post-trade, that is, after the trade had been agreed
upon between the counterparties, the parties would exchange physical paperwork to
settle the transaction, making the process cumbersome and prone to human error.
3.2 Late 1980s to 2000s
Computers made their first real entrance into FX trading in 1987, when Thomson
Reuters Dealing was introduced. This computer system, available only to dealers,
offered an alternative to telephone communication, enabling electronic messages to
be sent amongst dealers while enhancing operational efficiency by the creation of
electronic records of trading. Around the same point in time, Thomson Reuters also
released their FXFX product, a proprietary computer site within the Reuters Terminal
where dealers’ indicative quotes for the most commonly traded currencies were
shown in real time.14 Both Reuters Dealing and FXFX quickly became popular and as
such, important information hubs for price discovery and trading, see King et al.
(2013). The FXFX page contributed to greater transparency in the interbank market,
but as indicative quotes are not tradeable per se, the informational content of FXFX
quotes as an indicator of the tradeable current exchange rates was questionable, see
Martens and Kofman (1998).
12 In order: euro, British pound, Australian dollar, New Zealand dollar and US dollar. For example, the exchange rate of euros against US dollars is expressed as EURUSD and the exchange rate of British pounds against Australian dollars is expressed as GBPAUD. 13 Brokers that also act as dealers are called broker-dealers or dealing desk brokers. When a broker-dealer acts as an agent, the trade is on behalf of the client (broker), and when acting as principal, the trade is on its own account (dealer). 14 Indicative prices are prices quoted by dealers that are not necessarily tradable. Dealers submit indicative prices to give clients an indication of the price they are willing to trade at without being committed to trade. For example, if a client requests a quote without specifying the volume, dealers would normally provide an indicative quote. In contrast, tradable quotes are typically attached to a specified volume.

SVERIGES RIKSBANK ECONOMIC REVIEW 2022 no. 1
50
In the early 1990s, FX trading took another crucial step towards electronification
when a new type of broker emerged: the electronic brokering systems, or electronic
brokerages (EB). These electronic systems automatically match orders submitted by
dealers to buy and sell currencies. The two main electronic brokerages were run by
EBS and Thomson Reuters Matching, both of them available only for interbank
trading. These are often referred to as the primary venues, see BIS (2019).15 Similar to
stock market exchanges, electronic brokerages are structured so that the limit orders
(bids to buy and/or offers to sell a given amount of a currency at a given price) with
the highest bid price and the lowest ask price are prioritised and matched first with
incoming market orders (orders to trade a certain amount at the current market
price). Dealers submit limit orders in a centralised limit order book (CLOB). The
brokerage system then automatically matches these offers and bids with incoming
orders from other dealers. Both EBS and Reuters Matching operated anonymous limit
order books, meaning that the identities of counterparties were unknown prior to the
trade. Instead of having to reveal their interest in trading prior to the actual trading,
dealers could now post their quotes anonymously on the CLOB. In addition, the CLOB
offered not only indicative prices but actual tradeable prices, “firm” liquidity and
more reliable information on the price discovery process.
The introduction of electronic brokering made FX trading more efficient; it increased
competition between dealer banks and made interbank risk-sharing more effective,
requiring fewer trades to distribute a given volume within a given set of constraints,
see Evans and Rime (2019). Nevertheless, much of the electronification in the 1980s
and 1990s focused on the interbank market and left the dealer-client relationship
largely intact. While operational efficiency increased and execution costs decreased in
the interbank market, leading to smaller bid-ask spreads in the primary tier, the bid-
ask spreads of the secondary tier remained virtually unchanged until the end of the
1990s. Dealers, who profit from the spreads charged on the liquidity they provide,
could earn substantial revenue from their informational advantage and the large
difference in trading costs between the tiers.
Early examples of electronic solutions for end clients started emerging around the
middle of the 1990s (for example FX Connect and Hotspot FX), but the main shift
towards electronification of the secondary tier of the FX market began first around
1999, when the electronic multi-bank trading platform Currenex was launched. Multi-
bank platforms (MBPs, also known as multi-dealer platforms) are electronic trading
venues which connect a set of clients with its dealers and enables electronic
negotiation and execution in competition. They facilitate electronic price discovery
and execution in a competitive environment as several dealers are connected to the
network at the same time. Currenex, and a number of platforms with similar business
ideas that followed, gave end clients access to several dealer banks simultaneously
15 The term primary venue is often used with specific reference to a certain currency pair. Traditionally, Refinitiv (Reuters) Matching is referred to as the primary venue for the Commonwealth currencies and the Scandinavian currencies, while EBS is the primary venue for the euro, the US dollar, the Japanese yen, the Swiss franc and the Chinese renminbi.

Understanding the foreign exchange market
51
through tools such as request-for-quote (RFQ) and electronic limit order books
directed at end clients rather than dealers alone.16
Many of the pioneers of end-client trading platforms were independent non-bank
firms, often related to the booming tech sector of those years around the turn of the
millenium.17 Spurred by competition for customer business, the number of new,
electronic trading venues virtually exploded. To retain some of the information flows
and the market dominance that characterised their role in the 1980s, several of the
major dealer banks formed a consortium and launched the multi-bank trading
platform FXall in 2001, see King et al. (2013). FXall gave members of the platform
access to several dealers simultaneously through an RFQ solution. At approximately
the same time, dealer banks started introducing their own proprietary electronic
platforms, so called single-bank platforms (SBTs, also single-dealer platforms). Single-
bank platforms typically offer similar solutions as non-bank and multi-bank platforms,
but are owned and run by the dealer bank itself.
Both single- and multi-bank platforms are in different ways and to various extent
interconnected with each other and with other trading venues, and dealers typically
operate on several platforms simultaneously. They may be disclosed or anonymous,
that is, either the counterparty identities are or are not known pre-trade. Trading
venues for dealer-to-client transactions are sometimes referred to as secondary
venues, as opposed to the interbank primary markets. Generally, at least one of the
main brokerages is connected to the trading platforms.18
Another important impetus for the development of the FX market was prime
brokerage. The service emerged in the early 1990s, and is offered by banks that allow
clients to get access to multiple executing dealers while maintaining a credit
relationship and placing collateral and settlement with a single entity, the prime
broker, see Federal Reserve Bank of New York (2010). While electronic brokering
provides access to dealers, practical aspects of trading such as credit agreements and
settlement instructions are needed for each single dealer. Although this is feasible for
large clients, it is often too costly for smaller entities. Instead, with prime brokerage
accounts clients are given the opportunity to access the primary market through top
FX dealers. Clients then trade directly in the bank’s name with its established
counterparties, subject to credit limits. Prior to the introduction of prime brokerage,
dealer banks would charge smaller investors high transaction costs, as their trades
were considered too small to be economically interesting. With trade now grouped
16 When using the RFQ function, clients simultaneously ask several banks to supply them with a price that they are willing to trade on. The dealer banks are required to respond to the request within a few seconds, and the client may then choose which bank to trade with. 17 The term non-banks generally refers to institutions which perform services traditionally associated with banks, but which lack banking licences. 18 To exemplify, Refinitiv (Reuters) FX Matching is the electronic broker (for interbank trading) on the Refinitiv multi-bank platform FXall (for dealer-to-client trading, or “all-to-all” trading), accessed via the desktop platform FX Trading, all connected to the financial analysis tool Eikon. Although primary venues’ market share has decreased since its introduction, EBS (NEX) and Refinitiv FX Matching (Reuters) remain two of the largest brokerages globally, as are their respective platforms, see Euromoney (2019).

SVERIGES RIKSBANK ECONOMIC REVIEW 2022 no. 1
52
together into much larger trade sizes, dealers were willing to trade with prime brokers
at more attractive prices.
The effect of these technological changes was to accelerate the pace and increase the
volume of FX trading that could be intermediated at a given time. Transparency and
trading efficiency increased with access to price streams provided by electronic
brokerages and trading platforms. Client-access solutions helped narrow bid-ask
spreads faced by clients in the second tier vis-à-vis interbank pricing. New types of
intermediaries, particularly the introduction of prime brokerage, gave smaller clients
access to more competitive prices and deeper liquidity. Nonetheless, the
technological revolution of the FX market had only begun; the 2000s would see a
rapid evolution of electronic execution, new participants, the introduction of
algorithmic trading and a fragmented, interconnected and fast-paced electronic FX
market.
3.3 2000s to today
Today’s FX market is complex, consisting of a large number of trading platforms;
market participants wanting to trade FX have more than 75 different venues to
choose from, see Sinclair (2018). This proliferation has been driven by technological
advances as well as competition between both banks and new market participants
seeking to capture, or maintain, a share of the FX market. Electronification in FX first
took off in interbank trading, but it is the dealer-to-customer segment that has seen
the strongest rise in electronification in recent years, see Schrimpf and Sushko
(2019b). The resulting market structure is fragmented yet highly interconnected.
According to the 2019 BIS Triennial FX survey, 56 per cent of all FX trading, and 70 per
cent of all FX spot trading, takes place electronically (BIS, 2019). Or perhaps even
more, as according to a study from 2013, some market reporters suggested that as
much as 95 per cent of all spot transactions could in fact be electronic, as most voice
trades are booked electronically due to the practical benefits from electronic
execution, see Rime and Schrimpf (2013).
Modern market participants rely on technologically advanced and sophisticated
trading solutions. Algorithms became available in FX trading around the early 2000s
and grew rapidly with the availability and improvement of data, becoming a tool for
navigating an increasingly fragmented market, see Markets Committee (2020). In
addition, reporting requirements and regulations have increased the demand for
traceable execution, which in turn has contributed to the growth of electronic and
automated trading (see below for more details on reporting requirements and
regulation). Algorithms are used in many areas of trading, such as the execution of
trades, statistical algorithmic trading and high-frequency trading.19 As executable
liquidity is dispersed over a large number of venues, algorithms have also become a
tool to source liquidity from many different venues simultaneously.
19 In statistical algorithmic trading, algorithms are used to collect and analyse large amounts of data to identify favourable trading opportunities and strategies. This type of trading includes, for example, the employment of algorithms to analyse historical time series data to identify whether a currency is suitable for buying, selling or keeping, and portfolios based on mathematical mean-reversion models.

Understanding the foreign exchange market
53
Execution algorithms use mathematical models and automated trading programs to
create specific sets of trading rules and models and then automatically execute orders
and transactions. For example, traders commonly place limit orders using algorithms.
When a pre-defined limit value is reached, the algorithm is programmed to
automatically execute or cancel. Since their introduction, they have evolved from
simple mechanical forms to highly sophisticated and adaptive types based on machine
learning techniques that respond to real-time changes in market conditions. As of
2020, execution algorithms are estimated to account for around 10–20 per cent of
global FX spot trading, but are less frequently used in other types of FX trading, see
Markets Committee (2020).
Users and usage of algorithms have also evolved during these years, and today,
algorithmic solutions are available to a range of market participants. With the advent
of retail trading platforms, algorithmic trading was also made available for non-bank
participants, see King et al. (2013).20 A Greenwich Associates study from 2021 showed
that nearly 40 per cent of financial FX traders used algorithms in 2020 and that
approximately as many saw their usage increase in 2021, see Greenwich Associates
(2021). Measured since autumn 2018, the Riksbank’s Financial Markets Survey shows
that approximately 90 per cent of the participants active in the market for SEK often
or always use electronic platforms in trading, but only 20 per cent of participants
often or always use algorithms.21
Algorithms are also the key building blocks of high-frequency trading (HFT). HFT refers
to the use of algorithms for the purpose of arbitrage on slower market players by very
high speed and high frequency, also called latency arbitrage. The nature of HFT is
typically speculative and as with algorithmic trading in general, it has its roots in
equity markets where it has been common since the late 1990s. Several of the
pioneering HFT firms are becoming increasingly important to the FX market in their
roles as liquidity providers.
As data quality improves, so do the prospects of using machine learning techniques.22
Algorithms can handle massive amounts of unstructured data; sort, analyse and act
upon it in fractions of the time it would take a human trader. The term artificial
intelligence (AI) is frequently used to describe this human-like intelligence that today
is possible to program into electronic systems, making machines trade like humans
but without human involvement or intervention. Several major international dealer
banks have launched adaptive algorithms; algorithms that self-adapt to the ongoing
market conditions, see Greenwich Associates (2021). Still, AI and machine learning
20 Retail trading platforms are trading solutions, typically software programs, available for retail clients. One example is MetaTrader4, launched in 2005. 21 See Sveriges Riksbank (2021). 22 Machine learning is a technique in which a computer processes data and essentially writes its own program based on the statistical relationships it discovers, see Ford (2015). The technique is used in many everyday functions, such as the recommendations of what to watch on streaming platforms or spam filters in emailing software. In finance, one example of machine learning techniques is that used for scraping data, in which a computer program extracts data from human-readable output coming from another program. Noting the entrance of AI and machine learning as separate from algorithms may be slightly precarious. Algorithms have undergone a series of evolutions since their first emergence, with AI and machine learning techniques developing alongside rather than at separate stages in history.

SVERIGES RIKSBANK ECONOMIC REVIEW 2022 no. 1
54
techniques have only recently started to play an important role in transforming
electronic FX trading (see for example Refinitiv 2019 and Golden 2021). Despite the
rapid evolution of technology, this type of trading is highly resource demanding, both
in terms of human skill and computer power.
As trading has become increasingly electronic and automated, it has also gained
markedly in speed. The BIS describes the FX market as a fast-paced electronic market,
a market where the price development predominantly occurs via electronic means,
and which is characterized by a sizeable penetration of high-speed, algorithmic-driven
order placements. Along with an increase in the use of electronic brokerages, the
introduction of data aggregators and live price feeds has resulted in an increase in the
updating frequency of data feeds.23 As an example, the EBS platform increased its
pricing update frequency from every 100 milliseconds to every 20 milliseconds in
2016, and further to every 5 milliseconds for selected platform participants in 2017,
see Markets Committee (2018).
3.3.1 Market participants
The new, digital infrastructure of the FX market has led to the emergence of new
players, functions and possibilities. Nearly half of all reported turnover in spot trading
went through prime brokerage accounts in 2019, according to the BIS Triennial
Survey, see BIS (2019). For the currencies of small open economies, 56 per cent of all
spot turnover of the SEK was prime brokered, which is similar to the Australian,
Canadian and New Zealand dollars as well as the Norwegian krone. Higher turnover
currencies, such as the British pound, the US dollar, the Japanese yen and the Swiss
franc, have a smaller share of transactions conducted through prime brokerage
accounts.
Driven by the proliferation of prime brokerage, smaller banks, hedge funds and other
players have entered the market to much greater extent than previously. Today, some
of the top providers of spot liquidity are non-banks, see Euromoney (2019). The
market is no longer centered solely on the dealers; the share of global FX market
turnover accounted for by interdealer trading in the BIS Triennial Surveys has declined
considerably since the 1990s, from 67 per cent of the total global FX turnover in 1992
to below 40 per cent in 2019, see BIS (2019). They make up even less of the turnover
in SEK, their share falling from 48 per cent in 1992 to just above 30 per cent in 2019.
In the SEK spot market, only 22 per cent of the turnover have reporting dealers as
counterpart (see Figure 8). Interestingly, this is similar to the NOK spot market, but
markedly lower than that of the other G10 currencies. Instead, financial institutions
other than the dealer banks now represent one side of 60 per cent of all turnover in
SEK and over 70 per cent of all SEK spot turnover.
23 A data aggregator is a technological service where prices are streamed from several liquidity providers and/or platforms simultaneously.

Understanding the foreign exchange market
55
Figure 8. Turnover by counterpart, SEK spot market
Per cent
Source: BIS Triennial Survey (2019).
An increasingly important new group of participants in the FX market are the principal
trading firms (PTFs, also known as proprietary trading firms). PTFs are firms that
invest, hedge or speculate for their own account, not on behalf of clients. They are
sophisticated non-banks which provide and consume liquidity primarily through high-
frequency and algorithmic trading and typically trade with high speed and frequency
to turn over large volumes. This heterogeneous group of players, which includes HFT
firms, gains access to the FX market via prime brokers and accounts for roughly a third
of total turnover in electronic FX spot markets see BIS (2019). Their share of turnover
in the spot market for SEK is lower; around 18 per cent.
In recent decades, several non-bank PTFs have transformed into market-making
liquidity providers that have taken over parts of the FX market that were previously
exclusive to dealer banks. This subset of PTFs is sometimes referred to as non-bank
electronic liquidity providers, or non-bank electronic market-makers. While banks rely
on large balance sheets and client relationships that can generate volumes of flows
that may be matched with one another, the non-bank PTFs instead use their speed
and technological advantage to intermediate in the markets.
Another reason for dealers’ declining share of turnover is that major dealing banks
net more trades internally. Typically, dealers would quickly, or even immediately, try
to match the opposite side of a client’s trade within the interbank market. This is
sometimes referred to as “hot-potato trading” or externalisation, see Butz and
Oomen (2019).24 On the opposite, internalisation refers to the process of warehousing
one client’s transaction flow until it is offset against an opposing client’s flow. Through
internalisation, dealers are able to match more client trades directly on their own
books, which reduces the need to offload and hedge risk via the traditional interbank
24 Dealers engage in hot-potato trading when offloading their exposure to open positions onto the interbank market (King et al. 2012).
0%
10%
20%
30%
40%
50%
60%
70%
80%
1992 1995 1998 2001 2004 2007 2010 2013 2016 2019
with reporting dealers
with other financial institutions
with non-financial customers

SVERIGES RIKSBANK ECONOMIC REVIEW 2022 no. 1
56
market, see Schrimpf and Sushko (2019a). With more trades managed internally, hot-
potato trading, and thereby also interbank trading, becomes less necessary.
Internalisation ratios are highest within the spot market and have increased along
with electronic execution (see Moore et al. 2016 and Schrimpf and Sushko 2019b).
Similarly, the use of algorithms has been shown to reinforce the growing trend
towards internalisation among dealer banks, see Markets Committee (2020).
Internalisation has also coincided with an increase in market concentration: the
average number of banks covering 75 per cent of total FX turnover has about halved
since first measured in 1989, to a count of 7 in 2019, see Schrimpf and Sushko
(2019b).25 Arguably, internalisation and high market concentration are mutually
reinforcing. Dealer banks with large and diverse trading flows can internalise trades
more efficiently, allowing them to offer competitive prices and attract even more
client flows. Butz and Oomen (2018) show that internalisation is both quicker and less
risky among large dealers, who benefit from their size and the possibility of reducing
costs doing so. This is in line with the finding that internalisation ratios tend to be
higher for large trading centres, as this is typically where the largest dealer banks are
located, see Schrimpf and Sushko (2019b).
In addition, the Global Financial Crisis of 2007-2009 brought on a rapid decline in
dealer banks’ proprietary trading (trading for direct market gain, contrary to earning
commission on client trades). Increased regulatory scrutiny and greater risk-aversion
were important drivers of this development, see King et al. (2011). Banks’ balance
sheets have become more constrained and costly to deploy in the aftermath of the
crisis, which has resulted in a notable reduction in risk appetite and principal risk
warehousing, see Debelle (2018).26
Nonetheless, the major international banks still constitute an important part of the
market as liquidity providers, but are now accompanied by other types of financial
institutions that intermediate in the market. This development has dissolved the
clearly delineated market structure of the 1980s, and there are no longer two well-
defined market tiers with just as well-defined roles of its participants. The distinction
between liquidity provider and liquidity consumer is also becoming less clear, both
because trading can occur without intermediation and because new types of
participants have entered the market.27
The BIS Triennial Surveys also illustrate how consumers of liquidity have evolved
during the last few decades. Today, FX trading volumes mostly reflect financial
motives, as opposed to needs arising directly from real economic activity. As noted
earlier, FX trading volumes continue to be dominated mostly by financial institutions,
with the share of non-dealer financial institutions growing from below 12 per cent in
1992 to nearly 55 per cent of all trading in 2019. Non-dealer financial institutions
25 Although interdealer trading, that is, trading with dealer banks as both counterparts, has declined, banks remain one of the counterparts in most FX trading. 26 Providing algorithms has thus become a tool for banks to transfer the risk bearing onto the end client, as algorithms rely less on liquidity providers’ capacity to absorb risk (BIS 2020). 27 Clients wishing to trade FX no longer require a dealer to do so. Today, while clients may access liquidity with various degrees of intermediation: from client-to-client in disclosed or anonymous liquidity pools all the way to the more traditional alternative of using a dealer and a broker.

Understanding the foreign exchange market
57
include market participants such as smaller banks, pension and investment funds,
hedge funds and PTFs.
3.3.2 Reporting requirements and regulation
Despite its size and importance, the FX market is subject to relatively little regulation
and reporting requirements. There is no central regulatory body, instead, local
jurisdictions are set up across the globe. Two influential legislations are the Dodd-
Frank Wall Street Reform and Consumer Protection Act (Dodd-Frank Act) in the US
and the MiFID II legislation in the EU.28 Neither of these applies to the FX spot
market.29
The Dodd-Frank Act was written in the aftermath of the 2008-2009 financial crisis to
reduce risk, increase transparency and provide accountability for market participants.
Enacted in July 2010, it is a widely encompassing federal law that applies to US-based
financial companies. The Dodd-Frank Act applies to all FX derivatives, although some
instruments are mainly subject to reporting requirement. All FX derivatives except FX
swaps and outright forwards, are subject to certain mandatory derivatives
requirements, including central clearing and exchange trading.
The MiFID II regulation, adopted in January 2018, applies to all financial participants
across the EU, including fund managers, banks, exchange trading venues, pension
funds and retail investors. MiFID II aims to make markets safer, fairer and more
efficient. For instance, the MiFID II legislation requires reporting and record-keeping
on transactions of all financial instruments in the EU. It does not apply to the spot
market, which is not considered to be a financial instrument according to the
European Securities and Markets Authority (ESMA), but to all of the other major FX
instruments including forwards and swaps. Firms need to take “all sufficient steps” to
obtain the best possible results for their clients when executing orders, referred to as
best execution. The adaptation of the MiFID II regulation has led to firms taking a
more systematic approach to monitoring their trades, increasing the demand for so-
called transaction cost analysis (TCA). While it is not legally mandatory for the spot FX
market, demand for such analysis has increased there, too.
Instead of formal legislation, the FX market has largely been governed by informal
rules and codes of conduct, often regional. Following a number of high profile FX
misconduct cases in 2013 and 2014, the BIS Markets Committee was commissioned to
develop a single, global code of conduct for the wholesale FX market to restore trust
and confidence in the market. The Global Code of Conduct was developed through a
partnership of central banks and private sector market participants under the
auspices of the BIS Markets Committee, and the first complete version was launched
in 2017. The code is maintained by the Global FX Committee (GFXC), established in
2017. The GFXC is a forum of central banks and private sector participants that aim to
promote a robust, liquid, open and appropriately transparent FX market. The code
does not impose any legal or regulatory obligations on market participants, rather it is
28 The UK implemented the UK MiFID II in December 2020, which essentially mirrors the EU MiFID II framework.

SVERIGES RIKSBANK ECONOMIC REVIEW 2022 no. 1
58
intended to serve as a supplement to any and all local law, rules and regulations by
identifying global good practises and processes. Sveriges Riksbank is a member of the
GFXC and its local Scandinavian committee, the Scandinavian FX Committee (SFXC),
and signed the Terms of Commitment in 2017.
4 A fragmented, fast-paced and electronic FX market With electronification, barriers to entering the FX market have been lowered and
transparency has increased. New players have entered the market, both as providers
and consumers of liquidity. Technological advances have made comparable and
tradeable prices easily available and updated with high frequency, reduced
operational risks and lowered trading costs. Sophisticated tools of trading have
become available to an increasingly large and heterogeneous group of FX traders. But
as always, development brings new challenges. The FX market is complex, fast-paced
and highly fragmented, which has implications for market monitoring and analysis,
market efficiency and market conditions.
4.1 Information flows and market monitoring
As a consequence of trading taking place simultaneously on a bilateral basis and at
many different trading venues, there is no unique market exchange rate at any given
point in time. Rather, the same currency can simultaneously be traded at different
exchange rates at different trading venues. The lack of common reference points
makes it costly and difficult to obtain a representative overview of the market as a
whole, and complicates comparison between venues and providers. The electronic
information systems of the primary market venues, EBS and Refinitiv (previously
Reuters), are often used by practitioners and researchers as representative references
for volume and price data.30 However, while they remain important sources of
information, their market share has dwindled in recent years, and many alternative
trading venues and liquidity pools have emerged and taken over market shares, see
Schrimpf and Sushko (2019a).31
Moreover, the electronification of FX trading results in enormous amounts of data
and information being produced and collected. A widespread commoditisation of
such data has led to an increased availability via different technological solutions, but
this typically entails high costs, advanced quantitative analysis skills and large storage
requirements. For those with access, it allows for analysis of order flows, positioning,
technical levels, liquidity conditions and trading patterns – information previously
exclusive to the interbank dealers. However, the fragmentation of the market causes
this information to be dispersed over a large number of trading venues. In this sense,
somewhat paradoxically, electronification has increased the amount of information
available but made market monitoring and surveillance more difficult. The structure
of the FX market, combined with minimal regulation and reporting requirements,
30 The FX trading unit of Thomson Reuters was renamed Refinitiv in 2018. 31 Liquidity pools are centralised trading volumes created by orders executed on an exchange or other trading venue.

Understanding the foreign exchange market
59
results in there being no consolidated record of the turnover at any given point in
time.
Many central banks, including Sveriges Riksbank, track turnover in their respective FX
markets, but relatively few central banks publish this information regularly. In
addition, the international nature of the FX market ultimately complicates
compilation and consolidation of statistical data. For instance, the data collected by
Sveriges Riksbank are reported by the major Swedish banks. Trading of SEK between
other market participants, including reporting dealers domiciled abroad, will not be
registered in the Riksbank’s statistics. This means that trading between non-Swedish
dealers and non-bank participants is not captured by the Riksbank statistics, although
provided that at least one of two counterparts in a trade report to any of the other
central banks participating in the BIS survey, such trading will be captured by the BIS
statistics.
Furthermore, the structural changes to the FX market during the last four decades
have had an impact on the price discovery process. Fundamentally, the idea is that
trading is an integral part of the price discovery process through which information
relevant to exchange rate determination becomes embedded in the market price.
Information flows, a concept frequently explored in the research fields of market
microstructure and order flow analysis, are at the core of the price discovery process
(see for example Bacchetta and van Wincoop 2006, Breedon and Vitale 2010).
Essentially, informed agents have information about the currency’s fundamental
value, and this information becomes embedded in the price when the trade is
executed.
Early research on information flows focused on consumers of FX liquidity as the most
informed, as they would have information on trading flows of foreign and domestic
assets, but several empirical studies contradict this (see for example Bjønnes et al.
2005, Evans and Lyons 2006, Nolte and Nolte 2014, Osler and Vandrovych 2009, King
et al. 2010, Bjønnes et al. 2014). More recent research instead points to FX market
dealers as the most informed participants (see for example Evans and Lyon 2002,
Moore and Payne 2011, Chaboud et al. 2020). Information appears to become
embedded in the market price through at least three steps. First, end clients reveal
their information to dealers by trading. Second, the information becomes embedded
in interbank prices, and third, information is dispersed into the general market as
dealer-to-client quotes are adjusted to reflect interbank prices, see King et al. (2011).
Dealers’ information advantage as central counterparts with large electronic networks
of client relationships, their analytical muscles and their ability to quickly act upon
new information suggest that dealers are the most well-informed FX market
participants. In line with this, market monitors have generally turned to the banks and
to the primary electronic venues for information on exchange rate developments. At
the same time, even though some of the major dealer-banks have managed to retain
some of their information advantage via their own trading platforms, several of the
largest trading venues of today belong to non-banks. Trading on primary venues has
fallen markedly. As a result, part of these information flows has migrated from the
interbank market to external networks.

SVERIGES RIKSBANK ECONOMIC REVIEW 2022 no. 1
60
These structural changes have had implications not only for the monitoring and
surveillance of FX trading, but potentially also for the price discovery process itself. As
long as central banks and other monitoring agents rely on banks and primary venues
as their main source of information, they might overlook information important to
exchange rate determination, because banks might not be informed, or because the
price discovery process is increasingly taking place outside of the banks’ sphere.
Central banks have therefore had to diversify their FX monitoring from the usual
electronic brokerage screens and voice contact with dealers to monitoring more
electronic platforms and obtaining information about market conditions from a
broader range of market actors (for a detailed report on how monitoring of the FX
market has evolved over time, see Markets Committee 2018).
4.2 Technological advance, market conditions and market efficiency
The use of ever-more advanced financial technology is steadily increasing in a pursuit
of more efficient and faster trading. Technological advances and an increase in both
the number and variety of participants active in the market have forced the
traditional players of the FX market to charge more competitive prices in order to
maintain their market shares. To exemplify, the spread between bid and ask prices
has in general narrowed as the market has become increasingly electronic, see Rime
and Schrimpf (2013). Ding and Hiltrop (2010) demonstrated that the introduction of
electronic trading systems narrowed both the immediate and long-term bid-ask
spreads. This finding is in line with early studies on the topic, such as Pagano and Roell
(1996) and Flood et al. (1999), who suggested that electronic systems should lead to
narrower spreads due to lower operation costs, inventory risk and the costs of
attaining information. With comparable and tradeable prices easily accessible and
updated with high frequency the price discovery process has become less opaque,
especially to end clients and even non-active participants. In a more recent study,
Geromichalos and Jung (2018) suggested that the introduction of dealer-to-client
platforms led to lower spreads by lowering the bargaining power of dealers.
However, quite interestingly, Ding and Hiltrop (2010) also showed that large dealers
tended to quote relatively wider spreads on multibank platforms. This, they argued,
was indicating that these dealers were compensating for the loss of the information
advantage they used to possess in the more opaque market prior to the introduction
of electronic trading venues. On the other hand, their research focused on the
primary venues, Reuters and EBS, while data indicate that dealers are shifting away
from these, see Schrimpf and Sushko (2019a). Instead, dealers are turning to single-
bank platforms and direct price streams, a development that is driven principally by
the growing trend of internalising trades. The largest dealer banks are reporting
internalisation ratios as high as 90 per cent, see Moore et al. (2016).
While internalisation may be beneficial for both dealers and end clients, it is also
associated with lower visibility (known as hidden liquidity). On the positive side,
internalisation may benefit dealers by reducing intermediation costs, while end clients
may benefit from a reduction in information leakage and consequently market impact
(see for example Butz and Oomen 2019 and Markets Committee 2020). On the
negative side, internalisation shifts trading volumes from more transparent venues (so
Understanding the foreign exchange market
61
called lit venues) to more opaque internal liquidity pools. Hence, for the same reason
that electronic brokerages have had a positive impact on the transparency of price
formation, internalisation has the potential of obscuring it.
The growing use of algorithmic execution has been shown to improve overall market
functioning by increasing the efficiency of the matching process between liquidity
providers and liquidity consumers (see for example Rime and Schrimpf 2013 and
Chaboud et al. 2020). Assessing liquidity in a fragmented market is challenging, but
with more counterparties connected to each other, search costs have decreased and
the velocity of trading has increased, see Rime and Schrimpf (2013).32 Moreover,
studies indicate that algorithmic trading has had a positive impact on price
informativeness in the FX market (see for example Biais et al. 2015, Roşu 2019 and
Chaboud et al. 2014).33 Simply put, computers are better at finding and exploiting
arbitrage opportunities. The increasing use of algorithmic trading has therefore led to
a more efficient market by speeding up the price discovery process, thereby
improving informational efficiency. Chaboud et al. (2020) find that the price discovery
process has become faster during the last decade, consistent with improvements in
market efficiency during the same period, potentially a result of the increase in
algorithmic trading participation.
Nevertheless, algorithms, machines and the ever-increasing speed of the FX market
give rise to new challenges and risks. For instance, algorithms may amplify and
intensify market movements, causing disorderly price movements even in the most
traded and liquid instruments.
Flash events are perhaps the most dramatic examples of this, with the flash rally of
the Japanese yen in January 2019 being one of the most recent.34 Flash events are
unforeseen, abrupt and volatile movements in prices within a very short period of
time (typically seconds). Flash events to date have generally proved short-lived and
without immediate consequences for financial stability. But even though they may
happen rarely, they are important tests of the market’s resilience to stress. If
reoccurring and with lasting impact on financial market pricing, such events have the
32 King et al. (2012) suggest that trading, and in extension exchange rates, should be modelled as a search problem. Constraints and costs that are related to this search are in turn affected by the structure of the market. 33 The term price informativeness is used to describe the ability of the price of an asset to convey all information that is available to all traders at any given time. 34 On January 3rd 2019, the Japanese yen appreciated sharply during the early Asian trading hours, most notably against the Turkish lira and the Australian and US dollars. Liquidity is generally scarce during these hours, which was further exacerbated by a public holiday in Japan. Previous to the event, Japanese retail investors had been building up currency positions in high-interest yielding currencies, speculating that the Japanese yen would not strengthen above a certain level. After news reports of Apple’s profit warning on January 2nd, the yen started appreciating sharply – but orderly – triggering so called loss-cuts. Loss-cuts are part of a regulation put on all FX firms in Japan that will be executed if a client’s margin deposits falls below a required amount and the client does not deposit the required amount by the deadline (issued in a so-called margin call). In this particular case, the appreciation of the yen caused large-enough losses to the retail investors’ positions, which were then automatically closed, causing the yen to appreciate even more as the high-yielding currency was sold off and yen bought back. Consequently, more positions had to be closed. In just 5 seconds, the yen appreciated approximately 4 per cent against the US dollar (and approximately 9 and 7 per cent against the Turkish lira and the Australian dollar), before retracing over half of the move within a few seconds. For more details, see Reserve Bank of Australia (2019).

SVERIGES RIKSBANK ECONOMIC REVIEW 2022 no. 1
62
potential to undermine confidence in financial markets and hence impact the real
economy. When currencies swing very sharply, a certain depth of liquidity is needed
to absorb those moves and allow firms to unwind positions. Hence, it is important to
continue to develop a deeper understanding of modern market structure and its
associated vulnerabilities, see Markets Committee (2017). Nonetheless, initial
observations from the COVID-19 pandemic suggest that the risk of algorithmic
execution giving rise to self-reinforcing loops, exacerbating sharp movement in prices,
may not be as acute as previously believed, see Markets Committee (2020).
The fragmentation and speed of the market also implicate a risk of liquidity mirage: a
phenomenon that arises due to the combination of highly fragmented and
interconnected market venues and liquidity providers. Typically, several trading
venues show the same liquidity providers’ interest to trade simultaneously, which in
aggregation creates an illusion of deep market liquidity. Combined with high speed,
there is a risk that the liquidity suddenly vanishes when an order is executed at the
quoted price, as the transacted amount is then withdrawn from several platforms at
once. In this new electronic context, the market dynamics of a multitude of liquidity
venues need to be taken into consideration.
In addition, trend-driven trading, also known as momentum trading, may exacerbate
otherwise small movements. These strategies are typically built on algorithmic
programs that identify trends in exchange rates and trade in that direction. Anecdotal
evidence from market participants indicate that in periods of low liquidity and in
absence of human traders, these trend-driven trades gain momentum as they move
markets in their traded direction (see for example Engel 2014).
4.3 Liquidity in the FX market
In general, market liquidity makes transactions smoother and more cost-effective,
rendering liquid assets more attractive to investors. Liquid markets improve allocation
and information efficiency, allowing for more efficient risk-sharing and thereby
permitting financial institutions to accept larger asset-liability mismatches. As such,
market liquidity is essential for a well-functioning market, and a sudden
disappearance of liquidity from markets may develop into a systemic crisis. For
instance, a decline in FX liquidity affects funding costs, impairs hedging strategies and
increases rollover risks due to the common practice of using the FX swap market for
short-term funding, see Mancini et al. (2013).35
Liquidity is a prerequisite for an efficient market that eliminates opportunities for
arbitrage, see Shleifer and Vishny (1997). As a result, varying liquidity conditions likely
disrupt FX market efficiency and alter exchange rate dynamics. The nature and
development of the FX market, which has resulted in limited transparency, a high
degree of fragmentation and heterogeneity of agents, have important implications for
35 Brunnermeier and Pedersen (2009) distinguish between an asset’s market liquidity (that is, the ease with which it is traded) and traders’ funding liquidity (that is, the ease with which they can obtain funding). This article focuses mainly on what Brunnermeier and Pedersen term market liquidity; costs of trade execution and the ability to trade large volumes without sizeable market impact. Nonetheless, these concepts of liquidity are profoundly linked. Under certain conditions, the two are mutually reinforcing and may lead to liquidity spirals.

Understanding the foreign exchange market
63
both price and liquidity patterns. Several studies suggest that foreign exchange rates
contain liquidity premia and that there are noticeable differences in the level of
systematic liquidity across currency pairs and time (see for example Engel 1992,
Christiansen at al. 2011 and Banti et al. 2012). Furthermore, liquid markets also
generally contribute to a more stable and efficient monetary transmission process
through the financial system, see Sarr and Lybek (2002). Understanding FX market
liquidity and market conditions therefore is important, not only from a financial
stability perspective but also for the transmission of monetary policy. Even so, there is
no consensus on why and how liquidity in the FX market materialises, not even on
what constitutes liquidity, see Karnaukh et al. (2015).
4.3.1 Measuring FX market liquidity
Both theoretically and in practice, market liquidity is a multifaceted concept. A widely
recognised definition of market liquidity is the ability to rapidly trade large volumes of
a financial instrument at low or no transaction cost without the transaction noticeably
and adversely affecting the market price of the instrument, see IMF (2015). In the FX
market, this translates into the ability to rapidly trade large volumes of a currency
against another at low cost without having a large impact on the effective exchange
rate. Kyle (1985) summarised the characteristics of liquid markets as tight, deep and
resilient.
There is no universally accepted unequivocal measure of FX market liquidity that
captures all of these dimensions, and it is not obvious that each of these
characteristics of liquidity remain the same over time. For example, volume-based
measures such as the turnover rate may be used as a proxy for market liquidity as
more active markets also tend to be more liquid. But while the FX market generally is
perceived to be extremely liquid given its massive daily turnover volumes, an increase
in turnover may not always be associated with increasing liquidity conditions. As
documented in Melvin and Taylor (2009), FX trading activity rose sharply during the
financial crisis, which they attribute to the so called “hot-potato trading” rather than
an actual increase in liquidity.
Certainly, the turmoil during the onset of the COVID-19 pandemic in spring 2020 was
also characterised by large increases in volumes and quite poor liquidity (see for
instance Dobrev and Meldrum 2020 and CLS 2020). For example, the NOK, which was
heavily affected by the turbulence in financial markets, experienced large but one-
sided flows (selling of NOK against foreign currencies) and severely deteriorating
liquidity conditions in March 2020, see Alstadheim et al. (2021). Naturally, a volume-
based measure such as turnover would provide a false reflection of the actual liquidity
situation.
Furthermore, the FX market lack both a consolidated measure of turnover (at least
one that is updated more frequently than that of the BIS Triennial Survey) and a
proper denominator; there is no measureable stock of foreign exchange or
outstanding number of instruments to be turned over.36 Instead, bid-ask spreads may
36 However, Sarr and Lybek (2002) suggest that the sum of exports, imports and capital transactions or the level of central bank reserves, potentially including short-term net foreign assets of the banking system,

SVERIGES RIKSBANK ECONOMIC REVIEW 2022 no. 1
64
be better suited as a proxy for market liquidity. Indeed, most liquidity measures for
the FX market focuses on bid-ask spreads and exchange rate volatility, see Sarr and
Lybek (2002).
Bid-ask spreads provide a simple and easily available measure of liquidity. However,
although many of the trading venues provide tradable bid-ask prices, trades are not
always executed at the posted bid and ask quotes – some trading is hidden, some is
bilateral and once again, dispersed over venues and alternative trading methods, see
Mancini (2013).
Electronic brokerages generally also have live and recorded data of order books at any
given point of time, which may be used to calculate the order book depth; a metric
based on the quantity available at any given price level. A thin order book may result
in quickly changing prices, while deep order books means more liquidity is available at
prices at or close to the top prices in the book. This metric may be useful as a real-
time indicator of liquidity conditions or for event studies or short-run analysis of
liquidity conditions. For example, microdata from brokerages on order depth were
used to analyse the British pound (sterling) flash event in 2016 (see for example Noss
et al. 2017 and BIS 2017).
Another measure of liquidity is price impact on execution, also called slippage. It is
defined as the difference between the expected market price when requesting to
trade and the actual price that the trade is executed at. The higher the price impact,
the more the exchange rate moves following a trade, reflecting lower liquidity. While
relatively simple to calculate for any specific transaction post-trade, this metric
requires vast amounts of data on millisecond frequency, including the identified
direction of single transactions, to use as a systematic measure of liquidity conditions.
Finally, to capture the cost aspect of liquidity, another frequently used measure is the
effective cost of transactions. Similar to slippage, measuring the effective costs is an
attempt to capture the actual trading cost and compare it with the price quoted at
the point of execution. As such, the measure can be used as a benchmark measure of
(the inverse of) liquidity. Examples are found in Mancini et al. (2013) as well as
Karnaukh et al. (2015).
4.3.2 A liquidity index for the Swedish krona
Liquidity is thus a complex and multifaceted concept and no single measure is able to
capture all aspects of liquidity. Several measures require vast amounts of detailed and
precise high-frequency data, which restricts the analysis to a few of the major
currencies and a limited time period historically. In addition, such data are typically
expensive and the data handling and filtering techniques necessary are time
consuming and cumbersome. Moreover, while the research on FX market liquidity is
indeed evolving, it tends to focus heavily on the major currencies: the euro, the US
dollar, the British pound and to lesser extent the Japanese yen and the Swiss franc.
could be used as potential proxies for the outstanding value of FX. As for turnover, transaction data from any of the larger trading venues or settlement institutions could be used as a proxy.

Understanding the foreign exchange market
65
In an attempt to capture systematic liquidity specifically in terms of the SEK, I
construct a Krona liquidity index. The index is based on Karnaukh et al. (2015), who
offer a method to accurately measure systematic market liquidity using daily and
readily available data. Evaluating several low-frequency measures against a high-
frequency benchmark capturing the effective cost of transactions, they demonstrate
that a low-frequency index based on bid-ask spreads and the Corwin-Schultz (2012)
method accurately captures how liquidity changes over time.37 The Corwin-Schultz
estimates combine high and low values over one day with high and low values over
two days, assuming that daily high prices are buyer-initiated trades and daily low
prices are seller-initiated trades. The ratio of high-to-low prices for a day therefore
reflects both the fundamental volatility of the currency pair and its bid-ask spread.
The Krona liquidity index is based on daily prices of bilateral exchange rates of
21 currencies quoted against the SEK.38 Data are retrieved from Bloomberg, spanning
2001-2021.39 Bid-ask spreads are relative, computed by averaging the daily bid-ask
estimates over time. Corwin-Schultz estimates are calculated using daily high bid
prices and daily low ask prices adjusted for overnight returns, see the appendix for
more details. The index is constructed by first calculating monthly averages of the
relative bid-ask spreads across all daily bid-ask estimates for each individual currency
pair. Second, monthly averages across all positive two-day Corwin-Schulz estimates
are computed, also for each individual currency pair. Third, all series are standardised
by subtracting the mean and dividing it by the standard deviation. Fourth, the two
measures are combined by taking a simple average across them for each individual
currency pair. The last step is to form an average across all currency pairs. A global
liquidity index based on the same 30 currency pairs as Karnaukh et al. (2015) is
computed for comparison (see Figure 9).40
37 Karnaukh et al. (2015) use precise intraday data to calculate a high-frequency benchmark measure for evaluating the accuracy of their low-frequency measure. The high-frequency measure is constructed from tradable best bid and ask quotes, transaction prices and volume indicators where the direction of trades is known. Using these, they compute the midpoint of best bid and ask quotes and log return based on the transaction price of deals, which capture the effective cost measure described in section 4.3.1. They conclude that a low-frequency measure based on bid-ask spreads and the Corwin-Schultz model (2012) offer the highest correlation with the high-frequency measure. Their results are robust to several high-frequency measures. 38 The currencies used are those that are part of KIX (“Kronindex”). KIX is a currency index for the Swedish krona based on currencies from the OECD countries, China, India, Brazil and Russia. The index consists of 32 countries and 21 currencies. For more information on KIX, see Alsterlind (2006). 39 For some currency pairs, data availability starts already in January 1991. However, due to poor coverage in many other currency pairs, I have chosen to restrict the sample to a period with higher coverage in pricing data in both the SEK currency pairs and the pairs included in the global index. 40 Currency pairs are listed in the Appendix.

SVERIGES RIKSBANK ECONOMIC REVIEW 2022 no. 1
66
Figure 9. Systematic FX liquidity indices and Kronindex (KIX)
Standard deviation (left) and index units (inverted, right)
Note: Liquidity indices (left hand scale) capture systematic liquidity conditions in a set of currency pairs across time (currency pairs listed in the appendix). Negative values indicate worse liquidity conditions relative to a historical average, and vice versa for positive values. The KIX (“Kronindex”) index (right-hand scale) is inverted so that downwards movements illustrate a depreciation of the krona, and vice versa for upwards movements.
Source: Sveriges Riksbank and Bloomberg. Author’s own calculations.
Quite interestingly, there is no clear indication of systematic improvements in liquidity
conditions across this time period in any of the indices. Given the decrease in bid-ask
spreads documented in for example Ding and Hiltrop (2010), this may seem
somewhat surprising. Improvements in transparency and efficiency suggest that
liquidity should as well have improved systematically during these few decades. On
the other hand, Ding and Hiltrop’s findings indicate that it was the introduction of
electronic trading that significantly caused bid-ask spreads to decrease, which would
suggest that the major improvement in liquidity took place during an earlier stage in
time than is covered by this sample. In contrast, the 2000s have been characterised by
increasing fragmentation and complexity. In addition, Ding and Hiltrop’s finding that
large dealers actually even quoted larger spreads on multibank platforms may also be
part of the explanation of why systematic liquidity seems to be fairly stable in this
sample, given that Bloomberg is such as venue.41
Both indices show a clear pattern of deteriorating liquidity conditions around periods
of financial distress, with the 2008-2009 financial crisis and the COVID-19 pandemic
crisis in 2020 by far being the most severe. The European debt crisis that escalated
throughout the early 2010s is also associated with negative spikes in liquidity
conditions. The link between financial turmoil and deteriorating FX liquidity conditions
is related to several different factors. Karnaukh et al. (2015) provide empirical support
41 In addition, Rime and Schrimpf (2013) showed that the trend towards more narrow bid-ask spreads between 2004 and 2013 was driven solely by emerging markets’ currencies; currency pairs of advanced economies were approximately unchanged during the period. The currency sample therefore also affects the dynamics of the liquidity indices across time.
100
110
120
130
140
150-4
-3
-2
-1
0
1
2
01 02 03 04 05 06 07 08 09 10 11 12 13 14 15 16 17 18 19 20 21
Krona liquidity index (LS)
Global liquidity index (LS)
Kronindex KIX (RS)

Understanding the foreign exchange market
67
that FX liquidity systematically worsens with more severe funding constraints and
global risk. Sudden drops in liquidity have been key in several currency crashes: when
liquidity is low, traders become reluctant to take on positions, which in turn
contribute to lower liquidity, see Brunnermeier and Pedersen (2009). In addition,
lower liquidity leads to higher volatility, which may exacerbate such liquidity spirals
even further if it increases the risk of financing a trade, thus increasing the capital
requirements of margins. Market-wide systematic liquidity also tend to deteriorate
when both global stock and bond markets are more volatile and illiquid, suggesting
spillovers from related markets (Mancini et al. 2013).
Moreover, the correlation between the two indices across the time sample is close to
90 per cent, indicating that liquidity conditions in the krona are strongly linked to
global liquidity conditions. This is in line with previous research on commonality in
liquidity across currencies, suggesting that individual currencies share drivers of
liquidity. Brunnermeier and Pedersen (2009) point to shocks to funding constraints of
investors as an explanation for commonality across financial markets, suggesting that
financial turmoil affect funding constraints of investors across all asset classes.
Research also points to general market conditions (risk aversion) and supply- and
demand-side factors such as flight-to-quality dynamics, carry trades and the
propensity of intermediaries to provide liquidity being such common factors (see for
example Karnaukh et al. 2015, Lustig et al. 2011, Mancini et al. 2013 and Menkhoff et
al. 2012).
Furthermore, quarter- and year-ends seem to be connected to sharp but short-lived
drops in liquidity in both indices, especially since 2014 (see Figure 9). Part of the
explanation may be related to regulatory requirements and banks’ balance sheet
management. In line with previous research, Krohn and Sushko (2022) find additional
support of FX funding conditions being correlated with market liquidity and strong
indications of co-movement in FX spot and swap market liquidity. They also show that
this link has strengthened significantly since mid-2014, which coincides with the
introduction of the Basel III framework for global systemically important banks (G-
SIBs).42 They demonstrate that G-SIBs tend to cut back significantly on their quoting
activity around quarter- and year-ends, which causes liquidity to deteriorate. Given
the strong link between the two, worsening liquidity conditions in the swap market
might provide at least a partial explanation to quarter- and year-end drops in liquidity
conditions in the spot market.
Given the global and interconnected nature of the FX market, tight links between
liquidity conditions are unsurprising. Nonetheless, there are differences between the
indices that seem to indicate that liquidity conditions are not only common across
42 The Basel III framework was introduced in 2011, with the regulation on loss absorbency covering global systemically important banks (the G-SIB buffer) being introduced in 2014. Some regulatory requirements did not become fully binding until 2018, although banks started shifting to the Basel III reporting templates around 2014, see Krohn and Sushko (2022). While liquidity always has tended to deteriorate slightly around quarter-ends, the effect has become several times larger since 2014, when the G-SIB buffer was introduced. FX swaps are counted as more complex assets, which adds on the complexity score component of the G-SIB framework. A higher complexity score might put the bank into a higher G-SIB bucket, which means the bank will be subject to higher loss absorbency requirements via additional capital surcharges. As a result, G-SIBs have an incentive to pull out of the FX swap market around regulatory reporting periods.

SVERIGES RIKSBANK ECONOMIC REVIEW 2022 no. 1
68
currencies; some are idiosyncratic to the Swedish krona. For instance, the Krona index
tends to show slightly sharper drops in liquidity during periods of high financial stress,
which might imply that the currency pairs used in the Krona index are in general
riskier than those in the Global index.43 Karnaukh et al. (2015) find that such
currencies are more likely to suffer larger liquidity drops when global risk, such as
global stock and bond volatility, increases.
Furthermore, empirical studies document that the krona tends to depreciate in
response to financial stress (see for example Bacchetta and Chikhani 2021 and Ceh
2020). Gardberg (forthcoming) finds that the krona is particularly sensitive to changes
in global risk; among all G10 currencies, the krona responds the most.44 This pattern is
visible also in Figure 9, where the above mentioned episodes of elevated financial
stress are associated with not only a drop in liquidity but also a weaker krona in terms
of the krona currency index KIX. In addition, improvements in liquidity conditions
seem to be associated with an appreciation of the krona.
As noted in Markets Committee (2017), sudden shifts in liquidity conditions may
exacerbate otherwise orderly movements in exchange rates. In addition, existing
research on liquidity risk premia imply that liquidity risk is priced in the FX market;
investors demand compensation for holding assets that exhibit low liquidity. This
suggests that monitoring the liquidity conditions of the krona might be helpful in
understanding krona exchange rate movements, both in short-term and medium-
term analysis. Nevertheless, further research is necessary to fully understand the
dynamics and relations between liquidity conditions and how liquidity premia might
impact price formation. The rapid changes and increasing complexity of the market
structure further complicates the question; both depth and ability to trade are
important aspects of liquidity, but in today’s FX market, tradeable quotes are mixed
with indicative ones, all quoted on several platforms simultaneously. With the
increasing availability of comprehensive data sets, the effects of such structural
aspects particular to the FX market are hopefully to become subject to further
research.
In sum, a comparison of the Krona liquidity index and the Global liquidity index
indicates that liquidity conditions show a high degree of commonality. Liquidity tends
to deteriorate in periods of financial stress, most recently during the onset of the
COVID-19 pandemic. The krona tends to be weaker during such periods of financial
stress, while improvements in liquidity seem to be associated with the krona
appreciating. Interestingly, however, not all movements in the Krona liquidity index
can be explained by changes in global liquidity conditions, indicating that some
components of liquidity conditions are idiosyncratic to the krona.
43 Here, riskier currencies refer to currencies bearing larger exposure to systematic risk factors such as carry trade risk and volatility risk (see for example Lustig et al. 2011 and Menkhoff et al. 2012). 44 Gardberg (forthcoming) show that currencies in countries with large private net external debt, particularly net portfolio debt and other investment liabilities, tend to depreciate during financial turbulence. She uses VIX, an option-implied index of investors’ willingness to hedge themselves against large price movements in the American stock market index S&P 500, as a proxy for global risk. All currencies are quoted with USD as the base currency.

Understanding the foreign exchange market
69
5 Conclusion The FX market has undergone significant structural changes during the last four
decades. Both trading and price formation are to an increasing degree taking place
electronically and new participants, venues and strategies have emerged. The clear
division between the interbank and the end-client tiers that characterised the FX
market in the 1970s and 1980s has effectively been dissolved into the fragmented yet
interconnected fast-paced electronic market of today. Moreover, the rapid evolution
of electronic trading, particularly the use of algorithms, has increased trading
efficiency and the speed of trading, but has also had an impact on market liquidity
conditions, with potential risks to financial stability and the pricing mechanisms as a
consequence. Furthermore, these structural changes have had considerable
implications for liquidity distribution and market conditions, and market participants
wanting to monitor the market have had to diversify their sources of information.
Finally, this article has presented a Krona liquidity index in an attempt to capture
changes to the structural liquidity conditions in the krona specifically. Commonality
links are strong between global liquidity conditions and those for the krona, although
some changes in liquidity appear to be specific to the krona.

SVERIGES RIKSBANK ECONOMIC REVIEW 2022 no. 1
70
References Alstadheim, Ragna, Kjell Bjørn Nordal, Olav B. Syrstad, Saskia Ter Ellen and May-Iren
Walstad Wassås (2021), ‘Bond market fire sales and turbulence in the Norwegian FX
market in March 2020’, Staff memo, Norges Bank.
Alsterlind, Jan (2006), ‘Effective exchange rates – theory and practice’, Sveriges
Riksbank Economic Review, no. 1, pp. 58–77.
Baba, Naohiko, Frank Packer and Teppei Nagano (2008), ‘The spillover of money
market turbulence to FX swap and cross-currency swap markets’, article in BIS
Quarterly Review, March 2008, March.
Bacchetta, Philippe and Eric van Wincoop (2006), ‘Can information heterogeneity
explain the exchange rate determination puzzle?’, American Economic Review, vol. 96,
no. 3, pp. 552–576.
Bacchetta, Philippe and Eric van Wincoop (2010), ‘Infrequent portfolio decisions: A
solution to the forward discount puzzle’, American Economic Review, vol. 100, no. 3,
pp. 870–904.
Bacchetta, Philippe and Pauline Chikhani (2021), ‘On the weakness of the Swedish
krona’, Sveriges Riksbank Economic Review, no. 1, pp. 6–26.
Banti, Chiara, Kate Phylaktis and Lucio Sarno (2012), ’Global liquidity risk in the foreign
exchange market’, Journal of International Money and Finance, vol. 31, no. 2, pp. 267–
291.
Bertsch, Christoph (2022), ‘Hedging against exchange rate risk – maturity choice and
roll-over risk’, Sveriges Riksbank Economic Review, no. 1, pp. 79–114.
Biais, Bruno, Thierry Foucault and Sophie Moinas (2015), ‘Equilibrium fast trading’,
Journal of Financial Economics, vol. 116, no. 2, pp. 292–313.
BIS (2016), Forward contract, in BIS Glossary, retrieved November 16, 2021, from
https://www.bis.org/statistics/glossary.htm
BIS (2019), Triennial Central Bank Survey of Foreign Exchange and Over-the-counter
(OTC) Derivatives Markets in 2019.
BIS (2013), Triennial Central Bank Survey of Foreign Exchange and Over-the-counter
(OTC) Derivatives Markets in 2013.
Bjønnes Geir H., Dagfinn Rime and Haakon O. Aa. Solheim (2005), ‘Liquidity provision
in the overnight foreign exchange market’, Journal of International Money and
Finance, vol. 24, no. 2, pp. 177–198.
Bjønnes, Geir H., Steinar Holden, Dagfinn Rime and Haakon O. Aa. Solheim (2014),
’”Large” versus ”small” players: a closer look at the dynamics of speculative attacks’,
Scandinavian Journal of Economics, vol. 114, no. 2, pp. 506–538.

Understanding the foreign exchange market
71
Breedon, Francis and Paolo Vitale (2010), ‘An empirical study of portfolio-balance and
information effects of order flow on exchange rates’, Journal of International Money
and Finance, vol. 29, no. 3, pp. 504–524.
Brunnermeier, Markus K. and Lasse Heje Pedersen (2009), ‘Market liquidity and
funding liquidity’, The Review of Financial Studies, vol. 22, no. 6, pp. 2201–2238.
Butz, Maximilian and Roel Oomen (2019), ‘Internalisation by electronic FX spot
dealers’, Quantitative Finance, vol. 19, no. 1, pp. 35–56.
Ceh, Ana Maria (2020), ‘Forecasting short-term movements in the Swedish krona’,
Staff memo, Sveriges Riksbank.
Chaboud, Alain P., Benjamin Chiquoine, Erik Hjalmarsson and Clara Vega (2014), ‘Rise
of the machines: algorithmic trading in the foreign exchange market’, Journal of
Finance, vol. 69, no. 5, pp. 2045–2084.
Chaboud, Alain, Erik Hjalmarsson and Filip Zikes (2020), ‘The evolution of price
discovery in an electronic market’, Finance and Economics Discussion Series no. 2020-
051, Board of Governors of the Federal Reserve System.
CLS, CLS FX trading activity March 2020, retrieved November 25, 2021, from
https://www.cls-group.com/news/cls-fx-trading-activity-march-2020/
Committee on the Global Financial System (2001), ‘The implications of electronic
trading in financial markets’, CGFS Papers no. 16, Bank for International Settlements.
Corwin, Shane A. and Paul Schultz (2012), ‘A simple way to estimate bid-ask spreads
from daily high and low prices’, Journal of Finance, vol. 67, no. 2, pp. 719–760.
Debelle, Guy (2018), ‘Lessons and questions from the GFC’, speech at the Australian
Business Economists Annual Dinner, 6 December, Reserve Bank of Australia.
Ding, Liang and Jonas Hiltrop (2010), ‘The electronic trading systems and bid-ask
spreads in the foreign exchange market’, Journal of International Financial Markets,
Institutions and Money, vol. 20, no. 4, pp. 323–345.
Dobrev, Dobrislav and Andrew Meldrum (2020), ’What do quoted spreads tell us
about machine trading at times of market stress? Evidence from Treasury and FX
markets during the COVID-19-related market turmoil in March 2020’, FEDS Notes,
Board of Governors of the Federal Reserve System, September.
Engel, Charles (2014), ’Exchange rates and interest parity’, ch. 8 in Handbook of
International Economics, vol 4, edited by Gita Gopinath, Elhanan Helpman and
Kenneth Rogoff, Elsevier.
Engel, Charles (2016), ’Exchange rates, interest rates, and the risk premium’, American
Economic Review, vol. 106, no. 2, pp. 436–474.
Euromoney (2019), Foreign Exchange Survey 2019: Electronic trading.

SVERIGES RIKSBANK ECONOMIC REVIEW 2022 no. 1
72
Evans, Martin D. D. and Richard K. Lyons (2002), ‘Order flow and exchange rate
dynamics’, Journal of Political Economy, vol. 110, no. 1, pp. 170–180.
Evans, Martin D. D. and Richard K. Lyons (2006), ‘Understanding order flow’,
International Journal of Finance and Economics, vol. 11, no. 1, pp. 3–23.
Evans, Martin D. D. and Dagfinn Rime (2019), ‘Microstructure of foreign exchange
markets’, Working Paper no. 2019/6, Norges Bank.
Fama, Eugene F. (1984), ‘Forward and spot exchange rates’, Journal of Monetary
Economics, vol. 14, no. 3, pp. 319–338.
Federal Reserve Bank of New York (2010), ‘Foreign Exchange Prime Brokerage Reverse
Give-Up Relationships’, article in Foreign Exchange Committee 2009 Annual Report,
January.
Feenstra, Frank and Satnam Sohal (2019, October), FX Execution: competing in a
World of Algos. Greenwich Associates.
Flood, Mark D., Ronald Huisman, Kees G. Koedijk and Ronald J. Mahieu (1999), ‘Quote
disclosure and price discovery in multiple-dealer financial markets’, Review of
Financial Studies, vol. 12, no. 1, pp. 37–59.
Ford, Martin (2015), Rise of the Robots: technology and the threat of a jobless future,
Basic Books.
Gardberg, Malin (forthcoming), ‘Exchange rate sensitivity and the net foreign asset
composition’, Journal of Money, Credit and Banking.
Geromichalos, Athanasios and Kuk Mo Jung (2018), ‘An over-the-counter approach to
the forex market’, International Economic Review, vol. 59, no. 2, pp. 859–905.
Golden, Paul (2021, July), Foreign Exchange Survey 2021: Fast forward to the future.
Euromoney.
Greenwich Associates (2021), Coalition Greenwich 2020 Market Structure and Trading
Technology Study.
IMF (2015), ‘Market liquidity – resilient or fleeting?’, IMF Global Financial Stability
Report, ch. 2, 49–82.
Karnaukh, Nina, Angelo Ranaldo and Paul Söderlind (2015), ‘Understanding FX
liquidity’, Review of Financial Studies, vol. 28, no. 11, pp. 3073–3108.
King, Michael, Carol L. Osler and Dagfinn Rime (2011), ‘Foreign exchange market
structure, players and evolution’, Working Paper no. 2011/10, Norges Bank.
King, Michael, Carol L. Osler and Dagfinn Rime (2012), ‘Foreign exchange market
structure, players and evolution’, ch. 1 in Handbook of Exchange Rates, edited by
Jessica James, Ian W. Marsh and Lucio Sarno, John Wiley and Sons.

Understanding the foreign exchange market
73
King, Michael, Carol L. Osler and Dagfinn Rime (2013), ‘The market microstructure
approach to foreign exchange: looking back and looking forward’, Journal of
International Money and Finance, vol. 38, no. C, pp. 95–119.
King, Michael, Lucio Sarno and Elvira Sojli (2010), ‘Timing exchange rates using order
flow: the case of the Loonie’, Journal of Banking and Finance, vol. 34, no. 12,
pp. 2917–2928.
Krohn, Ingomar and Vladyslav Sushko (2022), ‘FX spot and swap market liquidity
spillovers’, Journal of International Money and Finance’, vol. 120, 102476.
Kyle, Albert S. (1985), ‘Continuous auctions and insider rrading’, Econometrica,
vol. 53, no. 6, pp. 1315–1335.
Lustig, Hanno and Adrien Verdelhan (2019), ‘Does incomplete spanning in
international financial markets help to explain exchange rates?’, American Economic
Review, vol. 109, no. 6, pp. 2208–2244.
Lustig, Hanno and Nikolai Roussanov and Adrien Verdelhan (2011), ’Common risk
factors in currency markets’, Review of Financial Studies, vol. 24, no. 11, pp. 3731–
3777.
Lyons, Richard K. (2001), The Microstructure Approach to Exchange Rates, The MIT
Press.
Mancini, Loriano, Angelo Ranaldo and Jan Wrampelmeyer (2013), ‘Liquidity in the
foreign exchange market: measurement, commonality, and risk premiums’, Journal of
Finance, vol. 68, no. 5, pp. 1805–1841.
Markets Committee (2017), ‘The sterling ‘flash event’ of 7 October 2016’, Market
Committee Papers no. 9, Bank for International Settlements.
Markets Committee (2018), ‘Monitoring of fast-paced electronic markets’, Markets
Committee Papers no. 10, Bank for International Settlements.
Markets Committee (2020), ‘FX execution algorithms and market functioning’,
Markets Committee Papers no. 13, Bank for International Settlements.
Martens, Martin and Paul Kofman (1998), ‘The inefficiency of Reuters foreign
exchange quotes’, Journal of Banking & Finance, vol. 22, no. 3, pp. 347–366.
Melvin, Michael and Lin Wen (2013), ‘The choice of direct dealing or electronic
brokerage in foreign exchange trading’, Borsa Istanbul Review, vol. 13, no. 3, pp. 10–
21.
Melvin, Michael and Mark Taylor (2009), ‘The crisis in the foreign exchange market’,
Journal of International Money and Finance, vol. 28, no. 8, pp. 1317–1330.

SVERIGES RIKSBANK ECONOMIC REVIEW 2022 no. 1
74
Menkhoff, Lukas, Lucio Sarno, Maik Schmeling and Andreas Schrimpf (2012), ‘Carry
trades and global foreign exchange volatility’, Journal of Finance, vol. 67, no. 2,
pp. 681–718.
Moore, Michael J. and Richard Payne (2011), ’On the sources of private information in
FX markets’, Journal of Banking and Finance, vol. 35, no. 5, pp. 1250–1262.
Moore, Michael, Andreas Schrimpf and Vladyslav Sushko (2016), ‘Downsized FX
markets: causes and implications’, article in BIS Quarterly Review December 2016,
December.
Nolte, Ingmar and Sandra Nolte (2014), ‘The information content of retail investors’
order flow’, European Journal of Finance, vol. 22, no. 2, pp. 80–104.
Noss, Joseph, Lucas Pedace, Ondrej Tobek, Oliver B. Linton and Liam Crowley-Reidy
(2017), ‘The October 2016 sterling flash episode: when liquidity disappeared from one
of the world’s most liquid markets’, Bank of England Working Paper no. 687, Bank of
England.
Osler, Carol L. and Vitaliy Vandrovych (2009), ‘Hedge funds and the origins of private
information in currency markets’, Working Paper, Brandeis International Business
School.
Pagano, Marco and Ailsa Roell (1996), ‘Transparency and liquidity: a comparison of
auction and dealer markets with informed trading’, Journal of Finance, vol. 51, no. 2,
pp. 579–611.
Ranaldo, Angelo and Fabricius Somogyi (2021), ‘Asymmetric information risk in FX
markets’, Journal of Financial Economics, vol. 140, no. 2, pp. 391–411.
Refinitiv (2019), Refinitiv 2019 Artificial Intelligence / Machine Learning Survey Global
Study.
Reserve Bank of Australia (2019), ‘The recent Japanese yen flash event’, article in
Statement on Monetary Policy, February.
Rime, Dagfinn and Andreas Schrimpf (2013), ‘The anatomy of the global FX market
through the lens of the 2013 Triennial survey’, article in BIS Quarterly Review,
December 2013, December.
Roşu, Ioanid (2019), ‘Fast and slow informed trading’, Journal of Financial Markets,
vol. 43, pp. 1–30.
Sager, Michael J. and Mark P. Taylor (2006), ‘Under the microscope: the structure of
the foreign exchange market’, International Journal of Finance and Economics, vol. 11,
no. 1, pp. 81–95.
Sarr, Abdourahmane and Tommy Lybek (2002), ‘Measuring liquidity in financial
markets’, IMF Working Paper no. 232, International Monetary Fund.

Understanding the foreign exchange market
75
Schrimpf, Andreas and Vladyslav Sushko (2019a), ‘FX trade execution: complex and
highly fragmented’, article in BIS Quarterly Review December 2019, December.
Schrimpf, Andreas and Vladyslav Sushko (2019b), ‘Sizing up global foreign exchange
markets’, article in BIS Quarterly Review December 2019, December.
Shleifer, Andrei and Robert W. Vishny (1997), ‘The limits of arbitrage’, Journal of
Finance, vol. 52, no. 1, pp. 35–55.
Sinclair, James (2018), ‘Why does fragmentation continue to increase? Increasing
entropy in currency markets’, MarketFactory Whitepaper, February.
Sveriges Riksbank (2020), ‘The interconnectedness of insurance companies, National
Pension Insurance Funds and banks via the foreign exchange market’, Financial
Stability Report 2020:1, May.
Sveriges Riksbank (2021), Financial markets survey Autumn 2021.
Wooldridge, Philip (2019), ‘FX and OTC derivatives markets through the lens of the
Triennial Survey’, article in BIS Quarterly Review, December 2019, December.

SVERIGES RIKSBANK ECONOMIC REVIEW 2022 no. 1
76
APPENDIX A – Liquidity index calculations The data used are retrieved from Bloomberg, see field names in Table 1 and currency
pairs in Table 2 and Table 3.
Table 1. Bloomberg field names
Ticker Description
XXXYYY Curncy Code for currency pair (i.e. EURUSD Curncy)
PR002 Bid price (closing value)
PQ690 High bid price
PQ677 Low bid price
PR004 Ask price (closing value)
PQ678 High ask price
PQ691 Low ask price
Note: As of 3 January, 2022.
Source: Bloomberg.
Table 2. Currency pairs in the Krona liquidity index
Currency pair Description
AUDSEK Swedish krona per Australian dollar
BRLSEK Swedish krona per Brazilian real
DKKSEK Swedish krona per Danish krone
EURSEK Swedish krona per Euro
INRSEK Swedish krona per Indian rupee
ISKSEK Swedish krona per Icelandic krona
JPYSEK Swedish krona per Japanese yen
CADSEK Swedish krona per Canadian dollar
CNYSEK Swedish krona per Chinese renminbi
MXNSEK Swedish krona per Mexican peso
NOKSEK Swedish krona per Norwegian krone
NZDSEK Swedish krona per New Zealand dollar
PLNSEK Swedish krona per Polish zloty
RUBSEK Swedish krona per Russian rubel
CHFSEK Swedish krona per Swiss franc
GBPSEK Swedish krona per British pound
KRWSEK Swedish krona per South Korean won
CZKSEK Swedish krona per Czech koruna
TRYSEK Swedish krona per Turkish lira
HUFSEK Swedish krona per Hungarian forint
USDSEK Swedish krona per US dollar

Understanding the foreign exchange market
77
Table 3. Currency pairs in the Global liquidity index
Currency pair Description
EURUSD US dollar per euro
USDJPY Japanese yen per US dollar
GBPUSD US dollar per British pound
AUDUSD US dollar per Australian dollar
CADUSD US dollar per Canadian dollar
USDCHF Swiss franc per US dollar
EURJPY Japanese yen per Euro
EURGBP British pound per Euro
EURCHF Swiss franc per Euro
USDSEK Swedish krona per US dollar
EURCAD Canadian dollar per Euro
EURAUD Australian dollar per Euro
GBPAUD Australian dollar per British pound
GBPCAD Canadian dollar per British pound
GBPCHF Swiss franc per British pound
GBPJPY Japanese yen per British pound
EURNOK Norwegian krone per Euro
GBPNOK Norwegian krone per British pound
USDNOK Norwegian krone per US dollar
EURNZD New Zealand dollar per Euro
GBPNZD New Zealand dollar per British pound
NZDUSD New Zealand dollar per US dollar
GBPSEK Swedish krona per British pound
USDINR Indian rupee per US dollar
USDMXN Mexican peso per US dollar
EURSGD Singapore dollar per Euro
GBPDGD Singapore dollar per British pound
USDSGD Singapore dollar per US dollar
GBPZAR South African rand per British pound
USDZAR South African rand per US dollar
Data are cleaned following Brownlees and Gallo (2006). Observations are removed
from the sample if both bid and ask prices are zero or if the price 𝑝𝑡𝑖 is such that:
|𝑝𝑡𝑖 − �̅�𝑖(𝛼, 𝑘)| > 3𝑠𝑖(𝛼, 𝑘) + ν
Where �̅�𝑖(𝛼, 𝑘) and 𝑠𝑖(𝛼, 𝑘) denote the 𝛼-trimmed sample mean and standard
deviation based on 𝑘 observations in the neighbourhood of 𝑡𝑖, respectively. ν is added
on the right side of the inequality to avoid zero variance for a sequence of equal

SVERIGES RIKSBANK ECONOMIC REVIEW 2022 no. 1
78
prices and is set to equal one pip (that is, 0.0001). 𝛼 is set to 5 percent and 𝑘 is set to
100.
Bid-ask spread estimates 𝐵𝐴𝑡 are calculated according to:
𝐵𝐴𝑡 = (𝑎𝑠𝑘𝑡 − 𝑏𝑖𝑑𝑡) ÷(𝑎𝑠𝑘𝑡 + 𝑏𝑖𝑑𝑡)
2.
To calculate the Corwin-Schultz estimates, data are first corrected for overnight
returns. If the low value at day 𝑡 + 1 is higher than the closing value at day 𝑡, both the
high and the low values for day 𝑡 + 1 are decreased by the amount of the overnight
spread. If the high value at day 𝑡 + 1 is lower than the closing value at day 𝑡, both the
high and the low values for day 𝑡 + 1 are increased by the amount of the overnight
spread.
Corwin-Schultz estimates are thereafter calculated according to:
𝐶𝑆𝑡 =2(𝑒𝛼 − 1)
1 + 𝑒𝛼≈ 𝛼
for small values of 𝛼 ∈ [−0.25, 0.25], where
𝛼 = (1 + √2)(√𝛽 − √𝛾),
𝛽 = [𝑙𝑛 (𝐻𝑡
𝐿𝑡)]2
+ [𝑙𝑛 (𝐻𝑡+1
𝐿𝑡+1)]2
and γ = [𝑙𝑛 (𝐻𝑡,𝑡+1
𝐿𝑡,𝑡+1)]2
,
where 𝐻𝑡 and 𝐿𝑡 denote the observed high and low prices on day 𝑡 (also for day 𝑡 +
1), while 𝐻𝑡,𝑡+1 and 𝐿𝑡,𝑡+1 are the high and low over two days (𝑡 to 𝑡 + 1).
All negative two-day spreads are excluded.
Monthly averages are calculated as simple averages for both estimates.
Both series of estimates are standardised (individually) by subtracting the mean and
dividing by the standard deviation. The two standardised series are then combined by
taking the simple average across them.
Finally, the index is computed by taking the simple average of the liquidity measure
across all currency pairs and taking the negative of the series so that negative values
indicate worse conditions and positive values indicate better conditions than the
historical average.