The efficacy of foreign exchange market intervention in Malawi
39
Munich Personal RePEc Archive The efficacy of foreign exchange market intervention in Malawi Kisu Simwaka and Leslie Mkandawire Reserve Bank of Malawi 1. June 2008 Online at http://mpra.ub.uni-muenchen.de/15946/ MPRA Paper No. 15946, posted 30. June 2009 00:17 UTC
Transcript of The efficacy of foreign exchange market intervention in Malawi

MPRAMunich Personal RePEc Archive
The efficacy of foreign exchange marketintervention in Malawi
Kisu Simwaka and Leslie Mkandawire
Reserve Bank of Malawi
1. June 2008
Online at http://mpra.ub.uni-muenchen.de/15946/MPRA Paper No. 15946, posted 30. June 2009 00:17 UTC
AJEP, Vol.15, No.1 June 2008 1
The Efficacy of Foreign Exchange Market Intervention in Malawi1
Kisu Simwaka and Leslie Mkandawire ∗
Abstract
The Malawi Kwacha was floated in February 1994. Since then, the Reserve Bank of Malawi has
periodically intervened in the foreign exchange market. This paper analyses the effectiveness of
foreign exchange market interventions carried out by the Reserve Bank of Malawi. We use a
GARCH (1, 1) model to simultaneously estimate the effect of intervention on the mean and
volatility of the Malawi kwacha.
Using monthly exchange rates and official intervention data from January 2002 to February
2006, the empirical results suggest that intervention activities of the Reserve Bank of Malawi
affect the kwacha. In line with similar findings elsewhere in the literature, the paper finds that net
sales of dollars by the Reserve Bank of Malawi depreciate, rather than appreciate, the kwacha.
This effect is very small, however. Moreover, the paper also finds that the Reserve Bank of
Malawi intervention reduces the volatility of the kwacha. This shows that the Reserve Bank
actually achieves its objective of smoothing out fluctuations of the kwacha. This can be evidenced
by the stability of the kwacha during a greater part of 2004. Thus intervention is, to some extent,
used as an effective tool for moderating fluctuations of the kwacha. However, its effectiveness is
constrained by the amounts of foreign exchange reserves, which are usually low.
Key Words: Foreign Exchange Market, Official Intervention, GARCH
1 This paper is a version of a funded final research report submitted to the African Economic Research Consortium (AERC). The authors wish to thanks the AERC for the financial support. Of course, the usual disclaimer applies. ∗ The authors are senior economists in the Research and Statistics Department of the Reserve Bank of Malawi. Their present address: Reserve Bank of Malawi, Convention Drive, P.O. Box 30063, Capital City Lilongwe 3, Malawi. Tel.: +265 01 770 600; Fax: +265 01 770 593. Email: [email protected]

AJEP, Vol.15, No.1 June 2008 2
Table of Contents
1. Introduction and background……………………………………………3
2. Purpose of the Study…………………………………………………… ..3
3. Literature Review………………………………………………………..21
4. Methodology………………………………………………...……………25
5. Empirical Results……………………………………………...…………28
6. Conclusion and Policy Recommendations……………………………...33
Appendix
Reference……………………………………………………………………..35

AJEP, Vol.15, No.1 June 2008 3
1. Introduction
Most central banks, especially in developing countries use foreign exchange market
intervention2 as a policy tool for macroeconomic stabilization. In Malawi, the
exchange rate was floated in February, 1994. Since then, the Reserve Bank of Malawi
(RBM) has periodically intervened in the foreign exchange market. In line with the
International Monetary Fund (IMF) conditions under the structural adjustment
package, the RBM has also intervened to buy foreign exchange in order to build up
reserves for the Government and moderate exchange rate fluctuations.
There has been a lot of debate in literature on the question of whether these
interventions affect the value of the kwacha. The main objective of the study is to
examine the efficacy of the official intervention in foreign exchange market.
Basically, the paper tries to answer the following questions: Floatation of the kwacha
was intended to be market determined, but has it really been market determined? Has
intervention influenced movements of the kwacha? Has intervention dampened and
smoothened the volatility of the Malawi kwacha? What is the role of the balance of
payments pressures on the direction and volatility of the Malawi kwacha?
The issue of the effect of intervention on the exchange market in Malawi is
significant on both research and policy fronts. Research front, because very few such
papers have been done on Africa and only one is known to the authors. It is of policy
interest because, if sterilized intervention has an effect on the kwacha, this offers the
monetary authorities an additional policy tool independent from general monetary
policy.
In Section 2, we discuss monetary and exchange rate policy in Malawi. Section 3
gives theoretical underpinnings and reviews recent results in recent contributions to
empirical literature on effectiveness of central bank interventions. Section 4 outlines
the methodology used in the paper. Section 5 summaries the main findings of our
empirical research. Section 6 concludes the paper and offers some policy
recommendations. 2Iintervention refers to official sales or purchases of foreign exchange to influence exchange rate. In this paper, we have used net sales of foreign exchange as our intervention variable.

AJEP, Vol.15, No.1 June 2008 4
1.2 Monetary and Exchange Rate Policy in Malawi
1.2.1 Monetary Policy
Up until late 1980s, monetary policy in Malawi was characterized by repressive
procedures such as direct credit, interest rate ceilings, and strict controls on foreign
exchange and capital flows. Supported by the International Monetary Fund (IMF),
Malawi went into structural adjustment programs beginning in the second half of
1988. The programmes included liberalization of the financial sector, which meant
that monetary policy had to shift from direct to indirect methods. This facilitated the
conduct of monetary policy in line with macroeconomic objectives of maintaining
sustainable growth, viable balance of payments position and stable prices. The central
bank keeps a close eye on all indicators that would entail price developments
including Consumer Price Index (CPI) inflation, growth in Gross Domestic Product
(GDP), monetary growth and expansion of credit.
Table 1: Selected macroeconomic Indicators
2000 2001 2002 2003 2004 2005
Real GDP 1 0.2 -4.1 1.8 3.9 5.1 1.9
CPI inflation2 29.3 27.5 14.8 9.6 11.5 16.5
M2 (money supply)3 47.1 22.1 25.2 29.3 29.8 14.3
MK/USD rate3 80.09 72.15 76.69 108.57 108.94 123.63
Source: Reserve Bank of Malawi Monthly Economic Review, July 2003 and January 2006
1. Annual percentage change 2. Year-on-year of inflation 3. Period average
In trying to attain its goal of price stability, the Reserve Bank of Malawi establishes
an annual inflation rate target, announced by the Minister of Finance in his Budget
Statement to Parliament and monetary aggregates as an intermediate variable.

AJEP, Vol.15, No.1 June 2008 5
The choice of monetary policy stance adopted by a country, by and large, depends on
the economic, financial and institutional environment within which the policy is
operating. Currently, Reserve Bank of Malawi (RBM) pursues a monetary targeting
regime, whereby the authorities aim at regulating money stock (broad money, M2), to
levels required to support the relationship between price level and output. Broad
money stock (M2), therefore is a nominal anchor to control inflation. Open market
type operations remain the primary policy levers to influence liquidity. The objective
of monetary policy is to reduce inflationary pressures by bringing inflation to the
neighbourhood of 5-8 percent over the medium term. In this range, inflation is
deemed less likely to distort savings and investment decisions. The conduct of
monetary policy is under the overall leadership of the Monetary Policy Committee,
which meets once in a month to take stock of the performance of the economy vis-à-
vis the economic program and takes a view on the expected level of inflation in the
short to medium term. On the basis of its assessment, the Committee gives broad
guidelines to the Open Market Desk of the Bank on what it views as the appropriate
reserve money target by the end of the month or quarter. The information given is
consistent with monetary policy targets. The Open Market Desk uses this information
and other available information such as expected sales and purchases of foreign
exchange by the Bank, maturities and new issues of Treasury bills and Government
expected revenue and expenditure to map out a path for monetary policy intervention
for the month.
1.2.2 Monetary Policy Targeting
The Reserve Bank of Malawi attempts to directly control money stock through a
number of instruments. Although the RBM has a statutory responsibility to achieve a
low and stable inflation at predetermined level for a given time, the nature of its
functions make inflation targeting not an option. Inflation targeting requires some
level of independence of the RBM, a high degree of cooperation between the Bank on
the one hand and the Government, private sector and trade unions on the other.

AJEP, Vol.15, No.1 June 2008 6
In order to achieve the price stability objective, the Bank exerts stricter controls over
reserve money, employing for this purpose quarterly growth targets (usaully agreed
with the International Monetary Fund under the supported programmes). While more
emphasis was initially put on growth in M2 aggregate, recent developments have
indicated that M2 can better be influenced by monitoring growth in reserve money
aggregate because the central bank has better control over the latter than the M2
money stock.
In order to influence growth in the money stock, the central bank increases or
decreases the amount of reserve money by managing both the domestic and foreign
sources of reserve money (credit from the central bank, and acquisition of foreign
exchange by the Bank that has impact on local money creation). The central bank’s
daily monetary management involves making estimates of banking system liquidity
situations. Based on the outcome, the central bank decides how to intervene i.e. inject
or withdraw liquidity from the system.
In line with direct monetary control, RBM manages monetary conditions in the
economy by using three main instruments namely the bank (discount) rate, Liquidity
Reserve Requirement (LRR), and Open Markets Operations (OMO).
1.2.2.1 Bank or Discount Rate
The bank rate or discount rate is the rate at which the Reserve Bank charges on funds
borrowed from it by commercial banks and the government. The rate imposes
limitations on the capacity to borrow from the central bank. The bank rate had
previously been set administratively but for a brief period, and during each month it
would be set at a mark above the average 273-day Treasury bill (TB) rate of the
previous month. As a result, increases in the Treasury bill rates would immediately be
reflected on the bank rate. For instance in February 2001, the Bank rate had increased
to more than 75 percent. In June 2001, the bank rate was de-linked from the TB-rate
and begun to be set administratively by the RBM. Following this move, the RBM has
succeeded in providing a broad benchmark for market interest rates. The effect of this
policy is that Treasury bill rates have declined relative to their values of over 50

AJEP, Vol.15, No.1 June 2008 7
percent in early 2001 to around 25 percent in 2005. But the large drop in Treasury
bills rate is, to an extent, attributed to fall in inflation due favourable food harvests as
food inflation accounts for 58 percent of the inflation basket. The discount rate is an
important barometer of monetary policy stance and its adjustment has successfully
tended to influence lending rates in the financial system. Operationally, borrowing by
banks is done through standing facilities window. RBM discount window was
established in line with the ‘lender-of-last-resort’ role. Accordingly, it has continued
to provide loans of a short-term nature (overnight) to banks in need of liquidity.
Recently, repurchase agreements have been used quite often in order to fine-tune
banking system’s liquidity. A commercial bank may borrow funds for a period of 7
days maximum. The discount rate is also a penalty rate as it is usually above the
market rates to discourage banks.
1.2.2.2 Liquidity Reserve Requirement (LRR)
LRR is one of the instruments available to RBM for controlling base money. LRR
works by affecting the proportion of assets that banks are required to hold, and hence
their ability to expand liquidity. In Malawi, all commercial banks are subject to the
LRR requirement on all their domestic liabilities, and discount houses on all their
collateralized deposits. Failure to oblige by the requirement attracts a penalty from
the RBM.
LRR was first applied in 1989. Initially, commercial banks were required to maintain
a minimum equal to 20 percent of their total local currency deposits (including
government deposits). In1995, the LRR was increased to 35 percent. In June 2004,
the rate was adjusted downwards to 27.5 percent to-date with the callable deposits
also adjusted to 14.5 percent.
The use of the LRR is limited, as focus has tilted more to open market operations
(OMO). The LRR remains generally high and this has adverse implications in the
conduct of monetary policy. In effect the high LRR is regarded as an implicit tax on
these institutions equivalent to interest rates that they could have earned on these

AJEP, Vol.15, No.1 June 2008 8
balances. This implicit tax on reserves when adjusted for other intermediation costs
partly explains the wide spread between deposit and lending rates.
But the authorities could not just ascribe to the idea of maintaining a lower LRR as its
reduction could fuel inflationary pressures unless it is offset by other monetary
instruments like aggressive sales of securities. It is against this reason that RBM did
not fully comply with its previously announced LRR reduction scheme in 2004.
Cumulative monetary overhang led to suspension of the scheme.
1.2.2.3 Open Market Operations (OMO)
Open Market Operations involves the deliberate buying and selling of paper by RBM
to inject and withdraw liquidity from the financial system. OMO is conducted
through RBM bills and repurchase agreements (repos) using Treasury bills as the
major monetary policy instruments. Of the two, the RBM bills are the most
commonly used. Prior to RBM bills, Treasury bills were issued for monetary policy
purposes in addition to government finance. The Reserve Bank assumed
responsibility over monetary Treasury bills and the proceeds were frozen till maturity.
But in view of policy conflicts that arise from government debt management and
monetary policy needs through issuance of Treasury bills for dual considerations
(monetary and fiscal), the monetary policy Treasury bills were gradually phased out.
Since 2000, RBM has been conducting OMO through primary market auctions of
RBM bills. Since 2000, RBM has been conducting open market type operations
through primary market auctions for liquidity management purposes to meet its
reserve money targets.
1.2.3 Challenges to execution of monetary policy
Monetary targeting in Malawi, however, faces some problems such as non-guaranteed
expectation that the relationship between the supply of money and inflation is stable
and predictable. This is manifest in the apparent missing of targets more frequently.
But despite being imprecise, the relationship has been judged to be sufficiently stable

AJEP, Vol.15, No.1 June 2008 9
to serve as a useful guide to policy. This therefore justifies the medium term inflation
objective of 5-8 percent.
Fiscal overruns have been associated with monetization of the deficit, crowding-out
of credit to the private sector and worsening inflation position. Associated with fiscal
overruns also, have been massive increases in banking system credit, especially in the
context of donors curtailing support because of concerns about governance. In simple
terms, fiscal expansion and the related large fiscal deficits have affected the efficacy
of monetary policy.
1.3.2 Exchange rate policy
1.3.2.1 Evolution of the Exchange Rate
Malawi’s exchange rate has evolved over time responding to the economic
circumstances that have prevailed at particular times. The management of the
exchange rate in Malawi has been pursued with three major policy objectives in
mind. These are:
i. Maintenance of a sustainable balance of payments position
ii. attainment of stable domestic prices
iii. Attainment of growth in real income
From 1965 to January 1973, Malawi operated within the sterling zone with the
Malawi pound, later changed to Malawi kwacha in 1971, pegged at par to the British
pound sterling. In November 1967, the British sterling was devalued by 14 percent
and the Malawi pound followed suit by the same magnitude. During the same period
the economy grew impressively and the balance of payments position was
remarkable.
With the collapse of the gold standard par value system the major currencies, the
British sterling included, in the currency market became very volatile as these
currencies shifted from pegging to the gold to a generalized floating system. From
November 1973 to June 1975, the Malawi kwacha was pegged to a trade weighted

AJEP, Vol.15, No.1 June 2008 10
basket of the Pound and the US dollar. The Reserve Bank took an active exchange
rate policy with announcements of devaluations and setting the daily buying and
selling rates of the US dollar and the British pound sterling.
There were persistent fluctuations in the two currencies, leading to authorities seeking
a more permanent peg and the kwacha was pegged to the SDR in June 1975 until
1984. This allowed the kwacha some measure of stability until early 1980s when the
SDR started appreciating rapidly in tandem with appreciation of the dollar, forcing
authorities to devalue the local currency against the SDR by 15 and 12 percent on 24
April 1982 and 17 September 1983, respectively. The situation was exacerbated by
external and internal shocks that rocked the Malawi economy, further worsening the
country’s terms of trade. Because of the continued appreciation of the SDR, and the
fact that the SDR did not properly represent the currencies of Malawi’s trading
partners, the authorities decided to add the South African rand to the SDR basket in
January 1984. Following this peg, the main thrust was to maintain external
competitiveness by ensuring that real exchange rate (RER) was not appreciating. This
was achieved by periodic devaluations of the kwacha especially that the rate of
inflation in Malawi remained higher than that of trading partners’ currencies such as
South Africa, Zimbabwe and Zambia and also due unfavourable movements in
relative prices.
From January 1984 through to February 1994, in an effort to recover from the
worsening balance of payments position, the authorities pegged the kwacha to a trade
weighted basket of seven currencies. The signs of recovery were manifested by
improvements if the balance of payments position from –11.8 percent of GDP in 1983
to –1.7 percent in 1984, but these were short-lived as increased transportation costs
led to further deterioration in terms of trade. This resulted in authorities taking a
series of active exchange rate policy stance. On April 2, 1984, the kwacha was
devalued by 15 percent, followed by further devaluations by 10 percent on August 16,
1986, 20 percent on February 7, 1987; 15 percent on January 16, 1988; 7 percent on
March 24, 1990; 15 percent on 28 March 1992; and further 22 percent on July 11,
1992. Progressively, it became apparent that the exchange rate was becoming heavily

AJEP, Vol.15, No.1 June 2008 11
politicized, with each devaluation becoming subject of intense speculation within the
private sector. That led to weakening the level of confidence in the exchange system,
and consequently a marked slowdown in repatriation of export proceeds. The
situation was worsened by the cut in non-humanitarian assistance by bilateral donors
and suspension of balance of payments support in 1992 because of governance issues.
1.3.2.2 The Floatation of the kwacha
In February 1994 Malawi adopted a managed float exchange rate regime. This was
aimed at resolving the foreign exchange crisis that had hit the country due to
suspension of balance of payments support from donors, and the lagged effects of the
1992/93 drought. The switch from the fixed regime to the floating one was meant to
achieve certain objectives which can be summed up as:
i. Improvement of the country’s export competitiveness,
ii. Provision of an efficient foreign exchange allocation mechanism
iii. Dampen speculative attacks on the Kwacha. Prior to the floatation,
devaluations had become more frequent and very predictable thereby
making the whole system very unstable.
iv. Restoration of investor and donor confidence. The country’s foreign
reserves had dwindled to such low levels that it was difficult to do
business with the rest of the world.
As a step towards market determination of the exchange rate, the monetary authorities
authorized creation of a foreign exchange market administered by the RBM where
weekly auctions of the foreign exchange market would take place. Buyers of the
foreign exchange would bid through the commercial banks the price at which they
wanted to buy a certain amount of foreign exchange. In the same way, sellers would
determine their selling price and amounts. Successful bidders would then pay their
bidding prices and not the clearing rate. This, therefore, was adoption of a managed
float exchange rate regime. Consequently, the exchange rate of the Kwacha against
the US dollar depreciated from around K4.5 to over K17 during the period February
to September 1994.

AJEP, Vol.15, No.1 June 2008 12
1.3.2.3 The Crawling band
During the period 1995-97 the exchange rate fluctuated within a very narrow fixed
band and accordingly foreign reserves were used to support the exchange rate. The
main objective of attaining low inflation rates was achieved towards the end of 1997
but at the expense of huge foreign exchange reserves and high interest rates, which
were used to support the exchange rate. Consequently, the real exchange rate
appreciated and had a negative impact on the current account balance. In other words
the current account imbalance that emerged during the period of fixed exchange rates
was being covered by a run down of reserves.
1.3.2.4 An unannounced crawling peg
After achieving the inflation objective during 1997, the target of the monetary
authorities was then to revive the lost competitiveness within a reasonable period of
time. It soon became clear that the narrow band had to be abandoned in favour of an
unannounced crawling peg. During this period, the authorities were not committed to
defend the currency thus the central parity rate was adjusted every time the maximum
level (i.e. the upper limit of the band) was reached. Thus between 1997 and 1998 the
exchange rate moved from around K15 to K38 to the US dollar.
1.3.2.5 The ‘free-floating’ system
This adjustment in the exchange rate brought back some competitiveness in the
country’s foreign trade. Consequently, the system was abandoned towards the end of
1998 and the exchange rate started operating in a more market fashion – i.e. the ‘free-
floating’ system. This system saw Authorized Dealer Banks taking a more active role
in determining the path for the Kwacha. Consequently, and in part owing to the
heavy depreciation of the kwacha in August, 1998, the kwacha dropped against the
dollar by over 100.0 percent between January and December of that year.
Developments in the exchange rates during 1999 reflected several factors, first ample
supply of foreign exchange made possible by a health tobacco season which

AJEP, Vol.15, No.1 June 2008 13
contributed to the relative stability of the currency. Second, mid-way, into the year,
speculation about another possible devaluation of the kwacha died down, enabling the
currency to remain relatively stable. Third, the donor inflows, though lower than
expected, also contributed much to the stability of the kwacha as these supported the
foreign exchange reserve position. Finally, the recovery in the countries affected by
the Asian crisis also helped achieve stability in the exchange rate as currencies of
major trading partners stabilized. Notwithstanding these positive developments, the
kwacha also came under pressure as the inflation differential between Malawi and her
trading partners increased. In addition, the seasonal increase in demand for foreign
exchange towards the end of the year also exerted a downward pressure on the
currency. Reflecting these developments, the external value of the Malawi kwacha
dropped by 6.5 percent against the US dollar between January and December, 1999.
In 1999, the kwacha also depreciated by 4.1 percent against the British pound and
17.4 percent against the Japanese yen. Over the same period, the kwacha appreciated
in relation to the Euro, largely owing to the latter’s weakening vis-à-vis other
currencies. The external value of the kwacha weakened substantially in 2000
particularly starting the second quarter of the year. Several factors accounted for this
development, both external and domestic. On the international scene, one of the
factors is the growth in the US economy which resulted into strengthening of the US
dollar against all major currencies. Subsequently, the Malawi kwacha weakened in
attempt to maintain its competitiveness. On the domestic front, the collapse of
tobacco prices at the auction floors had an adverse impact on the country’s reserve
position. This together with the hoarding of foreign currency by some exporters and
non-receipt of pledged donor support led to scarcity of foreign exchange on the
market thereby putting pressure on the kwacha. Thus by end December, 2000, the
external nominal value of the kwacha weakened by about 38.0 percent from the value
observed at the end of 1999.

AJEP, Vol.15, No.1 June 2008 14
The free-float system, is perhaps remembered by the first ever appreciation of the
Kwacha in 2001. Receipt of some donor inflows at the beginning of 2001 coupled
with relatively higher average tobacco prices at the auction floor meant a favourable
healthy foreign exchange position and this helped to dampen any speculative attacks
on the kwacha. The kwacha consequently managed to firm up against most of other
currencies. Similarly, the kwacha gained 18.3 percent, 19.9 percent and 26.6 percent
against the British Pound, the Euro and Japanese Yen, respectively to reach K97.64
per pound, K59.56 per euro and K0.51 per yen. Thus at the end of 2001, the kwacha
contrary to most speculative sentiments, settled at a modest K67.29 per US dollar
when viewed against the rate of K80.08 per US dollar at the end of 2000.
A short period of exchange rate instability followed. In 2002, developments on both
the local and international scene adversely affected the nominal value of the Malawi
kwacha against the currencies of other trading partners. On the domestic market,
despite improved receipts of from tobacco sales as compared to 2001, low donor
inflows impacted negatively on the country’s reserve position. On the international
scene, the United States economy performed below its projected growth with
significant drop in the second quarter of year. As a result, the dollar weakened against
other hard currencies, notably the Euro and the British pound. Consequently, by the
end of December 2002, the Malawi kwacha had shed 29. 5 percent against the US
dollar to close the year at K87.14 per dollar. Similarly the kwacha weakened against
the Euro and the Japanese yen by 53.4 percent and 43.3 percent to K91.36 per euro
and K0.70 per yen, respectively. Against the British pound, the kwacha slid to
K139.73 per pound from K97.64 per pound as at end December 2001.
1.3.2.6 The Managed float
A policy decision was taken in August 2003 to stabilize the Kwacha at a rate of K108
against the United States dollar. The decision was in response to serious economic
disequilibrium or instability following the suspension of the first IMF PRGF and the
resultant droughts in the early 2000s.

AJEP, Vol.15, No.1 June 2008 15
The kwacha –US dollar remained largely unchanged from August 2003 until mid-
March 2005 when a series of adjustments saw the Kwacha resting at K123 against the
United States dollar. The stability of the kwacha during the larger part of 2004 was as
a result of the involvement of the Reserve Bank of Malawi in buying United States
dollars direct from farmers at the auction floors. This arrangement was necessitated
by the misunderstanding that arose between tobacco farmers and the commercial
banks regarding delays in crediting the farmers’ accounts after the sale of their
tobacco and the exchange rate used in the conversions. This arrangement was,
however, not normal as it was not in keeping with the liberalized foreign exchange
regime Malawi adopted in 1994. However, in view of the importance of the tobacco
industry in the country, and in the face of a deadlock between farmers and the
commercial banks, the Reserve Bank had to step in to save the situation. The Kwacha
then stabilized at those levels until early 2006, when economic conditions
necessitated a further review3.
Figure 1: Daily exchange rates (2002-2005)
60
80
100
120
140
02:01 02:07 03:01 03:07 04:01 04:07 05:01 05:07 06:01
EX
3 Currently, the Reserve Bank is no longer involved in the purchase of dollars from farmers on the auction floors. This follows an agreement between the two parties after their Reserve Bank-brokered discussions earlier this year. The farmers are now able to get their proceeds within 24 hours of the sale documents being submitted to their bankers and the exchange rate used in the conversion is the one displayed on the day of the sale.

AJEP, Vol.15, No.1 June 2008 16
1.3.2.7 The Current Exchange Rate Policy
The current managed float exchange rate system was adopted in response to many
economic challenges like persistent excess demand for foreign exchange, frequent
droughts and market failures, among others, which rendered the free float system
ineffective. The exchange rate is aligned with major objectives, that is, maintaining a
sustainable BoP position, attaining stable domestic prices and attainment of growth
in real income. It is the intention of monetary authorities to place more reliance on
market based instruments in regulating the kwacha’s value. However, moral suasion
would be used if deemed necessary. It is not surprising therefore to see the kwacha on
a weakening voyage – depreciating against all major currencies in May to average
K138.75 (K134.74 in April 2006) against the US dollar, K22.45 (K22.24 in April
2006) against the South African rand, and K176.61 (K165.03 in April 2006) against
the Euro.
1.3.3 Foreign Exchange Market Intervention
The medium term objective of the Reserve Bank is to have the kwacha fully market
determined and build foreign exchange reserves, but at the same time the monetary
authorities do recognize the importance to investors, of a predictable currency value.
In a liberalized foreign exchange market, the RBM cannot dictate the value of the
Malawi kwacha. However, the RBM can only influence the value of the kwacha by
buying foreign exchange when there is an excess supply in the market and selling
when there is shortage. This means that in theory, the RBM can maintain a stable
exchange rate by intervening in foreign exchange market. In practice, however, the
RBM has to consider the monetary implications as well as implications on the
position of official foreign reserves. As the Bank buys foreign exchange from the
market, the supply of the Malawi kwacha in the economy increases and this has
potential for inflationary pressures. For the Reserve Bank to sell foreign exchange to
the market, it must have adequate reserves in the first place. And, as a source of its
own foreign exchange reserves, the Reserve Bank also relies on whatever it is able to
buy from the market and/or, if there were any inflows of donor funds. Any constraints

AJEP, Vol.15, No.1 June 2008 17
on these two sources, means inadequate capacity for the Bank to support the market
effectively, thereby affecting the surplus/demand balance in the market. The major
players in the foreign exchange market in Malawi are the two major commercial
banks (Authorized Dealer Banks), the tobacco companies (Limbe Leaf, STANCOM),
the Sugar Company (ILLOVO), and the foreign exchange bureaux.
Overall, since the floatation of the kwacha in 1994, there has been limited to meeting
net international reserve target and moderating seasonal fluctuation related primarily
to the agricultural cycle. Due to the seasonal nature of our foreign exchange earnings
coupled with the fact that tobacco exports account for about 60 percent of the foreign
exchange earnings, the Malawi kwacha is normally expected to appreciate during the
tobacco marketing season (April to August), reflecting increased supply of foreign
exchange on the market, and depreciate during the off-season reflecting increased
demand for foreign exchange as the economy imports farm inputs such as fertilizer.
This seasonal pattern may vary if during that time of the year, the country has
received substantial donor inflows. Daily purchases or sales are limited to 10US$mn,
while on weekly and monthly basis, they go up to 15US$mn and US$35mn,
respectively. The size and frequency of daily net purchases range from (-) US$1.0
million to US$10.0 million. On weekly basis the net purchases range from (-) US$16
million to US$15 million while on monthly basis they range from from (-) US$25.0
million to US$35.0 million.

AJEP, Vol.15, No.1 June 2008 18
Figure 2: Monthly Exchange rates and Net foreign exchange sales
-50
0
50
100
150
02:01 02:07 03:01 03:07 04:01 04:07 05:01 05:07 06:01
EX NS
Activity in the foreign exchange market is divided into segments – transactions
between banks and their clients, and inter-bank activity including the RBM’s
intervention in the market. Average daily turnover volume in the first segment of
foreign exchange market was about US$13.5 million in 2002. Inter-bank activity was
much lower however, more than 75 percent of which was characterized by official
intervention.
1.3.4 The Parallel Market
The parallel market has existed for a long time. This market exists to meet the needs
of foreign exchange customers whose needs cannot be satisfied in the authorized
dealer banks (ADBs) or bureaus. Continuation of activities in the parallel market
reflects that there are distortions in the official market and its exchange rates should
reflect the actual market rates. The activities in this market cannot objectively be
measured; however, the gap between the bureau exchange rates and the parallel rates
is not very large. The rates also tend to be stable following the movements in the
official exchange rates. The parallel market is preferred because it allows for faster
purchase or selling of foreign exchange without disclosing much information.
However, there is a high risk associated with dealing with operators in this market
mainly associated with obtaining the local or foreign currencies that are not genuine

AJEP, Vol.15, No.1 June 2008 19
and if the law catches with money changer, then prosecution will follow. This has
made it difficult to obtain any information regarding operations in this market
Participants in the parallel market are not defined, especially as there is no legal
recognition accorded to operators and there are no direct regulations, however there
seem to be a lot of information sharing among dealers in this market. Usually the
exchange rates in this market are similar among dealers in different places within the
city of Lilongwe, for example and between the dealers in different cities of the
country. The only marked difference in rates exist between dealers in major cities and
those at the borders with neighbouring countries, with the latter having lower rates in
most cases than the former.
Establishment of Foreign Exchange Bureaus
In order to incorporate parallel market into the legal foreign exchange system in
Malawi, foreign exchange bureaus were granted permission to operate from mid
1990s. Operators in the bureau de change are private entrepreneurs who have been
formally recognized by government to deal in foreign exchange and provide access to
foreign exchange in a convenient and informal manner.
Foreign exchange is primarily sourced from private individuals, including businesses
people who are unable to deal at authorized dealer banks. From their inception there
has been a general movement of exchange rates in the bureaus de changes towards
that of parallel market. By June 2004, while the official rate was K108.8858 per US
dollar, the bureau de change exchange rate and parallel rate were K110.0000 and
K118.0000, respectively (see below). This trend continued, with the explanation for
this as excess demand for foreign exchange in the foreign exchange market eventually
transferred to the bureau de change to attract higher prices. Again, the very simple
nature of transactions in this market compared with the foreign exchange market plus
relative lower risk – e.g fake currency transactions – to the parallel market, make it
attractive for consumers to prefer dealing with bureau de changes operators. This
drives up demand and, consequently, the exchange rate.

AJEP, Vol.15, No.1 June 2008 20
Figure 3: Official and Parallel exchange rate trends
60
80
100
120
140
160
02:01 02:07 03:01 03:07 04:01 04:07 05:01 05:07 06:01
OFFEXR PAR EXR
Figure 4 shows exchange rate premium. Exchange rate premium is measured by the
difference between official exchange rate and parallel exchange rate. Other measures of
premium are the difference between official exchange rate and bureau de change rates. It
should however be noted that the suggestion that parallel rate is the optimal rate is
controversial. Given the fact that the official market’s share of the foreign exchange
market is much larger, the realistic market rate may lie somewhere between the official
exchange rate and parallel market rate. The increasing gap between official exchange rate
and parallel exchange rate justifies some analyst’s view that the Malawi kwacha is
overvalued. Even though all markets are imperfect, the official market is the leading
market.

AJEP, Vol.15, No.1 June 2008 21
Figure 4: parallel exchange rate premium
parallel exchange rate premium
-10.000-5.0000.0005.000
10.00015.00020.00025.00030.000
1/31
/200
2
7/31
/200
2
1/31
/200
3
7/31
/200
3
1/31
/200
4
7/31
/200
4
1/31
/200
5
7/31
/200
5
1/31
/200
6
month/year
prem
ium
Series1
3.0 Literature Review
3.1 Theory of Intervention4
3.1.1 Sterilized intervention
There is general agreement in literature that unsterilized sale of foreign exchange
would be expected, other things being equal, to appreciate the exchange rate through
contraction of money supply and therefore interest rates. Sterilized intervention is
where the authorities take deliberate action to offset foreign exchange market
intervention with an equal change in the net domestic credit and this happens either
simultaneously or with some short lag, while leaving interest rates unchanged. On the
other hand, intervention is non-sterilized when it is conducted without any action
taken to offset the impact of intervention. The relationship between exchange rates
and monetary control largely comes from central banks balance sheet. On the
4 This section relies heavily on Simatele (2004)

AJEP, Vol.15, No.1 June 2008 22
liabilities side, there is the base money (BM) which comprises reserves, currency and
the central bank’s net worth. On the assets aside, there is net foreign assets (NFA) and
net domestic assets (NDA). Any intervention in the foreign exchange market will
change NFA (Simatele, 2004). Assuming that net worth is insignificant, a summary of
the balance sheet can be presented as:
BM = NFA + NDA
Sterilization needs the central bank to take deliberate action such as open market
operation sales or purchases of securities. Once this is done, the result will be an
equal change in domestic assets. Without sterilization, the monetary base also
changes i.e.
∆BM = ∆NFA
The size of sterilization largely depends on the extent to which simultaneous changes
take place in NDA as NFA changes (Simatele, 2004). Full sterilization happens when
changes in NFA are totally offset by changes in NDA, thus the expression:
- ∆NFA = ∆NDA
and
∆BM = 0
In this case there would be no impact on the monetary base. The changes will eventually
result into changes in broader money aggregates and interest rates. This in consequent will
affect expectations, capital inflows and eventually the exchange rate.
Sterilised intervention5 can affect exchange rate through two channels. These are the portfolio
balance channel and the signaling channel.
5 The Reserve Bank of Malawi sterilizes its foreign exchange market intervention whenever it is perceived that intervention in foreign exchange market will affect reserve money targets to the extent that the targets will be missed. Since, money targets are usually tight; the Bank therefore often sterilizes its foreign exchange market intervention.

AJEP, Vol.15, No.1 June 2008 23
3.1.1.1 The Portfolio Balance Channel
This one states that sterilising intervention through typical open market operations
will change the currency composition of government securities held by the public
(Humpage, 2003). A sterilised purchase of foreign exchange, for example, increases
the amount held domestic bonds held by the public relative to foreign bonds, resulting
in a depreciation of the local currency. Unfortunately, most empirical studies find the
relationship to be statistically insignificant. The reason offered for the lack of a
portfolio effect is that the typical intervention transaction is minor relative to the
stock of outstanding assets. Dominguez (1998) is a notable exception to this
conclusion.
3.1.1.2 Signalling Channel
The second channel is the signalling or expectations channel. Mussa (1981)
suggested that central banks might give indications regarding future, unanticipated
changes in monetary policy through their sterilised interventions, with sales or
purchases of foreign exchange implying, respectively, monetary tightening or ease.
This would have direct implications for future fundamentals, and traders would
immediately adjust spot exchange rate quotations. Mussa suggested that such signals
could be particularly strong – more so than a mere announcement of monetary policy
intentions – because interventions give monetary authorities open positions in foreign
currencies that would result in losses if they failed to confirm their signal. Reeves
(1997) has formalised Mussa’s approach and has demonstrated that if the signal is not
fully realistic, or if the market does not use all available information, then the
response of the exchange rate intervention ill be low. However, Edison (1993) argues
that intervention is effective and occurs through both the portfolio balance and
signalling channels.
3.1.2 Profit Criterion
This one states that if official intervention yields a profit, it will reduce unnecessary
exchange rate fluctuations. It is stabilising. If intervention entails losses, it becomes
an additional source of exchange rate instability. This criterion is based on static view

AJEP, Vol.15, No.1 June 2008 24
that of equilibrium exchange rate, which must be computed in the first place. The
profit criteria also takes into account interest differential.
3.2 Empirical Findings
Andrew and Broadbent (1994) in their work on the effectiveness of official
intervention in the Australian dollar market found out that in the first ten years of the
floatation of the Australian dollar (1983 – 94) the Reserve Bank of Australia foreign
exchange operations resulted in the stability of the Australian dollar. Makin and Shaw
(1997) concluded that the official intervention during 1983-93 had neither influenced
the Australian dollar nor smoothened its volatility. Bonser - Neal et al. (1998) and
Humpage (1999) show that the interventions undertaken together with changes in the
federal funds rate do not have any effect on exchange rates. Both results attribute
exchange rate responses mainly to the federal funds rate. However Kearns and
Rogobon (2002) support the view that over the period 1986-93, RBA intervention did
have an economically significant effect in moving the level of exchange rate. Using
daily data covering the 1983-97 period, Kim and Sheen (2002) and Kim, Kortian and
Sheen (2002) conclude that the RBA was cautious in choosing when to intervene and
that its intervention stabilised the volatility of Australian dollar. In contrast, Kim
(2003) claims important effects from intervention in a VAR model that allows for the
possible interactions between exchange rate intervention and monetary policies.
Kim’s results are unusual and questionable, but they highlight the need for further
research on this issue.
Even though most empirical studies do not provide the best theoretical model of
intervention, economists usually interpret their results as evidence of a broad
signalling channel. These results clearly show a high frequency (daily) relationship
between foreign exchange intervention and exchange rates.
Simatete (2004) investigates the effect of central bank intervention on the Zambian
kwacha. She used a GARCH (1,1) model simultaneously estimating the effect of
intervention on the mean and variance. She finds that central bank intervention in the
foreign exchange market increases the mean but reduces the volatility of the Zambian

AJEP, Vol.15, No.1 June 2008 25
kwacha. The explanation supports the ‘speculative bandwagon’ and a ‘leaning against
the wind’ strategy. Although there is no attempt to distinguish through which channel
intervention works, she argues that this is more likely to be a signalling affect rather
that a portfolio balance.
Many researchers also consider the second moment of the exchange rate process
finding that intervention typically increases currency volatility. They often interpret
this finding has evidence of a destabilising effect, but in a market that has information
imperfections, volatility may be associated with transmission of new information. If
so, one would expect an increase in exchange rate volatility around intervention
periods.
4.0 Methodology
In both macroeconomic and financial economics, empirical research is based on time
series, and time series is generally viewed as stochastic processes. The model builder
is therefore allowed to use statistical inference in developing and testing equations
that describe the relationships between economic variables. The two key properties of
many economic time series that have been common in research work are
nonstationarity and time-varying volatility. Foreign exchange market intervention
falls under the second property, as such an action would result into unpredictable
volatility. Researchers have attempted to model foreign exchange market intervention
using various methodologies and approaches. The broad range of techniques present
researchers with different types of problems about which anyone assessing their
results needs to be careful. The main problem in all empirical research on intervention
is the simultaneous determination of official intervention and exchange rate changes.
4.1 Alternative approaches
In this study we considered a number of approaches to modelling foreign exchange
market intervention and economic responses.
Event study: an incident of intervention is defined as a period of days with official
intervention in foreign exchange in one direction, including up to ten days of no

AJEP, Vol.15, No.1 June 2008 26
further intervention between the initial and subsequent intervention transaction. It
requires systematic intervention transactions (Humpage, 1999). A quick look at
Malawi’s experience shows that intervention transactions are not systematic. It takes
long periods between one official purchase or sale of foreign exchange to the next.
VAR models: structural VAR models have been used to identify dynamic responses of
an economy to particular shocks and this reveals the information about the dynamic
properties of the economy that is being investigated. The results can be used to
inform policy makers and economic forecasters how economic variables such as
exchange rate and prices respond over time to changes in policy or other events.
However, the discrete values and periodic nature of intervention make it difficult to
estimate parameter values of reaction functions in a VAR (Kim, 2003).
Econometric model: lagged models are inappropriate since intervention appears to
affect exchange rate movements within minutes and hours (Humpage, 1999).
The GARCH/ARCH models: ARCH Volatility in asset returns and exchange rates
tend to gather around their marginal distributions. Modelling such time varying
volatility was initiated by Robert Engel through autoregressive conditional
heteroskedasticity (ARCH). In order to go around this problem Bollerslev (1986)
proposed a generalised ARCH or GARCH (p, q) model. This is the model we adopt
in this study, it is particularly favoured to take account of variance correlations
typically found in financial data. The Generalised Autoregressive Conditional
Heteroskedastic (GARCH) model is robust to various types of misspecification, can
simultaneously model conditional mean and conditional (Edison, 1999).
4.2 The adopted methodology
We adopt the GARCH methodology. The first-order (p=q=1) GARCH model,
suggested by Taylor (1986), has since become the most popular ARCH model in
practice. Compared to the Engel’s basic ARCH model, the GARCH model is a

AJEP, Vol.15, No.1 June 2008 27
useful improvement that allows a parsimonious specification. The GARCH (p, q)
model on which the study is based takes the form:
∑ ∑= =
−− ++=q
i
p
iitiitit hh
1 1
220
2 )()( βεαα (1)
where α0>0, αi≥0 for i=1,2, …., q and b≥0 for i=1,2,….,p. The GARCH (p, q) model
successfully captures several characteristics of financial time series such as volatility.
The study estimates and tests ARCH models, that is, builds the ARCH into GARCH
(p, q) model using the Eviews. Initially we regress y on x by OLS and obtain the
residuals {εt}; then we compute the OLS regression ε2t=α0+α1ε2
t+…+αpε2t-p+error;
and test the joint significance of α…α1. The hypothesis of interest is the extent to
which changes in the conditional mean and conditional variance are associated with
changes in the intervention variable. The general formulation of the model follows
Edison and Liang (1999); but adjusted to suit the Malawi situation:
∆EXt = σ0 + + σ1NSt + σ2PDRSA+ σ3EP+σ4DMV+εt (2)
ε t | It-1| ∼ N (0, ht) (3)
ht = βo + β1 NS+ σε2 t-1 + δ h t-1 (4)
Where ∆EXt = log change in Malawi kwacha/United States dollar (MK/US$), NS is
net sales of foreign exchange (representing intervention), PDRSA is inflation
differential between Malawi and Republic of South Africa (RSA), EP is parallel
exchange rate premium, DMV is dummy variable for seasonal trends in exchange
rates, ε is a regression disturbance (forecast error), ⏐⏐is absolute value operator, It-1 is
information set through time t-1, h is the time-varying variance ofε.
Equation 2 measures the direct effect of net sales of foreign exchange (US dollars),
price differential, exchange rate premium and seasonal factors on exchange rate
changes. A positive coefficient on intervention variable indicates that net sales of the
foreign currency (NS) depreciate the Malawi kwacha. Equation 3, (ε t | I t-1 | ∼ N (0,

AJEP, Vol.15, No.1 June 2008 28
ht) states that the regression residuals will be modeled as a GARCH process.
Equation 4 describes the conditional variance. The parameters of the model will be
estimated using the quasi-maximum likelihood approach of Bollerslev and
Wooldridge (1992), which yields standard errors that are robust to non-normality in
the density function underlying the residuals. Parameters σ and δ in equation 4 are for
the ARCH and GARCH terms, respectively. The ARCH term (ε2t-1) measures
volatility from previous period measured as a lag of the squared residual from the
mean equation. The GARCH term (ht-1) measures the last period’s forecast variance.
4.3 Data
We use monthly data series which includes exchange rate (EX), net sales of foreign
exchange as intervention variable (NS), inflation differential between Malawi and
RSA (PDRSA), parallel exchange rate premium (EP) and dummy variable for
seasonality in exchange rate developments (DMV). We use nominal bilateral
exchange rate of the Malawi kwacha against the US dollar. Parallel exchange rate
premium is the difference between official exchange rate and parallel exchange rate.
All variables are expressed in logs except for net sales.
5.0 Estimation and Results
5.1 Time Series properties of the data
We first conduct a descriptive analysis of the data for the first part of the study.
Table 1 shows that the variables do not follow a normal distribution. The second
step is to test for unit root in the variables.
Table 1: Data distribution
Variable Mean SD Skewness Kurtosis Normality
NS 5.071250 14.606000 -0.467366 4.067161 4.192828

AJEP, Vol.15, No.1 June 2008 29
EX 101.4513 17.29165 -0.341316 1.957089 3.236769
PDRSA 4.950000 3.727463 0.680481 2.398785 4.612578
EP 10.82800 7.367356 -0.056362 2.293603 1.066048
Table 2: Phillips Perron Unit root test Variable Level 1st Difference
EP -1.5877054 -7.391786*
EX -2.289211 -5.096791*
NS -6.293474*
PDRSA -1.486199 -5.478247*
Where * implies that the variable is significant at 5 percent level of significance
The results show that variables such as exchange rate (EX), exchange rate premium (EP),
and price differential between Malawi and South Africa (PDRSA) are non-stationary
(integrated of order one) and thus become stationary after first difference. On the other
hand, net sales of foreign exchange (NS) is stationary (integrated of order zero)
The next step is to find out whether RBM intervention (net sales of foreign exchange) in
foreign exchange market in Malawi affects the kwacha. Seasonal dummies are introduced
for seasonal trends in kwacha movements. We set off by running an OLS equation of the
exchange rate deprecations on a constant, the net sales of foreign exchange, parallel
exchange rate premium and inflation differential (to take care of balance of payments
pressure) and seasonal dummy variable (to take care of seasonal trends in kwacha
fluctuations). The results are indicated in table 2 below.
Table 3: Conditional Mean Equation
Coefficient Std. Error t-statistic prob
C 0.001440 0.006191 0.232587 0.6172
DMV 0.006142 0.00753 0.814969 0.2195
AJEP, Vol.15, No.1 June 2008 30
∆LNPDRSA (-1) 0.006078 0.003003 2.024214 0.04452
∆EP 0.000416 0.000922 20.451010 0.6822
NS 0.001467 0.000255 1.834534 0.0343
R-squared 0.414862
D_W test 1.525484
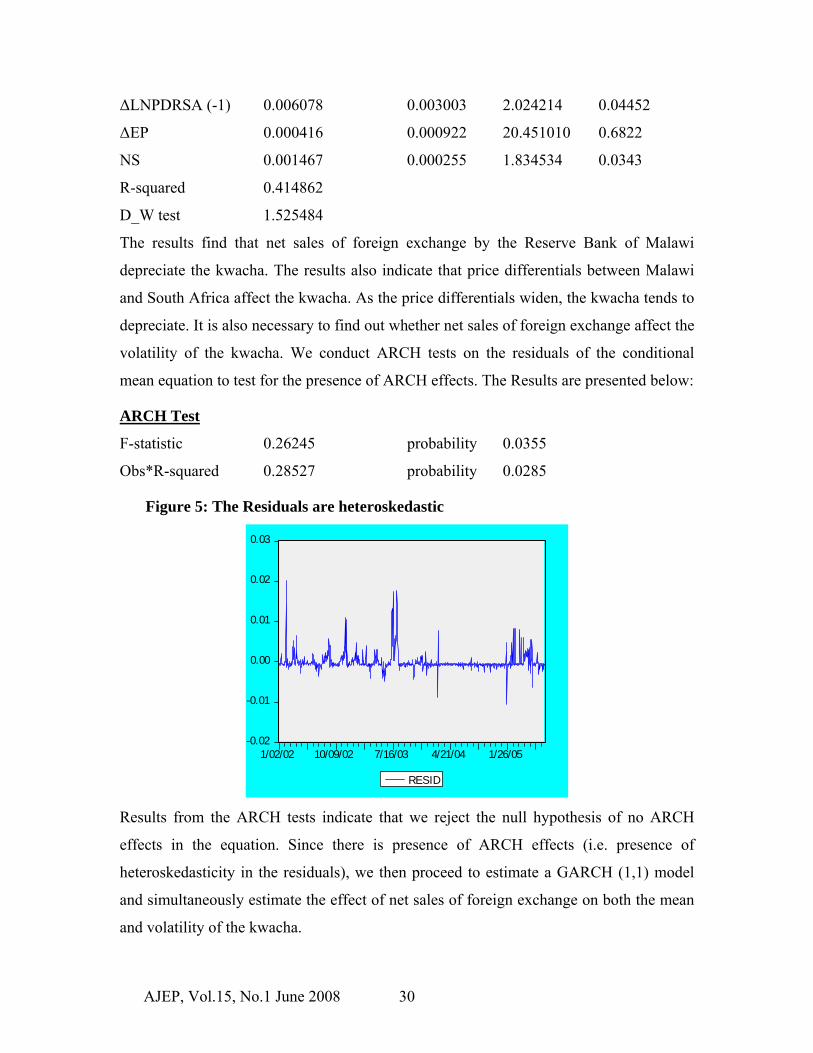
The results find that net sales of foreign exchange by the Reserve Bank of Malawi
depreciate the kwacha. The results also indicate that price differentials between Malawi
and South Africa affect the kwacha. As the price differentials widen, the kwacha tends to
depreciate. It is also necessary to find out whether net sales of foreign exchange affect the
volatility of the kwacha. We conduct ARCH tests on the residuals of the conditional
mean equation to test for the presence of ARCH effects. The Results are presented below:
ARCH Test
F-statistic 0.26245 probability 0.0355
Obs*R-squared 0.28527 probability 0.0285
Figure 5: The Residuals are heteroskedastic
-0.02
-0.01
0.00
0.01
0.02
0.03
1/02/02 10/09/02 7/16/03 4/21/04 1/26/05
RESID
Results from the ARCH tests indicate that we reject the null hypothesis of no ARCH
effects in the equation. Since there is presence of ARCH effects (i.e. presence of
heteroskedasticity in the residuals), we then proceed to estimate a GARCH (1,1) model
and simultaneously estimate the effect of net sales of foreign exchange on both the mean
and volatility of the kwacha.

AJEP, Vol.15, No.1 June 2008 31
In this study, we use GARCH method to model the heteroscedastic errors in our
conditional mean equation. Compared to the Engel’s basic ARCH model, the GARCH
model is a useful improvement that allows a parsimonious specification (it is robust to
various types of misspecification. This approach is also beneficial because it allows us to
simultaneously test the effect of intervention on both the mean and conditional volatility
of kwacha. The results are indicated in the table below:
Table 4: GARCH estimation of exchange rate
Conditional mean equation
Coeff. Std.Error z-statistic prob.
NS 0.005180 0.000131 1.380607 0.0474
∆LNPDRSA (-1) 0.001694 0.001685 3.973908 0.0001
∆EP (-1) 0.000436 0.000558 0.780752 0.4349
DMV 0.004593 0.003486 1.139680 0.2544
C 0.004593 0.003393 1.353630 0.1759
Conditional variance equation
C 2.5206 1.298662 0.19415 0.6584
NS -1.6289 0.35658 0.20635 0.0025
ARCH (ε2 t-1) 0.056893 0.010376 -5.426136 0.0000
GARCH (h t-1) 1.073047 0.031253 34.33400 0.0000
The results show that net sales of foreign exchange by the Reserve Bank of Malawi
depreciate the kwacha. This effect is very small, however. When the RBM sells foreign
exchange with the intention of appreciating the kwacha, the kwacha depreciates instead.6
Since the Malawi economy has low levels of foreign reserves, and considering that most
6 This reflects an endogeneity problem. In other words, we are picking up influences from an RBM reaction function rather than isolating the impact of intervention. This suggests that RBM is choosing a positive value for NS whenever it thinks EX is going to be too big. What we are estimating is some combination of intervention parameter and reaction function parameter.

AJEP, Vol.15, No.1 June 2008 32
foreign exchange sales are conducted during the lean period of foreign exchange, the
result suggests that the Reserve Bank foreign exchange sales are simply meant to reduce
the rate of depreciation of the kwacha. In literature, this result is generally interpreted as
‘leaning against the wind.’ In other words, the Reserve Bank foreign exchange sales are
simply meant to reduce the rate of depreciation of the kwacha.
ion
We may also suspect that the results are reflecting speculation in the foreign exchange
market. Typical of small economies, even after a Reserve Bank sale, the dollar tends to
quickly dry out on the market due small magnitudes of foreign exchange sales. What
happens is that market speculators tend to buy as much foreign exchange as is possible
after foreign exchange sales by the Reserve Bank and then withhold the foreign exchange
till the exchange rate rises again and then they sell afterwards7. This form of speculation
may be the result of the fact that since the kwacha was floated in February 2004, the
nominal exchange rate has on continuously been on the depreciating trend (from K4.5/US
dollar in 1994 to K138.65/US dollar as of end August 2006).
It must however be noted that, while the effect of net sales of foreign exchange on the
kwacha is statistically significant, it is not economically significant. In particular, for the
full sample period, a US$10 million sales of foreign exchange is associated with a rather
0.05 percent depreciation of the Malawi kwacha.8
The results also indicate that price differentials between Malawi and South Africa affect
the kwacha. As price differentials widen, the kwacha tends to depreciate. It must be noted
that South Africa is Malawi’s major trading partners with a weight of bout 48 percent. So
any price differentials between the two countries have consequent effects on the kwacha.
Similarly, higher exchange rate premium tend to depreciate the kwacha.
We also find that RBM intervention decreases the volatility of the kwacha as evidenced
by the negative sign of net sales of foreign exchange variable in the variance model. This
7 See Simatele (2004) 8 This result is consistent with findings by Edison (1999)

AJEP, Vol.15, No.1 June 2008 33
implies that the Reserve Bank of Malawi is able to achieve its goal of smoothing out
fluctuations of the kwacha. From the graphical exposition of the exchange rate
movements, it is clear that he Reserve Bank of Malawi was able to stabilize the kwacha
successfully in the larger part of the year 2004. A policy decision was taken in August
2003 to stabilize the Kwacha at a rate of K108.94 against the United States dollar. The
decision was in response to serious economic disequilibrium or instability following the
suspension of the first IMF- PRGF and the resultant droughts in the early 2000s. The
kwacha–US dollar exchange rate remained largely unchanged from August 2003 until
mid-March 2005 when a series of adjustments saw the Kwacha resting at K123 against
the United States dollar. The Kwacha then stabilized at those levels until early 2006,
when economic conditions necessitated a further review. The ARCH (σ) and GARCH (δ)
terms are both positive and statistically significant.
6.0 Policy Implications and Conclusion The paper analyses the effectiveness of foreign exchange market interventions carried out
by the Reserve Bank of Malawi. The paper uses monthly data of Reserve Bank of Malawi
intervention (net sales of foreign exchange), and exchange rate data, among others, over a
four year period. We start off by running a conditional mean equation using changes in
exchange rate as regressor. The results show the presence of ARCH effects. With the
presence of ARCH effects, we then move ahead to run a GARCH (1,1) model by quasi-
maximum likelihood. In line with similar findings elsewhere in the literature, the paper
finds that net sales of dollars by the Reserve Bank of Malawi depreciate, rather than
appreciate, the kwacha. This effect is very small however. Moreover, the paper also finds
that the Reserve Bank of Malawi intervention reduces the volatility of the kwacha.
This shows that the Reserve Bank of Malawi actually achieves its objective of smoothing
out fluctuation of the kwacha. This can be evidenced by the stability of the kwacha in a
larger part of 2004. Thus intervention is, to some extent, used as an effective tool for
moderating fluctuations of the Malawi kwacha. However, its effectiveness is constrained
by the amounts of foreign exchange reserves, which are usually low. In the short-term,
therefore, the Bank has to do a lot of balancing in managing the exchange rate to ensure
AJEP, Vol.15, No.1 June 2008 34
that the achievement of a stable exchange rate, which is good for the economy, does not
come at the expense of inflation and the depletion of foreign reserves. In the medium to
long-term, efforts must be directed at transforming the economy into a producing and
exporting one so that enough foreign exchange is generated to ensure success of foreign
exchange interventions.
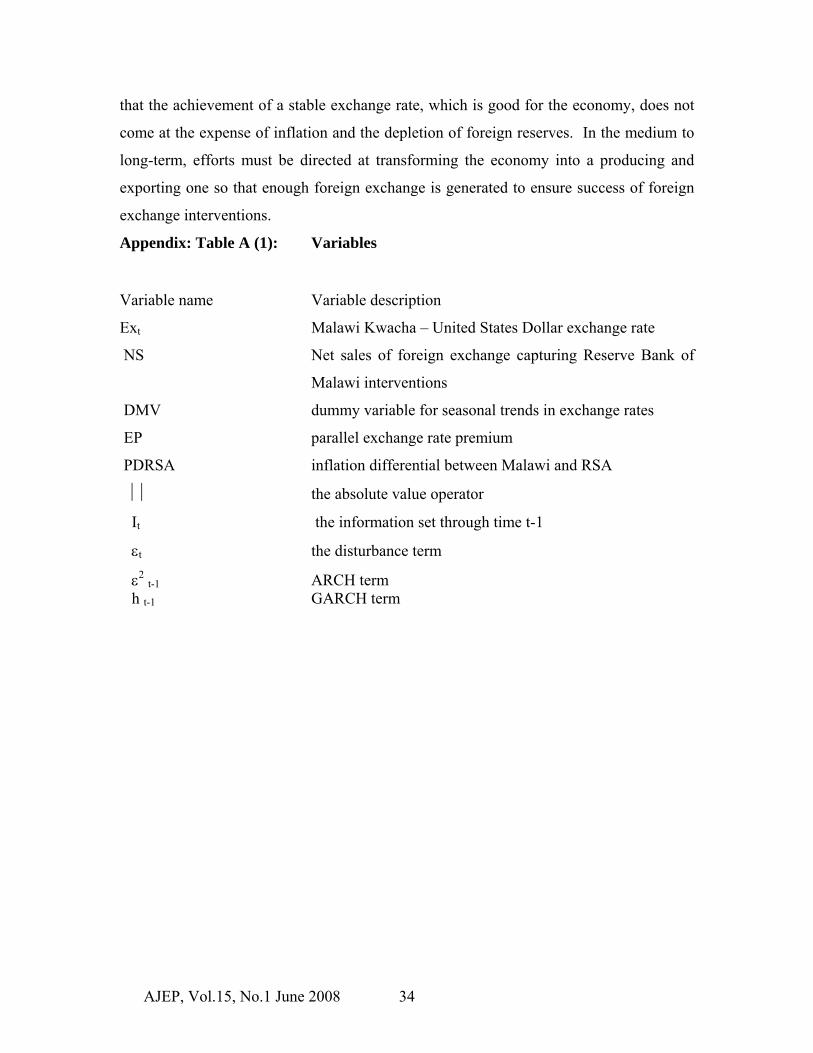
Appendix: Table A (1): Variables
Variable name Variable description
Ext Malawi Kwacha – United States Dollar exchange rate
NS Net sales of foreign exchange capturing Reserve Bank of
Malawi interventions
DMV dummy variable for seasonal trends in exchange rates
EP parallel exchange rate premium
PDRSA inflation differential between Malawi and RSA
⏐⏐ the absolute value operator
It the information set through time t-1
εt the disturbance term
ε2 t-1 ARCH term h t-1 GARCH term

AJEP, Vol.15, No.1 June 2008 35
Reference
Andrew, R., and J. Broadbent, 1994, ‘Reserve Bank Operations in the Foreign Exchange
Market: Effectiveness and Profitability,’ Research Discussion Paper 9406 (Sydney:
Reserve Bank of Australia).
Ballie, R. and X. Osterberg (1997). Central bank intervention and risk in the forward
market. Journal of International Economics 43
Beine, M., et al. (2002) Central Bank intervention and foreign exchange rates: New
evidence from figarch estimations. Journal of International Money and Finance 21
Bonser – Neal, C., and G. Tanner, 1996, ‘Central bank Intervention and Volatility of
Foreign Exchange Rates: Evidence from Options Market,’ Journal of International
Money and Finance, Vol. 15, pp. 853 – 78.
Dominguez, K.M., 1998, Central Bank Intervention and Exchange Rate Volatility,
Journal of International Money and Finance, Vol. 17, pp. 161-90.
Dominguez, K. and J.A. Frankel (1993). Does foreign exchange intervention matter? The
portfolio effect. American Economic Review 83 (5)
Edison, H. 1993. The Effectiveness of Central Bank Intervention: A Survey of the
Literature after 1982. Princeton University, Special Papers in International Economics,
No. 18.

AJEP, Vol.15, No.1 June 2008 36
Edison, H.J., and Liang H. 1999, ‘Foreign Exchange Intervention and the Australian
Dollar: Has It Mattered? IMF Working Paper, WP/03/99.
Friedman, M., 1953, ‘The case of Flexible Exchange rates,’ in Essays in Positive
Economics, Ed. By M. Friedman, (Chicago: Chicago University Press).
Humpage, O, F (2003), ‘Government Intervention in the Foreign Exchange Market,’
Federal Reserve Bank of Cleveland Working Paper 0315
Hung, J.H. (1997). Intervention strategies and exchange rate volatilities: a noise trading
perspective. Journal of International Money and Finance 16(5)
IMF Country Report No. 04/380, Malawi, December 2004
Kearns, J., and R. Rigobon, 2002, ‘Identifying the Efficacy of central Bank Interventions:
The Australian Case,’ NBER Working Paper No. 9062 (Cambridge, Massachusetts:
National Bureau of Economic Research)
Kim, S-J., T. Kortian, and J. Sheen, 2000, ‘Identifying Central Bank Intervention and
Exchange Rate Volatility – Australian Evidence,’ Journal of International Financial
Markets, Institutions and Money, Vol. 10, pp. 381 – 405.
Kim, and J. Sheen 2002, ‘The Determinants of Foreign Exchange Intervention by Central
Banks: Evidence from Australia,’ Journal of International Money and Finance, vol. 21,
pp.619-49.
Kim, Soyoung. 2003. Monetary Policy, Foreign Exchange intervention, and the
Exchange Rate in a Unifying Framework. Journal of International Economics, 60:355-
386.

AJEP, Vol.15, No.1 June 2008 37
Makin, A. J. and J. Shaw, ‘The Ineffectiveness of Foreign Exchange Market Intervention
in Australia,’ Asian Economies, Vol. 26, pp. 82-96.
Mathisen, J, (2003), ‘Estimation of the equilibrium Real Exchange Rate for Malawi,’
IMF Working papers 03/104
Mussa, M. 1981. The role of Official Intervention. Occasional Paper No. 6 New York:
Group of Thirty.
Reeves, Silke Fabian. 1997. Exchange Rate Management when Sterilized Interventions
Represent Signals of Monetary of Monetary Policy. International Review of Economics
and Finance. 6 (4): 339-360.
Reserve Bank of Malawi, Financial and Economic Reports, various issues.
Reserve Bank of Malawi, ‘Monetary Policy and Exchange Rate Management,’ RBM
Report, Blantyre, Malawi
Rogers, J. M. and P.L. Siklos, 2003, ‘Foreign Exchange Market Intervention in Two
Small Open Economies: The Canadian and Australian Experience,’ Journal of
International Money and Finance
Simatele M, 2004, ‘Foreign Exchange Intervention and the Exchange Rate in Zambia,’
Economics Studies, Goteborg University.
Van Hagen, J (1989). Monetary targeting with exchange rate constraints: The
bundesbank in the 1980s. Federal Reserve Bank of St. Louis.
Westeroff, F.H. (2001). Speculative behaviour, exchange rate volatility and central bank
intervention. Central Eastern Journal of Operations Research 9.

AJEP, Vol.15, No.1 June 2008 38