The Rationale for SEA to Overcome the Inadequacy of Environmental Assessment in Bangladesh
Upload
khangminh22Category
view
4download
0
IMPROVED INTERNATIONAL COMPARISONS O F REAL PRODUCT
AND ITS COMPOSITION: 1950-1980
University of Pennsylvania
A set of international comparisons is developed for 124 countries over the three post World War I1 decades, 1950-80. A Data Table is presented which gives, for most countries and most years, real product estimates for three different national income concepts and for the major subaggregates consumption, investment, and government. Detailed comparative price level estimates are provided as well.
The inadequacy of foreign exchange rates as a basis for international com- parisons is well-known.' This article gives comparisons more satisfactorily derived for a wide range of countries covering three post World War I1 decades. A large Data Table presents, for most countries and time points, a set of estimates of quantities and prices. The quantities in each year, made comparable across countries through the use of a common set of world average relative prices ("international prices"), are given for three different price concepts: constant 1975 international prices; current year international prices; and to allow for changes in the terms of trade, constant 1975 international prices for domestic absorption but current international prices for the net foreign balance. Accom- panying each constant 1975 international price real output estimate is a breakdown of the total into the real shares devoted to consumption, gross domestic investment, government, and the net foreign balance. Price data relating to each country in each year is given in the form of estimates of the price levels of total output and of each of the three major subaggregates.
What sets off this new research effort from our previously published cohesive set of international comparisons2 is: (1) it covers 9 centrally planned economies
*A. Heston, on leave from the University of Pennsylvania, is currently serving as Chief of the International Price Statistics Section of the United Nations Statistical Office. The research underlying this paper was made possible by the World Bank's support of the International Comparison Unit at the University of Pennsylvania, and by a grant from the National Science Foundation. The help of Gottfried Baldwin of the Foreign Demographic Analysis Division of the U.S. Census Bureau and Daniel Bond of Wharton Econometric Forecasting Associates is gratefully acknowledged, and dis- cussions with Hugo Krijnse Locker and Irving B. Kravis were most helpful. Furthermore, the authors are indebted to Douglas 0. Walker for making available the "UN tape" and for a number of useful discussions. The estimates of gross national product per capita for the socialist countries appearing in Panel B of the Data Table were prepared jointly with Irving B. Kravis. The substantial computations were carried out by Martin Shanin, T. Fukui and Ju-Yong Park.
'See Clark (1940), Gilbert, Kravis (1954), Gilbert and Associates (1958), and Kravis, Heston, Summers (1982). Also see footnote 7 below.
'summers, Kravis, Heston (1980). A set of per capita gross domestic product and gross domestic income estimates was constructed for Kravis, Heston, Summers (1982) to make comparisons over time of the affluence of collections of countries grouped by stage of development.

not previously included and all years from 1950 to 1980; (2) it develops a structural relationship between purchasing power parities and exchange rates based upon a more extensive data set than'was previously available and takes account of the variability of exchange rates over time; (3) it averages reasonably independent 1970 and 1975 "shortcut" estimates of per capita income for each of 85 countries in such a way as to allow for the differences in statistical precision of the estimates of the two years; (4) it follows a disaggregate intertemporal extrapolation methodology which better tracks the changes in shares over time, and explicitly measures the effects of changes in the terms of trade; and (5) it provides a method for replicating benchmark comparisons in current year prices for 115 market economies. In addition, the benchmark estimates of the United Nations Com- parison Project (ICP) upon which all of the estimate of this paper rest have been updated to take account of recent national accounts revisions.
The description of the general development of the Data Table is organized as follows: section I1 deals with estimates for 115 market economies and section I11 with estimates for nine centrally planned economies. Section I1 is divided between Parts A and B dealing with estimates of real gross domestic product per capita (RGDP) in 1975 and its subaggregates, consumption, gross domestic investment, government, and the net foreign balance; Part C, which is concerned with intertemporal extrapolations; and Part D, where price level estimation is described. Section IV interprets various aspects of the Data Table including its precision, and section V concludes the paper with a brief attempt to place this research in perspective.
A detailed outline of the precise procedures followed in constructing the Data Table is available on request from the authors. A computer tape containing the Data Table (updated to 1981) and supplementary information can be obtained as well to facilitate a reader's use of the information in the Data Table in his/her own research.
All market economy estimates have been derived from the data base of the ICP and national accounts data provided by the United Nations Centre for Development Planning. (We speak below of these latter numbers as residing on the "UN tape" as of December 1983). All ICP data were adjusted to conform to the United Nations data set.
A. Estimates of Real Per Capita Gross Domestic Product (RGDP) for 1975 Benchmark Countries
Of the 115 market economies appearing in the Data Table, 30 have received a full benchmark treatment by the ICP for 1975, along with 4 of the 9 centrally planned economies (CPEs). This 34-country3 comparison of real product for 1975, based upon world average relative prices in 1975, is described in detail in
3 ~ h e 34 ICP countries are Austria, Belgium, Brazil, Colombia, Denmark, France, Germany (F.R.), Hungary, India, Iran, Ireland, Italy, Jamaica, Japan, Kenya, Korea, Luxembourg, Malawi, Malaysia, Mexico, Netherlands, Pakistan, Philippines, Poland, Romania, Spain, Sri Lanka, Syria, Thailand, United Kingdom, United States, Uruguay, Yugoslavia, and Zambia.

Kravis, Heston, Summers (1982) (henceforth referred to as simply KHS). The 1975 entries in the RGDP column of the Data Table for these countries differ slightly from the corresponding Table 6.5 entries of KHS because of data revisions of national currency consumption, investment, government, and the net foreign balance subsequent in 1980; and because of a modification of the ICP's method of valuing each country's net foreign balance.
Non-benchmark Countries
A structural relationship between the purchasing power parity (PPP) for all of GDP of a country and its exchange rate was developed in Kravis, Heston, Summers (1978) and used again in Summers, Kravis, Heston (1980) to estimate the real gross domestic product per capita of a country for which only regular national accounts data are a~a i lab le .~ This relationship was based upon the ICP's 1970 real income comparison for 16 countries. The 1975 data on the 34 countries in the ICP data base make possible the estimation of the structural relationship for 1975. KHS, pp. 332-341, provides a detailed discussion of the relative merits of the 1970 and 1975 relationships, both of which were used in that volume in estimating 1975 RGDP for non-benchmark countries. A revised approach is used here for estimating 1975 RGDP for these countries. First, the cross-section regressions for the two years have been run in terms of per capita domestic absorption (DA) instead of per capita GDP as previously. DA is a more suitable concept for the cross-sections because the estimation of real expenditure shares devoted to consumption, investment, and government draws upon estimates of DA rather than GDP. Getting good real share estimates is important in itself, of course (half the entries in the Data Table refer to shares), but more critical, all of the intertemporal extrapolations-national product, national income, and the components-depend upon the 1975 real share estimates. The theoretical under- pinning of the cross-section structural relationship (the "productivity differential" model of KHS, pp. 332-33) provides limited guidance on the choice of DA versus G ~ P , so we have worked with DA even if it may not give as good a basis for estimating a non-benchmark country's RGDP for the year of the cross-section. Besides shifting to a domestic absorption basis, the present procedures differ from the previous ones in two respects: (i) a slightly different functional form for the regression is used6 and (ii) the 1970 and 1975 cross-section results are combined to get a single 1975 estimate in a more satisfactory way. The extrapola-
4 ~ h e relevant numbers in KHS are those based upon the System of National Accounts (SNA). The ICP's classification system for consumption and government differs from the SNA, but the entries of the Data Table, total output as well as consumption, investment, and government shares described below, all refer to the SNA concept.
' ~ a r l i e r examinations of this relationship were carried out by, among others, Clague, Tanzi (1972) and David (1973). Summers and Ahmad presented a paper on this subject entitled "Real G N P of 150 Countries in 1970 and 1972; The World Bank Atlas Revised "at the San Francisco 1974 meeting of the Econometric Society. The latter two were done in the same spirit as the present work, though David was not specifically attempting to estimate real per capita G D P for new countries from their exchange rate converted per capita GDPs.
6 ~ h e openness variable (see below) in our previous cross-section regressions appeared as part of an interaction term and here it is introduced additively. Furthermore, the constant terms in both 1970 and 1975 are not significantly different from zero so they have been suppressed. This simplifies the equation, and also makes the actual and estimated values for the numeraire country, the United States, the same.
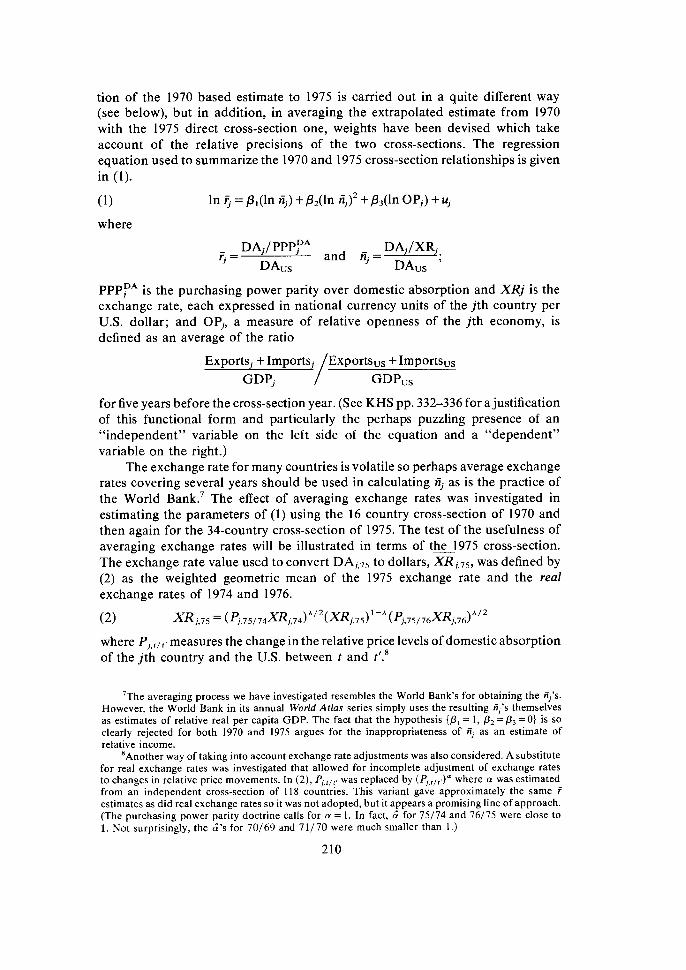
tion of the 1970 based estimate to 1975 is carried out in a quite different way (see below), but in addition, in averaging the extrapolated estimate from 1970 with the 1975 direct cross-section one, weights have been devised which take account of the relative precisions of the two cross-sections. The regression equation used to summarize the 1970 and 1975 cross-section relationships is given in (1).
where
r. = - DA,/PPP?~ DA,/XR,
and % = I DAus DAus '
PPP?~ is the purchasing power parity over domestic absorption and XRj is the exchange rate, each expressed in national currency units of the jth country per U.S. dollar; and OP,, a measure of relative openness of the jth economy, is defined as an average of the ratio
Exports, GDP,
for five years before the cross-section year. (See KHS pp. 332-336 for a justification of this functional form and particularly the perhaps puzzling presence of an "independent" variable on the left side of the equation and a "dependent" variable on the right.)
The exchange rate for many countries is volatile so perhaps average exchange rates covering several years should be used in calculating $ as is the practice of the World ~ a n k . ~ The effect of averaging exchange rates was investigated in estimating the parameters of (I) using the 16 country cross-section of 1970 and then again for the 34-country cross-section of 1975. The test of the usefulness of averaging exchange rates will be illustrated in terms of the1975 cross-section. The exchange rate value used to convert DAi,7, to dollars, XRj,,,, was defined by (2) as the weighted geometric mean of the 1975 exchange rate and the real exchange rates of 1974 and 1976.
where Pj, , / , , measures the change in the relative price levels of domestic absorption of the jth country and the U.S. between t and t'.8
h he averaging process we have investigated resembles the World Bank's for obtaining the 5's. However, the World Bank in its annual World Atlas series simply uses the resulting ii,'s themselves as estimates of relative real per capita GDP. The fact that the hypothesis { P , = 1, P, = P, = 0) is so clearly rejected for both 1970 and 1975 argues for the inappropriateness of ii, as an estimate of relative income.
nothe her way of taking into account exchange rate adjustments was also considered. A substitute for real exchange rates was investigated that allowed for incomplete adjustment of exchange rates to changes in relative price movements. In ( 2 ) , P,,,,,. was replaced by (Pi,,,,.)" where a was estimated from an independent cross-section of 118 countries. This variant gave approximately the same F estimates as did real exchange rates so it was not adopted, but it appears a promising line of approach. (The purchasing power parity doctrine calls for a = 1. In fact, 6 for 75/74 and 76/75 were close to 1. Not surprisingly, the 6's for 70169 and 71/70 were much smaller than 1.)

The relative weights given the observed 1975 exchange rate and the 1974 and 1976 ones depend upon the parameter A in (2). Rather than setting the value of A a priori (no averaging implies A = 0; equal weighting implies A = 2/3), we allowed a non-linear least squares regression and the data to determine what A should be. For the 1975 cross-section, the weighting question was resolved unambiguously because was not significantly different statistically from zero. Therefore, fi,,,, was computed using only XRj,,,. In the 1970 cross-section, however, despite the meager force of the purc;asing power parity doctrine before exchange rates were freed up, the value of A Awas very large. Not surprisingly, the noisiness of the parity relationship made A's standard error very large too. Since the estimated value of A implies a highly implausible weighting pattern in which XR,,,, would get negative weight, it was decided simply to use A = 213. (For &at it is worth, R was not significantly different statistically from 213.) Thus XRi,,, was taken as the simple geometric mean of XRj.,, and the price-level adjusted values bf XRj,@ and XR,,,,.
The empirical equations corresponding to (1) which contribute to our final real DA per capita estimates for 1975 are given in (3) and (4).
(4) 1975: In fi = 0.559 In ii, -0.038 (In ii,)2+ 0.091 In OP, (0.059) (0.017) (0.030)
Two r estimates were obtained for each of the 85 non-benchmark countries, for 1970 from (3) and ?;:' for 1975 from (4). By an extrapolation procedure
described below, ?? was obtained from This value, ?%), was averaged geometrically with FS:) to obtain 5,,, for all 85 countries, using weights inversely proportional to the variance of error associated with the estimates for similar benchmark countries in 1975.~ The vector 5,75 is the basis for the 1975 RGDP (regarded as identical with RGDY in 1975) for the 85 non-benchmark countries, and is also used to obtain the real expenditure shares for these countries in 1975.
RGDP,,,, is equal to real domestic absorption (RDA,,,,) plus the real value of the net foreign balance (RNFB,,,,). RDA,,,, was estimated simply as 5,,, multiplied by the value of per capita DA,,,,, taken from the UN tape. Estimating RNFB,,,, involves conceptual problems, however.
One would like to convert trade flows at purchasing power parities as is done with other categories of expenditures. Unfortunately, since many items entering trade are raw materials or intermediate products, it would be a major
' ~ r r o r estimates defined by (Fj,$ - F,!::) were obtained for the 29 ICP market economies (FgA.75 = 1) for t = 1970 and t = 1975. The systematic relationship between the square of the error and Fj.7; for 1970 and for 1975 was exploited to give a basis for estimating the variances of both the 1970 and 1975 errors for each of the 85 non-benchmark countries. The relative variances of the estimated 1970 and 1975 errors provided the weights for averaging f$",' and Fj,;:'. Generally speaking, the F estimates from the 1970 cross-section had lower error variances than the 1975 cross-section for low-income countries and higher error variances for high-income countries.

research task to convert exports and imports at purchasing power parities. The next best approach would be to convert the net foreign balance at the purchasing power parity of the collection of goods and services for which the balance if positive would be expended in the future, or if negative would be exported. Implementing this approach, however, would require more knowledge about future trade patterns than is at all likely to be available. The alternative adopted here is to convert the net foreign balance at the exchange rate on the grounds that at the margin this is the conversion factor for an increment to the net foreign balance. (This is equivalent to setting the international price of a dollar's worth of net balance at l.)1° Thus RGDPj,75 = 4,75 . DAUS,75+NFBj,75/XRj,75
B. Estimates of Expenditure Shares of Non-Benchmark Countries for 1975
The real expenditure shares devoted to consumption, gross domestic invest- ment, and government for the 30 benchmark countries of the ICP appearing in the Data Table are based upon the updated GDP and subaggregate entries in the SNA section of Table 6.5 of KHS (except for the modification in the treatment of the net foreign balance described above). The shares for the other 85 countries were obtained using a set of structural equations relating real shares and the level of income. (In fact, these variables relate to DA rather than GDP.) The parameters of the structural equations, estimated from the real and nominal share data for the 34 ICP countries, appear in ( 9 , (6) and (7).
The variables on the right denoted by double letters are nominal shares (i.e., shares calculated from the 1975 national currency values); a,, is the real value relative to the U.S. of domestic absorption; and the variables on the left are real share (i.e., shares calculated from expenditures in 1975 international prices). The
'O~his is not the procedure that was followed in KHS and earlier phases of the ICP. Rather, the international price of a dollar's worth of net foreign balance there was a weighted average of the ratios of the exchange rate to the overall purchasing power parity calculated for the non-negative categories of GDP. This procedure was used because the aggregation technique used in KHS does not admit categories with negative expenditures. This definition of the international price for the net foreign balance was used because it parallels the treatment of other categories. However, when one solves for the international price of the net balance as part of the ICP's aggregation system, ignoring the fact that some net foreign balances are negative, the international price of the net foreign balance comes out quite differently from the ICP's method.

rationalization of these structural relationships and a description of the estimating procedures utilized is given in Summers, Kravis, Heston (1980) and will not be repeated here. The relationships were originally developed for the 1970 data of Phase I1 of the ICP, and the (5), (6), and (7) relationships fairly closely parallel the previous ones. Only the effect of income on consumption changed between 1970 and 1975; in the earlier year, variations in F had no effect on c in (5), given cc, iid, and gg.
Using (5), (6) and (7), real share values were estimated for the 85 non- benchmark countries on the basis of the national accounts data on the UN tape.
C. Extrapolations to Other Years
( 1 ) RGDP: Real Gross Domestic Product Per Capita
In Summers, Kravis, Heston (1980), RGDP,,, was extrapolated from RGDPj,,, on the basis of the constant-price GDP per capita series on the (earlier) UN tape. The extrapolations in the Data Table here have been carried out at a more disaggregated level. The UN tape's constant-price series for consumption, gross domestic investment, government, and the net foreign balance were used to get the individual real components, expressed in 1975 international dollars, for each of the years between 1950 and 1980. RGDPj was obtained simply as the sum of the components, where the net foreign balance exports and imports in 1975 were converted to dollars at current exchange rates." This new disaggregate procedure is superior to the previous one because it insures that the price weights used for consumption, investment, and government in each year in each country reflect 1975 international prices rather than the individual countries' relative prices.
The real shares for years other than 1975 are computed as the ratio of the individual real aggregate to RGDP. These estimates differ from the ones appearing in Summers, Kravis, Heston (1980) in a critical way: the previous estimates were based on the assumption that in every year the real shares were related to income and the nominal shares in accordance with the relationship observed in the year of the ICP benchmark study (1970 in Summers, Kravis, Heston (1980)). The present method depends upon no such assumption. Essentially, a real share is estimated for 1975 on the basis of the 1975 observed relationship, and the values for other years are obtained as straightforward constant-price extrapolations from the 1975 figure.
( 2 ) RGDP*: Real Gross Domestic Product Per Capita Adjusted for Changes in the Terms of Trade.
In the Data Table a counterpart to RGDP is given which takes account of a country's changing ability to use its exports to buy imports as its terms of trade change over time. This alternative real gross product per capita concept, RGDP*, still measures domestic absorption in 1975 international prices but allows for
"see footnote 10. The international price of a dollar of net foreign balance here is 1.00; the ICP's 1975 international price was 1.28. Computations have also been done on this latter basis, and are available (along with exchange rates and some other detail omitted from the Data Table) on the computer tape available from the authors.

current export and import prices in valuing the net foreign balance and thus for some purposes may be regarded as a better income variable than RGDP. '~ That the effects of changes in the terms of trade are substantial can be seen in the differences between the RGDP and RGDP* entries in the Data Table as one moves away in time from 1975, the base year. (In the base year RGDPj = RGDP*.) The method of adjustment of the net foreign balance used was that of Cour- bis/Kurabayashi, the preferred method of Gutmann (1981) and the authors. (Note though that when alternative methods were applied to examine their robustness, substantial differences were observed for a number of developing countries and oil economies.)I3
(3) RGDY: Real Gross Domestic Income Per Capita
As described above, RGDP extrapolated to years earlier and later than 1975 values each year's output in 1975 international prices. On the other hand, if a benchmark study were conducted annually, the comparisons among countries each year would be based upon the current year's international prices. Such comparisons in current year prices would be extremely useful for a variety of purposes, but each benchmark study as it is usually carried out requires a detailed collection of individual prices in each country. The prices are used to estimate purchasing power parities for detailed categories of goods, and these PPPs are combined with detailed national currency expenditure data to get overall gross product comparisons. It is not feasible to conduct such benchmark studies annually-and in any case it could not now be done directly for past years. However, operating at the quite aggregative level of consumption, gross domestic investment, and government, it is possible using the current and constant price expenditure series on the UN tape to estimate current year purchasing power parities for the broad aggregates. The parities plus the current price expenditure
' 2 ~ recent summary of the literature on this subject is provided by Gutmann (1981). h his is in contrast with Gutmann's finding that there was little empirical difference between
five methods of adjustment for terms of trade using data for 6 OECD countries from 1970 to 1977. It was found here, for example, that in the case of Iran, the 1955 ratio of RGDP* to RGDP is 0.89 as calculated using Courbis/Kurabayashi but applying the Geary 1 and Geary-Burge alternative methods give 0.90 and 0.68 respectively. In the same year the figures for Zambia were 1.35, 1.47, and 1.76 for the three methods; such differences are not surprising for a country with a large deficit or surplus and fluctuating export and/or import prices. The definitions of the methods are as follows:
Geary
Geary and Burge S = rn
X : M : x: m :
Px : P m :
X R : RGDPX =
current exports current imports current exports deflated by p , current imports deflated by p m price index for exports price index for imports exchange rate : RGDP,, + 81,/XRj,75

data on the tape can be the raw material for a set of comparisons based upon current year prices.'4
Where in KHS the ICP's aggregation procedure (the so-called "Geary- Khamis method" described on pp. 76-8) was applied to the detailed data of 150-odd categories of expenditure in 34 countries, here the same procedure can be applied to the rather aggregate data of 4 categories of expenditure in 115 countries. Thus the equivalent of a set of annual benchmark studies can be obtained.
The column headed "y" in the Data Table contains the results of these replications of benchmark studies. Specifically, for each country in a particular year, y (a percentage) equals 100 times the ratio of the country's gross product per capita to the gross product per capita of the United States, both valued in that year's international prices for the broad aggregates. The y's are to be interpreted as the equivalent of the SNA entries of Table 6.4 in KHS.
D. Price Levels
The price level for each aggregate of a country-gross domestic income, consumption, gross domestic investment, or government-is a concept designed to illuminate whether prices for the aggregate are high or low relative to those of a numeraire country, given the rate at which the currency of the two countries can be exchanged. Thus, the price level for any aggregate is equal to the ratio of the country's PPP for the aggregate to the country's exchange rate. The price levels reported in the Data Table are derived from the RGDY calculations just described. For each aggregate the price level is defined as the value of the national currency total converted at the exchange rate divided by the international dollar total valued at the international prices derived from the Geary-Khamis run for that year, all divided by the same ratio for the U.S.
bnly estimates of RGDP are presented for the nine centrally planned economies of Panel B of the Data Table. Most of these are based upon information sources outside of the ICP and United Nations.
The panel was built up in two steps: (1) 1975 RGDP expressed in 1975 international dollars was estimated for each country; (2) each 1975 RGDP was extrapolated backward to 1950 and forward to 1980.
The 1975 estimates for four countries, Hungary, Poland, Romania, and Yugoslavia, were obtained directly from the ICP (KHS, Table 1.2). The People's Republic of China figure was taken from Kravis (1981). The Soviet Union RGDP was derived from a Fisher "ideal" estimate of the Soviet Union relative to the U.S. in 1976 taken from Edwards, Hughes, Noren (1979).15 The 1975 RGDPs for the remaining three countries, Bulgaria, Czechoslovakia, and the Democratic
14 A somewhat more refined procedure along these same lines is used by the Statistical Office of the European Community (Eurostat (1983), chapter V), and a variant on it was employed in the Phase I 1 benchmark studies of the ICP.
1 5 ~ h i s Fisher index was adjusted upward to allow for the typical difference between binary and multilateral indexes in countries at the income level of the Soviet Union.

Republic of Germany were based upon 1973 estimates, derived by the physical indicator method, reported in United Nations (1980).16
The extrapolations of real per capita output were based upon three sources. Inevitably, these extrapolations could not be derived from real income time series based upon 1975 international prices. The People's Republic of China extrapola- tions for 1950-78 were based upon a GNP series of the National Foreign Assessment Center (1979); the 1979 and 1980 figures were based upon annual changes in national income reported in the Chinese government's Communiques on Fulfillment of Economic Plans for 1979 and 1980. The Soviet Union extrapola- tions were estimated from a fragmentary real GNP series in Edwards, Hughes, Noren (1979) with interpolations and extrapolations for missing years in the 1950-80 time period based upon an earlier real GNP series of Greenslade (1976). The extrapolations for Yugoslavia were derived from a GNP series in World Bank (1980). The extrapolations for the remaining seven centrally planned economies of eastern Europe were all based upon annual estimates of GDP in Alton (1982).
The source of the population figures for all countries but the People's Republic of China was Shoup (1981) as revised and updated by the Foreign Demographic Analysis Division of the U.S. Census Bureau. The figures for China, kindly supplied by John S. Aird, are the Model 2 (June 1982) projections of the same agency.
IV. THE USE OF THE DATA TABLE
Panels A and B of the Data Table cover 124 countries which together contain more than 95 per cent of the world's population. The major omissions are Cuba of the centrally planned economies and Kuwait, Libya, Saudi Arabia, and Lebanon of the market economies. (Cuba and Lebanon are not represented because of insufficient information, and the three oil-exporters have such large net foreign balances that the estimates derived from the cross-section regressions described above are highly unreliable.) Estimates are provided for all countries for the years 1960-80. The U.N. tape lacks data on half the countries in the 1950's, so the coverage is incomplete during that decade.
Market economies: Panel A
Estimates are provided for each country and each year for three national income concepts: gross product per capita measured in 1975 international prices (RGDP); gross product per capita measured in current year international prices expressed relative to that of the United States (y); and a gross product per capita figure based upon 1975 international prices which has been adjusted to take account of changes in the terms of trade over time (RGDP*). RGDP,, and RGDP; are both directly comparable across countries and time, but the y,,'s are compar- able only across countries within a year.
Estimates of the real shares of real GDP expressed in 1975 international prices allocated to consumption, gross domestic investment, and government as defined by the SNA are presented as percentages under the headings c, id, and
"%e physical indicator estimates, extrapolated forward to 1975, were increased by 4 percent to allow for the finding that the equivalent UN estimates for Hungary, Poland, Romania, and Yugoslavia were on average lower by that amount than the corresponding ICP estimates.

g. They, along with the share allocated to the net foreign balance, add up to 100 percent, so the latter share though not printed can be obtained as a residual from the other three.
Estimates of price levels defined as PPPIXR have been estimated for each country and year for all of gross product and each of the major components. These estimates all refer to the individual countries' own current prices, of course.
To enable the reader to recover the total figures from the per capita ones, the population of each country is provided for each year.
Centrally Planned Economies: Panel B
The centrally planned economies of eastern Europe and Asia measure their national incomes using a different methodology from that of the market economies. As a consequence, estimates are not available of the ten economic numbers provided for the market economies. However, by combing the CPE literature, we have brought together estimates of RGDP, measured in 1975 international prices, for 9 centrally planned economies. Some ICP information on Hungary, Poland, Romania, and Yugoslavia has been drawn upon in getting the RGDPs. But for the most part, the RGDP estimates are the work of others. The numbers are placed here for the convenience of readers needing directly comparable national income data for both market and centrally planned economies.
The Precision of the Estimates The imprecision of the national income estimates in Panel A varies consider-
ably from country to country and from year to year. In a quite subjective way we have classified countries7 estimates into four quality classes, A, B, C, and D with the relative standings D: Fair, C: Good, B: Better, and A: Best. These letter grades appear in the 1980 section of Panel A in the right-hand column headed "Q".
The classification flows from what appears to be the main sources of imprecision in the estimation process: (i) the imprecision inherent in the ICP benchmark estimates as quantified in KHS, Table 3.6, column (7); (ii) the imprecision arising from f i e use of a cross-section regression approach in making estimates for the non-benchmark countries; and (iii) closely related to (ii), the imprecision that comes from not really knowing what year's cross-section to rely on. (That is, not really knowing what weights to use in averaging the 1970-derived and 1975 cross-section estimates of F.)
The ICP imprecision is inversely correlated with real income, and the same is apparently (but less certainly) true for the noise in the cross section regression. Twice the standard errors of the regressions GU printed beneath both (3) and (4) probably indicates the maximum percentage error that might be encountered from using the cross-sections. The consideration underlying (iii) is quantified as well as it can be done by comparing the estimates of FJ,0,' with ?$?. These are presented in the 1980 section of Panel A in the column headed A. Specifically,
The A's are highly correlated negatively with real income and apparently the A's are higher for African countries than others even after controlling for income.
217

The quality ratings of the countries in Panel A reflect these considerations. Ceteris paribus, benchmark countries are rated higher than non-benchmark coun- tries; higher income countries are rated higher than lower income countries; countries with larger A's are rated lower than those with lower A's; and African countries are rated lower than non-African countries. We think these relative ratings apply specifically to RGDP in 1975, but probably apply to all of the other estimates too.
One comment on imprecision over time is in order. It is a slight exaggeration to say that RGDP,,,, is a measure in 1975 international prices of the jth country's real per capita GDP in the year t. Strictly speaking, the prices within each major component are the country's own prices (for a year that may not be the same for each country!). The 1975 international prices reflect the world average relative prices of overall consumption vs. investment vs. government. This distinction may become important as one moves from 1975 forward and backward through time. Furthermore, some countries' intertemporal price indexes are poor. These considerations suggest that the quality of estimates for years far from 1975 is likely to be lower than for years close to 1975, ceteris paribus.
Comparing Benchmark Countries with Non-Benchmark Countries For the benchmark countries the Data Table entries for 1975 are based on
the benchmark study. If the estimating procedure for non-benchmark countries for RGDP were applied to the benchmark countries, an alternative RGDP estimate would be obtained. The difference between these two estimates may be thought of as an estimation error. For the non-benchmark countries, in the absence of any specific information, the numbers in the Data Table are based on the assumption that this estimation error is zero. This means that for comparisons between benchmark and non-benchmark countries, one would usually simply compare the Data Table entries. (This would always be appropriate for com- parisons between two benchmark or between two non-benchmark countries.)
However, if the user of the Data Table is making a comparison between a benchmark country and a non-benchmark country where it is felt the estimation errors would be similar, then a factor could be applied to the Data Table entries (say, RGDP, RGDP", or y for any year) for the benchmark country to take account of the error associated with the relevant benchmark country. (This factor, given in the Notes to the Data Table for the 30 non-centrally planned ICP countries, is the ratio of the benchmark RGDP to the RGDP estimate if estimated by the procedure for non-benchmark countries.) For example, if one were comparing Malawi and Tanzania, and believed because of location, type of economy, or other reasons that the error associated with Malawi is likely to be similar to that for Tanzania, then one would multiply the Tanzania Data Table entry by 0.883, the factor given below for Malawi. Comparisons involving more than one benchmark country with one or more non-benchmark countries where errors cannot be assumed to be zero raise further complications that the reader may wish to cope with.
It is self-evident that it would be highly desirable to have a complete set of real national accounts figures denominated in a common currency covering a

large number of countries and a long period of time. The Data Table purports to provide such a set of accounts. Individual numbers in the Table are perishable because new benchmark studies in the future will reduce the number of countries that must be given a non-benchmark treatment. More than that, the new studies should improve the quality of non-benchmark estimates, either through improved estimating methods of the type used in this paper or through techniques of linking non-benchmark countries to economically adjacent ones.'' However, the extrapo- lation and disaggregation procedures followed here, while certainly improvable, are likely to have substantial staying power because the prohibitive cost of benchmark studies will inevitably leave time gaps that must be filled in.
REFERENCES Alton, Thad P. (1982), Estimates of East European Countries' GNP Structure and Growth of Factor
Cost, (prepared for the June 7-8, 1982 Workshop on CPE National Income Statistics at the World Bank, Washington, D.C.).
Clague, C. and Tanzi, V. (1972), Human Capital, National Resources and the Purchasing Power Parity Doctrine; Some Empirical Results, Economia Internazionale, February.
Clark, C. (1940), The Conditions of Economic Progress, 2nd edition, 1951, London: Macmillan. David, P. A. (1972), Just How Misleading are Official Exchange Rate Conversions, Economic Journal,
September. Edwards, L., Hughes, M., and Noren, J. (1979), U.S. and U.S.S.R.: Comparisons of GNP, Soviet
Economy in a Time of Change, U.S. Congress Joint Economic Committee, Vol. 1, GDP, October. Eurostat (1983), Comparison in Real Values of the Aggregates of ESA, 1980, Statistical Office of the
European Community, Luxembourg. Gilbert, M. and Kravis, I. B. (1954), An International Comparison of National Products and the
Purchasing Power of Currencies: A Study of the United States, the United Kingdom, France, Germany, and Italy. Paris: Organization for European Economic Cooperation.
Gilbert, M. and Associates (1958), Comparative National Products and Price Levels, Paris: Organization for European Economic Cooperation.
Greenslade, R. V. (1976), The Real Gross National Product of the U.S.S.R. 1950-75, Soviet Economy in a New Perspective, U.S. Congress Joint Economic Committee, Washington, D.C.
Gutmann, Pierre (1981), The Measurement of Terms of Trade Effects, Review of Income and Wealth, December.
Kravis, I . B., (1981), An Approximation of the Relative Real Per Capita GDP of the People's Republic of China, Journal of Comparative Economics, March.
Kravis, I. B., Heston, A., and Summers, R. (1978), Real GDP Per Capita for More Than One Hundred Countries, Economic Journal, June. - (1982), World Product and Income, Baltimore: Johns Hopkins University Press. National Foreign Assessment Center (1979), China: A Statistical Compendium, Washington D.C., July. People's Republic of China, Communique on Fulfillment of 1979 Economic Plan (1980), April 30,1980. People's Republic of China, Communique on Fulfillment of 1980 Economic Plan (1981), April 29,1981. Shoup, Paul E. (1981), 7he Eastern European and Soviet Data Handbook, New York: Columbia
University Press. Summers, R., Kravis, I. B., and Heston, A. (1980), International Comparisons of Real Product and
its Composition: 1950-77, Review of Income and Wealth, March. United Nations (1980), U.N. Bulletin for Europe, Vol. 31, No. 2, prepared by the Secretariat of the
Economic Commission for Europe, Geneva. New York. World Bank (1980), World Tables, Baltimore: John Hopkins University Press.
h he ratings of present non-benchmark countries included in new studies (like the 15 African countries in the ICP's Phase IV) will be raised at least one level, but the ratings of present benchmark countries are not likely to change. New 1980 estimates compiled by EUROSTAT (1983) following a slightly different methodology from the ICP's deviate from those in the Data Table by an average absolute value of 4.7%. (If one allows for the difference between the 1975 estimates of EUROSTAT and the ICP for the same countries, the mean absolute difference is only 3.2'/0.) A similar comparison with ECIEL 1979 estimates for 18 Latin American countries shows a somewhat larger mean absolute deviation, 11.5%. The new EUROSTAT study provides better comparisons among Economic Com- munity countries but does not allow comparisons with countries outside the Community on the basis of a consistent set of international prices. The same is true for the ECIEL study. For this reason neither set has been integrated into the Data Table.

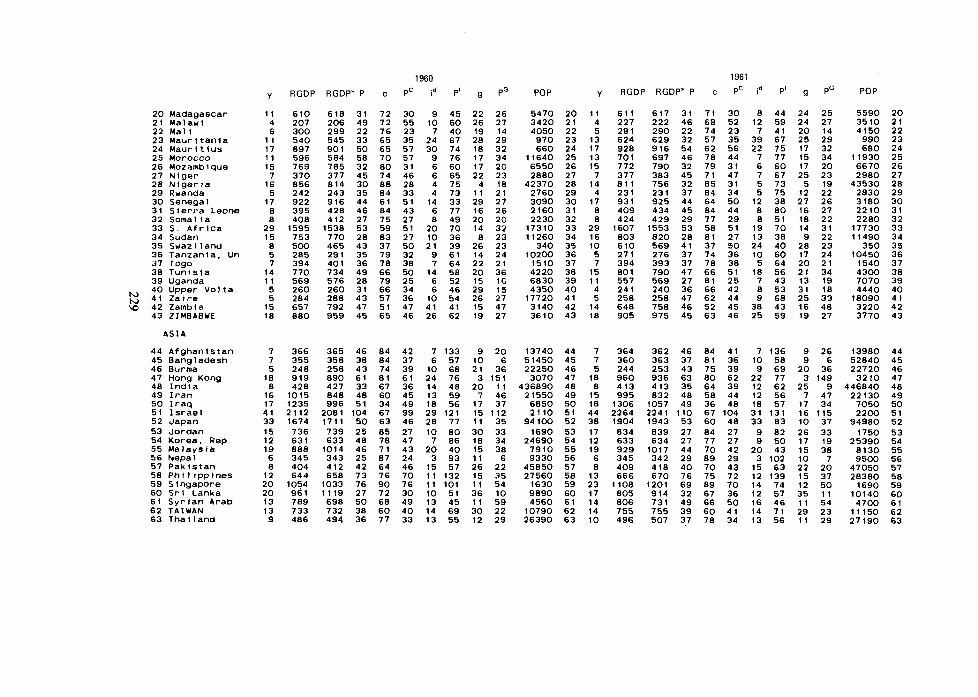
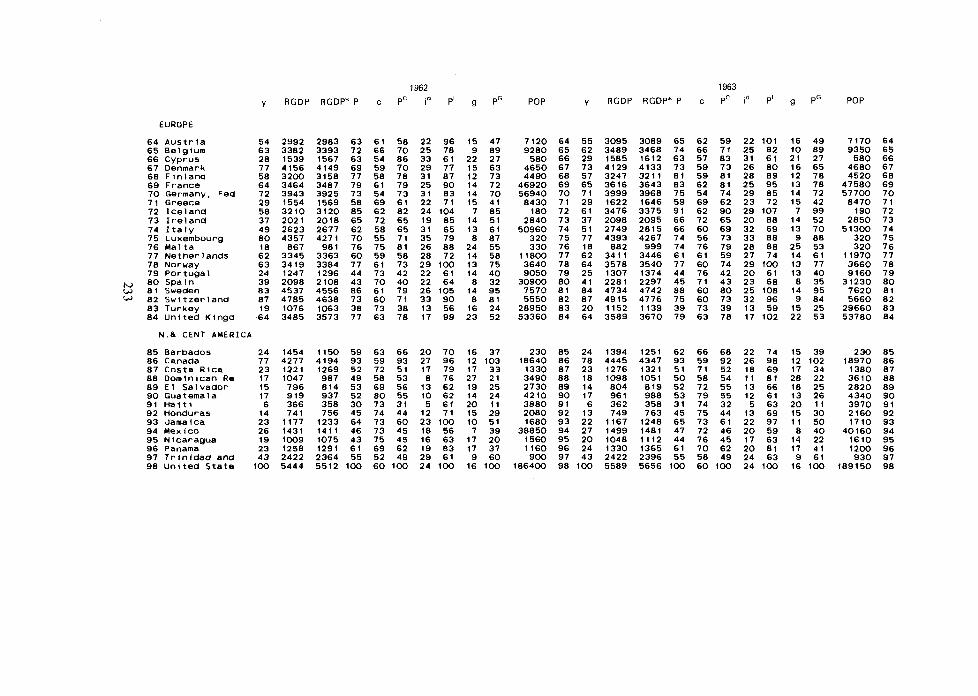
DATA TABLE
REAL PER CAPITA GROSS DOMESTIC OUTPUT AND INCOME ESTIMATES; SHARES OF REAL OUTPUT DEVOTED TO CONSUMPTION, GROSS DOMESTIC INVESTMENT A N D GOVERNMENT; PRICE LEVELS FOR GROSS DOMESTIC INCOME A N D ITS COMPONENTS; A N D POPULATION: 1950-1980*
Panel A: Market Economies 1950
y RGDP RGDP* P c pC id P' g pG POP y RGDPRGDP* P c pC id P' g pG POP
AFRICA AFRICA
10 ~ g y p t , Arab 1 1 Ethlopla 17 Kenya 24 Yaurlt lus 25 Morocco 28 Nlperla 33 S Afrtca 39 Upanda 41 Zalre
EpYpt. Arab Ethlopla Kenya Maur 1 t lua Morocco Nlgerla 5 . Africa Uganda Zalre
ASIA ASIA
46 Burma 48 lndla 51 18rael 52 Japan
Pak istarn i: Phillpptnem Srl Lanka 2 TAIWAN
83 Thalland
Burma India Iarael Japan Pak latan PhlIIpplnem Srl Lanka TAIWAN That land
EUROPE EUROPE
Austrla Belplum Cyprua Denmark Ftnland France Gormany. Fed Greece Iceland Ireland Italy Luxerabourp Netherlands Norway Portugal Spa In Sweden Switzerland Turkey Unlted Klngd
Auatrla 0elplum Cyprua Denmark Flnlana France Gormany. Fmd Greece Iceland Ireland Italy Luxembourg Netherlands Norway Portugal Spa 1 n Sweden Sultzerland Turkey Unltaa Klnpd
*See notes at end of table.

1950 1951
y RGDP RGDP* P c pC id P' g pG POP y RGDP RGDP* P c pC ld P' g pG POP
N . 6 CENT AMERICA N . 6 CENT AMERICA
Barbados 19 976 824 56 63 58 2 0 63 14 39 210 Barbados 2 0 1035 854 56 6 0 6 1 29 6 6 13 40 210 39 Canada 78 3596 3524 89 5 9 SO 29 88 10 92 13740 Canada 74 3701 3620 96 56 96 3 0 96 12 9 9 14110 4 0 C o s t a R i c a 18 819 816 87 72 8 0 14 134 13 48 860 Comta R l c a 17 823 8 4 0 82 73 77 15 122 14 47 890 4 1 ~ ~ ~ i n l c a n ~ e $ 4 719 697 62 62 6 1 9 78 21 28 2360 O o m i n t c a n R e 16 8 0 0 791 57 6 6 57 9 88 2 0 26 2430 42 EI sa lva&r 14 612 650 5 8 74 55 10 75 18 29 1940 E l S a l v a d o r 14 622 677 6 0 76 58 12 8 0 18 31 1990 43
, Guatemal s 18 842 880 6 1 79 6 1 12 6 8 13 25 2860 Guatemala 18 837 870 59 78 6 0 11 6 9 14 25 3050 44 H ~ ~ I I P I S 15 680 697 52 73 45 12 6 9 12 31 1400 Hondurms 15 701 719 5 1 72 45 14 68 12 31 1440 4 9 .- - - -
94 Mex1co 24 1055 1063 38 79 36 15 45 6 38 26610 M e x l c o 23 1125 1135 43 8 0 40 17 5 0 5 43 27370 46 N 1 c a r a g u a 15 683 719 64 75 63 10 110 21 23 1110 Nicaragua 16 739 759 7 0 7 1 7 0 13 117 18 28 1140 47 z: ~ n n a m a 2 1 928 974 79 6 0 . 79 15 8 3 19 45 8 2 0 Panama 19 878 919 77 73 78 13 8 3 1s 46 850 48
97 ~ r t n i d a d a n d 27 1223 1222 49 54 42 3 0 48 8 65 6 4 0 T r l n l d a d a n d 27 1327 1326 54 54 47 3 0 53 g 67 640 49 91 U n l t e d S t a t e 100 4550 4580 100 6 0 100 28 100 12 100 152270 U n i t e d S t a t * 100 4846 4863 100 56 100 27 100 17 100 164720 5 0
SOUTH AMERICA
9~ A r g e n t l n a B o l i v i a B r a z l l Ch l l e
Ecuador '04 Guyana :$ Paraguay
lo7 E k a y :$ venezuwla
OCEANIA
~ u s t r a l t a 81 3324 3630 ::: New Z..land 75 3074 3421
SOUTH AMERICA
A r g e n t l n a 4 1 B o l l v l a 17 B r a z 1 I 14 C h l l e 3 0 Co lombia 19 t c u a d o r 14 Guyana , 17 Paraguay 18 P e r u 2 1 Uruguay 54 Venwzuel a 38
OCEANIA
8220 A u s t r a l l a 6 9 3191 3404 68 68 6 3 37 88 11 73 8420 62 1810 Neu Z e a l a n d 6 5 2796 3207 8 1 8 1 7 1 25 112 12 8 1 1950 6 3
1952
y RGDP RGDP* P c pC id P' g pG POP
AFRICA AFRICA
21400 l 6 0 l O rim 5 10
9 U O 34710 14460 6470
14710
1 0 C O Y P ~ . A r e 10 1 1 E th lap l . 6 17 h n y a I 1 4 U w r l t t u m ID II Morocco I1 11 )I((#wria l a 3 3 S . A t r l u a# rr uww I a 4 1 Z a l r w r
1953
y RGDP RGDP* P c pC id P' g pG POP

1952
y RGDPRGDP* P c pC id P' g pG POP 1953
y RGDPRGDP* P c pC id P' g pG POP
46 B u r u 4 100 111 49 83 40 9 83 13 44 10070 46 4 104 111 48 77 40 11 00 16 43 10410 I 0 48 I M l a 7 348 347 41 76 40 7 66 16 13 373830 4' Ind1. 7 361 381 40 7 1 40 8 6 1 16 14 3MOOO I 1 1 1 I a r a a l 19 1110 1800 487 69 179 37 334 16 331 1480 SO I r aq 13 946 786 17 33 11 18 18 13 43 -10 12 61 J w a n 981 981 46 63 43 19 78 I 0 16 86470 1 1 Imra*l 17 1399 14011 141 73 114 31 180 17 146 1880 13 67 Paklmtan 8 376 392 18 77 87 7 84 21 18 37900 ir.:, nw. 11 1028 1033 48 67 48 18 8 0 17 30 87700 14 5. Phl l tpp t r rm 10 484 493 83 79 77 10 144 11 44 1 I, Cak18tan ( 8 6 161 60 73 11 I 1 93 11 a0 10600 11 60 S r l ~mn*a $8 719 834 37 78 3 1 11 71 16 14 8 381 391 14 74 14 8 79 11 17 5.830 16 6 1 T A l V b ( 1 5 887 56 86 53 9 109 38 14 8000 88 P h ( l ( w f ~ m 11 sac 648 78 80 13 11 141 18 43 21680 17 63 T h 8 l l . n d g 441 437 39 78 34 0 1 3 11 33 11000 60 6 1 S r t L ~ a TbIUAN 17 713 847 36 79 38 10 6 1 10 14 0 x 0 18
11 607 608 16 17 60 10 97 57 14 8180 I 0 63 Th8 l l .nd 404 405 4 1 7 1 5. 10 76 13 U I t 0 0 0 10
Aumtrla B a l Q l u cyprum Damark Ftnland Franc- Garuny . Gr8ocm 1c.t.M I r e l a n d I t . lv
76 ~ u x o & o u r ~ 77 Wthmrlanb. 78 Norway 79 Portugal €iO Spa I n 8 1 S r a 8 1 Sul tzar land 83 Turkay 44 u n 1 t . a w t w
N.. CENT U C R I C A
Barbadom canad. costa ntca D a l n t y y r Jlm E l Salvador GUateAala H o n d ~ a a Y I X I C O N l c a r a g u P- Tr1ntd.d and un1t.d s ta t *
N.b CENT U D l C A

1952
RGDPRGDP* P c pC id PI g pG
1953
y RGDPRGDP* P c pC id P' g pG POP POP
SOUTH UlCRlCA
I 6 I 4 0 11 79 7 316 4 I 8 8
1 1 7 1 18 W 19 67 I ¶ 110 1 6 8 1 I t 47 1 1 1 3 11 1 8 I 1 0 8 l a a1 11 94 17 10 10 9 6 I 8 I1 I0 Ill I 6 a0 32 103 1 111
OCEANIA
1954
RGDPRGDP* P c p C id PI g pG
1955
POP y RGDPRGDP* P c pC id P' g pG
AFRlCA
Y w h, AFRICA
10 Lpypt . Arab I t I 1 Eth loplm 1 17 Kanya 9 21 *.law1 3 14 Mmurltlum 19 29 bkirocco 13 2 1 Y lgor im 13 3 3 5 . A f r l u 2m 3. ug.- I1 4 1 Z a l r o 8 43 Z I m M I L I 1
POP
91440 10 E p t . Arab 10 4 8 1 111 11 61 17 1 3 1 0 I 4 61 17630 11 lopla la 1 163 268 42 1 9 41 9 8 1 I1 23 6800 14 0h.m 19 990 974 3 1 8 0 a8 13 4 1 9 17 l@w 17 K*&. 8 410 491 49 1 1 49 3 1 9 1 9 6 1 0 1 1 Ma1au1 3 178 177 84 14 1 7 9 10 2 0 2 1
24 Y . u r l t tum I1 9 7 1 936 1 9 67 1 8 17 7 1 13 37 36360 a s ~ r o c c o 11 605 197 77 74 77 11 94 14 48 19070 1 8 Nlgor lm I 3 616 651 34 0 1 3 1 1 71 4 22 1750 3 3 S . A f r t c a 1 9 I464 I416 94 6 1 1 2 1 1 74 14 33
15400 34 Sudan I 3 822 640 3 1 8 9 29 4 41 1 2 1 2860 30 Uganda 11 187 613 3 1 7 1 32 8 1 1 I S 13
4 1 Z a t r e 8 J00 307 4 1 49 41 14 99 1 1 14 43 Z.lblm 1 1 164 763 10 9 1 47 9 1 43 19 41 43 Z I ~ A B W E I 1 t 3 1 3 0 4 0 67 44 3 1 64 11 29
ASIA ASIA
Burma I n d ~ m
1 I r m n I I r a q
Imraml J u w n

E W E
64 A u s t r l a 6 5 8 a l g I u 6 0 Cyprua 6 7 D-rk $8 F I n l a n d 6 9 Franc- 10 W r u n y . Fmd 1 1 arHC* 7 2 lc.l.nd 7 3 I r a l a d 74 I t a l y 7 5 Lu..bourg 7. bit.
N.& CENT * Y I I C A
~ -
9 2 9 3 94 El 0. 9 7 U
n loo I 0 1 IQI l o a l o 4 808 la 107 10 . I I0
OCEANIA
15 I a 25 2 0 2 0 3 0
loo
3 9 I1 I 5 3 1 04 I1 I 6 I 8 a2 b. 47
RGDP RGDP* P
973 000 65 3719 3665 103 I 0 1 3 I124 72 M)I 7BO a0 6 0 0 781 0 3 828 868 59 0 9 1 722 49 7 w as0 56
1161 1169 37 937 981 74 958 1 0 0 1 73
1369 1423 W a 1 9 4844 loo
POP
6940 0 8 I0
520 44 10 4 I 9 0
43030 11120
7090 I X)
2940 47020 300 3 I0
10810 3400 8540
2 0 8 W 1120 4920
23100 B l m o
220 I 5 3 I0
9 0 0 2 6 W 2 100 3320 I 5 9 0 1520
29990 I 2 4 0 920 700
lC3010
105M) 2010
60020 8590
13040 3700
470 1520 8640 2320 5860
EUROPE
04 A u e t r l a 6 5 O a l p t u 6 8 Cyprum 67 Oomork 8 0 F l n l a n d 6 9 Francm 10 O . r u n y . Fad 7 1 O r m a 7 2 Iceland 7 3 I r o l a n d 74 I t a l y 75 L u x w b a r r p 76 Mmlt. 77 N o t h r l a n d a 78 Woruay 7 8 Por tugal W Spaln 8 1 Sr.d.n 0 2 S r l t z a r l a n d 8 3 Turkoy 84 Unfitod * InEd
N . 8 CENT AMERICA
8 5 0arb.dOa 8 0 c w d . 0 1 CWt. RIC* 8 9 D o l l n l c a n Ra
8 E l Salvador to &,at-la 91 Hmduraa 9 3 J w fica 9 4 I k r l c o 91 N l c a r a p a 9 0 P ~ N M 07 T r l n 1 d . d and go Unltmd s t a t e
SOUTH AMERICA
OCEANIA
RGDP
2213 2832 1342 302 1 2413 2592 285 I 1 I 0 2 294s I 7 3 1 1114 3687
742 2788 2797
928 1176 3602 38 I 6
935 -0
loo0 3885 loa5 839 099 824 695 856
1226 942 970
153@ 1123
I 9 8 5 743 753
1500 1113 712 935 070 I I 4 3 2684 2708
RGDP'
2195 285 I 1383 2912 2514 2 600 2794 1 I 1 1 2795 1722 1870 3603
767 2790 2823
966 1576 3644 38 16
9 2 1 3 IM
8 I 9 3854 1 I 7 7 176 768 8 6 1 7 I 6 920
1226 996
1008 1577 5154
2000 74 1 16 I
1532 1131 748 767 876
1 I I 8 2764 23-
P'
w 7 1 1 9 7 7
loa 108 74 7 0
142 78 66 82 94 66 a s 67
a 79 90 I I
122 101
7 1 to¶ 108 w 8 1 66 72 6 0 43 8 I 7 I 15
loo
154 1352
66 I I 9 6 0 76 88 96 6 8 0 7 9 1
14 27 13 35 0 59 6 35
18 2 0 I 0 43 10 6 6 I 8 loo
POP
6950 8870
530 4440 4230
43430 52380
7970 160
2920 48100
300 310
107X) 3430 86 10
28060 7260 4810
23860 51200
220 15740
I 0 2 0 2750 2220 3420 1640 1540
30850 1280 950 720
I65930
18920 2970
8 I150 6740
13450 38 10
490 1560 8860 2350 6 1 t o
111 A u a t r m l l a 7 6 3594 3577 7 0 64 6 E 1 9 8 8 10 7 0 9030 I ( ( A u s t r a l l a 72 3642 3649 74 0 3 71 19 8 9 I0 73 9240 74 Nor Z w l u d 1 1 !JOM 3388 85 76 76 26 117 $ 4 8 8 1m ( ( 4 Now Zaaland 68 3112 3417 95 77 7 1 25 I l l 11 88 2140 75

1956
RGDP RGDP* P c pC id P' g pG POP
1957
y RGDP RGDP* P c pC id P' g pG POP
A F R I C A AFRICA
10 Em pt A r a b 11 E ~ ~ I G I ~ 1 4 QtuN I1 Kmnym 2 1 * m l a u l 2 4 M a u r l t l u a 21 Morocco 18 N 1 g . r l a 3 3 1. A t r l o a 3 4 S u d m n 39 U P . h 4 1 Z a l r m 4 2 Z a n b l a 4 3 Z I Y B A B U E
E m y p t . A r a b E t h l o p l m Qh.N K m n y a *.law1 Y . u r I t l u a Worocco NIQwI~ S . A t r t u -n ucr- Z a l r m ZU.bI. Z I ~ A B U E
A S I A A S I A
B u r u I n d i a I r a n I r m q I m r m m l J o p a n Jordan K o r m a . R a p . Y.1ay.1. Pmk 1 a tan P h l l t w t m s S r t ~ a n * a 1 A I U A N TII.1 I a M
4 6 B u r u 4 1 I M l m 4 9 I r a n 80 I raq 1 1 I e r a m l 1 2 Japan 13 r)ordan 1 4 K o r a a . R 9 16 M a l a y e l a 1 7 P U 1 m t M 50 P h l l l p p l r m a
S r t L a n k m 8 2 T A I U A N 6 3 T t m l l a d
EUROPE EUROPE
A u m t r l a B . 1 ~ 1 ~ C y p r u m D.nurk F l n l a n d F r a n c . a r m a n y . F d O r m o c m I c e l a n d I r m l a n d I t a 1 y L u x . r b a r r p Y . 1 t a N . t h a r I m n d . N o r w a y P o r t u g . 1 S p a In S w m M S w I t z m r I a n d T u r k s y unctw K l r p d

RGDPRGDP* P c pC id P' g qG POP y RGDPRGDP* P c pC id P' g pG POP
N.L CENT AMERICA N . L CENT A r C R l C A
O a r b d o m C a M d . c o s t a RIC. O w l n l c a n I a E l S a l v a d o r o r a t . u 1 a Honduras Jan. IC. *.x l C 0 N l c a r m g w P ~ N M T r I n 1 d . d a n d U n l t o d s t a t .
O a r b a d o m 2 0 C a r u d . 8 3 c o a t . RtC. 2 1 D o m l n t c a n R m I S E l S.lv.* 1 6 GUatY.1. 18 k m d u r a a 1 6 J a u I w 3 0 *.xtco 1 6 N 1 c a r a g w 1 9 P a ~ u 10 T r t n 1 d . d m d 3 3 U n 1 t . d s t a t . 1 0 0
SOUTH W L R l C A U Y I T H AMERICA
99 loo I01 l o 3 lo3 I04 100 lo. 1 0 7 la 1 I0
A r n t i N 0 o K I. O r a z I I C h l l . C o l m l a E c u a d o r 0 u y . r ~ P a r a w m y P m r u
: z 2 1 a
OCEANIA OCEANIA
1958 RGDP RGDP* P c pC id P' g pG POP
1959
Y RGDPRGDP* P c pC id P' g pG POP
AFRICA A F R I C A
B a n ln E g y p t . A r a b E t h l o p l a O h s M O U I N . K m n y a M*l.U1 b u r l t l u m M o r o c c o N l g w r i a S Africa S u d a n U g a n d a Z a i r e z a m b 1 a Z IYBABYE
1 0 E g y p t . A r a b I t E t h l o p l a 1 4 Ghana 1 7 K a n y a 1 1 Y a I a u I 24 M a u r I t I u m 25 M o r o c c o 28 N l g a r i a 3 3 s Africa 3 4 S u d a n 38 U w n d .

y RGDPRGDP* P c pC id PI g pG Pop y RGDPRGDP* P c pC id PI g pG POP
ASIA
Bang1 ad.8h Burma I n d l a I r a n I r a q I a r a a l Japan Jordan Koraa. Rap. *.laymIa Paklatan P h l l l p p l ~ a S r l Lanka TAIWAN 7h. l land
46 Burn8 48 1 M I a 49 I r a n 50 I r a q 51 Imraa? 52 Japan 53 Jordan 5 4 Koraa. Rap. 56 Yalays la 57 Paklatan 16 P h 1 l I p p l n m 60 Sr1 Lank. 6 1 TAIWAN 63 Th.1land
EUROPE EUROPE
Aua t r l a B a l g l u Cyprua Damark F I n land f ranca &rmny . f e d Oraaca IC.l.nd 1ra iand I t a l y Luxantmurg % I t 8 Nmtharlandr Norway Por tug.,
Aua t r l a e a l g t u cyprum Oafnark F In land Franca Oarmany. Fad Oraacm Ica land I r a l a n d I t a l y L u x a a a r r g -1 t a Ne th r landm Norway Por tugal spa ln Swadan Sr l t xmr lana Turkay Un l ted
N.L CENT AYfRlCA N.6 CENT AMERICA
Barbadoas CaMd. coat. RIG. Domlntcan Ra E l Salvador &atanal. Honduraa J a n I ca Max ICO I l l ca rag lu P~MU Trtn1d.d and u n l t a d s t a t e
I 7C 1 I05 I 6 4 I 11 8 17
88 8 4 1 8 19 8 4 1 1 49
6 1 5 I
loo

:XxM B r a 1 I l Chl l a COloU4l. Ecuador Ouyaru Paraguay Peru Uruguay V.nelU I.
OCEANIA
1958
y RGDP RGDP* P c pC id P' g pG POP
SOUTH AMERICA
1959 y RGDP RGDP* P c pC id P' g pG POP
$ 9 9 ~ 1 9 Ar . n t ( l u 38 1971 I 9 7 1 8 1 7 1 4 1 17 73 12 31 10110 66 3110 I 0 0 n o p f v ( a I1 673 665 3 0 1 3 11 0 47 10 14 3150 67
87810 101 e r a l ( l 17 164 173 5 0 6 0 1 1 11 6 3 I 7 3 1 69100 6 1 7130 101 ChIl . 1 9 I 8 6 1 1169 84 76 4 1 I t 9 1 I 4 39 7410 69
14770 I 0 5 C o l w ( a 10 I 0 3 3 I O l I 44 6 8 4 1 11 47 0 11 111W 7 0 4170 101 Ecuador I 4 713 781 55 64 5 9 11 67 24 1 1 4190 71
1 3 0 106 & W a r n 11 6 741 6 1 11 6 6 11 76 I 5 49 140 7 1 1690 I 0 6 Paral luW I 147 114 3 1 76 39 10 80 I 7 I1 1730 1 3 so10 107 p*ru 11 1143 1099 34 70 3 1 11 82 14 10 9110 74 1460 toe u r w w 4s 1410 1437 29 77 11 9 50 tc I 4 14BO 7s TOO0 $ 1 0 V m Z u O I a 4 1 1998 1489 1 1 39 11 16 95 10 74 7320 76
OCEANIA
1960 1961
y RGDP RGDP* P c pC id P' g pG POP y RGDP RGDP* P c pC id PI g pG POP
AFRICA
1 Algeria 20 2 Angola 17 3 Benin 8 4 Botswana 7 5 Burundi 9 6 Cameroon 10 7 Central Afri 10 8 Chad 9 9 Congo. Peop. 13
1 0 Egypt. Arab 10 1 1 Ethiopia 5 12 Gabon 17 13 Gambia. The 12 14 Ghana 19 15 Guinea 13 16 Ivory Coast 14 17 Kenya 8 18 Lesotho 4 19 Liberia 15
20 Madagascar 21 Malawi 22 Mall 23 Maurltanla 24 Maurltlus 25 Morocco 26 Mozambique 27 Niger 28 Ntgeria 29 Rwanda 30 Senegal 31 Slerra Leone 32 Somalia 33 5. Africa 34 Sudan 35 Swaziland 36 Tanzanla. Un 37 Togo 38 Tunlsla 39 Uaanda 40 upper Volta 41 Zaire
\O 42 Zambia 43 ZIMBABWE
ASIA
44 Afghanistan 45 Bangladesh 46 Burma 47 Hong Kong 48 India 49 Iran 50 Iraq 51 Israel 52 Japan 53 Jordan 54 Korea. Rep 55 Malaysia 56 Nepal 57 Pakistan 58 Phillpptnes 59 Singapore 60 Srl Lanka 61 Syrlan Arab 62 TAIWAN 63 Thailand
n r - n n r n n * n POP
5470 3420 4050 970 660
11640 6550 2880
42370 2760 3090 2160 2230 17310 11260 340
10200 1510 4220 6830 4350 17720 3140 36 10
13740 51450 22250 3070
436890 21550 6850 21 10
94 1 0 0 1690
24690 7910 9330 45850 27560 1630 9890 4560 10790 26390
RGDP RGDP* P POP
5590 35 10 4150 990 680
11930 6670 2980
43530 2830 3 180 22 10 2280 17730 11490 350
10450 1540 4300 7070 4440 18090 3220 3770
13980 52840 22720 32 10
446840 22130 7050 2200
94980 1750
25390 8 130 9500 47050 28380 1690 10140 4700
1 1 150 27 190

EUROPE
64 Austria 65 Belgium 66 Cyprus 67 Denmark 68 Finland 69 France 70 Germany. Fed 71 Greece 72 Iceland 73 Ireland 74 Italy 75 Luxembourg 76 Malta 77 Netherlands 78 Norwav 79 ~ortugal 23 80 Spa in 33 81 Sweden 8 1 82 Switzerland 84 83 Turkey 20 84 United Kingd 65
N.B CENT AMERICA
85 Barbados 24 86 Canada 78 87 Costa Rica 2 3 88 Dominican Re 16 89 El Salvador 15 90 Guatemala 18 91 Haiti 7 92 Honduras 14 93 Jamaica 24 94 Mexico 27 95 Nicaragua 18 96 Panama 2 1 97 Trinidad and 44 98 United State 100
1960
RGDP RGDP* P c pC id P' g pG
1961
POP y RGDP RGDP* P c pC id P' g pG POP

SOUTH AMERICA
99 Argentina 1 0 0 Bolivia 101 Brazt l 102 Chile 103 Colombia 104 Ecuador 105 Guyana 106 Paraguay 107 Peru 108 Surinam 109 Uruguay 1 1 0 Venezuela
OCEANIA
1 1 1 Australia 112 Flji 113 Indonesia
h) 114 New Zealand 115 Papua Hew Gu
AFRICA
1 Algeria 2 Angola 3 Benln 4 Botswana 5 8urundl 6 Cameroon 7 Central Afri 8 Chad 9 Congo. Peop. 10 Egypt. Arab 1 1 Ethlopla 12 Gabon 13 Gambla. The 14 Ghana 15 Gulnea 16 Ivory Coast 17 Kenya
RGDP RGDP* P
RGDP RGDP* P
1961
POP y RGDP RGDP* P c pC id P' g pG
1963
POP y RGDP RGDP* P c pC id p1 pG
POP
POP

18 Lesotho 19 Liberia 20 Madagascar 21 Malawi 22 Ma1 1 23 Maurltanla 24 Maurltlus 25 Morocco 26 Mozambique 27 Nlger 28 Nigeria 29 Rwanda 30 Senegal 31 Sierra Leone 32 Somal la 33 S Afrlca 34 suaan 35 Swaziland 36 Tanzania. Un 37 Togo 38 Tunlsla
h, 39 Uganda w 4 0 upper Vol t a h) 41 Zalre
42 Zambia 43 ZIMBABWE
ASIA
45 Afgnanistan 45 Bangladesh 46 Burma 47 nong KonQ 48 India 49 Iran 5 0 Iraq 51 Israel 52 Japan 53 Jordan 54 Korea. Rep. 55 Malaysia 56 Nepal 57 Pakistan 58 Phillpplnes 59 Singapore 60 Sri Lanka 61 Syrian Arab 62 TAIWAN 63 Thailand
RGDP RGDF
238 900 627 2 06 286
1963
POP y RGDP RGDP* P c pC id PI g pG POP
1963
POP y RGDP RGDP* P c pC id P' g pG POP v RGDP
EUROPE
64 Austria 65 Belgium 66 Cyprus 67 Denmark 68 Finland 69 France 70 Germany. Fed 71 Greece 72 Iceland 73 Ireland 74 Italy 75 ~ u x e m b o u r ~ 76 Ma1 ta 77 Netherlands 78 Norway 79 Portugal 80 Spain 81 Sweden 82 Switzerland 83 Turkey 84 United Kingd
N.& CENT AMERIC
85 Barbados 86 Canada 87 Costa Rlca 88 Domtnican Re 89 El Salvador 90 Guatemala 91 Haiti 92 Honduras 93 Jamaica 94 Mextco 95 Nicaragua 96 Panama 97 Trtnldad and 98 United State

Y
SOUTH AMERICA
99 Argent ina 39 100 Bol l v l a 13 101 B r a z i l 18 102 C h i l e 32 103 Colombia 20 104 Ecuador 14 105 Guyana 16 106 Paraguay 16 107 Peru 24 108 Surinam 26 109 Uruguay 46 110 Venezuela 40
OCEANIA
111 A u s t r a l l a 75 112 F t j l 20 113 Indonesia 7 114NewZealand 68 115 Papua New Gu 14
AFRICA
1 A l g e r l a 2 Angola 3 Benln 4 Botswana 5 Burundl 6 Cameroon 7 Centra l 4 f r I 8 Chad 9 Congo. Peop.
10 Egypt. Arab 11 E t h l o p l a 12 Gabon 13 Gambla. The 14 Ghana 15 Gulnea 16 I v o r y Coaat 17 Kenya
RGDP
RGDP 1964
RGDP* P c pC id P' g pG
1963
POP y RGDP RGDP* P c pC id P' g pG POP
1965
POP y RGDP RGDP* P c pC id P' g pG POP

RGDP RGDP* P c
269 35 94 828 38 57 608 33 70 198 52 71 250 29 67 574 46 61 1010 51 68 897 44 78 861 32 80 398 44 73 815 32 84 173 46 82 972 43 70 581 44 87 407 31 79 1768 54 57 851 27 77 778 39 29 338 39 74 437 38 72 854 47 59 621 27 75 239 37 68 310 34 60 677 57 61 844 50 63
POP v 930 18 4
1 1 0 0 19 12 5950 20 9 3800 21 4 4460 22 4 1070 23 10 730 24 15
12810 25 14 7100 26 14 3380 27 7
47310 28 13 3050 29 3 3490 30 16 2350 31 10 2440 32 6 19100 33 30 12260 34 13 380 35 1 1
11290 36 5 1660 37 8 4540 38 15
RGDP
2 79 753 588 22 1 253 602 999 870 842 4 14 859 162 950 546 363 1920 813 844 332 52 1 904 611 220 32 1 713 860
RGDP* P c POP
950 1140 6080 39 10 4570 1 1 0 0 750
13140 7260 3500
48680 3130 3610 2400 2500 19600 12530 390
1 1590 1710 4630 82 10 4850 19510 3590 4430
18 Lesotho 19 Llberia 20 Madagascar 21 Malawi 22 Mali 23 Maurltanla 24 Maurltius 25 Morocco 26 Mozamblque 27 Nlger 28 Nigeria 29 Rwanda 30 Senegal 31 Sferra Leone 32 Soma1 la 33 5. Africa 34 Sudan 35 Swaziland 36 Tanzania. Un 37 Togo 38 Tunisia 39 Uganda 40 Upper Yo1 ta E 41 Zaire 42 Zambia 43 ZIMBABWE
ASIA
44 Afghanletan 45 Bangladesh 46 Burma 47 Hong Kong 48 Indla 49 Iran 50 Iraq 51 Israal 52 Japan 53 Jordan 54 Korea. Rep. 55 Malaysia 56 Nepal 57 Pakistan 58 Phlllpplnes 59 Slngapore 60 Srl Lanka 61 Syrlan Arab 62 TAIWAN 63 Thailand

EUROPE
6 4 Austria 6 5 Belgium 6 6 Cyprus 6 7 Denmark 6 8 Finland 6 9 France 7 0 Germany. Fed 7 1 Greece 72 Ice land 73 I r e land 74 I t a l y 75 Luxembourg 76 Malta 77 Netherlands 78 Norway 79 Portugal 8 0 Spain 8 1 Sweden 8 2 Switzerland 8 3 Turkey 84 United Kingd
N . & CENT AMERICA
8 5 Barbados 2 2 8 6 Canada 79 87 Costa Rlca 2 2 88DominicanRe 18 8 9 E l Salvador 15 9 0 Guatemala 17 9 1 H a l t l 6 9 2 Honduras 13 9 3 Jamalca 2 3 94 Mexico 28 9 5 Nicaragua 2 1 9 6 Panama 24 97 Tr ln ldad and 42 98 unl ted State 100
RGDP RGDP* P POP
7210 94 10
590 4720 4550
48200 584 10
8 5 10 190
2860 5 1620
330 320
12130 3690 9230
3 1560 7680 5760
30390 54180
230 19300
1430 3730 29 10 4480 4050 2230 1730
41500 1650 1230 950
191790
RGDP
3322 3834 168 1 4704 3575 3929 4422 1947 391 1 2216 2823 4684
959 3825 3893 1446 2550 52 10 5167 1171 3814
1595 4939 1373 975 873 997 368 800
$346 1675 1209 1422
RGDP* P POP
7250 9460
590 4760 4560
48760 59010
8550 190
2880 5 1940
330 320
12290 3720 9230
31910 7730 5860
31150 54520
2 3 0 19640
1480 3850 3010 46 10 4140 2 300 1760
42870 1700 1270 9 7 0
194300

SOUTH AMERICA
99 Argentina 100 ~ o l ivla 101 8razll 102 Chile 103 Colombia 104 Ecuador 105 Guyana 106 Paraguay 107 Peru 108 Surinam 109 Uruguay 110 Venezuela
OCEANIA
1 1 1 Australla 112 F 1 1 1 113 ~nionesia 114 New Zealand 115 Papua New Gu
1964 1965
y RGDP RGDP* P c pC id PI g pG POP y RGDP RGDP* P c pC id PI g pG
AFRICA
1 Algerla 2 Angola 3 Benln 4 Botswana 5 Burundl 6 Cameroon 7 Central Afrl 8 Chad 9 Congo. Peop. 10 Egypt. Arab 1 1 ~thiopia 12 Gabon 13 Gambla. The 14 Gnana 15 Guinea 16 Ivory Coast 17 Kenya
RGDP
1034 1196 460 43 1 300 63 1 494 486 746 693 319 1555 684 970 794 909 383
RGDP* P
867 52 1152 32 462 35 441 34 302 32 638 36 503 36 493 33 611 48 695 46 329 34 1204 67 722 26 923 47 787 33 922 44 419 51
POP
1967
POP y RGDP RGDP* P c pC id p1 g pG p o p

18 Lesotho 19 Liberia 20 Madagascar 21 MaIawl 22 Mall 23 Mauritania 24 Maurltlus 25 Morocco 26 Mozambique 27 Niger 28 Nigerla 29 Rwanda 30 Senegal 31 Sierra Leone 32 Soma 1 la 33 S. Africa 34 Sudan 35 Suaziland 36 Tanzania. Un 37 Togo 38 Tunisla
h, 39 Uganda W 40 Upper Volta
41 Zaire 42 Zambia 43 ZIMBABWE
ASIA
44 Afgnanistan 45 Bangladesh 46 Burma 47 Hong Kong 48 Indla 49 Iran 50 Iraq 51 Israel 52 Japan 53 Jordan 54 Korea. Rop. 55 Malaysia 56 Nepal 57 Pakistan 58 Philippines 59 Slngapore 60 Sri Lanka 61 Syrian Arab 62 TAIWAN 63 Thalland
RGDP
340 786 589 2 36 254 582 947 824 854 492 788 227 942 52 1 396 1930 774 897 362 529 9 13 642 2 14 346 658 847
369 374 310 1563 383 1298 1577 2725 !la 10 1047 798 1124 367 550 757 1306 79 1 907 1005 653
RGDf
326 813 593 237 254 593 929 823 876 500 709 229 969 557 403 1834 790 753 362 526 887 652 2 16 355 86 1 826
370 379 316 1515 383 1065 1279 2752 2886 1054 803 1186 364 560 755 I286 868 803 1013 678
POP
970 1 la0 62 10 4020 4680 1 120 760
13500 7430 3610 50090 32 10 3730 2460 2560
201 10 12820 400
11910 1760 4720 8520 4960 19890 3700 46 10
15430 608 10 253 10 3760
502030 25350 8230 2650
99880 2020 28750 9340 10470 53900 33060 1920
11440 5500 12990 31600
RGDP
344 812 600 250 253 588 988 84 1 911 487 654 256 907 504 409 2047 73 1 838 365 575 898 636 223 346 700 880
37 1 395 289 1636 411 1378 14 10 2665 3 102 1115 847 1130 345 569 763 1430 7 76 973 1092 69 1
POP

1966 1967
y RGDP RGDP* P c pC id P' g pG POP y RGDP RGDP* P c pC id P' g pG POP
EUROPE
Austria Belgium Cyprus Denmark Flnland France Germany. Fed Greece Iceland Ireland Italy Luxembourg Ma1 ta Netherlands Norway Por tuga 1 Spa 1 n Sweden Switzerland Turkey Unlted Klngd
N . 8 CENT AMERICA
Barbados Canada Costa Rica Domlnlcan Re E 1 Salvador Gua temal a Halt l Honduras Jama 1 ca Mex i co Nicaragua Panama Trinidad and United State

v SOUTH AMERICA
99 Argent lna 37 100 B o l i v l a 13 101 B raz l l 15 102 C h l l e 32 103 Colombia 19 104 Ecuador 14 105 Guyana 16 106 Paraguay 14 107 Peru 24 108 Surinam 29 109 Uruguay 39 110 Venezuela 35
OCEANIA
111 A u s t r a l l a 7 3 112 F l j l 17 113 Indonesia 5 114 New Zealand 68
h, 115 Papua New Gu 15 P 0
AFRICA
1 A l g e r l a 2 Angola 3 8en ln 4 Botswana 5 Burundl 6 Cameroon 7 Cent ra l A f r i 8 Chad 9 Congo. Peop.
10 Egypt. Arab 11 E t h l o p l a 12 Gabon 13 Gambfa. The 14 Ghana 15 Gulnea 16 i v o r y Coast 17 Kenya
RGDP RGDP* P POP
1968
v RGDP RGDP* P c pC id PI g pG
RGDP RGDP* P POP
1969
POP V RGDP RGDP* P c pC id P' g pG POP

18 Lesotho 19 Llberla 20 Madagascar 21 Malaw1 22 Mall 23 Maurltanla 24 Maurltlus 25 Morocco 26 Mozambique 27 Nlger 28 NiQerla 29 Rwanda 30 Senegal 31 Sierra Leone 32 Soma l la 33 S. Africa 34 Sudan 35 Swaziland 36 Tanzania. Un 37 Togo 38 Tunlsla 39 Uaanda
t3 40 upper Vol ta 2 41 Zaire 42 Zambla 43 ZIMBABWE
ASIA
44 Afghanlstan 45 Bangladesh 46 Burma 47 Hong Kong 48 Indla 49 Iran 50 Iraq 51 Israel 52 Japan 53 Jordan 54 Korea. Rep. 55 Malaysia 56 Nepal 57 Pakistan 58 Phillpplnes 59 Singapore 60 Srl Lanka 61 Syrian Arab 62 TAIWAN 63 Thailand
RGDP
333 808 632 246 250 615 940 911 957 486 647 248 9 13 533 4 10 207 1 866 866 382 570 939 633 300 353 708 883
373 392 307 1697 4 15 1515 1610 3010 3475 1068 935 1161 340 585 77 1 1591 763 980 1163 733
RGDP
32 1 852 6 36 246 256 624 886 915 983 490 584 25 1 91 1 568 4 (7 1999 Be5 714 382 584 917 640 303 365 940 86 1
373 396 310 1673 415 1210 1345 3072 3579 1078 943 1181 338 596 775 1567 819 90 1 1175 74 1
RGDP
325 835 639 259 24 1 594 916 923 999 447 771 269 8 16 566 349 2161 7 50 1013 374 599 965 672 307 377 662 958
368 404 3 12
1 907 438 1615 1604 3315 3870 1090 1061 1169 355 574 780 1787 795 1159 1203 767
RGDP* P c POP

EUROPE
Austr la Belgium Cyprus Denmark F in land France Germany. Fed Greece I c e l a n d I r e l a n d I t a l y Luxembourg Ma1 t a Netherlands Norway Portugal Spain Sweden Swi tzer land Turkey Unl ted Klngd
N . & CENT AMERICA
8 5 Barbados 25 86 Canada 79 87 Costa Rica 23 88 Dominican Re 14 89 El Salvador 14 9 0 Guatemala 16 91 H a i t i 5 92 Honduras 13 93 Jamaica 24 94 Mexico 28 95 Nicaragua 19 9 6 Panama 2 5 97 T r i n i d a d and 31 98 Uni ted S t a t e 100
1968
RGDP RGDP* P c pC id PI g pG POP y RGDP
1969
RGDP* P c pC POP
7420 96 10
610 4 900 4590
50300 604 30
8740 200
2930 53180
340 320
12890 3850 8680
33400 7990 6200
34440 55330
240 2 1080
1680 4390 3470 5190 4510 2570 1840
48740 1910 1420 1020
202970

Y
SOUTH AMERICA
A r g e n t i n a 37 €401 i v i a 13 B r a z i l 16 C h i l e 3 1 C o l o m b i a 18 E c u a d o r 14 G u y a n a 15 P a r a g u a y 15 P e r u 23 S u r i n a m 29 U r u g u a y 36 V e n e z u e 1 a 35
O C E A N I A
111 A u s t r a l i a 7 7 112 F i j i 18 113 I n d o n e s i a 5 1 14 N e w Z e a I and 6 1 115 P a p u a N e w Gu 16
RGDP RGDPC P POP y RGDP RGDP* P POP
1970 1971
y RGDP RGDP* P c pC id PI g pG POP y RGDP RGDP* P c pC id PI g pG POP
A F R I C A
1 A l o e r i a 17 1403 1129 44 3 9 46 2 9 58 18 34 13310 1 16 1283 1043 44 47 42 26 6 9 15 32 13700 1 2 ~ n g o l a 3 B e n i n 4 B o t s w a n a 5 B u r u n d ~ 6 C a m e r o o n 7 C e n t r a l A f r i 8 C h a d 9 C o n g o . P e o p .
10 E g y p t . A r a b 11 E t h i o p i a 12 G a b o n 13 G a m b i a . T h e 14 G h a n a 15 G u i n e a 16 I v o r y C o a s t 17 K e n y a

RGDP RGDP* P c
320 303 34 89 860 867 38 54 647 659 28 69 257 259 38 60 253 257 29 65 650 652 37 54 901 871 40 64 956 938 38 71 1007 1036 30 74 485 489 28 79 936 841 36 72 290 297 29 85 853 861 32 69 580 617 35 80 362 368 30 70
1971
POP y RGDP RGDP* P c pC id P' g pG
1060 18 5 343 333 33 88 43 8 88 17 32 1330 19 13 884 891 36 54 31 19 47 19 22 6800 20 10 664 678 27 69 27 1 1 56 24 19 4510 21 4 281 283 40 65 48 16 65 25 18 5140 22 4 254 259 29 66 32 14 41 23 17 1240 23 9 634 636 38 52 39 21 52 23 19
POP
1090 1380 6960 4650 5270 1280 840
15530 8340 4 100 58060 3670 44 10 2760 2860 22950 14440 440
I3690 2080
18 Lesotho 19 Liberia 20 Madagascar 21 Malawi 22 Ma1 i 23 Mauritania 24 Maurltius 25 Morocco 26 Mozambique 27 Niger 28 Nigeria 29 Rwanda 30 Senegal 31 Sierra Leone 32 Soma1 la 33 5. Africa 34 Sudan 35 Swaziland 36 Tanzania. Un 37 Togo 38 Tunlsla 39 Uganda
h) 40 Upper Volta 41 Zaire 42 Zambia 43 ZIMBABWE
ASIA
44 Afghanistan 45 Bangladesh 46 Burma 47 Hong Kong 48 Indla 49 Iran 50 Iraq 51 Israel 52 Japan 53 Jordan 54 Korea. Rep. 55 Malaysla 56 Nepal 57 Pakistan 58 Philippines 59 Slngapore 60 Srl Lanka 61 Syrian Arab 62 TAIWAN 63 Thailand

EUROPE
64 Austria 65 Belgium 66 Cyprus 67 Denmark 68 Finland 69 France 70 Germany. Fed 71 Greece 72 Iceland 73 Ireland 74 Italy 75 Luxembourg 76 Malta 77 Netherlands 78 Norway 79 Portugal 80 Spain 81 Sweden 82 Switzerland 83 Turkey 84 United Klngd
N.& CENT AMERICA
85 Barbados 3 1 86 Canada 82 87 Costa Rica 2 5 88 Domlnlcan R e 16 89 El Salvador 14 90 Guatemala 17 91 ~aiti 5 92 Honduras 14 93 Jama lca 2 8 94 Mex fco 30 95 Nicaragua 19 96 Panama 28 97 Trlnldad and 36 98 United State 100
RGDP
4154 477 1 2259 5530 4549 504 1 5356 2672 4098 2717 3655 5429 1486 4767 451 1 2126 323 1 6025 5958 1408 4216
2333 5703 1601 1 1 I3 902 1133 356 9 10 1841 2005 1246 1804 2847 6629
RGDP* P POP RGDP
4383 4935 2486 5637 4600 5259 5486 28 14 46f3 2789 3653 5579 1504 4924 4660 2249 3337 6064 6121 1499 43 13
2375 6058 1658 1175 913 1152 362 914 1847 1996 1261 1916 2878 6774
RGDP* P POP

1970 1971
v RGDP RGDP* P c pC id P' g pG POP y RGDP RGDP* P c pC id P' g pG POP
SOUTH AMERICA
99 A r g e n t l n a 100 B o l i v l a 101 B r a z i l 102 C h i l e 103 Colornbla 104 Ecuador 105 Guyana 106 Paraguay 107 Peru 108 Surinam 109 Uruguay 110 Venezuela
OCEANIA
111 A u s t r a l l a 8 1 112 F l j i 20 113 I n d o n e s l a 6 1 1 4 N e w Z e a l a n d 64
h) 11 5 Papua New Gu 19 P 0\
1972 1973
y RGDP RGDP* P c pC id P' g pG POP v RGDP RGDP* P c pC ld PI g pG POP
AFRICA
A l g e r l a Angola B e n l n Botswana Burund i Cameroon C e n t r a l A f r Chad Congo. Peop Egyp t . Arab E t h i o p i a Gabon Gambia. The Ghana Gut nea I v o r y Coast Kenya

18 Leso tho 19 L i b e r i a 20 Madagascar 21 Malawi 22 M a l l 23 M a u r l t a n l a 24 M a u r l t l u s 25 Morocco 26 Mozambique 27 N i g e r 28 N i g e r i a 29 Rwanda 30 Senegal 31 S i e r r a Leone 32 Somal ia 33 S. A f r l c a 34 Sudan 35 Swaz i land 36 Tanzania. Un 37 Tog0 38 T u n l s l a 39 Uganda
t 4 40 Upper Vol t a 5 41 Z a i r e
42 Zambia 43 ZIMBABWE
ASIA
44 A f g h a n i s t a n 45 Bangladesh 46 Burma 47 Hong Kong 48 I n d i a 49 I r a n 50 I r a q 51 I s r a e l 52 Japan 53 Jordan 54 Korea. Rep 55 M a l a v s l a 56 ~ e ~ a i 57 P a k i s t a n 58 P h l l l p p i n e s 59 S ingapore 6 0 S r i Lanka 6 1 S y r i a n Arab 62 TAIWAN 63 T h a i l a n d
1972
RGDP RGDP* P c pC i d P' g pG POP y RGDP RGDP
445 833 609 304 269 580
1 I 3 6 962
1117 406
1007 29 1 785 639 434
2285 732
1056 4 16 582
1233 640 275 444 917
1091
35 1 365 314
2626 454
2171 1455 4139 5182
787 1380 1527 336 590 865
2646 709
11 19 1708 884
POP

EUROPE
64 A u s t r l a 65 Be lg lum 66 Cyprus 67 Denmark 68 F l n l a n d 69 France 70 Germany. Fed 71 Greece 72 I c e l a n d 73 I r e l a n d 74 I t a l y 75 Luxembourg 76 M a l t a 77 N e t h e r l a n d s 78 Norway 79 P o r t u g a l
h, 80 Spa I n 81 Sweden % 82 S w i t z e r l a n d 83 Turkey 84 U n i t e d K l n g d
N.& CENT AMERICA
85 Barbados 3 1 86 Canada 8 4 87 Cos ta R i c a 2 4 8 8 0 o m l n l c a n R e 16 89 E l Sa lvador 13 90 Guatemala 17 91 H a l t 1 5 92 Honduras 13 93 Jamalca 2 7 94 Mexlco 2 8 95 N icaragua 18 96 Panama 29 97 T r l n l d a d and 37 98 U n i t e d S t a t e 100
RGDP
4624 5185 2620 5937 4901 5522 5653 3023 4804 2928 37 19 5864 1572 5047 4926 2374 3587 6162 6286 1564 4396
248 1 6289 1706 1234 93 1
1185 35 1 904
1957 207 1 1205 1990 298 1 7119
RGDP* P POP
7490 9700
630 4990 4640
51540 61300
8890 2 10
3010 54480
350 330
13300 3930 8840
34510 8120 6360
37 I 5 0 55760
240 2 1970
1830 4810 3810 5690 4820 2800 1930
53690 2 100 1550 1050
208480
RGDP RGDP* P POP
75 10 9740
6 30 5020 4660
51980 61570
8940 2 10
3050 54980
350 3 30
13430 3960 9040
34870 8150 6380
38 100 55890
240 22220
1870 4950 3920 5870 4930 2890 1970
55460 2 $ 7 0

1972 1973
y RGDP RGDP* P c pC id P' g pG POP y RGDP RGDP* P c pC id PI g pG POP
SOUTH AMERICA
9 9 A r g e n t l n a 41 2968 2985 52 62 55 26 6 0 12 28 24390 99 4 1 3045 3080 6 7 6 3 6 8 24 84 12 40 247 '3 9 9
100 ~ o l i v i a 13 959 963 38 6 9 4 0 17 55 16 21 4520 100 13 1004 1009 34 6 9 34 15 58 17 17 4640 100
101 B r a z I 1 2 0 1466 1464 53 61 58 26 67 15 28 100760 101 21 1624 1623 5 9 59 64 28 73 14 30 103660 101
102 C h l l e 32 2227 2281 71 8 1 67 10 116 14 64 9700 102 29 2108 2196 6 1 8 0 6 0 10 110 15 41 9860 102
103 Co lomb ia 20 1470 1479 33 7 1 34 21 41 10 21 22290 103 21 1536 1548 35 73 36 18 42 10 22 22790 103
104 Ecuador 14 1020 991 39 61 41 16 68 21 17 6310 104 15 1190 1134 43 56 43 17 6 9 19 20 6500 104 105 Guyana 13 1104 954 52 54 5 1 15 78 19 36 740 105 13 1129 948 49 54 52 2 1 72 2 1 4 0 760 105 106 Paraguay 15 1051 1068 38 7 0 42 15 5 0 17 14 2430 1 s 15 1095 1130 43 7 0 46 19 56 14 15 2500 106 107 P e r u 23 1662 1662 46 76 45 8 84 16 28 14270 107 24 1740 1795 47 74 46 14 73 15 30 14660 107
108 Sur lnam 3 0 2264 2213 55 47 57 21 7 1 25 36 370 108 28 2336 2155 59 45 6 1 2 0 79 24 38 370 108 109 Uruguay 37 2518 2614 38 78 38 8 76 18 21 2840 109 37 2653 2781 45 77 44 7 106 20 25 2840 109 110 Venezue la 36 3482 2679 61 4 0 59 22 83 12 4 1 11440 110 37 3468 2948 65 4 0 6 0 23 89 12 42 11830 110
OCEANIA
111 A u s t r a l l a 78 5699 5751 88 6 0 87 27 97 10 8 9 13000 111 77 5745 5876 112 6 2 110 3 0 125 10 116 13220 111 112 F l j i 21 1660 1486 5 0 58 54 20 6 9 17 31 5 4 0 1 1 2 23 1912 1689 55 6 3 6 1 19 75 14 33 5 5 0 1 1 2 113 I n d o n e s f e 6 434 408 27 66 29 13 47 16 12 125640 113 6 484 466 33 65 35 14 53 18 15 128800 113 114 New Z e a l a n d 6 6 4431 4831 87 68 82 25 114 13 72 2920 114 7 0 4681 5305 96 6 9 93 30 121 14 77 2980 114 115 Papua New Gu 16 1074 1112 43 54 45 18 59 33 3 1 2530 115 16 1048 1151 59 52 54 16 6 9 32 41 2590 115
1974 1975
y RGDP RGDP* P c pC id P' g pG POP y RGDP RGDP* P c pC id PI g pG POP
AFRICA
1 A l g e r i a 2 A n g o l a 3 B e n i n 4 Botswana 5 B u r u n d i 6 Cameroon 7 C e n t r a l A f r i 8 Chad 9 Congo. Peop.
10 E g y p t . A rab 11 E t h l o p i a 12 Gabon 13 Gambia. The 14 Ghana 15 Gu inea 16 I v o r y C o a s t 17 Kenya

18 Lesotho 19 Liberia 20 Madagascar 21 Malawl 22 Mali 23 Mauritania 24 Mauritius 25 Morocco 26 Mozambique 27 Nlger 28 Nigeria 29 Rwanda 30 Senegal 31 Sierra Leone 32 Somalia 33 S. Africa 34 Sudan 35 Swaziland 36 Tanzania. Un 37 Togo 38 Tunisia 39 Uganda
bd 40 Upper Volta 2 41 Zaire 42 Zambia 43 ZIMBABWE
ASIA
44 Afghanistan 45 Bangladesh 46 Burma 47 Hong Kong 48 India 49 Iran 50 Iraq 51 Israel 52 Japan 53 Jordan 54 Korea. Rep. 55 Malaysia 56 Nepal 57 Pakistan 58 Phll lpplnes 59 Singapore 60 Srl Lanka 61 Syrian Arab 62 TAIWAN 63 Thailand
RGDP
506 894 586 315 255 673 1209 1012 933 477 1142 365 783 599 440 2448 763 1242 442 635 1365 627 288 446 778 1147
369 365 31 1 2553 447 2582 1995 4169 4883 863 1455 1620 363 583 882 2822 698 1628 1712 89 1
1974
RGDP* P c pC id P' g pG POP
1160 1520 7490
RGDP
534 830 568 326 263 752 1260 1121 785 427 1179 396 8 13 567 423 2412 735 1270 455 616 1473 6 13 292 382 79 1
1 1 19
380 373 312 2559 472 2664 2088 4 154 4905 802 1530 1532 358 594 912 2875 66 1 1935 1755 930
1975
RGDP* P c pC id P' g pG POP
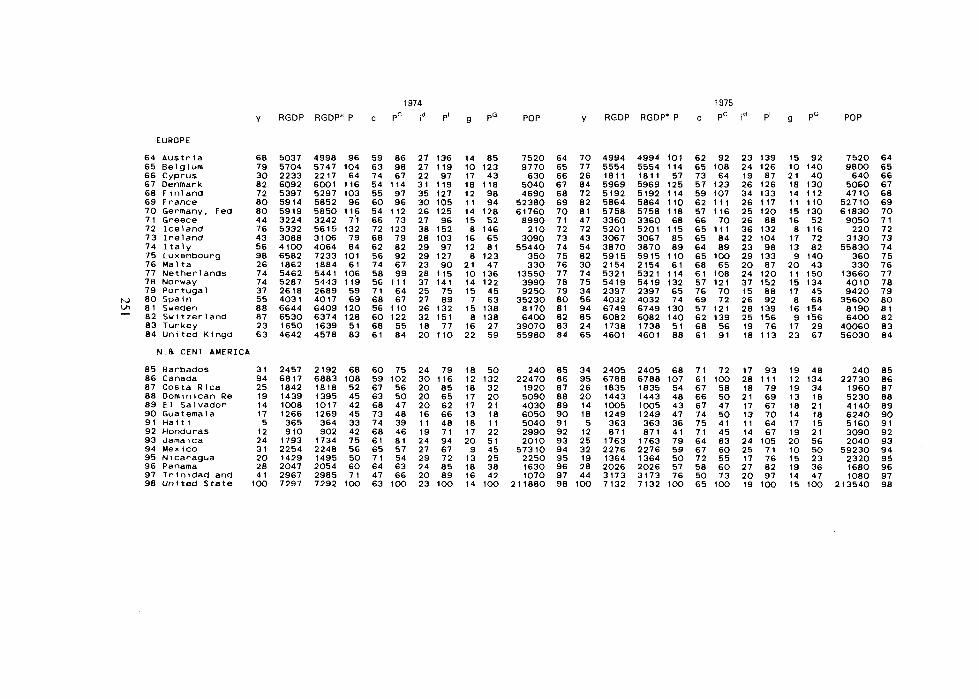
EUROPE
64 Austria 6 5 Belgium 66 Cyprus 67 Denmark 6 8 Finland 6 9 France 7 0 Germany. Fed 71 Greece 72 Iceland 73 Ireland 74 Italy 75 Luxembourg 76 Malta 77 Netherlands 78 Norway 79 Portugal
h, 8 0 Spa in vl 81 Sweden i 82 Switzerland
83 Turkey 84 United Kingd
N . 5 CENT AMERICA
85 Barbados 86 Canada 87 Costa Rtca 88 Dominican Re 8 9 El Salvador 9 0 Guatemala 91 Haiti 9 2 Honduras 93 Jamaica 94 Mexico 9 5 Nicaragua 96 Panama 97 Trinidad and 9 8 United State
y RGDP POP
1975
RGDP RGDP* P c pC id P' POP

1974
RGDP* P c pC id P' g pG POP
1975
y RGDP RGDP* P c pC id PI g pG POP y RGDP
SOUTH AMERICA
99 Argentina 4 4 100 801 ivia 15 101 Brazil 2 4 102 Chile 3 1 103 Colombia 22 104 Ecuador 18 105 Guyana 15 106 Paraguay 16 107 Peru 2 6 108 Surinam 26 109 Uruguay 38 110 Venezuela 4 7
OCEANIA
1 1 1 Australia 80 112 Fiji 24 113 Indonesia 7 114 New Zealand 68 1 15 Papua New GU 15
h)
1976
RGDP* P c pC id P' g pG POP
1977
y RGDP RGDP* P c pC id P' g pG RGDP POP
AFRICA
1 Algeria 2 Angola 3 Benin 4 Botswana 5 Burundi 6 Cameroon 7 Central Afrl 8 Chad 9 Congo. Peop. 10 Egypt. Arab 11 Ethiopia 12 Gabon 13 Gambia. The 14 Ghana 15 Guinea 16 Ivory Coast 17 Kenya

18 Lesotho 19 Liberia 2 0 Madagascar 2 1 Malawi 22 Mal 23 Mauritania 24 Mauritius 25 Morocco 26 Mozambique 27 Niger 28 Nlgeria 29 Rwanda 3 0 Senegal 3 1 Sierra Leone 32 Somalia 33 S . Africa 34 Sudan 35 Swaziland 36 Tanzania. Un 37 Togo 38 Tunisia 39 Uganda 4 0 Upper Volta 4 1 Zaire 42 Zambia 43 ZIMBABWE
ASIA
Afghan istan Bangladesh Burma Hong Kong India I ran Iraq Israel Japan Jordan Korea. Rep. Malaysla Nepa 1 Pakistan Phlltpplnes Singapore Sri Lanka Syrian Arab TAIWAN Thai land
RGDP
608 867 5 5 1 330 260 786
1442 1237 732 486
1228 399 84 1 568 43 1
2357 885
1341 446 603
1549 6 0 0 284 330 732
1017
RGDP* P
601 22 878 5 1 551 38 326 38 265 32 777 44
1357 46 1198 4 0 727 37 490 39
1238 5 0 408 36
POP
1220 1630 7870 5420 5960 1460 920
17840 9440 4720
67760 4240 5 1 10 3 120 3260
262 10 16450
500 15860 2390 5740
11680 6230
25340 4960 6460
RGDP
656 926 556 345 255 753
1502 1255 73 1 505
1338 41 1 837 547 432
2247 1068 1339 46 1 617
1595 593 269 346 680 925
RGDP* P c

1976 1977
y RGDP RGDP* P c pC id P' g pG POP y RGDP RGDP* P c pC id P' g pG POP
EUROPE
64 Austria 65 Belgium 66 Cyprus 67 Denmark 68 Finland 69 France 70 Germany. 71 Greece 72 Iceland 73 Ireland
69 7 7 30 86 69 8 1
Fed 80 4 7 7 2 42
74 italy 54 75 Luxembourg 8 1 76 Malta 34 77 Netherlands 74 78 Norway 74 79 Portugal 34 8 0 Spain 55 81 Sweden 9 1 82Switzerland 81 83 Turkey 25 84 United Kingd 64
N . S CENT AMERICA
Barbados 26 Canada 95 Costa Rlca 26 Dominican Re 18 El Salvador 14 Guatemala 18 Haiti 6 Honduras 13 Jamaica 2 2 Mex l co 30 Nicaragua 19 Panama 26 Trinidad and 45 United State 1 0 0

SOUTH AMERICA
9 9 A r g e n t l n a 1 0 0 8 0 1 l v l a 1 0 1 B r a z l l 1 0 2 C h i l e 1 0 3 C o l o m b i a 1 0 4 E c u a d o r 1 0 5 G u y a n a 1 0 6 P a r a g u a y 1 0 7 P e r u 1 0 8 S u r i n a m 1 0 9 U r u g u a y 1 1 0 V e n e z u e l a
OCEANIA
1 1 1 A u s t r a l l a 1 1 2 F i j i 1 1 3 I n d o n e s l a 1 1 4 New Z e a l a n d 1 1 5 P a p u a N e w G u
'a
1976
RGDP RGDP* P c pC i d PI g pG POP
1977
y RGDP RGDP* P c pC id P' g pG POP
AFRICA
1 A l g e r i a 2 A n g o l a 3 B e n i n 4 B o t s w a n a 5 B u r u n d l 6 C a m e r o o n 7 C e n t r a l A f r l 8 C h a d 9 C o n g o . P e o p
1 0 E g y p t . A r a b 1 1 E t h l o p l a 12 G a b o n 1 3 G a m b l a . T h e 1 4 G h a n a 1 5 G u i n e a 1 6 I v o r y C o a s t 1 7 K e n y a
RGDP RGDP* P c pC i d PI g pG POP y RGDP RGDP* P c pC i d P' g pG POP

18 Leso tho 19 L i b e r i a 2 0 Madagascar 2 1 Malawi 22 Ma1 i 23 M a u r i t a n i a 24 M a u r i t i u s 25 Morocco 26 Mozambique 27 N t g e r 28 N i g e r i a 29 Rwanda 30 Senegal 31 S i e r r a Leone 32 Somal ia 33 S. A f r i c a 34 Sudan 35 Swaz i land 36 Tanzania. Un 37 Togo 38 T u n i s i a 39 Uganda 40 Upper V o l t a
g\ 41 Z a i r e 42 Zambia 43 ZIMBABWE
ASIA
44 A f g n a n i s t a n 45 Bangladesh 46 Burma 47 Hong Kong 48 I n d i a 49 I r a n 50 I r a q 51 I s r a e l 52 Japan 53 J o r d a n 54 Korea. Rep. 55 M a l a y s i a 56 Nepal 57 P a k i s t a n 58 P h l l l p p l n e s 59 S ingapore 6 0 S r l Lanka 6 1 S y r i a n Arab 62 TAIWAN 63 Tha i l a n d
RGDP RGDP* P POP
1280 1740 8290 5770 6290 1540 960
19010 9930 5000
72220 4510 5380 3290 3440
27700 17380
520 16850 2540 6040
12410 6550
26770 5290 6910
20880 83480 33600 4650
6631 10 35830 122 10 3750
1 14700 2980
36650 12960 13630 77310
RGDP RGDP* P POP
1310 1800 8510 5960 6460 1590 980
19640 10200 5 150
74590 4650 5520 3380 3540
28480 17860
540 17380 2620 6200
12800 673C
27520 5470 7 150
21450 86060 34430
4750 678490
36940 12640 3850
1 15560 3090
37310 13300 13940 79840 49500
2390 14610

1978 1979
y RGDP RGDP* P c pC id P' g pG POP y RGDP RGDP* P c pC id P' g pG POP
EUROPE
64 Austria 65 Belgium 66 Cyprus 67 Denmark 68 Flnland 69 France 70 Germany, Fed 80 6485 6513 134 57 134 27 124 14 150 61390 70 83 6820 6789 139 56 140 29 131 14 157 61140 70 71 Greece 47 3829 3835 75 66 74 24 95 16 6 0 9210 71 49 3984 3972 81 65 79 25 103 16 64 9270 71
Iceland Ireland Italy Luxembourg Malta Netherlands Norway Por tuga 1 Spain Sweden Switzerland Turkey United Klngd
N.B CENT AMERICA
85 Barbados 86 Canada 87 Costa Rica 88 Dominican Re 89 El Salvador 9 0 Guatemala 91 Haiti 92 Honduras 93 Jamatca 94 Mexico 95 Nicaragua 96 Panama 97 Trinidad and 98 United State 1

SOUTH AMERICA
99 Argentina 1 0 0 Bolivra 101 Brazi l 102 Chile 103 Colombia 104 Ecuador 105 Guyana 106 Paraguay 107 Peru 108 Surinam 109 Uruguay 110 Venezuela
OCEANIA
1 1 1 Australia 112 Fiji 113 Indonesia 114 New Zealand 115 Papua New Gu
1978
y RGDP RGDP* P c pC id POP
1979
RGDP RGDP* P c pC id P' g POP
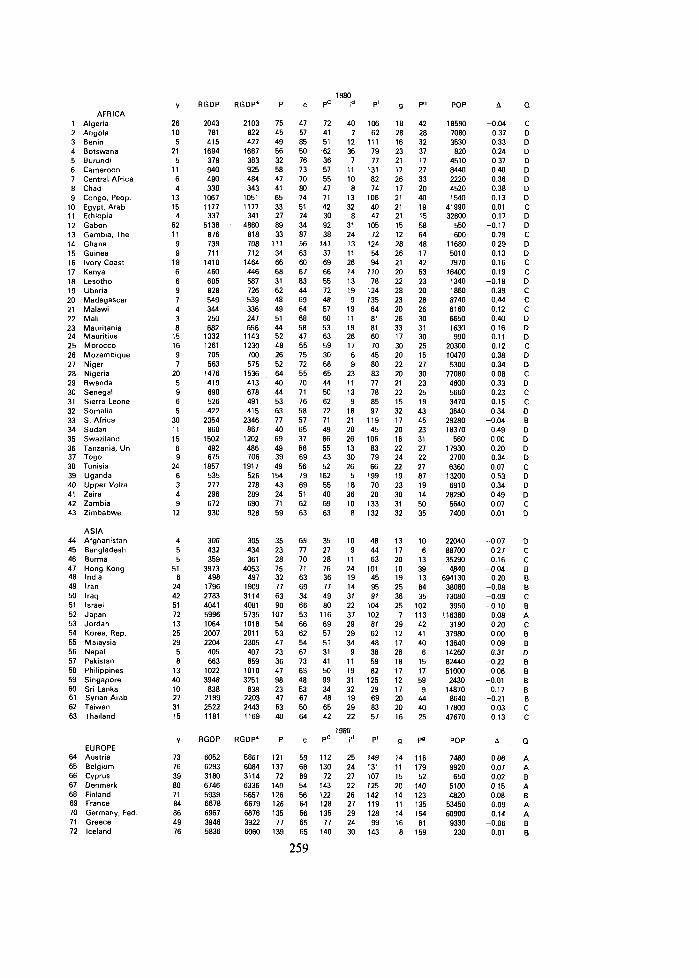
AFRICA 1 Algeria 2 Angola 3 Benin 4 Botswana 5 Burundi 6 Cameroon 7 Central Afr~ca 8 Chad 9 Congo. Peop.
10 Egypt. Arab 11 Eth~opia 12 Gabon 13 Gambia. The 14 Ghana 15 Gumea 16 Ivory Coast 17 Kenya 18 Lesotho 19 Liberia 20 Madagascar 21 Malawi 22 Mali 23 Mauritania 24 Mauritius 25 Morocco 26 Mozambique 27 Niger 28 N~geria 29 Rwanda 30 Senegal 31 Sierra Leone 32 Somalla 33 S. Africa 34 Sudan 35 Swaz~land 36 Tanzania, Un 37 Togo 38 Tunisla 39 Uganda 40 Upper Volta 41 Zaire 42 Zambia 43 Zimbabwe
ASIA 44 Afghanistan 45 Bangladesh 46 Burma 47 Hong Kong 48 lnd~a 49 Iran 50 Iraq 51 Israel 52 Japan 53 Jordan 54 Korea, Rep. 55 Malaysia 56 Nepal 57 Pakistan 58 Philippines 59 S~ngapore 60 Sri Lanka 61 Syrian Arab 62 Ta~wan 63 Thailand
EUROPE 64 Austr~a 65 Belgium 66 Cyprus 67 Denmark 68 Finland 69 France 70 Germany. Fed 71 Greece 72 Iceland
RGDP
2043 781 41 5
1694 379 940 490 338
1067 1177 337
5138 876 739 71 1
1410 460 605 828 549 344 250 682
1332 1261 705 563
1476 41 9 690 526 422
2354 860
1502 492 675
1857 535 277 296 672 930
306 432 359
3973 498
1796 2783 4041 5996 1064 2007 2204 405 663
1022 3948 838
2199 2522 1181
RGDP
6052 6293 3180 6746 5939 6678 6967 3946 5836
1980 RGDP* P c pC id PI g Pg
4053 497
1909 31 14 4081 5735 1018 201 1 2305 407 659
1010 3251 838
2203 2443 1169
RGDP*
5861 6084 3114 6336 5657 6679 6876 3922 6060
POP
18590 7080 3530 820
4510 8440 2220 4520 1540
41 990 32600
550 600
11 680 5010 7970
16400 1340 1860 8740 6160 6650 1630 990
20300 10470 5300
77080 4800 5660 3470 3640
29280 18370
560 17930 2700 6360
13200 6910
28290 5640 7400
22040 88700 35290 4840
6941 30 38080 13080 3950
11 6360 3190
37980 13640 14260 82440 51000 2430
14870 8640
17800 47670
POP
7480 9920 650
5100 4820
53450 60900 9330 230

73 Ireland 74 Italy 75 Luxembourg 76 Malta 77 Netherlands 78 Norway 79 Portugal 80 Spaln 81 Sweden 82 Switzerland 83 Turkey 84 United Kingdom
N. & CENT. AMERICA 85 Barbados 86 Canada 87 Costa R ~ c a 88 Domnican Re 89 El Salvador 90 Guatemala 91 Haiti 92 Honduras 93 Jamaica 94 Mexico 95 Nicaragua 96 Panama 97 Trimdad 98 United States
SOUTH AMERICA 99 Argentina
100 Bolivia 101 Braz~l 102 Chila 103 Colomb~a 104 Ecuador 105 Guyana 106 Paraguay 107 Peru 108 Surinam 109 Uruguay 110 Venezuela
Oceania 11 1 Australia 112 Fiji 113 lndones~a 114 New Zealand 115 Papua New Guinea

Country Bulgar~a China Czechoslovak~a Germany Dem. Rep Hungary Poland Romania U.S S.R. Yugoslavia
Country Bulgaria China Czechoslovak~a Germany Dem. Rep Hungary Poland Romanla U.S.S.R. Yugoslavia
Country Bulgaria China Czechoslovak~a Germany Dem. Rep. Hungary Poland Romanla U.S.S.R. Yugoslavia
Country Bulgaria China Czechoslovak~a Germany Dem Rep Hungary Poland Romania U.S.S.R. Yugoslavia
1950 RGDP POP
912 7250 300 547364 2182 12389 1480 18388 1543 9338 1516 24824 747 16311 1373 180075 769 16346
1958 RGDP POP 1418 7728 565 658179 2871 13474
17206 2087 9882 1894 28693
18056 1978 206775
1801 8
1966 RGDP POP 2376 8258 629 755277 3570 14224 3621 17058 2852 10185 2465 31532 1683 19141 2641 233533 1652 19644
1974 RGDP POP 3110 8679 838 929358 4508 14658 4726 16925 3503 10471 3467 33643 2309 21030 3584 252131 2593 21 148
1951 RGDP POP 1126 7258 353 538096 2195 12532
18344 1677 9423 1557 25262
16464 1406 183190
16658
1959 RGDP POP 1523 7798 527 673039 2979 13565
17132 2163 9937 1920 29152
18226 2044 210498
18214
1967 RGDP POP 2487 8310 593 774945 3717 14277 3737 17082 3002 10223 2532 31785 1746 19285 2739 235994 1694 19840
1975 RGDP POP 3358 8721 883 946721 4607 14772 4923 16850 3559 10532 3595 33969 2390 21245 3636 254469 2591 21343
Panel 6. C e n t r a l l y Planned Economies 1952 1953 1954
RGDP POP RGDP POP RGDP POP 1074 7275 1187 7346 1147 7423 392 569904 408 582640 418 596335 2237 12683 2209 12820 2270 12952
18303 181 64 17993 1717 9504 1731 9595 1770 9706 1560 25781 1620 26221 1682 26715
16630 16847 17040 1469 188377 1518 189490 1576 192709
16798 17048 17284
1960 1961 1962 RGDP POP RGDP POP RGDP POP 1652 7867 1719 7943 1843 8013 505 680208 398 680310 436 682579 3189 13654 3280 13779 3309 13858 3006 17058 3066 16938 3146 16903 2272 9984 2369 10029 2459 10063 1996 29590 2128 29979 2072 30330 1204 18403 1289 18567 1308 18681 2084 214329 2193 218145 2239 221730 1256 18402 1310 18612 1341 18819
1968 1969 1970 RGDP POP RGDP POP RGDP POP 2512 8370 2649 8434 2738 8490 585 796238 627 819419 711 842867 3868 14323 3924 14284 4027 14319 3902 17084 3998 17076 4100 17070 3024 10264 3108 10303 3077 10337 2652 32035 2622 32281 2731 32526 1741 19721 1793 20010 1801 20253 2871 238317 2932 240554 3142 242766 1755 20029 1955 20209 2027 20371
1976 1977 1978 RGDP POP RGDP POP RGDP POP 3500 8759 3407 8804 3455 8814 865 962278 926 976248 1017 990040 4651 14884 4805 14990 4852 15089 5027 16786 5174 16765 5264 16756 3552 10589 3760 10637 3843 10673 3650 34299 3674 34621 3770 34929 2627 21446 2669 21658 2761 21885 3748 256760 3844 259029 3866 261253 2702 21545 2897 21746 3124 21935
1955 RGDP POP 1217 7499 445 611026 2444 13093
17832 1907 98250 1733 27221
17325 1686 196159 879 17519
1963 RGDP POP 1901 8078 486 693226 3225 13948 3237 16951 2594 10091 2169 30662 1358 18813 2202 225063 1459 19029
1971 RGDP POP 2824 8536 736 866329 4148 14381 4195 17061 3209 10365 2918 32778 2047 20470 3237 2451 10 2182 20572
1979 RGDP POP 3555 8826 1074 1004015 4856 15182 5409 16745 3856 10698 3668 35257 2839 22048 3891 263425 3229 221 15
1956 RGDP POP 1205 7576 470 626384 2559 13229
17607 1803 991 1 1772 27744
17583 1791 199658
17685
1964 RGDP POP 2083 8144 522 712540 3353 14052 3370 16983 2732 10124 2233 30976 1444 18927 2384 228149 1584 19222
1972 RGDP POP 2944 8576 750 889337 4274 14456 4345 17043 3269 10398 3106 33040 2158 20663 3262 247501 2243 20769
1980 RGDP POP 3437 8862 1135 1017561 4908 15225 5532 16737 3861 10711 3509 35578 2766 22201 3943 265542 3318 22295
1957 RGDP POP 1319 7651 484 642261 2689 13358
17370 1966 9839 1834 28235
17829 1877 203169
17859
1965 RGDP POP 2215 8201 570 734493 3452 14147 3525 17020 2706 10153 2330 31262 1517 19027 2507 230936 1590 19434
1973 RGDP POP 3042 8621 831 910525 4385 14549 4497 16980 3428 10426 3309 33331 2211 20828 3484 249802 2278 20952

Notes to Data Table
A Definitions of Variables
yjt. RGDY,,/RGDYUs, RGDPi,: Real gross domestic income per caplta (current international prices) RGDP,,: Real gross domestic income per capita (1975 international prices) RGDP;: Real gross domestic product per capita adjusted for changes in the terms of trade (Domestic absorption In 1975 international prices; net foreign balance in current prlces) c,,: Percentage of real gross domestic product devoted to consumption (1975 international prices) i;,: Percentage of real gross domestic product devoted to gross domestic investment (1975 international prices) git: Percentage of real gross domestic product devoted to government (1975 international prices) F,, Prlce level for gross domestic income (PPP;/Exchange Rateg) P;: Price level for consumption (PPP~/Exchange Rate,,) P),: Price level for gross domestic investment (PPP$~xchan~e Ratei,) P:: Price level for government ( P ~ ~ ; / ~ x c h a n ~ e Rate,,) POPit: Populat~on (in thousands) A: The difference between 1970-based and 1975 cross section estimates of country's real domestic absorption. (?%I- ?!%I)+ [(ij,:] +i!,;tl) +2]. Q: Quality rating: D: Fair; C: Good; B: Better; A: Best B. Country Numbers
From 1960 to 1980 all countries are represented in the Data Table. and each has the same serial number beside its name. Prior to 1960, the number beside each country's name corresponds to the 1960 t o 1980 number; the right hand column in these years gives the serial number for each year C. Benchmark Error Factors
Kenya (0.748). Malawi (0.883). Zambia (0.7301, India (1.053), Iran (1.042). Japan (0.990). Korea (1.208). Malaysia (1 093). Pakistan (1.WO). Philippmes (1.044). Sri Lanka (1.361). Syria (1.136), Thailand (1.134). Austria (1.019). Belgium (1.048), Denmark (1.030), France (1.003). Germany (0.986), Ireland (0.956). Italy (0.942). Luxembourg (1.136), Netherlands (1.067). Spain (1.078), U.K. (1.016), Brazil (0.808). Columbia (1.222), Jamaica (0.837). Mexico (0.942). Uruguay (1.157), and US. (1.00 because it is numeraire).
Copyright © 2022 FDOKUMEN


![Nurit Govrin Bibliography (1950-2004) [In Hebrew]](https://static.fdokumen.com/doc/165x107/63147739c32ab5e46f0ce692/nurit-govrin-bibliography-1950-2004-in-hebrew.jpg)