Exchange rate exposure, hedging, and the use of foreign currency derivatives
24
Journal of International Money and Finance 20 (2001) 273–296 www.elsevier.nl/locate/econbase Exchange rate exposure, hedging, and the use of foreign currency derivatives George Allayannis a,* , Eli Ofek b a Darden Graduate School of Business Administration, University of Virginia, PO Box 6550, Charlottesville, VA 22906, USA b Stern School of Business, New York University, 44 West 4th St. #908, New York, NY 10012, USA Abstract We examine whether firms use foreign currency derivatives for hedging or for speculative purposes. Using a sample of S&P 500 nonfinancial firms for 1993, we find evidence that firms use currency derivatives for hedging, as their use, significantly reduces the exchange- rate exposure firms face. We also find that, while the decision to use derivatives depends on exposure factors (i.e., foreign sales and foreign trade) and on variables largely associated with theories of optimal hedging (i.e., size and R&D expenditures), the level of derivatives used depends only on a firm’s exposure through foreign sales and trade. 2001 Elsevier Science Ltd. All rights reserved. JEL classification: F23; F30; G30 Keywords: Risk management; Multinationals; Corporate policies; Foreign trade 1. Introduction Exchange-rate movements affect expected future cash flows, and therefore the value, of large multinationals, small exporters (importers) and import competitors, by changing the home currency value of foreign revenues (costs) and the terms of competition. In light of this, it is surprising that previous research in the area (Jorion, 1990; Amihud, 1993; Bodnar and Gentry, 1993) finds that US multinationals, exporters, and manufacturing industries are not significantly affected by exchange- rate movements. * Corresponding author. Tel.: + 1-804-924-3434; fax: + 1-804-243-5021. E-mail address: [email protected] (G. Allayannis). 0261-5606/01/$ - see front matter 2001 Elsevier Science Ltd. All rights reserved. PII:S0261-5606(00)00050-4
Transcript of Exchange rate exposure, hedging, and the use of foreign currency derivatives
Journal of International Money and Finance20 (2001) 273–296
www.elsevier.nl/locate/econbase
Exchange rate exposure, hedging, and the useof foreign currency derivatives
George Allayannisa,*, Eli Ofek b
a Darden Graduate School of Business Administration, University of Virginia, PO Box 6550,Charlottesville, VA 22906, USA
b Stern School of Business, New York University, 44 West 4th St. #908, New York, NY 10012, USA
Abstract
We examine whether firms use foreign currency derivatives for hedging or for speculativepurposes. Using a sample of S&P 500 nonfinancial firms for 1993, we find evidence thatfirms use currency derivatives for hedging, as their use, significantly reduces the exchange-rate exposure firms face. We also find that, while the decision to use derivatives depends onexposure factors (i.e., foreign sales and foreign trade) and on variables largely associated withtheories of optimal hedging (i.e., size and R&D expenditures), the level of derivatives useddepends only on a firm’s exposure through foreign sales and trade. 2001 Elsevier ScienceLtd. All rights reserved.
JEL classification:F23; F30; G30
Keywords:Risk management; Multinationals; Corporate policies; Foreign trade
1. Introduction
Exchange-rate movements affect expected future cash flows, and therefore thevalue, of large multinationals, small exporters (importers) and import competitors,by changing the home currency value of foreign revenues (costs) and the terms ofcompetition. In light of this, it is surprising that previous research in the area (Jorion,1990; Amihud, 1993; Bodnar and Gentry, 1993) finds that US multinationals,exporters, and manufacturing industries are not significantly affected by exchange-rate movements.
* Corresponding author. Tel.:+1-804-924-3434; fax:+1-804-243-5021.E-mail address:[email protected] (G. Allayannis).
0261-5606/01/$ - see front matter 2001 Elsevier Science Ltd. All rights reserved.PII: S0261 -5606(00 )00050-4
274 G. Allayannis, E. Ofek / Journal of International Money and Finance 20 (2001) 273–296
One possible explanation is the fact that corporations make extensive use offoreign currency derivatives and other hedging instruments (e.g., foreign debt) toprotect themselves from unexpected movements of exchange rates.1 To the extentthat US multinationals, exporters, and importers fully cover their exposure toexchange-rate movements, we should not expect to find any effect of exchange-ratemovements on firms’ values. However, derivatives can also be used for speculativepurposes, as alleged in the much publicized stories of Procter & Gamble and Met-allgesellschaft. This creates a genuine concern for investors and regulators as to whatrole derivatives play in a corporation.
In this paper, we examine whether firms use foreign currency derivatives for hedg-ing or for speculative purposes. In particular, to identify a firm’s hedging or speculat-ive behavior in the data, we examine (a) the effect of foreign currency derivativeuse on its exchange-rate exposure and (b) the determinants of the amount of deriva-tive use. We measure exchange-rate exposure as the sensitivity of the value of thefirm, proxied by the firm’s stock return, to an unanticipated change in an exchangerate, as defined in Adler and Dumas (1984). We test the hypothesis that using foreigncurrency derivatives for hedging reduces a firm’s foreign exchange-rate exposure,and that the degree to which firms use derivatives is related to its exposure throughforeign sales and foreign trade.
Many papers examine which theory of optimal hedging is consistent with the useof derivatives that we observe in the data.2 However, there is no direct evidence thatderivatives are actually used to hedge. Hentschel and Kothari (1997) and Simkinsand Laux (1997) examine directly firms’ use of currency derivatives, but the formerdoes not find any evidence and the latter finds only weak evidence that their useinfluences exposure. However, given that a firm’s exchange-rate exposure is determ-ined by both its real operations (i.e., foreign sales) and its financial hedging activities,we estimate a multivariate regression that links a firm’s exposure to both those fac-tors. This contrasts with Hentschel and Kothari, who rely only on univariate tests.We also use a continuous variable for hedging, instead of the dummy variable usedby Simkins and Laux. When the dummy is used by itself, it appears to be negativelyrelated to a firm’s exposure. However, when the authors use their measure of hedgingand foreign sales in the same model, the effect of the hedging dummy is no longersignificant and its sign (positive) is inconsistent with the hypothesis that firms usederivatives to hedge.
Using a sample of S&P 500 nonfinancial firms for 1993, we find that a firm’sexchange-rate exposure is positively related to its ratio of foreign sales to total sales,
1 There are several theories that suggest why it may be optimal for a firm to hedge (e.g., Stulz, 1984;Smith and Stulz, 1985; Froot et al., 1993; DeMarzo and Duffie, 1995).
2 See, e.g., Nance et al. (1993), Dolde (1993), Francis and Stephan (1990) and Mian (1996) for alltypes of derivatives; Tufano (1996) and Haushalter (2000) for commodity derivatives; and Geczy et al.(1997) for foreign currency derivatives.
275G. Allayannis, E. Ofek / Journal of International Money and Finance 20 (2001) 273–296
and negatively related to its ratio of foreign currency derivatives to total assets.3 Theseassociations are significant at the 1% level and robust to alternative time periods,exchange-rate indices, and estimation techniques. We also find this result robust to theuse of an alternative sample, which includes all US manufacturing firms with assetsabove 100 million during 1994 and 1995. Finally, we obtain similar results usingindividual exchange rates (e.g., the US dollar/Japanese yen and the US/Canadian dollarexchange rate), instead of an exchange-rate index. Our evidence supports the hypoth-esis that firms use foreign currency derivatives, not to speculate in the foreign exchangemarkets, but as protection against exchange-rate movements. It also provides an expla-nation for the lack of significant exchange-rate exposure that has been documented inpast studies. In addition, our results confirm and extend those of Jorion (1990), whouses a sample of major US multinationals to show that a firm’s exchange-rate exposureis positively related to its ratio of foreign sales to total sales.
We use a two-stage framework (Cragg, 1971), to examine what determines cor-porations’ level of derivative use. This two-stage process allows us to examine separ-ately a firm’s decision to hedge from its decision of how much to hedge. Similar toGeczy et al. (1997), we find that firms with larger size, R&D expenditures, andexposure to exchange rates through foreign sales or foreign trade are more likely touse currency derivatives. These results are consistent with the Froot et al. (1993)theory of optimal hedging, and also high fixed start-up costs of hedging explanations.While these tests reveal the factors that prompt corporations to hedge, they do notanswer the question of what determines the extent of hedging. Using—in the secondstage of the estimation—the notional amount of currency derivatives for those firmsthat chose to hedge, we find that exposure factors (foreign sales and foreign trade)are the sole determinants of the degree of hedging. In other words, given that a firmdecides to hedge, the decision of how much to hedge is affected solely by itsexposure to foreign currency movements through foreign sales and trade. This result
3 Clearly, the effect of exchange rates on share prices should be proportional tonet revenues denomi-nated in foreign currency—that is, foreign currency denominated revenues minus foreign currencydenominated expenses—not, gross revenues. Firms, however, are only required to report foreign revenues(and only if foreign revenues are above 10% of total revenues) and provide no useful information aboutforeign expenses. Nevertheless, the use of the ratio of foreign sales to total sales should be a good proxyof the percentageof net foreign revenues (out of total revenues), if foreign profit margins are similar todomestic margins. In that case, the ratio of foreign sales to total sales is proportional to the ratio offoreign net revenues to total net revenues. Also, the use of gross derivative positions, instead of netpositions that we have to use in our tests due to data limitations in the derivatives reporting in the annualreports may introduce noise to our test; however, there is some evidence that firms first net positions inthe same currency before aggregating them. In other words, a long yen and a short yen forward positionwill first be netted out. Note also that our hypothesis predicts a relationship between the absolute valueof derivatives and the absolute value of exposure; that is, a higher level of derivatives should be associatedwith a lower level of exposure in absolute value, if derivatives are used for hedging. Therefore, the lackof a sign in the derivatives data due to reporting limitations should not introduce any specific systematicbias. Also, to the degree that there are other sources of exposure, direct or indirect that are omitted inthe regression, this would cause bias towards insignificance. Therefore, our finding that hedging is associa-ted with lower exposure is despite the fact that hedgers had initially larger exposures than nonhedgers—exposures that may not exactly be captured through our proxies.
276 G. Allayannis, E. Ofek / Journal of International Money and Finance 20 (2001) 273–296
provides additional support to our hypothesis that firms use currency derivatives forhedging purposes.
Finally, foreign debt can be another way to hedge foreign currency exposure. Asin the case of foreign currency derivatives, we examine separately a firm’s decisionto issue foreign debt and its decision of how much foreign debt to issue. Again, wefind that exposure through foreign sales is positively and significantly related to afirm’s decision to issue foreign debt and to the level of foreign debt. Overall, thesefindings are consistent with our hypothesis that firms use foreign debt to hedge theirexchange-rate exposure.
The paper is organized as follows: Section 2 describes our sample; Section 3presents the tests of the relation between exchange-rate exposure and foreign cur-rency derivatives; Section 4 presents the tests on the use and amount of foreigncurrency derivatives; and Section 5 concludes.
2. Sample description
SFAS 105 requires firms to report information on financial instruments with off-balance sheet risk (e.g., futures, forwards, options, and swaps) for fiscal years endingafter June 15, 1990. In particular, firms must report the face, contract, or notionalamount of the financial instrument, and information on the credit and market riskof those instruments, the cash requirements, and the related accounting policy. Withthe exception of futures contracts, disclosure was very limited for other off-balancesheet risk financial instruments prior to SFAS 105.
We obtain data on year-end notional value of forward contracts reported in thefootnotes of the annual reports of all the S&P 500 nonfinancial firms in 1993. Weexclude S&P 500 financial firms, because most of them are also market-makers inforeign currency derivatives; hence, their motivation for using derivatives could bevery different from that of the nonfinancial firms. Our sample’s notional values offoreign currency derivatives also include foreign currency options, if a firm discloseda combined number. However, these values do not include foreign currency swaps.Currency swaps are mainly used by corporations in conjunction with foreign debt,effectively translating foreign debt into domestic liability. In the Bodnar et al. (1995)report of a survey on the use of derivatives of a large sample of US nonfinancialcorporations, the instrument used by 48% of the firms in the sample to manageexchange-rate risk was forwards.
Using the dollar notional value of foreign currency derivatives has several advan-tages over using a binary variable to indicate whether or not a firm uses foreigncurrency derivatives. For example, by using this continuous variable, we can testhypotheses on the determinants of the amount of hedging and examine the impactof a firm’s currency derivative use on its exchange-rate exposure. However, a disad-vantage of this measure is that since firms were not required to disclose the directionof the hedge during the period of our tests, we do not know whether the amountsof foreign currency derivatives represent a short or a long position in the underlyingcurrency. This drawback in the data should not introduce any specific systematic
277G. Allayannis, E. Ofek / Journal of International Money and Finance 20 (2001) 273–296
bias though, as our hypothesis relates the absolute value of derivatives used withthe absolute value of exposure. Also, with the exception of a handful of firms, firmsdo not break down derivatives amounts by individual currency. However, they seemto first net positions in individual currencies before aggregating them. Despite thepossible measurement error introduced by such aggregation, our continuous variablenevertheless provides valuable insights.
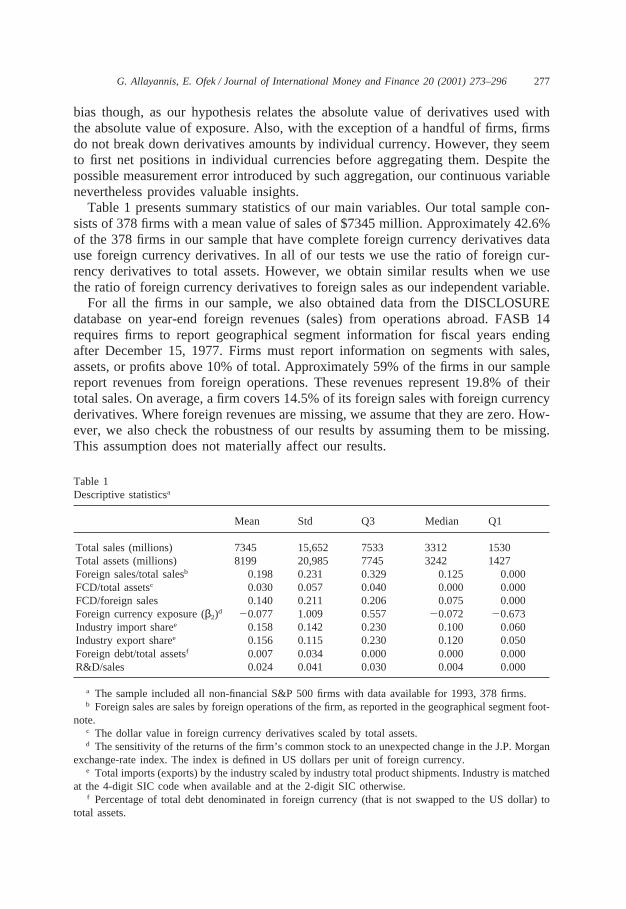
Table 1 presents summary statistics of our main variables. Our total sample con-sists of 378 firms with a mean value of sales of $7345 million. Approximately 42.6%of the 378 firms in our sample that have complete foreign currency derivatives datause foreign currency derivatives. In all of our tests we use the ratio of foreign cur-rency derivatives to total assets. However, we obtain similar results when we usethe ratio of foreign currency derivatives to foreign sales as our independent variable.
For all the firms in our sample, we also obtained data from the DISCLOSUREdatabase on year-end foreign revenues (sales) from operations abroad. FASB 14requires firms to report geographical segment information for fiscal years endingafter December 15, 1977. Firms must report information on segments with sales,assets, or profits above 10% of total. Approximately 59% of the firms in our samplereport revenues from foreign operations. These revenues represent 19.8% of theirtotal sales. On average, a firm covers 14.5% of its foreign sales with foreign currencyderivatives. Where foreign revenues are missing, we assume that they are zero. How-ever, we also check the robustness of our results by assuming them to be missing.This assumption does not materially affect our results.
Table 1Descriptive statisticsa
Mean Std Q3 Median Q1
Total sales (millions) 7345 15,652 7533 3312 1530Total assets (millions) 8199 20,985 7745 3242 1427Foreign sales/total salesb 0.198 0.231 0.329 0.125 0.000FCD/total assetsc 0.030 0.057 0.040 0.000 0.000FCD/foreign sales 0.140 0.211 0.206 0.075 0.000Foreign currency exposure (β2)d 20.077 1.009 0.557 20.072 20.673Industry import sharee 0.158 0.142 0.230 0.100 0.060Industry export sharee 0.156 0.115 0.230 0.120 0.050Foreign debt/total assetsf 0.007 0.034 0.000 0.000 0.000R&D/sales 0.024 0.041 0.030 0.004 0.000
a The sample included all non-financial S&P 500 firms with data available for 1993, 378 firms.b Foreign sales are sales by foreign operations of the firm, as reported in the geographical segment foot-
note.c The dollar value in foreign currency derivatives scaled by total assets.d The sensitivity of the returns of the firm’s common stock to an unexpected change in the J.P. Morgan
exchange-rate index. The index is defined in US dollars per unit of foreign currency.e Total imports (exports) by the industry scaled by industry total product shipments. Industry is matched
at the 4-digit SIC code when available and at the 2-digit SIC otherwise.f Percentage of total debt denominated in foreign currency (that is not swapped to the US dollar) to
total assets.
278 G. Allayannis, E. Ofek / Journal of International Money and Finance 20 (2001) 273–296
3. Exchange-rate exposure and currency derivatives
In this section, we examine the impact of the use of derivatives on exchange-rateexposure. Our hypothesis is that if firms use foreign currency derivatives to protectthemselves from exchange-rate movements (i.e., as a hedge), then we should expectthat derivatives will reduce exchange-rate exposure. We first present our method-ology, and then our tests and results.
3.1. Estimation framework
Dumas (1978), Adler and Dumas (1984) and Hodder (1982) define economicexposure to exchange-rate movement as the regression coefficient of the value ofthe firm on the exchange rate across states of nature. However, the definition doesnot imply that exchange-rate fluctuations cause changes in firms’ values. Indeed, inAdler and Dumas, stock prices and exchange rates are both endogenous variablesand determined simultaneously. However, for an individual firm, we can safelyassume that exchange rates are exogenous.
In line with the definition above, previous research in this area4 uses the followingmodel to estimate a firm’s exchange-rate exposure:
Rit5b0i1b1iRmt1b2iFXIt1eit,t51,...T, (1)
where
Rit is the rate of return on theith firm’s common stock in periodt,Rmt is the rate of return on the market portfolio in periodt,FXIt is the rate of return on a moving, trade-weighted exchange rate index, meas-
ured in US dollars per unit of foreign currencies in periodt5.
In Eq. (1), b2i represents the exchange-rate exposure. Similar to a market beta,the exchange-rate exposure measures the percentage change in the rate of return ona firm’s common stock against a 1% change in the exchange rate. Because we areinterested in examining the relation between exchange-rate exposure and currencyderivative use, we use J.P. Morgan’s ‘narrow,’ trade-weighted, nominal exchange-rate index, which measures the strength of the dollar relative to a basket of 18 otherOECD currencies.6 We choose this index because firms are more likely to use deriva-
4 See, e.g., Jorion (1990), Amihud (1993) and Allayannis (1996).5 This specification assumes that exchange rates and stock returns follow a random walk process, hence
the rate of return captures the unanticipated movements. In this framework, there is little differencebetween nominal and real exposure, since the largest percentage of variation comes from exchange rates,rather than inflation. Similarly, there is little difference in using excess returns (returns over the risk-freerate), since the variation in interest rates is also relatively small compared to the variation in exchangerates.
6 The index is weighted to reflect bilateral trade in manufactures in 1990.
279G. Allayannis, E. Ofek / Journal of International Money and Finance 20 (2001) 273–296
tives in these currencies and derivatives are generally hedges against nominalexposure. However, we also examine the sensitivity of our results by using a real,much broader index (RX-101) published by the Federal Reserve Bank of Dallas,which measures the strength of the dollar against 101 of the US’s trading partners.Finally, to control for the market movements, we use the CRSP monthly value-weighted market index.
We estimate the exchange-rate exposure of the firms in our sample using model1. We estimate each firm’s exposure in our 1993 sample using monthly return dataduring the three years surrounding 1993 (1992–94). This is appropriate, since wewant to measure the contemporaneous impact of foreign currency derivatives on afirm’s exchange-rate exposure. However, we also use a longer time interval (fiveyears) to estimate exposures between 1991 and 1995. Finally, we use monthly datainstead of daily or weekly, since daily and weekly exchange rate indices are noisierand usually suffer from nonsynchroneity problems (nonalignment of stock-return andexchange-rate series).
In the second stage, we examine the potential impact of a firm’s currency deriva-tive use on its exchange-rate exposure. Exchange-rate exposure is simultaneouslydetermined by a firm’s real operations (which we proxy through foreign sales) and itsfinancial hedging. Therefore, we include both factors in the cross-sectional regressionequation shown below:
b̂2i5a1i1a2i(FS/TS)i1a3i(FCD/TA)i1hi,i51,...N, (2)
where
b̂2i is a firm’s exchange-rate exposure estimated in (1),(FS/TS)i is a firm’s ratio of foreign sales to total sales,(FCD/TA)i is a firm’s ratio of foreign currency derivatives to total assets.
3.2. Tests and results
Given the definition of our index in US dollars per unit of foreign currency, anappreciation of the dollar would decrease the index. We expect an exporter or a firmwith revenues from operations abroad to be hurt by an exchange-rate appreciation(i.e., the return on its stock should decrease), thus producing apositiveexchange-rate exposure. However, if a firm is an importer, then an appreciation of the dollarshould benefit it (i.e., the return on its stock should increase), producing anegativeexposure.7 For a given exposure, an increase in revenues from foreign operationsshould increase exposure. Hence, our hypothesis suggests that exchange-rateexposure should be positively related to the ratio of foreign sales to total sales.
7 For theoretical models predicting this relation between a dollar appreciation and anexporter’s/importer’s value, see e.g., Levi (1993) and Shapiro (1975).
280 G. Allayannis, E. Ofek / Journal of International Money and Finance 20 (2001) 273–296
On the other hand, if firms use foreign currency derivatives to hedge againstexchange-rate movements, then the use of derivatives should reduce their foreignexchange exposure. That is, the use of derivatives should decrease exchange-rateexposure for firms with positive exposures and increase (decrease in absolute value)exchange-rate exposure for firms with negative exposures. Therefore, if firms usederivatives as a hedge against exchange-rate movements, the absolute values ofderivatives used should be negatively related to the absolute values of the exchange-rate exposures. If, on the other hand, firms use derivatives to speculate in the foreignexchange market, we should expect a positive relation between the absolute valuesof derivatives used and the absolute values of exchange-rate exposures. Hence, weneed a two-tail test. We cannot hypothesize any relation between the absolute valueof foreign currency exposure and the ratio of foreign sales to total sales, or betweenforeign currency exposure and (absolute value of) currency derivative used.
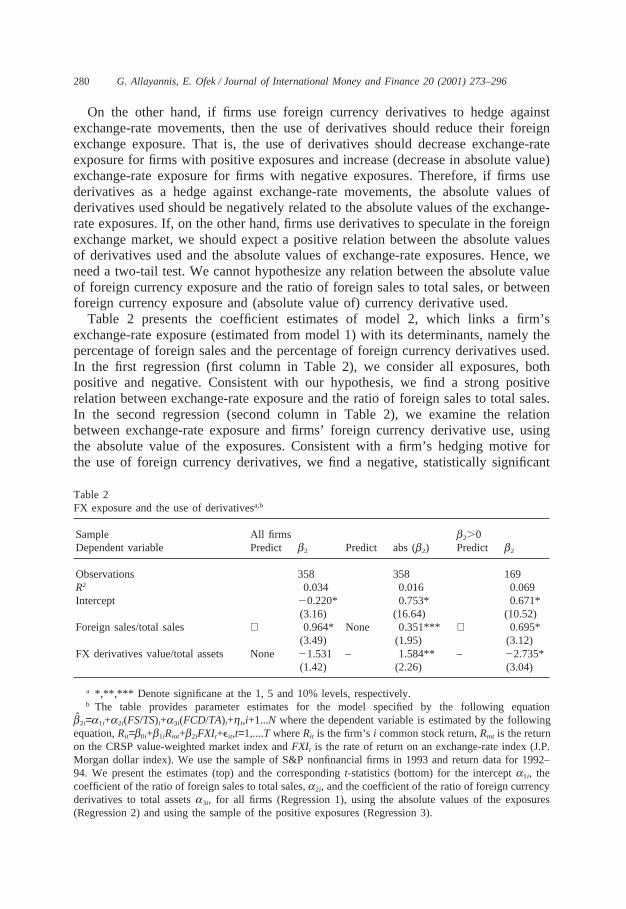
Table 2 presents the coefficient estimates of model 2, which links a firm’sexchange-rate exposure (estimated from model 1) with its determinants, namely thepercentage of foreign sales and the percentage of foreign currency derivatives used.In the first regression (first column in Table 2), we consider all exposures, bothpositive and negative. Consistent with our hypothesis, we find a strong positiverelation between exchange-rate exposure and the ratio of foreign sales to total sales.In the second regression (second column in Table 2), we examine the relationbetween exchange-rate exposure and firms’ foreign currency derivative use, usingthe absolute value of the exposures. Consistent with a firm’s hedging motive forthe use of foreign currency derivatives, we find a negative, statistically significant
Table 2FX exposure and the use of derivativesa,b
Sample All firms b2.0Dependent variable Predict b2 Predict abs (b2) Predict b2
Observations 358 358 169R2 0.034 0.016 0.069Intercept 20.220* 0.753* 0.671*
(3.16) (16.64) (10.52)Foreign sales/total sales + 0.964* None 0.351*** + 0.695*
(3.49) (1.95) (3.12)FX derivatives value/total assets None 21.531 – 1.584** – 22.735*
(1.42) (2.26) (3.04)
a *,**,*** Denote significane at the 1, 5 and 10% levels, respectively.b The table provides parameter estimates for the model specified by the following equation
b̂2i=a1i+a2i(FS/TS)i+a3i(FCD/TA)i+hi,i+1...N where the dependent variable is estimated by the followingequation,Rit=b0i+b1iRmt+b2iFXIt+eit,t=1,....T whereRit is the firm’si common stock return,Rmt is the returnon the CRSP value-weighted market index andFXIt is the rate of return on an exchange-rate index (J.P.Morgan dollar index). We use the sample of S&P nonfinancial firms in 1993 and return data for 1992–94. We present the estimates (top) and the correspondingt-statistics (bottom) for the intercepta1i, thecoefficient of the ratio of foreign sales to total sales,a2i, and the coefficient of the ratio of foreign currencyderivatives to total assetsa3i, for all firms (Regression 1), using the absolute values of the exposures(Regression 2) and using the sample of the positive exposures (Regression 3).
281G. Allayannis, E. Ofek / Journal of International Money and Finance 20 (2001) 273–296
association between the absolute value of the exposures and the (absolute value) ofthe percentage use of foreign currency derivatives.
However, the drawback of these regressions is that they only test predictions ofhow either foreign sales or currency derivatives affect exchange-rate exposure. Sincewe observe an ex-post exposure (beta) that is determined by both foreign operationsand financial hedging, the regression that does not include both factors suffers froman omitted variables problem. This problem could be more severe in this case,because the two factors, foreign sales and currency derivative use, are positivelycorrelated. To include both variables in the regression, we must focus either on thepositive or the negative exposures. Because the presence of foreign sales creates apositive exposure, we chose to perform our multivariate tests by using the sampleof positive exposures. In addition, foreign sales is an exposure factor for which firm-level data is available, in contrast to imports and exports, for which only industry-level data are available.
We present results for the sample of firms with positive exposures in the thirdcolumn of Table 2. Consistent with our hypothesis that firms use currency derivativesas a hedge, we find evidence that exchange-rate exposure increases with the percent-age of foreign sales and decreases with the percentage of foreign currency deriva-tives. Our results on both the use of foreign currency derivatives and foreign salesare statistically significant at the 1% level.8
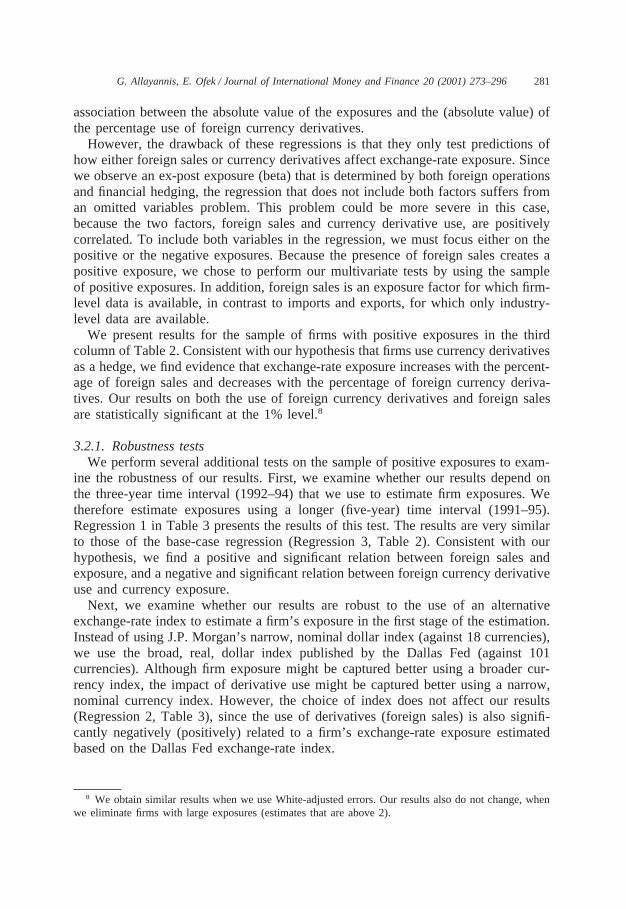
3.2.1. Robustness testsWe perform several additional tests on the sample of positive exposures to exam-
ine the robustness of our results. First, we examine whether our results depend onthe three-year time interval (1992–94) that we use to estimate firm exposures. Wetherefore estimate exposures using a longer (five-year) time interval (1991–95).Regression 1 in Table 3 presents the results of this test. The results are very similarto those of the base-case regression (Regression 3, Table 2). Consistent with ourhypothesis, we find a positive and significant relation between foreign sales andexposure, and a negative and significant relation between foreign currency derivativeuse and currency exposure.
Next, we examine whether our results are robust to the use of an alternativeexchange-rate index to estimate a firm’s exposure in the first stage of the estimation.Instead of using J.P. Morgan’s narrow, nominal dollar index (against 18 currencies),we use the broad, real, dollar index published by the Dallas Fed (against 101currencies). Although firm exposure might be captured better using a broader cur-rency index, the impact of derivative use might be captured better using a narrow,nominal currency index. However, the choice of index does not affect our results(Regression 2, Table 3), since the use of derivatives (foreign sales) is also signifi-cantly negatively (positively) related to a firm’s exchange-rate exposure estimatedbased on the Dallas Fed exchange-rate index.
8 We obtain similar results when we use White-adjusted errors. Our results also do not change, whenwe eliminate firms with large exposures (estimates that are above 2).
282 G. Allayannis, E. Ofek / Journal of International Money and Finance 20 (2001) 273–296
Tab
le3
FX
expo
sure
and
the
use
ofde
rivat
ives
a,b
Sam
ple
Pos
itive
fore
ign
curr
ency
expo
sureb 2.
0R
egre
ssio
nty
peO
LSO
LSO
LSW
LSP
robi
tD
epen
dent
varia
ble
b 2es
timat
edov
er5
yrR
X-1
01as
FX
inde
x19
92sa
mpl
et2
stat
.1.
648=
1w
eigh
ted
by1
ST
D(b 2
)ot
herw
ise=
0
Obs
erva
tions
174
172
131
169
169
R2
0.04
10.
076
0.02
50.
088
0.06
7In
terc
ept
0.46
6*0.
822*
0.63
3*0.
703*
20.
905*
(10.
65)
(10.
27)
(11.
45)
(10.
00)
(5.8
7)F
orei
gnsa
les/
tota
lsa
les
0.32
1**
1.05
9*0.
096
0.85
6*1.
345*
(2.2
3)(3
.65)
(0.5
5)(3
.52)
(2.6
5)F
Xde
rivat
ives
valu
e/to
tal
asse
ts21.
274*
*2
3.15
6**
20.
886*
**2
3.38
3*2
5.90
0**
(2.4
0)(2
.57)
(1.7
8)(3
.50)
(2.4
3)
a*,
**,*
**D
enot
esi
gnifi
cane
atth
e1,
5an
d10
%le
vels
,re
spec
tivel
y.b
The
tabl
epr
ovid
espa
ram
eter
estim
ates
for
the
mod
elsp
ecifi
edby
the
follo
win
geq
uatio
nb̂ 2
i=a
1i+a
2i(F
S/T
S)i+a
3i(F
CD
/TA
) i+h
i,i+
1...N
whe
reth
ede
pen-
dent
varia
ble
ises
timat
edby
the
follo
win
geq
uatio
n,Rit=b
0i+b 1
iRm
t+b 2
iFX
I t+e i
t,t=1
,....T
whe
reR
itis
the
firm
’si
com
mon
stoc
kre
turn
,Rm
tis
the
retu
rnon
the
CR
SP
valu
e-w
eigh
ted
mar
ket
inde
xan
dF
XI t
isth
era
teof
retu
rnon
anex
chan
ge-r
ate
inde
x(J
.P.
Mor
gan
dolla
rin
dex)
.W
epr
esen
tth
ees
timat
es(t
op)
and
the
corr
espo
ndin
gt-st
atis
tics
(bot
tom
)fo
rth
ein
terc
epta1i,
the
coef
ficie
ntof
the
ratio
offo
reig
nsa
les
toto
tal
sale
s,a
2i,
and
the
coef
ficie
ntof
the
ratio
offo
reig
ncu
rren
cyde
rivat
ives
toto
tal
asse
tsa3i,
for
the
case
sin
whi
chw
ees
timat
eex
posu
re.
We
use
afiv
e-ye
arin
terv
al(R
egre
ssio
n1)
,an
alte
rnat
ive
exch
ange
-rat
ein
dex
(Dal
las
Fed
RX
-101
)(R
egre
ssio
n2)
,th
eS
&P
500
firm
sth
atre
port
curr
ency
deriv
ativ
eda
tain
thei
r19
92an
nual
repo
rts
(Reg
ress
ion
3),
and
for
two
alte
rnat
ive
estim
atio
nte
chni
ques
(wei
ghte
dle
ast
squa
res
and
prob
it(R
egre
ssio
ns4
and
5).
283G. Allayannis, E. Ofek / Journal of International Money and Finance 20 (2001) 273–296
We also re-estimate the relation between exchange-rate exposure and currencyderivative use for the sample of S&P 500 nonfinancial firms that disclosed currencyderivative use in their 1992 annual reports (Regression 3, Table 3). Similar to ourbase-case regression, we estimate firms’ exposures using a three-year period (1991–93) and the J.P. Morgan dollar index. Our results, which suggest that currency deriva-tives are used for hedging, extend to the 1992 sample, as the use of currency deriva-tives significantly reduces firm exchange-rate exposure. In this sample, the ratio offoreign sales to total sales is also positively related to a firm’s exchange-rateexposure, but is not statistically significant.
Our last two alternative tests examine different estimation methods. First, we re-estimate model 2 by using weighted least squares. In this case, the weighting factoris the inverse of the standard error of the exposure coefficients estimated by model1. Weighted least squares assigns more weight to the more precise estimates andtherefore can increase the accuracy of our second-stage regression. The results,presented in Regression 4, remain unchanged. Again, consistent with our hypothesis,the use of currency derivatives significantly reduces a firm’s exchange-rate exposure.
Finally, we re-estimate model 2, using a probit estimation, in which the dependentvariable is a binary variable which equals one if a firm’s exposure is statisticallysignificant at the 10% level, and zero otherwise (Regression 5, Table 3). This pro-cedure could be viewed as an extreme weighting scheme under which only statisti-cally significant estimates are considered. Approximately 22% of the firms in oursample with positive exposures have statistically significant exposures. Again, theresults are consistent with our hypothesis.
3.2.2. Robustness tests: alternative samplesSo far, we have found our results to be robust to alternative time intervals,
exchange-rate indices (J.P. Morgan and Dallas Fed), and estimation techniques(weighted least squares or probit). While our robustness tests are not independent,they nevertheless strongly support our hypothesis that firms use currency derivativesas a hedge. In this section, we use an alternative sample—a much larger cross-sectionof firms—that allows us to examine the robustness of our results in later years (1994and 1995), to the inclusion of smaller firms, and to the use of individual exchangerates (instead of indices).
Specifically, we collect data on the use of currency derivatives for all US manufac-turing firms (i.e., all firms with primary 4-digit SIC between 2000 and 4000) withavailable data in Compustat, which have assets above 100 million in 1994 and 1995.There is a total of 916 firms that meet the criteria (thus a total of 1832 firm-yearobservations). As before, data on currency derivatives are collected from the foot-notes to firms’ annual reports. The mean value of assets (sales) in this sample is$3868 ($3577) million compared to $8199 ($7345) for the sample of S&P 500 non-financial firms used earlier.9 It is clear that this sample contains a lot of smallerfirms; this should make an investigation of the effectiveness of derivatives for such
9 This sample contains 204 firms that also belong to the S&P 500 nonfinancial firms.
284 G. Allayannis, E. Ofek / Journal of International Money and Finance 20 (2001) 273–296
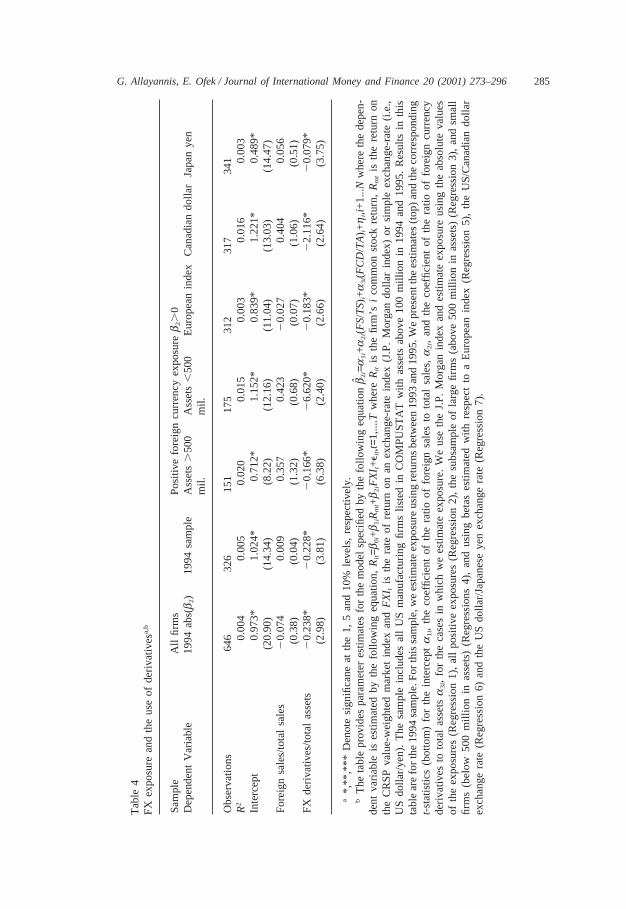
firms possible. Approximately 68% of the sample observations have foreign salesfrom operations abroad and for the entire sample, foreign sales account for 23% oftotal sales. However, for multinational firms (firms with foreign sales), foreign salesaccount for 33% of total sales. Approximately 34% of the firms in the sample usecurrency derivatives, and 41% of the firms in the sample of multinationals. For firmsthat use currency derivatives, currency derivatives are on average 7% of their totalassets. As in the previous tests, we use returns for the three-year period surroundingthe particular year of interest (i.e., we use returns for the 1993–95 period to estimateexposures and match them with derivative positions in 1994).
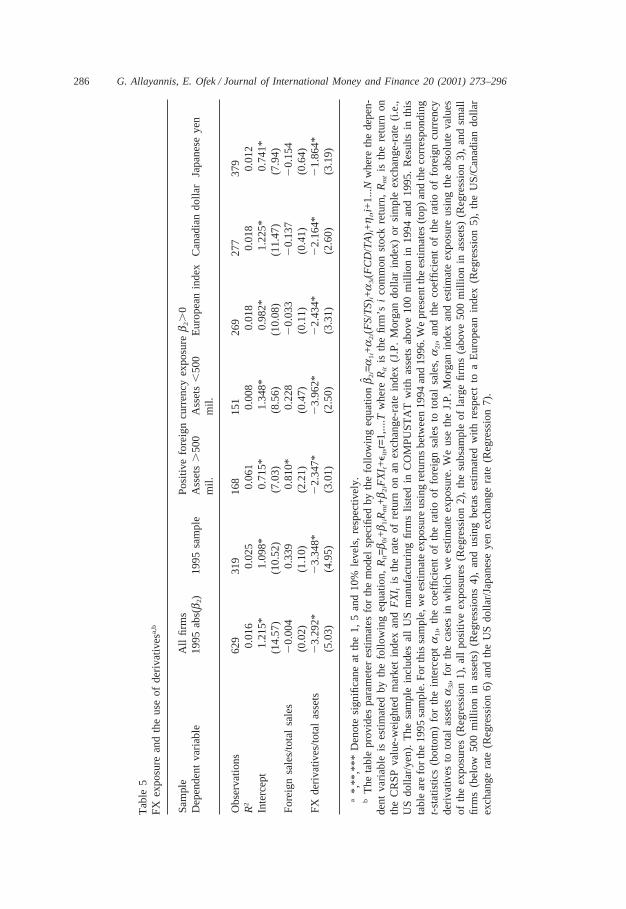
Our first test examines our hypothesis using the absolute value of exposures. Iffirms use derivatives for hedging, then the (absolute value of) currency derivativesused should be negatively related to the absolute value of currency exposure. Asexplained earlier, we do not expect any relationship between the ratio of foreignsales to total sales and the absolute value of exposure. Regression 1, Table 4 (Table5) presents the results for 1994 (1995). Consistent with our hypothesis that firmsuse derivatives as a hedge, we find a negative and significant relationship betweenthe use of derivatives and the absolute value of exposure both in 1994 and 1995.
Next, we examine whether our result that exposure is negatively related to theuse of currency derivatives holds using all firms with positive exposures. Regression2, Table 4 (Table 5) presents results for this test for 1994 (1995). Consistent withour hypothesis, we find that the percentage use of currency derivatives is negativelyand significantly related to a firm’s currency exposure, suggesting that firms usederivatives as a hedge. The coefficient on the ratio of foreign sales to total sales ispositive both in 1994 and in 1995, but is not statistically significant.10 We also exam-ine whether small firms use derivatives as effectively as large firms. Regressions 3and 4 show results for the firms in the sample that have assets above and below 500million respectively. We find similarly that small firms significantly reduce theirexposure through the use of derivatives. In general, we find that the coefficient valueson the use of currency derivatives vary from year to year, although they are alwaysnegative and highly significant.
Finally, we examine the robustness of our results to the use of an alternativeEuropean index and two individual exchange rates (the US/Canadian dollar exchangerate and the US dollar/Japanese yen exchange rate). One of the drawbacks of usinga common exchange-rate index for all firms, as we have done in the previous section,is that different firms have different patterns of global sales and hence the weightsmay be inappropriately applied to exchange rates that are not relevant for a givenfirm. Unfortunately, it is not possible to construct firm-specific exchange-rate indices,since that would require a breakdown of firm-sales on a country basis. Many firmsonly report sales broken down by continents, however, this information is also not
10 We also examine whether outliers in the estimates of exposures affect our results, by eliminatinglarge exposure estimates (estimates that are above 2). Consistent with our hypothesis, the coefficient onthe percent of currency derivatives used is negatively and significantly related to exposure. Moreover,the coefficient on the percent of foreign sales in 1995 (0.364) is also statistically significant at the 1%level (results not reported).
285G. Allayannis, E. Ofek / Journal of International Money and Finance 20 (2001) 273–296
Tab
le4
FX
expo
sure
and
the
use
ofde
rivat
ives
a,b
Sam
ple
All
firm
sP
ositi
vefo
reig
ncu
rren
cyex
posu
reb 2.
0D
epen
dent
Var
iabl
e19
94ab
s(b 2)
1994
sam
ple
Ass
ets.
500
Ass
ets,
500
Eur
opea
nin
dex
Can
adia
ndo
llar
Japa
nye
nm
il.m
il.
Obs
erva
tions
646
326
151
175
312
317
341
R2
0.00
40.
005
0.02
00.
015
0.00
30.
016
0.00
3In
terc
ept
0.97
3*1.
024*
0.71
2*1.
152*
0.83
9*1.
221*
0.48
9*(2
0.90
)(1
4.34
)(8
.22)
(12.
16)
(11.
04)
(13.
03)
(14.
47)
For
eign
sale
s/to
tal
sale
s2
0.07
40.
009
0.35
70.
423
20.
027
0.40
40.
056
(0.3
8)(0
.04)
(1.3
2)(0
.68)
(0.0
7)(1
.06)
(0.5
1)F
Xde
rivat
ives
/tota
las
sets
20.
238*
20.
228*
20.
166*
26.
620*
20.
183*
22.
116*
20.
079*
(2.9
8)(3
.81)
(6.3
8)(2
.40)
(2.6
6)(2
.64)
(3.7
5)
a*,
**,*
**D
enot
esi
gnifi
cane
atth
e1,
5an
d10
%le
vels
,re
spec
tivel
y.b
The
tabl
epr
ovid
espa
ram
eter
estim
ates
for
the
mod
elsp
ecifi
edby
the
follo
win
geq
uatio
nb̂ 2
i=a
1i+a
2i(F
S/T
S)i+a
3i(F
CD
/TA
) i+h
i,i+
1...N
whe
reth
ede
pen-
dent
varia
ble
ises
timat
edby
the
follo
win
geq
uatio
n,Rit=b
0i+b 1
iRm
t+b 2
iFX
I t+e i
t,t=1
,....T
whe
reR
itis
the
firm
’si
com
mon
stoc
kre
turn
,Rm
tis
the
retu
rnon
the
CR
SP
valu
e-w
eigh
ted
mar
ket
inde
xan
dF
XI t
isth
era
teof
retu
rnon
anex
chan
ge-r
ate
inde
x(J
.P.
Mor
gan
dolla
rin
dex)
orsi
mpl
eex
chan
ge-r
ate
(i.e.
,U
Sdo
llar/
yen)
.T
hesa
mpl
ein
clud
esal
lU
Sm
anuf
actu
ring
firm
slis
ted
inC
OM
PU
ST
AT
with
asse
tsab
ove
100
mill
ion
in19
94an
d19
95.
Res
ults
inth
ista
ble
are
for
the
1994
sam
ple.
For
this
sam
ple,
we
estim
ate
expo
sure
usin
gre
turn
sbe
twee
n19
93an
d19
95.W
epr
esen
tthe
estim
ates
(top
)an
dth
eco
rres
pon
ding
t-st
atis
tics
(bot
tom
)fo
rth
ein
terc
epta1i,
the
coef
ficie
ntof
the
ratio
offo
reig
nsa
les
toto
tal
sale
s,a
2i,
and
the
coef
ficie
ntof
the
ratio
offo
reig
ncu
rren
cyde
rivat
ives
toto
tal
asse
tsa3i,
for
the
case
sin
whi
chw
ees
timat
eex
posu
re.
We
use
the
J.P
.M
orga
nin
dex
and
estim
ate
expo
sure
usin
gth
eab
solu
teva
lues
ofth
eex
posu
res
(Reg
ress
ion
1),
allp
ositi
veex
posu
res
(Reg
ress
ion
2),
the
subs
ampl
eof
larg
efir
ms
(abo
ve50
0m
illio
nin
asse
ts)
(Reg
ress
ion
3),
and
smal
lfir
ms
(bel
ow50
0m
illio
nin
asse
ts)
(Reg
ress
ions
4),
and
usin
gbe
tas
estim
ated
with
resp
ect
toa
Eur
opea
nin
dex
(Reg
ress
ion
5),
the
US
/Can
adia
ndo
llar
exch
ange
rate
(Reg
ress
ion
6)an
dth
eU
Sdo
llar/
Japa
nese
yen
exch
ange
rate
(Reg
ress
ion
7).
286 G. Allayannis, E. Ofek / Journal of International Money and Finance 20 (2001) 273–296
Tab
le5
FX
expo
sure
and
the
use
ofde
rivat
ives
a,b
Sam
ple
All
firm
sP
ositi
vefo
reig
ncu
rren
cyex
posu
reb 2.
0D
epen
dent
varia
ble
1995
abs(b 2)
1995
sam
ple
Ass
ets.
500
Ass
ets,
500
Eur
opea
nin
dex
Can
adia
ndo
llar
Japa
nese
yen
mil.
mil.
Obs
erva
tions
629
319
168
151
269
277
379
R2
0.01
60.
025
0.06
10.
008
0.01
80.
018
0.01
2In
terc
ept
1.21
5*1.
098*
0.71
5*1.
348*
0.98
2*1.
225*
0.74
1*(1
4.57
)(1
0.52
)(7
.03)
(8.5
6)(1
0.08
)(1
1.47
)(7
.94)
For
eign
sale
s/to
tal
sale
s2
0.00
40.
339
0.81
0*0.
228
20.
033
20.
137
20.
154
(0.0
2)(1
.10)
(2.2
1)(0
.47)
(0.1
1)(0
.41)
(0.6
4)F
Xde
rivat
ives
/tota
las
sets
23.
292*
23.
348*
22.
347*
23.
962*
22.
434*
22.
164*
21.
864*
(5.0
3)(4
.95)
(3.0
1)(2
.50)
(3.3
1)(2
.60)
(3.1
9)
a*,
**,*
**D
enot
esi
gnifi
cane
atth
e1,
5an
d10
%le
vels
,re
spec
tivel
y.b
The
tabl
epr
ovid
espa
ram
eter
estim
ates
for
the
mod
elsp
ecifi
edby
the
follo
win
geq
uatio
nb̂ 2
i=a
1i+a
2i(F
S/T
S)i+a
3i(F
CD
/TA
) i+h
i,i+
1...N
whe
reth
ede
pen-
dent
varia
ble
ises
timat
edby
the
follo
win
geq
uatio
n,Rit=b
0i+b 1
iRm
t+b 2
iFX
I t+e i
t,t=1
,....T
whe
reR
itis
the
firm
’si
com
mon
stoc
kre
turn
,Rm
tis
the
retu
rnon
the
CR
SP
valu
e-w
eigh
ted
mar
ket
inde
xan
dF
XI t
isth
era
teof
retu
rnon
anex
chan
ge-r
ate
inde
x(J
.P.
Mor
gan
dolla
rin
dex)
orsi
mpl
eex
chan
ge-r
ate
(i.e.
,U
Sdo
llar/
yen)
.T
hesa
mpl
ein
clud
esal
lU
Sm
anuf
actu
ring
firm
slis
ted
inC
OM
PU
ST
AT
with
asse
tsab
ove
100
mill
ion
in19
94an
d19
95.
Res
ults
inth
ista
ble
are
for
the
1995
sam
ple.
For
this
sam
ple,
we
estim
ate
expo
sure
usin
gre
turn
sbe
twee
n19
94an
d19
96.W
epr
esen
tthe
estim
ates
(top
)an
dth
eco
rres
pon
ding
t-st
atis
tics
(bot
tom
)fo
rth
ein
terc
epta1i,
the
coef
ficie
ntof
the
ratio
offo
reig
nsa
les
toto
tal
sale
s,a
2i,
and
the
coef
ficie
ntof
the
ratio
offo
reig
ncu
rren
cyde
rivat
ives
toto
tal
asse
tsa3i,
for
the
case
sin
whi
chw
ees
timat
eex
posu
re.
We
use
the
J.P
.M
orga
nin
dex
and
estim
ate
expo
sure
usin
gth
eab
solu
teva
lues
ofth
eex
posu
res
(Reg
ress
ion
1),
allp
ositi
veex
posu
res
(Reg
ress
ion
2),
the
subs
ampl
eof
larg
efir
ms
(abo
ve50
0m
illio
nin
asse
ts)
(Reg
ress
ion
3),
and
smal
lfir
ms
(bel
ow50
0m
illio
nin
asse
ts)
(Reg
ress
ions
4),
and
usin
gbe
tas
estim
ated
with
resp
ect
toa
Eur
opea
nin
dex
(Reg
ress
ion
5),
the
US
/Can
adia
ndo
llar
exch
ange
rate
(Reg
ress
ion
6)an
dth
eU
Sdo
llar/
Japa
nese
yen
exch
ange
rate
(Reg
ress
ion
7).

287G. Allayannis, E. Ofek / Journal of International Money and Finance 20 (2001) 273–296
harmonized across firms. An alternative is to use individual exchange rates, which,at the minimum, alleviates the problem of index-weighting. Clearly, several firmsmay not be affected by the individual exchange rates that we use here, if, forexample, they have no foreign sales to those countries (Japan and Canada). However,as our results show [Regressions (5–7)], both during 1994 (Table 4) and 1995 (Table5), the use of currency derivatives is on average negatively and significantly relatedto a firm’s exposure to the Canadian dollar, the Japanese Yen as well as to theEuropean index. Note that foreign sales is not significantly related to exposure inthese tests.
In addition to the above tests, we have also performed the following tests usingthis alternative sample: (a) estimate exposures based on the index put forth by theDallas Fed; (b) use five-year return data, instead of three-year return data, (i.e.,returns between 1993 and 1997 for 1995 regressions); (c) use weighted least squaresand probit estimation techniques, similar to those shown in Table 3 for the 1993sample. Our results are robust to these alternative tests and continue to support thehypothesis that firms’ use of currency derivatives significantly reduces theirexchange-rate exposure (results not reported).
Our last test uses the orthogonalized JP Morgan index, instead of the index itself,to estimate exposures. It is possible that, if the market return and the exchange rateare collinear, exposures will be biased. To avoid this problem, we first run a modelin which we regress the exchange-rate index on the market and assume the residualsas the new—orthogonalized—index. Clearly, the orthogonalized index is uncorre-lated to the market by construction. We find that the regression of the J.P. Morganexchange-rate index on the market index is insignificant and that the market is notsignificantly related to the J.P. Morgan exchange-rate index. Nonetheless, we alsoexamined our hypothesis using the exposures based on the orthogonalized index. Theresults are virtually identical to those using the original index (results not reported).
Overall, our results are robust to sample, year, estimation technique, exchange-rate index (or individual currency) and size and show support for our hypothesisthat firms’ use of currency derivatives reduces their exchange-rate exposure. Inaddition, our results complement and extend those in Jorion (1990), in whichexchange-rate exposures of US multinationals are shown as positively related to theratio of foreign sales to total sales. By introducing the firms’ percentage of foreigncurrency derivatives in our tests, we can examine the role of derivatives by corpora-tions. Our results strongly confirm our hypothesis that firms use foreign currencyderivatives to hedge against exchange-rate movements, rather than to speculate inforeign exchange markets. Our results also provide an explanation for the lack ofsignificant exposure documented in past studies.
4. The determinants of the extent of hedging
4.1. Related literature
There are several theories of optimal hedging, most of which rely on the introduc-tion of some friction to the classical Modigliani and Miller paradigm. For example,
288 G. Allayannis, E. Ofek / Journal of International Money and Finance 20 (2001) 273–296
in Stulz (1984), corporate hedging arises as a result of managerial risk aversion. InSmith and Stulz (1985), the structure of the tax code (i.e., if taxes are progressive)or the transaction costs of financial distress could prompt firms to undertake hedgingactivities. In Froot et al. (1993), hedging mitigates the underinvestment problem thatwould result when cash flow is volatile and access to external financing is costly.Finally, in DeMarzo and Duffie (1995), corporate hedging is optimal when managershave private information on the firm’s expected payoff despite shareholders’ abilityto hedge by themselves.
Empirical examination of hedging theories has been difficult due to the generalunavailability of data on hedging activities. Until the beginning of the 1990s, a firm’sexact position in derivatives was privately held information, and was considered avery important component of strategic competitiveness. It is only recently that cor-porations have been required to disclose in footnotes in their annual reports, thenotional amount of derivatives they are using.
In the absence of reported information on derivatives, most of the earlier studiesused survey data to examine why firms use derivatives. For example, Nance et al.(1993) used survey data on Fortune 500 firms’ use of forwards, futures, swaps, andoptions and found that firms that hedged faced more convex tax functions, had lesscoverage of fixed claims, were larger, and had more growth options in their invest-ment opportunity set.
Recently, studies have focused on the type of hedging (commodity, interest rate,or currency), recognizing that different factors can be important for each type ofhedging. In particular, Geczy et al. (1997) examine currency hedging activities fora sample of Fortune 500 firms. They find that firms’ use of currency derivatives ispositively related to the amount of R&D expenditures, which is consistent with theuse of hedging to reduce underinvestment (e.g., Froot et al., 1993); size, which isconsistent with fixed-costs of hedging explanations; and exposure factors (foreignincome and trade). Tufano (1996) examines commodity hedging activities in the goldmining industry. He finds that firms’ use of commodity derivatives is negativelyrelated to the number of options their managers and directors hold, and positivelyrelated to the value of their stock holdings, evidence consistent with theories ofmanagerial risk aversion (e.g., Stulz, 1984). Haushalter (2000) examines the hedgingactivities of oil and gas producers. He finds that total debt ratio is positively relatedto the percentage of production hedged, which is consistent with theories of trans-action costs of financial distress. Visvanathan (1998) examines the use of interest rateswaps by S&P 500 nonfinancial firms, and also finds evidence supporting theories oftransaction costs of financial distress (e.g., Smith and Stulz, 1985).11 Finally, Mian(1996) investigates all three types of hedging activities for a sample of 3022 firmsand finds mixed evidence for theories of managerial risk aversion and taxes andevidence that strongly supports the hypothesis that hedging activities exhibit econom-ies of scale (i.e., that larger firms hedge more).
11 Earlier studies which examined interest rate hedging include Booth et al. (1984), Block and Gallagher(1986) and Wall and Pringle (1989).

289G. Allayannis, E. Ofek / Journal of International Money and Finance 20 (2001) 273–296
All of the studies cited above have examined which factors could be associatedwith the probability that a firm hedges. With the exception of Tufano (1996) andHaushalter (2000), who also examine the level of hedging in a particular industry(gold, and oil and gas respectively), no other study in the general derivatives areahas looked for the factors that are associated with the extent of hedging.
In this paper, we examine this question in the context of foreign currency hedgingand for a large cross-section of industries. Testing the determinants of the amountof hedging can provide additional evidence for the use of foreign currency derivativesas a hedge. In particular, if a firm uses such hedges, we expect its decision on howmuch to hedge to depend on its exposure through foreign sales and foreign trade.Our findings would add to the evidence of the previous section, suggesting that firmsuse currency derivatives to hedge.
4.2. Tests and results
A firm can make its hedging decision in one step, deciding whether or not tohedge and how much to hedge; or in two steps, deciding how much to hedge onlyafter it has decided to hedge. Ultimately, this is an empirical question. We test ithere in the context of foreign currency derivative use by firms. We model a firm’sone-step hedging decision using a Tobit method, because the continuous dependentvariable that we use on the percentage of foreign currency derivatives is censoredat zero (i.e., there are a significant number of zero observations). To model separatelya firm’s decision to hedge from its decision of how much to hedge, and identifythe relevant factors for each decision, we implement a two-stage process originallysuggested by Cragg (1971).
In contrast to the simple Tobit model which constraints the coefficients on thefactors associated with the decisions to hedge and how much to hedge to be thesame, the Cragg model allows these two decisions to be independent. In the firststage, using all firms, we estimate a binomial probit model in which the decision tohedge is related to variables that are broadly consistent with theories of optimalhedging and controls for exchange-rate exposure.12 In the second stage, using onlythose firms that chose to engage in hedging, we estimate a truncated regression usingtheamountof derivative use as a dependent variable. We find that a two-step decisionprocess fits the data better. Therefore, we examine further only the Cragg model’stests and results. Haushalter (2000) used a similar approach to examine the extentof oil and gas derivatives.
We first present the variables that proxy for optimal hedging theories and exposureto exchange-rate movements. We then proceed with the results of the Cragg model.We use similar variables to those used by Geczy et al. (1997). Specifically, to testtheories of hedging related to agency costs (underinvestment), we use the R&Dexpenditures, defined as the ratio of R&D to total sales; dividend yield, defined asthe ratio of total dividend paid to share price; and the ratio of market to book, defined
12 The dependent variable is a binary variable which equals one if the firm hedges and zero if it does not.

290 G. Allayannis, E. Ofek / Journal of International Money and Finance 20 (2001) 273–296
as the ratio of the sum of market value of equity and book value of debt to totalassets, as proxies for growth options in the firm’s investment opportunity. We usea tax dummy variable set equal to one if the firm has a tax-loss carryforward orinvestment tax credits, and zero otherwise, to test theories related to the reductionin expected taxes. We use ROA, defined as the ratio of earnings before interest,taxes, and dividends (EBITD) to total assets and leverage, defined as the ratio oftotal debt to total assets, to test theories related to expected costs of financial dis-tress.13 Finally, we control for the size of the firm (the logarithm of total assets), afactor that most previous studies found was positively related to a firm’s decisionto hedge. This is consistent with arguments related to the existence of large fixedstart-up costs of hedging. We also incorporated the total number of options held atthe beginning of the year by the CEO and the total number of shares (both variablesscaled by total shares outstanding), which we obtained from the Compustat ExecuC-omp database, to test theories related to managerial risk aversion. Since neither vari-able is significant, and because they substantially reduce the number of observations,we do not include them here.
To control for exposure factors, we introduce the ratio of foreign sales to totalsales and the share of total trade (imports and exports) in total production. Exportsproduce the same exposure to exchange rates as do foreign sales. An appreciationof the dollar hurts firms with foreign revenues or exports by reducing the dollarvalue of foreign-currency-denominated revenues. In contrast, an appreciation of thedollar benefits importers by reducing the dollar value of the costs of imports. How-ever, given that we only have the absolute value of foreign currency derivatives, weexpect that both the import and export factors should be positively associated to theuse of foreign currency derivatives. The decision to hedge should depend on thetotal foreign trade (imports plus exports) if they are in uncorrelated currencies orfirms hedge them separately.
Information on imports and exports is not available at the firm level. However,the US Department of Commerce compiles annual import and export shares at theindustry level, for both the two and four-digit SIC classification, for the main USmanufacturing industries.14 In our tests, we match firms with their industry import(export) share at the four-digit SIC where available, otherwise at the two-digit.15
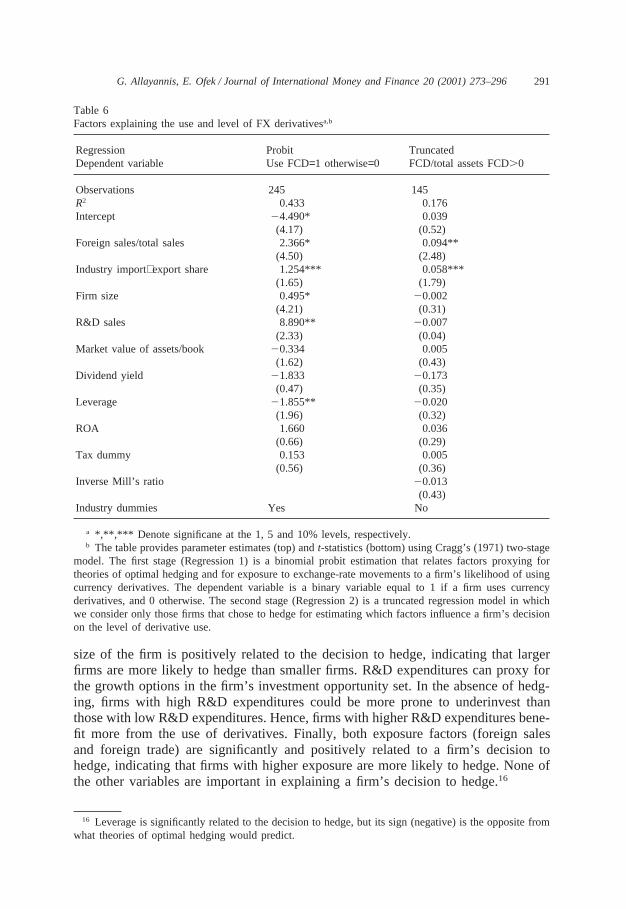
Regression 1 in Table 6, presents the results of the first-stage binomial probitmodel. Our findings are similar to those obtained by Geczy et al. (1997): firm size,R&D expenditures, and controls for exposure (foreign income and trade) areimportant determinants in a firm’s decision to use foreign currency derivatives. The
13 We also use other measures of predictability of bankruptcy (e.g., Altman’s z-score, Altman, 1968)and liquidity, defined as the ratio of cash and marketable securities net of current liabilities to total assets.These are not significant and do not materially alter our results.
14 This dataset is available in the USDC publication,U.S. Commodity Exports and Imports as Relatedto Output.
15 We have data on import and export shares on 59 industries at the 4-digit SIC and on 25 industriesat the 2-digit SIC. At the 2-digit, we have data on the main US manufacturing industries (SICs 20-39)as well as on industries related to mineral commodities (SICs 10, 12, 13, 15, 16).
291G. Allayannis, E. Ofek / Journal of International Money and Finance 20 (2001) 273–296
Table 6Factors explaining the use and level of FX derivativesa,b
Regression Probit TruncatedDependent variable Use FCD=1 otherwise=0 FCD/total assets FCD.0
Observations 245 145R2 0.433 0.176Intercept 24.490* 0.039
(4.17) (0.52)Foreign sales/total sales 2.366* 0.094**
(4.50) (2.48)Industry import+export share 1.254*** 0.058***
(1.65) (1.79)Firm size 0.495* 20.002
(4.21) (0.31)R&D sales 8.890** 20.007
(2.33) (0.04)Market value of assets/book 20.334 0.005
(1.62) (0.43)Dividend yield 21.833 20.173
(0.47) (0.35)Leverage 21.855** 20.020
(1.96) (0.32)ROA 1.660 0.036
(0.66) (0.29)Tax dummy 0.153 0.005
(0.56) (0.36)Inverse Mill’s ratio 20.013
(0.43)Industry dummies Yes No
a *,**,*** Denote significane at the 1, 5 and 10% levels, respectively.b The table provides parameter estimates (top) andt-statistics (bottom) using Cragg’s (1971) two-stage
model. The first stage (Regression 1) is a binomial probit estimation that relates factors proxying fortheories of optimal hedging and for exposure to exchange-rate movements to a firm’s likelihood of usingcurrency derivatives. The dependent variable is a binary variable equal to 1 if a firm uses currencyderivatives, and 0 otherwise. The second stage (Regression 2) is a truncated regression model in whichwe consider only those firms that chose to hedge for estimating which factors influence a firm’s decisionon the level of derivative use.
size of the firm is positively related to the decision to hedge, indicating that largerfirms are more likely to hedge than smaller firms. R&D expenditures can proxy forthe growth options in the firm’s investment opportunity set. In the absence of hedg-ing, firms with high R&D expenditures could be more prone to underinvest thanthose with low R&D expenditures. Hence, firms with higher R&D expenditures bene-fit more from the use of derivatives. Finally, both exposure factors (foreign salesand foreign trade) are significantly and positively related to a firm’s decision tohedge, indicating that firms with higher exposure are more likely to hedge. None ofthe other variables are important in explaining a firm’s decision to hedge.16
16 Leverage is significantly related to the decision to hedge, but its sign (negative) is the opposite fromwhat theories of optimal hedging would predict.
292 G. Allayannis, E. Ofek / Journal of International Money and Finance 20 (2001) 273–296
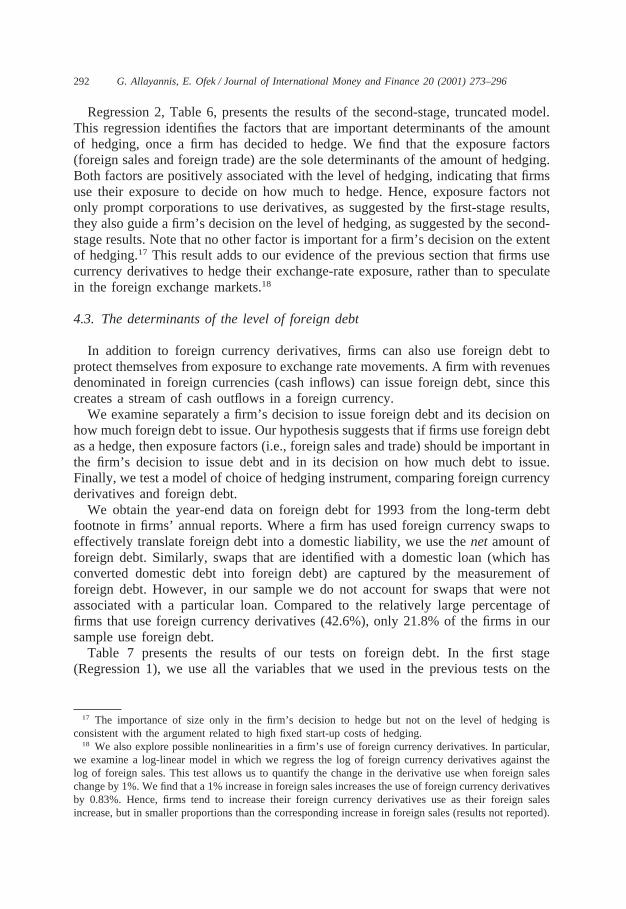
Regression 2, Table 6, presents the results of the second-stage, truncated model.This regression identifies the factors that are important determinants of the amountof hedging, once a firm has decided to hedge. We find that the exposure factors(foreign sales and foreign trade) are the sole determinants of the amount of hedging.Both factors are positively associated with the level of hedging, indicating that firmsuse their exposure to decide on how much to hedge. Hence, exposure factors notonly prompt corporations to use derivatives, as suggested by the first-stage results,they also guide a firm’s decision on the level of hedging, as suggested by the second-stage results. Note that no other factor is important for a firm’s decision on the extentof hedging.17 This result adds to our evidence of the previous section that firms usecurrency derivatives to hedge their exchange-rate exposure, rather than to speculatein the foreign exchange markets.18
4.3. The determinants of the level of foreign debt
In addition to foreign currency derivatives, firms can also use foreign debt toprotect themselves from exposure to exchange rate movements. A firm with revenuesdenominated in foreign currencies (cash inflows) can issue foreign debt, since thiscreates a stream of cash outflows in a foreign currency.
We examine separately a firm’s decision to issue foreign debt and its decision onhow much foreign debt to issue. Our hypothesis suggests that if firms use foreign debtas a hedge, then exposure factors (i.e., foreign sales and trade) should be important inthe firm’s decision to issue debt and in its decision on how much debt to issue.Finally, we test a model of choice of hedging instrument, comparing foreign currencyderivatives and foreign debt.
We obtain the year-end data on foreign debt for 1993 from the long-term debtfootnote in firms’ annual reports. Where a firm has used foreign currency swaps toeffectively translate foreign debt into a domestic liability, we use thenet amount offoreign debt. Similarly, swaps that are identified with a domestic loan (which hasconverted domestic debt into foreign debt) are captured by the measurement offoreign debt. However, in our sample we do not account for swaps that were notassociated with a particular loan. Compared to the relatively large percentage offirms that use foreign currency derivatives (42.6%), only 21.8% of the firms in oursample use foreign debt.
Table 7 presents the results of our tests on foreign debt. In the first stage(Regression 1), we use all the variables that we used in the previous tests on the
17 The importance of size only in the firm’s decision to hedge but not on the level of hedging isconsistent with the argument related to high fixed start-up costs of hedging.
18 We also explore possible nonlinearities in a firm’s use of foreign currency derivatives. In particular,we examine a log-linear model in which we regress the log of foreign currency derivatives against thelog of foreign sales. This test allows us to quantify the change in the derivative use when foreign saleschange by 1%. We find that a 1% increase in foreign sales increases the use of foreign currency derivativesby 0.83%. Hence, firms tend to increase their foreign currency derivatives use as their foreign salesincrease, but in smaller proportions than the corresponding increase in foreign sales (results not reported).
293G. Allayannis, E. Ofek / Journal of International Money and Finance 20 (2001) 273–296
Table 7Factors explaining the use and level of foreign debta,b
Regression Probit Truncated ProbitDependent variable Use LT Fr debt=1 LT Fr debt/assets LT Use only FCD=1
otherwise=0 Fr debt.0 only foreign debt=0
Observations 214 62 94R2 0.279 0.434 0.089Intercept 23.9578* 0.064 20.824
(3.69) (0.68) (0.57)Foreign sales/total sales 1.804* 0.107* 20.475
(3.32) (2.81) (0.66)Industry export share 21.007 3.111***
(0.59) (1.65)FX derivatives value/total assets 2.725
(1.53)Firm size 0.317* 20.018** 0.140
(2.65) (2.48) (0.87)R&D sales 22.538 9.066***
(0.75) (1.70)Market value of assets/book 20.446
(1.54)Dividend yield 25.791
(0.60)Leverage 0.895 0.332
(0.82) (5.33)ROA 3.335
(1.08)Tax dummy 20.081
(0.29)Inverse Mill’s ratio 0.003
(0.10)Industry dummies Yes No No
a *,**,*** Denote significane at the 1, 5 and 10% levels, respectively.b The table provides parameter estimates (top) and t-statistics (bottom) using Cragg’s (1971) two-stage
model. The first stage (Regression 1) is a binomial probit estimation which relates factors that proxy fortheories of optimal hedging and for exposure to exchange rate movements to a firm’s likelihood of issuingforeign debt. The dependent variable is a binary variable equal to 1 if a firm uses foreign debt and 0otherwise. The second stage (Regression 2) is a truncated regression model where only those firms whichchose to issue foreign debt are considered, to estimate which factors influence a firm’s decision on thelevel of foreign debt. Regression 3 presents results of a model of choice between currency derivativesand foreign debt.
use of foreign currency derivatives. Again, the dependent variable is a binary indicat-ing whether or not a firm uses foreign debt. We note that since foreign debt representsa cash outflow in a foreign currency, it can only be used as a hedge when a firmhas foreign revenues (cash inflows), either from operations abroad or from exports.By contrast, imports, which also represent a cash outflow in a foreign currency,cannot be hedged through foreign debt. Therefore we do not use them in these tests.
We find a significant positive relation between the ratio of foreign sales to total
294 G. Allayannis, E. Ofek / Journal of International Money and Finance 20 (2001) 273–296
sales and a firm’s decision to use foreign debt. We also find that larger firms aremore prone to use foreign debt. Finally, we do not find any evidence that exportersare more likely to issue foreign debt, nor that any of the remaining variables aresignificantly associated with the firm’s decision to issue debt. This result is generallyconsistent with our hypothesis.
In the second stage (Regression 2), using only those firms that chose to issueforeign debt, we examine the determinants of the amount of foreign debt issue. Topreserve our observations, we use only those factors that are important in the firststage. We find that as in the case of foreign currency derivatives, exposure throughforeign sales is an important determinant of a firm’s decision on how much foreigndebt to issue. This, too, is consistent with our hypothesis. We also find that whilelarger firms are more likely to issue foreign debt, of those that do, smaller firmsissue larger amounts of foreign debt. This is consistent with high fixed start-up costsof issuing foreign debt.
Finally, we investigate further why exporters are not likely to issue foreign debt,as suggested by Regression 1, Table 7. We use a logit model (Regression 3, Table7) to test a model of choice that compares the use of foreign currency derivativesand foreign debt. Our dependent variable is a binary equal to one if the firm usesonly foreign currency derivatives, and zero if the firm uses only foreign debt.
We find no significant evidence that multinationals prefer to use foreign currencyderivatives or debt to hedge foreign currency exposure (the coefficient on foreignsales is insignificant). However, we do find significant evidence that exporters preferthe use of foreign currency derivatives over the use of foreign currency debt. Thismight be explained by the nature of exporting, which can require customized, short-term contracts that are better served by derivatives rather than by long-term foreigndebt. Alternatively, it might be the lack of foreign institutional details that keepsexporters away from issuing foreign debt.
Overall, our results suggest that exposure through foreign sales is an importantdeterminant of both a firm’s decision to issue foreign debt and its decision on howmuch foreign debt to issue. These results are consistent with our hypothesis thatfirms use both foreign debt and foreign currency derivatives to hedge their exchange-rate exposure. In addition, while firms with operations abroad do not prefer onehedging instrument over another, exporters prefer the use of currency derivatives.
5. Conclusions
This paper examines whether firms use currency derivatives for hedging or forspeculative purposes. Using a sample of S&P 500 nonfinancial firms for 1993, weexamine the impact of currency derivatives on firm exchange-rate exposure, the fac-tors that prompt corporations to hedge, and the factors that affect their decision onhow much to hedge.
We find a strong negative association between foreign currency derivative use andfirm exchange-rate exposure, suggesting that firms use derivatives as a hedge ratherthan to speculate in the foreign exchange markets. This relation is robust to alterna-
295G. Allayannis, E. Ofek / Journal of International Money and Finance 20 (2001) 273–296
tive time intervals and exchange-rate indices to estimate exposure and estimationmethods (e.g., weighted least squares and probit) that we use to examine the relationbetween exchange rate exposure and currency derivative use. It is also robust to theuse of a larger, alternative sample that includes all US manufacturing firms that havetotal assets above 100 million during 1994 and 1995 and to the use of individualexchange rates instead of trade-weighted exchange-rate indices.
We find additional supportive evidence on the firm’s hedging behavior, when weexamine separately, using a two-stage framework, the factors that are associated witha firm’s decision to hedge and its decision on the level of hedging. We find evidencethat a firm’s exposure through foreign sales and foreign trade is a very importantfactor that both prompts corporations to hedge and guides their decision on howmuch to hedge.
Firms can also use foreign debt to protect themselves from exchange-rate move-ments. Similarly, we find that a firm’s exposure through foreign sales is an importantdeterminant of its decision to use foreign debt and on its decision on the level offoreign debt. Collectively, our results suggest that firms use currency derivatives andforeign debt as a hedge.
Our paper has important implications for managers and financial regulators. Afirm’s exposure to exchange-rate movements is mitigated through the use of foreigncurrency derivatives. This finding suggests that an intervention in the derivativesmarkets may not be warranted, and provides an explanation for the lack of significantexposure documented in past studies.
Acknowledgements
We would like to thank James Lothian (the editor) and two anonymous refereesfor their helpful comments. We also greatly appreciate comments received by YakovAmihud, Pierluigi Balduzzi, Geert Bekaert, Jose Campa, Martin Gruber, Kose John,Richard Levich, James Weston and Robert Whitelaw and are grateful to KumarVisvanathan for sharing the 1992–93 data on foreign currency derivatives. We alsothank seminar participants at Harvard Business School, Virginia Tech, ESSEC, Til-burg University, University of Lancaster; and participants at the EFA in Oslo, August1996 and the discussant Ian Cooper; the WFA in San Diego, June 1997 and thediscussant Mike Stutzer; and the 1997 International Finance Conference at GeorgiaTech and the discussant Milind Shrikhande. The first author also wishes to thankthe Darden School Foundation for financial support.
References
Adler, M., Dumas, B., 1984. Exposure to currency risks: definition and measurement. Financial Manage-ment 13 (Summer), 41–50.
Allayannis, G., 1996. Exchange rate exposure revisited. Working Paper (DSWP-97-06), Darden GraduateSchool of Business Administration, University of Virginia.
296 G. Allayannis, E. Ofek / Journal of International Money and Finance 20 (2001) 273–296
Altman, E., 1968. Financial ratios, discriminant analysis and the prediction of corporate bankruptcy. Jour-nal of Finance 23 (4), 589–609.
Amihud, Y., 1993. Evidence on exchange rates and the valuation of equity shares. In: Amihud, Y., Levich,R. (Eds.), Exchange Rates and Corporate Performance. Business One, Irwin, IL.
Bodnar, G., Gentry, W., 1993. Exchange rate exposure and industry characteristics: evidence from Canada,Japan and the U.S. Journal of International Money and Finance 12, 29–45.
Bodnar, G., Hayt, G., Marston, R., Smithson, W., 1995. Wharton survey of derivatives usage by U.S.non-financial firms. Financial Management 24 (Summer), 104–115.
Block, S., Gallagher, T., 1986. The use of interest rate futures and options by corporate financial managers.Financial Management 15 (Autumn), 73–78.
Booth, J., Smith, R., Stolz, R., 1984. The use of interest rate futures by financial institutions. Journal ofBank Research 15 (Spring), 15–20.
Cragg, J., 1971. Some statistical models for limited dependent variable with application to the demandof durable goods. Econometrica 39, 829–844.
DeMarzo, P., Duffie, D., 1995. Corporate incentives for hedging and hedge accounting. The Review ofFinancial Studies 95 (8), 743–771.
Dolde, W., 1993. Use of foreign exchange and interest rate risk management in large firms. WorkingPaper, University of Connecticut, Storrs, CT.
Dumas, B., 1978. The theory of the trading firm revisited. Journal of Finance 33 (June), 1019–1029.Francis, K., Stephan, J., 1990. Characteristics of hedging firms: an empirical examination. In: Schwartz,
R.J., Smith, C.W. Jr (Eds.), Advanced Strategies in Financial Risk Management. New York Instituteof Fiance and Simon and Schuster, Englewood Cliffs, NJ and New York.
Froot, K., Scharfstein, D., Stein, J., 1993. Risk management: coordinating corporate investment andfinancing policies. Journal of Finance 48 (December), 1624–1658.
Geczy, C., Minton, B., Schrand, C., 1997. Why firms use currency derivatives? Journal of Finance 52(September), 1324–1354.
Haushalter, D., 2000. Financing policy, basis risk and corporate hedging: evidence from oil and gasproducers. Journal of Finance 55, 107–152.
Hentschel, L., Kothari, S.P., 1997. Life insurance or lottery: Are corporations managing or taking riskswith derivatives? Working paper, University of Rochester, Rochester, NY.
Hodder, J., 1982. Exposure to exchange rate movements. Journal of International Economics 13(November), 375–386.
Jorion, P., 1990. The exchange rate exposure of U.S. multinationals. Journal of Business 63, 331–345.Levi, M., 1993. Exchange rates and the value of the firm. In: Amihud, Y., Levich, R. (Eds.), Exchange
Rates and Corporate Performance. Business One, Irwin, IL.Mian, S., 1996. Evidence on corporate hedging policy. Journal of Financial and Quantitative Analysis 31
(September), 419–439.Nance, D., Smith, C., Smithson, C., 1993. On the determinants of corporate hedging. Journal of Finance
48 (March), 267–284.Shapiro, A., 1975. Exchange rate change, inflation and the value of the multinational corporation. Journal
of Finance 30, 485–502.Simkins, B., Laux, P., 1997. Derivatives use and the exchange rate risk of investing in large U.S. corpora-
tions. Working Paper, Case Western Reserve University.Smith, C., Stulz, R., 1985. The determinants of firms’ hedging policies. Journal of Financial and Quantitat-
ive Analysis 20 (December), 391–405.Stulz, R., 1984. Optimal hedging policies. Journal of Financial and Quantitative Analysis 19 (June),
127–140.Tufano, P., 1996. Who manages risk? An empirical examination of risk management practices in the gold
mining industry. Journal of Finance 51 (September), 1097–1137.Visvanathan, G., 1998. Who uses interest rate swaps? A cross-sectional analysis. Journal of Accounting,
Auditing and Finance 13, 173–200.Wall, L., Pringle, J., 1989. Alternative explanations of interest rate swaps: a theoretical and empirical
analysis. Financial Management 18 (Summer), 59–73.