The Society for Financial Studies The Use of Foreign Currency Derivatives and Firm Market ValueThe...
35
The Society for Financial Studies The Use of Foreign Currency Derivatives and Firm Market Value Author(s): George Allayannis and James P. Weston Source: The Review of Financial Studies, Vol. 14, No. 1 (Spring, 2001), pp. 243-276 Published by: Oxford University Press. Sponsor: The Society for Financial Studies. Stable URL: http://www.jstor.org/stable/2696762 Accessed: 10/02/2009 10:39 Your use of the JSTOR archive indicates your acceptance of JSTOR's Terms and Conditions of Use, available at http://www.jstor.org/page/info/about/policies/terms.jsp. JSTOR's Terms and Conditions of Use provides, in part, that unless you have obtained prior permission, you may not download an entire issue of a journal or multiple copies of articles, and you may use content in the JSTOR archive only for your personal, non-commercial use. Please contact the publisher regarding any further use of this work. Publisher contact information may be obtained at http://www.jstor.org/action/showPublisher?publisherCode=oup. Each copy of any part of a JSTOR transmission must contain the same copyright notice that appears on the screen or printed page of such transmission. JSTOR is a not-for-profit organization founded in 1995 to build trusted digital archives for scholarship. We work with the scholarly community to preserve their work and the materials they rely upon, and to build a common research platform that promotes the discovery and use of these resources. For more information about JSTOR, please contact [email protected]. The Society for Financial Studies and Oxford University Press are collaborating with JSTOR to digitize, preserve and extend access to The Review of Financial Studies. http://www.jstor.org
Transcript of The Society for Financial Studies The Use of Foreign Currency Derivatives and Firm Market ValueThe...
The Society for Financial Studies
The Use of Foreign Currency Derivatives and Firm Market ValueAuthor(s): George Allayannis and James P. WestonSource: The Review of Financial Studies, Vol. 14, No. 1 (Spring, 2001), pp. 243-276Published by: Oxford University Press. Sponsor: The Society for Financial Studies.Stable URL: http://www.jstor.org/stable/2696762Accessed: 10/02/2009 10:39
Your use of the JSTOR archive indicates your acceptance of JSTOR's Terms and Conditions of Use, available athttp://www.jstor.org/page/info/about/policies/terms.jsp. JSTOR's Terms and Conditions of Use provides, in part, that unlessyou have obtained prior permission, you may not download an entire issue of a journal or multiple copies of articles, and youmay use content in the JSTOR archive only for your personal, non-commercial use.
Please contact the publisher regarding any further use of this work. Publisher contact information may be obtained athttp://www.jstor.org/action/showPublisher?publisherCode=oup.
Each copy of any part of a JSTOR transmission must contain the same copyright notice that appears on the screen or printedpage of such transmission.
JSTOR is a not-for-profit organization founded in 1995 to build trusted digital archives for scholarship. We work with thescholarly community to preserve their work and the materials they rely upon, and to build a common research platform thatpromotes the discovery and use of these resources. For more information about JSTOR, please contact [email protected].
The Society for Financial Studies and Oxford University Press are collaborating with JSTOR to digitize,preserve and extend access to The Review of Financial Studies.
http://www.jstor.org
The Use of Foreign Currency Derivatives and Firm Market Value
George Allayannis University of Virginia
James P. Weston Rice University
This article examines the use of foreign currency derivatives (FCDs) in a sample of 720 large U.S. nonfinancial firms between 1990 and 1995 and its potential impact on firm
value. Using Tobin's Q as a proxy for firm value, we find a positive relation between firm value and the use of FCDs. The hedging premium is statistically and economically
significant for firms with exposure to exchange rates and is on average 4.87% of firm
value. We also find some evidence consistent with the hypothesis that hedging causes an
increase in firm value.
According to the classic Modigliani and Miller paradigm, risk management is irrelevant to the firm; shareholders can do it on their own, for example, by holding well-diversified portfolios. Several recent theories, however, suggest that hedging is a value-increasing strategy for the firm. Most of these theo- ries rely on the introduction of some friction (e.g., taxes or costly access to external financing) into the Modigliani and Miller model.' Previous empirical research has tried to uncover which theory of hedging describes firms' use of derivatives more accurately. For example, Geczy, Minton, and Schrand (1997) examined currency hedging activities for a sample of Fortune 500 firms and found that firms' use of currency derivatives is positively related to growth opportunities, consistent with the Froot, Scharfstein, and Stein (1993) theory of hedging.
We would like to thank Bernard Dumas (the editor) and an anonymous referee for their many helpful sug- gestions. We also would like to thank Serena Agoro-Menyang, Tim Adam, Susan Chaplinsky, Ken Eades, Bob Harris, Eli Ofek, Robert Whitelaw, David Yermack, and especially Warren Bailey, David Haushalter, and Marc Zenner for their suggestions and Betty Simkins for making available to us interest-rate derivatives data. We also thank seminar participants at the Darden Graduate School of Business of the University of Virginia and the International Finance Seminar, Economics Department, University of Virginia, EFMA participants in Lisbon, Portugal, June 1998, and the discussant Iraj Fooladji, and participants at the 1998 Maryland Sympo- sium on Financial Innovation and Technology, September 1998, and the discussant Vojislav Maksimovic. We also thank Kristin Adams and Jason Fink for excellent research assistance and the Darden School Founda- tion for summer support (to G. Allayannis). Address correspondence to George Allayannis, Darden Graduate School of Business Administration, University of Virginia, P.O. Box 6550, Charlottesville, VA 22906-6550, or e-mail: [email protected].
l For example, in Smith and Stulz (1985), hedging is beneficial, as it reduces expected taxes or the costs of financial distress. In Froot, Scharfstein, and Stein (1993) hedging can reduce the underinvestment problem that occurs when cash flow is volatile and access to external financing is costly.
The Review of Financial Studies Spring 2001 Vol. 14, No. 1, pp. 243-276 C) 2001 The Society for Financial Studies
The Review of Financial Studies / v 14 n 1 2001
While there is an increasing number of studies providing evidence that firms that hedge fit the profile of one theory or another [e.g., see Nance, Smith, and Smithson (1993), Mian (1996), Tufano (1996), Geczy, Minton, and Schrand (1997), and Haushalter (2000)], no study thus far has addressed the question of whether there is a direct relation between hedging and firm value. In this article, we test whether the use of derivatives is associated with higher firm market value, as captured by Tobin's Q, in a sample of 720 large U.S. nonfinancial firms between 1990 and 1995.
Within our sample of 720 firms, we focus our analysis on the subsample of firms that are exposed to exchange rate risk through sales from foreign operations and examine whether firms that have similar exposure differ in value, depending on whether they hedge or not. For these firms, the use of foreign currency derivatives (FCDs) is likely to be rewarded by investors with higher valuation in the marketplace, as it may, for example, substantially mit- igate underinvestment. The firms in the remainder of our sample that have no foreign sales may also be affected by exchange rate movements through, for example, exporting activities or import competition. Unfortunately export and import data on U.S. firms are generally not available at the firm level, so we cannot be certain whether these firms are affected by exchange rate movements or not. If these firms are not affected by exchange rate move- ments, then hedging should not add value. Further, there is no reason, ceteris paribus, that firms with neither exposure nor hedging policy should be valued at a discount compared to firms that choose to hedge their exposure. For this reason, we perform our analysis separately for the samples with and without foreign sales.
First, for the two samples (with and without foreign sales) we examine whether users of currency derivatives have a higher value than nonusers. We find that for the sample of firms with foreign sales, users of currency derivatives have consistently higher mean and median Qs than nonusers. For example, the median hedging premium for the entire period that we examine, between 1990 and 1995, is 0.04. Given that the median firm in this sample has a market value of roughly $3.79 billion and a Q close to 1, a 0.04 difference in Q suggests that nonusers' value is smaller by 0.04, or $153.1 million, holding the replacement cost of assets constant. For firms with no foreign sales, we also find a positive hedging premium in these univariate tests.
Next we investigate further whether the hedging premium can be explained by other factors that theory suggests may affect firm value and that have com- monly been used to explain Q [e.g., see Morck and Yeung (1991), Lang and Stulz (1994), Servaes (1996), and Yermack (1996)]. In multivariate tests, we test whether our finding that investors value derivatives users higher than nonusers is robust to controls for size, profitability, leverage, growth oppor- tunities, ability to access financial markets, geographic and industrial diver- sification, credit quality, industry classification (the four-digit SIC), and time
244
Use of Foreign Clurency Derivatives and Firm Market Value
effects. We find that for firms that are exposed to exchange rate risk there is a positive and significant relation between firm value and the use of cur- rency derivatives during 1990-1995. Because unobservable firm characteris- tics, such as managerial quality, are likely to affect each firm's market value, we also estimate a fixed-effects model. Similarly, in the fixed-effects model, we find that hedgers have higher values than nonhedgers.
Since the majority of the firms in our sample are diversified across dif- ferent industrial segments, it is possible that using simple industry controls (even the four-digit SIC) may not adequately capture industry effects on firm value. We therefore construct industry-adjusted Qs by computing the log difference between the weight-adjusted industry Q ("pure-play" firm Q) and each multisegment firm's Q (see Appendix 1 for details). Our results using the industry-adjusted Qs are similar to those obtained using raw Qs. For firms with exposure to exchange rate movements, we find a positive and significant relation between industry-adjusted firm value and the use of cur- rency derivatives. The magnitude of the hedging premium ranges from 3.62% to 5.34% of firm value. For firms with no foreign involvement we find no evidence of a hedging premium in our multivariate tests.
For firms with foreign operations, their value is likely to be influenced by the exchange rate behavior over the year. Assuming that firms with foreign sales have a net long position in foreign currency, then the benefits of hedging should be most pronounced during years in which the dollar appreciates. In years in which the dollar depreciates, hedging is relatively less beneficial as firms that are not hedged experience a windfall, relative to the hedged firms. While we find that hedging adds value both during the dollar's appreciating and the dollar's depreciating period, we find that, as expected, the hedging premium is much larger (and statistically significant) during those years in which the dollar has appreciated.
The results of our tests outlined above are consistent with the hypothe- sis that the use of currency derivatives increases firm value (Tobin's Q) for firms that are exposed to exchange rate risk. However, an alternative expla- nation is that firms with high Tobin's Q have an incentive to hedge, as they may have high investment (growth) opportunities. If high Qs cause firms to hedge, we should expect firms that begin a hedging policy in the next period to have higher values (Qs) this period than firms that remained unhedged and firms that quit hedging in the next period to have lower values than firms that remained hedged. To test for the possibility of this reverse causation we perform a time-series analysis of firms' changes in hedging policy. We reject the hypotheses that firms with large Qs choose to hedge, and firms with low Qs choose to remain unhedged. These results suggest that the correla- tion between the use of currency derivatives and firm value does not stem from reverse causality. Furthermore, we perform a more direct test of the hypothesis that hedging causes an increase in firm value through an event study of how changes in hedging policy affect value. We find that firms that
245
The Review of Finiancial Stuidies / 1v 14 n 1 2001
begin a hedging policy experience an increase in value relative to those firms that choose to remain unhedged and that firms that quit hedging experience a decrease in value relative to those firms that choose to remain hedged. Taken together, these results provide evidence consistent with the notion that hedging causes an increase in firm value.
While our results suggest that the use of FCDs increases firm value, other types of derivative use, such as interest rate or commodity, may also be ben- eficial for a firm. In this article, we chose to focus on currency derivatives, for the following reasons: (1) we are interested in isolating a common risk factor among firms (exchange rate risk) and examine how the use of cur- rency derivatives affects the value of firms that are exposed to exchange rate movements; (2) although most theories of hedging imply the reduction of the variability of firm value or cash flow, prior empirical research has shown that different factors affect the decision to use currency, interest rate, or commod- ity derivatives, which can have implications for firm value;2 and (3) currency derivatives are the most commonly used derivatives and most firms which use other types of derivatives also use currency derivatives.3
The relatively few interest rate derivative users that we have potentially misclassified as nonhedgers would bias results against us (i.e., against a pos- itive hedging premium) if interest rate hedging is also a value-increasing strategy. This argument is also valid for other means of hedging exchange rate risk, as, for example, through the use of foreign debt.4 Finally, to the extent that a firm's diversification of markets, suppliers, or production loca- tions is positively correlated with the extent of multinationality (i.e., the per- centage of foreign sales), our tests effectively control for such an alternative means of hedging exchange rate risk through operations.
The remainder of the article is organized as follows. Section 1 describes theories of optimal hedging and reviews previous empirical research on the use of derivatives. Section 2 describes our sample and develops our hypothe- sis. Section 3 presents the tests of the relation between the use of derivatives and firm value. Section 4 concludes.
2 For example, managerial risk aversion is found to be motivating managers to use commodity (gold) derivatives in Tufano (1996); such use of derivatives may not add to the value of a firm. This contrasts with evidence in Haushalter (2000) in which the use of commodity (oil and gas) derivatives is found to be related to the reduction of expected bankruptcy costs, which should increase firm value. In currency hedging, Geczy, Minton, and Schrand (1997) find that firms use currency derivatives to reduce the underinvestment problem and similarly Visvanathan (1998) finds that the use of interest rate derivatives may be related to value-increasing strategies.
3For example, in Geczy et al. (1995, Table 2), during 1993, in the sample of Fortune 500 nonfinancial firms, 52.1% use currency derivatives, 44.2% use interest rate derivatives, and only 11.3% use commodity derivatives. In fact, in their sample, 78% of all derivative users are also currency derivative users.
4We were able to obtain data on interest rate derivatives and foreign debt for the subsamples of Fortune 500 and S&P 500 nonfinancial firms, respectively; our results do not change when we classify those firms as hedgers.
246
Use of Foreign Cur-rency Derivatives anid Firm Market Value
1. Prior Research on the Use of Derivatives
There are several theories of hedging, most of which arrive at optimal hedg- ing policies by introducing some friction to the classic Modigliani and Miller model. For example, Stulz (1984) suggests that corporate hedging is due to managers' risk aversion.5 Smith and Stulz (1985) suggest that the struc- ture of the tax code (i.e., if taxes are a convex function of earnings) or the transaction costs of financial distress may induce firms to hedge. In Froot, Scharfstein, and Stein (1993), hedging can reduce the underinvestment prob- lem that would result from variation in cash flow and costly access to external financing. Finally, in DeMarzo and Duffie (1995), even though shareholders can hedge on their own, hedging is optimal when managers have private information on the firm's expected profits.6
Empirical examination of hedging theories has been affected by the general unavailability of data on hedging activities. Until the beginning of the 1990s, a firm's positions in derivatives was not disclosed, and was considered an important component of strategic competitiveness. It is only since then that corporations have been required to report in the footnotes to their annual reports the notional amount of derivatives they are using. Therefore earlier studies used survey data to examine the determinants of derivatives use. For example, Nance, Smith, and Smithson (1993) used survey data on Fortune 500 firms' use of derivatives and found that firms that hedge face more convex tax functions, have less coverage of fixed claims, are larger, and have more growth opportunities.
More recent empirical studies have distinguished among the types of hedg- ing employed (i.e., commodity, interest rate, or currency), suggesting that different factors may be important for each type. Most of these studies also generally employed a binary variable indicating whether a firm uses deriva- tives or not, as the notional amounts disclosed were considered less reliable. Specifically, Geczy, Minton, and Schrand (1997) examined currency hedg- ing activities for a sample of Fortune 500 firms and found that the use of currency derivatives is directly related to the amount of research and devel- opment (R&D) expenditures, which is consistent with the use of hedging to reduce underinvestment problems [e.g., Froot, Scharfstein, and Stein (1993)]. Tufano (1996) examined hedging activities in the gold-mining industry and found that the use of commodity derivatives is negatively related to the num- ber of options and positively related to the value of stock held by managers and directors. This evidence is consistent with theories of managerial risk aversion [e.g., Stulz (1984)]. Haushalter (2000) examined the commodity
5Managers may not be able to diversify away exchange rate risk if they have a large amount of their wealth invested in the firm's stock. Assuming no hedging costs, managers can increase their utility through hedging, without reducing firm value.
6There is a trade-off in equilibrium between an increase in the degree of informativeness of expected profits and a decrease in expected profits due to the costs of hedging.
247
The Review of Financial Studies / v 14 n 1 2001
hedging activities of firms in the oil and gas industry and found evidence consistent with theories of transaction costs of financial distress [e.g., Smith and Stulz (1985)]. Visvanathan (1998) found similar evidence examining the use of interest rate swaps by S&P 500 nonfinancial firms.7 Finally, Mian (1996) investigated all three types of hedging activities for a large sample of firms during 1992 and found strong evidence of economies of scale in hedging.
All of the studies above examine factors that influence a firm's decision to use derivatives. As Allayannis and Ofek (2000) found that, on average, firms use currency derivatives to reduce exchange rate risk exposure, rather than to speculate, it follows that firms' use of derivatives to hedge may be a value-increasing strategy.8 In this article, we address the question of whether the use of derivatives directly affects firm value. In particular, we examine whether firms' use of FCDs is rewarded by investors with higher market valuation.
2. Sample Description and Hypothesis Development
Our sample consists of all nonfinancial firms that are in the COMPUSTAT database, have total assets of more than 500 million in each year between 1990 and 1995, and have nonmissing data on size (assets/sales) and market value. We obtain a total of 720 firms that meet our selection criteria and therefore a total of 4320 firm-year observations between 1990 and 1995. We excluded financial firms from our sample because most of them are also market makers in FCDs; hence their motivations in using derivatives may be different from the motivations of nonfinancial firms. We also excluded public utilities because they are heavily regulated.
SFAS 105 requires all firms to report information about financial instru- ments with off-balance sheet risk (e.g., futures, forwards, options, and swaps) for fiscal years ending after June 15, 1990. In particular, firms must report the face, contract, or notional amount of the financial instrument together with information on the credit and market risk of those instruments and the related accounting policy. For the firms in our sample, we obtained data on year-end gross notional value of forward contracts reported in the footnotes of the annual reports for each year during 1990-1995. Our sample's notional values of FCDs also include foreign currency options, if a combined number has been disclosed. These values, however, do not include foreign currency swaps, as their reported magnitudes were not comparable with the magni- tudes of forward contracts. However, we record swaps users, as well as the small sample of futures users, as users of currency derivatives. Also, many
7Earlier studies of interest rate hedging include Block and Gallagher (1986) and Wall and Pringle (1989).
8 Evidence that firms in the mutual thrifts industry also use derivatives as a hedge is found in a recent article by Schrand and Unal (1998).
248
Use of Foreigni Currency Derivatives and Firm Market Value
firms report the use of FCDs but do not report their level. These firms are also included in the sample of foreign currency derivatives users. We are able to collect a total of 1600 firm-year observations that reported the use of FCDs. Given that our sample of hedgers dramatically decreases when we use the level of FCDs from 1600 to 969 firm-year observations (a 39% decrease), we perform our tests using a binary variable, which indicates whether a firm used currency derivatives or not during that year.
Table 1, panel A, presents summary statistics of the main variables that we use in our article. Our sample has a mean value of assets (sales) of $7701 ($6592) million. For all the firms in our sample, we also obtained data from the geographical segment of the COMPUSTAT database on year-end foreign sales and foreign assets. FASB 14 requires firms to report geographical- segment information for fiscal years ending after December 15, 1977. Firms must report information for segments whose sales, assets, or profits exceed 10% of consolidated totals. Approximately 51% of our sample observations have foreign sales from operations abroad which constitute 18% of total sales, while 37% of the firm-year observations in our sample use foreign currency derivatives.9 Where foreign revenues are not reported, we assume that they are zero. However, we also check the robustness of our results by assuming that the unreported foreign revenues are missing. This assumption does not materially affect our results.
We use Tobin's Q as a proxy for a firm's market value. Tobin's Q is defined as the ratio of the market value of the firm to replacement cost of assets, evaluated at the end of the fiscal year for each firm. Our methodol- ogy for constructing the market value and replacement cost of assets closely follows Lewellen and Badrinath (1997). The replacement cost of assets is cal- culated as the sum of the replacement cost of fixed assets plus inventories. We estimate the replacement cost of fixed assets by inferring the vintages and depreciation pattern of in-place gross fixed assets. The replacement cost of inventories is simply the sum of the book value of inventories plus LIFO reserves. The advantage of this procedure in calculating replacement costs is that it does not rely on any initial conditions or "recursive build-up" period. Lewellen and Badrinath argue that these initial conditions and recursive tech- niques can have a serious effect on both the magnitude and ranking of Q across firms. To calculate the market value of the firm's debt and equity, we follow the procedure outlined in Lewellen and Badrinath (1997) and in Perfect and Wiles (1994). The market value of common stock is taken directly from COMPUSTAT. We estimate the market value of preferred stock using the year-end redemption value as suggested by Lang and Stulz (1994). The market value of debt is constructed using a recursive methodology that esti- mates the maturity structure of the firm's long-term debt and accounts for
9 Due to the fact that our sample contains a lot of smaller firms than samples in other studies [i.e., Geczy, Minton, and Schrand (1997)], the percentage of firms in our sample that use currency derivatives is relatively smaller. Most studies have documented a positive relationship between size and the use of derivatives.
249
The Review of Financial Studies / v 14 n 1 2001
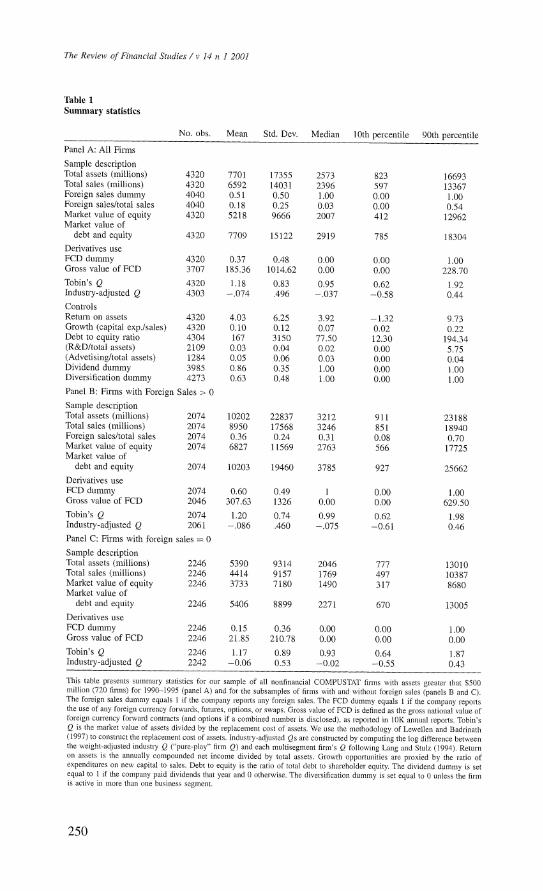
Table 1 Summary statistics
No. obs. Mean Std. Dev. Median 10th percentile 90th percentile
Panel A: All Firms
Sample description Total assets (millions) 4320 7701 17355 2573 823 16693 Total sales (millions) 4320 6592 14031 2396 597 13367 Foreign sales dummy 4040 0.51 0.50 1.00 0.00 1.00 Foreign sales/total sales 4040 0.18 0.25 0.03 0.00 0.54 Market value of equity 4320 5218 9666 2007 412 12962 Market value of
debt and equity 4320 7709 15122 2919 785 18304 Derivatives use FCD dummy 4320 0.37 0.48 0.00 0.00 1.00 Gross value of FCD 3707 185.36 1014.62 0.00 0.00 228.70 Tobin's Q 4320 1.18 0.83 0.95 0.62 1.92 Industry-adjusted Q 4303 -.074 .496 -.037 -0.58 0.44 Controls Return on assets 4320 4.03 6.25 3.92 -1.32 9.73 Growth (capital exp./sales) 4320 0.10 0.12 0.07 0.02 0.22 Debt to equity ratio 4304 167 3150 77.50 12.30 194.34 (R&D/total assets) 2109 0.03 0.04 0.02 0.00 5.75 (Advetising/total assets) 1284 0.05 0.06 0.03 0.00 0.04 Dividend dummy 3985 0.86 0.35 1.00 0.00 1.00 Diversification dummy 4273 0.63 0.48 1.00 0.00 1.00 Panel B: Firms with Foreign Sales > 0 Sample description Total assets (millions) 2074 10202 22837 3212 911 23188 Total sales (millions) 2074 8950 17568 3246 851 18940 Foreign sales/total sales 2074 0.36 0.24 0.31 0.08 0.70 Market value of equity 2074 6827 11569 2763 566 17725 Market value of
debt and equity 2074 10203 19460 3785 927 25662 Derivatives use FCD dummy 2074 0.60 0.49 1 0.00 1.00 Gross value of FCD 2046 307.63 1326 0.00 0.00 629.50 Tobin's Q 2074 1.20 0.74 0.99 0.62 1.98 Industry-adjusted Q 2061 -.086 .460 -.075 -0.61 0.46 Panel C: Firms with foreign sales = 0
Sample description Total assets (millions) 2246 5390 9314 2046 777 13010 Total sales (millions) 2246 4414 9157 1769 497 10387 Market value of equity 2246 3733 7180 1490 317 8680 Market value of
debt and equity 2246 5406 8899 2271 670 13005 Derivatives use FCD dummy 2246 0.15 0.36 0.00 0.00 1.00 Gross value of FCD 2246 21.85 210.78 0.00 0.00 0.00 Tobin's Q 2246 1.17 0.89 0.93 0.64 1.87 Industry-adjusted Q 2242 -0.06 0.53 -0.02 -0.55 0.43
This table presents summary statistics for our sample of all nonfinancial COMPUSTAT firms with assets greater that $500 million (720 firms) for 1990-1995 (panel A) and for the subsamples of firms with and without foreign sales (panels B and C). The foreign sales dummy equals I if the company reports any foreigni sales. The FCD dummy equals I if the company reports the use of any foreign curnency forwards, futures, options, or swaps. Gross value of FCD is defined as the gross national value of foreign currency forward contracts (and options if a combined number is disclosed), as reported in 10K anisiuial reports. Tobin's Q is the market value of assets divided by the replacement cost of assets. We use the methodology of Lewellen and Badrinath (1997) to constmuct the replacement cost of assets. Industry-adjusted Qs are constructed by computing the log difference between the weight-adjusted industly Q ("pure-play" firm Q) and each multisegment firm's Q following Lang and Stulz (1994). Return on assets is the annually compounded net income divided by total assets. Growth opportunities are proxied by the ratio of expenditures on new capital to sales. Debt to equity is the ratio of total debt to shareholder equity. The dividend dummy is set equal to 1 if the company paid dividends that year and 0 otherwise. The diversification dummy is set equal to 0 unless the firm is active in more than one business segment.
250
Use of Foreign Currency Derivatives and Firm Market Value
changes in the yield on A-rated industrial bonds. We assume that other lia- bilities (short-term debt) have a market value equal to book value.
While our construction of Tobin's Q reflects the "state of the art" in the lit- erature, we investigate how sensitive our results are to this particular measure. Specifically, we construct three alternative measures of firm value: (1) the measure suggested by Perfect and Wiles (1994) (which relies on initial condi- tions and "recursive build-up" of fixed-asset replacement costs); (2) a simple measure of the market value of the firm to the book value of assets; and (3) the ratio of the market value of the firm to the book value of total sales. We find that our results are independent of how we measure firm value.
We compute Tobin's Qs for a total of 4320 firm-year observations (720 firms per year). The median Q in our sample is 0.95, which is smaller than the mean Q (1.18), indicating that the distribution of Tobin's Q is skewed.10 To control for this apparent skewness, we use the natural log of Q in our multivariate tests so that the distribution of Q becomes more symmetric. A benefit of using Tobin's Q is that it makes comparisons across firms rela- tively easier than comparisons based on stock returns or accounting measures where a risk adjustment or normalization is required."
Finally, since the majority of the firms in our sample are diversified across different industrial segments, we also construct industry-adjusted Qs by com- puting the log difference between the weight-adjusted industry Q ("pure- play" firm Q) and each multisegment firm's Q (see Appendix 1 for details). The mean (median) industry-adjusted Q for our sample is -0.074 (-0.037).
Given that most of our analysis is performed separately in the subsamples of firms with and without exchange rate exposure, we also present summary statistics for the two subsamples. Specifically, Table 1, panel B, presents statistics for the sample of firms with exchange-rate exposure (FS > 0), while Table 1, panel C, presents statistics for the sample of firms without exposure (FS = 0). The sample of firms with exposure (FS > 0) has larger size and market value of debt and equity than the sample without exposure (FS =
0) (e.g., mean assets of $10,202 million versus $5390). As expected, the percentage of firms that use derivatives in the sample of firms with exposure is much higher than that in the sample of firms without exposure (60% versus 15%).
2.1 Control variables To infer that hedging increases the value of the firm, we need to exclude the effect of all other variables that could have an impact on firm value (Q). Below, we describe the various controls that we use in our multivariate tests and the theoretical reasons that led us to use them.
10 This finding is consistent with the findings of Lang and Stulz (1994) and Servaes (1996). " See Lang and Stulz (1994) for a detailed discussion of this issue.
251
The Review of Financial Studies / v 14 n 1 2001
(a) Size: There is ambiguous evidence for U.S. firms as to whether size leads to higher accounting profitability.'2 However, as large firms are more likely to use derivatives than are small firms-for example, because of the existence of large fixed start-up costs of hedging-we use the log of total assets to control for the effect of size. We also use alternatively as size controls the log of total sales and the log of capital expenditures and obtain very similar results.
(b) Access to financial markets: If hedgers forgo projects because they are not able to obtain the necessary financing, their Q ratio may remain high because they undertake only positive net present value (NPV) projects. To proxy for the ability to access markets, we use a dividend dummy, which equals 1 if the firm paid a dividend in the current year. If a firm paid a dividend, it is less likely to be capital constrained and may thus have a lower Q. We therefore expect the dividend dummy to be negatively related to Q."
(c) Leverage: A firm's capital structure may also be related to its value. To control for differences in capital structure, we use a leverage variable defined as the long-term debt divided by shareholders' equity.
(d) Profitability: A profitable firm is likely to trade at a premium relative to a less profitable one. Thus if hedgers are more profitable, they will have higher Qs. To control for profitability, we use return on assets, defined as the ratio of net income to total assets.
(e) Investment growth: Myers (1977) and Smith and Watts (1992) have argued that firm value also depends on future investment opportunities. Because hedgers are more likely to have larger investment opportunities [e.g., see Froot, Scharfstein, and Stein (1993) for theoretical arguments, Geczy, Minton, and Schrand (1997) for empirical evidence], such control is important. Similar to Yermack (1996) and Servaes (1996), we use the ratio of capital expenditures to sales as a proxy for investment opportu- nities. R&D expenditures is another variable that has also been used as a proxy for investment opportunities, but also proxies for a firm's intangi- ble assets of technological know-how and expertise [e.g., see Morck and Yeung (1991)1. Given that more than half of the R&D observations have missing values, we assume them to be zero. However, we also check the robustness of our results by treating them as missing and find that our results are qualitatively similar. Another intangible asset that may affect firm value is consumer goodwill. Similar to Morck and Yeung (1991), we use the percentage of advertising to total sales to proxy for consumer
12 See Mueller (1987) for a summary of that literature and Peltzman (1977) for arguments that size leads to higher efficiency.
13 See Lang and Stulz (1994), and Servaes (1996) for a detailed discussion of this issue.
252
Use of Foreign Currency Derivatives anid Firm Market Value
goodwill. As with the R&D variable, we assume the missing observa- tions to be equal to zero in our tests, but also examine the results by assuming them as missing.'4
(f) Industrial diversification: There are several theoretical arguments that suggest that industrial diversification increases value [e.g., Williamson (1970), Lewellen (1971)], while other arguments suggest that it is an outgrowth of the agency problems between managers and shareholders [e.g., Jensen (1986)], and thus reduces value. There is substantial empiri- cal evidence suggesting that industrial diversification is negatively related to firm value [e.g., Berger and Ofek (1995), Lang and Stulz (1994), and Servaes (1996)]. To control for the effect of industrial diversification on firm value, we use a dummy variable that equals 1 if the firm operates in more than one segment. Approximately 63% of the firms in our sample are diversified across industries.
(g) Geographic diversification: Several theories suggest that geographic diversification (multinationality) increases value. For example, the inter- nalization theory posits that foreign direct investment occurs when a firm can increase its value by internalizing markets for some of its intangi- ble assets, such as superb production skills or consumer goodwill. [See, for example, Coase (1937) and Dunning (1973).] Other theories suggest that it is an outgrowth of agency problems, much like industrial diver- sification. Morck and Yeung (1991) and Bodnar, Tang, and Weintrop (1997), among others, find that multinationality is positively related to firm value. Because foreign sales are sales from operations abroad, firms with foreign sales are multinationals. We use the ratio of foreign sales to total sales as a continuous measure of multinationality in our tests.
(h) Industry effect: If hedgers are concentrated in high-Q industries, then hedgers will have higher values, not because of their use of derivatives but because of the industry they belong to. We control for such industry effects in the following ways: (1) as in Lang and Stulz (1994), we con- struct the industry-adjusted Qs by computing the log difference between the weight-adjusted industry Q ("pure-play" firm Q) and each multiseg- ment firm's Q. Each multisegment firm's weight-adjusted industry Q is constructed in two steps: first, by multiplying the average log Q of all COMPUSTAT single-segment firms in the particular segment in which our firm operates by the percentage of assets of our firm that are invested in this segment; and second, by summing across the segments that our firm operates in (see Appendix 1 for details);'5 (2) we also construct a
14 Lang and Stulz (1994) reported an additional reason to include R&D expenditures as a control variable in regressions of Q: R&D is usually not included as an asset in the measurement of the replacement cost of assets (denominator of Q). Therefore firmns with large R&D investmnents may have high Q by definition. A similar reasoti, we may add, is also valid for advertising.
15 Note that these shares are computed as a proportion of the sum of assets in each business segment rather thanl the total assets of the consolidated firm. If a firm reports common assets in multiple business segments, the
253
The Review of Finiancial Stuidies / v 14 n 1 2001
primary-industry adjusted Q for each firm by subtracting each year the median Q of the primary four-digit SIC that the firm belongs to from the firm's Q. Although we only report results adjusting for industry effects using measure (1), results are similar using measure (2). Finally, in the remainder of our tests in which we use raw Qs, we also control for industry effects using industry controls at the four-digit SIC.
(i) Credit rating (quality): The credit quality as reflected in the credit rating of a firm's debt assigned by companies such as S&P or Moody's is likely to affect a firm's value. We control for credit quality by constructing seven indicator variables that specify the general credit rating of the firm. 16
(j) Time effects: Finally, we control for time effects by using year dummies in all of our regressions.
3. The Use of Derivatives and Firm Value
3.1 The hedging premium Since we are interested in the effect the use of currency derivatives has on firm value and the potential impact on firm value of a change in hedging policy, we examine first the use of currency derivatives over time for the firms in our sample. Table 2 presents summary statistics on firms' hedging behavior over time. In the first two rows of Table 2, we present the number and percentage, respectively, of firms in our sample that use currency derivatives. There is a substantial increase in the number of firms in our sample that use currency derivatives over time during 1990-1995. Specifically, 232 firms (32%) used FCDs in 1990 compared with 291 (40%) in 1995. At the same time, there is a similar increase over time regarding the mean gross notional amount of currency derivatives used (row 3) from $105 million in 1990 to $279 million in 1995.17
Next, we examine the use of currency derivatives over time both for the sample of firms with foreign sales and the sample with no foreign sales. We find that there is an increase over time in the number of firms with
sum of assets over all business segments may not match the book value of assets for the consolidated company. Using this procedure, common assets are given equal weighting across those divisions. Unfortunately, common assets are not reported separately nor are they identifiable in another way. However, the sum of assets in each business segment and the consolidated assets are highly correlated (0.96 for the sample of diversified firms; 0.98 for the entire sample). The absolute median deviation between total assets and the sum of business segment assets for our sample is 8.2%, while the median deviation for our sample is 0.95%. Eliminating those observations that have deviations between the sum of segment assets and total assets above 20% does not alter our results.
16 In particular, we use one dummy for AAA firms, one for AA+ to AA-, one for A+ to A-, one for BBB+ to BBB-, one for BB+ to BB-, one for B+ to B-, and one for CCC+ and below. The largest percentage of our sample observations (41.4% of the sample) belong to the third category (A+ to A-) and to the fourth category (BBB+ to BBB-) (about 30.7% of our sample).
17 Since less than half of the firms in our sample used FCDs during 1990-1995, the median amount of FCDs remains zero over the sample period.
254
Use of Foreign Curr-ency Derivatives anid Fin-n Market Value
Table 2 Profile of firms's hedging over time
90 91 92 93 94 95
Number of firms using derivatives 1 232 246 267 273 291 291
Percent of sample 2 32% 34% 37% 38% 40% 40%
Gross notional amount of foreign currency derivatives held (millions$) 3 Mean 105 130 187 194 202 279
4 Median 0 0 0 0 0 0
Number of firms using FDC with foreign sales > 0
5 177 200 212 213 227 224
6 55% 57% 60% 61% 65% 64%
Number of firms using FDC with foreign sales > 0 7 145 152 140 135 121 128
8 45% 43% 40% 39% 35% 36%
Number of firms using FCD with foreign sales = 0 9 55 46 55 60 64 67
10 14% 13% 15% 16% 17% 18%
Number of firms not using FCD with foreign sales = 0 11 343 322 313 312 308 301
12 86% 88% 85% 84% 83% 82%
This table presents a summary of firms' use of foreign currency derivatives over time. A firm is a user of foreign currency derivatives for a given year if the firm reports the use of foreign currency forwards, futures, options, or swaps during that year. The gross notional value of derivatives is based only on those firms that report the actual amount of currency forwards and options held.
foreign sales that use currency derivatives and a corresponding decline in the number of firms with foreign sales that do not use derivatives. In particular, 177 firms (55% of the sample of firms with foreign sales) used FCDs in 1990 compared with 224 (64%) in 1995 (row 5). Therefore for the sample of firms with foreign sales, 36% (128 of 352) did not use currency derivatives in 1995 (row 7).
In contrast, the percentage of firms with no foreign sales that use FCDs is small (only 18% of the sample of firms with no foreign sales, or 9% of the total sample in 1995) and varies between 13% (in 1991) and 18% (in 1995) of the sample of firms with no foreign sales (rows 9 and 10). These firms may still face currency exposure through exports or imports competition, despite having no foreign sales. Unfortunately, for U.S. firms, no data is available on imports and exports at the firm level. However, the majority of the firms with no foreign sales (e.g., 301 of 368, or 82% in 1995) do not use FCDs (rows 11 and 12).
3.1.1 Univariate tests. In this subsection, we test our main hypothesis that firms that use FCDs are rewarded by investors with higher valuation, by comparing the values (Tobin's Qs) for users and nonusers of FCDs. We test our hypothesis separately for the sample of firms with foreign operations and
255
The Review of Fintanicial Stiudies / v 14 n 1 2001
the sample of firms with no foreign operations. Firms with foreign operations are exposed to exchange rate risk through foreign sales and are likely to be rewarded with higher valuation. Firms with no foreign operations may be affected by exchange rate movements through exports or imports competition, although it is also likely that they have no exposure, and therefore hedging may not be valuable. As the mean value of Q is higher than the median value of Q, suggesting that the distribution of Tobin's Q is skewed, we test our hypothesis using both means and medians.
The behavior of the dollar during the year is also likely to influence the value of firms with exposure. Firms that use currency derivatives should be less sensitive to exchange rate movements than firms that do not. Thus if firms with foreign sales are generally long foreign currencies, their value will go up when the dollar depreciates and fall when the dollar appreciates. However, the relative difference in value between hedgers and nonhedgers will fluctuate depending on the direction of the dollar's movement. When the dollar depreciates, nonhedgers may ex post benefit and their market value may end up relatively higher compared to the values of the hedgers, while when the dollar appreciates, the nonhedgers are hurt and their market value ends up relatively lower. We therefore also test our hypothesis separating between years in which the dollar appreciated and years in which the dollar depreciated.
Table 3, panel A, presents the mean Qs for the sample of firms with for- eign sales that use FCDs (column 1) and for those that do not use currency derivatives (column 2), and for the firms in our sample with no foreign sales that use FCDs (column 3) and for those that do not use currency derivatives (column 4). Column 5 (column 7) presents the difference in the average Q between users and nonusers for firms with foreign sales (no foreign sales). Row 1 shows results during 1990-1995. The mean Q for users is 1.27, com- pared with a mean Q for nonusers of 1.10, resulting in a hedging premium of 0.17. The premium is statistically significant at the 1% level, as shown in column 6. This result is consistent with our hypothesis that hedgers have a larger value than nonhedgers. For the sample of firms with no foreign sales, we also find a positive and significant hedging premium during 1990-1995 in these univariate tests (columns 7 and 8).
We further test our hypothesis during the years in which the dollar appre- ciated (depreciated) and present results in row 4 (row 7). In these tests we find uniformly the presence of a significant hedging premium (regardless of the dollar's behavior and for both the sample of firms with foreign sales and the sample of firms with no foreign sales).
In panel B, we also test our hypothesis by using the median Qs. As indi- cated earlier, the median Qs are smaller than the average Qs for the firms in our sample. The median Q for FCD users with foreign sales was 1.02 during 1990-1995 (column 1), compared with 0.98 for nonusers (column 2), sug- gesting a difference of about 4% during that period. The hedging premium
256
Use of Foreign Currency Derivatives annd Firmi Manket Valuie
Table 3
Comparison of Q:
hedgers
versus
nonhedgers
Foreign
sales > 0
Foreign
sales = 0
Hedgers
Nonhedgers
Hedgers
Nonhedgers
Difference
Difference
Year
(1)
(2)
(3)
(4)
(5)
(1) -
(2)
t-statistic
(7) =
(3) -
(4)
t-statistic
Panel A:
Differences in
means
All
years
Mean
1.27
1.10
1.41
1.13
0.17
5.53
0.28
4.12
Std.
Dev.
0.84
0.56
1.12
0.82
N
1243
826
339
1896
Dollar
Mean
1.26
1.11
1.38
1.11
0.15
3.12
0.27
3.00
appreciation
Std.
Dev.
0.74
0.54
0.91
0.73
(1993
and
1994)
N
436
258
122
617
Dollar
Mean
1.28
1.10
1.42
1.13
0.18
4.55
0.29
3.08
depreciation
Std.
Dev.
0.89
0.57
1.35
0.86
(90-92 &
95)
N
807
568
217
1279
(1990-1992
and
1995)
Foreign
sales > 0
Foreign
sales = 0
Hedgers
Nonhedgers
Hedgers
Nonhedgers
Difference
Difference
Year
(1)
(2)
(3)
(4)
(5) =
(1) -
(2)
p-value
(7) =
(3) -
(4)
p-value
Panel B:
Differences in
medians
All
years
1.02
0.98
0.97
0.92
0.04
0.001
0.06
0.001
Dollar
1.05
1.00
1.05
0.91
0.05
0.027
0.14
0.001
appreciation
(1993
and
1994)
Dollar
0.98
0.97
0.94
0.93
0.01
0.024
0.01
0.084
depreciation (1990-1992
and
1995)
This
table
presents a
univariate
comparison of
Tobin's Q
between
firms
which
used
foreign
currency
derivatives
and
those
which
did
not
for
the
sample of
firms
with
foreign
sales
and
the
sample
of
firms
with no
foreign
sales.
The
sample
includes all
nonfinancial
COMPUSTAT
firms
with
assets
greater
than
$500
million
for
1990-1995. A
firm is a
user of
foreign
currency
derivatives
for a
given
year if
the
firm
reports
the
use of
foreign
currency
forwards,
futures,
options, or
swaps
during
that
year.
P-values
for
testing
the
difference in
medians
are
constructed
using a
rank-sum
test.
257
The Review of Financial Studies / v 14 n 1 2001
is much smaller than the one documented earlier using the mean values but is also statistically significant. As before, we find that both during the years in which the dollar appreciated and the years in which the dollar depreciated the median values of derivatives users are larger than those of nonusers. In fact, the hedging premium is now much larger during the dollar's appreci- ation period than during the dollar's depreciation period (0.05 compared to 0.01), consistent with the hypothesis described above.
3.1.2 Univariate tests using industry-adjusted Qs. Before we examine further our hypothesis using multivariate tests, we examine in a univariate framework our hypothesis that hedgers have higher values than nonhedgers using industry-adjusted Qs. It is possible that the hedging premium that we have documented so far is purely due to industry influences and not related to the use of derivatives. We use the industry-adjusted Qs constructed according to the methodology described above.
Table 3a presents the results of our univariate tests using industry-adjusted Qs for mean Qs (panel A) and median Qs (panel B). We use the same format as before: column 5 shows the hedging premium for the sample of firms with foreign sales and column 7 shows the hedging premium for the sample of firms with no foreign sales. For both samples, the use of industry- adjusted Qs reduces the hedging premium substantially (e.g., 0.03 compared to 0.17 for firms with foreign sales during 1990-1995) and is now statistically insignificant for the sample of firms with no foreign sales. For firms that have foreign sales, the results using both mean and median Qs show that the hedging premium is larger during the dollar's appreciation years than during its depreciation years (e.g., 0.08 versus 0.01 for the median Qs).
3.1.3 Multivariate tests. In the previous subsection we examined in a uni- variate setting the hypothesis that users of foreign currency derivatives are rewarded by investors with a higher valuation in the marketplace than are nonusers. To document a relationship between the use of derivatives and firm value, however, we need to control for variables that could have an impact on Q, as described earlier. In this subsection, we test our hypothesis in a multivariate setting.
In particular, we control for the following: (1) size, by using the log of total assets as a proxy (as we explained earlier, the sign of size is ambiguous); (2) access to financial markets, by using a dividend dummy that equals 1 if the company paid a dividend in the current year (we expect the dividend dummy to be negatively related to Q); (3) leverage, by using the ratio of long- term debt over equity; (4) profitability, by using ROA and expecting a positive association with Q; (5) investment growth and intangible assets, by using as proxies the ratio of capital expenditures to total sales, the ratio of R&D to total assets, and the ratio of advertising expenses to total assets and expecting a positive association of these proxies with Q; (6) industrial diversification,
258
Use of Foreign Cutrrency Derivatives aond Firmi Market Value
Table
3a
Comparison
of
industry-adjusted
Q:
hedgers
versus
nonhedgers
Foreign
sales > 0
Foreign
sales = 0
Hedgers
Nonhedgers
Hedgers
Nonhedgers
Difference
Difference
Year
(1)
(2)
(3)
(4)
(5) =
(1) -
(2)
t-statistic
(7) =
(3) -
(4)
t-statistic
Panel A:
Differences in
means
All
years
Mean
-0.06
-0.09
-0.03
-0.05
0.03
1.67
-0.02
0.74
Std.
Dev.
0.44
0.48
0.54
0.49
N
1238
818
339
1892
Dollar
Mean
-0.10
-0.18
-0.09
-0.09
0.08
2.36
0.00
0.95
appreciation
Std.
Dev.
0.02
0.03
0.04
0.02
(1993
and
1994)
N
434
259
122
621
Dollar
Mean
-0.06
-0.06
-0.00
-0.06
0.00
0.94
0.06
0.17
depreciation
Std.
Dev.
0.02
0.02
0.04
0.02
(1990-1992
and
1995)
N
804
564
217
1276
Foreign
sales > 0
Foreign
sales = 0
Hedgers
Nonhedgers
Hedgers
Nonhedgers
Difference
Difference
Year
(1)
(2)
(3)
(4)
(5) =
(1) -
(2)
p-value
(7) =
(3) -
(4)
p-value
Panel B:
Differences in
medians
All
years
-0.05
-0.09
-0.04
-0.01
0.04
0.31
-0.03
0.27
Dollar
-0.09
-0.18
-0.09
-0.05
0.08
0.03
-0.04
0.51
appreciation
(1993
and
1994)
Dollar
-0.05
-0.06
-0.05
0.00
0.01
0.87
-0.05
0.41
depreciation (1990-1992
and
1995)
This
table
presents a
univariate
comparison of
industry-adjusted Q
between
firms,
which
used
foreign
currency
derivatives
and
those
which
did
not
for
the
sample of
firms
with
foreign
sales
and
the
sample of
firms
with no
foreign
sales.
Industry-adjusted
Qs
are
constructed by
computing
the
log
difference
between
the
weight-adjusted
industry Q
("pure-play"
firm
Q)
and
each
multisegment
firm's
Q.
The
sample
includes all
nonfinancial
COMPUSTAT
firms
with
assets
greater
than
$500
million
for
1990-1995.
Hedgers
are
defined to be
firms
using
foreign
currency
derivatives.
P-values
for
testing
the
difference in
medians
are
constructed
using a
rank-sum
test.
259
The Review of Financial Studies / v 14 n 1 2001
Table 4 Foreign currency derivatives use and firm value: cross-section results
All firms with foreign sales > 0
Pooled regression Fixed effects Dependent variable: In (Tobin's Q) (1) (2)
Observations 2069 2069 R2 0.73 0.22 FCD dummy (% of Q in parenthesis) 0.053 (5.26%) 0.045 (4.53%)
2.989*** 2.273** Foreign sales/total sales 0.163 0. 573
4.229*** 5.918*** Size (log of total assets) -0.071 -0.117
-7.790*** -4.833*** ROA 0.030 0.015
11.335*** 1 1. 195*** Debt to equity 0.000 0.000
5.004*** 0.237 Growth (capital exp/sales) 0.131 0.024
1.367 0.315 Diversification dummy -0.102 -0.111
-4.830*** -3.426*** Dividend dummy -0.090 -0.033
-3.803*** - 1.704* Advertising/assets 1.173 0.417
3.879*** 1.622* R&D/assets -0.840 -0.418
-2.330** -0.648
This table presents the results for pooled and fixed-effects regressions of the use of derivatives on firm value. The sample includes all nonfinancial COMPUSTAT firms with assets > $500 million and positive foreign sales for 1990-1995. Tobin's Q is the market value of debt and equity divided by the replacement cost of assets constmcted using method described in the text. FCD dummy variable is equal to 1 if the company reports the use of foreign curnency forwards, futures, options, or swaps. Return on assets is the annually compounded net income divided by total assets. Growth opportunities are proxied by the ratio of expenditures on new capital to sales. Debt to equity is the ratio of total debt to shareholder equity. The dividend dummy is set equal to t if the company paid dividends that year, 0 otherwise. The diversification dummy is set equal to 0 unless the firm is active in more than one business segment. The regressions also include year dummies, credit quality controls, and four digit SIC level controls (regression 1 only). ***, **, * denote significance at the 1%, 5%, and 10% levels, respectively. T-statistics are based on White (1980) standard errors.
by using a diversification dummy that equals 1 if a firm operates in more than one industry segment and expecting a negative association with Q; (7) geographic diversification (extent of multinationality), by using the ratio of foreign sales to total sales and expecting a positive association with Q; (8) industry effects, using industry controls at the four-digit SIC and the industry-adjusted Qs in separate regressions; (9) time effects, using year dummies; and finally, (10) credit quality, using the credit rating controls described earlier.
Table 4, regression 1, presents the results of a pooled OLS regression for the sample of firms that have foreign sales. The main variable we use to test our hypothesis is the FCD dummy that equals I if a firm uses currency derivatives and 0 otherwise.t1 Consistent with our hypothesis that firms with
18 We should note that foreign sales is only a proxy for exchange rate exposure. Firms that have no foreign sales may also be exposed to exchange rates through exports or imports competition. This could explain why some of these firms use derivatives in the first place. Given that we cannot verify the nature and extent of the exposure for these firms, including them in the sample along with firms with foreign sales and then using
260
Use of Foreign Currency Derivatives and Firm Maorket Valtue
exposure that use derivatives are rewarded by investors with higher valuation, we find a positive and significant association between the use of derivatives and Q."9 The coefficient value indicates that users of currency derivatives have a higher Q than nonusers by 0.053 or 5.3% of firm value.
Most of the control variables are statistically significant and have the expected sign. For example, like Lang and Stulz (1994), we find that size has a negative sign; the extent of multinationality is positively related to Q; more profitable firms as proxied by high ROA have higher Qs; and simi- larly, firms with access to financial markets have lower Qs; firms that are more diversified across industries are less valuable than single-segment ones, a finding supported by the diversification literature; firms with more leverage have higher Qs, which is consistent with theories that advance the monitor- ing benefits of debt; advertising expenses, which is a proxy for consumer goodwill, is positively related to Q; and finally, our credit quality dummies are significant and consistent with our priors: high-quality firms have high Qs, while low-quality firms have low Qs. In contrast to our expectations, R&D expense has a negative effect on firm value.20 21
To control for unobservable firm characteristics that may affect value, we estimate a fixed-effects model [Hausman and Taylor (1981)]. In the fixed- effects model, each firm is assigned a unique intercept. Regression 2 in Table 4 shows the results of the fixed-effects model. Similar to the results in the pooled regression, we find a positive and significant relationship between derivatives use and firm value for firms with exposure. The magnitude of the hedging premium (0.045) is smaller than that in the pooled regression, and suggests that hedgers have on average 4.5% higher value than nonhedgers. The signs and significance of the coefficients of our control variables are similar to those in the pooled regression, except that in this model, R&D expense is statistically insignificant.
While the tests above control for industry effects using dummy variables at the four-digit SIC, we also investigate the value implications of hedging by using industry-adjusted Qs. This is quite important here, given the large per- centage (63%) of industrially diversified firms in our sample. Table 5 shows the results for the pooled regression (regression 1) and the fixed-effects model (regression 2) using industry-adjusted Qs for the sample of firms with for- eign sales. We find similarly, a positive and significant relationship between
an interaction term for FCD use and foreign sales could result in a less powerful test than the one performed here in which we only consider firms that are definitively exposed through foreign sales.
19 Note that all reported t-statistics are based on White (1980) standard errors.
20 A possible explanation for this result may be the fact that R&D exhibits a strong industry component. Con- trolling for industry effects using two-digit SIC controls instead of four-digit SIC controls results in a positive and significant R&D effect, without having any material effect on the remaining variables.
21 We also included board size as a control variable in some specifications. As in Yermiiack (1996), we also find a negative relationship between the number of board members and Q. Our results on the hedging premium do not change when we include the number of board members as a control variable. Because this numhber is missing for a large part of our sample, we do niot include it in our maini tests.
261

The Review of Financial Studies / v 14 7t 1 2001
Table 5 Foreign currency derivatives use and firm value: cross-section results
All firms with foreign sales > 0
Pooled regression Fixed effects Dependent variable: Industry-adjusted Q (1) (2)
Observations 2056 2056 R2 0.25 0.04 FCD dummy (% of Q in parenthesis) 0.048 (4.80%) 0.036 (3.66%)
2.442** 1.366 Foreign sales/total sales 0.067 0. 213
1.613* 1.633* Size (log of total assets) -0.074 -0.282
-8.971*** -8.728*** ROA 0.026 0.009
1 1.21 1*** 4.965*** Debt to equity -0.000 -0.000
- 1.709* -0.458 Growth (capital exp/sales) 0.429 0.116
6.078*** 1.144 Diversification dummy -0.103 -0.129
-5.453*** -2.973*** Dividend dummy -0.096 -0.019
-3.554*** -0.757 Advertising/assets 0.223 0.119
1.086 0.348 R&D/assets -2.797 0.274
-10.436*** 0.318
This table presents the results for pooled and fixed-effects regressions of the use of derivatives on firm valse. The sample includes all nonfinancial COMPUSTAT firms with assets > $500 million and positive foreign sales for 1990-1995. Industry- adjusted Qs are constructed by computing the log difference between the weight-adjusted industry Q ("puce-play" firm Q) and each multisegment firm's Q following Lang and Stulz (1994). FCD dummy variable is equal to 1 if the company reports the use of foreign currency forwards, futures, options, or swaps. Return on assets is the annually compounded net income divided by total assets. Growth opportunities are proxied by the ratio of expenditures on new capital to sales. Debt to equity is the ratio of total debt to shareholder equity. The dividend dummy is set equal to 1 if the company paid dividends that year, 0 otherwise. The diversification dummy is set equal to 0 unless the firm is active in more than one business segment. The regressions also include year dummies and credit quality controls. ***, **, * denote significance at the 1%, 5%, and 10% levels, respectively. T-statistics are based on White (1980) standard errors.
derivatives use and industry-adjusted value. The magnitude of the hedging
premium is 0.048 in the pooled regression and 0.036 in the fixed-effects
model, and representing 4.8% and 3.6% of firm value, respectively. Most
controls in these regressions have similar signs as before, except leverage,
which has a negative sign. The growth variable (capital expenditures) is now
statistically significant in the pooled regression, indicating that firms with
high investment opportunities have higher Qs. We also examine whether investors value currency hedging for firms that
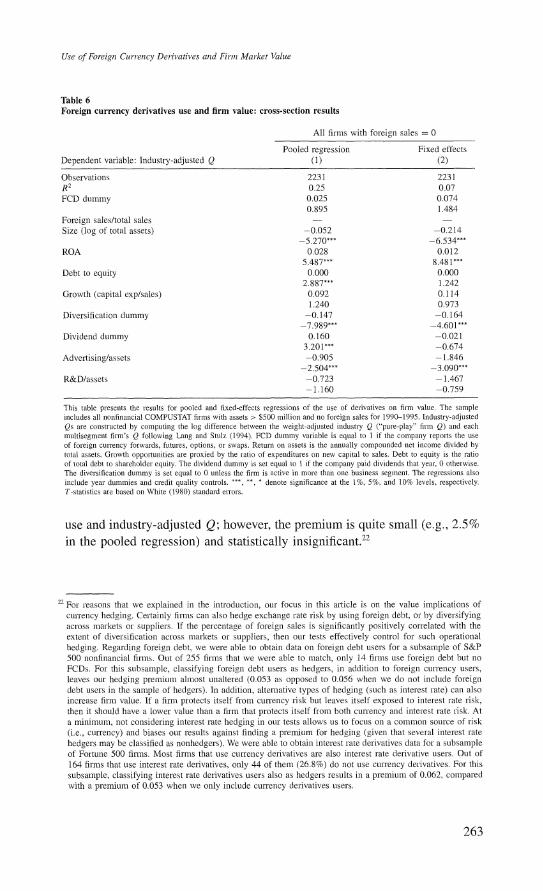
have no foreign operations. As noted before, we cannot be certain whether
these firms have an exposure to exchange rate movements; therefore it is not
clear whether hedging should add value in this sample. We use the same con-
trols for Q as in the previous tests. Table 6 presents the results of these tests
using industry-adjusted Qs for pooled (column 1) and fixed-effects estima-
tion (column 2). We find a positive association between currency derivatives
262
Use of Foreigni Currency Derivatives anid Firm Market Value
Table 6 Foreign currency derivatives use and firm value: cross-section results
All firms with foreign sales = 0
Pooled regression Fixed effects Dependent variable: Industry-adjusted Q (1) (2)
Observations 2231 2231 R2 0.25 0.07 FCD dummy 0.025 0.074
0.895 1.484 Foreign sales/total sales - -
Size (log of total assets) -0.052 -0.214 -5 .270*** -6.534***
ROA 0.028 0.012 5.487X** 8.48 1***
Debt to equity 0.000 0.000 2.887*** 1.242
Growth (capital exp/sales) 0.092 0.114 1.240 0.973
Diversification dummy -0.147 -0.164 -7 .989*** -4.601 ***
Dividend dummy 0.160 -0.021 3.201*** -0.674
Advertising/assets -0.905 -1.846 -2.504*** -3.090***
R&D/assets -0.723 -1.467 -1.160 -0.759
This table presents the results for pooled and fixed-effects regressions of the use of derivatives on firm value. The sample includes all nonfinancial COMPUSTAT firms with assets > $500 million and no foreign sales for 1990-1995. Industry-adjusted Qs are constructed by computing the log difference between the weight-adjusted industry Q ("pure-play" firm Q) and each multisegment firm's Q following Lang and Stulz (1994). FCD dummy variable is equal to I if the company reports the use of foreign cunTency forwards, futures, options, or swaps. Return on assets is the annually compounded net income divided by total assets. Growth opportunities are proxied by the ratio of expenditures on new capital to sales. Debt to equity is the ratio of total debt to shareholder equity. The dividend dummy is set equal to I if the company paid dividends that year, 0 otherwise. The diversification dummy is set equal to 0 unless the firm is active in more than one business segment. The regressions also include year dummies and credit quality controls. ***, **, * denote significance at the 1%, 5%, and 10% levels, respectively. T-statistics are based on White (1980) standard errors.
use and industry-adjusted Q; however, the premium is quite small (e.g., 2.5% in the pooled regression) and statistically insignificant.22
22 For reasons that we explained in the introduction, our focus in this article is on the value implications of
culrency hedging. Certainly firms can also hedge exchange rate risk by using foreign debt, or by diversifying across markets or suppliers. If the percentage of foreign sales is significantly positively correlated with the extent of diversification across markets or suppliers, then our tests effectively control for such operational hedging. Regarding foreign debt, we were able to obtain data on foreign debt users for a subsample of S&P 500 nonfinancial firms. Out of 255 firms that we were able to match, only 14 firms use foreign debt but no FCDs. For this subsample, classifying foreign debt users as hedgers, in addition to foreign currency users, leaves our hedging premiussi almost unaltered (0.053 as opposed to 0.056 when we do not include foreign debt users in the sample of hedgers). In addition, alternative types of hedging (such as interest rate) can also increase firm value. If a firm protects itself from currency risk but leaves itself exposed to interest rate risk, then it should have a lower value than a firm that protects itself from both currency and interest rate risk. At a minimum, not considering interest rate hedging in our tests allows us to focus on a common source of risk
(i.e., currency) and biases our results against finding a premium for hedging (given that several interest rate
hedgers may be classified as nonhedgers). We were able to obtain interest rate derivatives data for a subsample of Fortune 500 firms. Most firms that use currency derivatives are also interest rate derivative users. Out of 164 firms that use interest rate derivatives, only 44 of them (26.8%) do not use currency derivatives. For this
subsample, classifying interest rate derivatives users also as hedgers results in a premium of 0.062, compared with a premium of 0.053 when we only include currency derivatives users.
263
The Review of Finianicial Studies / v 14 it 1 2001
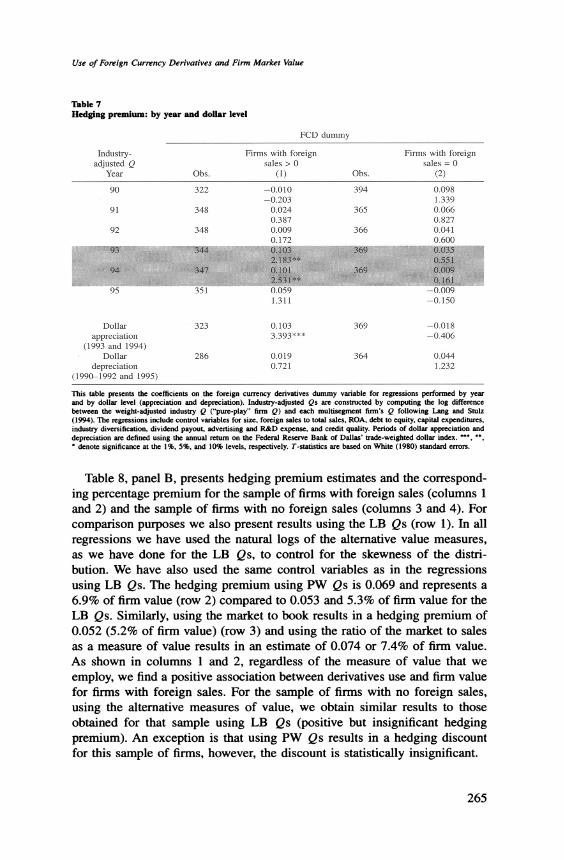
Because in a pooled regression, if there is serial correlation in the use of derivatives, the standard errors would be understated, we also test our hypoth- esis by year and provide results in Table 7. In these by-year regressions, we also use the same control variables as we used for the pooled ones.23 Regres- sions 1 and 2 present the results for the sample of firms with and without foreign sales using industry-adjusted Qs. Consistent with our hypothesis that hedgers have a higher valuation, we find a positive coefficient for the hedge dummy in each year except in 1990 for firms with foreign sales. However, the coefficients are statistically significant only during 1993-1994. In fact, during 1993-1994, the dollar appreciated, while for the remainder of the sample, the dollar depreciated. This is consistent with our hypothesis that, for firms with foreign sales, hedging is more beneficial during the years in which the dol- lar appreciates, as they are likely long foreign currency. Further multivariate tests pooling across the dollar's appreciating and depreciating years (shown at the bottom of Table 7) further confirm this hypothesis. The hedging pre- mium during the dollar's appreciation is 0.103 using industry-adjusted Qs and is highly significant. In contrast, the hedging premium during the dol- lar's depreciation is 0.019 and is statistically insignificant. For firms with no operations abroad (regression 2), the hedging effect is always insignificant.
3.1.4 Sensitivity analysis. In this section we explore the robustness of our results to alternative measures of firm value and to alternative estimation tech- niques that handle the potential impact of outliers. Specifically we construct three alternative measures: (1) a measure of Tobin's Q estimated using the Perfect and Wiles (1994) methodology;24 (2) a simple measure of the mar- ket to book ratio (simple Q); and (3) the ratio of market to sales. Table 8, panel A, presents summary statistics on our value measures. Column 1 shows the correlation between our Lewellen and Badrinath (LB) Q and the rest of the value measures. LB Q has a 0.61 correlation with the Perfect and Wiles (PW) Q, 0.93 correlation with simple Q, and 0.48 correlation with market to sales. The mean (median) of PW Q is 2.09 (1.45) compared with 1.18 (0.95) for LB Q, 1.20 (0.98) for market to book, and 1.69 (1.29) for market to sales. PW Q also has a much larger standard deviation and skewness than LB Q and simple Q. These comparisons are similar to those reported in Lewellen and Badrinath (1997).
23 To conserve space, we do not present results on the control variables. The results on the control variables are similar to those in the pooled regressions.
24 We construct the Perfect and Wiles Q as follows. The market value of the firm is constructed by adding the market value of debt and the market value of equity. The market value of common stock is taken directly from COMPUSTAT. We estimate the market value of preferred stock using the year-end redemption value as suggested by Lang and Stulz (1994). The market value of debt is constructed by using a recursive methodology that estimates the maturity structure of the firm's long-term debt and accounts for changes in the yield on A-rated industrial bonds. We assume that other liabilities (short-term debt) have a market value equal to book value. The replacement cost of assets is calculated as the replacement cost of fixed assets plus inventories. We estimate replacement cost using a recursive methodology that accounts for real depreciation, inflation, new capital expenditures, and the method of inventory accounting used by each firm, as described in Perfect and Wiles (1994).
264
Use of Foreign Currency Derivatives and Firrn Market Value
Table 7 Hedging premium: by year and dollar level
FCD dummy
Industry- Fma with foreign Firm with foreign adjusted Q sales > O sales = 0
Year Obs. (1) Obs. (2)
90 322 -0.010 394 0.098 -0.203 1.339
91 348 0.024 365 0.066 0.387 0.827
92 348 0.009 366 0.041 0.172 0.60
95 351 0.059 -0.009 1.311 -0.150
Dollar 323 0.103 369 -0.018 appreciation 3.393*e* -0.406
(1993 and 1994) Dolar 286 0.019 364 0.044
depecion 0.721 1.232 (1990-1992 and 1995)
This table presents the coefficients on the foreign currency derivatives dummy variable for regressions performed by year and by dollar level (appreciation and depreciation). Industry-adjusted Qs are constructed by computing the log difference between the weight-adjusted industry Q ("pure-play" firm Q) and each multisegment firm's Q following Lang and Stulz (1994). The regressions include control variables for size, foreign sales to total sales, ROA, debt to equity, capital expenditures, industry diversification, dividend payout, advertising and R&D expense, and credit quality. Periods of dollar appreciation and depreciation are defined using the annual return on the Federal Reserve Bank of Dallas' trade-weighted doUlar index.
denote significance at the 1%, 5%, and 10% levels, respectively. T-statistics are based on White (1980) standard errors.
Table 8, panel B, presents hedging premium estimates and the correspond- ing percentage premium for the sample of firms with foreign sales (columns 1 and 2) and the sample of firms with no foreign sales (columns 3 and 4). For comparison purposes we also present results using the LB Qs (row 1). In all regressions we have used the natural logs of the alternative value measures, as we have done for the LB Qs, to control for the skewness of the distri- bution. We have also used the same control variables as in the regressions using LB Qs. The hedging premium using PW Qs is 0.069 and represents a 6.9% of firm value (row 2) compared to 0.053 and 5.3% of firm value for the LB Qs. Similarly, using the market to book results in a hedging premium of 0.052 (5.2% of firm value) (row 3) and using the ratio of the market to sales as a measure of value results in an estimate of 0.074 or 7.4% of firm value. As shown in columns 1 and 2, regardless of the measure of value that we employ, we find a positive association between derivatives use and firm value for firms with foreign sales. For the sample of firms with no foreign sales, using the alternative measures of value, we obtain similar results to those obtained for that sample using LB Qs (positive but insignificant hedging premium). An exception is that using PW Qs results in a hedging discount for this sample of firms, however, the discount is statistically insignificant.
265

The Review of Finiatncial Stludies / v 14 az 1 2001
Table 8
Alternative
measures of
Tobin's Q
Panel A:
Summary
statistics
Correlation with
Measure of
Tobin's Q
benchmark
Mean
Mean:FS > 0
Std.
Dev.
Skewness
10th
percentile
Median
90th
percentile
Benchmark
(Lewellen
and
1.00
1.18
1.21
0.83
4.16
0.62
0.95
1.91
Badrinath
Q)
Perfect
and
Wiles Q
0.61
2.09
2.12
2.36
4.51
0.58
1.45
3.96
Simple Q
0.93
1.20
1.25
0.81
4.22
0.64
0.98
1.93
Market to
sales
0.48
1.69
1.50
1.62
6.04
0.49
1.29
3.15
Panel B:
Hedging
premium-pooled
regressions
FCD
dummy
Firms
with
foreign
sales > 0
Firms
with
foreign
sales = 0
Altemative
measures of Q
Estimate
%Premium
Estimate
%Premiumn
ln(benchmark)
0.053
5.26%
0.038
3.84%
(Lewellen
and
Badrinath
Q)
2.99***
1.303
ln(Perfect
and
Wiles
Q)
0.069
6.86%
-0.065
-6.50%
2.46**
-1.450
ln(simple
Q)
0.052
5.21%
0.024
2.44%
(market to
book)
3.03***
0.870
ln(market to
sales)
0.074
7.38%
0.036
3.55%
3.17t**
1.070
This
table
presents
summary
statistics of
three
alternative
measures of
firm
value
(Tobin's Q
estimated
according to
Perfect
and
Wiles,
ratio of
market
value of
firm to
book
value,
ratio of
market
value of
firm
to
sales)
(panel
A),
and an
analysis of
the
hedging
premium
using
those
alternative
measures of
firm
value
(panel
B).
The
regressions
include
control
variables
for
size,
foreign
sales to
total
sales,
ROA,
debt to
equity,
capital
expenditures,
industry
diversification,
dividend
payout,
advertising
and
R&D
expense,
credit
quality,
and
industry
controls at
the
four
digit
SIC
level.
***, **,
denote
significance at
the
1%,
5%,
and
10%
levels,
respectively.
T-statistics
are
based on
White
(1980)
standard
errors.
266
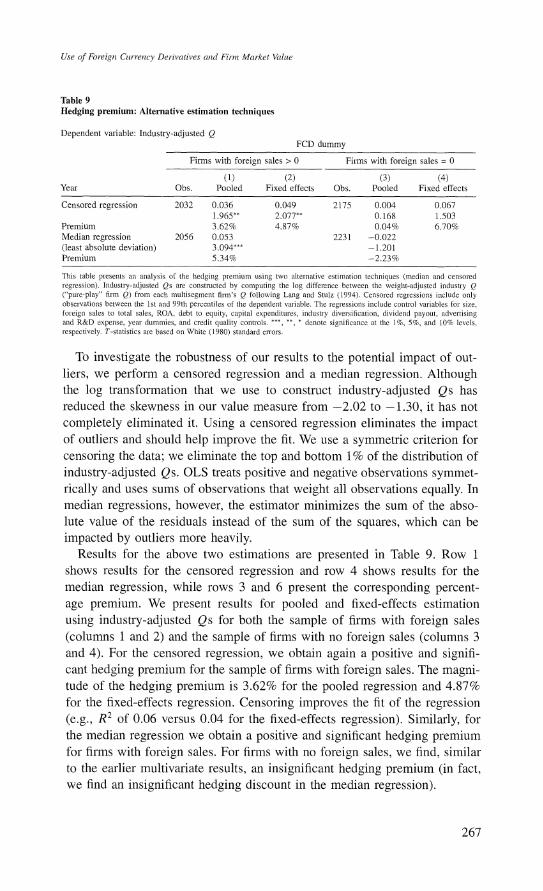
Use of Foreigni Currenicy Derivatives anid Firn Market Value
Table 9 Hedging premium: Alternative estimation techniques
Dependent variable: Industry-adjusted Q FCD dummy
Firms with foreign sales > 0 Firms with foreign sales = 0
(1) (2) (3) (4) Year Obs. Pooled Fixed effects Obs. Pooled Fixed effects
Censored regression 2032 0.036 0.049 2175 0.004 0.067 1.9658* 2.077** 0.168 1.503
Premium 3.62% 4.87% 0.04% 6.70% Median regression 2056 0.053 2231 -0.022 (least absolute deviation) 3.094*** -1.201 Premium 5.34% -2.23%
This table presents an analysis of the hedging premium using two alternative estimation techniques (median and censored regression). Industry-adjusted Qs are constructed by computing the log difference between the weight-adjusted industry Q ("pure-play" firm Q) from each multisegment firm's Q following Lang and Stulz (1994). Censored regressions include only observations between the 1st and 99th percentiles of the dependent variable. The regressions include control variables for size, foreign sales to total sales, ROA, debt to equity, capital expenditures, industry diversification, dividend payout, advertising and R&D expense, year dummies, and credit quality controls. ***, **, * denote significance at the 1%, 5%, and 10% levels, respectively. T-statistics are based on White (1980) standard erTors.
To investigate the robustness of our results to the potential impact of out- liers, we perform a censored regression and a median regression. Although the log transformation that we use to construct industry-adjusted Qs has reduced the skewness in our value measure from -2.02 to -1.30, it has not completely eliminated it. Using a censored regression eliminates the impact of outliers and should help improve the fit. We use a symmetric criterion for censoring the data; we eliminate the top and bottom 1% of the distribution of industry-adjusted Qs. OLS treats positive and negative observations symmet- rically and uses sums of observations that weight all observations equally. In median regressions, however, the estimator minimizes the sum of the abso- lute value of the residuals instead of the sum of the squares, which can be impacted by outliers more heavily.
Results for the above two estimations are presented in Table 9. Row 1 shows results for the censored regression and row 4 shows results for the median regression, while rows 3 and 6 present the corresponding percent- age premium. We present results for pooled and fixed-effects estimation using industry-adjusted Qs for both the sample of firms with foreign sales (columns 1 and 2) and the sample of firms with no foreign sales (columns 3 and 4). For the censored regression, we obtain again a positive and signifi- cant hedging premium for the sample of firms with foreign sales. The magni- tude of the hedging premium is 3.62% for the pooled regression and 4.87% for the fixed-effects regression. Censoring improves the fit of the regression (e.g., R2 of 0.06 versus 0.04 for the fixed-effects regression). Similarly, for the median regression we obtain a positive and significant hedging premium for firms with foreign sales. For firms with no foreign sales, we find, similar to the earlier multivariate results, an insignificant hedging premium (in fact, we find an insignificant hedging discount in the median regression).
267
The Review of Financial Studies / v 14 n 1 2001
3.1.5 The size of the premium. In our tests above using industry-adjusted Qs, we find the size of the average hedging premium to be between 3.62% and 5.34% of firm value, while the premium obtained from the censored fixed-effects regression is 4.87%. One way to gauge whether the estimated hedging premium has a meaningful size is to examine the magnitudes of the relevant benefits that theory suggests should arise due to hedging. Hedging theories point out the beneficial effects of hedging in reducing expected taxes, reducing bankruptcy costs, and mitigating underinvestment. These effects could be sizable, given that the firms in our sample have dispersed credit ratings and substantial exposure to exchange rates. A recent article by Gra- ham and Rogers (2000), which examines the factors that determine a firm's decision to use interest rate, currency, or commodity derivatives, estimates the tax benefits of hedging to be about 0.5% of asset value, as hedging increases the average firm debt ratio in their sample by 1.26%. Kaplan (1989) estimates the expected costs of bankruptcy for Federated to be around 3%, while other studies [e.g., Altman (1984), Weiss (1990), Andrade and Kaplan (1998)] find bankruptcy costs that are on the order of 16.7%, 2.8%, and between 10% and 20%, respectively. Given that these estimates of bankruptcy costs are from samples of firms that went into bankruptcy, in order to obtain an estimate of the hedging benefit for our sample firms, we should multiply these estimates by the probability of bankruptcy. Assuming a default probability of 1% and bankruptcy costs of 10-20% found in Andrade and Kaplan (1998) yields an estimate of bankruptcy costs of 0.1-0.2% for our sample firms. Finally, Lewent and Kearney (1990), in a study describing the rationale for hedging currency risk at Merck, report that companies end up reducing their capital expenditures by roughly $0.35 for each dollar reduction in cash flow when exchange rates move against them (and they are unhedged). Given that we find a coefficient on capital expenditures to sales between 0.091 and 0.429 in our regressions, that would suggest, holding sales constant, a reduction in value of between 3% (0.091 divided by 3) and 14.3% (0.429 divided by 3). These estimates should be multiplied by the probability that exchange rates move adversely to yield estimates of the hedging benefit in reducing under- investment. Assuming a probability of exchange rates moving against a firm to be 0.5 and the average effect from underinvestment of 8.65% (3% plus 14.3% divided by 2) yields an average hedging benefit of 4.32% due to the reduction in underinvestment.25
Overall the cumulative benefits of hedging due to the reduction in expected taxes, bankruptcy costs, and underinvestment (e.g., 0.5% due to taxes, 0.2% due to bankruptcy costs, and 4.32% due to underinvestment) are in the same
25 In this framework, we have made several strong assumptions about the sensitivity of sales to exchange rate changes, the relation between changes in sales and cash flows, and the initial level of the capital-to-sales ratio. Relaxing some of these assumptions may lead to different magnitudes of the expected hedging premium. We have also estimated the model using the ratio of capital expenditures to assets (which may be less sensitive to exchange rates) and find qualitatively similar results.
268
Use of Foreign Cutrenicy Derivatives and Firmn Market Value
range with the premium that we estimated here (e.g., 4.87% in the censored fixed-effects regression). Note that these estimates of the hedging benefits due to the reduction in expected taxes, bankruptcy costs, and underinvestment are only rough, "back of the envelope" estimates. We do not mean to imply that these are exact measures, but rather, useful approximations we can employ as benchmarks for our premium.26 While these benefits may be substantial, our point estimate of the premium seems rather large.27
Finally, it is likely that firms that use currency derivatives also use other types of risk management activities. Hence, although currency hedging is a very critical component of risk management for our sample firms--since they have a high percentage of revenues in foreign currencies-other types of risk management activities and firms' overall risk management capabili- ties and sophistication may also contribute to the somewhat large hedging premium found here.
3.2 Time-series analysis
3.2.1 Reverse causality tests. In the previous section, we found evidence consistent with the hypothesis that the use of FCDs increases firm value, especially for firms with exposure to exchange rates. However, there may be an alternative explanation for these results. A large value of Tobin's Q reflects the fact that the market value of a firm exceeds the replacement costs of its assets. If firms with large values of Tobin's Q have many profitable investment opportunities, then these firms may have an added incentive to hedge. That is, higher values for firms that use derivatives may simply reflect the fact that high-Q firms have an incentive to hedge, and not that hedging causes higher values.
To test for the possibility of this reverse causation, we classify firms each year into one of four categories: (1) firms that choose not to hedge in the current and the next period (N,N,+?); (2) firms that hedge in the current period, but choose not to hedge in the next period (HtN,+?); (3) firms that did not hedge in the current period but choose to hedge in the next period
(NtHt+?); and (4) firms that choose to hedge in the current and the next period (HtH,+,). We then construct dummy variables for categories (1)-(3) and use these variables in the following cross-sectional regression:
Qt= a + j (Firm remains unhedged, (N,N,+?))
+ ,2(Firm quits hedging in the next period, (HtNt+?))
26 Note that it may not be appropriate to benchmark this premium against the notional values of the currency derivatives that firms report, since, as stated above, the notional values collected here do not include currency swaps whose magnitudes were not comparable with the magnitudes of forward contracts (hence the positions in currency derivatives reported here significantly understate the actual currency positions employed by the
firms) and the fact that it is possible that year-end notional values are not representative of the amounts used
during the year.
27 Our confidence interval suggests that there is a 95% probability that the interval 0.2-9.4% includes the "true" premium.
269
The Review of Financial Studies / v 14 n 1 2001
+ j3 (Firm begins hedging in the next period, (NtHt+?)) + yXt + st
where X represents the vector of explanatory variables used in the previous regressions (e.g., size, ROA, etc.) and E is the error term.28
If it is the case that firms with high Qs choose to hedge, then firms that begin hedging in the next period, NtHt+?, should have larger Qs than firms that decided to remain unhedged in the next period, NtNt+1. That is, we would expect /33 > /3l. In addition, if firms choose not to hedge because they have low Qs, then we should similarly expect firms that quit hedging in the next period to have lower Qs than firms that remain hedged, that is, /2 < 0
Finally, our results from the previous section suggest that firms that do not hedge have lower Qs than firms which do, or /3I < 0. We therefore test the following three hypotheses concerning the causal relation between hedging and firm value:
Hypothesis 1. PI = 0 (hedging adds no value).
Hypothesis 2. /3 = /I (the decision to begin hedging is unaffected by the size of Q).
Hypothesis 3. P2 0 ? (the decision to quit hedging is unaffected by the size of Q).
Table 10 presents the results of our OLS estimation of the above regression model for all firms with foreign sales using both raw Qs (regression 1) and industry-adjusted Qs (regression 2). Consistent with our findings in the previous section, our results continue to show that firms that use derivatives are valued higher than firms that do not use derivatives. That is, we reject Hypothesis 1 for both raw Qs and industry-adjusted Qs (p-values of 0.057 and 0.042, respectively).
In addition, we test the linear restrictions implied by Hypotheses 2 and 3 using a Wald test. We cannot reject Hypothesis 2, that the decision to begin hedging is unaffected by Q (p-value of 0.359 for raw Q and 0.977 for industry-adjusted Qs), and similarly, we cannot reject Hypothesis 3, that the decision to quit hedging is unaffected by Q (for industry-adjusted Qs). We are also unable to reject the null hypothesis of no reverse causality implied by Hypotheses 2 and 3 when we test them jointly (p-value of 0.310 for raw Q and 0.849 for industry-adjusted Qs). On the basis of these tests, we find no evidence that the correlation between the use of foreign currency derivatives and firm value stems from reverse causality. Our results are consistent with the hypothesis that hedging causes an increase in firm value.29
28 This specification is similar to Servaes (1996) who investigates the time-series properties of industrial diver- sification on firm value.
29 Note that Geczy, Minton, and Schrand (1997) also find that Tobin's Q is not significantly related to a firm's decision to use currency derivatives in a sample of Fortune 500 firms.
270
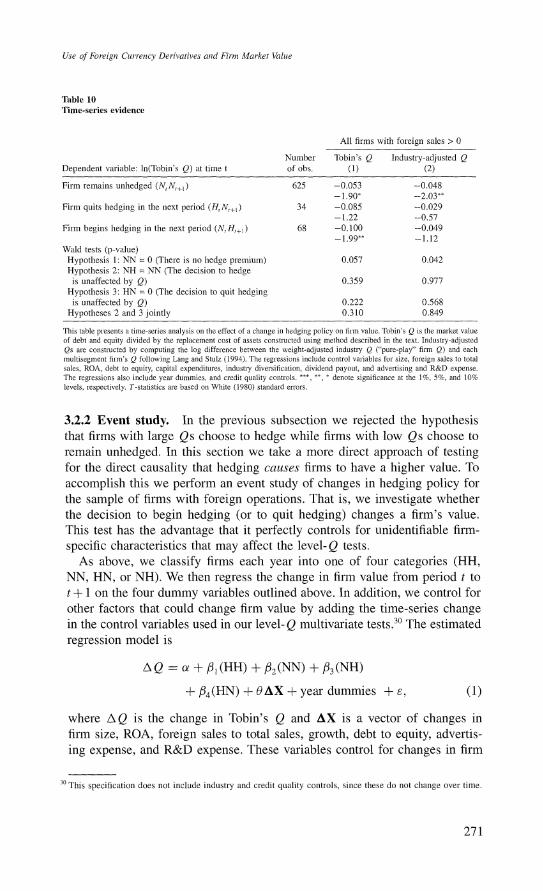
Use of Foreign Currency Derivatives aond Fir-m Market Value
Table 10 Time-series evidence
All firms with foreign sales > 0
Number Tobin's Q Industry-adjusted Q Dependent variable: ln(Tobin's Q) at time t of obs. (1) (2)
Firm remains unhedged (N N,+,) 625 -0.053 -0.048 - 1.90* -2.03**
Firm quits hedging in the next period (HtN,+,) 34 -0.085 -0.029 -1.22 -0.57
Firm begins hedging in the next period (NAH,,,) 68 -0.100 -0.049 -1.99** -1.12
Wald tests (p-value) Hypothesis 1: NN = 0 (There is no hedge premium) 0.057 0.042 Hypothesis 2: NH = NN (The decision to hedge
is unaffected by Q) 0.359 0.977 Hypothesis 3: HN = 0 (The decision to quit hedging
is unaffected by Q) 0.222 0.568 Hypotheses 2 and 3 jointly 0.310 0.849
This table presents a time-series analysis on the effect of a change in hedging policy on firm value. Tobin's Q is the market value of debt and equity divided by the replacement cost of assets constructed using method described in the text. Industry-adjusted Qs are constructed by computing the log difference between the weight-adjusted industry Q ("pure-play" firm Q) and each multisegment firm's Q following Lang and Stulz (1994). The regressions include control variables for size, foreign sales to total sales, ROA, debt to equity, capital expenditures, industry diversification, dividend payout, and advertising and R&D expense. The regressions also include year dummies, and credit quality controls. i**, **, * denote significance at the 1%, 5%, and 10% levels, respectively. T-statistics are based on White (1980) standard errors.
3.2.2 Event study. In the previous subsection we rejected the hypothesis that firms with large Qs choose to hedge while firms with low Qs choose to remain unhedged. In this section we take a more direct approach of testing for the direct causality that hedging causes firms to have a higher value. To accomplish this we perform an event study of changes in hedging policy for the sample of firms with foreign operations. That is, we investigate whether the decision to begin hedging (or to quit hedging) changes a firm's value. This test has the advantage that it perfectly controls for unidentifiable firm- specific characteristics that may affect the level-Q tests.
As above, we classify firms each year into one of four categories (HH, NN, HN, or NH). We then regress the change in firm value from period t to t + 1 on the four dummy variables outlined above. In addition, we control for other factors that could change firm value by adding the time-series change in the control variables used in our level- Q multivariate tests.30 The estimated regression model is
AQ = a + /31 (HH) + P2(NN) + /33(NH)
+ ?4(HN) + ?AX + year dummies + e, (1)
where A Q is the change in Tobin's Q and AX is a vector of changes in firm size, ROA, foreign sales to total sales, growth, debt to equity, advertis- ing expense, and R&D expense. These variables control for changes in firm
30 This specification does not include industry and credit quality controls, since these do not change over time.
271
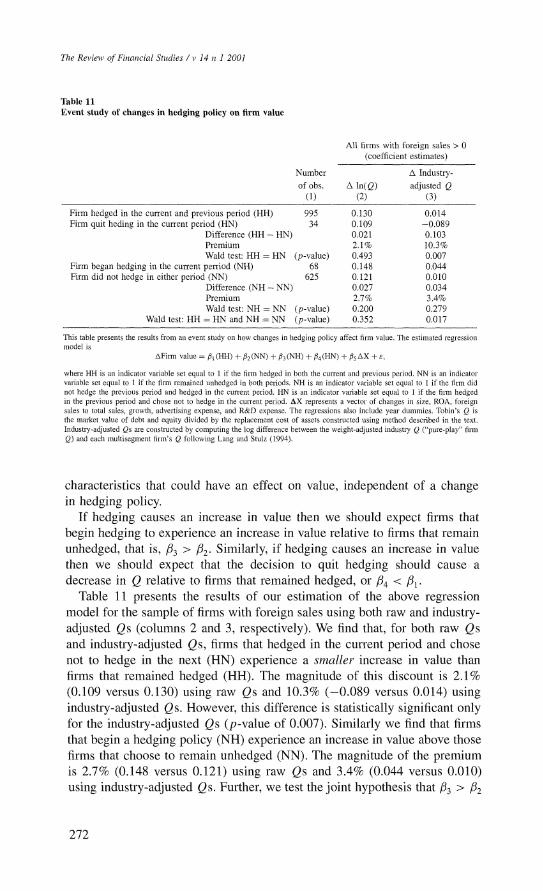
The Review of Finanicial Stutdies / v 14 n 1 2001
Table 11 Event study of changes in hedging policy on firm value
All firms with foreign sales > 0 (coefficient estimates)
Number A Industry-
of obs. A ln(Q) adjusted Q
(1) (2) (3)
Firm hedged in the current and previous period (HH) 995 0.130 0.014 Firm quit heding in the current period (HN) 34 0.109 -0.089
Difference (HH - HN) 0.021 0.103 Premium 2.1% 10.3% Wald test: HH = HN (p-value) 0.493 0.007
Firm began hedging in the current perriod (NH) 68 0.148 0.044 Firm did not hedge in either period (NN) 625 0.121 0.010
Difference (NH - NN) 0.027 0.034 Premium 2.7% 3.4% Wald test: NH = NN (p-value) 0.200 0.279
Wald test: HH = HN and NH = NN (p-value) 0.352 0.017
This table presents the results from an event study on how changes in hedging policy affect firm value. The estimated regression model is
AFirm value = 41 (HH) + 02 (NN) + 03 (NH) + 04(HN) + 45 AX + r,
where HH is an indicator variable set equal to 1 if the firm hedged in both the current and previous period. NN is an indicator variable set equal to 1 if the firm remained unhedged in both periods. NH is an indicator variable set equal to 1 if the firm did not hedge the previous period and hedged in the current period. HN is an indicator variable set equal to 1 if the firm hedged in the previous period and chose not to hedge in the current period. AX represents a vector of changes in size, ROA, foreign sales to total sales, growth, advertising expense, and R&D expense. The regressions also include year dummies. Tobin's Q is the market value of debt and equity divided by the replacement cost of assets constructed using method described in the text. Industry-adjusted Qs are constructed by computing the log difference between the weight-adjusted industry Q ("pure-play" firm Q) and each multisegment firm's Q following Lang and Stulz (1994).
characteristics that could have an effect on value, independent of a change in hedging policy.
If hedging causes an increase in value then we should expect firms that begin hedging to experience an increase in value relative to firms that remain unhedged, that is, /33 > I32 Similarly, if hedging causes an increase in value then we should expect that the decision to quit hedging should cause a decrease in Q relative to firms that remained hedged, or 34 < 31-
Table 11 presents the results of our estimation of the above regression model for the sample of firms with foreign sales using both raw and industry- adjusted Qs (columns 2 and 3, respectively). We find that, for both raw Qs and industry-adjusted Qs, firms that hedged in the current period and chose not to hedge in the next (HN) experience a smaller increase in value than firms that remained hedged (HH). The magnitude of this discount is 2.1% (0.109 versus 0.130) using raw Qs and 10.3% (-0.089 versus 0.014) using industry-adjusted Qs. However, this difference is statistically significant only for the industry-adjusted Qs (p-value of 0.007). Similarly we find that firms that begin a hedging policy (NH) experience an increase in value above those firms that choose to remain unhedged (NN). The magnitude of the premium is 2.7% (0.148 versus 0.121) using raw Qs and 3.4% (0.044 versus 0.010) using industry-adjusted Qs. Further, we test the joint hypothesis that /3 > P2
272
Use of Foreign Currentcy Derivatives and Firmi Market Vallue
and 134 < 01 using a Wald test. For the industry-adjusted Qs, we can reject the hypothesis that there is no relation between a change in hedging policy and firm value at the 1% level. Overall the magnitude of these premia are roughly consistent with those reported in the previous sections in the level- Q tests.31
These results provide evidence that hedging increases firm value, and not that high-Q firms choose to hedge. Moreover, the premium exists in both directions. Firms that begin hedging are rewarded relative to firms that did not, and firms that cease hedging are discounted relative to firms that remain hedged. However, these findings should be interpreted with some caution. In our sample, we identify only 34 firms that ceased hedging over time and 68 firms that began hedging.32 In addition, as noted above, our hedging data was collected from the footnotes of firms' annual reports. Some firms that we classify as beginning a hedging policy between 1990 and 1995 may have only begun reporting the use of derivatives. As a result, we are reluctant to draw strong conclusions from such a small sample. Nevertheless, our results in this section are consistent with the hypothesis that the decision to hedge causes an increase in firm valuation and not the other way around. We find no evidence of reverse causation and some evidence that hedging improves firm value.
4. Conclusions
This article examines the use of FCDs in a sample of 720 large nonfinancial firms between 1990 and 1995. We examine whether firms with currency exposure that use FCDs are rewarded by investors with a higher market valuation.
Using Tobin's Q as an approximation for firm market value, we find signif- icant evidence that the use of FCDs is positively associated with firm market value. Specifically we find that, on average, firms that face currency risk and use currency derivatives have a 4.87% higher value than firms that do not use currency derivatives. This result is robust to numerous controls (size, profitability, leverage, growth opportunities, ability to access financial mar- kets, geographic and industrial diversification, credit quality, industry effects, firm fixed effects, and time effects), to the use of alternative measures of Q, or firm value in general, and to alternative specifications (i.e., median and censored regressions) that handle the potential effect of outliers. For firms that have no foreign involvement-but may be exposed to exchange
31 Our results do not change when we eliminate three firms from our sample which began and subsequently quit hedging during our sample period.
32 Tahle 2, row 5, identifies 47 new net hedgers (difference between the number of firms that began hedging and those that quit hedging). However, 13 of those switched from having no foreign sales to having foreign sales and hedging; they therefore appear in Table 2, but are not in the tests of Table 11, as they did not switch their hedging policy [net hedgers of 34 (68 - 34)].
273
The Review of Finiancial Studies / v 14 n 1 2001
rate movements through exports or import competition-we find a small and statistically insignificant hedging premium.
In addition, we perform further tests to examine whether hedging causes an increase in firm value. We find evidence that firms that begin a hedging policy experience an increase in value above those firms that choose to remain unhedged and that firms that quit hedging experience a decrease in value relative to those firms that choose to remain hedged.
Our results are consistent with theories that suggest the decision to hedge is value increasing. While most studies so far examine what determines a firm's decision to hedge, very little is known about the more fundamental question of whether hedging increases value. Our article sheds light on this important issue by providing evidence on the existence of a hedging premium.
Appendix We construct a measure of the industry-adjusted Q as follows. Assume that the holding
company owns n firms. Let oi be the weight of the ith firm in the holding company and Qi is Tobin's Q for the ith business segment. The properly constructed industry-adjusted Q for the consolidated company would therefore be
Qindustry-adjusted = ln(Qconsolidated) -ln( cei Qi) (Al)
Lang and Stulz (1994) show that an unbiased comparison of Tobin's Q between diversified and single segment firms requires computing a replacement cost-weighted average of the stand- alone Qs for each business segment. However, neither the replacement cost of a firm's divisions nor the stand-alone Qs can be computed using publicly available databases. As in Lang and Stulz (1994), we proxy for the replacement cost of each business segment with the book value of its assets. In addition, we proxy for the stand-alone Q of each division by the average of the Qs of all single-segment firms in COMPUSTAT with the same three-digit SIC as that division. The weights given to each business segment, cei, are therefore simply the share of the book value of assets in each segment, or Assetsi
si. = 1
E Assetsi
References Allayannis, G., and E. Ofek, 2000, "Exchange-Rate Exposure, Hedging, and the Use of Foreign Currency Derivatives," forthcoming, Journal of International Moniey and Finance.
Altman, E., 1984, "A Further Investigation of the Bankruptcy Cost Question," Journal of Finiance, 39, 1067-1089.
Andrade, G., and S. Kaplan, 1998, "How Costly is Financial (Not Economic) Distress? Evidence from Highly Leveraged Transactions That Became Distressed," Journal of Finance, 53, 1443-1493.
Berger, P., and E. Ofek, 1995, "Diversification's Effect on Firm Value," Journal of Financial Econiornics, 37, 39-65.
Block, S., and T. Gallagher, 1986, "The Use of Interest Rate Futures and Options by Corporate Financial Managers," Finiancial Management, 15, 73-78.
Bodnar, G., C. Tang, and J. Weintrop, 1997, "Both Sides of Corporate Diversification: the Value Impact of Geographical and Industrial Development," Working Paper 6224, NBER.
274
Use of Foreign Cluriency Derivatives and Fimn Market Valute
Coase, R., 1937, "The Nature of the Firm," Economica, 4, 386-405.
DeMarzo, P., and D. Duffie, 1995, "Corporate Incentives for Hedging and Hedge Accounting," Review of Finiancial Stuidies, 95, 743-771.
Dunning, J., 1973, "The Determinants of International Product," Oxford Econiomiiic Papers, 25, 289-336.
Froot, K., D. Scharfstein, and J. Stein, 1993, "Risk Management: Coordinating Corporate Investment and Financing Policies," Journal of Finanice, 48, 1624-1658.
Geczy, C., B. Minton, and C. Schrand, 1995, "Why Firms Use Derivatives Distinguishing among Existing Theories," working paper, Wharton Business School, University of Pennsylvania.
Geczy, C., B. Minton, and C. Schrand, 1997, "Why Firms Use Currency Derivatives?" Journal of Finance, 52, 1324-1354.
Graham, J., and D. Rogers, 2000, "Do Firms Hedge in Response to Tax Incentives?" working paper, North- eastern University.
Haushalter, D., 2000, "Financing Policy, Basis Risk, and Corporate Hedging: Evidence from Oil and Gas Producers," Journal of Finanice, 55, 107-152.
Hausman, J., and W. Taylor, 1981, "Panel Data and Unobservable Individual Effects," Econotnetrica, 49, 1377-1398.
Jensen, M., 1986, "Agency Costs of Free Cash Flow, Corporate Finance and Takeovers," Amlerican Econiomic Revievv, 76, 323-329.
Kaplan, S., 1989, "Campeau's Acquisition of Federated: Value Destroyed or Value Added?" Journ-lal of Finiani- cial Econtomnics, 25, 191-212.
Lang, L., and R. Stulz, 1994, "Tobin's Q, Corporate Diversification and Firm Performance," Journ-lal of Political Econony, 102, 1248-1280.
Lewellen, W., 1971, "A Pure Financial Rationale for the Conglomerate Merger," Jolus7lal of Finianice, 26, 521-537.
Lewellen, W., and S. G. Badrinath, 1997, "On the Measurement of Tobin's Q," Journal of Finanicial Eco- niomics, 44, 77-122.
Lewent, J., and J. Kearney, 1990, "Identifying, Measuring and Hedging Currency Risk at Merck," Continenltal Bank Journal of Applied Corporate Finiance, 1, 19-28.
Mian, S., 1996, "Evidence on Corporate Hedging Policy," Journal of Finanicial anid Quanititative Anialysis, 31, 419-439.
Morck, R., and B. Yeung, 1991, "Why Investors Value Multinationality," Journlal of Businiess, 64, 165-187.
Mueller, D., 1987, "The Corporation: Growth, Diversification and Mergers," Harwood: Chur, Switzerland.
Myers, S., 1977, "Determinants of Corporate Borrowing," Journal of Finanicial Econionics, 5, 147-175.
Nance, D., C. Smith, and C. Smithson, 1993, "On the Determinants of Corporate Hedging," Journlal of Finance, 48, 267-284.
Peltzman, S., 1977, "The Gains and Losses from Industrial Concentration," Joumrlal of Lasv and Econonmics, 20, 229-263.
Perfect, S., and K. Wiles, 1994, "Alternative Constructions of Tobin's Q: An Empirical Comparison," Joulrlal of Empirical Finance, 1, 313-341.
Schrand, C., and H. Unal, 1998, "Hedging and Coordinated Risk Management: Evidence from Thrift Con- versions," Journal of Finanice, 53, 979-1013.
Servaes, H., 1996, "The Value of Diversification During the Conglomerate Merger Wave," Journlal of Finianice, 51, 1201-1225.
275
The Review of Financial Studies / v 14 n 1 2001
Smith, C., and R. Stulz, 1985, "The Determinants of Firms' Hedging Policies," Jolurnal of Finianicial anid Quantitative Anialysis, 20, 391-405.
Smith, C., and R. Watts, 1992, "The Investment Opportunity Set and Corporate Financing, Dividend, and Compensation Policies," Journal of Financial Economics, 32, 263-292.
Stulz, R., 1984, "Optimal Hedging Policies," Journal of Financial anid Quantitative Analysis, 19, 127-140.
Tufano, P., 1996, "Who Manages Risk? An Empirical Examination of Risk Management Practices in the Gold Mining Industry," Joufrnal of Finanice, 51, 1097-1137.
Visvanathan, G., 1998, "Who Uses Interest Rate Swaps? A Cross-Sectional Analysis," JOUn77al of Accountinig, Auditing and Finanice, 13, 173-200.
Wall, L., and J. Pringle, 1989, "Alternative Explanations of Interest Rate Swaps: A Theoretical and Empirical Analysis," Finiancial Management, 18, 59-73.
White, H., 1980, "A Heteroskedasticity-Consistent Covariance Matrix Estimator and a Direct Test for Het- eroskedasticity," Econometrica, 48, 817-838.
Weiss, L., 1990, "Bankruptcy Resolution: Direct Costs and Violation of Priority of Claims," Journal of Finan- cial Economics, 27, 285-314.
Williamson, O., 1970, "Corporate Control and Business Behavior: An Inquiry into the Effects of Organiza- tional Form on Enterprise Behavior," Prentice Hall, Englewood Cliffs, N.J.
Yermack, D., 1996, "Higher Market Valuation of Companies with a Small Board of Directors," Jolurnial of Financial Economics, 40, 185-211.
276