The Role of Schooling in Taiwan’s Labor Market: Human Capital, Screening or Credentialism?
41
The Role of Schooling in Taiwan’s Labor Market: Human Capital, Screening or Credentialism? Jeng Liu ∗ Arthur Sakamoto ** Taiwanese Journal of Sociology 29: 1-56 December 2002 Acknowledgment: This research was partially supported by a grant from the National Science Council (NSC-89-2745-P-343-001). Gratitude is extended to Paula England for earlier discussions on this research topic. Earlier versions of this paper were presented at the 2000 Taiwanese Sociological Association Annual Meeting and the 2001 American Sociological Association Annual Meeting. All opinions expressed herein are the sole responsibility of the authors. Direct correspondence to Jeng Liu, Department of Sociology, Tung-hai University, Taichung, 407, Taiwan. Tel: (04) 2359-0121 ext 2987; fax: (04) 2359-3780; email: [email protected] ∗ Jeng Liu, Assistant Professor, Department of Sociology, Tung-hai University, Taiwan ** Arthur Sakamoto, Associate Professor, Department of Sociology, The University of Texas at Austin, U.S.A.
Transcript of The Role of Schooling in Taiwan’s Labor Market: Human Capital, Screening or Credentialism?

The Role of Schooling in Taiwan’s Labor Market:
Human Capital, Screening or Credentialism?
Jeng Liu∗ Arthur Sakamoto**
Taiwanese Journal of Sociology 29: 1-56
December 2002
Acknowledgment:
This research was partially supported by a grant from the National Science Council
(NSC-89-2745-P-343-001). Gratitude is extended to Paula England for earlier
discussions on this research topic. Earlier versions of this paper were presented at the
2000 Taiwanese Sociological Association Annual Meeting and the 2001 American
Sociological Association Annual Meeting. All opinions expressed herein are the sole
responsibility of the authors. Direct correspondence to Jeng Liu, Department of
Sociology, Tung-hai University, Taichung, 407, Taiwan. Tel: (04) 2359-0121 ext 2987;
fax: (04) 2359-3780; email: [email protected]
∗ Jeng Liu, Assistant Professor, Department of Sociology, Tung-hai University, Taiwan ** Arthur Sakamoto, Associate Professor, Department of Sociology, The University of Texas at Austin, U.S.A.
The Role of Schooling in Taiwan’s Labor Market:
Human Capital, Screening or Credentialism?
ABSTRACT
A classic issue in social stratification is whether the correlation between an
individual’s education and his or her socioeconomic attainment is derived from increased
productivity (i.e., human capital), labor market screening or simply from his or her
credentials (credentialism). All three theories predict an association between education
and socioeconomic status, but they differ with regard to the precise underlying causes of
such a relationship. While previous research has largely avoided the challenge of
empirically testing these three competing explanations, here we provide some relevant
findings to tackle this research dilemma. More specifically, we investigate the effects of
different measures of schooling on productivity so as to provide systematic evidence that
is pertinent to distinguishing between the different perspectives in an empirical manner.
The results of our analysis of recent data on productivity and schooling in Taiwanese
manufacturing industries clearly support the view of education as productive human
capital and provide limited backing for the notion of a mechanism for labor market
screening. Since these results only pertain to the manufacturing sector, they cannot be
used to generalize about the entire economy. Nonetheless, we conclude that our
findings demonstrate that this difficult research problem can indeed be empirically
investigated and that, in the future, researchers should consider revisiting the challenge of
understanding the nature of the various effects of education on social stratification.
Key words: human capital, screening, credentialism, labor productivity
1
The Role of Schooling in Taiwan’s Labor Market:
Human Capital, Screening or Credentialism?
I. Introduction
A well known fact is that schooling is closely associated with greater socioeconomic
status, and not surprisingly, this correlation has been noted across various units of
analysis. Workers who have more schooling, for one, tend to have higher wages (Card
1998) and more rewarding occupations (Featherman and Hauser 1978). Along the same
line, American metropolitan areas and states with more highly educated residents report
higher average incomes (Chiswick 1974; Hale and Main 1977; Hirsch 1978). As for
industries, those with more educated workers evidently have greater productivity (Galle
et al. 1985) and earnings (Dickens and Katz 1987; Hirsch 1982), a fact which has long
led economists to argue that educational expansion has significantly contributed to
economic growth (Jorgenson 1984; Jorgenson and Fraumeni 1995a); the analysis of
Walters and Rubinson (1983) suggests, however, that these effects may have been
somewhat more disparate during the first part of the twentieth century. But, economic
factors aside, even the prestige rankings of occupational titles are greater for workers
with higher levels of schooling (Duncan 1961). In short, the positive associations
between schooling and socioeconomic status generally go undisputed and can, indeed, be
observed in different units of analysis.
Although this association between schooling and socioeconomic status is widely
observed in a variety of contexts, considerable disagreement still exists when it comes to
the precise causal nature of this association. In this paper, we seek to clarify some of
the substantive differences among these theoretical disagreements. Specifically, we
investigate the effects of different measures of schooling on productivity and provide
systematic evidence to empirically draw distinctions between the three different
perspectives.
Given this objective, we organize the theoretical perspectives into three basic views:
(1) the technical-functional view; (2) the market-signal view; and (3) the credentialism
view. In the following, we summarize these three perspectives and derive testable
hypotheses which seek to disentangle their substantive differences. We then present our
2

empirical results regarding these hypotheses and discuss their implications.
II. Theoretical Background
The Technical-Functional View
According to the technical-functional view (Collins 1971), education directly
augments economic productivity, not to mention the potential of workers; workers with
more education are inclined to be more productive on account of their schooling
experiences. This view recognizes that while there are also other sources of worker
productivity, education is very important in providing workers with the crucial
components of the training and skills required for competency in more complex jobs.
As noted by Collins (1971, p. 1004) in his discussion of the assumptions of the
technical-functional view, “…formal education provides the training, either in specific
skills or in general capacities, necessary for more highly skilled jobs.”
More specifically, based on this theory, education improves an individual’s
productivity in several ways. First, education increases a person’s cognitive skills, such
as in mathematics and writing. Second, education normally provides training in work
skills by increasing one’s familiarity and facility with the technology involved in
production, such as that with machines, materials, computers or technical instruments.
Third, education can increase an individual’s productivity by conditioning important
social skills, like the ability to communicate, to work with others and to be reliable and
disciplined.
According to Collins (1971, p. 1004), the technical-functional view can be
interpreted as being consistent with the general functional theory of social stratification as
discussed by Davis and Moore (1945). In brief, this functional theory states that
education provides substantial components of the greater skills and training that are
required for the competent performance of more complex jobs. In order to motivate
people to endure the various costs and bother of completing additional schooling and
training, jobs which are more complex and more important (or at least their higher
demand in the economy) seemingly offer greater socioeconomic rewards. Given this,
higher rewards for more complex jobs have now become accepted as legitimate and
necessary.
3
An economic version of the technical-functional view is the human capital theory
(Becker 1975; Rubinson and Browne 1994), and the assumptions discussed above are
generally applicable here, as well. The major additional theoretical elements in the
human capital theory, as typically espoused by economists, are the general presumptions
that labor markets are highly competitive in the same way that product markets are and
that differences in workers’ productivities (which reflect their varying amounts and
stocks of human capital) are the driving forces underlying differences in wages (Sorensen
and Kalleberg 1981). Common to both the sociological technical-functional view and
the economists’ human capital theory, however, is the fundamental idea that education
directly augments the individual’s productive capacities; education, in other words,
enhances productive human capital.
One important implication of this concept is that a prima facie general solution to
the problem of poverty and inequality exists, and that is that increases in the education of
the poor and of the working-class will correspondingly bring about increases in their
incomes (Aaron 1978, pp. 70-71; Bluestone 1977, p. 337; Schiller 1984, p. 117; Sorensen
and Kalleberg 1981, p. 69). To state this in a more general way, and as discussed by
Becker (1975, p. 86), a reduction in the inequality in the distribution of schooling will
lessen the degree of inequality in the distribution of wages.
The Market-Signal View
According to the market-signal view, education certifies which people have greater
ability and trainability but, in what may seem paradoxical, schooling does not
significantly reinforce those traits in any direct way. The main value of education per se
is to serve as a signal in a labor market where information about a person’s abilities is
highly imperfect. Education is typically correlated with a person’s productivity and thus
with his or her socioeconomic attainment, but as a rule, education per se does not directly
enhance the economic productivity of a firm (Thurow 1975).
A major assumption in the market-signal view--which clearly differentiates it from
the technical-functional view--is that most work skills are learned on the job and in the
workplace rather than in school. That is, students do not learn very much in school that
actually enhances their economic performance. Actual work skills are said to be too far
4
removed from the activities that come with schooling. Instead, work skills are
developed through job experience and the on-the-job training that is informally provided
by senior workers (Sorensen and Kalleberg 1981; Thurow 1975).
However, education is still valued by employers because it serves as a valid signal
or certification of the extent to which an individual has discipline, trainability and a
general capacity to learn. As noted by Thurow (1975, p. 88), these are all important
traits that employers value in workers because of the salient role of on-the-job training in
the development of work skills. Thus, an individual’s education is a market-signal that
provides strong prima facie evidence to an employer that s/he can readily be trained to
become a more productive worker (Spence 1981).
Simply put, in accordance with the market-signal view, education is associated with
productivity, but it does not directly cause it.1 The association arises because people with
more education tend to have more of those traits that make a person economically
productive--discipline, trainability and ability--but those traits are not significantly
enhanced by education. Thus, the bivariate association between education and
economic productivity is said to be spurious: their association stems from a common
cause (i.e., the individual’s discipline, trainability and other productive traits).
The market-signal view, for the most part, also assumes that a worker’s productive
traits and capacities are often difficult to directly assess. This, therefore, reinforces the
reliance upon education as a market-signal or certifying device. This may simply reflect
the fact that information about workers’ abilities, trainability and potential productivity
are just too difficult to accurately ascertain, measure or observe. These problems of
assessment or evaluation may especially be pronounced in firms where the production
process is highly interdependent and is characterized by non-constant returns to scale, or
when senior workers are crucial in providing training to junior workers (Thurow 1975).
Another typical presupposition of the market-signal view is that the labor market
consists of a set of job slots that firms seek to fill with people who pose the least risk of
necessitating higher training costs--that is, with people who will quickly learn to do the 1 One strand of research in the human capital tradition which may implicitly recognize some role for the market-signal value of schooling is the economic research on “ability bias” in the estimation of the returns to schooling. Recent studies using sibling data, however, do not seem to yield estimates that are substantially less than those obtained using more conventional methods and data sets (Ashenfelter and Kreuger 1994; Ashenfelter and Zimmerman 1997).
5

job well (Thurow 1975). One important implication of this assumption, in the context
of the market-signal view, is that in determining the socioeconomic status of a job, a
person’s relative educational attainment is more important than his or her absolute
educational attainment because relative educational attainment actually determines his or
her place in the labor queue.2 In other words, although education is the primary
screening device that employers value most in that it most accurately certifies who
requires lower training costs, “it is a person’s relative position in the distribution of
education that counts”(Sorensen and Kalleberg 1981, p. 69).
Worth noting too is that, in contrast to the technical-functional view, the
market-signal view does not predict that the distribution of wages is much affected by
changes in the distribution of education (Sorensen and Kalleberg 1981, p. 69). With
regard to the problem of eliminating poverty wages in the distribution, Levin (1977, p.
168) observes that “in a way, we are describing a game of musical chairs” because the
fundamental problem of not having enough good-paying jobs is not substantially affected
by the distribution of education from the market-signal viewpoint. This means that
changing the distribution of education will likely change who gets the better jobs but the
poverty rate for the economy will not be significantly reduced because “there are still
fewer chairs than there are people” (Levin 1977, p. 168). In sum, the market-signal
view of education is not optimistic vis-à-vis the notion that education can do a lot to
reduce poverty or equalize the distribution of wages because the key assumption is that
education is only a certifying device that does not directly contribute to economic
productivity.
The Credentialism View
The credentialism view is related to the market-signal view in that both share the
assumption that what students learn in school does not actually improve their economic
performance in the workplace very much. While both approaches agree that education
does not directly augment one’s productivity (at least not significantly), the credentialism
view differs from the market-signal view since it goes one step further by claiming that
2 Sakamoto and Powers (1995) tested this hypothesis with regard to obtaining employment in the corporate sector of the Japanese economy.
6
education is not even correlated with productive abilities or capacities, let alone overall
productivity (Collins 1979).
According to the credentialist view, the reason for the association between education
and socioeconomic attainment is not due to any relationship with economic productivity;
on the contrary, it is a result of class conflict. This perspective is not unlike the theory
imbedded in discussions on cultural capital. As Farkas (1996) suggests, a key feature of
the conflict synthesis is the theory of cultural capital, which builds with its own status
culture controlling access to the rewards and privileges of group membership. In other
words, cultural capital, along with economic, social and symbolic capital, serves as a
power resource or a way for groups to either remain dominant or gain status. Also as
stated by Burris (1983, p.465), “Employers rely on educational credentials in hiring and
promoting not because of the technical skills these represent, but as a means of selecting
people who are socialized into the dominant status culture.” In general, the credentialist
view maintains that education serves to legitimize and reinforce inequality in the labor
market both in terms of authoritative relations and the distribution of wages (Bowles and
Gintis 1976). Jobs which pay higher wages to more educated workers do so not because
those workers are actually more productive but because their higher education has
established them as being a member of a morally superior status group that deserves to
not only be in power but also enjoy greater rewards (Berg 1970; Bourdieu 1977; Collins
1971, 1979).
An additional reason for the association between education and socioeconomic
attainment, according to the credentialist view, is that education serves the interests of
dominant social classes as far as the intergenerational transmission of inequality goes.
That is, education is a mechanism by which higher status groups can reinforce and pass
on some of their higher status to their offspring. Owing to inequalities with regard to
educational opportunities--needless to say, in favor of the wealthy and powerful--the
dominant social classes are able to ensure that their children are much more likely to
obtain a high level of educational attainment. The association between education and
socioeconomic rewards, therefore, helps to promote the intergenerational perpetuation of
inequality (Bowles and Gintis 1976).
7

III. Schooling, Economic Productivity and Units of Analysis
The distinctions among the aforementioned three perspectives could certainly be
discussed at greater length, but for the purposes here, we contend that the most critical
substantive difference among them is that they differ with respect to the predictions they
make about the relationship between schooling and productivity. To be more specific,
according to the technical-functional view, an increase in schooling should directly result
in greater productivity because education is deemed to represent human capital.
On the other hand, the credentialism view predicts that an increase in schooling does
not increase productivity because the educational system serves to perpetuate class
inequality and exploitation; the observed association between education and
socioeconomic status is simply symptomatic of the fundamental economic irrationality of
capitalism. The intermediate position here is represented by the market-signal view
which predicts that firms which hire workers with more schooling should indirectly
increase productivity because such workers have lower training costs and are more
disciplined (although, in contrast to the technical-functional view, these latter qualities do
not derive from their schooling per se).
Although quantitative sociological studies of productivity are rare (Galle et al. 1985;
Tomaskovic-Devey 1988; Walters and Rubinson 1983), there is no reason that they
cannot be a fruitful area of sociological inquiry, particularly when they involve such
important substantive issues as the understanding of the causal relationship(s) between
schooling and socioeconomic status. While one might argue that, for an analysis of
productivity and schooling, the individual is the most desirable unit of analysis (Rubinson
and Browne 1994, pp. 583-584), objectively-defined productivity statistics are not
available for a broad representative sample of workers.3 In the modern economy, whole
products are usually not produced separately by individuals. For this reason, only for a
limited number of jobs, e.g., in some sales occupations and some blue-collar jobs, can
output be directly measured in objective economic terms at the individual-level (Sorensen
1994, pp. 515-518). Therefore, if one insists (as apparently Robinson and Browne 1994
do) that productivity must be measured at the individual level, then a systematic
3 This absence is reflected, for example, in Petersen (1992) who used a worker’s wage as an indicator of his or her productivity.
8

sociological analysis of productivity is hardly possible.
We argue, however, that an aggregate unit of analysis is appropriate for the
investigation of our underlying theoretical questions. Each of the three theoretical
perspectives discussed above implies a corresponding aggregate-level relationship
between productivity and schooling. From the standpoint of the technical-functional
approach, workers who have more schooling should have developed more human capital.
At the level of the firm, productivity is greater (ceteris paribus) if its workers have a
higher average level of human capital. We believe that this aggregate relationship is
indeed the essential logic motivating the use of the term “human capital.” In any event,
the argument that an aggregate measure of human capital increases productivity
measured at some aggregate unit is well formulated in the literature in the field of
economics and represents some of the classic statements of human capital theory
(Griliches 1970; Jorgenson and Fraumeni 1995a; Schultz 1961b).
From the point of view of the market-signal approach, the theoretical basis of an
aggregate-level analysis is less well developed. We believe, however, that the essence
of this perspective is the assumption that the primary role of schooling is to certify rather
than directly augment the productivity of an individual; this assumption is fundamental
because it clearly differentiates the market-signal approach from the technical-functional
view.
According to the market-signal approach, employers value workers who are more
highly certified because in fact such workers, by and large, do tend to be more productive
and/or have lower training costs. However, because schooling does not directly
augment productivity, the total years of schooling per se is not the most appropriate
indicator of a person’s level of certification. Rather, greater relative educational
attainment is the relevant measure because, in contrast to the technical-functional view,
schooling per se is irrelevant to economic productivity; the value of the signal derives
from a person’s relative standing on the ladder of educational competitiveness because
his or her relative standing reveals his or her productive potential.4
Because schooling is a signal or certification of an individual’s productivity or
4 This type of competition has a tendency to develop a rat-race quality since the “growth in education will feed itself as more and more education is needed to secure the same relative position” (Sorensen and Kalleberg 1981, p.69).
9
trainability, the output of a firm should be greater (ceteris paribus) to the extent that its
workers have higher relative educational attainment (i.e., are more highly certified or are
providing a stronger signal) than do those of other firms. Thus, at the level of the firm,
the market-signal view does imply that a more highly educated workforce contributes to
increased productivity, but in contrast to the human capital approach, the appropriate
measure for the market-signal view is a higher level of relative educational attainment
rather than the mean number of years of schooling per se (although the latter measure is
often used in human capital studies of economic productivity).
As for the credentialism view, the essence of the concept of a credential (at least as
used in this literature) is that it helps sustain class inequality rather than economic
efficiency or productivity. In other words, the fundamental assumption here is that
schooling does not specifically relate to economic productivity; schooling is hypothesized
to be uncorrelated with productivity. The implication of this line of reasoning with
respect to the level of a firm is that the economic output of firms with more highly
educated workers is not necessarily greater than that of firms with less educated workers
(ceteris paribus). Because an individual worker is no more productive for having gone
to school longer, it seems reasonable to infer that firms are no more productive (ceteris
paribus) for having hired a more educated workforce. They may be more accepting of
the social and economic inequality of the firm, but they are not regarded as being more
economically productive.
In sum, these three theoretical perspectives give rise to different predictions
regarding the relationship between firm-level productivity and the schooling
characteristics of the workforce. And, these different predictions can be assessed with
empirical data. Nonetheless, the interpretations derived from these theories are not
necessarily self-contradictory or mutually exclusive. Recent studies have also drawn
some different conclusions on account of the differences in the data or methodology.
For example, Chang et al. (1996) emphasize the value of credentials and argue that it is
already conventional wisdom in Taiwan that an individual with a higher level of
educational attainment will enjoy increased opportunities for greater socioeconomic
achievement. Yu and Chu (1998) find, however, that the performance of graduates from
the most prestigious university (i.e., National Taiwan University) in terms of salary and
10
employment is not significantly superior to that of graduates from other colleges in
Taiwan. Based on their thorough data analyses, Tsay and Lin (2000) underscore the
importance of a firm’s first position rather than other factors. Liu and Li (2001)
conclude that a worker’s credentials are useful for entering the labor market but have
little effect on his or her future career development. Because of this, it is important and
interesting to carry out some sort of quantitative social accounting of the relative strength
of each theory. In the following, we discuss this issue in greater detail.
IV. Operationalizing Hypotheses about Schooling and Productivity
There are no publicly available data sets that contain data on the productivity of
particular firms along with information on the schooling of their workforce. In lieu of
firm-level data, we therefore use data on industries which represent groups of firms that
produce similar products. Our data consist of two-digit manufacturing industries for
which there is an established tradition of economic statistics and data collection on
productivity.5
We use an objectively-defined measure of productivity, namely the dollar value of
the output produced per employee-hour in the two-digit manufacturing industries. In
order to provide a more methodologically conservative test of our theoretical concerns,
we restrict our study to manufacturing industries because productivity data are more
likely to be valid and reliable for the manufacturing sector than for others, such as
services where the output is sometimes less directly measured or quantifiable.6
Restricting the analysis of productivity to one sector also reduces the number of
complications that might arise from the high degree of technological heterogeneity across
sectors. In our analysis, we estimate the net effects of measures of educational
attainment on labor productivity using the two-digit manufacturing industry as the unit of
analysis. To do so, our model is developed from the Cobb-Douglas production function
which, in various formulations, is well known and widely used in economics (and is also
used by Walters and Rubinson 1983):
5 We do agree that firm-level data would be very useful to have, and we are in the process of collecting such data (this research proposal has been approved by the NSC). 6 Galle et al. (1985, p.24) and Tomaskovic-Devey (1988, p.147) restricted their analyses to the manufacturing sector for the same reason.
11
βα LAKQ = (1)
where A is a constant reflecting the scaling of the measures; Q is the quantity produced
during the given time period in which K units of capital are used and L units of labor are
employed; α and β are parameters to be estimated. In this simple model, the L
units of labor are undifferentiated in terms of quality or human capital.
A human capital version of Equation (1)--that is, a formulation that would be more
explicitly consistent with the technical-functional view--would in some fashion include
measures of the educational attainment of workers involved in the production process.
For example, Equation (1) could be extended by including the mean or median years of
schooling completed by workers (Galle et al. 1985; Kendrick and Grossman 1980) or by
including some composite index or other indicators of the distribution of years of
schooling completed by workers (Griliches 1970; Jorgenson and Griliches 1995; Walters
and Rubinson 1983). Because the human capital model assumes that workers who have
completed more schooling are accordingly more productive, the inclusion of the
measures of the extent of schooling completed by workers in Equation (1) operationalizes
the hypothesis that states that increased educational attainment should increase
productivity.
At the same time, Equation (1) can also be extended to test for the predictions of the
market-signal view of education. According to this explanation of the role of education
in the labor market, industries are more productive to the extent that they are able to
attract workers who require lower training costs and/or have greater ability (e.g., Thurow
1975, p.121). Because the market-signal view assumes that education per se does not
significantly increase productivity but is only correlated with workers’ trainability which,
in turn, lowers training costs, the mean level of schooling per se among workers does not
significantly increase productivity.7 Instead, as noted by Thurow (1975, p.95), the
market-signal view implies that the labor market clears or reaches equilibrium by
adjusting hiring standards rather than wage rates; thus, we may predict that productivity
will be greater in industries in which workers, generally speaking, have higher relative
7 Thus, according to the market-signal view of education, aggregate economic growth is not affected by increases in the total stock of educational human capital that is embodied in workers, but such an accumulation has been the subject of investigation among economists working within the theoretical framework of the human capital view (Denison 1962; Jorgenson 1984; Jorgenson and Fraumeni 1995).
12
educational attainment, as discussed earlier.
At the level of the individual worker, let s refer to his or her years of schooling and r
to the percentile ranking associated with that number of years of schooling (where the
percentiles are based on the distribution of years of schooling for all workers in the labor
force). At the level of the industry, let S refer to the mean years of schooling completed
by workers in a particular industry and R to the mean of the percentiles associated with
the years of schooling completed by the workers employed in a particular industry.
Thus, industries with a larger value of S are those in which the workers have, on average,
spent more time in school, while industries with a larger value of R are those in which the
workers have, on average, achieved a relatively higher level of educational attainment.
While s and r can be expected to be highly correlated, there is nonetheless a crucial
difference between S and R. Across the labor force as a whole, the mean of S increases
over time as the Taiwanese education system expands and the average levels of
educational attainment increase. By contrast, the mean of R across the labor force as a
whole cannot increase because, by construction, the mean for a distribution of percentiles
is always approximately 50%. This latter feature is consistent with the fundamental
assumption of the market-signal view which is that education serves to certify which
people have greater ability and trainability and that schooling per se does not directly
augment those traits significantly in ways that are pertinent to economic productivity.
S and R may be both included to Equation (1) to derive a model that can be
estimated to test the relative predictive power of these theories of the role of education in
the labor market: rs RSLAKQ δδβα= (2)
Once Equation (2) is estimated with actual data, the two empirical results that would
most strongly support the technical-functional (i.e., human capital) view of education
would be: (1) reject ; and (2) fail to reject . This set of results
would underscore the importance of the absolute amount of education obtained by
workers in influencing productivity and would, consequently, be consistent with the
interpretation of education as representing stocks of human capital. Such results would
also be contrary to the expectation of the market signal view which places a great deal of
emphasis on relative educational attainment as an indicator of one’s potential
0:0 ≤sH δ 0:0 ≤rH δ
13
productivity.
Empirical results that would support the market signal view would be: (1) fail to
reject ; and (2) reject . This set of results would indicate that
the mean number of years of schooling per se has no net effect on productivity---that
schooling does not really constitute productive human capital. However, education
would still be important in explaining inter-industry variations in productivity because
the finding that implies that productivity is greater in those industries which
employ workers who have a relatively higher educational attainment. In other words,
the empirical results that would support the market signal view are exactly opposite those
that would support the technical-functional view. Nonetheless, the human capital and
market signal views are not necessarily mutually exclusive. It might be argued that if
the empirical results rejected both and , then both theories are
supported, to some degree. The credentialism view can also be evaluated on the basis of
the empirical results obtained from the estimations from Equation (2). Specifically, the
credentialism view would be supported if the results indicated that we should fail to reject
both and simultaneously. This result would support the
credentialism view which assumes that productivity is uncorrelated with education in
terms of either years completed or percentile rank. In this case, education is neither
productive human capital nor an accurate market signal about a worker’s productive
capacities; educational attainment is simply irrelevant to economic productivity.
0:0 ≤sH δ
δ
0:0 ≤sH δ
0:0 ≤rH δ
0:0 ≤sH δ
0
0>r
0:0 ≤rH δ
:0H ≤rδ
Sorensen’s Educational Attainment Score (EDR)
As a further test of these hypotheses on the relationship between education and
productivity, we also operationalize an additional version of Equation (2) in which
Sorensen’s (1979, p. 371) educational attainment score (edr) is used instead of r to
indicate a worker's relative educational attainment. edr is a measure of relative
educational attainment that Sorensen (1979) derives from his formal analysis of the effect
of schooling on status attainment in the context of the job competition model. Because
the market-signal view of education is often based on the job competition model of the
labor market, we also estimate regressions based on edr in order to ascertain whether our
14

conclusions about the predictive power of the market-signal view are affected by the use
of a potentially more appropriate metric.8
At the individual level, Sorensen’s educational attainment score, edr, is simply a
nonlinear transformation of the percentile ranking of one’s years of schooling completed,
r. In particular, at the individual level:
edr = 100*[-ln(1- r/100)] (3)
Sorensen’s (1979) essential rationale for this function is that the competitive advantage
afforded by an increased percentile ranking is not uniformly distributed across all levels
of percentiles. As stated by Sorensen (1979, p. 371), “If the ordinality of educational
attainment measured in years of schooling was the only concern, percentiles might seem
an appropriate metric....However, using percentiles implies that the underlying
variable--competitive advantage--is uniformly distributed, which seems an unwarranted
assumption.”
As we mentioned earlier, the mean of r at the level of the industry is R. Also at the
level of the industry, let EDR refer to the mean of edr. Note that edr is computed for
each individual worker, and then the mean of edr is computed for each industry-time
observation. Therefore, the natural logarithmic transformation of R would not equal
EDR. We estimate our regressions using EDR in lieu of R in order to test the
market-signal view against the technical-functional view. Although operationalizing
Sorensen’s (1979) particular model is not our research objective (and, in contrast to that
paper, we do not seek to predict socioeconomic attainment for all individual workers), we
do use Sorensen’s (1979) metric in some of our analyses so as to provide further evidence
regarding the robustness of our conclusions about the relationship between education and
economic productivity.
In light of our discussion above, the predictions of the net effects of our schooling
measures, which are derived from the three theoretical perspectives on labor productivity,
are summarized in Table 1, and the empirical findings can be tested by one-tailed t-tests.
For human capital theory, the net effect of years of schooling on productivity is expected
to be significantly positive (via a one-tailed t-test), while that of rank in educational
8 Sorensen (1979) used the term “vacancy competition,” but his model is actually very similar to Thurow’s (1975) “job competition” model especially with regard to our primary theoretical concern which is the nature of the relationship between education and socioeconomic attainment.
15

attainment is not expected to be significant; as for the screening hypothesis, the expected
effects of the schooling measures are just the opposite of those of human capital theory;
for credentialism, none of our schooling measures are expected to be significant.
Table 1: Net Effects on Labor Productivity: Predictions from Three Theoretical Perspectives
Schooling Measures
Theory Years of Schooling (S)
Percentile Ranking of Schooling (R)
Sorensen’s Educational Attainment Score (EDR)
Human Capital Theory Significantly positive Not significant Not significant
Screening Hypothesis Not significant Significantly positive Significantly positive
Credentialism Not significant Not significant Not significant
It should be noted that these expectations are theoretical: the human capital theory
and the market-signal view are not necessarily mutually exclusive. General discussions
of the role of education in the labor market also sometimes lump together the
market-signal view and the credentialism view (Boylan 1993; Meyer 1977). It might be
suggested that, to some degree and in some ways, all three of these theories are
true. That is, it could be argued that these theories should be integrated into a broader,
more comprehensive theory which stipulates that each one plays some role in explaining
labor market outcomes for different types of workers or for the same workers at different
points in their work careers. We would definitely welcome the delineation of such a
theory, and we believe that our efforts here represent the first contribution ever made in
this direction.
V. Data and Methods
The 1979, 82, 85, 89, 92, 95 and 98 Taiwan Industrial Production Statistics Yearly
Report are used to obtain the indexes of industrial productivity (output per
employee-hour). Because these indexes are calculated from the net value of different
base years, we apply the 1991 Taiwan Wholesale Price Index to adjust these statistics into
raw New Taiwan dollars. In addition, we use The Report on Taiwan Factory Census to
16

get the annual capital input for each industry. The Monthly Bulletin of Earnings and
Productivity Statistics and the Monthly Statistics of the Republic of China provide
monthly information on employees and their average working hours by industry. In
general, data on annual Taiwanese labor productivity for the past 20 years are available
for 2-digit industries which were coded by the Taiwan Standard Industry Classification
Codes (the list of Taiwan manufacturing industrial categories is shown in Appendix 1).
The individual-level data sets used are the Taiwan Manpower Utilization Survey for the 7
years stated above. These surveys contain information we need for this research:
workers’ demographic characteristics, hours worked, educational level, industry,
occupation, establishment size, firm tenure, and so on.
In order to transform Equation (2) into an additive linear model that can be
estimated by the least squares, we take the natural logarithm of both sides of the equation.
In our particular application, we have annual productivity data for each of the 20 different
manufacturing industries (i.e., j = 1, 2, 3, ..., 20) for each of the 7 years (which are
indicated by the subscript t). The dependent variable for the statistical model is lnQjt
which refers to the log of the 1991 Taiwanese dollar value of output per employee-hour
in the jth industry in the tth year. Because we use data pertaining to productivity per
employee-hour, we do not need to control for the number of hours worked in the industry.
To control for variations in capital utilization across industries and across time, we are
able to include the value of annual capital expenditures per worker (in constant 1991
Taiwanese dollars) in the jth industry in the tth year in the statistical model. We also
include the square of this variable.
Because our data cover a 20- year period, it should be kept in mind that the net
effect of education on productivity might change over time due to economic development.
Although the issue related to the association between educational expansion and
economic growth has long been of interest to economists, no general consensus has been
reached. Rubinson and Browne (1994) argue that education may simply allocate people
within a relatively fixed distribution of jobs and that since education per se may not
create more productive jobs, it does not necessarily have any effect on economic growth.
Hwang’s (1998) empirical results, in fact, indicate that educational expansion in Taiwan
did not improve economic development. On the contrary, educational expansion was
17

the result of economic development (also see the review by Liu and Li 2001). In order
to control for period effects, we include two dummy variables: one for the 1980’s and the
other for the 1990’s (so that 1979 serves as the reference time period). The rationale for
these dummy variables is to control for period changes in the business environment that
affect industrial productivity in Taiwan.9
We estimate a fixed-effects regression model of labor productivity observed in these
manufacturing industries across this time period. We use the least-squares dummy
variable formulation of this model in which J - 1 dummy variables are included to
indicate the J units (Greene 2000, pp. 560-562) which in our application refers to the 20
industries. The rationale for this approach is that each industry may have unique aspects
of technology that may influence its productivity but which are not fully reflected in the
value of annual capital expenditures per worker. The fixed-effects specification also
eliminates the problem of auto-correlated error terms across the years for each of the
industries.
We estimate the models by the weighted least squares in order to correct for
heteroscedasticity which was evident from residual plots. The weight that we use is the
square root of the sample size for the jth industry in the tth year. The use of this weight
is common in the least-squares estimation of regression models for which the data are
aggregate statistics based on varying sample sizes (Johnston 1984, pp. 293-296). The
residuals obtained from our weighted least squares estimation appear to be satisfactorily
homoscedastic.
VI. Empirical Results
Descriptive Statistics
The descriptive statistics can be visually appreciated in Table 2. Because we have 7
years of data for 20 industries, the total sample size is 140. Across these 140
observations, the mean of the output per employee-hour is 486.39 New Taiwan dollars (in
constant 1991 New Taiwan dollars), while the mean of the log of this variable is 5.39.
9 Period effects may derive from changes in Taiwan’s infrastructure, taxes and industrial regulations. Our research design, however, is a simple version of the screening model because it assumes that the signal is constant across the workers’ career, but this issue is partly addressed by breaking down the workers by cohort.
18

The mean of the annual capital expenditures per worker is 14,925.53 New Taiwan dollars
(in constant 1991 New Taiwan dollars), while the mean of the log of this variable is 9.01.
Table 2: Descriptive Statistics (N = 140) Mean S.D. Max. Min. Hourly Output per Worker 486.39 953.61 5745.29 49.75 Log of Hourly per Worker 5.39 1.04 8.66 3.91 Capital Expenditures per Worker 14925.53 21783.90 126054.23 658.30 Log of Cap. Expend. per Worker 9.01 1.04 11.75 6.49 Log of Cap. Expend. per Worker Squared 82.29 19.28 137.94 42.12 Mean Years of Firm Tenure 5.85 2.57 20.01 2.62 Log of Mean Years of Firm Tenure 1.70 0.36 3.00 0.96 Mean Years of Schooling 9.54 1.36 13.14 6.67 Log of Mean Years of Schooling 2.25 0.14 2.58 1.90 Rank of Schooling by Total Labor Force 40.73 11.22 93.30 24.25 Log of Rank of Sch. by Total Labor Force 3.67 0.26 4.54 3.19 Rank of Schooling by 5-year Age Cohort 38.10 11.99 86.00 21.60 Log of Rank of Sch. by 5-year Age Cohort 3.60 0.29 4.45 3.07 Rank of Schooling by Gender 40.12 10.92 90.40 22.44 Log of Rank of Schooling by Gender 3.66 0.26 4.50 3.11 Rank of Schooling by Age and Gender 36.89 11.50 84.00 20.14 Log of Rank of Schooling by Age and Gender 3.57 0.29 4.43 3.00 EDR of Schooling by Total Labor Force 77.51 27.70 170.31 38.40 Log of EDR of Sch. by Total Labor Force 4.29 0.34 2.51 3.65 EDR of Schooling by 5-year Age Cohort 71.74 26.34 175.66 35.00 Log of EDR of Sch. by 5-year Age Cohort 4.21 0.35 5.17 3.56 EDR of Schooling by Gender 75.63 25.97 135.87 35.66 Log of EDR of Schooling by Gender 4.27 0.33 4.91 3.57 EDR of Schooling by Age and Gender 68.91 24.38 148.19 33.02 Log of EDR of Schooling by Age and Gender 4.17 0.34 5.00 3.50 Dummy Variable for 1982, 1985 and 1989 0.42 0.49 1.00 0.00 Dummy Variable for 1992, 1995 and 1998 0.42 0.49 1.00 0.00 Note:
Descriptive statistics are calculated across 20 manufacturing industries observed in 7 different years. Hourly output per worker refers to the 1991 New Taiwan dollar value. Capital expenditure per worker refers to new capital expenditures per worker in 1991 New Taiwan dollars.
Regarding the schooling variables, the mean of S across the 140 observations is 9.54.
The standard deviation of the mean years of schooling is 1.36, and there is a fairly
substantial range with a minimum value of 6.67 and a maximum of 13.14. As defined
19
earlier, R is referred to as the “rank of schooling by total labor force.” Its mean across
the 140 observations is 40.73 (which is less than 50, the approximate value of the mean
for the distribution of percentiles across all workers in the labor force in a given year).
The minimum value of R is 24.25, while its maximum is 93.30. Note that these
descriptive statistics are computed on the basis of percentiles that are derived from the
distribution of schooling across all workers in the labor force in a given year.
The market-signal view does not clearly specify the relevant group over which
relative educational attainment is to be gauged--that is, the relevant distribution to which
the percentiles pertain. The obvious baseline distribution is the entire labor force, and
we have just reported the descriptive results for R when it is based on that overall group.
Additional possibilities are feasible, however, and we also consider these in our analyses
in order to assess the robustness of our findings and conclusions.
Also shown in Table 2 is the “rank of schooling by 5-year age cohorts.” In this
case, r refers to the percentile associated with an individual’s years of schooling based on
the distribution derived from all workers in the labor force who are in the same 5-year
age cohort. R is then just the mean of r defined in this way for each worker in the
particular industry (and for the particular year). A basic argument for this approach is
that employers do not compare educational attainment across age cohorts due to changes
in educational standards and the general increase in educational opportunities across time
in Taiwan.10 Across the 140 observations, the mean of “rank of schooling by 5-year age
cohorts” is 38.10. This mean is similar to, albeit slightly smaller than, the mean of the
“rank of schooling by total labor force.”
In the next stage, we define a relative educational attainment variable in which the
distribution is separated by gender. In Table 2, this variable is “rank of schooling by
gender.” For this variable, the percentiles pertain to the distribution of years of
schooling completed by all workers in the labor force who are of the same gender (either
male or female). We investigate this variable on account of the possibility that
employers may compare the relative educational attainment of workers separately by
gender (due perhaps to gender differences in curricula, experiences or performances).
As shown in Table 2, the mean of “rank of schooling by gender” is 40.12, and its
10 Similarly, in calculating his edr scores, Sorensen (1979, p.371) used 3-year and 5-year age cohorts.
20
standard deviation is 10.92.
“Rank of schooling by gender and age” is based on the most specific definition of
the pertinent distribution to use in gauging relative educational attainment. In this case,
the percentile refers to a person’s ranking in the distribution of completed years of
schooling among all workers in the labor market who are of the same gender and are in
the same 5-year age cohort. This way of calculating r offers the greatest predictive
power if employers rank workers’ educational attainment separately by age and gender.
Each of these different ways of calculating r --by the total labor force, by age
cohorts, by gender and by gender and age--is also used in calculating a corresponding edr
score based on Equation 3. These variables are shown in Table 2 as “EDR of schooling
by total labor force,” “EDR of schooling by 5-year age cohort,” “EDR of schooling by
gender” and “EDR of schooling by gender and age.” The descriptive statistics of these
are also shown in Table 2.
In addition, Pearson correlation coefficients for several of these variables are shown
in Appendix 2. Our dependent variable (i.e., the logged hourly output) has a positive
correlation with the logged mean years of schooling as well as with the different types of
logged mean schooling percentile ranking. They show that there are strong positive
bivariate relationships among productivity and worker’s educational attainment and their
relative educational ranking in the labor market. To estimate the net effects of years of
schooling and schooling percentile ranking on productivity, multivariate analysis is
required.
Regression Results
The first set of regression results are shown in Table 3. Model 1 in Table 3
includes the control variables--capital expenditures per worker, mean years of firm tenure
and dummy variables to indicate time period--plus mean years of schooling.11 Because
the dependent variable as well as the continuous independent variables are all logged, the
coefficients may be interpreted as elasticities.
11 We do not report the estimated fixed effects for the 20 industries, but they are available from the author upon request.
21

Table 3: Weighted Least-Squares Estimates for Fixed-Effect Models of Labor Productivity in Taiwanese Manufacturing Industries, 1979-1998
Variable
Model 1
Model 2
Model 3
Log of Capital Expend. per Worker -1.139 ** -1.285 ** -1.147 **
(0.440) (0.451) (0.440)
Log of Capital Expend. per Worker Squared 0.067 ** 0.077 ** 0.068 **
(0.023) (0.024) (0.023)
Log of Mean Years of Firm Tenure 0.005 0.104 0.035
(0.174) (0.183) (0.179)
Dummy Variable for 1982,1985 and 1989 0.207 ** 0.330 ** 0.214 **
(0.083) (0.075) (0.084)
Dummy Variable for 1992, 1995 and 1998 0.513 ** 0.785 ** 0.529 **
(0.134) (0.105) (0.136)
Log of Mean Years of Schooling 1.755 ** 1.561 **
(0.492) [0.294]
(0.551) [0.262]
Log of Rank of Sch. by Total Labor Force 0.463 * 0.178
(0.208) [0.136]
(0.226) [0.052]
R-square .902 .896 .903 Adjusted R-square .881 .873 .880 Note: 1. Dependent variable id log of hourly output per worker. 2. Standard errors are shown in parentheses; the standardized coefficients (i.e., beta) of
education-related variables are shown in brackets. 3. The star * indicates p < .05; ** indicates p <.01; the significance level of our key variables is
based on one-tailed tests. 4. All models are fixed-effect models. Due to space limitations, we do not report the
parameter estimates and standard errors for the 19 industry dummy variables in each model. The complete information is available from the author upon request.
In Model 1, the coefficient for the mean years of schooling is substantively large as
well as statistically significant at the .01 level. The coefficient of 1.76 indicates that a
1% increase in the mean years of schooling results in a net increase of 1.76% in labor
productivity. This result is inconsistent with the credentialism view which contends that
22

schooling has no effect on economic productivity.
Model 2 includes the control variables plus R, the percentile rank of schooling, in
this case by the total labor force. In Model 2 the coefficient for R is .46 and is
statistically significant at the .05 level. This coefficient indicates that a 1% increase in
R increases labor productivity by .46%. This net effect is substantial, but it is
considerably less than the estimated net effect of the mean years of schooling in Model 1.
Although the mean years of schooling and the percentile rank of schooling are not
calibrated in terms of the same units, their coefficients in these models can, nonetheless,
be directly compared because they refer to elasticities which are independent of the units
of measurement. We also report the standardized coefficients (i.e., beta) of these
different schooling measures to clarify their relative importance.
In Model 3 in Table 3, both S, the mean years of schooling, and R, the percentile
rank of schooling, are included in the specifications (along with the control variables).
The estimates of this regression clearly indicate that the mean years of schooling has a
more important effect on labor productivity than does the percentile rank of schooling.
In Model 3, the coefficient for R is substantially reduced and is not statistically
significant at any conventional level. By contrast, the coefficient for the mean years of
schooling retains both its substantive as well as statistical significance. As shown in
Table 3, this coefficient is 1.56, indicative that a 1% increase in the mean years of
schooling results in an increase of 1.56% in labor productivity net of the effects of the
other variables in the model. This coefficient is statistically significant at the .01 level.
In Table 4, we report the results for other similar regression models that we estimate
using percentiles which are based on other definitions of the relevant reference
distribution. Model 4 in Table 4 includes R when it is based on 5-year age cohorts. In
Model 5, R is computed separately by gender. In Model 6, both gender and the 5-year
age cohorts are used to define the relevant reference distribution to which R pertains.
The empirical results for Model 4, Model 5 and Model 6 in Table 4 are all consistent
with and, in fact, mirror the general conclusion that we mentioned above with regard to
Model 3 in Table 3. That is, the mean years of schooling retains both its substantive as
well as statistical significance regardless of which of these other ways is used to calculate
R. In each of the three models, the mean years of schooling is statistically significant at
23

the .01 level, and the estimated coefficient is 1.61 or greater. By contrast, R is not
statistically significant at any conventional level in Model 4, Model 5 or Model 6.
Table 4: Weighted Least-Squares Estimates for Fixed-Effect Models of Labor Productivity in Taiwanese Manufacturing Industries, 1979-1998
Variable
Model 4
Model 5
Model 6
Log of Mean Years of Schooling 1.649 ** 1.608 ** 1.775 **
(0.598) [0.277]
(0.543) [0.270]
(0.537) [0.298]
Log of Rank of Sch. by 5-year Age Cohort 0.105
(0.335) [0.035]
Log of Rank of Schooling by Gender 0.139
(0.214) [0.041]
Log of Rank of Schooling by Age and Gender -0.021
(0.213) [-0.007]
R-square .902 .902 .902 Adjusted R-square .880 .880 .880
Note: 1. The dependent variable is the log of the hourly output per worker. 2. Standard errors are shown in parentheses; the standardized coefficients (i.e., beta) of
education-related variables are shown in brackets. 3. The star * indicates p < .05; ** indicates p <.01; the significance level of our key variables is
based on one-tailed tests. 4. All models also include (as do previous models shown in Table 3) controls for capital
expenditures per worker, the mean number of years of firm tenure, two dummy variables for the time period and the 19 parameters of the industry dummy variables for fixed effects. These estimates are available from the author upon request.
In Table 5, we present the results for the estimation of the regression models in
which Sorensen’s (1979) EDR scores are used instead of R.
In Model 7, EDR is based on the total labor force, as a whole, and is included in the
equation without the mean years of schooling (although the other control variables that
are used in the previous models are also included as control variables in all of the models
shown in Table 5). The estimated coefficient for EDR in Model 7 is fairly substantial
24
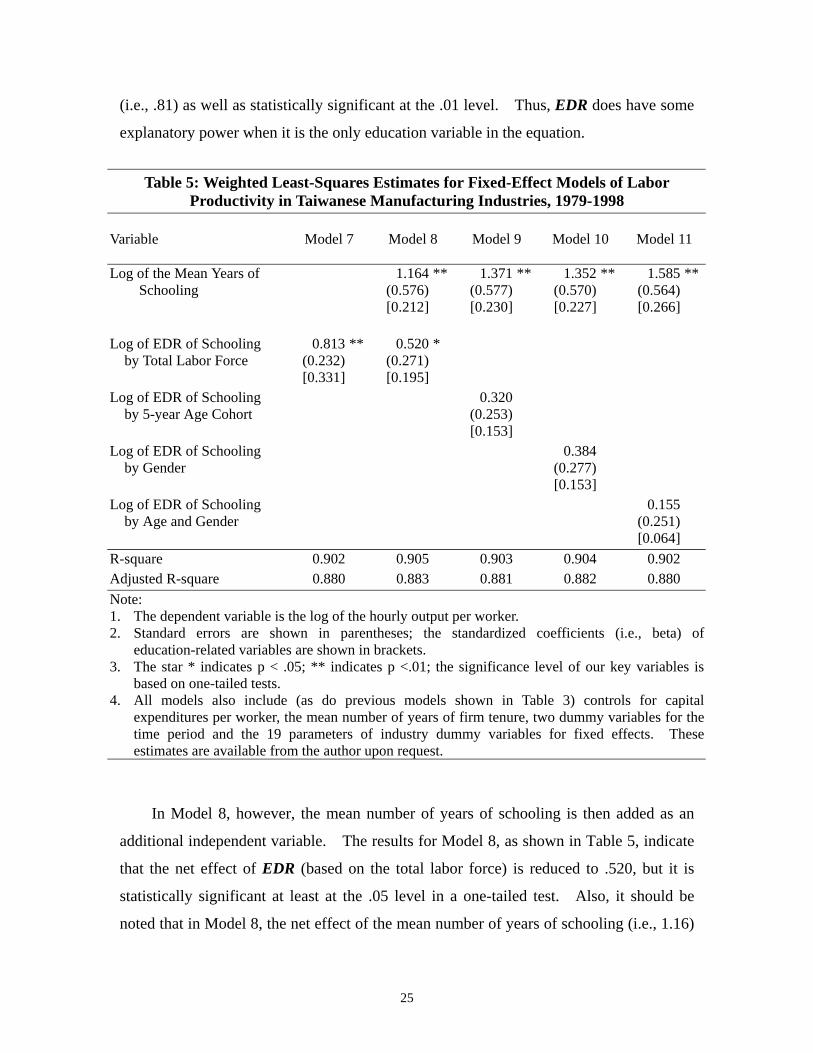
(i.e., .81) as well as statistically significant at the .01 level. Thus, EDR does have some
explanatory power when it is the only education variable in the equation.
Table 5: Weighted Least-Squares Estimates for Fixed-Effect Models of Labor
Productivity in Taiwanese Manufacturing Industries, 1979-1998 Variable
Model 7
Model 8
Model 9
Model 10
Model 11
Log of the Mean Years of Schooling
1.164 (0.576) [0.212]
** 1.371 (0.577) [0.230]
** 1.352 (0.570) [0.227]
** 1.585 (0.564) [0.266]
**
Log of EDR of Schooling by Total Labor Force
0.813 (0.232)
** 0.520 (0.271)
*
[0.331] [0.195] Log of EDR of Schooling by 5-year Age Cohort
0.320 (0.253)
[0.153] Log of EDR of Schooling by Gender
0.384 (0.277)
[0.153] Log of EDR of Schooling by Age and Gender
0.155 (0.251)
[0.064] R-square 0.902 0.905 0.903 0.904 0.902 Adjusted R-square 0.880 0.883 0.881 0.882 0.880 Note: 1. The dependent variable is the log of the hourly output per worker. 2. Standard errors are shown in parentheses; the standardized coefficients (i.e., beta) of
education-related variables are shown in brackets. 3. The star * indicates p < .05; ** indicates p <.01; the significance level of our key variables is
based on one-tailed tests. 4. All models also include (as do previous models shown in Table 3) controls for capital
expenditures per worker, the mean number of years of firm tenure, two dummy variables for the time period and the 19 parameters of industry dummy variables for fixed effects. These estimates are available from the author upon request.
In Model 8, however, the mean number of years of schooling is then added as an
additional independent variable. The results for Model 8, as shown in Table 5, indicate
that the net effect of EDR (based on the total labor force) is reduced to .520, but it is
statistically significant at least at the .05 level in a one-tailed test. Also, it should be
noted that in Model 8, the net effect of the mean number of years of schooling (i.e., 1.16)
25

is still statistically significant. Thus, the results for Model 8 indicate that both the mean
number of years of schooling and EDR (based on the total labor force) have net effects
on labor productivity and that the former is larger than the latter.12
Table 5 also shows the results for Models 9 through 11. In Model 9, EDR is
constructed on the basis of the 5-year age cohorts. In Model 10, EDR is constructed
separately by gender. In Model 11, EDR is based on both the 5-year age cohorts as well
as on gender. As shown in Table 5, these EDR variables are not statistically significant
at the .05 level in one-tailed tests in any of these models. In sum, the only result where
an EDR variable has a net effect that is statistically significant at the .05 level (in a
one-tailed test) is in Model 8 where EDR is based on the total labor force, as a whole.
Indeed, in all of our analyses, this is the only result where a variable derived from the
ordinal rank of educational attainment is found to be statistically significant net of the
mean number of years of schooling.
Additionally, our data cover 20 years and consist of 20 manufacturing industries as
mentioned earlier. It is also important to determine if the net effect of schooling on
productivity has changed over time or has differed in specific industrial groups. We
therefore replicate the models shown in Tables 3 to 5 by dividing our data into two parts
by time (T1 refers to 1979, 1982, 1985 and 1989; T2 refers to 1992, 1995 and 1998).
Similarly, two groups (G1 refers to industries 1, 2, 8, 9, 10, 13, 14, 17, 18 and 19 which
have higher labor hourly output; G2 refers to the other 10 industries with lower labor
hourly output) are also analyzed separately. The results are reported in Appendix 3 and
Appendix 4, respectively.
In general, the net effects of the mean number of years of schooling on productivity
are greater than our other measures of schooling, and these findings are consistent with
the results reported above. Specifically, however, we find that the effects of the mean
number of years of schooling on productivity in T1 are greater than those in T2 in most
models. This finding is largely consistent with the findings reported in the literature 12 In assessing the relative sizes of the education effects, we compare elasticities as is common in productivity research. However, in terms of standardized coefficients (i.e., beta), the net effect of the mean number of years of schooling in Model 8 is approximately the same as is that for EDR. We prefer to compare elasticities, however, because that practice is more conventional in productivity and because the comparison of standardized coefficients in this case is very much affected by the fact that the standard deviation of EDR is much more than twice as large as the standard deviation for the mean years of schooling.
26
pertaining to the economics of education (e.g., Layard and Psacharopoulos 1974) which
contend that the effects of schooling should decline over time if it is a pure screening
device. For the two industrial groups, the effect of schooling on productivity is greater
for industries with higher labor hourly output than for industries with lower labor hourly
output. This finding suggests the importance of an interaction between the effects of
education and industrial characteristics. We hope that future research will consider this
more complex topic further.
VII. Discussion and Conclusions
Our primary research concern has been to empirically evaluate the relationship
between educational attainment and labor productivity since the nature of this
relationship has important implications for understanding how economic inequality is
generated in the labor market. Previous literature on this topic may be organized into
three major theories of the role of education in the labor market: (1) the
technical-functional view; (2) the market-signal view; and (3) the credentialism view.
Each of these theories has different implications as to how indicators of educational
attainment affect labor productivity. As we have mentioned, these perspectives are not
necessarily mutually exclusive in real labor markets. The employment system, for
example, may provide advantages to those with more education both because their
education has raised their productive capacities (human capital) and they have latent traits,
such as the capacity to learn new things easily, that are signaled by more years of
educational attainment (screening). In this paper, we try to clarify how these three
theories, in their purest forms, can be empirically distinguished.
It might be argued that our findings are suspect due to the collinearity between the
mean number of years of schooling and the percentile rank of schooling. While we
agree that, in general, multicollinearity can sometimes obscure the implications of a given
set of research results, we do not believe that multicollinearity is a problem in our
analysis. Multicollinearity refers to the situation when two (or more) variables in a
regression are jointly significant (in terms of the F-test), but none of them are
individually significant (in terms of their respective t-tests); in this situation, the
researcher knows that at least one of the variables can not be dropped from the regression
27

(because the F-test is significant), but the t-tests do not clearly indicate which variable is
significant (Goldberger 1991, p. 245). While this situation of multicollinearity certainly
obscures the implications of a set of results, it simply does not apply to our findings
because they clearly demonstrate which variable is statistically significant, and that is the
mean number of years of schooling. Furthermore, the same result is consistently shown
in other models.
In general, the strongest and most consistent finding from our analyses is the large
net effect of the mean number of years of schooling on labor productivity in
manufacturing industries. The mean number of years of schooling is, in fact,
statistically significant in all of these models. Its estimated coefficient is always larger
than is the estimated coefficient for any other educational variable that is included in the
models. What is worth noting too is that labor productivity in a manufacturing firm
seems to be highly elastic with respect to the mean number of years of schooling attained
by its workers, and this result is evidently net of the control variables and of any measure
of relative educational attainment.
We interpret this result as providing strong prima facie evidence for the
technical-functional view. Contrary to the credentialist claim that education has no
economic value, labor productivity in manufacturing industries is clearly and directly
increased when workers have more years of schooling. Furthermore, this increase is
still obvious and substantial even after controlling for any indicator of the extent of
relative educational attainment completed by workers. That is, increased schooling per
se increases labor productivity independently of the extent to which the educational levels
of some workers may be ranked more highly than those of other workers. Thus, this
finding is inconsistent with the market-signal view which emphasizes the importance of
relative educational attainment due to the assumption that schooling does not directly
augment human capital but rather only certifies those who possess greater abilities.13
In other words, of the three major theories that we have discussed, our results most
strongly support the technical-functional view since the mean number of years of
schooling is consistently the most important education variable in the regression analyses,
13 Interestingly, Ross and Mirowsky (1999) find that the years of schooling is also the dimension of education that has the largest effect on self-reported general health and physical functioning.
28
and this is consistent with and predicted by the technical-functional view. For this
reason, we can also clearly rule out the credentialist view which predicts that economic
productivity is unrelated to education. Further, even though Jiang’s (1990)
methodology differs greatly from ours, he also concludes that there is little empirical
support for the credentialist view when applied to the contemporary Taiwanese labor
market (also see Yu and Chu 1998; Liu and Li 2001).
As concerns the market-signal view, our findings are not strongly supportive, but it
could be argued that some limited support for this theory is evident in our regression
results. Among all of the models that we estimate which include both the mean number
of years of schooling and some indicators related to educational attainment (i.e., some
measures of R or EDR), the latter variables are statistically significant at the .05 level in
one case, more precisely Model 8, which includes EDR as computed on the basis of the
total labor force. Although the coefficient for the mean number of years of schooling is
clearly larger and more important than is the coefficient for EDR in Model 8, the fact that
the latter coefficient is fairly large as well as statistically significant at the .05 level (at
least in a one-tailed test) provides some support for the market-signal view.
In addition, while limited support of the market-signal view may be evident in
Model 8, we argue that what is needed is a more sophisticated version of that approach.
Strong and simplistic versions of the market-signal view--according to which only
relative educational attainment matters and schooling does not directly augment labor
productivity--most probably need to be reconsidered. Further theoretical developments
may require a model which incorporates aspects of both the technical-functional view as
well as the market-signal view. This contention may be consistent with the view of
Bidwell and Friedkin (1988, p. 454) who state that “What is learned and what is certified
as having been learned on average are strongly related, making it very difficult to
determine the degree to which labor markets are responsive to workers’ capabilities or
credentials. It may be more judicious to regard learning and gaining credentials as
tightly linked mechanisms through which schooling affects employability.” The need
for this sort of model has also been argued for by Weiss (1995, p. 134) who states that
“Sorting models [i.e., the market-signal view] of education can best be viewed as
extensions of human capital models.” We believe that future theoretical work on this
29

topic should more fully incorporate the interrelations among educational attainment,
employer and firm practices regarding hiring and remuneration and market conditions
related to the degree and nature of competitive pressure.
We emphasize, however, that none of our results directly support the human capital
theory of wages per se. Although our findings are consistent with one assumption of
that theory--namely, that education augments labor productivity--our analyses do not
address other crucial assumptions of the human capital theory. In particular, we have
not presented any evidence that wages among individuals derive solely from their
productivity; indeed, we have not presented any evidence at all regarding wages. It is
also certainly beyond the scope of this paper to consider whether wages are set on the
basis of competitive market forces (Lang and Dickens 1988; Sakamoto and Chen 1991).
In other words, our findings are not broad enough to provide direct support for critical
assumptions of the human capital theory of wages although our results are probably
consistent with at least one of the assumptions of that theory. From a strictly neoclassic
economic point of view, it might be argued that the net effect of EDR as evidenced in
Model 8 derives from some nonlinearity in the effect of years of schooling on
productivity. Because the mean number of years of schooling weighs each year of
schooling equally, the remaining net effect of EDR in Model 8 may reflect the greater
productivity associated with the higher years of schooling (i.e., college years) because
EDR is more sensitive to the upper end of the schooling distribution.
We should furthermore point out that although our results indicate that the number
of years of schooling has a strong net effect on productivity, they do not demonstrate that
this effect is an entirely direct result of improvements in cognitive skills. While we
would suspect that cognitive skills are at least partly involved in this increased
productivity, it is also quite plausible that attending school longer increases a person’s
work discipline as well as improves his or her social skills which are also important
sources of labor productivity. In addition, schools may sometimes directly impart work
skills that are directly relevant to production processes. In any event, in none of our
analyses do we use any direct measures of cognitive skills per se.
Finally, one important, albeit obvious, limitation in our analysis is that the data
pertain only to Taiwanese manufacturing industries in recent decades. We therefore do
30
not present any evidence which would permit us to argue that our conclusions apply to
other sectors of the Taiwanese economy or to other post-industrial economies, such as the
United States. However, it is worth pointing out that a major conclusion of Tam and
Tang’s (1998, p. 21) review of the American literature is that the “substantial returns
from additional years of schooling mostly reflect a gain in labor market productivity....the
returns to the quantity of schooling are driven by the productive significance of learning
in school. The presence of ability sorting does not lead to substantial bias in the returns
to schooling. The signaling value of schooling is at best a very minor source of the
substantial returns to additional years of schooling.” We hope that future research will
expand upon our efforts here.
Jeng Liu is Assistant Professor of Sociology, Tung-hai University. His main areas of
interest include labor market studies, sociology of education, and quantitative research
methods. He recently started a project funded by the National Science Council on the
changing highly-educated labor demand and utilization in Taiwan.
Arthur Sakamoto is Associate Professor of Sociology at the University of Texas at
Austin. His main areas of interest include social stratification, racial/ethnic relations
(including Asian American Studies), and labor market sociology. He is currently
involved in research which clarifies the multiple and varied mechanisms that may
generate exploitation, and to elucidate some of the complexities involved for the
sociological study of exploitation.
31
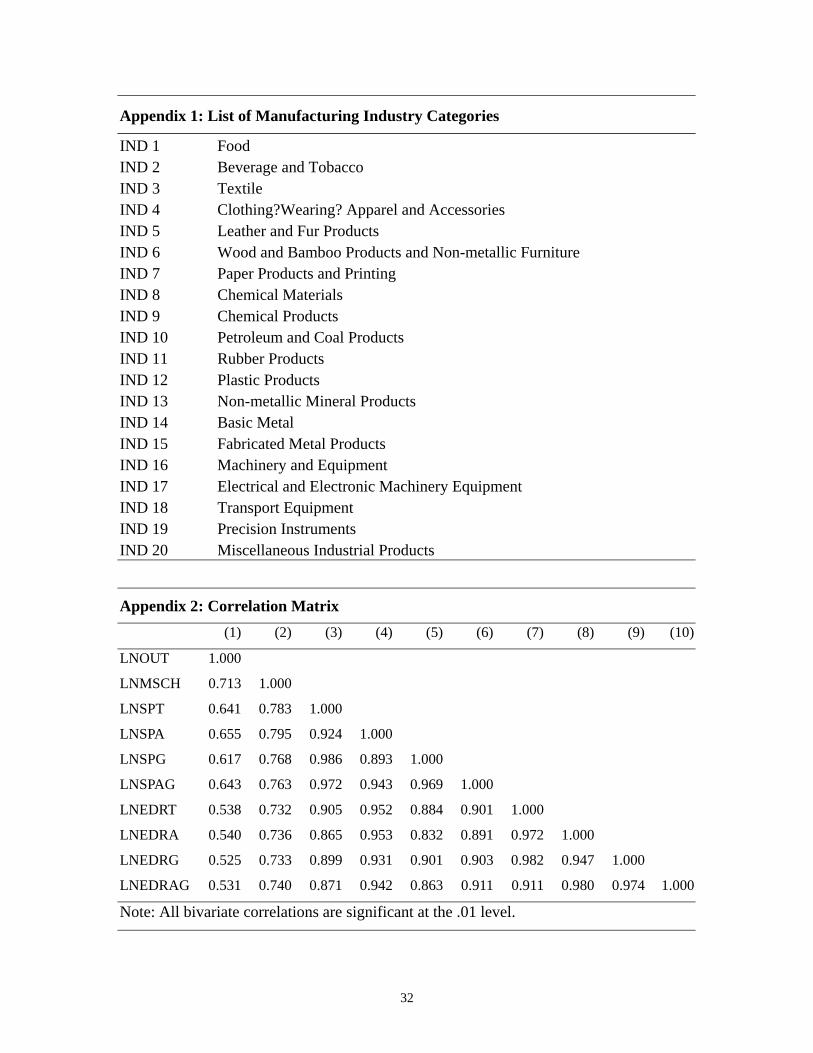
Appendix 1: List of Manufacturing Industry Categories
IND 1 Food IND 2 Beverage and Tobacco IND 3 Textile IND 4 Clothing?Wearing? Apparel and Accessories IND 5 Leather and Fur Products IND 6 Wood and Bamboo Products and Non-metallic Furniture IND 7 Paper Products and Printing IND 8 Chemical Materials IND 9 Chemical Products IND 10 Petroleum and Coal Products IND 11 Rubber Products IND 12 Plastic Products IND 13 Non-metallic Mineral Products IND 14 Basic Metal IND 15 Fabricated Metal Products IND 16 Machinery and Equipment IND 17 Electrical and Electronic Machinery Equipment IND 18 Transport Equipment IND 19 Precision Instruments IND 20 Miscellaneous Industrial Products
Appendix 2: Correlation Matrix
(1) (2) (3) (4) (5) (6) (7) (8) (9) (10)
LNOUT 1.000
LNMSCH 0.713 1.000
LNSPT 0.641 0.783 1.000
LNSPA 0.655 0.795 0.924 1.000
LNSPG 0.617 0.768 0.986 0.893 1.000
LNSPAG 0.643 0.763 0.972 0.943 0.969 1.000
LNEDRT 0.538 0.732 0.905 0.952 0.884 0.901 1.000
LNEDRA 0.540 0.736 0.865 0.953 0.832 0.891 0.972 1.000
LNEDRG 0.525 0.733 0.899 0.931 0.901 0.903 0.982 0.947 1.000
LNEDRAG 0.531 0.740 0.871 0.942 0.863 0.911 0.911 0.980 0.974 1.000
Note: All bivariate correlations are significant at the .01 level.
32

Appendix 3: Net Effects of Schooling Measures on Productivity by Time
LNMSCH LNEDRT LNEDRA LNEDRG LNEDRAG
b
(s.e.)
beta b
(s.e.)
beta b
(s.e.)
beta b
(s.e.)
beta B
(s.e.)
beta
2.101* 0.354 T1
(0.399)
3.846* 0.553
Model 1
T2
(0.694)
T1 0.640* 0.285
Model 7 (0.170)
T2 1.437* 0.633
(0.201)
T1 2.503* 0.421 -0.191 -0.085
Model 8 (0.730) (0.290)
T2 1.389* 0.612 0.173 0.025
(0.388) (0.388)
T1 2.834* 0.477 -0.377 -0.173
Model 9 (0.667) (0.275)
T2 1.004* 0.471 1.231 0.177
(0.365) (1.155)
T1 2.065* 0.348 -0.017 0.007
Model 10 (0.708) (0.272)
T2 1.371* 0.591 -0.002 0.001
(0.363) (1.193)
T1 2.281* 0.384 -0.090 -0.040
Model 11 (0.637) (0.247)
T2 1.109* 0.456 1.046 0.151
(0.357) (1.178)
Note: 1. T1 refers to data from 1979, 1982, 1985 and 1989; T2 refers to data from 1992, 1995 and
1998. 2. The star * indicates p < .05 (one-tailed test).
33

Appendix 4: Net Effects of Schooling Measures on Productivity by Industries
LNMSCH LNEDRT LNEDRA LNEDRG LNEDRAG
B
(s.e.)
beta b
(s.e.)
beta b
(s.e.)
Beta b
(s.e.)
beta B
(s.e.)
beta
2.383* 0.346 G1
(0.420)
2.896* 0.794
Model 1
G2
(0.396)
G1 0.589* 0.182
Model 7 (0.216)
G2 0.841* 0.493
(0.216)
G1 3.222* 0.468 0.494* 0.153
Model 8 (0.630) (0.280)
G2 2.680* 0.102 0.174 0.102
(0.478) (0.214)
G1 3.514* 0.511 0.730* 0.212
Model 9 (0.667) (0.265)
G2 2.838* 0.778 0.052 0.033
(0.454) (0.198)
G1 3.307* 0.481 0.514* 0.165
Model 10 (0.658) (0.285)
G2 2.315* 0.635 0.406* 0.226
(0.501) (0.221)
G1 3.641* 0.529 0.751* 0.229
Model 11 (0.598) (0.266)
G2 2.556* 0.154 0.270 0.154
(0.206) (0.206)
Note: 1. G1 refers to industries 1, 2, 8, 9, 10, 13, 14, 17, 18 and 19; G2 refers to the other 10
industries. 2. The star * indicates p < .05 (one-tailed test).
34
REFERENCES
Aaron, Henry J. 1978. Politics and the Professors. Washington, D.C.: Brookings
Institution.
Becker, Gary S. 1975. Human Capital. 2nd. ed. Chicago: University of Chicago Press.
Berg, Ivar. 1970. Education and Jobs: The Great Training Robbery. Boston: Beacon
Press.
Bluestone, Barry. 1977. “Economic Theory and the Fate of the Poor.” Pp. 335-340 in
Power and Ideology in Education, edited by J. Karabel and A. H. Halsey. New York:
Oxford University Press.
Bourdieu, Pierre. 1977. “Cultural Reproduction and Social Reproduction.” Pp. 487-511
in Power and Ideology in Education, edited by J. Karabel and A. H. Halsey. New
York: Oxford University Press.
Bowles, Samuel and Herbert Gintis. 1976. Schooling in Capitalist America. New York:
Basic Books.
Boylan, Ross D. 1993. “The Effect of the Number of Diplomas on Their Value.”
Sociology of Education 66:206-221.
Card, David. 1998. “The Causal Effect of Education on Earnings.” Center for Labor
Economics, Working Paper #2, University of California, Berkeley, and forthcoming
in Handbook of Labor Economics, Volume 3, edited by O. Ashenfelter and D. Card.
Chang, Ying-hua, James C. Hsue, and Yih-jyh Hwang. 1996. Educational Tracking and
Socioeconomic Status. Educational Reform Series: AB09. Taipei: Executive Yuan.
[In Chinese]
Chiswick, Barry R. 1974. Income Inequality: Regional Analyses within a Human Capital
Model. New York: National Bureau of Economic Research.
Collins, Randall. 1971. “Functional and Conflict Theories of Educational Stratification.”
American Sociological Review 36:1002-1019.
Collins, Randall. 1979. The Credential Society. New York: Academic Press.
Denison, Edward. 1962. The Sources of Economic Growth in the United States and the
Alternatives Before Us. New York: Committee for Economic Development.
Denison, Edward. 1967. Why Do Growth Rates Differ? Washington, D.C.: The
35
Brookings Institution.
Dickens, William T. and Lawrence F. Katz. 1987. “Inter-Industry Wage Differences and
Industry Characteristics.” Pp. 48-89 in Unemployment and the Structure of Labor
Markets, edited by K. Lang and J. S. Leonard. New York: Basil Blackwell.
Duncan, Otis D. 1961. “A Socioeconomic Index for All Occupations.” Pp. 109-138 in
Occupations and Social Status, edited A. J. Reiss, Jr. New York: Free Press.
Farkas, George. 1996. Human Capital or Cultural Capital? Ethnicity and Poverty
Groups in an Urban School District. New York: Aldine De Gruyter.
Featherman, David L. and Robert M. Hauser. 1978. Opportunity and Change. New York:
Academic Press.
Galle, Omer R., Candace H. Wiswell, and Jeffrey A. Burr. 1985. “Racial Mix and
Industrial Productivity.” American Sociological Review 50:20-33.
Goldberger, Arthur S. 1991. A Course in Econometrics. Cambridge, MA: Harvard
University Press.
Greene, William H. 2000. Econometric Analysis. 2nd edition. New York: Macmillan.
Griliches, Zvi. 1970. “Notes on the Role of Education in Production Functions and
Growth Accounting.” Pp. 71-127 in Education, Income, and Human Capital, edited
by W. L. Hansen. New York: Columbia University Press.
Hale, Carl W. and Robert Main. 1977. “Size Distribution of Individual Income in Large
United States Standard Metropolitan Statistical Areas: 1963 and 1967.” Journal of
Regional Science 17:255-270.
Hirsch, Barry T. 1978. “Predicting Earnings Distributions Across Cities: The Human
Capital Model vs. the National Distribution Hypothesis.” Journal of Human
Resources 13:366-384.
Hirsch, Barry T. 1982. “The Interindustry Structure of Unionism, Earnings, and Earnings
Dispersion.” Industrial and Labor Relations Review 36:22-39.
Hwang, Yih-jyh. 1998. “Educational Strata, Educational Expansion, and Economic
Development.” National Cheng-chi University Journal of Sociology 28:25-55. [In
Chinese]
Jiang, Feng-fuh. 1990. “The Importance of Educational Credentialism in Taiwan’s Labor
Market.” Academia Economic Papers 18:129-178. [In Chinese]
36

Johnston, John. 1984. Econometric Methods. New York: McGraw-Hill.
Jorgenson, Dale W. 1984. “The Contribution of Education to U.S. Economic Growth.”
Pp. 95-162 in Education and Economic Productivity, edited by E. Dean. Cambridge,
MA: Ballinger.
Jorgenson, Dale W. and Barbara M. Fraumeni. 1995a. “Investment in Education and U.S.
Economic Growth.” Pp. 371-388 in Productivity, Volume 1: Postwar U.S. Economic
Growth. Cambridge, MA: MIT Press.
Jorgenson, Dale W. and Barbara M. Fraumeni. 1995b. “The Accumulation of Human and
Nonhuman Capital, 1948-84.” Pp. 273-331 in Productivity, Volume 1: Postwar U.S.
Economic Growth. Cambridge, MA: MIT Press.
Jorgenson, Dale W. and Zvi Griliches. 1995. “The Explanation of Productivity Change.”
Pp. 51-98 in Productivity, Volume 1: Postwar U.S. Economic Growth. Cambridge,
MA: MIT Press.
Kendrick, John W. 1976. The Formation and Stocks of Total Capital. New York:
Columbia University Press.
Kendrick, John W. and Elliot S. Grossman. 1980. Productivity in the United States.
Baltimore: John Hopkins University Press.
Lang, Kevin and William T. Dickens. 1988. “Neoclassical and Sociological Perspectives
on Segmented Labor Markets.” Pp. 65-88 in Industries, Firms, and Jobs, edited by
G. Farkas and P. England. New York: Plenum Press.
Layard, Richard and George Psacharopoulos. 1974. “The Screening Hypothesis and the
Returns to Education.” Journal of Political Economy 82(5): 985-98.
Levin, Henry M. 1977. “A Decade of Policy Developments in Improving Education and
Training for Low-Income Populations.” Pp. 123-188 in A Decade of Federal
Antipoverty Programs, edited by R. H. Haveman. New York: Academic Press.
Liu, Jeng and Chin-hwa Li. “The Myth of Credentialism: Some Evidence from Taiwan’s
Labor Market.” Taiwan Journal of Sociology of Education 1(2): 91-129. [In
Chinese]
Meyer, John W. 1977. “The Effects of Education as an Institution.” American Journal of
Sociology 83:55-77.
Meyer, John W. 2001. “The Evolution of Modern Stratification Systems.” Pp. 881-890 in
37

Social Stratification: Class, Race and Gender in a? Sociological Perspective, edited
by D. B. Grusky. Boulder, CO: Westview Press.
Petersen, Trond. 1992. “Individual, Collective, and Systems Rationality in Work Groups:
Dilemmas and Market-Type Solutions.” American Journal of Sociology 98:469-510.
Ross, Catherine E. and John Mirowsky. 1999. “Refining the Association Between
Education and Health: The Effects of Quantity, Credential, and Selectivity.”
Demography 36:445-460.
Rubinson, Richard and Irene Browne. 1994. “Education and the Economy.” Pp. 581-599
in The? Handbook of Economic Sociology, edited by N.J. Smelser and R. Swedberg.
Princeton, NJ: Princeton University Press.
Sakamoto, Arthur and Meichu D. Chen. 1991. “Inequality and Attainment in a Dual
Labor Market.” American Sociological Review 56:295-308.
Schiller, Bradley R. 1984. The Economics of Poverty and Discrimination. Englewood
Cliffs, NJ: Prentice-Hall.
Schultz, Theodore W. 1961a. “Investment in Human Capital.” American Economic
Review 51:1-17.
Schultz, Theodore W. 1961b. “Education and Economic Growth.” Pp. 39-65 in Social
Forces Influencing American Education, edited by N. B. Henry. Chicago, IL:
University of Chicago Press.
Sorensen, Aage B. 1979. “A Model and a Metric for the Analysis of the Intragenerational
Status Attainment Process.” American Journal of Sociology 85:361-384.
Sorensen, Aage B. 1994. “Firms, Wages, and Incentives.” Pp. 504-28 in Handbook of
Economic Sociology, edited by N. J. Smelser and R. Swedberg. New York: Russell
Sage Foundation.
Sorensen, Aage B. and Arne L. Kalleberg. 1981. “An Outline of a Theory of the
Matching of Persons to Jobs.” Pp. 49-74 in Sociological Perspectives on Labor
Markets, edited by I. Berg. New York: Academic Press.
Spence, Michael. 1981. “Signaling, Screening, and Information.” Pp. 319-357 in Studies
in Labor Markets, edited by S. Rosen. Chicago: University of Chicago Press.
Tam, Tony and Stephen Tang. 1998. “What Do the Quantity and Quality of Schooling
Do? Evidence and Implications.” Paper presented at the International Sociological
38

Association, RC28, January 7-9. Taipei, Taiwan.
Thurow, Lester C. 1975. Generating Inequality: Mechanisms of Distribution in the U.S.
Economy. New York: Basic Books.
Tomaskovic-Devey, Donald. 1988. “Market Concentration and Structural Power as
Sources of Industrial Productivity.” Pp. 141-154 in Industries, Firms, and Jobs,
edited by G. Farkas and P. England. New York: Plenum Press.
Tsay, Ruey-ming and Ta-sen Lin. 2000. “The Linkage Between Education and the Labor
Market.” Pp. 143-190 in Market, Class, and Politics: The Changing Chinese Society,
edited by J. Liu et al. Hong Kong: The Chinese University of Hong Kong Press. [In
Chinese]
Walters, Pamela B. and Richard Rubinson. 1983. “Educational Expansion and Economic
Output in the United States, 1890-1969: A Production Function Analysis.” American
Sociological Review 48:480-493.
Yu, Ruoh-rong and C.Y. Cyrus Chu. 1998. “Does NTU Add More Value to Her Students
Than Other Colleges?” Taiwan Economic Review 26(1): 65-89. [In Chinese]
39

學校教育在台灣勞動市場中扮演的角色:
人力資本,篩選機制,或文憑主義?
劉 正 Arthur Sakamoto
中 文 摘 要
個人的教育與其社會經濟成就之間有密切的關係。然而,這種關係係源自於其
人力資本的增加與生產能力的提升?勞動市場之篩選?或僅是文憑主義的作用?則
為有關社會階層化研究的普遍爭議。雖然,這三種說法對教育與社會經濟地位的關
聯性所提出之理由各有不同,但卻未見學界有系統的比較各理論之適用性,也不曾
對此等理論進行過決斷性的驗証。我們經由分析各種代表學校教育的量化指標對經
濟生產力產生的影響效果,試圖釐清學校教育在勞動市場中所扮演的角色。實際操
作上,本文使用了近二十年來的台灣人力運用調查資料及各相關的官方統計報告,
以產業別為單位,分析了製造業勞工之教育成就與其平均生產力的關係。部分結果
呈現出台灣勞動市場篩選的事實,但對人力資本理論的支持程度則更為明顯。
關鍵字:人力資本、篩選標準、文憑主義、勞動生產力
作 者 簡 介
劉 正,東海大學社會學系助理教授。主要研究興趣為勞動市場、教育社會學、量
化研究方法等。目前進行一探討台灣高級人力之需求與運用狀況變遷的研究計劃。
Arthur Sakamoto,美國德州大學(奧斯汀)社會學系副教授。主要研究興趣為社
會階層、亞裔研究、勞動市場等。目前正進行剝削理論的整理與分析的研究。
40