Phytoplankton seasonal variation in a shallow stratified eutrophic reservoir (Garças Pond, Brazil)
Upload
independentCategory
view
2download
0
Tq
GEa
b
c
d
e
a
ARRA
KPRSFC
1
tofti
(
h1
Ecological Indicators 45 (2014) 28–36
Contents lists available at ScienceDirect
Ecological Indicators
jo ur nal ho me page: www.elsev ier .com/ locate / ecol ind
he role of phytoplankton diversity metrics in shallow lake and riveruality assessment
ábor Boricsa, Judit Görgényia, István Grigorszkyb, Zsolt László-Nagyc, Béla Tóthmérészd,niko Krasznaie, Gábor Várbíróa,∗
MTA Centre for Ecological Research, Department of Tisza Research, 18/c, Bem Square, H-4026 Debrecen, HungaryUniversity of Debrecen, Department of Hydrobiology, Egyetem Tér 1, H-4032 Debrecen, HungaryEnvironmental Protection, Nature Conservation and Water Authority, Lower-Tisza Region, Felso Tisza-part 17, H-6721 Szeged, HungaryMTA-DE Biodiversity and Ecosystem Services Research Group, Egyetem tér 1, H-4032 Debrecen, HungaryEnvironmental Protection, Nature Conservation and Water Authority, Trans-Tisza Region, Hatvan u. 16, H-4025 Debrecen, Hungary
r t i c l e i n f o
rticle history:eceived 18 December 2013eceived in revised form 3 March 2014ccepted 12 March 2014
eywords:otamal rivershithral riverspecies diversityunctional diversityontradictory trends
a b s t r a c t
Ecological water quality problems are frequently connected to increment of phytoplankton productiv-ity and overdominance of some phytoplankton species. Metrics that show monotonously increasing ordecreasing tendencies along stressor gradients is recommended for ecological state assessment. Diver-sity metrics are influenced by various physical disturbances and show high within-year variability; thus,there is no agreement on the usefulness of these metrics as state indicators.
To test the usefulness of phytoplankton diversity in ecological state assessment we investigated theproductivity–diversity relationships for lakes and rivers in the Carpathian Basin (Hungary). We demon-strated that the shape of productivity–diversity relationship depends on the investigated water bodytype. Regarding lakes, hump-shaped relationship was found for all computed metrics. Parallel with theincrease in phytoplankton productivity values, diversity metrics showed monotonously increasing ten-dencies in rhithral and decreasing tendencies in large potamal rivers. We found no systematic relationshipin the case of small lowland rivers.
Changes of diversity metrics calculated for species and functional groups showed similar tendencieswithin the types, only the slopes of regression lines differ each other.
The use of diversity metrics as ecological state indicators should be restricted to water body types
where diversity decreases or increases monotonously with phytoplankton biomass. Regarding the lakesthe use of diversity metrics is not recommended for ecological state assessment. In rhithral and largepotamal river assessment, application of diversity metrics should be strongly considered. We demon-strated that diversity metrics can be useful components of multimetric indices proposed to use by theWater Framework Directive.© 2014 Elsevier Ltd. All rights reserved.
. Introduction
Diversity is indisputably one of the most frequently used quan-itative descriptors of communities. Diversity metrics are capablef describing system properties such as complexity, stability, and
unctioning of ecosystems (Hacker and Gaines, 1997); therefore,hey became parts of several multimetric indices used for biolog-cal quality assessment (Hering et al., 2006; Stoddard et al., 2008;∗ Corresponding author. Tel.: +36 302393267.E-mail addresses: [email protected], [email protected]
G. Várbíró).
ttp://dx.doi.org/10.1016/j.ecolind.2014.03.011470-160X/© 2014 Elsevier Ltd. All rights reserved.
Carvalho et al., 2013). Applicability of diversity-based approachesneeds a clear relationship between stressors and diversity metricsas response variables (European Commission, 2010). The natureof these relationships depends on the types of the anthropogenicdisturbances and the responses of biological assemblages. Inhighly diverse natural assemblages human-caused environmen-tal changes result in a decrease both in functional and speciesdiversity (Gabriels et al., 2010). In the case of benthic diatoms,assemblages exhibit opposite responses to nutrient enrichment.
Sonneman et al. (2001) demonstrated that sites with low nutri-ent concentrations were more species-rich than mildly enrichedsites. In contrast Stevenson et al. (2008) found that species diversityof stream phytobenthos increases with phosphorus enrichment.
al Indicators 45 (2014) 28–36 29
Tmt
oaqee(lrwo(eaoci
ttsantpt
t22ttsteipstus
fat
•
•
2
2
wstdtl
Fig. 1. Diversity profiles of the one-parametric Rényi diversity index family for twohypothetical assemblages, denoted by A and B. Vertical dotted lines denotes theparticular values of the scale parameter (measured along the x-axis) which provides
G. Borics et al. / Ecologic
hese examples indicate that prior to the application of diversityetrics as ecological indicators the possibilities and limitation has
o be investigated.Due to central role in the aquatic food chain, phytoplankton is
ne of the biological quality elements that have to be monitorednd assessed in Europe (European Commission, 2000). Based onuantitative and qualitative characteristics of phytoplankton sev-ral types of metrics have been elaborated and used in Europe:.g. biomass, sensitivity/tolerance, composition and bloom metricsCarvalho et al., 2013). Among the various water quality prob-ems, eutrophication is indisputably a phenomenon that is closelyelated to phytoplankton issues. Nutrient enrichment coincidesith enhanced phytoplankton production and impoverishment
f floristic composition in lakes and large potamal rivers as wellSchmidt, 1994; Thorp et al., 1998; Wehr and Descy, 1998; Boricst al., 2007, 2013a,b; Stankovic et al., 2012). Several human inducedlterations of the aquatic ecosystems result in the overdominancef some phytoplankton taxa (Naselli-Flores et al., 2003), whichause the decrease of diversity; therefore, diversity indices as statendicators seem plausible ecological assessment measures.
Phytoplankton diversity is influenced by the fluctuation ofhe resources (Sommer, 1984) and not by their absolute quan-ity; thus, diversity metrics cannot be studied by the traditionaltressor–metric relationships, as it is proposed in technical guid-nce (European Commission, 2010), and has been done in theutrients–sestonic chl-a and nutrients–sensitivity metrics rela-ions. Instead of that, we investigated the changes of diversity alonghytoplankton productivity, which is the most robust phytoplank-on metric used for quality assessment (Carvalho et al., 2013).
Diversity is frequently studied as a function of productivity inhe case of plants, animals or microbes (Adler et al., 2011; Grime,001; Chase and Leibold, 2002; Borics et al., 2012; Fridley et al.,012; Skácelová and Leps, 2014). Besides its theoretical impor-ance, the shape of this relationship provides useful information onhe practical use of diversity metrics as state indicators. Ecologicaltate assessment should be based on clear relationship betweenhe stressor(s) and the indicator metrics, i.e. the metrics shouldxhibit monotonously increasing or decreasing tendencies withncreasing anthropogenic loads (European Commission, 2010). Ashytoplankton productivity can be considered as a proximate mea-ure of anthropogenic loads (Borics et al., 2013a,b), investigation ofhe productivity–diversity relationships, in an indirect way, informs about the role of diversity in phytoplankton-based ecologicaltate assessment.
The specific objective of this study is to investigate the use-ulness of diversity metrics in phytoplankton-based water qualityssessment, and to set the limits of their application. Thus, weested the following hypotheses:
The shape of the phytoplankton productivity–species diversitycurves depends on water body types.Functional diversity metrics are more sensitive measures of pro-ductivity than those calculated for species data.
. Material and methods
.1. Data
For the analyses phytoplankton and chlorophyll-a (chl-a) dataere provided by the Hungarian national water quality monitoring
ystem. Data of 25 lakes and 71 rivers were used for the inves-
igations. Lake samples were from the photic layer (2.5 × Secchiepth) of the lakes. In the case of the very shallow lakes (Zmax < 2 m)he whole water column was sampled. River samples were col-ected from the immediate surface layer of the thalweg. There wereclassical diversity index statistics, like number of species, Shannon, Simpson, andBerger–Parker index of diversity).
monthly samplings in the growing season. Samples were fixed byLugol’s solution on the spot. Algal counting was performed usingthe Utermöhl’s settling procedure (Lund et al., 1958). Algae wereidentified to species level. Standard geometric models (Hillebrandet al., 1999) were used to calculate phytoplankton biovolumes.Sestonic chl-a as a surrogate measure of phytoplankton produc-tivity was used to analyse phytoplankton productivity–diversityrelationships.
2.2. Applied metrics
We characterise the diversity of phytoplankton by four diver-sity indices (species richness, Shannon index, Simpon index,Berger–Parker index); each of these indices is a member of theRényi diversity index family Eq. (1) (Rényi, 1961; Tóthmérész,1998). This is a so-called one-parametric diversity index family: thediversity of an assemblage is characterised by a (scale-dependent)diversity profile instead of a numerical value (see Fig. 1). By increas-ing the value of scale parameter (˛), the contribution of abundantspecies to the diversity of the assemblage increases, and the con-tribution of rare species decreases. This is a solution of the classicalindex choice problem: one may wish the index to be sensitive tothe composition of the abundant species but relatively indifferentto that of the rare ones (Peet, 1974). Diversity profiles can be usedin a graphical form to visualise the diversity relations of an assem-blage as shown in Fig. 1 for the assemblages A and B based on Rényidiversity index family (Tóthmérész, 1995). We have used the fol-lowing values: 0, 1, 2, ∞. When the value of the scale parameter is0, then the value of the Rényi diversity is the logarithm of the num-ber of species Eq. (2). It is extremely sensitive to the presence of rarespecies: a species present as a single individual has the same con-tribution to HR(0) as the most abundant species. When the value ofthe scale parameter is 1, Rényi diversity is identical to the Shannonindex of diversity (Shannon, 1948) Eq. (3). It is less sensitive to therare species than HR(0). When the value of the scale parameter is2, the Rényi diversity is equivalent to the Simpson diversity Eq. (4),and it is more sensitive to the frequent species than to the rare ones.HR(∞) is the logarithm of the relative abundance of the commonestspecies, and ignores the others Eq. (5); it is usually mentioned asBerger–Parker diversity (Berger and Parker, 1970).
HR˛ = 11 − ˛
logS∑
i=1
p˛i where ˛≥0 and /= 1, (1)
3 al Indicators 45 (2014) 28–36
H
˛
H
H
teal
2
rrr(ml
bolstTAbuiar
3
twtdwr
aTtgfiHfspidHsd
t
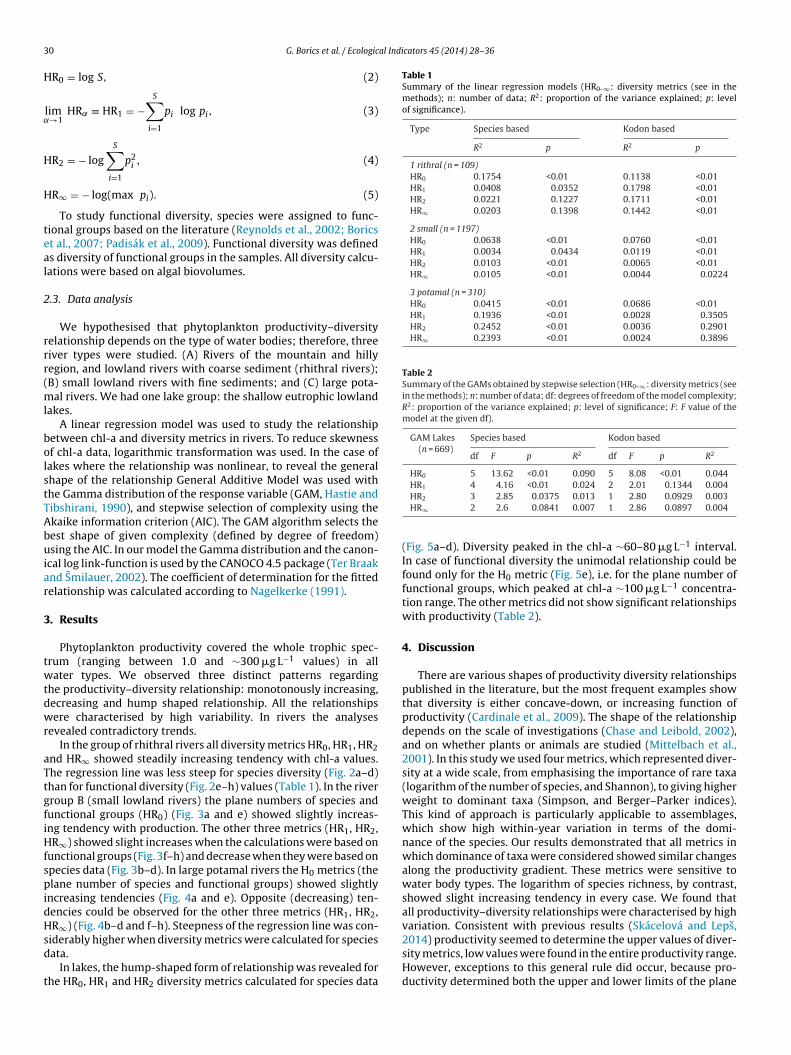
Table 1Summary of the linear regression models (HR0–∞: diversity metrics (see in themethods); n: number of data; R2: proportion of the variance explained; p: levelof significance).
Type Species based Kodon based
R2 p R2 p
1 rithral (n = 109)HR0 0.1754 <0.01 0.1138 <0.01HR1 0.0408 0.0352 0.1798 <0.01HR2 0.0221 0.1227 0.1711 <0.01HR∞ 0.0203 0.1398 0.1442 <0.01
2 small (n = 1197)HR0 0.0638 <0.01 0.0760 <0.01HR1 0.0034 0.0434 0.0119 <0.01HR2 0.0103 <0.01 0.0065 <0.01HR∞ 0.0105 <0.01 0.0044 0.0224
3 potamal (n = 310)HR0 0.0415 <0.01 0.0686 <0.01HR1 0.1936 <0.01 0.0028 0.3505HR2 0.2452 <0.01 0.0036 0.2901HR∞ 0.2393 <0.01 0.0024 0.3896
Table 2Summary of the GAMs obtained by stepwise selection (HR0–∞: diversity metrics (seein the methods); n: number of data; df: degrees of freedom of the model complexity;R2: proportion of the variance explained; p: level of significance; F: F value of themodel at the given df).
GAM Lakes(n = 669)
Species based Kodon based
df F p R2 df F p R2
HR0 5 13.62 <0.01 0.090 5 8.08 <0.01 0.044HR1 4 4.16 <0.01 0.024 2 2.01 0.1344 0.004
0 G. Borics et al. / Ecologic
R0 = log S, (2)
lim→1
HR˛ ≡ HR1 = −S∑
i=1
pi log pi, (3)
R2 = − logS∑
i=1
p2i , (4)
R∞ = − log(max pi). (5)
To study functional diversity, species were assigned to func-ional groups based on the literature (Reynolds et al., 2002; Boricst al., 2007; Padisák et al., 2009). Functional diversity was defineds diversity of functional groups in the samples. All diversity calcu-ations were based on algal biovolumes.
.3. Data analysis
We hypothesised that phytoplankton productivity–diversityelationship depends on the type of water bodies; therefore, threeiver types were studied. (A) Rivers of the mountain and hillyegion, and lowland rivers with coarse sediment (rhithral rivers);B) small lowland rivers with fine sediments; and (C) large pota-
al rivers. We had one lake group: the shallow eutrophic lowlandakes.
A linear regression model was used to study the relationshipetween chl-a and diversity metrics in rivers. To reduce skewnessf chl-a data, logarithmic transformation was used. In the case ofakes where the relationship was nonlinear, to reveal the generalhape of the relationship General Additive Model was used withhe Gamma distribution of the response variable (GAM, Hastie andibshirani, 1990), and stepwise selection of complexity using thekaike information criterion (AIC). The GAM algorithm selects theest shape of given complexity (defined by degree of freedom)sing the AIC. In our model the Gamma distribution and the canon-
cal log link-function is used by the CANOCO 4.5 package (Ter Braaknd Smilauer, 2002). The coefficient of determination for the fittedelationship was calculated according to Nagelkerke (1991).
. Results
Phytoplankton productivity covered the whole trophic spec-rum (ranging between 1.0 and ∼300 �g L−1 values) in allater types. We observed three distinct patterns regarding
he productivity–diversity relationship: monotonously increasing,ecreasing and hump shaped relationship. All the relationshipsere characterised by high variability. In rivers the analyses
evealed contradictory trends.In the group of rhithral rivers all diversity metrics HR0, HR1, HR2
nd HR∞ showed steadily increasing tendency with chl-a values.he regression line was less steep for species diversity (Fig. 2a–d)han for functional diversity (Fig. 2e–h) values (Table 1). In the riverroup B (small lowland rivers) the plane numbers of species andunctional groups (HR0) (Fig. 3a and e) showed slightly increas-ng tendency with production. The other three metrics (HR1, HR2,R∞) showed slight increases when the calculations were based on
unctional groups (Fig. 3f–h) and decrease when they were based onpecies data (Fig. 3b–d). In large potamal rivers the H0 metrics (thelane number of species and functional groups) showed slightly
ncreasing tendencies (Fig. 4a and e). Opposite (decreasing) ten-encies could be observed for the other three metrics (HR1, HR2,R∞) (Fig. 4b–d and f–h). Steepness of the regression line was con-
iderably higher when diversity metrics were calculated for speciesata.
In lakes, the hump-shaped form of relationship was revealed forhe HR0, HR1 and HR2 diversity metrics calculated for species data
HR2 3 2.85 0.0375 0.013 1 2.80 0.0929 0.003HR∞ 2 2.6 0.0841 0.007 1 2.86 0.0897 0.004
(Fig. 5a–d). Diversity peaked in the chl-a ∼60–80 �g L−1 interval.In case of functional diversity the unimodal relationship could befound only for the H0 metric (Fig. 5e), i.e. for the plane number offunctional groups, which peaked at chl-a ∼100 �g L−1 concentra-tion range. The other metrics did not show significant relationshipswith productivity (Table 2).
4. Discussion
There are various shapes of productivity diversity relationshipspublished in the literature, but the most frequent examples showthat diversity is either concave-down, or increasing function ofproductivity (Cardinale et al., 2009). The shape of the relationshipdepends on the scale of investigations (Chase and Leibold, 2002),and on whether plants or animals are studied (Mittelbach et al.,2001). In this study we used four metrics, which represented diver-sity at a wide scale, from emphasising the importance of rare taxa(logarithm of the number of species, and Shannon), to giving higherweight to dominant taxa (Simpson, and Berger–Parker indices).This kind of approach is particularly applicable to assemblages,which show high within-year variation in terms of the domi-nance of the species. Our results demonstrated that all metrics inwhich dominance of taxa were considered showed similar changesalong the productivity gradient. These metrics were sensitive towater body types. The logarithm of species richness, by contrast,showed slight increasing tendency in every case. We found thatall productivity–diversity relationships were characterised by highvariation. Consistent with previous results (Skácelová and Leps,
2014) productivity seemed to determine the upper values of diver-sity metrics, low values were found in the entire productivity range.However, exceptions to this general rule did occur, because pro-ductivity determined both the upper and lower limits of the plane
G. Borics et al. / Ecological Indicators 45 (2014) 28–36 31
F L−1) ae ies rica er (BP
n(
tteidse
ig. 2. Relationship between phytoplankton productivity (expressed in chl-a �g
xpressed in four indices of the Rényi’s diversity series: HR0 is the logarithm of specnd HR∞ is the proportion of the most abundant species, known as the Berger–Park
umbers of species and functional groups (HR0) both in rhithralFig. 2a and e) and potamal (Fig. 4a and e) rivers.
In the present study we demonstrated that phytoplank-on productivity–diversity relationship depends on water-bodyype. The monotonously increasing tendency in rhithral rivers isxplained by their naturally oligotrophic character. These rivers
n natural state are characterised by low diversity phytoplanktonominated by tychoplanktonic elements, i.e. benthic taxa that occa-ionally carried into the plankton by physical disturbances (Rojot al., 1994; Leland, 2003; Stankovic et al., 2012). Although, nutrientgainst species (a–d) and functional diversity (e–h) in rhithral rivers. Diversity ishness, HR1 is the Shannon–Wiener diversity, HR2 is the Simpson dominance index) index. Lines fitted by ordinary least squares regression.
and light conditions in these rivers would enable phytoplanktersto develop larger populations, because of lack of inocula and shortresidence time (Borics et al., 2007), phytoplankton abundance inpristine rivers remains low. The clear rhithral rivers are highly sus-ceptible to species invasions. Phytoplankton composition in thesewater currents is quite sensitive to that of the inlets, which con-
tinuously enrich the phytoplankton. Phytoplankton abundance ofthe inlets (ponds or reservoir effluents) can highly exceed that ofthe rivers; therefore, despite the dilution effect, the inlets basi-cally determine the phytoplankton composition and diversity in
32 G. Borics et al. / Ecological Indicators 45 (2014) 28–36
F 1) agas
tur
iippapi
ig. 3. Relationship between phytoplankton productivity (expressed in chl-a �g L−
ediments (abbreviations as in Fig. 2).
he recipient rivers. Along the river the phytoplankton is contin-ously enriched by various elements, and finally, eclectic speciesich assemblages will develop even at high biomass range.
The small lowland rivers are the most threatened water bod-es worldwide. Their watersheds are on the heavily populated andntensively used lowlands, which are seriously impacted by anthro-ogenic influents (Van Dam et al., 2007; Várbíró et al., 2012). Inristine state these water currents were macrophyte dominated,
nd the phytoplankton must have been dominated by tycho-lanktonic and metaphytic elements. Several of the lowland riversn our database were affected by human induced disturbances
inst species (a–d) and functional (e and f) diversity in small lowlands rivers of fine
which masked the natural processes and the real shape ofbiomass–diversity relationship. The steepness of regression lines(both for species and functional group data) was quite low in caseof HR1, HR2, HR∞, thus, we can conclude that there was no rela-tionship between the variables.
The large potamal rivers provide hospitable environment forseveral phytoplankton species. Due to nutrient retention of theriver basins concentrations of nutrients are relatively high in
these rivers even in natural state, and the residence time is long(Kronvang et al., 1999); thus, everything is optimal to the devel-opment of high biomass phytoplankton assemblages. Composition
G. Borics et al. / Ecological Indicators 45 (2014) 28–36 33
F 1) agav
optio2blrbw
ig. 4. Relationship between phytoplankton productivity (expressed in chl-a �g L−
iations as in Fig. 2).
f the plankton is strongly influenced by competition among thelankton members, and this leads to the development of a charac-eristic assemblage called potamoplankton. The potamoplanktons mostly dominated by centric diatoms and chlorococcaleans notnly in the vegetation period (Bothár and Kiss, 1990; Várbíró et al.,007), but in winters too (Kiss and Genkal, 1993). This assem-lage can also be enriched by the influents, but this impact is of
esser importance, because of the very large water discharge of the
ivers in this category. Decreasing tendency for the plane num-er of species (HR0) and at functional level cannot be observed,hich implies that although physical constraints might changeinst species (a–d) and functional (e and f) diversity in large potamal rivers (abbre-
considerably along the large rivers, the competition does not actat this level.
The contrasting shape of biomass–diversity relationships foundin rhithral and potamal rivers is not a “lack of data problem”, wherethe increasing or decreasing tendency can be explained by the factthat data available covers only one tail of the otherwise hump-shaped relationship. The opposite trends can be explained by dif-ferences in the strength of contradictory processes e.g. colonisation
and competitive exclusion. Both in the case of rhithral and potamalrivers, the whole trophic spectrum was considered in this study,from the oligotrophic to hypertrophic states. The productivity
34 G. Borics et al. / Ecological Indicators 45 (2014) 28–36
F 1) agaa
gs
2oHhp
ig. 5. Relationship between phytoplankton productivity (expressed in chl-a �g L−
s in Fig. 2). Regression line fitted by GAM.
radient also covered the whole trophic spectrum when lakes weretudied.
In accordance with previous findings (Skácelová and Leps,014), where the calculations were based on species data the
bserved hump-shaped relationship became flattened towards theR0, HR1, HR2, HR∞ direction. It means that those indices in whichigher weight is given to the dominant taxa are less sensitive to theroductivity. Regarding the functional diversity the hump shapedinst species (a–d) and functional (e and f) diversity in shallow lakes (abbreviations
character was observed exclusively for the plane number of func-tional groups (HR0). The lack of significant relationships we foundin the case of the other metrics was due to the high number ofsmall naturally eutrophic water bodies in the database. These lakes
are characterised by high functional diversity values even underhypertrophic conditions (Borics et al., 2012).We hypothesised that functional diversity metrics show morepronounced changes along productivity. We found that this is not

al Indi
tsorsrda
tetpladllcaoacaap(
dZp2m
br
1
2
itsihmi
pmbtHc
t
G. Borics et al. / Ecologic
rue for all types. Metrics calculated from functional groups andpecies data showed different sensitivity depending on the typef water bodies. Differences were more pronounced in case ofhithral and potamal rivers. In rhithral rivers the functional diver-ity, in potamal rivers species diversity showed more pronouncedelationship with productivity. Differences are attributable to theifferent intensity of the underlying mechanisms, impact of inletsnd species competition.
The apparent similarity, which exists between phytoplank-on dynamics in potamal rivers and in shallow lakes (Reynoldst al., 1994) would imply that this similarity should appear inhe shape of the productivity–diversity curves. Differences in theroductivity–diversity curves suggest that intensity of the under-
ying processes along the productivity scale is different in lakesnd large potamal rivers. However, at higher productivity range,iversity showed decreasing tendency both in the case of lakes and
arge potamal rivers. Borics et al. (2012) demonstrated that in shal-ow lakes dominance of the good light competitor bloom-formingyanobacteria exert strong negative impact both on functionalnd species diversity at high biovolume range, while dominancef other groups has much less consequences for the diversity ofssemblages. In large potamal rivers light deficiency also plays cru-ial role in phytoplankton succession (Vörös et al., 2000; Sellersnd Bukaveckas, 2003). The high biomass riverine assemblagesre dominated mostly by diatoms, which taxa due to their plastichysiological properties can cope with fluctuating light conditionsLavaud and Lepetit, 2013).
The decisive role of physical disturbances in supportingiversity (Connell, 1978; Padisák et al., 1988; Hambright andohary, 2000) and the unimodal character of the phytoplanktonroductivity–diversity relationship in lakes (Skácelová and Leps,014) raise the question of whether and to what extent diversityetrics can be used for water quality assessment.Regarding the lakes we think that diversity metrics should not
e used for ecological state assessment because of the followingeasons:
. We demonstrated the unimodal character of theproductivity–diversity relationship, but productivity deter-mines only the maxima of the diversity metrics and not theactual value of the metrics in case of a particular lake. Valuesclose to the theoretical minima of the given metrics might occuralong the whole productivity gradient, which result in a hugeamount of scatter of data.
. The hump shaped relationship means that low diversity valuesare expected both at low and high productivity; thus, low diver-sity values might occasionally refer to good or bad ecologicalstate.
For these reasons in lake quality assessment only sensitiv-ty/tolerance indices should be used as composition metrics. Onhe other hand, the use of diversity metrics as state indicatorseems a plausible approach for rivers. In rhithral rivers a significantncrease of diversity may indicate nutrient load and/or undesirableydromorphological modification of the watershed. In large pota-al rivers the decreasing tendency indicates nutrient input and/or
mpoundment.In these river types, besides the well known biomass and com-
osition metrics, diversity metrics can be incorporated into aultimetric index, which approach otherwise is strongly supported
y the WFD (European Community, 2000). Because of the con-rasting trends observed in rhithral and potamal rivers (for HR1,
R2 and HR∞ metrics), development of detailed river typology andorrect classification of rivers are of crucial importance.As compared with biomass and sensitivity/tolerance metricshat are considered robust measures of the actual state of waters,
cators 45 (2014) 28–36 35
diversity metrics have higher uncertainties (Carvalho et al., 2013).On the other hand, when longer time periods are evaluated, changesin diversity (mostly changes in plane number of species) provideimportant information about the mechanisms that drive the sys-tems into positive or negative directions. Impoverishment of themicroflora caused by acidification or nutrient enrichment in thelast decades (Almer et al., 1974; Ruggiu et al., 1998) was a strikingindicator of the undesirable processes. Long-term studies on phy-toplankton diversity are also important in highlighting the trendsin species invasions (Kastovsky et al., 2010).
Our results are summarised as follows. We propose to use diver-sity metrics to assess the actual state of waters in the case ofrhithral, and large potamal rivers. Regarding the lakes, phytoplank-ton diversity metrics should be used for ecological state assessmentwhen long term trends are evaluated.
Acknowledgements
This work was funded by the OTKA Grant K104279 and by theBolyai János fellowship of the Hungarian Academy of Sciences. Thework was supported by TÁMOP-4.2.2 B-10 1-2010-0024, TAMOP-4.2.2.C-11/1/KONV-2012-0010 projects and by the European Unionand the State of Hungary, co-financed by the European Social Fundin the framework of TÁMOP 4.2.4. A/2-11-1-2012-0001 ‘NationalExcellence Program’. We would like to thank to Ministry of RuralDevelopment to make the data available for the analyses.
References
Adler, P.B., Seabloom, E.W., Borer, E.T., Hillebrand, H., Hautier, Y., Hector, A., et al.,2011. Productivity is a poor predictor of plant species richness. Science 333,1750–1753.
Almer, B., Dickson, W., Ekström, C., Hornström, E., Miller, U., 1974. Effects of acidifi-cation on Swedish lakes. AMBIO 3, 30–36.
Berger, W.H., Parker, F.L., 1970. Diversity of planktonic Foraminifera in deep seasediments. Science 168, 1345–1347.
Borics, G., Várbíró, G., Grigorszky, I., Krasznai, E., Szabó, S., Kiss, K.T., 2007. A newevaluation technique of potamo-plankton for the assessment of the ecologicalstatus of rivers. Arch. Hydrobiol. Suppl. 17, 465–486.
Borics, G., Várbíró, G., Tóthmérész, B., Lukács, B.A., 2012. Functional groups of phy-toplankton shaping diversity of shallow lake ecosystems. Hydrobiologia 698,251–262.
Borics, G., Várbíró, G., Padisák, J., 2013a. Disturbance and stress – different meaningsin ecological dynamics? Hydrobiologia 711, 1–7.
Borics, G., Nagy, L., Miron, S., Grigorszky, I., László-Nagy, Z., Lukács, B.A., Tóth,G.L., Várbíró, G., 2013b. Which factors affect phytoplankton biomass in shalloweutrophic lakes? Hydrobiologia 714, 93–104.
Bothár, A., Kiss, K.T., 1990. Phytoplankton and zooplankton (Cladocera, Copepoda)relationships in the eutrophicated River Danube (Danubialia Hungarica, CXI).Hydrobiologia 191, 165–171.
Carvalho, L., Poikane, S., Lyche Solheim, A., Phillips, G., Borics, G., Catalan, J., et al.,2013. Strength and uncertainty of phytoplankton metrics for assessing eutro-phication impacts in lakes. Hydrobiologia 704, 127–140.
Cardinale, B.J., Hillebrand, H., Harpole, W.S., Gross, K., Ptacnik, R., 2009. Sep-arating the influence of resource availability from resource imbalance onproductivity–diversity relationships. Ecol. Lett. 12, 475–487.
Chase, J.M., Leibold, M.A., 2002. Spatial scale dictates the productivity–biodiversityrelationship. Nature 416, 427–430.
Connell, J., 1978. Diversity in tropical rain forests and coral reefs. Science 199,1304–1310.
European Commission, 2000. Directive 2000/60/EC of the European Parliament andof the Council of 23rd October 2000 establishing a framework for Communityaction in the field of water policy. Official Journal of the European Communities,22 December, L 327/1. European Commission, Brussels.
European Commission, 2010. Guidance Document on the Intercalibration Process2008–2011. Guidance Document No. 14. Implementation Strategy for the WaterFramework Directive 2000/60/EC. Office for Official publications of the EuropeanCommunities, Luxembourg, 102 pp.
Fridley, J.D., Grime, J.P., Huston, M.A., Pierce, S., Smart, S.M., Thompson, K., et al.,2012. Comment on “Productivity is a poor predictor of plant species richness”.Science 335, 1441.
Gabriels, W., Lock, K., De Pauw, N., Goethals, P.L.M., 2010. Multimetric Macroinver-tebrate Index Flanders MMIF for biological assessment of rivers and lakes inFlanders Belgium. Limnologica 40, 199–207.
Grime, J.P., 2001. Plant Strategies, Vegetation Processes, and Ecosystem Properties.Wiley, Chichester.

3 al Indi
H
H
H
H
H
K
K
K
L
L
L
M
N
N
P
P
P
R
R
R
6 G. Borics et al. / Ecologic
acker, S.D., Gaines, S.D., 1997. Some implications of direct positive interactions forcommunity species diversity. Ecology 78, 1990–2003.
ambright, K.D., Zohary, T., 2000. Phytoplankton species diversity control throughexclusion and physical disturbances. Limnol. Oceanogr. 45, 110–122.
astie, T.J., Tibshirani, R.J., 1990. Generalized Additive Models. Chapman & Hall,London.
ering, D., Feld, C.K., Moog, O., Ofenböck, T., 2006. Cook book for the developmentof a multimetric index for biological condition of aquatic ecosystems: expe-riences from the European AQEM and STAR projects and related initiatives.Hydrobiologia 566, 311–324.
illebrand, H., Duerselen, C.D., Kirschtel, D., Pollingher, U., Zohary, T., 1999. Biovol-ume calculation for pelagic and benthic microalgae. J. Phycol. 35, 403–424.
astovsky, J., Hauer, T., Mares, J., Krautová, M., Besta, T., Komárek, J., et al., 2010. Areview of the alien and expansive species of freshwater cyanobacteria and algaein the Czech Republic. Biol. Invasions 12, 3599–3625.
iss, K.T., Genkal, S.I., 1993. Winter blooms of centric diatoms in the RiverDanube and its side arms near Budapest Hungary. Hydrobiologia 269/270,317–325.
ronvang, B., Hoffmann, C.C., Svendsen, L.M., Windolf, J., Jensen, J.P., Dorge, J., 1999.Retention of nutrients in river basins. Aquat. Ecol. 33, 29–40.
avaud, J., Lepetit, B., 2013. An explanation for the inter-species variability ofthe photoprotective non-photochemical chlorophyll fluorescence quenching indiatoms. Biochim. Biophys. Acta Bioenerg. 1827, 294–302.
eland, H.V., 2003. The influence of water depth and flow regime on phytoplanktonbiomass and community structure in a shallow, lowland river. Hydrobiologia506–509, 247–255.
und, J.W.G., Kipling, C., Le Cren, E.D., 1958. The inverted microscope method ofestimating algal numbers and the statistical basis of estimations by counting.Hydrobiologia 11, 143–170.
ittelbach, G.G., Steiner, C.F., Scheiner, S.M., Gross, K.L., Reynolds, H.L., Waide, R.B.,et al., 2001. What is the observed relationship between species richness andproductivity? Ecology 82, 2381–2396.
agelkerke, N., 1991. A note on a general definition of the coefficient of determina-tion. Biometrika 78, 691–692.
aselli-Flores, L., Padisák, J., Dokulil, M.T., Chorus, I., 2003. Equilibrium/steady-stateconcept in phytoplankton ecology. Hydrobiologia 502, 395–403.
adisák, J., G-Tóth, L., Rajczy, M., 1988. The role of storms in the summer successionof phytoplankton in a shallow lake Lake Balaton, Hungary. J. Plankton Res. 10,249–265.
adisák, J., Crossetti, L.O., Naselli-Flores, L., 2009. Use and misuse in the applicationof the phytoplankton functional classification: a critical review with updates.Hydrobiologia 621, 1–19.
eet, R.K., 1974. The measurement of species diversity. Annu. Rev. Ecol. Systemat. 5,285–307.
ényi, A.,1961. On measures of entropy and information. In: Berkeley Symp. onMath. Statist. and Prob., Proc. Fourth Berkeley Symp. on PC Math. Statist.and Prob., vol. 1. Univ. of Calif. Press, pp. 547–561 http://projecteuclid.org/euclid.bsmsp/1200512181
eynolds, C.S., Descy, J.P., Padisák, J., 1994. Are phytoplankton dynamics in rivers sodifferent from those in shallow lakes? Hydrobiologia 289, 1–7.
eynolds, C.S., Huszar, V., Kruk, C., Naselli-Flores, L., Melo, S., 2002. Towards afunctional classification of the freshwater phytoplankton. J. Plankton Res. 24,417–428.
cators 45 (2014) 28–36
Rojo, C., Cobelas, M.A., Arauzo, M., 1994. An elementary, structural analysis of riverphytoplankton. Hydrobiologia 289, 43–55.
Ruggiu, D., Morabito, G., Panzani, P., Pugnetti, A., 1998. Trends and relationsamong basic phytoplankton characteristics in the course of the long-term oligo-trophication of Lake Maggiore Italy. Hydrobiologia 369/370, 243–257.
Schmidt, A., 1994. Main characteristics of phytoplankton of the southern Hungariansection of the River Danube. Hydrobiologia 289, 97–108.
Sellers, T., Bukaveckas, P.A., 2003. Phytoplankton production in a large, regu-lated river: a modeling and mass balance assessment. Limnol. Oceanogr.,1476–1487.
Shannon, C.E., 1948. A mathematical theory of communication. Bell Syst. Tech. J. 27,379–423, 623–656.
Skácelová, O., Leps, J., 2014. The relationship of diversity and biomass in phy-toplankton communities weakens when accounting for species proportions.Hydrobiologia 724, 67–77, http://dx.doi.org/10.1007/s10750-013-1723-2.
Sommer, U., 1984. The paradox of plankton: fluctuations of phosphorus availabilitymaintain diversity in flow-through cultures. Limnol. Oceanogr. 29, 633–636.
Sonneman, J.A., Walsh, C.J., Breen, P.F., Sharpe, A.K., 2001. Effects of urbanization onstreams of the Melbourn region, Victoria, Australia. II. Benthic diatom commu-nities. Freshwater Biol. 46, 553–565.
Stankovic, I., Vlahovic, T., Udovic, M.G., Várbíró, G., Borics, G., 2012. Phytoplanktonfunctional and morphofunctional approach in large foodplain rivers. Hydrobi-ologia 698, 217–231.
Stevenson, R.J., Hill, B.E., Herlihy, A.T., Yuan, L.L., Norton, S.B., 2008. Algae–Prelationships, thresholds, and frequency distributions guide nutrient criteriondevelopment. J. North Am. Benthol. Soc. 27, 259–275.
Stoddard, J.L., Herlihy, A.T., Peck, D.V., Hughes, R.M., Whittier, T.R., Tarquinio, E.,2008. A process for creating multimetric indices for large-scale aquatic surveys.J. North Am. Benthol. Soc. 27, 878–891.
Ter Braak, C.J.F., Smilauer, P., 2002. Canoco Reference Manual and User’s Guide:Software for Ordination Version 5.0. Microcomputer Power, Ithaca, NY.
Thorp, J.H., Delong, M.D., Greenwood, K.S., Casper, A.F., 1998. Isotopic analysis ofthree food web theories in constricted and floodplain regions of a large river.Oecologia 117, 551–563.
Tóthmérész, B., 1995. Comparison of different methods for diversity ordering. J. Veg.Sci. 6, 283–290.
Tóthmérész, B., 1998. On the characterization of scale-dependent diversity. Abstr.Bot. 22, 149–156.
Van Dam, H., Stenger-Kovács, C., Ács, É., Borics, G., Buczkó, K., Hajnal, É., et al., 2007.Implementation of the European Water Framework Directive: development of asystem for water quality assessment of Hungarian running waters with diatoms.Arch. Hydrobiol. 161, 339–383.
Várbíró, G., Ács, É., Borics, G., Érces, K., Fehér, G., Grigorszky, I., et al., 2007. Useof Self-Organising Maps SOM for characterization of riverine phytoplanktonassociations in Hungary. Arch. Hydrobiol. Suppl. 161, 383–394.
Várbíró, G., Borics, G., Csányi, B., Fehér, G., 2012. Improvement of the ecologicalwater qualification system of rivers based on the first results of the Hungarianphytobenthos surveillance monitoring. Hydrobiologia 695, 125–135.
Vörös, L., Balogh, K.V., Herodek, S., Kiss, K.T., 2000. Underwater light conditions, phy-toplankton photosynthesis and bacterioplankton production in the Hungariansection of the River Danube. Arch. Hydrobiol. 11, 511–532.
Wehr, J.D., Descy, J.-P., 1998. Use of phytoplankton in large river management.J. Phycol. 34, 741–749.
Copyright © 2022 FDOKUMEN