Do cyanobacteria dominate in eutrophic lakes because they fix atmospheric nitrogen?
Upload
independentCategory
view
2download
0
PRIMARY RESEARCH PAPER
Phytoplankton seasonal variation in a shallow stratifiedeutrophic reservoir (Garcas Pond, Brazil)
Barbara M. Fonseca Æ Carlos E. de M. Bicudo
Received: 10 July 2007 / Revised: 1 November 2007 / Accepted: 12 November 2007 / Published online: 5 December 2007
� Springer Science+Business Media B.V. 2007
Abstract This study aimed at describing the
phytoplankton dynamics and structure in a shallow
eutrophic reservoir, the Garcas Pond, located in the
Parque Estadual das Fontes do Ipiranga (23�38040.600
S, 46�37028.000 W), in the Municipality of Sao Paulo,
southeast Brazil. Samples were collected monthly
from January to December 1997 in five depths
(subsurface, 1 m, 2 m, 3 m, and 20 cm above the
bottom) in the pelagic zone (Zmax = 4.7 m). Abiotic
variables studied were: water temperature, turbidity,
transparency, conductivity, pH, dissolved oxygen,
alkalinity, inorganic carbon, and N and P dissolved
and total forms. Altogether 236 phytoplankton taxa
distributed among 10 classes were identified. Phyto-
plankton seasonal and vertical variation was related
to shifts in the water chemical features as a conse-
quence of a warm-wet season with stratified water
column (phase 1, January–March and September–
December) alternating with a cool-dry season with
mixed water column (phase 2, April–August). There
were shifts in cyanobacterial dominance over the
entire year. During phase 1, Raphidiopsis/Cylindro-
spermopsis was one of the most important taxon.
During phase 2, Raphidiopsis/Cylindrospermopsis
biomass decreased, whereas richness and diversity
increased and diatoms were relatively abundant. In
September, when the water column was markedly
stratified, a cyanobacterial bloom (Sphaerocavum
brasiliense) occurred. Changes in water chemical
variables caused by the bloom allowed recognition of
a phase 3, in which pH and chlorophyll a, TP and
CO32- concentration reached their highest values.
According to Reynolds and collaborators’ functional
groups approach, phase 1 was marked by groups S/
W1/W2/H1/Y, phase 2 by groups K/LM/LO/D/P/X1/
F, and phase 3 by group M. This sequence was
corroborated by canonical correspondence analysis
(CCA) results.
Keywords Community structure and dynamics �Functional groups � Sphaerocavum brasiliense �Raphidiopsis mediterranea �Cylindrospermopsis raciborskii
Introduction
During the last two decades, shallow lakes metabo-
lism was frequently addressed (Scheffer, 1998;
Scheffer & van Nes, 2007). Their responses to
eutrophication can be catastrophic, mainly due to
Handling editor: J. Padisak
B. M. Fonseca (&)
Curso de Ciencias Biologicas, Universidade Catolica
de Brasılia, QS 07, Lote 1, Aguas Claras, Brasilia, DF
71966-700, Brazil
e-mail: [email protected]
C. E. de M. Bicudo
Instituto de Botanica, Secao de Ecologia, Caixa postal
3005, Sao Paulo, SP 01061-970, Brazil
123
Hydrobiologia (2008) 600:267–282
DOI 10.1007/s10750-007-9240-9
the intense water–sediment interaction (Bicudo et al.,
2007). Padisak & Reynolds (2003) discussed the role
of the ecosystem depth in its functioning and
introduced the concept of functional shallowness
applied to discontinuously mixed water bodies.
According to the latter authors, however, some
systems shallower than 10 m can stratify and behave
like deep lakes. Therefore, shallowness is not a
function only of the system’s absolute depth value,
since factors such as basin morphology and shelter
degree also have to be considered.
Some functional shallow lakes do not fit into the
classical relationship models among biomass, phyto-
plankton composition, and nutrient supply (Jensen
et al., 1994). Phytoplankton community structure
responds to trophic and seasonal gradient through
changes in species composition and quantitative
ecological traits as biomass, species richness, and
diversity (Watson et al., 1997). Quantification of
these ecological processes is essential for the estab-
lishment of predictive models applied to natural
communities (Reynolds, 2006). An increasing num-
ber of authors have emphasized species’ morpho-
functional attributes as important tools in phyto-
plankton dynamics studies (Huszar & Caraco, 1998;
Reynolds et al., 2002; Salmaso & Padisak, 2007).
Many studies described temporal phytoplankton
patterns in lakes with varying mixing regimes.
These include functional shallow lakes such as
Balaton (Zmax = 11 m; Padisak, 1992) and Rodo
(Zmax = 2.5 m; Kruk et al., 2002), as well as
functional deep lakes as Garda (Zmax = 350 m;
Salmaso, 2003) and Maggiore (Zmax = 370 m; Mor-
abito et al., 2003). Notwithstanding, this matter is
far from being exhausted. Accelerated rates of
anthropogenic eutrophication are continuously
demanding management strategies applied to eutro-
phic reservoirs, with particular emphasis to those in
tropical countries.
In Brazil, phytoplankton communities from eutro-
phic urban reservoirs such as Guarapiranga (Beyruth,
2000), Billings (Carvalho et al., 1997), Pampulha
(Figueredo & Giani, 2001), and Paranoa (Branco &
Senna, 1996) are among the most studied ones.
Recently, hypereutrophic lakes from the northeastern
region of the country, as the Tapacura (Bouvy et al.,
2003) and the Gargalheiras (Chellapa & Costa, 2003)
have also been explored, mainly after Caruaru’s
incident, when people died as a consequence of liver
failure caused by microcystin toxin from cyanobac-
terial blooms (Komarek et al., 2001).
Garcas Pond phytoplankton was already described
from various aspects like taxonomy (Azevedo &
Sant’Anna, 1999, 2003; Komarek & Azevedo, 2000;
Tucci et al., 2006), ecology (Sant’Anna et al., 1989,
1997; Ramırez & Bicudo, 2002; Tucci, 2002; Tucci
& Sant’Anna, 2003; Fonseca, 2005; Ramırez &
Bicudo, 2005; Crossetti & Bicudo, 2005a, b; Cros-
setti, 2006) and toxicology (Sant’Anna & Azevedo,
2000). The reservoir’s limnological features changed
substantially over the last 10 years, especially due to
the undesirable side effects of the water hyacinth
control. Bicudo et al. (2007) described the mecha-
nisms underlying limnological variations in the
reservior during the period 1997–2004.
Present article aims at describing the phytoplank-
ton seasonal and vertical variation in the Garcas
Pond, with emphasis on its dynamics and structure
before the water hyacinth proliferation and in relation
to the abiotic environment.
Study area
Garcas Pond (23�38040.600 S, 46�37028.000 W) is
located in the Parque Estadual das Fontes do Ipiranga
Biological Reserve (PEFI; 526 ha; 798 m.a.s.l) situ-
ated in the Municipality of Sao Paulo, southeastern
Brazil. See Bicudo et al. (2007) and Crossetti &
Bicudo (2005a) for site location. The mean annual
precipitation is 1,368 mm, the mean air temperature
of the coldest month (July) is 15�C, and the mean
temperature of the warmest months (January–Febru-
ary) is 21.4–21.6�C (Santos & Funari, 2002). Climate
of the area is tropical (Conti & Furlan, 2003) and
wind speed is commonly low (\2.5 m s-1).
Although locally called Garcas Pond, the water
body is, in fact, a reservoir recently classified as
eutrophic/hypereutrophic (Bicudo et al., 2006). It has
a surface area of 88,156 m2, a volume of 188,785 m3,
a mean depth of 2.1 m, a maximum depth of 4.7 m, a
mean theoretical residence time of 71 days (Bicudo
et al., 2002) and is polymictic according to Lewis’
classification (Bicudo et al., 2002). Garcas Pond has
one outlet and seven tributaries, four of which carring
sewage (Henry et al., 2004).
268 Hydrobiologia (2008) 600:267–282
123
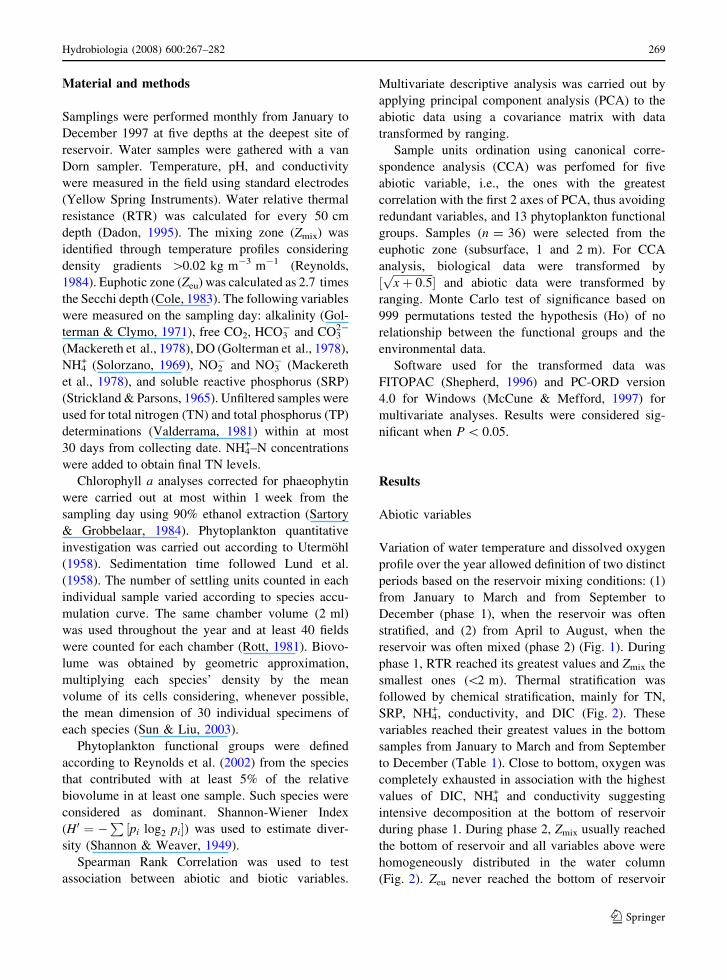
Material and methods
Samplings were performed monthly from January to
December 1997 at five depths at the deepest site of
reservoir. Water samples were gathered with a van
Dorn sampler. Temperature, pH, and conductivity
were measured in the field using standard electrodes
(Yellow Spring Instruments). Water relative thermal
resistance (RTR) was calculated for every 50 cm
depth (Dadon, 1995). The mixing zone (Zmix) was
identified through temperature profiles considering
density gradients [0.02 kg m-3 m-1 (Reynolds,
1984). Euphotic zone (Zeu) was calculated as 2.7 times
the Secchi depth (Cole, 1983). The following variables
were measured on the sampling day: alkalinity (Gol-
terman & Clymo, 1971), free CO2, HCO3- and CO3
2-
(Mackereth et al., 1978), DO (Golterman et al., 1978),
NH4+ (Solorzano, 1969), NO2
- and NO3- (Mackereth
et al., 1978), and soluble reactive phosphorus (SRP)
(Strickland & Parsons, 1965). Unfiltered samples were
used for total nitrogen (TN) and total phosphorus (TP)
determinations (Valderrama, 1981) within at most
30 days from collecting date. NH4+–N concentrations
were added to obtain final TN levels.
Chlorophyll a analyses corrected for phaeophytin
were carried out at most within 1 week from the
sampling day using 90% ethanol extraction (Sartory
& Grobbelaar, 1984). Phytoplankton quantitative
investigation was carried out according to Utermohl
(1958). Sedimentation time followed Lund et al.
(1958). The number of settling units counted in each
individual sample varied according to species accu-
mulation curve. The same chamber volume (2 ml)
was used throughout the year and at least 40 fields
were counted for each chamber (Rott, 1981). Biovo-
lume was obtained by geometric approximation,
multiplying each species’ density by the mean
volume of its cells considering, whenever possible,
the mean dimension of 30 individual specimens of
each species (Sun & Liu, 2003).
Phytoplankton functional groups were defined
according to Reynolds et al. (2002) from the species
that contributed with at least 5% of the relative
biovolume in at least one sample. Such species were
considered as dominant. Shannon-Wiener Index
(H0 ¼ �P½pi log2 pi�) was used to estimate diver-
sity (Shannon & Weaver, 1949).
Spearman Rank Correlation was used to test
association between abiotic and biotic variables.
Multivariate descriptive analysis was carried out by
applying principal component analysis (PCA) to the
abiotic data using a covariance matrix with data
transformed by ranging.
Sample units ordination using canonical corre-
spondence analysis (CCA) was perfomed for five
abiotic variable, i.e., the ones with the greatest
correlation with the first 2 axes of PCA, thus avoiding
redundant variables, and 13 phytoplankton functional
groups. Samples (n = 36) were selected from the
euphotic zone (subsurface, 1 and 2 m). For CCA
analysis, biological data were transformed by
½ffiffiffiffiffiffiffiffiffiffiffiffiffiffiffixþ 0:5p
� and abiotic data were transformed by
ranging. Monte Carlo test of significance based on
999 permutations tested the hypothesis (Ho) of no
relationship between the functional groups and the
environmental data.
Software used for the transformed data was
FITOPAC (Shepherd, 1996) and PC-ORD version
4.0 for Windows (McCune & Mefford, 1997) for
multivariate analyses. Results were considered sig-
nificant when P \ 0.05.
Results
Abiotic variables
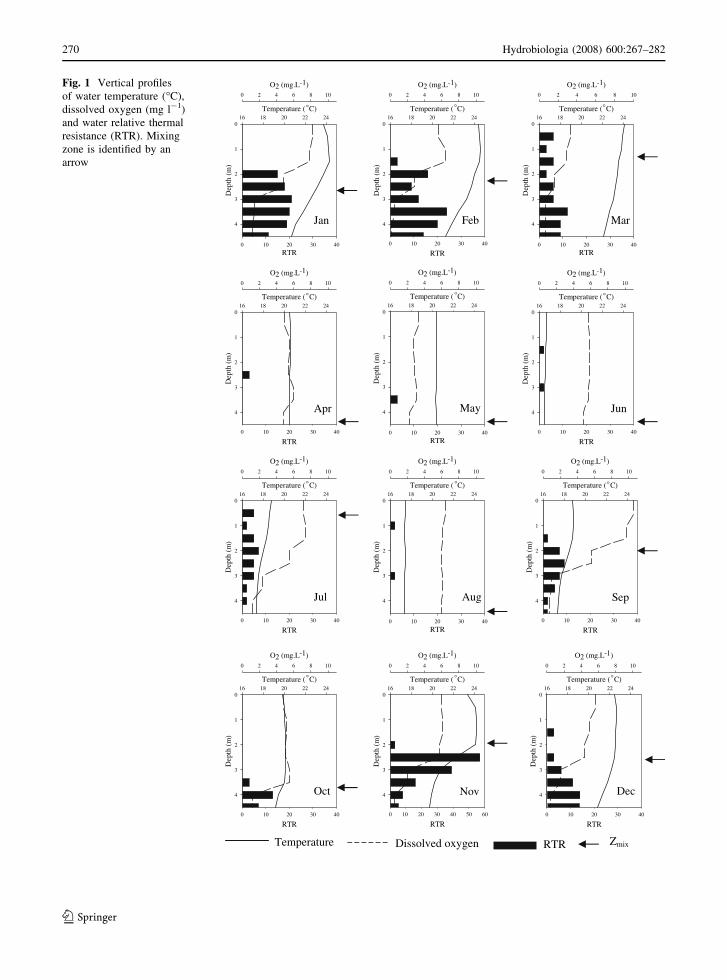
Variation of water temperature and dissolved oxygen
profile over the year allowed definition of two distinct
periods based on the reservoir mixing conditions: (1)
from January to March and from September to
December (phase 1), when the reservoir was often
stratified, and (2) from April to August, when the
reservoir was often mixed (phase 2) (Fig. 1). During
phase 1, RTR reached its greatest values and Zmix the
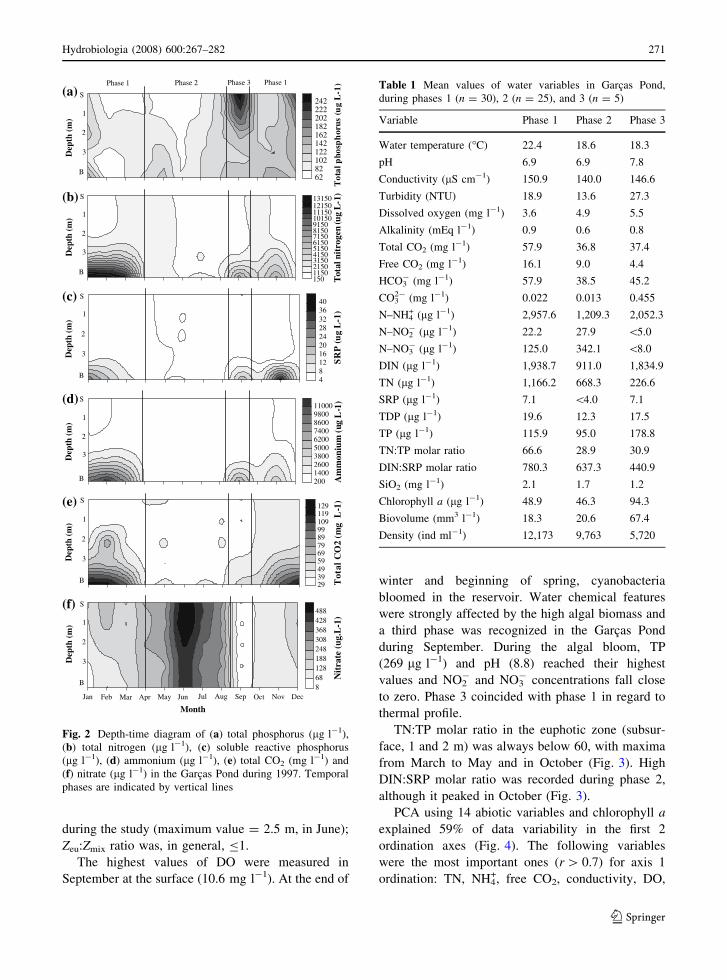
smallest ones (\2 m). Thermal stratification was
followed by chemical stratification, mainly for TN,
SRP, NH4+, conductivity, and DIC (Fig. 2). These
variables reached their greatest values in the bottom
samples from January to March and from September
to December (Table 1). Close to bottom, oxygen was
completely exhausted in association with the highest
values of DIC, NH4+ and conductivity suggesting
intensive decomposition at the bottom of reservoir
during phase 1. During phase 2, Zmix usually reached
the bottom of reservoir and all variables above were
homogeneously distributed in the water column
(Fig. 2). Zeu never reached the bottom of reservoir
Hydrobiologia (2008) 600:267–282 269
123
RTR0 10 20 30 40
)m( htpe
D
0
1
2
3
4
Temperature (°C)16 18 20 22 24
O2 (mg.L-1)0 2 4 6 8 10
Jan
Temperature (°C)16 18 20 22 24
)m( htpe
D
0
1
2
3
4
O2 (mg.L-1)0 2 4 6 8 10
RTR0 10 20 30 40
Feb
Temperature (°C)16 18 20 22 24
)m( htpe
D
0
1
2
3
4
O2 (mg.L-1)0 2 4 6 8 10
RTR0 10 20 30 40
Mar
Temperature (°C)16 18 20 22 24
)m( htpe
D
0
1
2
3
4
O2 (mg.L-1)0 2 4 6 8 10
RTR0 10 20 30 40
Apr
Temperature (°C)16 18 20 22 24
)m( htpe
D
0
1
2
3
4
O2 (mg.L-1)0 2 4 6 8 10
RTR0 10 20 30 40
May
Temperature (°C)16 18 20 22 24
)m( htpe
D
0
1
2
3
4
O2 (mg.L-1)0 2 4 6 8 10
RTR0 10 20 30 40
Jun
Temperature (°C)16 18 20 22 24
)m( htpe
D
0
1
2
3
4
O2 (mg.L-1)0 2 4 6 8 10
RTR0 10 20 30 40
Jul
RTR0 10 20 30 40
)m( htpe
D
0
1
2
3
4
Temperature ( °C)16 18 20 22 24
O2 (mg.L-1)0 2 4 6 8 10
Aug
Temperature (°C)16 18 20 22 24
)m( htpe
D
0
1
2
3
4
O2 (mg.L-1)0 2 4 6 8 10
RTR0 10 20 30 40
Sep
Temperature (°C)16 18 20 22 24
)m( htpe
D
0
1
2
3
4
O2 (mg.L-1)0 2 4 6 8 10
RTR0 10 20 30 40
Oct
Temperature (°C)16 18 20 22 24
)m( htpe
D
0
1
2
3
4
O2 (mg.L-1)0 2 4 6 8 10
RTR0
Nov
Temperature (°C)16 18 20 22 24
)m( htpe
D
0
1
2
3
4
O2 (mg.L-1)0 2 4 6 8 10
RTR0 10 20 30 40
Dec
Temperature RTRDissolved oxygen Zmix
10 20 30 40 50 60
Fig. 1 Vertical profiles
of water temperature (�C),
dissolved oxygen (mg l-1)
and water relative thermal
resistance (RTR). Mixing
zone is identified by an
arrow
270 Hydrobiologia (2008) 600:267–282
123
during the study (maximum value = 2.5 m, in June);
Zeu:Zmix ratio was, in general, B1.
The highest values of DO were measured in
September at the surface (10.6 mg l-1). At the end of
winter and beginning of spring, cyanobacteria
bloomed in the reservoir. Water chemical features
were strongly affected by the high algal biomass and
a third phase was recognized in the Garcas Pond
during September. During the algal bloom, TP
(269 lg l-1) and pH (8.8) reached their highest
values and NO2- and NO3
- concentrations fall close
to zero. Phase 3 coincided with phase 1 in regard to
thermal profile.
TN:TP molar ratio in the euphotic zone (subsur-
face, 1 and 2 m) was always below 60, with maxima
from March to May and in October (Fig. 3). High
DIN:SRP molar ratio was recorded during phase 2,
although it peaked in October (Fig. 3).
PCA using 14 abiotic variables and chlorophyll a
explained 59% of data variability in the first 2
ordination axes (Fig. 4). The following variables
were the most important ones (r [ 0.7) for axis 1
ordination: TN, NH4+, free CO2, conductivity, DO,
D
epth
(m
)
Dep
th (
m)
D
epth
(m
)
Dep
th (
m)
Dep
th (
m)
Dep
th (
m)
S
1
6282102122142162182202222242
2
3
B
)1-L g
u( or
ush
psohp lato
T
S
1
15011502150315041505150615071508150915010150111501215013150
2
3
B
Tni
trog
en lato
)1-L gu(
S
1
481216202428323640
2
3
B
SR
u( P
g)1-
L
S
1
2001400260038005000620074008600980011000
2
3
B Am
mon
ium
) 1-
L gu(
S
1
2939495969798999109119129
2
3
B
m( 2O
C latoT
g)1-
L
Month
S
1
Jan868128188248308368428488
2
3
B
Feb Mar Apr May Jul Aug Sep Oct Nov Dec
)1-L.gu( etar ti
N
Phase 1 Phase 2 Phase 3 Phase 1
Jun
(a)
(b)
(c)
(d)
(e)
(f)
Fig. 2 Depth-time diagram of (a) total phosphorus (lg l-1),
(b) total nitrogen (lg l-1), (c) soluble reactive phosphorus
(lg l-1), (d) ammonium (lg l-1), (e) total CO2 (mg l-1) and
(f) nitrate (lg l-1) in the Garcas Pond during 1997. Temporal
phases are indicated by vertical lines
Table 1 Mean values of water variables in Garcas Pond,
during phases 1 (n = 30), 2 (n = 25), and 3 (n = 5)
Variable Phase 1 Phase 2 Phase 3
Water temperature (�C) 22.4 18.6 18.3
pH 6.9 6.9 7.8
Conductivity (lS cm-1) 150.9 140.0 146.6
Turbidity (NTU) 18.9 13.6 27.3
Dissolved oxygen (mg l-1) 3.6 4.9 5.5
Alkalinity (mEq l-1) 0.9 0.6 0.8
Total CO2 (mg l-1) 57.9 36.8 37.4
Free CO2 (mg l-1) 16.1 9.0 4.4
HCO3- (mg l-1) 57.9 38.5 45.2
CO32- (mg l-1) 0.022 0.013 0.455
N–NH4+ (lg l-1) 2,957.6 1,209.3 2,052.3
N–NO2- (lg l-1) 22.2 27.9 \5.0
N–NO3- (lg l-1) 125.0 342.1 \8.0
DIN (lg l-1) 1,938.7 911.0 1,834.9
TN (lg l-1) 1,166.2 668.3 226.6
SRP (lg l-1) 7.1 \4.0 7.1
TDP (lg l-1) 19.6 12.3 17.5
TP (lg l-1) 115.9 95.0 178.8
TN:TP molar ratio 66.6 28.9 30.9
DIN:SRP molar ratio 780.3 637.3 440.9
SiO2 (mg l-1) 2.1 1.7 1.2
Chlorophyll a (lg l-1) 48.9 46.3 94.3
Biovolume (mm3 l-1) 18.3 20.6 67.4
Density (ind ml-1) 12,173 9,763 5,720
Hydrobiologia (2008) 600:267–282 271
123
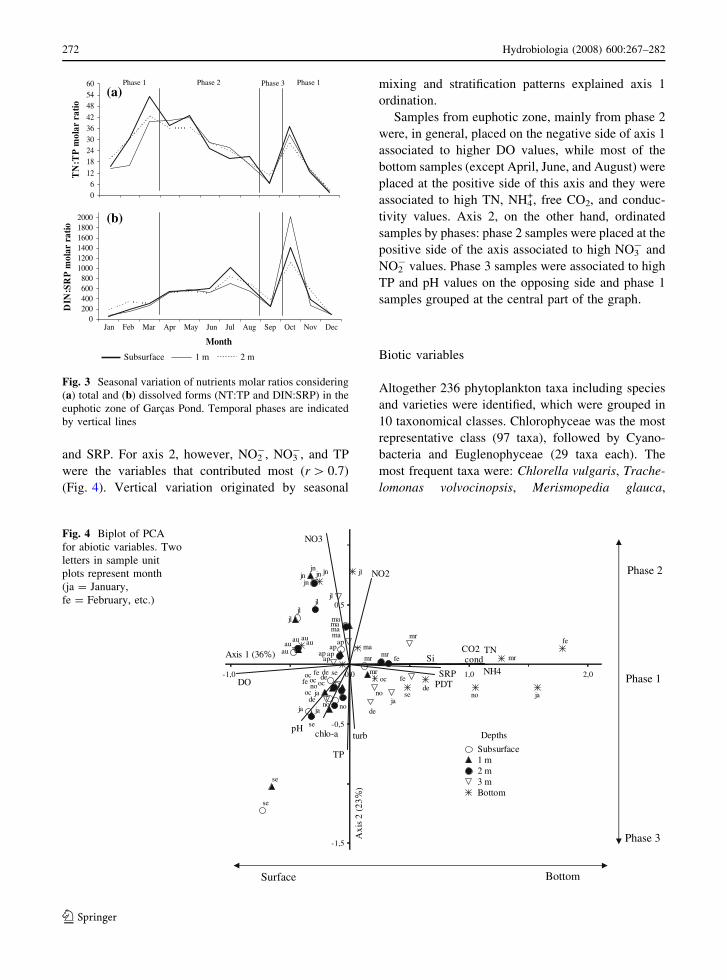
and SRP. For axis 2, however, NO2-, NO3
-, and TP
were the variables that contributed most (r [ 0.7)
(Fig. 4). Vertical variation originated by seasonal
mixing and stratification patterns explained axis 1
ordination.
Samples from euphotic zone, mainly from phase 2
were, in general, placed on the negative side of axis 1
associated to higher DO values, while most of the
bottom samples (except April, June, and August) were
placed at the positive side of this axis and they were
associated to high TN, NH4+, free CO2, and conduc-
tivity values. Axis 2, on the other hand, ordinated
samples by phases: phase 2 samples were placed at the
positive side of the axis associated to high NO3- and
NO2- values. Phase 3 samples were associated to high
TP and pH values on the opposing side and phase 1
samples grouped at the central part of the graph.
Biotic variables
Altogether 236 phytoplankton taxa including species
and varieties were identified, which were grouped in
10 taxonomical classes. Chlorophyceae was the most
representative class (97 taxa), followed by Cyano-
bacteria and Euglenophyceae (29 taxa each). The
most frequent taxa were: Chlorella vulgaris, Trache-
lomonas volvocinopsis, Merismopedia glauca,
06
12
1824303642
485460
oitar ralom
PT:
NT
0200400600800
100012001400160018002000
Jan
Month
oitar ralom
PRS:
NID
Phase 1 Phase 2 Phase 3 Phase 1
1 m 2 m Subsurface
Feb Mar Apr May Jun Jul Aug Sep Oct Nov Dec
(a)
(b)
Fig. 3 Seasonal variation of nutrients molar ratios considering
(a) total and (b) dissolved forms (NT:TP and DIN:SRP) in the
euphotic zone of Garcas Pond. Temporal phases are indicated
by vertical lines
ja
fe
mr
ap
ma
jn
jl
au
se
oc
no
de
ja
femr
ap
ma
jn
jl
au
se
oc
no
de
ja
femrap
ma
jn
jl
au
se
oc
no
de
ja
fe
mr
ap
ma
jn
jl
au
se
oc no
de
ja
fe
mrap
ma
jn jl
au
se
oc
node
pH
cond
turb
DO
NO2
NO3
NH4
TN
SRPPDT
TP
SiCO2
chlo-a
-1,0
-1,5
0,0 1,0 2,0
-0,5
0,5
Axis 1 (36%)
)% 32( 2 si x
A
Depths
Subsurface1 m2 m3 mBottom
Phase 1
Phase 3
Phase 2
Surface Bottom
Fig. 4 Biplot of PCA
for abiotic variables. Two
letters in sample unit
plots represent month
(ja = January,
fe = February, etc.)
272 Hydrobiologia (2008) 600:267–282
123
Microcystis aeruginosa, Sphaerocavum brasiliense,
Monoraphidium contortum, Cryptomonas erosa, and
Aphanocapsa elachista, which were present in more
than 90% of samples.
Chlorophyll a mean annual value (n = 60) was
51.6 lg l-1 and it maximized in September during
the cyanobacterial bloom at 218.3 lg l-1. Density
and biovolume annual mean values (n = 60) were,
respectively, 10,683 ind ml-1 and 23 mm3 l-1.
Greatest density values were measured in January
(45,269 ind ml-1) (phase 1), whereas the greatest
biovolume one (148 mm3 l-1) was registered during
the cyanobacterial bloom, in September (phase 3).
The maximum values of chlorophyll a, density, and
biovolume were all measured at the subsurface. In
general, higher values of these variables were
observed between subsurface and 2 m depth, mainly
during phases 1 and 3, when the water column was
thermally and chemically stratified.
Species richness was high during phases 1 and 2,
with a mean of 55. During phase 1, richness vertical
profile followed the thermal one, decreasing sharply
from subsurface to the bottom of reservoir. During
phase 2, however, stratification being absent, richness
values were homogeneous throughout the entire
water column, although the euphotic zone did not
reach the 3 m. The highest diversity was found in
phase 2 with a maximum of 3.83 bits mm-3, in June,
2 m. Phase 3 showed the lowest diversity values,
especially in the September subsurface sample
(0.36 bits mm-3).
Cyanobacteria contributed most to phytoplankton
biovolume due to their bloom in September. They were
positively correlated with pH (rs = 0.6), temperature
(rs = 0.5), DO (rs = 0.6) and TP (rs = 0.7), and
negatively with NO3- (rs = -0.6), NO2
- (rs = -0.6),
TN (rs = -0.4), NH4+ (rs = -0.4), NT:TP ratio
(rs = -0.6) and free CO2 (rs = -0.5).
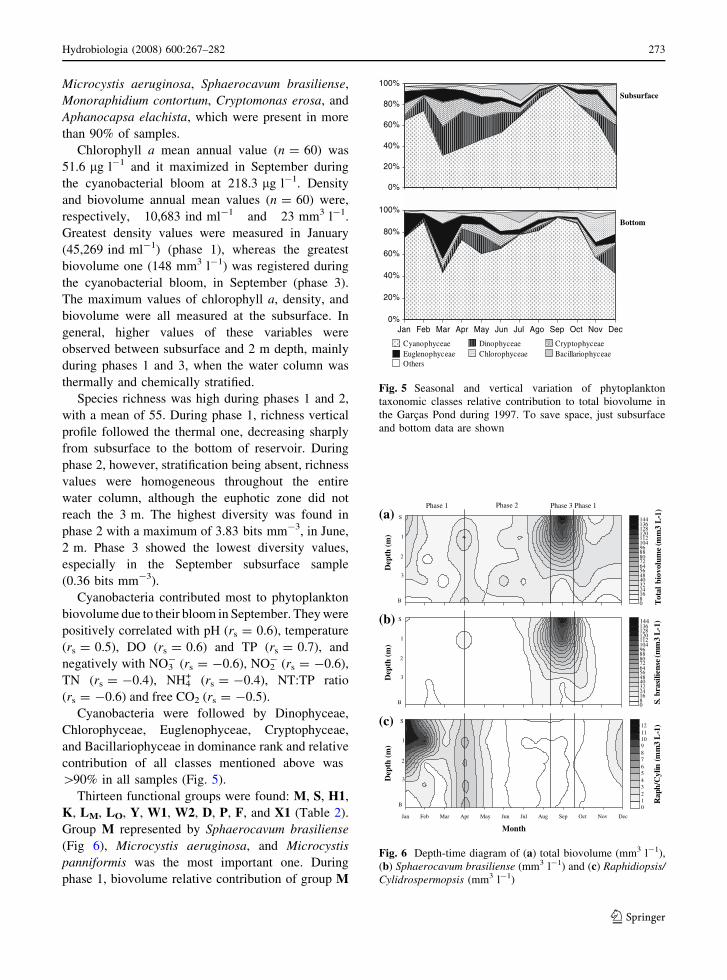
Cyanobacteria were followed by Dinophyceae,
Chlorophyceae, Euglenophyceae, Cryptophyceae,
and Bacillariophyceae in dominance rank and relative
contribution of all classes mentioned above was
[90% in all samples (Fig. 5).
Thirteen functional groups were found: M, S, H1,
K, LM, LO, Y, W1, W2, D, P, F, and X1 (Table 2).
Group M represented by Sphaerocavum brasiliense
(Fig 6), Microcystis aeruginosa, and Microcystis
panniformis was the most important one. During
phase 1, biovolume relative contribution of group M
0%
20%
40%
60%
80%
100%
0%
20%
40%
60%
80%
100%
Jan
Cyanophyceae Dinophyceae CryptophyceaeEuglenophyceae Chlorophyceae BacillariophyceaeOthers
Subsurface
Bottom
Feb Mar Apr May Jun Jul Ago Sep Oct Nov Dec
Fig. 5 Seasonal and vertical variation of phytoplankton
taxonomic classes relative contribution to total biovolume in
the Garcas Pond during 1997. To save space, just subsurface
and bottom data are shown
Dep
th (
m)
Dep
th (
m)
Dep
th (
m)
S
1
081624324048566472808896104112120128136144
2
3
B
biov
olum
e l ato
T( m
m)1-
L 3
S
1
081624324048566472808896104112120128136144
2
3
B
. bra
silie
nse
S( m
m)1 -
L 3
Month
S
1
Jan
0123456789101112
2
3
B
Feb May Jul Sep Oct Nov
R( nily
C/ h pam
m)1 -
L 3
Phase 1 Phase 2 Phase 3 Phase 1
Mar Apr Jun Aug Dec
(a)
(b)
(c)
Fig. 6 Depth-time diagram of (a) total biovolume (mm3 l-1),
(b) Sphaerocavum brasiliense (mm3 l-1) and (c) Raphidiopsis/Cylidrospermopsis (mm3 l-1)
Hydrobiologia (2008) 600:267–282 273
123
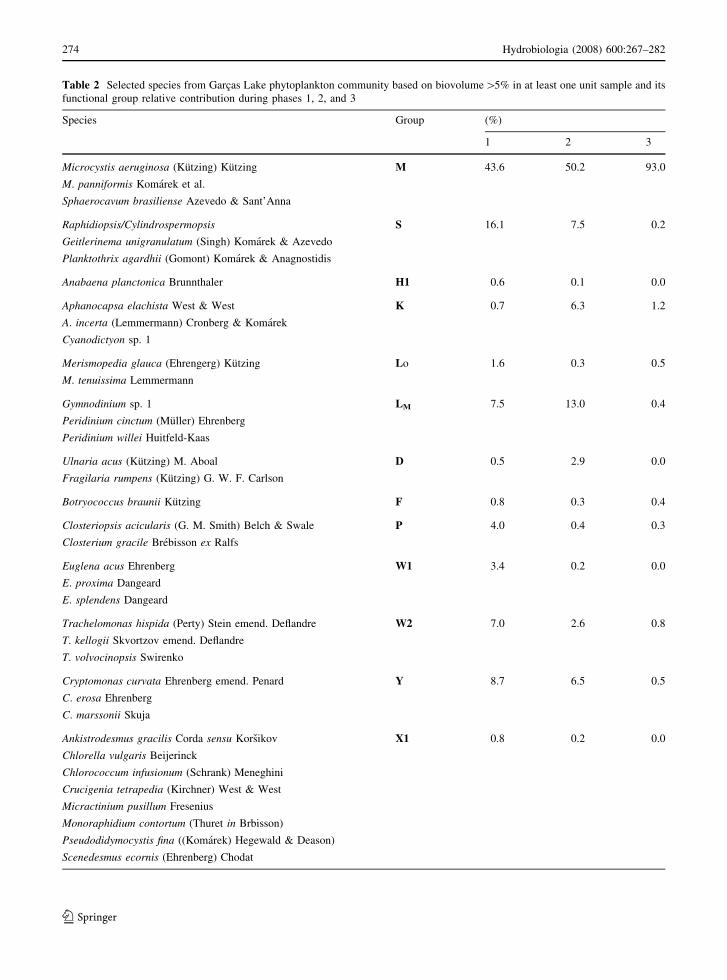
Table 2 Selected species from Garcas Lake phytoplankton community based on biovolume[5% in at least one unit sample and its
functional group relative contribution during phases 1, 2, and 3
Species Group (%)
1 2 3
Microcystis aeruginosa (Kutzing) Kutzing M 43.6 50.2 93.0
M. panniformis Komarek et al.
Sphaerocavum brasiliense Azevedo & Sant’Anna
Raphidiopsis/Cylindrospermopsis S 16.1 7.5 0.2
Geitlerinema unigranulatum (Singh) Komarek & Azevedo
Planktothrix agardhii (Gomont) Komarek & Anagnostidis
Anabaena planctonica Brunnthaler H1 0.6 0.1 0.0
Aphanocapsa elachista West & West K 0.7 6.3 1.2
A. incerta (Lemmermann) Cronberg & Komarek
Cyanodictyon sp. 1
Merismopedia glauca (Ehrengerg) Kutzing Lo 1.6 0.3 0.5
M. tenuissima Lemmermann
Gymnodinium sp. 1 LM 7.5 13.0 0.4
Peridinium cinctum (Muller) Ehrenberg
Peridinium willei Huitfeld-Kaas
Ulnaria acus (Kutzing) M. Aboal D 0.5 2.9 0.0
Fragilaria rumpens (Kutzing) G. W. F. Carlson
Botryococcus braunii Kutzing F 0.8 0.3 0.4
Closteriopsis acicularis (G. M. Smith) Belch & Swale P 4.0 0.4 0.3
Closterium gracile Brebisson ex Ralfs
Euglena acus Ehrenberg W1 3.4 0.2 0.0
E. proxima Dangeard
E. splendens Dangeard
Trachelomonas hispida (Perty) Stein emend. Deflandre W2 7.0 2.6 0.8
T. kellogii Skvortzov emend. Deflandre
T. volvocinopsis Swirenko
Cryptomonas curvata Ehrenberg emend. Penard Y 8.7 6.5 0.5
C. erosa Ehrenberg
C. marssonii Skuja
Ankistrodesmus gracilis Corda sensu Korsikov X1 0.8 0.2 0.0
Chlorella vulgaris Beijerinck
Chlorococcum infusionum (Schrank) Meneghini
Crucigenia tetrapedia (Kirchner) West & West
Micractinium pusillum Fresenius
Monoraphidium contortum (Thuret in Brbisson)
Pseudodidymocystis fina ((Komarek) Hegewald & Deason)
Scenedesmus ecornis (Ehrenberg) Chodat
274 Hydrobiologia (2008) 600:267–282
123
was around 40%. From phase 2 up to phase 3,
contribution of codon M gradually increased exceeding
90% of the total biovolume during September (Table 2).
The M group was positively correlated to pH (rs = 0.5),
DO (rs = 0.6) and TP (rs = 0.6), and negatively to
temperature (rs = -0.5), NO2- (rs = -0.6), NT:TP
ratio (rs = -0.6), and free CO2 (rs = -0.4).
The S functional group represented by Raphidiopsis/
Cylindrospermopsis (Fig 6), Planktothrix agardhii, and
Geitlerinema unigranulatum was also important to
Garcas Pond phytoplankton community. The expression
Raphidiopsis/Cylindrospermopsis is used to stress
extreme difficulties in distinguishing Raphidiopsis
mediterranea and Cylindrospermopsis raciborskii (see
Section ‘‘Discussion’’ later). Their highest contribution
was found during phase 1, when it reached 16.1% of the
total biovolume. In September (phase 3), however, S
group was virtually absent, contributing with 0% for
total biovolume. The S group positively correlated with
temperature (rs = 0.7) and SRP (rs = 0.7), and nega-
tively with DIN (rs = -0.38).
Cyanobacteria belonging to groups H1 (Anabaena
planktonica), K (Aphanocapsa incerta), and LO
(Merismopedia glauca) were also recorded but with
smaller biomasses than members of S and M groups.
They contributed with [5% for total biovolume in
only 16% of all samples. K group contribution was
particularly high during phase 2, when it represented
38% of July bottom layer total biovolume. Latter
group showed significant positive correlation with
Zmix (rs = 0.8) and NO3- (rs = 0.6), and significant
negative correlation with temperature (rs = -0.8)
and SRP (rs = -0.5).
LM group was present all the year, as well as Y
group. W1 and W2 groups’ contribution were
especially high in March, when they reached
together 47% of total biovolume at 3 m depth.
Although diatoms from D group contributed little
to the total biovolume (\1% in 80% of all unit
samples), they had a pronounced seasonality, with
highest values during phase 2, reaching 18.5% in
July 2 m.
Integrated analysis of abiotic and phytoplankton
functional groups
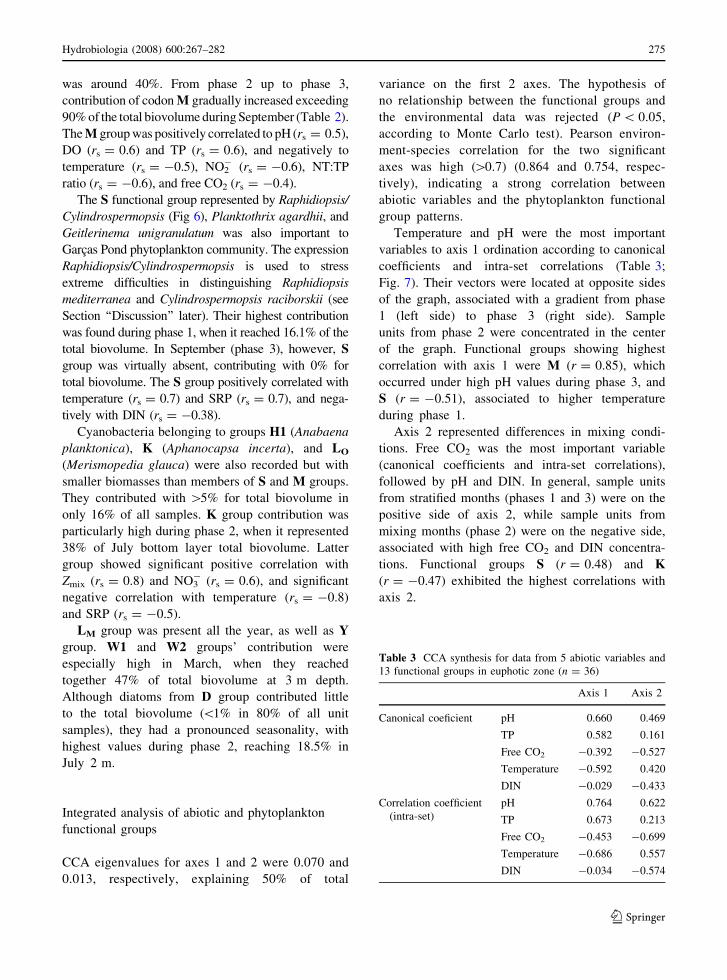
CCA eigenvalues for axes 1 and 2 were 0.070 and
0.013, respectively, explaining 50% of total
variance on the first 2 axes. The hypothesis of
no relationship between the functional groups and
the environmental data was rejected (P \ 0.05,
according to Monte Carlo test). Pearson environ-
ment-species correlation for the two significant
axes was high ([0.7) (0.864 and 0.754, respec-
tively), indicating a strong correlation between
abiotic variables and the phytoplankton functional
group patterns.
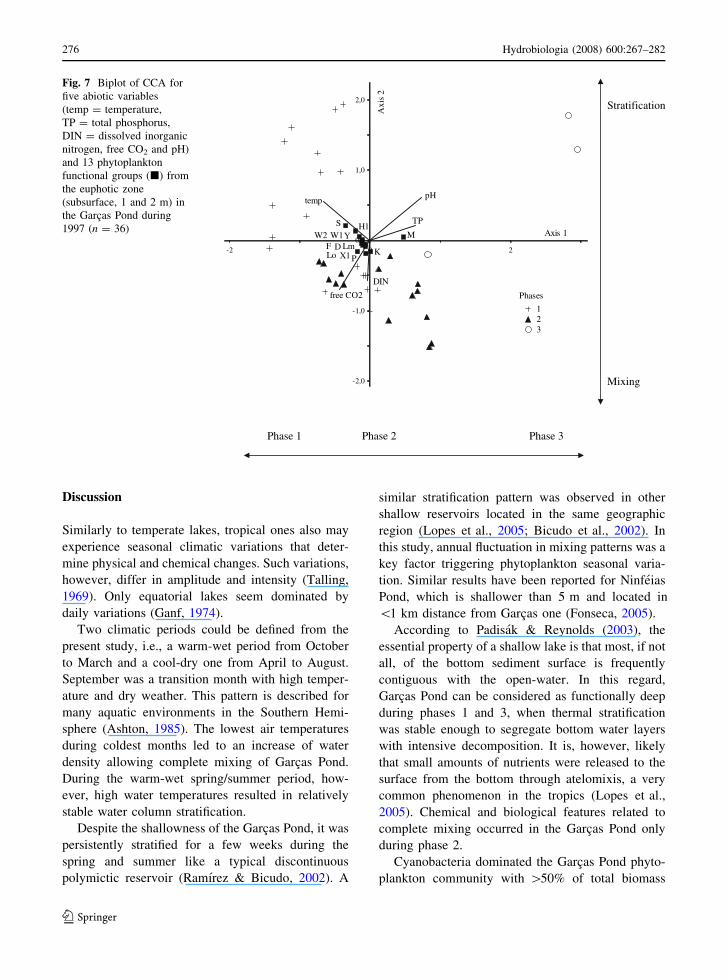
Temperature and pH were the most important
variables to axis 1 ordination according to canonical
coefficients and intra-set correlations (Table 3;
Fig. 7). Their vectors were located at opposite sides
of the graph, associated with a gradient from phase
1 (left side) to phase 3 (right side). Sample
units from phase 2 were concentrated in the center
of the graph. Functional groups showing highest
correlation with axis 1 were M (r = 0.85), which
occurred under high pH values during phase 3, and
S (r = -0.51), associated to higher temperature
during phase 1.
Axis 2 represented differences in mixing condi-
tions. Free CO2 was the most important variable
(canonical coefficients and intra-set correlations),
followed by pH and DIN. In general, sample units
from stratified months (phases 1 and 3) were on the
positive side of axis 2, while sample units from
mixing months (phase 2) were on the negative side,
associated with high free CO2 and DIN concentra-
tions. Functional groups S (r = 0.48) and K
(r = -0.47) exhibited the highest correlations with
axis 2.
Table 3 CCA synthesis for data from 5 abiotic variables and
13 functional groups in euphotic zone (n = 36)
Axis 1 Axis 2
Canonical coeficient pH 0.660 0.469
TP 0.582 0.161
Free CO2 -0.392 -0.527
Temperature -0.592 0.420
DIN -0.029 -0.433
Correlation coefficient
(intra-set)
pH 0.764 0.622
TP 0.673 0.213
Free CO2 -0.453 -0.699
Temperature -0.686 0.557
DIN -0.034 -0.574
Hydrobiologia (2008) 600:267–282 275
123
Discussion
Similarly to temperate lakes, tropical ones also may
experience seasonal climatic variations that deter-
mine physical and chemical changes. Such variations,
however, differ in amplitude and intensity (Talling,
1969). Only equatorial lakes seem dominated by
daily variations (Ganf, 1974).
Two climatic periods could be defined from the
present study, i.e., a warm-wet period from October
to March and a cool-dry one from April to August.
September was a transition month with high temper-
ature and dry weather. This pattern is described for
many aquatic environments in the Southern Hemi-
sphere (Ashton, 1985). The lowest air temperatures
during coldest months led to an increase of water
density allowing complete mixing of Garcas Pond.
During the warm-wet spring/summer period, how-
ever, high water temperatures resulted in relatively
stable water column stratification.
Despite the shallowness of the Garcas Pond, it was
persistently stratified for a few weeks during the
spring and summer like a typical discontinuous
polymictic reservoir (Ramırez & Bicudo, 2002). A
similar stratification pattern was observed in other
shallow reservoirs located in the same geographic
region (Lopes et al., 2005; Bicudo et al., 2002). In
this study, annual fluctuation in mixing patterns was a
key factor triggering phytoplankton seasonal varia-
tion. Similar results have been reported for Ninfeias
Pond, which is shallower than 5 m and located in
\1 km distance from Garcas one (Fonseca, 2005).
According to Padisak & Reynolds (2003), the
essential property of a shallow lake is that most, if not
all, of the bottom sediment surface is frequently
contiguous with the open-water. In this regard,
Garcas Pond can be considered as functionally deep
during phases 1 and 3, when thermal stratification
was stable enough to segregate bottom water layers
with intensive decomposition. It is, however, likely
that small amounts of nutrients were released to the
surface from the bottom through atelomixis, a very
common phenomenon in the tropics (Lopes et al.,
2005). Chemical and biological features related to
complete mixing occurred in the Garcas Pond only
during phase 2.
Cyanobacteria dominated the Garcas Pond phyto-
plankton community with [50% of total biomass
MH1S
KLoLmDF
P
W1W2 Y
X1
pH
TP
free CO2
temp
DIN
-2
-2,0
0 2
-1,0
0,0
1,0
2,0
Axis 1
2 sixA
Phases
123
Phase 1 Phase 2 Phase 3
Stratification
Mixing
Fig. 7 Biplot of CCA for
five abiotic variables
(temp = temperature,
TP = total phosphorus,
DIN = dissolved inorganic
nitrogen, free CO2 and pH)
and 13 phytoplankton
functional groups (j) from
the euphotic zone
(subsurface, 1 and 2 m) in
the Garcas Pond during
1997 (n = 36)
276 Hydrobiologia (2008) 600:267–282
123

almost all year, at all depths. Driving factors
controlling Cyanobacteria have been persistently
studied, since the 1970s, initiated by the importance
of this algal group in eutrophic waters (Shapiro, 1973,
1990; Schindler, 1974; Smith, 1983, 2003; Huszar
et al., 2000). Several cyanobacterial species form
blooms thus preventing the recreational use or
drinking water supply (Branco & Senna, 1996;
Beyruth, 2000).
Cyanobacterial blooms are commonly related to
high temperatures, high pH, low CO2, high P
concentration and water column stability, low TN:TP
ratio, and grazing pressure (Smith, 1983; Paerl, 1988;
Marinho & Huszar, 2002). All conditions above were
detected in the Garcas Pond: the Spearman Rank
Correlation between cyanobacterial biomass and
abiotic factors fit the existing literature.
Phytoplankton seasonal variation was character-
ized by shifts in the cyanobacterial species. Phases 1,
2, and 3 defined from abiotic data (see abiotic results)
were consistent with phytoplankton community data,
supporting the applicability of the functional group
(Reynolds et al., 2002) concept in describing sea-
sonal variation of Garcas Pond phytoplankton as
shown by the CCA.
During phase 1 (November–March), there was a
marked dominance of Raphidiospis/Cylindrosperm-
opsis (S-group). From April to August (phase 2),
Raphidiospis/Cylindrospermopsis density gradually
decreased and a more diverse community established
with co-existence of some cyanobacterial species
(groups K, LM, and M), diatoms (group D) and
chlorophytes (groups P and X1). Phase 3 was charac-
terised by Sphaerocavum brasiliense bloom (group
M). The summary sequence of functional groups over
phases 1, 2, and 3 resulted from CCA is: S/W1/W2/
H1/Y ? K/LM/LO/D/P/X1/F ? M (Fig. 8).
Thus study indicated S. brasiliense as a key
species in Garcas phytoplankton community during
1997. It was among the most frequent species and
reached the highest relative dominance. It outcom-
peted other taxa during the September, and influenced
the diversity patterns over the year.
The genus Sphaerocavum was proposed by Azev-
edo & Sant’Anna (2003) from samples collected from
the Sao Paulo state eutrophic reservoirs, including the
Garcas Pond. Since then, S. brasiliense was reported
for eutrophic lakes all over the world (Wood et al.,
2005; Vardaka et al., 2006). Morphology of Sphaer-
ocavum colonies is very similar to that of Microcystis
except for their hollow interior, a consequence of the
cell division in two planes.
Microcystis aeruginosa is one of the most cited
species in Brazilian eutrophic reservoirs (Santos &
Calijuri, 1998; Figueredo & Giani, 2001; Marinho &
Huszar, 2002) and was described as the most
important species in the Garcas Pond phytoplankton
community in several previous studies, being respon-
sible for regular spring/summer blooms (Sant’Anna
et al., 1997; Bicudo et al., 1999). According to this
study, Sphaerocavum brasiliense was the main spe-
cies during phase 3 bloom, replacing M. aeruginosa
cited in previous articles.
Sphaerocavum and Microcystis have similar eco-
logical requirements. Reynolds et al. (2002) placed
both in M group because they form large colonies
with biovolume [106 lm3, and their buoyancy
control accommodates diel fluctuations during strat-
ifications and mixings in low-latitude lakes.
Microcystis panniformis, another significant species
Jan Feb Mar Apr May Jun Jul Aug Sep Oct Nov Dec
Phase1 Phase 2 Phase 1Phase 3
↑ Temperature
Stratification
⇓Bottom: ↑nutrients,
↓ dissolved oxygen
Cyano (S, H1)Eugleno (W1, W2 )
Crypto (Y)
↓ Temperature
Mixing
⇓↓ nutrients
↑ dissolved oxygen
Cyano (K, M, Lm),Bacillario (D)
Chloro (X1, P, F )Dino (Lo)
↑ Temperature
Stratification
⇓Bottom: ↑nutrients,
↓ dissolved oxygen
Cyano (S, H1)Eugleno (W1, W2 )
Crypto (Y)
↑ Temperature
Stratification
⇓Surface: ↑ pH,
chlo-a, TP
Cyano( M)
Fig. 8 Synthesis diagram
showing main abiotic and
biological changes during
the year 1997 in the Garcas
Pond
Hydrobiologia (2008) 600:267–282 277
123

from Garcas Pond phytoplankton community, also
belongs to this group that comprises many overlap-
ping taxa and ecotypes.
In Garcas Pond, it is possible to infer that thermal
stratification was the driving factor triggering other
water physical and chemical characteristics related
to Sphaerocavum brasiliense dominance. Biovolume
of S. brasiliense individuals showed great variation
over the year, from frequent 2.7 9 103 lm3
(GALD = 26 lm) individuals during phases 1 and
2 to the extreme values of up to 2.4 9 105 lm3
(GALD = 314 lm) during phase 3. Certainly, with
moderate turbulence large colonies remain buoyant.
During the bloom, pH increased reflecting high
photosynthetic rates, and nutrients as NO3- and NO2
-
that were relatively abundant during the phase 2
were quickly exhausted leading to low NT:TP ratios.
S. brasiliense morphological plasticity allowed the
species to maintain its population in the Garcas
Pond all year round, notwithstanding its variations
in relative contribution for total biovolume during
the three phases.
Role of phytoplankton morphological and physi-
ological plasticity in maintaining the (apparently)
same populations under different environmental con-
ditions has been thoroughly discussed in recent
literature (Naselli-Flores & Barone, 2003; Naselli-
Flores et al., 2007; Stoyneva et al., 2007; Dokulil
et al., 2007). According to Naselli-Flores et al.
(2007), morphological variability is recognizable
both at population and assemblage level. The same
population is maintained when the extent of environ-
mental parameter does not exceed the morphological
adaptative capacity of that single population; if
environmental changes are strong enough, species
replacement takes place offering further adaptation at
a higher organization level.
During phase 1, Raphidiospis/Cylindrospermopsis
was the most important taxon. Raphidiopsis mediter-
ranea and Cylindrospermopsis raciborskii are two
very similar species in terms of morphology. Accord-
ing to current literature (Mohamed, 2007),
Raphidiopsis mediterranea filaments are sharply
pointed at both ends and it never forms heterocytes.
Cylindrospermopis raciborskii usually has conically
rounded trichome ends and forms heterocytes
(Branco & Senna, 1991). Specimens in the Garcas
Pond had straight trichomes, terminal cells gradually
narrowed into almost hair-like appearance. Akinetes
were sometimes observed near the thichome ends and
heterocytes have not been seen.
Raphidiopsis mediterranea was first reported for
the Garcas Pond by Sant’Anna et al. (1997) in samples
collected in 1991–1992. At that time, higher R.
mediterranea abundance was detected during the
summer, as in the present work. Cylindrospermopsis
raciborskii was reported first for the Garcas Pond in
samples collected also in 1997 by R. C. Gentil
(unpublished Master Degree thesis dating from
2000), who reported very few trichomes with hetero-
cytes. Individuals presenting this study corresponded
to Raphidiopsis mediterranea’s morphological
description. Nevertheless, Cylindrospermopsis raci-
borskii was confirmed as a key species in the pond
since 1998, frequently overwhelming Sphaerocavum
and Microcystis during the seasonal fluctuation (Tucci
& Sant’Anna, 2003; Crossetti, 2006). For this reason,
we used the expression Raphidiopsis/Cylindrosperm-
opsis in this study. Most likely, the year 1997 was a
transitional year in the Garcas Pond when the preced-
ing Raphidiopsis mediterranea dominance was
replaced by Cylindrospermopsis raciborskii.
Mohamed (2007) reported about simultaneous
occurrence of Raphidiopsis mediterranea and Cylin-
drospermopsis raciborskii in an Egyptian subtropical
shallow pond where their populations were morpho-
logically distinct. Morphology of Raphidiopsis
mediterranea corresponded to the descriptions and
Cylindrospermopsis raciborskii filaments were coiled
with heterocytes at one or both ends. The same author
reported also about differences in their toxicity but
genetic studies to distinguish the two species have
never been carried out. Although information about
C. raciborskii ecology is abundant (Padisak, 1997;
Isvanovics et al., 2000; Bouvy et al., 2003; Tucci &
Sant’Anna, 2003), R. mediterranea has lesser reports.
According to McGregor & Fabbro (2000), suffi-
cient evidence accumulated for considering
Raphidiopsis-like trichomes as environmental mor-
photypes of Cylindrospermopsis raciborskii. Such
suggestion was also raised by Cronberg (1977) based
on observations in Brazilian reservoirs. She found
that R. mediterranea trichomes can be triggered to
form heterocytes after P or sewage water addition.
Life cycle of Cylindrospermopsis raciborskii con-
fuses further the picture: freshly germinated filaments
are very much similar to filaments of Raphidiopsis
mediterranea (Singh, 1962; Padisak, 2003).
278 Hydrobiologia (2008) 600:267–282
123
Brazilian C. raciborskii populations typically
show some 10% of heterocyte bearing individuals
(Branco & Senna, 1996; Huszar et al., 2000). Tucci
& Sant’Anna (2003) reported\9% of specimens with
heterocytes from Garcas Pond. According to Padisak
& Reynolds (1998), C. raciborskii could be consid-
ered a ‘heterocytic Oscillatoria’ equipped with
numerous ecological adaptations that will turn the
species into a very successful competitor in Nature.
Although C. raciborskii is a N-fixer, it does not seem
to be highly dependent on N fixation, preferring
NH4+–NO3
- as N source (Padisak, 1997).
Heterocytic cyanobacterial dominance is com-
monly reported under low availability of inorganic
N (for example, NO3-N:TP ratio \ 5; McQueen &
Lean, 1987). In Garcas Pond, smaller NO3- concen-
trations coincided with high cyanobacterial biomass,
including non-heterocytic species such as Sphaer-
ocavum brasiliense in September (phase 3) and the
summer period (phase 1). During this study, only
Anabaena planctonica specimens possessed hetero-
cytes in \10% of samples.
Ecological characteristics of Cylindrospermopsis
raciborskii and Raphidiopsis mediterranea popula-
tions were found to be similar by Mohamed (2007).
In this study, the two species were positively
associated, but negatively correlated with Microcystis
aeruginosa and both declined when water tempera-
ture fall below 17�C. These patterns are very much
like the observations made in the Garcas Pond.
The following explanation is proposed for the
M ? S succession between phases 3 and 1: Septem-
ber usually characterized by warm and dry weather in
the Garcas Pond area, a condition that allows
development of stratifications that establishes after
some months of complete mixing (winter), when
nutrients were homogeneously distributed along the
entire water column. Although Sphaerocavum bra-
siliense perennial, stratification, and nutrient
abundancy allow development of large colonies in
September exhausting nutrients from the epilimnion.
Stratification prevailed during summer months (phase
1) and Raphidiopsis/Cylindrospermopsis, as a very
efficient nutrient uptaker and light-collector took
advantage, being able to develop great densities
during phase 1. Discontinuous mixing events prob-
ably happened during phase 1, but were not
pronounced enough to result in homogenous profiles.
Another possible explanation for the M group
decrease during phase 1 might be that increased
precipitation induces turbulences that inhibit mainte-
nance of large colonies.
Acknowledgments BMF thanks to FAPESP (Fundacao de
Amparo a Pesquisa do Estado de Sao Paulo) for a Doctoral
fellowship, and CEMB to CNPq (Conselho Nacional de
Desenvolvimento Cientıfico e Tecnologico) for Grant n�303876/2004-2. Both authors are thankful to all colleagues
involved in the laboratory and fieldwork, and to Dr. Denise de
Campos Bicudo for fruitful discussions. BMF and CEMB are
also very grateful to Dr. Jiri Komarek for his comments on
Raphidiopsis/Cylindrospermopsis taxonomic definitions, and
to two anonymous referees for their excellent contributions.
References
Ashton, P. J., 1985. Seasonality in Southern Hemisphere
freshwater phytoplankton assemblages. Hydrobiologia
125: 179–190.
Azevedo, M. T. P. & C. L. Sant’Anna, 1999. Coelosphaeriumevidenter-marginatum, a new planktonic species of Cya-
nophyceae/Cyanobacteria from Sao Paulo State,
Southeastern Brazil. Algological Studies 94: 35–43.
Azevedo, M. T. P. & C. L. Sant’Anna, 2003. Sphaerocavum, a
new genus of Cyanobacteria from continental water
bodies in Brazil. Algological Studies (Cyanobacterial
Research 4) 109: 79–92.
Beyruth, Z., 2000. Periodic disturbances, trophic gradient and
phytoplankton characteristics related to cyanobacterial
growth in Guarapiranga Reservoir, Sao Paulo State, Bra-
zil. Hydrobiologia 424: 51–65.
Bicudo, C. E. M., C. F. Carmo, D. C. Bicudo, R. Henry, A. C.
S. Piao, C. M. Santos & M. R. M. Lopes, 2002. Morfo-
logia e morfometria de tres reservatorios do PEFI. In
Bicudo, D. C., M. C. Forti & C. E. M. Bicudo (eds),
Parque Estadual das Fontes do Ipiranga: Unidade de
conservacao que resiste a urbanizacao de Sao Paulo. Sao
Paulo: Editora Secretaria do Meio Ambiente do Estado de
Sao Paulo: 143–160.
Bicudo, C. E. M., R. J. J. Ramırez, A. Tucci & D. C. Bicudo, 1999.
A dinamica de populacoes fitoplanctonicas em ambiente
eutrofizado: o Lago das Garcas, Sao Paulo. In Henry, R. (ed.),
Ecologia de reservatorios: estrutura, funcao e aspectos
sociais. Botucatu: FUNDIBIO/FAPESP: 449–508.
Bicudo, D. C., B. M. Fonseca, C. E. M. Bicudo, L. M. Bini &
T. A. de Jesus, 2006. Remocao de Eichhornia crassipesem um reservatorio tropical raso e suas implicacoes na
classificacao trofica do sistema: estudo de longa duracao
no Lago das Garcas, Sao Paulo, Brasil. In Tundisi, J. G.,
T. Matsumura-Tundisi & C. Sidagis-Galli (eds), Eutrof-
izacao na America do Sul: causas, consequencias e
tecnologias para gerenciamento e controle. Sao Carlos:
Instituto Internacional de Ecologia: 413–438.
Bicudo, D. C., B. M. Fonseca, L. M. Bini, L. O. Crossetti, C. E.
M. Bicudo & T. Araujo-Jesus, 2007. Undesirable side-
effects of water hyacinth control in a shallow tropical
reservoir. Freshwater Biology 52: 1120–1133.
Hydrobiologia (2008) 600:267–282 279
123

Bicudo, D. C., M. C. Forti, C. F. Carmo, C. Bourote, C. E. M.
Bicudo, A. J. Melfi & Y. Lucas, 2002. A atmosfera, as
aguas superficiais e os reservatorios do PEFI: caracter-
izacao quımica. In Bicudo, D. C., M. C. Forti & C. E. M.
Bicudo (eds), Parque Estadual das Fontes do Ipiranga:
Unidade de conservacao que resiste a urbanizacao de Sao
Paulo. Sao Paulo: Editora Secretaria do Meio Ambiente
do Estado de Sao Paulo: 161–200.
Bouvy, M., S. M. Nascimento, R. J. R. Molica, A. Ferreira, V.
Huszar & S. M. F. O. Azevedo, 2003. Limnological fea-
tures in Tapacura reservoir (northeast Brazil) during a
severe drought. Hydrobiologia 493: 115–130.
Branco, C. W. C. & P. A. C. Senna, 1996. Phytoplankton
composition, community structure and seazonal changes
in a tropical reservoir (Paranoa Reservoir, Brasil). Algo-
logical Studies 81: 69–84.
Branco, C. W. C. & P. A. C. Senna, 1991. The taxonomic
elucidation of the Paranoa Lake (Brasılia, Brazil) prob-
lem: Cylindrospermopsis raciborskii. Bulletin du Jardin
Botanique National Belgique 61: 85–91.
Carvalho, M. C., M. J. Coelho-Botelho, M. C. Lamparelli, M.
H. Roquetti-Humaita, M. E. P. Salvador, C. R. Souza &
A. Truzzi, 1997. Spatial and temporal variations of chlo-
rophyll-a, plankton and some physico-chemical factors at
Billings Complex. Sao Paulo, Brazil. Verhandlungen der
Internationalen Vereinigung fur theoretische und ange-
wandte Limnologie 26: 452–457.
Chellappa, N. T. & M. A. M. Costa, 2003. Dominant and co-
existing species of Cyanobacteria from a eutrophicated
reservoir of Rio Grande do Norte State, Brazil. Acta
Oecologica 24: S3–S10.
Cole, G., 1983. Textbook of Limnology, 3rd edn. London: The
C.V. Mosby Co.
Conti, J. B. & S. A. Furlan, 2003. Geoecologia: o clima, os
solos e a biota. In Ross, J. L. (org.), Geografia do Brasil.
Sao Paulo: Editora da Universidade de Sao Paulo:
67–207.
Cronberg, G., 1977. The Lago do Paranoa Restoration Project.
Phytoplankton ecology and taxonomy: final report. Brası-
lia, Brasil. Project PAHO/WHO/77/WT/BRA/2341/04.
Crossetti, L. O., 2006. Estrutura e dinamica da comunidade
fitoplanctonica no perıodo de oito anos em ambiente eu-
trofico raso (Lago das Garcas), Parque Estadual das
Fontes do Ipiranga, Sao Paulo. Doctoral Dissertation.
Ribeirao Preto: Universidade de Sao Paulo.
Crosseti, L. O. & C. E. M. Bicudo, 2005a. Structural and
functional phytoplankton responses to nutrient impover-
ishment in mesocosms placed in a shallow eutrophic
reservoir (Garcas Pond), Sao Paulo, Brazil. Hydrobiologia
541: 71–85.
Crosseti, L. O. & C. E. M. Bicudo, 2005b. Effects of nutrient
impoverishment on phytoplankton biomass: a mesocosms
experimental approach in a shallow eutrophic reservoir
(Garcas Pond), Sao Paulo, southeast Brazil. Brazilian
Journal of Botany 28: 95–108.
Dadon, J. R., 1995. Calor y temperatura em cuerpos lenticos. In
Lopretto, E. C. & G. Tell (eds), Ecosistemas de aguas
continentales: metodologia para su estudio, Vol. 2. Bue-
nos Aires: Ediciones Sur.
Dokulil, M. T., K. Donabaum & K. Teubner, 2007. Modifi-
cations in phytoplankton size structure by environmental
constraints induced by regime shifts in an urban lake.
Hydrobiologia 578: 59–63.
Figueredo, C. C. & A. Giani, 2001. Seasonal variation in the
diversity and species richness of phytoplankton in a
tropical eutrophic reservoir. Hydrobiologia 445: 165–174.
Fonseca, B. M., 2005. Diversidade fitoplanctonica como dis-
criminador ambiental em dois reservatorios rasos com
diferentes estados troficos no Parque Estadual das Fontes
do Ipiranga, Sao Paulo, SP. Doctoral Dissertation. Sao
Paulo: Universidade de Sao Paulo.
Ganf, G. G., 1974. Diurnal mixing and the vertical distribution
of phytoplankton in a shallow equatorial lake (Lake
George, Uganda). Journal of Ecology 62: 611–629.
Golterman, H. L. & R. S. Clymo, 1971. Methods for Chemical
Analysis of Freshwaters. Oxford: Blackwell Scientific
Publications, International Biological Programme, Oxford
and Edinburg.
Golterman, H. L., R. S. Clymo & M. A. M. Ohmstad, 1978.
Methods for Physical and Chemical Analysis of Fresh-
waters. Oxford: Blackwell Scientific Publications.
International Biological Programme. (IBP Handbook n� 8,
2nd edition).
Henry, R., C. F. Carmo & D. C. Bicudo, 2004. Trophic status
of a Brasilian urban reservoir and prognosis about the
recovery of water quality. Acta Limnologica Brasiliensia
16: 251–262.
Huszar, V. L. M. & N. F. Caraco, 1998. The relationship
between phytoplankton composition and physical–chem-
ical variables: a comparison of taxonomic and
morphological-functional descriptors in six temperate
lakes. Freshwater Biology 40: 679–696.
Huszar, V. L. M., L. H. S. Silva, M. Marinho, P. Domingos &
C. L. Sant’Anna, 2000. Cyanoprokayote assemblages in
eight productive tropical Brazilian waters. Hydrobiologia
424: 67–77.
Isvanovics, V., H. M. Shafik, M. Presing & S. Juhos, 2000.
Growth and phosphate uptake kinetics of the cyanobac-
terium, Cylindrospermopsis raciborskii (Cyanophyceae)
in throughflow cultures. Freshwater Biology 43: 257–275.
Jensen, P., E. Jeppesen, K. Olrik & P. Kristensen, 1994. Impact
of nutrients and physical factors on the shift from
cyanobacterial to chlorophyte dominance in shallow
Danish lakes. Canadian Journal of Fisheries and Aquatic
Sciences 51: 1692–1699.
Komarek, J. & M. T. P. Azevedo, 2000. Geitlerinema uni-granulatum, a common tropical cyanoprokaryote from
freshwater reservoirs in Brazil. Algological Studies 99:
39–52.
Komarek, J., S. M. F. O. Azevedo, P. Domingos, J. Komarkova
& M. Tichy, 2001. Background of the Caruaru tragedy; a
case taxonomic study of toxic cyanobacteria. Algological
Studies (Cyanobacterial Research 2) 103: 9–29.
Kruk, C., N. Mazzeo, G. Lacerot & C. S. Reynolds, 2002.
Classification schemes for phytoplankton: a local valida-
tion of a functional approach to the analysis of species
temporal replacement. Journal of Plankton Research 24:
901–912.
Lopes, M. R. M., C. E. M. Bicudo & C. Ferragut, 2005. Short
term and temporal variation of phytoplankton in a shallow
tropical oligotrophic reservoir, southeast Brazil. Hydro-
biologia 542: 235–247.
280 Hydrobiologia (2008) 600:267–282
123

Lund, J. W. G., C. Kipling & E. D. Le Cren, 1958. The inverted
microscope method of estimating algal numbers and sta-
tistical basis of estimation by counting. Hydrobiologia 11:
143–170.
Mackereth, F. J. H., J. Heron & J. F. Talling, 1978. Water
Analysis: Some Revised Methods for Limnologists.
Kendall: Titus Wilson & Son Ltd. (Freshwater Biological
Association Scientific Publication n� 36).
Marinho, M. M. & V. L. M. Huszar, 2002. Nutrient availability
and physical conditions as controlling factors of phyto-
plankton composition and biomass in a tropical reservoir
(Southeastern Brazil). Archiv fur Hydrobiologie 153:
443–468.
McCune, B. & M. J. Mefford, 1997. PC-ORD. Multivariate
Analysis of Ecological Data, Version 3.0. Oregon: MjM
Software Design.
McGregor, G. B. & L. D. Fabbro, 2000. Dominance of Cylin-drospermopsis raciborskii (Nostocales, Cyanoprokaryota)
in Queensland tropical and subtropical reservoirs: impli-
cations for monitoring and management. Lakes &
Reservoirs: Research and Management 5: 195–205.
McQueen, D. J. & D. R. S. Lean, 1987. Influence of water
temperature and nitrogen to phosphorus ratios on the
dominance of blue-green algae in Lake St. George,
Ontario. Canadian Journal of Fisheries and Aquatic Sci-
ences 44: 598–604.
Mohamed, Z. A., 2007. First report of toxic Cylindrosperm-opsis raciborskii and Raphidiopsis mediterranea(Cyanoprokaryota) in Egyptian fresh waters. FEMS
Microbiological Ecology, 59: 749–761.
Morabito, G., A. Oggioni & P. Panzani, 2003. Phytoplankton
assemblages at equilibrium in large and deep subalpine
lakes: a case study from Lao Maggiore (N. Italy). Hyd-
robiologia 502: 37–48.
Naselli-Flores, L. & R. Barone, 2003. Steady-state assemblages
in a Mediterranean hypertrophic reservoir. The role of
Microcystis ecomorphological variability in maintaining
an apparent equilibrium. Hydrobiologia 502: 133–143.
Naselli-Flores, L., J. Padisak & M. Albay, 2007. Shape and
size in phytoplankton ecology: do they matter? Hydrobi-
ologia 578: 157–161.
Padisak, J., 1992. Seasonal succession of phytoplankton in a
large shallow lake (Balaton, Hungary)—a dynamic
approach to ecological memory, its possible role and
mechanisms. Journal of Ecology 80: 217–230.
Padisak, J., 1997. Cylindrospermopsis raciborskii (Wol-
oszynnska) Seenayya et Subba Raju, an expanding, highly
adaptative cyanobacterium: worldwide distribution and
review of its ecology. Archiv fur Hydrobiology 107:
563–593.
Padisak, J., 2003. Estimation of minimum sedimentary inocu-
lum (akinete) pool of Cylindrospermopsis raciborskii: a
morphological and life-cycle based method. Hydrobiolo-
gia 502: 389–394.
Padisak, J. & C. S. Reynolds, 1998. Selection of phytoplankton
associations in Lake Balaton, Hungary, in response to
eutrophication and restoration measures, with special ref-
erence to the cyanoprokaryotes. Hydrobiologia 384: 41–53.
Padisak, J. & C. S. Reynolds, 2003. Shallow lakes: the abso-
lute, the relative, the functional and the pragmatic.
Hydrobiologia 506–509: 1–11.
Paerl, H. W., 1988. Growth and reproductive strategies of
freshwater blue-green algae (Cyanobacteria). In Sand-
green, C. D. (ed.), Growth and Reproductive Strategies of
Freshwater Phytoplankton. Cambridge: Cambridge
University Press: 261–315.
Ramırez, R. J. J. & C. E. M. Bicudo, 2002. Variation of cli-
matic and physical co-determinants of phytoplankton
community in four nictemeral sampling days in a shallow
tropical reservoir, Southeastern Brazil. Brazilian Journal
of Biology 62: 1–14.
Ramırez, R. J. J. & C. E. M. Bicudo, 2005. Diurnal and spatial
(vertical) dynamics of nutrients (N, P, Si) in four sampling
days (summer, fall, winter, and spring) in a tropical shallow
reservoir and their relationships with the phytoplankton
community. Brazilian Journal of Biology 65: 147–157.
Reynolds, C. S., 2006. The Ecology of Phytoplankton. Cam-
bridge: Cambridge University Press.
Reynolds, C. S., 1984. The Ecology of Freshwater Phyto-
plankton. Cambridge: Cambridge University Press.
Reynolds, C. S., V. Huszar, C. Kruk, L. Naselli-Flores & S.
Melo, 2002. Towards a functional classification of the
freshwater phytoplankton (Review). Journal of Plankton
Research 24: 417–428.
Rott, E., 1981. Some results from phytoplankton counting in-
tercalibrations. Schweizerische Zeitschrift fur Hydrologie
43: 34–62.
Salmaso, N., 2003. Life strategies, dominance patterns and
mechanisms promoting species coexistence in phyto-
plankton communities along complex environmental
gradients. Hydrobiologia 502: 13–36.
Salmaso, N. & J. Padisak, 2007. Morpho-functional groups and
phytoplankton development in two deep lakes (Lake
Garda, Italy and Lake Stechlin, Germany). Hydrobiologia
578: 97–112.
Sant’Anna, C. L. & M. T. P. Azevedo, 2000. Contribution to
the knowledge of potentialy toxic Cyanobacteria from
Brazil. Nova Hedwigia 71: 359–385.
Sant’Anna, C. L., M. T. P. Azevedo & L. Sormus, 1989. Fit-
oplancton do Lago das Garcas, PEFI, Sao Paulo, SP,
Brasil: estudo taxonomico e aspectos ecologicos. Hoehnea
16: 89–131.
Sant’Anna, C. L., L. Sormus, A. Tucci & M. T. P. Azevedo,
1997. Variacao sazonal do fitoplancton do Lago das
Garcas, Sao Paulo, SP. Hoehnea 24: 67–86.
Santos, A. C. A. & M. C. Calijuri, 1998. Survival strategies of
some species of the phytoplankton community in the
Barra Bonita Reservoir (Sao Paulo, Brazil). Hydrobiolo-
gia 367: 139–152.
Santos, P. M. & F. L. Funari, 2002. Clima local. In Bicudo, D.
C., M. C. Forti & C. E. M. Bicudo (eds) Parque Estadual
das Fontes do Ipiranga: Unidade de Conservacao que
resiste a urbanizacao de Sao Paulo. Sao Paulo: Editora
Secretaria do Meio Ambiente do Estado de Sao Paulo:
27–46.
Sartory, D. P. & J. U. Grobbelaar, 1984. Extraction of chlorophyll
a from freshwater phytoplankton for spectrophotometric
analysis. Hydrobiologia 114: 177–187.
Scheffer, M., 1998. Ecology of Shallow Lakes. London:
Chapman & Hall.
Scheffer, M. & E. H. van Nes, 2007. Shallow lakes theory
revisited: various alternative regimes driven by climate,
Hydrobiologia (2008) 600:267–282 281
123
nutrients, depth and lake size. Hydrobiologia 584:
455–466.
Schindler, D. W., 1974. Eutrophication and recovery in
experimental lakes: implications for lake management.
Science 184: 897–899.
Shannon, C. E. & W. Weaver, 1949. The Mathematical Theory
of Communication. Urbana (Il): The University of Illinois
Press: 19–27, 82–83, 104–107.
Shapiro, J., 1973. Blue-green algae: why they become domi-
nant. Science 179: 382–384.
Shapiro, J., 1990. Current beliefs regarding dominance by
blue-greens: the case for the importance of CO2 e pH.
Verhandlungen der Internationalen Vereinigung fur the-
oretische und angewandte Limnologie 24: 38–54.
Shepherd, G. J., 1996. Fitopac 1: manual do usuario. De-
partamento de Botanica, UNICAMP.
Singh, R. N., 1962. Seasonal variants of Anabaenopsis raci-borskii Wolosz. Hydrobiologia 20: 87–91.
Smith, V. H., 1983. Low nitrogen to phosphorus ratios favor
dominance by blue-green algae in lake phytoplankton.
Science 221: 669–670.
Smith, V. H., 2003. Eutrophication of Freshwater and Coastal
Marine Ecosystems: a global Problem. Environmental
Science & Pollution Research 10: 126–139.
Solorzano, L., 1969. Determination of ammonia in natural
waters by the phenolhypochlorite method. Limnolology
and Oceanography 14: 799–801.
Stoyneva, M. P., J.-P. Descy & W. Vyverman, 2007. Green
algae in Lake Tanganyika: is morphological variation a
response to seasonal changes? Hydrobiologia 578: 7–16.
Strickland, J. D. & T. R. Parsons, 1965. A manual of sea water
analysis. Bulletin of the Fisheries Board of Canada 125:
1–185.
Sun, J. & D. Liu, 2003. Geometric models for calculating cell
biovolume and surface area for phytoplankton. Journal of
Plankton Research 25: 1331–1346.
Talling, J. F., 1969. The incidence of vertical mixing, and some
biological and chemical consequences, in tropical African
lakes. Verhandlungen der Internationalen Vereinigung fur
theoretische und angewandte Limnologie 17: 998–1012.
Tucci, A. 2002. Sucessao da comunidade fitoplanctonica de um
reservatorio urbano e eutrofico, Sao Paulo, SP, Brasil.
Doctoral Dissertation. Rio Claro: Universidade Estadual
Paulista.
Tucci, A. & C. L. Sant’Anna, 2003. Cylindrospermopsis rac-iborskii (Woloszynska) Seenayya & Subba Raju
(Cyanobacteria): variacao semanal e relacoes com fatores
ambientais em um reservatorio eutrofico, Sao Paulo, SP,
Brasil. Revista Brasileira de Botanica 26: 97–112.
Tucci, A., C. L. Sant’Anna, R. C. Gentil & M. T. P. Azevedo,
2006. Fitoplancton do Lago das Garcas, Sao Paulo, Brasil:
um reservatorio urbano eutrofico. Hoehnea 33: 147–175.
Utermohl, H., 1958. Zur Vervollkommnung der quantitativen
Phytoplankton-Methodik. Mitteilungen der internationale
Vereinigung fur theoretische und angewandte Limnologie
9: 1–38.
Valderrama, J. C., 1981. The simultaneous analysis of total
nitrogen and total phosphorus in natural waters. Marine
Chemistry 10: 109–122.
Vardaka, E., M. Moustaka-Gouni, C. M. Cook & T. Lanaras,
2006. Cyanobacterial blooms and water quality in Greek
waterbodies. Journal of Applied Phycology 17: 391–401.
Watson, S. B., E. McCauley & J. A. Downing, 1997. Patterns
in phytoplankton taxonomic composition across temperate
lakes of differing nutrient status. Limnology and Ocean-
ography 42: 487–495.
Wood, S. A., A. L. M. Crowe, J. G. Ruck & R. G. Weak, 2005.
New records of planktonic cyanobacteria in New Zealand
freshwaters. New Zealand Journal of Botany 43: 479–492.
282 Hydrobiologia (2008) 600:267–282
123
Copyright © 2022 FDOKUMEN