The role of oxidative stress, impaired glycolysis and mitochondrial respiratory redox failure in the...
16
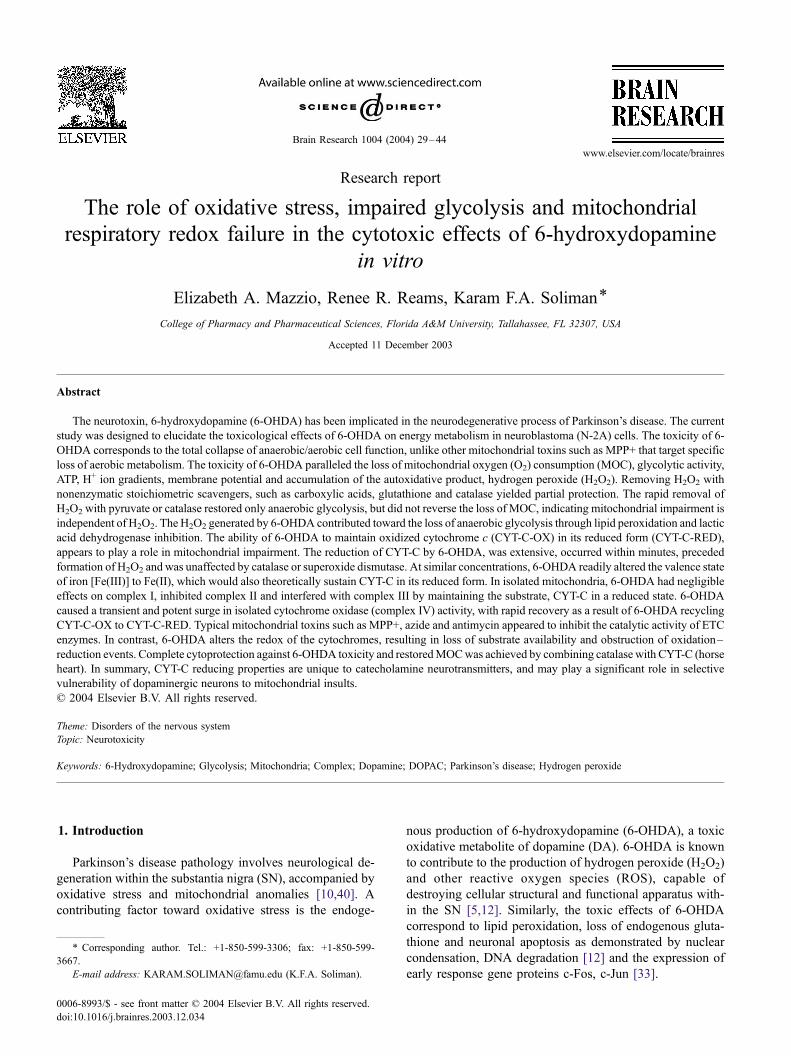
Research report The role of oxidative stress, impaired glycolysis and mitochondrial respiratory redox failure in the cytotoxic effects of 6-hydroxydopamine in vitro Elizabeth A. Mazzio, Renee R. Reams, Karam F.A. Soliman * College of Pharmacy and Pharmaceutical Sciences, Florida A&M University, Tallahassee, FL 32307, USA Accepted 11 December 2003 Abstract The neurotoxin, 6-hydroxydopamine (6-OHDA) has been implicated in the neurodegenerative process of Parkinson’s disease. The current study was designed to elucidate the toxicological effects of 6-OHDA on energy metabolism in neuroblastoma (N-2A) cells. The toxicity of 6- OHDA corresponds to the total collapse of anaerobic/aerobic cell function, unlike other mitochondrial toxins such as MPP+ that target specific loss of aerobic metabolism. The toxicity of 6-OHDA paralleled the loss of mitochondrial oxygen (O 2 ) consumption (MOC), glycolytic activity, ATP, H + ion gradients, membrane potential and accumulation of the autoxidative product, hydrogen peroxide (H 2 O 2 ). Removing H 2 O 2 with nonenzymatic stoichiometric scavengers, such as carboxylic acids, glutathione and catalase yielded partial protection. The rapid removal of H 2 O 2 with pyruvate or catalase restored only anaerobic glycolysis, but did not reverse the loss of MOC, indicating mitochondrial impairment is independent of H 2 O 2 . The H 2 O 2 generated by 6-OHDA contributed toward the loss of anaerobic glycolysis through lipid peroxidation and lactic acid dehydrogenase inhibition. The ability of 6-OHDA to maintain oxidized cytochrome c (CYT-C-OX) in its reduced form (CYT-C-RED), appears to play a role in mitochondrial impairment. The reduction of CYT-C by 6-OHDA, was extensive, occurred within minutes, preceded formation of H 2 O 2 and was unaffected by catalase or superoxide dismutase. At similar concentrations, 6-OHDA readily altered the valence state of iron [Fe(III)] to Fe(II), which would also theoretically sustain CYT-C in its reduced form. In isolated mitochondria, 6-OHDA had negligible effects on complex I, inhibited complex II and interfered with complex III by maintaining the substrate, CYT-C in a reduced state. 6-OHDA caused a transient and potent surge in isolated cytochrome oxidase (complex IV) activity, with rapid recovery as a result of 6-OHDA recycling CYT-C-OX to CYT-C-RED. Typical mitochondrial toxins such as MPP+, azide and antimycin appeared to inhibit the catalytic activity of ETC enzymes. In contrast, 6-OHDA alters the redox of the cytochromes, resulting in loss of substrate availability and obstruction of oxidation – reduction events. Complete cytoprotection against 6-OHDA toxicity and restored MOC was achieved by combining catalase with CYT-C (horse heart). In summary, CYT-C reducing properties are unique to catecholamine neurotransmitters, and may play a significant role in selective vulnerability of dopaminergic neurons to mitochondrial insults. D 2004 Elsevier B.V. All rights reserved. Theme: Disorders of the nervous system Topic: Neurotoxicity Keywords: 6-Hydroxydopamine; Glycolysis; Mitochondria; Complex; Dopamine; DOPAC; Parkinson’s disease; Hydrogen peroxide 1. Introduction Parkinson’s disease pathology involves neurological de- generation within the substantia nigra (SN), accompanied by oxidative stress and mitochondrial anomalies [10,40].A contributing factor toward oxidative stress is the endoge- nous production of 6-hydroxydopamine (6-OHDA), a toxic oxidative metabolite of dopamine (DA). 6-OHDA is known to contribute to the production of hydrogen peroxide (H 2 O 2 ) and other reactive oxygen species (ROS), capable of destroying cellular structural and functional apparatus with- in the SN [5,12]. Similarly, the toxic effects of 6-OHDA correspond to lipid peroxidation, loss of endogenous gluta- thione and neuronal apoptosis as demonstrated by nuclear condensation, DNA degradation [12] and the expression of early response gene proteins c-Fos, c-Jun [33]. 0006-8993/$ - see front matter D 2004 Elsevier B.V. All rights reserved. doi:10.1016/j.brainres.2003.12.034 * Corresponding author. Tel.: +1-850-599-3306; fax: +1-850-599- 3667. E-mail address: [email protected] (K.F.A. Soliman). www.elsevier.com/locate/brainres Brain Research 1004 (2004) 29 – 44
Transcript of The role of oxidative stress, impaired glycolysis and mitochondrial respiratory redox failure in the...
www.elsevier.com/locate/brainres
Brain Research 1004 (2004) 29–44
Research report
The role of oxidative stress, impaired glycolysis and mitochondrial
respiratory redox failure in the cytotoxic effects of 6-hydroxydopamine
in vitro
Elizabeth A. Mazzio, Renee R. Reams, Karam F.A. Soliman*
College of Pharmacy and Pharmaceutical Sciences, Florida A&M University, Tallahassee, FL 32307, USA
Accepted 11 December 2003
Abstract
The neurotoxin, 6-hydroxydopamine (6-OHDA) has been implicated in the neurodegenerative process of Parkinson’s disease. The current
study was designed to elucidate the toxicological effects of 6-OHDA on energy metabolism in neuroblastoma (N-2A) cells. The toxicity of 6-
OHDA corresponds to the total collapse of anaerobic/aerobic cell function, unlike other mitochondrial toxins such as MPP+ that target specific
loss of aerobic metabolism. The toxicity of 6-OHDA paralleled the loss of mitochondrial oxygen (O2) consumption (MOC), glycolytic activity,
ATP, H+ ion gradients, membrane potential and accumulation of the autoxidative product, hydrogen peroxide (H2O2). Removing H2O2 with
nonenzymatic stoichiometric scavengers, such as carboxylic acids, glutathione and catalase yielded partial protection. The rapid removal of
H2O2 with pyruvate or catalase restored only anaerobic glycolysis, but did not reverse the loss of MOC, indicating mitochondrial impairment is
independent of H2O2. The H2O2 generated by 6-OHDA contributed toward the loss of anaerobic glycolysis through lipid peroxidation and lactic
acid dehydrogenase inhibition. The ability of 6-OHDA to maintain oxidized cytochrome c (CYT-C-OX) in its reduced form (CYT-C-RED),
appears to play a role in mitochondrial impairment. The reduction of CYT-C by 6-OHDA, was extensive, occurred within minutes, preceded
formation of H2O2 and was unaffected by catalase or superoxide dismutase. At similar concentrations, 6-OHDA readily altered the valence state
of iron [Fe(III)] to Fe(II), which would also theoretically sustain CYT-C in its reduced form. In isolated mitochondria, 6-OHDA had negligible
effects on complex I, inhibited complex II and interfered with complex III by maintaining the substrate, CYT-C in a reduced state. 6-OHDA
caused a transient and potent surge in isolated cytochrome oxidase (complex IV) activity, with rapid recovery as a result of 6-OHDA recycling
CYT-C-OX to CYT-C-RED. Typical mitochondrial toxins such as MPP+, azide and antimycin appeared to inhibit the catalytic activity of ETC
enzymes. In contrast, 6-OHDA alters the redox of the cytochromes, resulting in loss of substrate availability and obstruction of oxidation–
reduction events. Complete cytoprotection against 6-OHDA toxicity and restoredMOCwas achieved by combining catalase with CYT-C (horse
heart). In summary, CYT-C reducing properties are unique to catecholamine neurotransmitters, and may play a significant role in selective
vulnerability of dopaminergic neurons to mitochondrial insults.
D 2004 Elsevier B.V. All rights reserved.
Theme: Disorders of the nervous system
Topic: Neurotoxicity
Keywords: 6-Hydroxydopamine; Glycolysis; Mitochondria; Complex; Dopamine; DOPAC; Parkinson’s disease; Hydrogen peroxide
1. Introduction
Parkinson’s disease pathology involves neurological de-
generation within the substantia nigra (SN), accompanied by
oxidative stress and mitochondrial anomalies [10,40]. A
contributing factor toward oxidative stress is the endoge-
0006-8993/$ - see front matter D 2004 Elsevier B.V. All rights reserved.
doi:10.1016/j.brainres.2003.12.034
* Corresponding author. Tel.: +1-850-599-3306; fax: +1-850-599-
3667.
E-mail address: [email protected] (K.F.A. Soliman).
nous production of 6-hydroxydopamine (6-OHDA), a toxic
oxidative metabolite of dopamine (DA). 6-OHDA is known
to contribute to the production of hydrogen peroxide (H2O2)
and other reactive oxygen species (ROS), capable of
destroying cellular structural and functional apparatus with-
in the SN [5,12]. Similarly, the toxic effects of 6-OHDA
correspond to lipid peroxidation, loss of endogenous gluta-
thione and neuronal apoptosis as demonstrated by nuclear
condensation, DNA degradation [12] and the expression of
early response gene proteins c-Fos, c-Jun [33].
E.A. Mazzio et al. / Brain Research 1004 (2004) 29–4430
Glutathione plays a significant role in antagonizing the
toxic effects of 6-OHDA, and its depletion with buthionine-
(S,R)-sulfoximine potentiates toxicological damage [35],
indicating a role for H2O2 in the neurodegenerative mecha-
nism of this toxin [24]. In vivo, intrastriatal injections of 6-
OHDA can induce extensive nigrostriatal lesions that occur
due to oxidative stress [23,29]. The lesions are similar to
those that occur in response to systemic administration 1-
methyl-4-phenyl-1,2,3-6-tetrahydropyridine (MPTP) [21].
While, MPTP is not a direct prooxidant, it is converted to
the active toxin, 1-methyl-4-phenylpyridinium (MPP+),
resulting in inhibition of mitochondrial complex I [37]. It is
thought that MPP+ can trigger the rapid efflux of DA from
nerve terminals [32], potentially leading to the oxidation of
DA, which can form 6-OHDA [9,17]. Once formed, 6-
OHDA can induce a cyclic cascade of toxicity parallel to
accumulation of ROS produced through the release of free
iron from bound ferritin [9], H2O2, and the production of
hydroxyl radicals, which further perpetuate oxidation of DA
into 6-OHDA [38].
Although a number of studies have demonstrated detri-
mental effects of 6-OHDA in vitro and in vivo involving the
ROS medicated component, it is unclear as to what extent
mitochondrial impairment or free radicals each contribute to
the damage. Moreover, with the exception of few reports
investigating complex I as a target, it is still uncertain as to
how 6-OHDA directly impairs the function of the mito-
chondria [5,24].
Preliminary data from our laboratory reveal that damage
to the mitochondria by 6-OHDA is independent of ROS. We
consistently found that antioxidants such as glutathione and
pyruvate protect against 6-OHDAwithout reversing the loss
of mitochondrial respiration. Conversely, these antioxidants
reverse the loss of mitochondrial O2 consumption parallel to
cytoprotection against toxicity of H2O2, the primary autox-
idative product of 6-OHDA [25]. Moreover, we have found
that 6-OHDA and catecholamines are unique from other
neurotransmitters, having potent chemical reducing effects
on cytochrome c (CYT-C). 6-OHDA is known to reduce
Fe(III) to Fe(II), and similar events may be occurring within
the heme core of CYT-C (14). If the reduction of CYT-C by
6-OHDA occurs in the mitochondria, this could potentially
obstruct electron flow through complexes II–IV. Yet, there
has not been an investigation to examine if CYT-C reduc-
tion by either 6-OHDA or catecholamines contribute to the
loss of oxidation–reduction events through the electron
transport chain (ETC). Past research defining a role for
CYT-C in the toxicity of 6-OHDA, has been limited to the
investigation of apoptotic signaling involving the release of
mitochondrial CYT-C, activation of caspase-3 and -9 and
DNA fragmentation [15,39].
We hypothesize that 6-OHDA may be contributing to the
failure of mitochondrial respiration, through preventing
availability of oxidized CYT-C as a substrate carrier for
electrons, primarily through altering the redox state of Fe in
complex III. Complex III (cytochrome c–coenzyme Q oxi-
doreductase) contains cytochromes b and c, and accepts
electrons from ubiquinol in complex II. 6-OHDA may be
interfering with availability of CYT-C-OX in complex III,
rendering loss of electron transfer down the ETC to its
terminal receptor O2 in complex IV (cytochrome oxidase).
Therefore, the present study was designed to elucidate the
mechanism of 6-OHDA toxicity as it relates to ROS, effects
on CYT-C, impaired aerobic/anaerobic metabolism, mito-
chondrial oxidative phosphorylation and complexes I, II, III,
IV activities.
2. Materials and methods
Murine brain neuroblastoma (N-2A) cells were obtained
from American Type Culture Collection (Manassas, VA).
Dulbecco’s modified Eagle medium (DMEM), L-glutamine,
fetal bovine serum (FBS)-heat inactivated, Hank’s balanced
salt solution (HBSS), phosphate buffered saline (PBS) and
penicillin/streptomycin were supplied by Fischer Scientific,
Mediatech (Pittsburgh, PA). CYT-C, 6-OHDA and all other
chemicals and supplies were purchased from Sigma (St.
Louis, MO).
2.1. Cell culture
Murine brain neuroblastoma (N-2A) cells exhibit neuronal
morphology, and are vulnerable to the toxic effects of
mitochondrial toxins, ROS and 6-OHDA [26,28]. Briefly,
cells were grown in DMEM+phenol red, supplemented with
10% FBS (v/v), 4 mM L-glutamine, penicillin (100 U/ml)/
streptomycin (0.1 mg/ml) and 20 AM of sodium pyruvate.
The cells were cultured under stable conditions maintained at
temperature of 37 jC and 5% CO2 in atmosphere. Every 2–5
days, cells were subcultured, and for experiments, the cells
were plated at approximately 0.5� 106 cells/ml in 96-well
plates. The experimental plating media consisted of DMEM
(without phenol red), supplemented with 1.8% FBS (v/v),
penicillin (100 U/ml)/streptomycin (0.1 mg/ml), 4 mM L-
glutamine and 20 AM sodium pyruvate. A stock solution of
each experimental compound was prepared in HBSS con-
taining 5 mM (N-[2-hydroxyethylpiperazine]-NV-[2-ethane-sulfonic acid]) (HEPES), adjusted to a pH of 7.4. Six
concentrations of each treatment were prepared to span a
1000-fold dilution range. Solutions of 6-OHDA were pre-
pared fresh daily, immediately prior to use. In all experiments,
the cells were exposed to experimental treatments f 2 h prior
to addition of 6-OHDA, and incubated for 24 h at 37 jC in 5%
CO2/atmosphere.
2.2. Measurements of cell viability
Resazurin (Almar blue) indicator dye was used to assess
cell viability as previously described [11]. Briefly, a work-
ing solution of resazurin (0.5 mg/ml) was prepared in sterile
PBS and added to the samples for 6–8 h. Blanks and
E.A. Mazzio et al. / Brain Research 1004 (2004) 29–44 31
controls were run simultaneously to account for interference
or interplate variability. Quantitative analysis of dye con-
version was measured on a Cambridge microplate fluorom-
eter—Model 7620, version 5.02 (Cambridge Technologies,
Watertown, MA)—with settings fixed at [550/580] [excita-
tion/emission] wavelengths.
Loss of cell viability by 6-OHDA was confirmed with
fluorescein diacetate (FD) after 24 h, as previously de-
scribed [19,26]. Briefly, FD (final working concentration:
20 Ag/ml) was incubated with the samples at 37 jC for 20
min. Images were acquired using a Nikon Eclipse TE300
inverted microscope with a SPOT cooled CCD color digital
camera (Diagnostic Instruments, Sterling Hts., MI) using a
blue filter cube. The images were further captured by SPOT
Imaging Software Version 2.2.
2.3. Measurements of cell death
Propidium iodide (PI) was used to observe cell death
after 24 h incubation with 6-OHDA [19,26]. Briefly, PI
(final working concentration: 7 Ag/ml) was added to the
samples and returned to the incubator for 15 min. Samples
were evaluated using a Nikon Eclipse TE300 inverted
microscope with a SPOT cooled CCD color digital camera
(Diagnostic Instruments). Images were captured by SPOT
Imaging Software Version 2.2.
2.4. Measurements of endoplasmic reticulum and intracel-
lular organelle membrane potentials
Endoplasmic reticulum (ER), mitochondria and intracel-
lular organelle transmembrane potentials were determined
using 3,3V-dihexyloxacarbocyanine iodide [DiOC6(3)] after
24 h incubation with 6-OHDA [26,34]. Briefly, DiOC6(3)
(final working concentration: 4 Ag/ml) was added to the
samples and incubated at 37 jC for 15 min. Samples were
evaluated on a Nikon Eclipse TE300 inverted microscope
with a SPOT cooled CCD color digital camera (Diagnostic
Instruments) using a blue filter cube. DiOC6(3) is typically
quantified at approximately 480 nm excitation and 600 nm
emission. Images were captured by SPOT Imaging Software
Version 2.2.
2.5. Measurements of intracellular pH
2,7V-bis(2-carboxyethyl)-5(6) carboxy-fluorescein ace-
toxymethyl ester (BCECF-AM) was used to measure cyto-
solic pH after 24 h incubation with 6-OHDA [26,31]. Briefly,
the stock solution of BCECF-AM was prepared in ethanol (1
mg/ml) and stored at 0 jC. The reagent (final working
concentration 7 Ag/ml) was added to the samples and incu-
bated at 37 jC for 15 min. Samples were evaluated utilizing a
Nikon Eclipse TE300 inverted microscope with a SPOT
cooled CCD color digital camera (Diagnostic Instruments)
using a blue filter cube. BCECF-AM is typically quantified at
490 nm (blue) excitation and 535 nm/emissions. Images were
captured using SPOT Imaging Software Version 2.2.
2.6. Hydrogen peroxide quantifications
Hydrogen peroxide was quantified during the autoxida-
tion of 6-OHDA using a peroxidase-linked continuous assay
as previously described [16,26]. To assess nonenzymatic
scavenging capability, H2O2 (500 AM) was prepared in PBS
and incubated with experimental compounds for 30 min.
The chromogenic solution was prepared in PBS + 2 mM
HEPES at a pH of 7.4 with final working concentration of 1
mM vanillic acid, 500 AM 4-aminoantipyrine and horserad-
ish peroxidase (4 U/ml). The chromogenic reagent was
added to the samples, and incubated for 10 min at 37 jC.Controls and blanks were run simultaneously to account for
interference and a standard curve was established with H2O2
(1–500 AM). The data were quantified at 490 nm on a
Cambridge UV microplate spectrophotometer—Model
7520, version 5.02 (Cambridge Technologies).
2.7. O2 consumption determinations
Mitochondrial O2 consumption (MOC) is indicative of
cell respiration. MOC was analyzed using a Clark electrode
after 24 h incubation with 6-OHDAF experimental com-
pounds (Hansatech Instruments, Norfolk, England) [39].
Briefly, the electrode was calibrated with air-saturated
deionized water and deionized water-containing sodium
dithionite. The samples or control blanks were loaded into
a chamber jacket at 25 jC. After instrument stabilization
and equilibration, a reading was taken. The data were
acquired as nM of O2/ml and converted to % control.
2.8. Determination of cytochrome c reduction
The reduction of CYT-C (derived from horse heart, 130
AM) was determined monitoring the increase in optical
density (O.D.) at 550 nm on a multiplate UV spectropho-
tometer. Solutions of CYT-C were prepared in experimental
plating medium. The oxidation–reduction range for CYT-C
was established by monitoring the absorbance change from
CYT-C-OX to CYT-C-RED by 3 mM of ascorbic acid.
2.9. Measurements of mitochondrial respiratory chain
activity
Mitochondrial activities were determined using a modi-
fication of a method described elsewhere [6,41]. Briefly, N-
2A cell pellets were washed in PBS and then dispersed in
ice-cold mitochondrial isolation buffer consisting of HEPES
(20 mM), pH 7.4, MgCl2 (1.5 mM) KCl (10 mM), ethyl-
enediaminetetraacetic acid (EDTA) (1 mM), dithiothreitol (1
mM), ethylene glycol-bis(h-aminoethyl ether)-N,N,NV,NV-tetraacetic acid (1 mM), phenylmethylsulfonyl fluoride (1
mM), leupeptin (10 AM), aprotinin (10 AM) and sucrose
E.A. Mazzio et al. / Brain Research 1004 (2004) 29–4432
(250 mM). The homogenate was chilled, disrupted and
centrifuged at 500� g for 10 min at 4 jC. The mitochondria
were pelleted by centrifugation at 9400� g for 10 min at 4
jC.The protein concentration of the mitochondrial homog-
enate was adjusted so that the final working concentration
was equal to f 200 Ag/ml. Protein was determined with the
Lowry procedure, using bovine albumin as a standard (0–
100 mg/dl) [22]. Existing protocols for mitochondrial assays
utilize substrate reaction mixtures at a stabilized pH of 7.4.
However, it was our observation that optimal enzyme
conditions for complexes II, III and IV in validation controls
were observed at a pH of f 5.6. This anomaly may be due
to the unusual nature of immortal cell lines that allow them
to thrive under acidic conditions. Control blanks were
established for all experimental compounds, for each com-
plex activity assay, to identify potential reactivity between
inhibitors and substrates, in the absence of mitochondrial
homogenates.
2.10. Complex I activity determinations
NADH:ubiquinone oxidoreductase activity was deter-
mined by quantifying the decrease in UV absorbance that
accompanied the oxidation of NADH at 340 nm. The
reaction mixture consisted of sodium phosphate (8 mM),
MgSO4 (10 mM), NaCl (136 mM), KH2PO4 (1.5 mM),
CaCl2 (1 mM), HEPES (25 mM) and KCl (2.5 mM) in
deionized H20. The buffer contained 2.5 mg/ml bovine
serum albumin, 50 Ag/ml antimycin A, sodium azide 4
mM, 50 AM decylubiquinone and flavin adenine dinucleo-
tide (FAD)/flavin mononucleotide (FMN) 25 AM. The final
pH was readjusted to 7.4. The reaction was initiated by the
addition of 500 AM NADH. A standard curve was estab-
lished for NADH along with an NAD+ nonresponse control
(1–2500 AM).
2.11. Complex II activity determinations
Succinate:2,6-dichlorophenolindophenol (DCPIP) oxido-
reductase activity was quantified by measuring the decrease
in UV absorbance due to the reduction of 2,6-DCPIP at 600
nm. The reaction mixture consisted of sodium phosphate (8
mM), NaCl (136 mM), KH2PO4 (1.5 mM), MgSO4 (10
mM), CaCl2 (1 mM), HEPES (25 mM) and KCl (2.5 mM)
in deionized H20. The buffer contained 2.5 mg/ml bovine
serum albumin, 12 mM succinic acid, 50 AM decylubiqui-
none, 25 AM FAD/FMN, 75 AM DCPIP, 50 Ag/ml anti-
mycin A and sodium azide 4 mM. The final pH was
readjusted to 5.6. DCPIP reduction was monitored over
time. A standard curve was established using DCPIP
(1–100 AM).
2.12. Complex III activity determinations
Ubiquinol:cytochrome c oxidoreductase was determined
by monitoring the reduction of oxidized cytochrome c at
550 nm. The reaction mixture consisted of sodium phos-
phate (8 mM), NaCl (136 mM), KH2PO4 (1.5 mM), CaCl2(1 mM), MgSO4 (10 mM), HEPES (25 mM) and KCl (2.5
mM) in deionized H20. The reaction mixture contained 2.5
mg/ml bovine serum albumin, 12 mM succinic acid, 50 AMdecylubiquinone, 25 AM FAD/FMN, 4 mM sodium azide
and 125 AM cytochrome c. The final pH was readjusted to
5.6. The oxidation–reduction state of cytochrome c was
established with ascorbic acid.
2.13. Complex IV activity determinations
Cytochrome c oxidase was determined by monitoring the
oxidation of reduced cytochrome c at 550 nm. The reaction
mixture consisted of sodium phosphate (8 mM), NaCl (136
mM), KH2PO4 (1.5 mM), MgSO4 (10 mM), CaCl2 (1 mM),
HEPES (25 mM) and KCl (2.5 mM) in deionized H20. The
reaction mixture contained 2.5 mg/ml bovine serum albu-
min, 50 AM decylubiquinone, 25 AM FAD/FMN, 50 Ag/ml
antimycin and 15 mM malonate. Cytochrome c 125 AM was
added in the presence of 3 mM ascorbic acid. The final pH
was readjusted to 5.6. Oxidation was monitored over time.
2.14. Determinations of ATP levels
ATP was assessed by firefly bioluminescence as previ-
ously described [39]. Briefly, samples were frozen in a
lysing buffer and stored at � 80 jC. A luciferase–luciferin
solution in glycine buffer (Sigma) was reconstituted with
sterile deionized water, 0.04 mg/ml luciferase, 0.26 mM
luciferin, 19.5 mM MgSO4, 1.95 mM EDTA, 195 mM
glycine and 324 mM Tris–HCl (pH 7.4). The ATP reagent
was added and light units were converted to CPM and
quantified on a Beckman LS 6500 Scintillation Counter
(Beckman, and Schaumburg, IL, USA). The data were
converted to % control.
2.15. Determinations of lactic acid levels
Lactic acid was quantified using a colorimetric enzymatic
assay (Procedure No. 735, Sigma). The base reagent was
mixed with a chromogenic solution prepared in PBS + 2
mM HEPES, pH 7.4, containing (final working concentra-
tions) 1 mM vanillic acid, 500 AM 4-aminoantipyrine and
horseradish peroxidase (4 U/ml). The reagent was added to
each sample and incubated for 15 min at 37 jC. Lactate wasquantified at 490 nm on a UV microplate spectrophotome-
ter. A lactic acid standard curve was generated by preparing
a dilution of lactic acid (10 AM–10 mM) in ultralow serum
plating media minus phenol red. Although control blanks
were run to eliminate potential interference effects of 6-
OHDA on chromogenic reagent reactivity for H2O2, to
ensure accuracy, HPLC quantification of lactic acid was
also examined for MPP+ and 6-OHDA—IC50 samples (500
and 175 AM), respectively. Briefly, lactate was quantified
using an Interaction Ion-300 anion exchange column on a
E.A. Mazzio et al. / Brain Research 1004 (2004) 29–44 33
Waters 2487/Millennium 32 version 3.20, system controller
with 2690 Separations Module and UV detector (210 nm).
The mobile phase consisted of 0.01 N H2SO4, the flow rate
was set at 0.4 ml/min and column temperature 40 jC.
2.16. Measurements of LDH activity
Pyruvic acid was converted to lactate in the presence of
lactic acid dehydrogenase (LDH) (from rabbit muscle, type
V-S [EC 1.1.1.27]), at a concentration of 1 U/ml in the
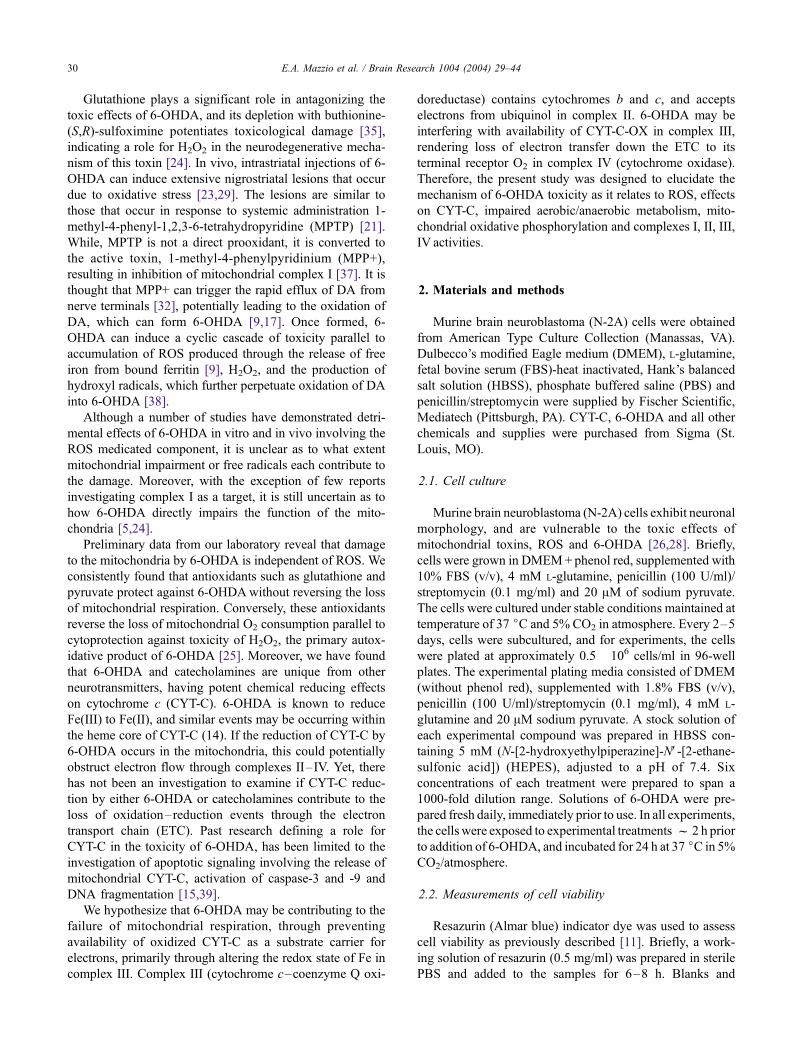
Fig. 1. (A) The effect of 6-OHDA on N-2A cell viability, ATP, lactic acid pro
atmosphere. The data are expressed as % live control and are plotted as the meanFcontrol was determined by a one-way ANOVA, followed by a Tukey mean compari
of lactate was also corroborated with HPLC analysis during 6-OHDA (175 AM) tox
acid production after 24 h incubation at 37 jC in 5% CO2/atmosphere. The data a
Significance of difference between the treatment groups and the control was deter
hoc test, *P< 0.001. Quantification of lactate was corroborated with HPLC analy
presence of adenosine, 2V,5V-diphospahte (ADP) (1.5 mM),
h-NADH (1 mM) +magnesium sulfate (MgSO4) (5 mM)
prepared in buffered distilled water, pH 7.4. Dose-depen-
dent enzyme activity in the presence of varying concentra-
tion of the substrate (pyruvate) was determined by
quantifying formation of lactic acid as described above.
In order to assess the effects of H2O2 on LDH, the
peroxidase-linked reaction was not used due to potential
interferences. LDH inhibition was established by monitor-
ing the oxidation of NADH by LDH at 340 nm on a UV
duction and O2 consumption after 24 h incubation at 37 jC in 5% CO2/
S.E.M. (n= 4). Significance of difference between treatment groups and the
son post hoc test. All groups [*] P< 0.001 or single groups *. Quantification
icity (right panel). (B) The effect of MPP+ on N-2A cell viability and lactic
re expressed as % live control and are plotted as the meanF S.E.M. (n= 4).
mined by a one-way ANOVA, followed by a Tukey mean comparison post
sis during MPP+ (500 AM) toxicity (right panel).
E.A. Mazzio et al. / Brain Research 1004 (2004) 29–4434
spectrophotometer. Negative control blanks were estab-
lished in the presence of H2O2 containing the substrate
solution minus the enzyme.
2.17. Measurements of ferritin–Fe+2 release
The release of free Fe+ 2 from horse spleen bound
ferritin type I (15 mg/ml) was determined by monitoring
the release of ferrous iron in the presence of various
concentrations of 6-OHDA [1]. The ferrous iron reactant
(FIR) solution was prepared and kept from light. The FIR
consisted of 1,10-phenanthroline (1 mg/ml) dissolved in
deionized water. Separate solutions of hydroxylamine hy-
drochloride and sodium acetate (100 mg/ml) were prepared
in deionized water. To a sample volume (81% total vol-
ume), the reagent was added (19% of total volume) and
consisted of total volume (1% hydroxylamine solution, 8%
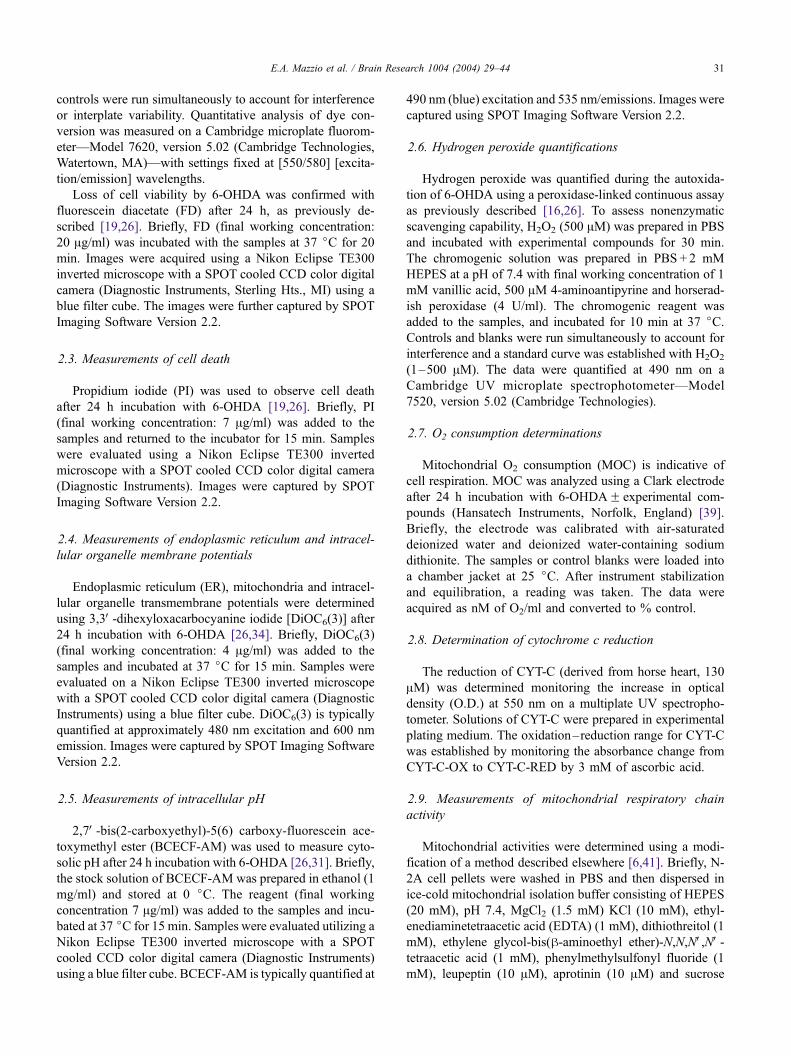
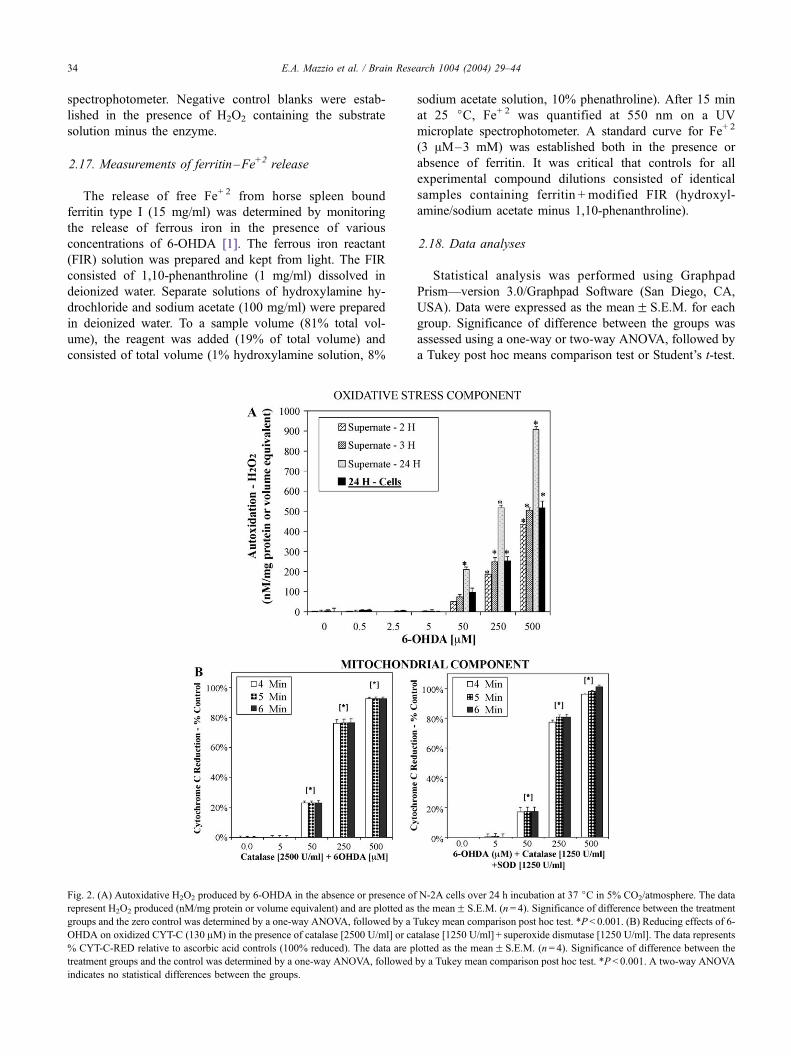
Fig. 2. (A) Autoxidative H2O2 produced by 6-OHDA in the absence or presence of
represent H2O2 produced (nM/mg protein or volume equivalent) and are plotted as
groups and the zero control was determined by a one-way ANOVA, followed by a T
OHDA on oxidized CYT-C (130 AM) in the presence of catalase [2500 U/ml] or ca
% CYT-C-RED relative to ascorbic acid controls (100% reduced). The data are p
treatment groups and the control was determined by a one-way ANOVA, followed
indicates no statistical differences between the groups.
sodium acetate solution, 10% phenathroline). After 15 min
at 25 jC, Fe+ 2 was quantified at 550 nm on a UV
microplate spectrophotometer. A standard curve for Fe+ 2
(3 AM–3 mM) was established both in the presence or
absence of ferritin. It was critical that controls for all
experimental compound dilutions consisted of identical
samples containing ferritin + modified FIR (hydroxyl-
amine/sodium acetate minus 1,10-phenanthroline).
2.18. Data analyses
Statistical analysis was performed using Graphpad
Prism—version 3.0/Graphpad Software (San Diego, CA,
USA). Data were expressed as the meanF S.E.M. for each
group. Significance of difference between the groups was
assessed using a one-way or two-way ANOVA, followed by
a Tukey post hoc means comparison test or Student’s t-test.
N-2A cells over 24 h incubation at 37 jC in 5% CO2/atmosphere. The data
the meanF S.E.M. (n= 4). Significance of difference between the treatment
ukey mean comparison post hoc test. *P< 0.001. (B) Reducing effects of 6-
talase [1250 U/ml] + superoxide dismutase [1250 U/ml]. The data represents
lotted as the meanF S.E.M. (n= 4). Significance of difference between the
by a Tukey mean comparison post hoc test. *P < 0.001. A two-way ANOVA

E.A. Mazzio et al. / Brain Research 1004 (2004) 29–44 35
3. Results
3.1. Toxic profile of 6-OHDA toxicity
N-2A cells were incubated with varying concentration of
6-OHDA for 24 h, leading to complete metabolic collapse
as indicated by the reduction in lactic acid, ATP and whole
cell O2 consumption (Fig. 1A). The decrease in lactate
associated with toxicity of 6-OHDA is unique from other
mitochondrial toxins such as MPP+, that typically lead to an
increase of lactic acid due to increased compensatory
anaerobic glycolysis (Fig. 1B). In Fig. 1, lactic acid profiles
are demonstrated in the graph (left panel) and corroborated
with HPLC analysis (right panel).
3.2. Chemical properties of 6-OHDA
Two distinct chemical properties of 6-OHDA, that occur
independent of a biological system include autoxidative
generation of H2O2 in aqueous solution (Fig. 2A) and
reduction of CYT-C (Fig. 2B). Fig. 2A demonstrates that
under experimental cell culture conditions, 6-OHDA can
produce significant amount of H2O2. Furthermore, N2A
cells contain limited antioxidant capability and are ineffec-
tive in removing a large portion of the H2O2 at 24 h. The
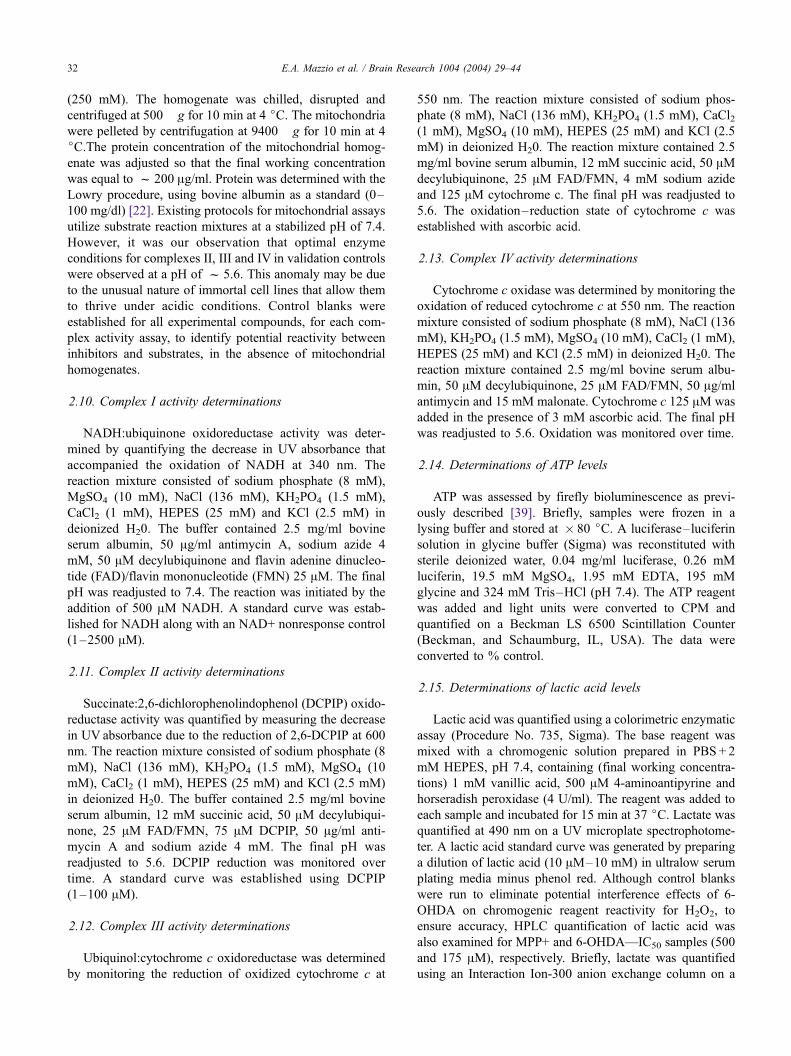
Fig. 3. Fluorescence photographic analysis of 6-OHDA effects on membrane pot
activity after 24 h incubation at 37 jC in 5% CO2/atmosphere.
reduction of CYT-C by 6-OHDA occurred within minutes
and is independent of H2O2 or superoxide (Fig. 2B). The
loss of cell viability in the presence of varying concentra-
tion of 6-OHDA corresponds to CYT-C reduction, H2O2
production, and the loss of intracellular organelle potential,
H+ ion gradients, a reduction in live cell esterase activity
and increased propidium iodide nuclear staining, as de-
monstrated in Fig. 3. Thiobarbituric reactive substances
were measured during 6-OHDA toxicity at 50, 250 and 500
AM as a measure of lipid peroxidation. The data indicate
that cell death corresponded to increased concentrations of
malondialdehyde, 1.3F 1.2, 8.6F 2.1 and 21.1F 2.4 nM/
mg protein, respectively. These data indicate that H2O2
formed by 6-OHDA can lead to lipid peroxidation, poten-
tially contributing to the observed loss of cell membrane
integrity.
3.3. Screening for cytoprotection against 6-OHDA
In order to elucidate potential cytoprotective com-
pounds, over a hundred compounds were screened against
6-OHDA (175 AM) toxicity. Experimental compounds
included superoxide dismutase, plant-derived polyphenolic
antioxidants, vitamins, amino acids, energy intermediates,
protein kinase inhibitors, calcium channel blockers, nitric
ential, H+ concentration, nucleic acid staining and loss of live cell esterase

Fig. 4. (A–E) The cytoprotective effects of carboxylic acid intermediates and glutathione against 6-OHDA (175 AM) toxicity at 24 h incubation. The data in
Panels A and C represent cell viability as % live control and are expressed as the meanF S.E.M. (n= 4). The data in Panels B and D represent corresponding
antioxidant effects, quantified by ability to trap H2O2 (500 AM) 30 min after incubation at room temperature. The data represent residual AM H2O2 remaining
and are expressed as the meanF S.E.M. (n= 4). The significance of difference between treatment and control groups were determined by a one-way ANOVA,
followed by a Tukey mean comparison post hoc test. *P < 0.001. (E) The effects of pyruvate (10 mM) and catalase (2500 U/ml) on restoring the loss of
mitochondrial O2 consumption (MOC) and viability by either 6-OHDA (175 AM) or H2O2 (500 AM) at 24 h incubation � 37 jC in 5% CO2/atmosphere. The
data values as % live control, and are expressed as the meanF S.E.M. (n= 4). The significance of difference between treatment and control groups (in the
presence of toxins) were determined by a one-way ANOVA, followed by a Tukey mean comparison post hoc test. *P < 0.001.
E.A. Mazzio et al. / Brain Research 1004 (2004) 29–4436

Fig. 5. (A and B) The effects of H2O2 on isolated LDH [EC 1.1.1.27]
enzyme activity assessed in the presence of ADP, h-NADH+Mg-
SO4F substrate. Panel A is the control at 15 min, analyzed with increasing
concentration of substrate. Panel B represents LDH activity + 1 mM
pyruvateF 500 AM H2O2 over time. The data are plotted as the
meanF S.E.M. (n= 4). Significance of difference between the treatment
groups and the control was determined by a one-way ANOVA, followed by
a Tukey mean comparison post hoc test. *P< 0.001. A two-way ANOVA
indicates no statistical differences between the groups in Panel B.
E.A. Mazzio et al. / Brain Research 1004 (2004) 29–44 37
oxide synthase inhibitors, and electrolytes. The results
revealed that only five compounds were protective
against 6-OHDA. These included the tricarboxylic acid
intermediates: pyruvate, oxaloacetate, a-ketoglutarate, re-
duced glutathione (GSH) and N-acetyl-L-cysteine (NAC)
(Fig. 4A and C). The cytoprotection observed by these
compounds paralleled their nonenzymatic stoichiometric
scavenging potency against H2O2 (500 AM) (Fig. 4B and
D). In order to ensure the antioxidant effects of carbox-
ylic acids were not due to the effects of acidity on the
chromogenic peroxidase enzyme system, neutralized car-
boxylic acid solutions were also analyzed for radical
trapping. The results were identical, indicating that pro-
tective properties are related to the direct antioxidant
capabilities of these acids. These data clearly indicate a
role for H2O2 in the toxicity of 6-OHDA. Fig. 4E
corroborates protective effects of pyruvate specifically
against H2O2 or 6-OHDA. However, these data indicate
that protection against the toxicity of H2O2 by pyruvate
and catalase, are associated with restored function to the
mitochondria. This is vastly different from toxicity of 6-
OHDA, where pyruvate and catalase are protective
through restoring anaerobic metabolism, evident by the
sustained loss of respiration. These data suggest that
mitochondrial impairment by 6-OHDA is independent of
ROS production.
The loss of anaerobic glycolysis appears to be the direct
result of an action caused by H2O2. While H2O2 can
induce loss of membrane integrity as demonstrated in
Fig. 3, H2O2 may also attenuate LDH activity (Fig. 5).
Fig. 5A is a control for the LDH assay, with increasing
concentration of pyruvate at 15 min. Fig. 5B quantifies
LDH activity with 1 mM pyruvateFH2O2 (500 AM) over
19 min. The data show significant reduction in LDH
activity by peroxide.
3.4. Restoration of anaerobic mitochondrial function by
addition of catalase and CYT-C
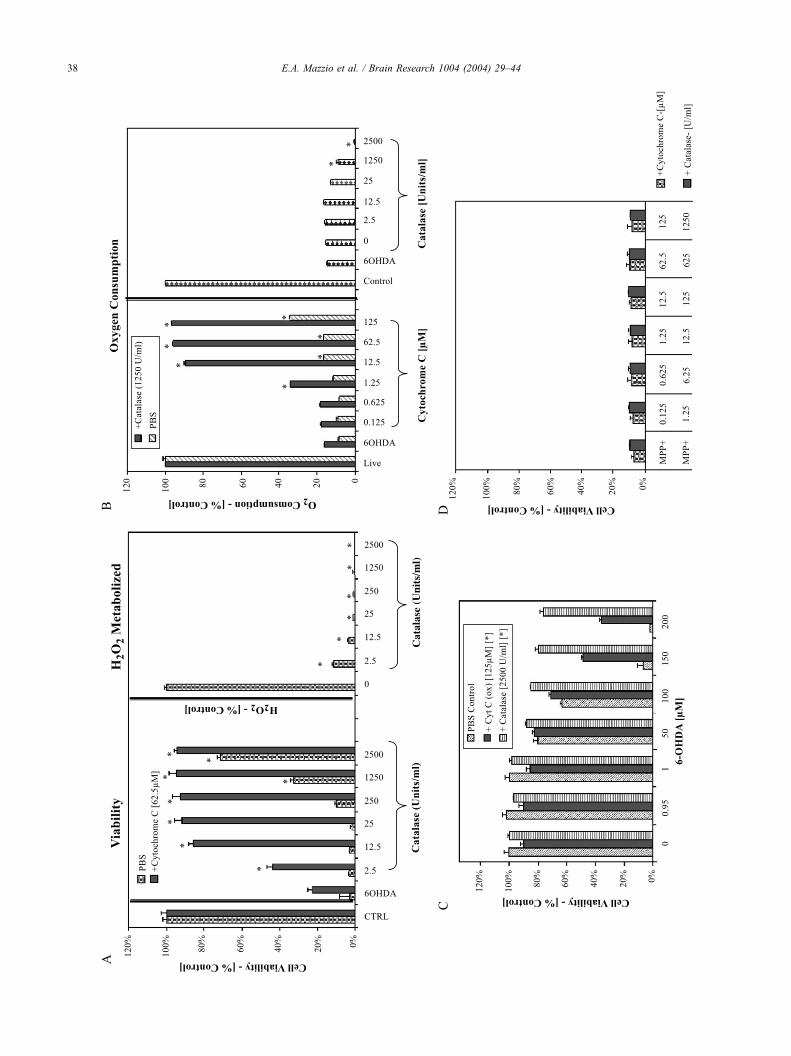
To define a specific role for H2O2 in cell death, we used
catalase rather than other antioxidants, such as GSH that
could potentially contribute to protective effects through
another mechanism. Due to the profound effects of 6-
OHDA on reduction of CYT-C, toxicity assays were
established to elucidate if exogenous CYT-C can provide
any protection in the absence or presence of catalase. The
effects of catalaseFCYT-C against 6-OHDA (175 AM)
toxicity after 24 h incubation are presented in Fig. 6A. The
right-hand panel displays the extent of H2O2 (500 AM)
metabolized within 1 min with varying concentration of
catalase. The left-hand panel demonstrates cell viability in
the presence of 6-OHDA with varying concentration of
catalaseF 62.5 AM of CYT-C. A remarkable synergistic
effect was evident, when combined 12.5 U/ml of catalase
and 62.5 AM CYT-C yielded 100% cytoprotection. Fig. 6B
demonstrates the effects of catalase and/or CYT-C on
restoring mitochondrial function during cytoprotection
against 6-OHDA (175 AM) after 24 h incubation. Fig.
6B, (right panel) demonstrates that the cytoprotection
observed in the presence of catalase does not restore
mitochondrial O2 consumption. Conversely, there is a
greater decline in cell respiration indicating efficient an-
aerobic compensatory survival. The data in Fig. 6B (left
panel) clearly indicate that while CYT-C alone leads to
E.A. Mazzio et al. / Brain Research 1004 (2004) 29–4438
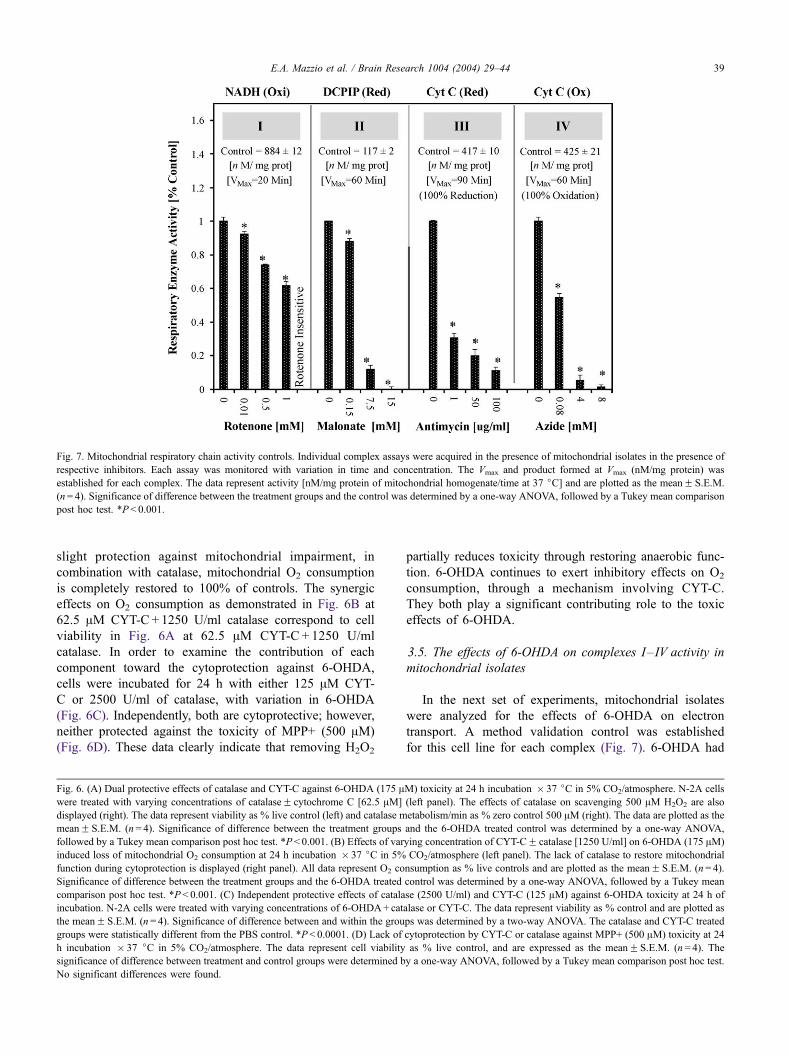
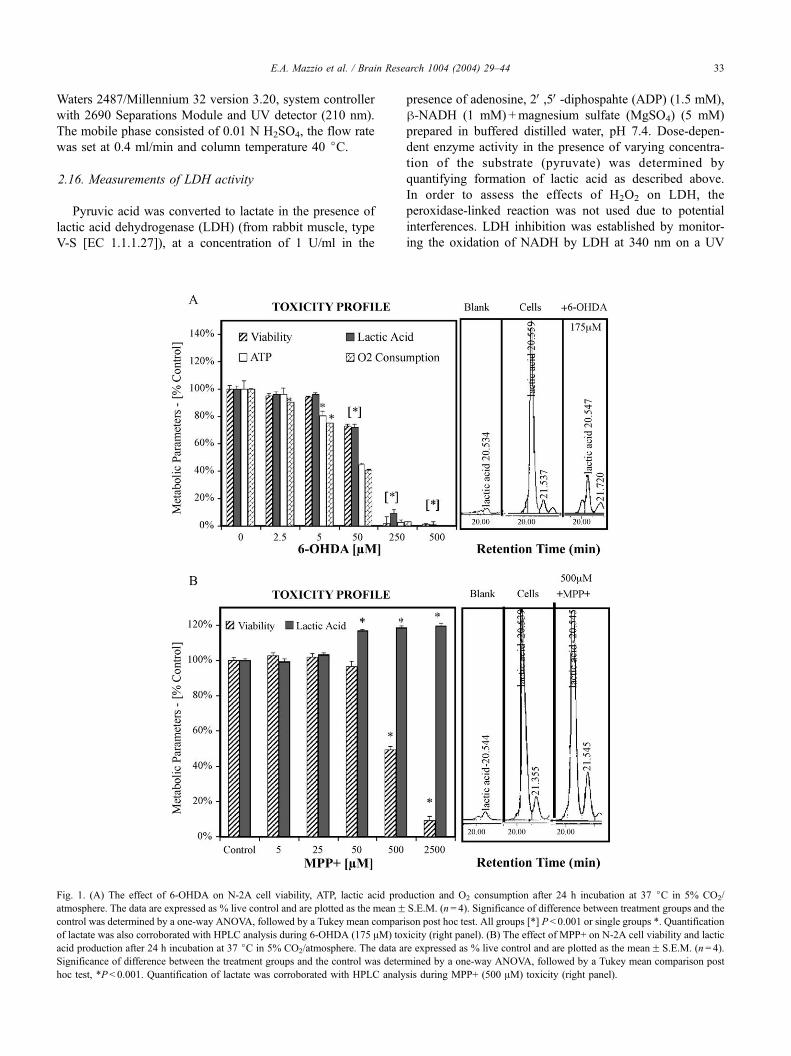
Fig. 7. Mitochondrial respiratory chain activity controls. Individual complex assays were acquired in the presence of mitochondrial isolates in the presence of
respective inhibitors. Each assay was monitored with variation in time and concentration. The Vmax and product formed at Vmax (nM/mg protein) was
established for each complex. The data represent activity [nM/mg protein of mitochondrial homogenate/time at 37 jC] and are plotted as the meanF S.E.M.
(n= 4). Significance of difference between the treatment groups and the control was determined by a one-way ANOVA, followed by a Tukey mean comparison
post hoc test. *P< 0.001.
E.A. Mazzio et al. / Brain Research 1004 (2004) 29–44 39
slight protection against mitochondrial impairment, in
combination with catalase, mitochondrial O2 consumption
is completely restored to 100% of controls. The synergic
effects on O2 consumption as demonstrated in Fig. 6B at
62.5 AM CYT-C + 1250 U/ml catalase correspond to cell
viability in Fig. 6A at 62.5 AM CYT-C + 1250 U/ml
catalase. In order to examine the contribution of each
component toward the cytoprotection against 6-OHDA,
cells were incubated for 24 h with either 125 AM CYT-
C or 2500 U/ml of catalase, with variation in 6-OHDA
(Fig. 6C). Independently, both are cytoprotective; however,
neither protected against the toxicity of MPP+ (500 AM)
(Fig. 6D). These data clearly indicate that removing H2O2
Fig. 6. (A) Dual protective effects of catalase and CYT-C against 6-OHDA (175 Awere treated with varying concentrations of catalaseF cytochrome C [62.5 AM]
displayed (right). The data represent viability as % live control (left) and catalase m
meanF S.E.M. (n= 4). Significance of difference between the treatment groups
followed by a Tukey mean comparison post hoc test. *P< 0.001. (B) Effects of var
induced loss of mitochondrial O2 consumption at 24 h incubation � 37 jC in 5%
function during cytoprotection is displayed (right panel). All data represent O2 co
Significance of difference between the treatment groups and the 6-OHDA treated
comparison post hoc test. *P < 0.001. (C) Independent protective effects of catala
incubation. N-2A cells were treated with varying concentrations of 6-OHDA+ cat
the meanF S.E.M. (n= 4). Significance of difference between and within the grou
groups were statistically different from the PBS control. *P< 0.0001. (D) Lack of
h incubation � 37 jC in 5% CO2/atmosphere. The data represent cell viability
significance of difference between treatment and control groups were determined b
No significant differences were found.
partially reduces toxicity through restoring anaerobic func-
tion. 6-OHDA continues to exert inhibitory effects on O2
consumption, through a mechanism involving CYT-C.
They both play a significant contributing role to the toxic
effects of 6-OHDA.
3.5. The effects of 6-OHDA on complexes I–IV activity in
mitochondrial isolates
In the next set of experiments, mitochondrial isolates
were analyzed for the effects of 6-OHDA on electron
transport. A method validation control was established
for this cell line for each complex (Fig. 7). 6-OHDA had
M) toxicity at 24 h incubation � 37 jC in 5% CO2/atmosphere. N-2A cells
(left panel). The effects of catalase on scavenging 500 AM H2O2 are also
etabolism/min as % zero control 500 AM (right). The data are plotted as the
and the 6-OHDA treated control was determined by a one-way ANOVA,
ying concentration of CYT-CF catalase [1250 U/ml] on 6-OHDA (175 AM)
CO2/atmosphere (left panel). The lack of catalase to restore mitochondrial
nsumption as % live controls and are plotted as the meanF S.E.M. (n= 4).
control was determined by a one-way ANOVA, followed by a Tukey mean
se (2500 U/ml) and CYT-C (125 AM) against 6-OHDA toxicity at 24 h of
alase or CYT-C. The data represent viability as % control and are plotted as
ps was determined by a two-way ANOVA. The catalase and CYT-C treated
cytoprotection by CYT-C or catalase against MPP+ (500 AM) toxicity at 24
as % live control, and are expressed as the meanF S.E.M. (n= 4). The
y a one-way ANOVA, followed by a Tukey mean comparison post hoc test.
E.A. Mazzio et al. / Brain Research 1004 (2004) 29–4440
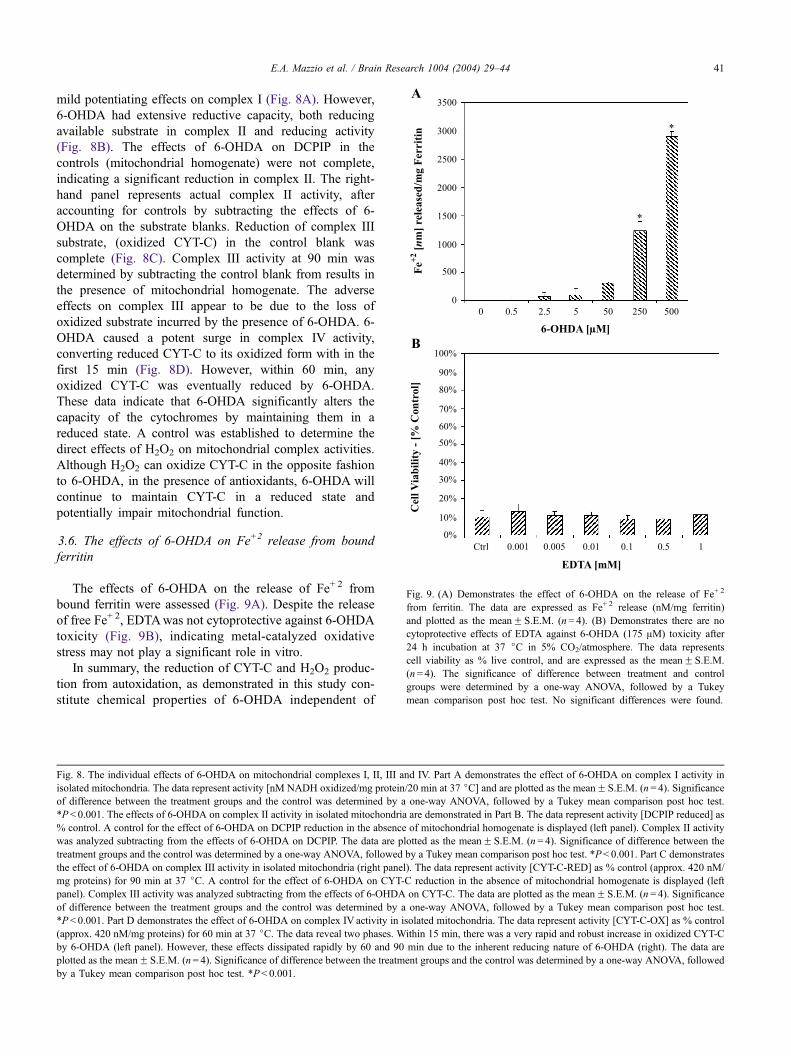
Fig. 9. (A) Demonstrates the effect of 6-OHDA on the release of Fe+ 2
from ferritin. The data are expressed as Fe+ 2 release (nM/mg ferritin)
and plotted as the meanF S.E.M. (n= 4). (B) Demonstrates there are no
cytoprotective effects of EDTA against 6-OHDA (175 AM) toxicity after
24 h incubation at 37 jC in 5% CO2/atmosphere. The data represents
cell viability as % live control, and are expressed as the meanF S.E.M.
(n= 4). The significance of difference between treatment and control
groups were determined by a one-way ANOVA, followed by a Tukey
mean comparison post hoc test. No significant differences were found.
E.A. Mazzio et al. / Brain Research 1004 (2004) 29–44 41
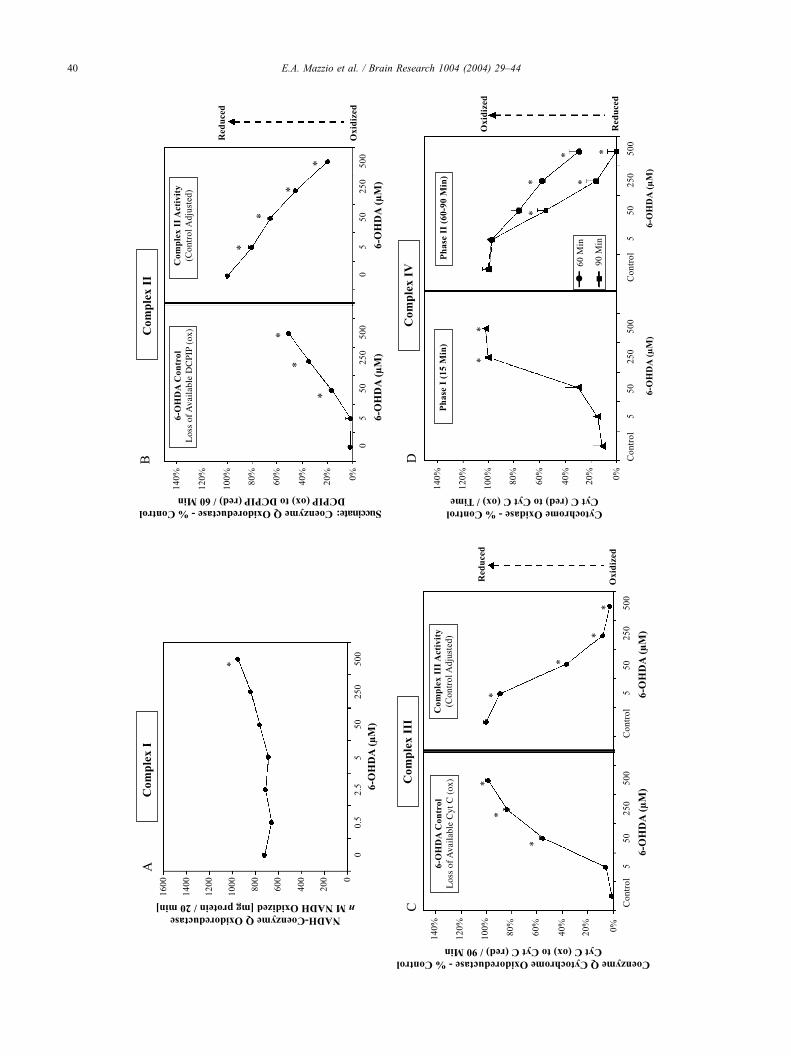
mild potentiating effects on complex I (Fig. 8A). However,
6-OHDA had extensive reductive capacity, both reducing
available substrate in complex II and reducing activity
(Fig. 8B). The effects of 6-OHDA on DCPIP in the
controls (mitochondrial homogenate) were not complete,
indicating a significant reduction in complex II. The right-
hand panel represents actual complex II activity, after
accounting for controls by subtracting the effects of 6-
OHDA on the substrate blanks. Reduction of complex III
substrate, (oxidized CYT-C) in the control blank was
complete (Fig. 8C). Complex III activity at 90 min was
determined by subtracting the control blank from results in
the presence of mitochondrial homogenate. The adverse
effects on complex III appear to be due to the loss of
oxidized substrate incurred by the presence of 6-OHDA. 6-
OHDA caused a potent surge in complex IV activity,
converting reduced CYT-C to its oxidized form with in the
first 15 min (Fig. 8D). However, within 60 min, any
oxidized CYT-C was eventually reduced by 6-OHDA.
These data indicate that 6-OHDA significantly alters the
capacity of the cytochromes by maintaining them in a
reduced state. A control was established to determine the
direct effects of H2O2 on mitochondrial complex activities.
Although H2O2 can oxidize CYT-C in the opposite fashion
to 6-OHDA, in the presence of antioxidants, 6-OHDA will
continue to maintain CYT-C in a reduced state and
potentially impair mitochondrial function.
3.6. The effects of 6-OHDA on Fe+2 release from bound
ferritin
The effects of 6-OHDA on the release of Fe+ 2 from
bound ferritin were assessed (Fig. 9A). Despite the release
of free Fe+ 2, EDTAwas not cytoprotective against 6-OHDA
toxicity (Fig. 9B), indicating metal-catalyzed oxidative
stress may not play a significant role in vitro.
In summary, the reduction of CYT-C and H2O2 produc-
tion from autoxidation, as demonstrated in this study con-
stitute chemical properties of 6-OHDA independent of
Fig. 8. The individual effects of 6-OHDA on mitochondrial complexes I, II, III and IV. Part A demonstrates the effect of 6-OHDA on complex I activity in
isolated mitochondria. The data represent activity [nM NADH oxidized/mg protein/20 min at 37 jC] and are plotted as the meanF S.E.M. (n= 4). Significance
of difference between the treatment groups and the control was determined by a one-way ANOVA, followed by a Tukey mean comparison post hoc test.
*P < 0.001. The effects of 6-OHDA on complex II activity in isolated mitochondria are demonstrated in Part B. The data represent activity [DCPIP reduced] as
% control. A control for the effect of 6-OHDA on DCPIP reduction in the absence of mitochondrial homogenate is displayed (left panel). Complex II activity
was analyzed subtracting from the effects of 6-OHDA on DCPIP. The data are plotted as the meanF S.E.M. (n= 4). Significance of difference between the
treatment groups and the control was determined by a one-way ANOVA, followed by a Tukey mean comparison post hoc test. *P< 0.001. Part C demonstrates
the effect of 6-OHDA on complex III activity in isolated mitochondria (right panel). The data represent activity [CYT-C-RED] as % control (approx. 420 nM/
mg proteins) for 90 min at 37 jC. A control for the effect of 6-OHDA on CYT-C reduction in the absence of mitochondrial homogenate is displayed (left
panel). Complex III activity was analyzed subtracting from the effects of 6-OHDA on CYT-C. The data are plotted as the meanF S.E.M. (n= 4). Significance
of difference between the treatment groups and the control was determined by a one-way ANOVA, followed by a Tukey mean comparison post hoc test.
*P < 0.001. Part D demonstrates the effect of 6-OHDA on complex IV activity in isolated mitochondria. The data represent activity [CYT-C-OX] as % control
(approx. 420 nM/mg proteins) for 60 min at 37 jC. The data reveal two phases. Within 15 min, there was a very rapid and robust increase in oxidized CYT-C
by 6-OHDA (left panel). However, these effects dissipated rapidly by 60 and 90 min due to the inherent reducing nature of 6-OHDA (right). The data are
plotted as the meanF S.E.M. (n= 4). Significance of difference between the treatment groups and the control was determined by a one-way ANOVA, followed
by a Tukey mean comparison post hoc test. *P< 0.001.

E.A. Mazzio et al. / Brain Research 1004 (2004) 29–4442
biological systems. Both components appear to contribute to
the loss of aerobic and anaerobic function, respectively in
living cells.
4. Discussion
The data in this study demonstrate that 6-OHDA
toxicity is associated with simultaneous collapse of anaer-
obic and aerobic metabolism. Moreover, this study dem-
onstrates that H2O2 produced from autoxidation may
contribute to loss of anaerobic glycolysis, possibly through
inhibiting lactic acid dehydrogenase. The reductive prop-
erties of 6-OHDA on CYT-C in the presence of catalase
are potent, and may be contributing to impaired mitochon-
drial function. The complete loss of available CYT-C-OX
in the ETC would block proton translocation and electron
transfer at complex III. Fig. 9A corroborates previous
findings in that 6-OHDA can reduce Fe(III) to Fe(II),
initiating the release of free Fe from its bound form. Fig.
2B indicates a similar pattern, where the reduction of Fe
could lead to the stabilization of mitochondrial CYT-C-
RED. The data suggest that the toxic effects of 6-OHDA
may involve impaired oxidation–reduction events at com-
plex III (cytochrome c reductase) by preventing electrons
received from complex II, and those transferred to the
terminal receptor, being O2 in complex IV. These events
could potentially contribute to aerobic metabolic respirato-
ry failure and the loss of MOC, as clearly demonstrated in
this study.
The toxicity of 6-OHDA was associated with reduction
in lactic acid, ATP and whole-cell O2 consumption,
indicating complete metabolic collapse. The reduction in
lactate in the presence of 6-OHDA is unique from the
toxicological profiles observed with other mitochondrial
toxins. Typically, toxins such MPP+, target specific
damage to aerobic cell function and correspond to an
increase rather than a decrease in lactate as demonstrated
in Fig. 1B. The reduction in lactate during 6-OHDA
toxicity signifies destruction to functional anaerobic gly-
colysis. The loss of glycolysis appears to involve H2O2
contributing to a number of factors including LDH
inhibition and lipid peroxidation. Furthermore, a symbi-
otic relationship could exist between the two, where
structural damage could render anaerobic production of
ATP ineffective in driving membrane Na+,K+-ATPase
pumps to sustain voltage. Membrane depolarization could
prompt the abnormal influx of calcium ions through
voltage-linked channels, leading to excitotoxicity. How-
ever, data from our lab have indicated that the buffering
of intracellular calcium, or blocking Ca+ 2 ionic receptor-
linked excitatory channels do not spare 6-OHDA toxicity,
suggesting oxidative stress to be a predominant factor in
cellular injury.
Oxidative stress associated with 6-OHDA is thought to
contribute to morphological neurodegenerative lesions
[30]. This and previous research corroborate that partial
cytoprotection against 6-OHDA can be achieved with
antioxidants [5]. Our findings show significant protective
effects by the carboxylic acids. Oxaloacetate and a-
ketoglutarate are structurally similar to pyruvate, an
energy intermediate that can rapidly dissipate H2O2
[3,42] by converting it to water through decarboxylation
[13,27]. Pyruvic acid can also sustain energy by fueling
aerobic and anaerobic metabolism in neurons and other
tissue, indicating its powerful dual protective role [7,18].
NAC and GSH are also cytoprotective in vitro [4] and in
vivo against striatal degeneration induced by 6-OHDA
[2,36]. While H2O2 may play a significant role in neuro-
degeneration, 6-OHDA can also release free iron from
ferritin [9]. The combination of H2O2 with available
divalent metals could lead to the production of the
hydroxyl radical, which is biologically destructive. The
data in this study demonstrated that metal-catalyzed
oxidative stress does not play a role in vitro, where
EDTA did not offer cytoprotection. Ferritin is localized
primarily in glia and oligodendrocytes [8] indicating these
cells may play a more predominant role in the toxic
cascade of events that occur in vivo. For this reason,
administration of EDTA or desferrioxamine can attenuate
6-OHDA toxicity in vivo, where neurodegeneration may
be multifaceted [20].
The mechanism of mitochondrial impairment by 6-
OHDA appears to be unique from typical mitochondrial
toxins. Toxic substances such as MPP+, malonate, anti-
mycin, and sodium azide led to catalytic inactivation of
complexes I, II, III and IV, halting mitochondrial respira-
tion. This is corroborated by the data presented in this
study, where these toxins did not affect the redox of
enzyme substrates in blank control groups (Fig. 7, data
on control groups not shown). In contrast, control blanks
for 6-OHDA exhibited reduction of oxidized substrate, in
the absence of mitochondria homogenate (Fig. 8, control
blanks shown). Furthermore, addition of CYT-C and cat-
alase did not offer cytoprotection against the toxicity of
MPP+ (Fig. 6D), because its mechanism does not involve
altering the redox state of the cytochromes or production
of ROS. Unlike 6-OHDA, protection against MPP+ is
achieved by driving anaerobic glycolysis with additional
glucose [24,39]. On the other hand, complete cytoprotec-
tion against 6-OHDA was achieved with CYT-C + catalase
(Fig. 6A–C), indicating that reductive properties of 6-
OHDA may play a paramount role in mitochondrial
impairment.
A hypothetical schematic for how 6-OHDA may
impact mitochondrial function is displayed in Fig. 10.
We found no direct inhibitory effects on complex I in
contrast to previous research [14] and noted inhibition of
complex II activity by 6-OHDA. The mechanism for this
is uncertain and future research will be required to
examine if 6-OHDA is reducing either the CYT-b or
ubiquinone content of complex II. Complex III activity
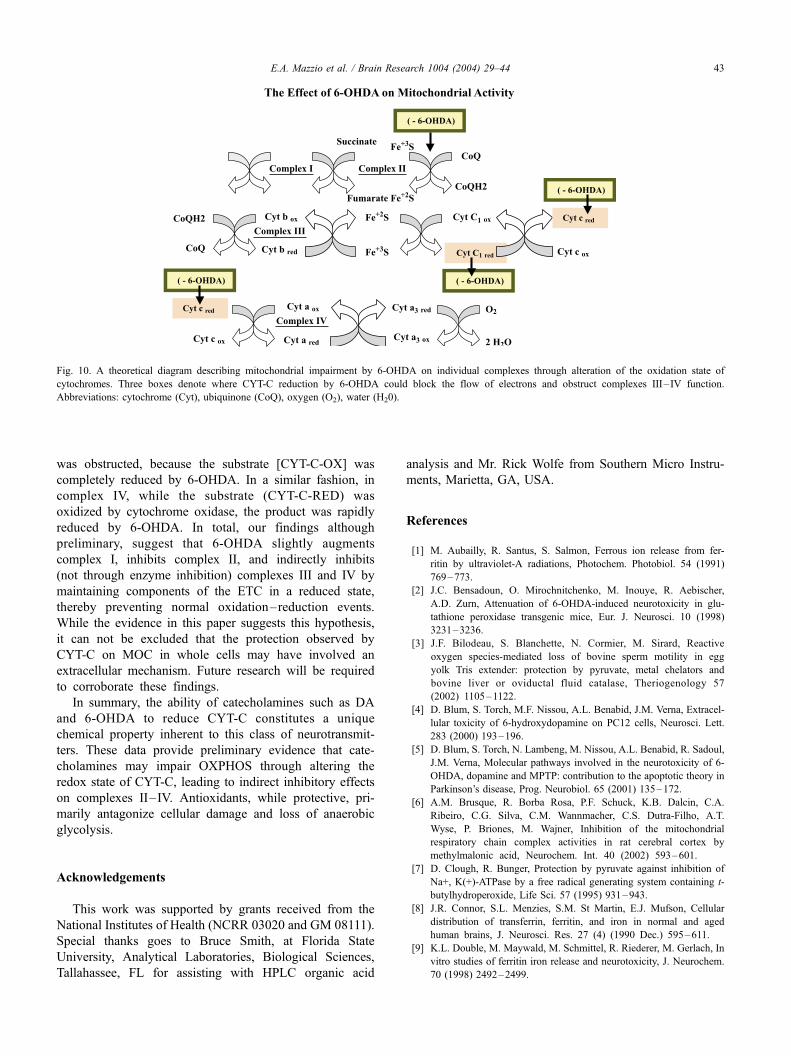
Fig. 10. A theoretical diagram describing mitochondrial impairment by 6-OHDA on individual complexes through alteration of the oxidation state of
cytochromes. Three boxes denote where CYT-C reduction by 6-OHDA could block the flow of electrons and obstruct complexes III– IV function.
Abbreviations: cytochrome (Cyt), ubiquinone (CoQ), oxygen (O2), water (H20).
E.A. Mazzio et al. / Brain Research 1004 (2004) 29–44 43
was obstructed, because the substrate [CYT-C-OX] was
completely reduced by 6-OHDA. In a similar fashion, in
complex IV, while the substrate (CYT-C-RED) was
oxidized by cytochrome oxidase, the product was rapidly
reduced by 6-OHDA. In total, our findings although
preliminary, suggest that 6-OHDA slightly augments
complex I, inhibits complex II, and indirectly inhibits
(not through enzyme inhibition) complexes III and IV by
maintaining components of the ETC in a reduced state,
thereby preventing normal oxidation–reduction events.
While the evidence in this paper suggests this hypothesis,
it can not be excluded that the protection observed by
CYT-C on MOC in whole cells may have involved an
extracellular mechanism. Future research will be required
to corroborate these findings.
In summary, the ability of catecholamines such as DA
and 6-OHDA to reduce CYT-C constitutes a unique
chemical property inherent to this class of neurotransmit-
ters. These data provide preliminary evidence that cate-
cholamines may impair OXPHOS through altering the
redox state of CYT-C, leading to indirect inhibitory effects
on complexes II–IV. Antioxidants, while protective, pri-
marily antagonize cellular damage and loss of anaerobic
glycolysis.
Acknowledgements
This work was supported by grants received from the
National Institutes of Health (NCRR 03020 and GM 08111).
Special thanks goes to Bruce Smith, at Florida State
University, Analytical Laboratories, Biological Sciences,
Tallahassee, FL for assisting with HPLC organic acid
analysis and Mr. Rick Wolfe from Southern Micro Instru-
ments, Marietta, GA, USA.
References
[1] M. Aubailly, R. Santus, S. Salmon, Ferrous ion release from fer-
ritin by ultraviolet-A radiations, Photochem. Photobiol. 54 (1991)
769–773.
[2] J.C. Bensadoun, O. Mirochnitchenko, M. Inouye, R. Aebischer,
A.D. Zurn, Attenuation of 6-OHDA-induced neurotoxicity in glu-
tathione peroxidase transgenic mice, Eur. J. Neurosci. 10 (1998)
3231–3236.
[3] J.F. Bilodeau, S. Blanchette, N. Cormier, M. Sirard, Reactive
oxygen species-mediated loss of bovine sperm motility in egg
yolk Tris extender: protection by pyruvate, metal chelators and
bovine liver or oviductal fluid catalase, Theriogenology 57
(2002) 1105–1122.
[4] D. Blum, S. Torch, M.F. Nissou, A.L. Benabid, J.M. Verna, Extracel-
lular toxicity of 6-hydroxydopamine on PC12 cells, Neurosci. Lett.
283 (2000) 193–196.
[5] D. Blum, S. Torch, N. Lambeng, M. Nissou, A.L. Benabid, R. Sadoul,
J.M. Verna, Molecular pathways involved in the neurotoxicity of 6-
OHDA, dopamine and MPTP: contribution to the apoptotic theory in
Parkinson’s disease, Prog. Neurobiol. 65 (2001) 135–172.
[6] A.M. Brusque, R. Borba Rosa, P.F. Schuck, K.B. Dalcin, C.A.
Ribeiro, C.G. Silva, C.M. Wannmacher, C.S. Dutra-Filho, A.T.
Wyse, P. Briones, M. Wajner, Inhibition of the mitochondrial
respiratory chain complex activities in rat cerebral cortex by
methylmalonic acid, Neurochem. Int. 40 (2002) 593–601.
[7] D. Clough, R. Bunger, Protection by pyruvate against inhibition of
Na+, K(+)-ATPase by a free radical generating system containing t-
butylhydroperoxide, Life Sci. 57 (1995) 931–943.
[8] J.R. Connor, S.L. Menzies, S.M. St Martin, E.J. Mufson, Cellular
distribution of transferrin, ferritin, and iron in normal and aged
human brains, J. Neurosci. Res. 27 (4) (1990 Dec.) 595–611.
[9] K.L. Double, M. Maywald, M. Schmittel, R. Riederer, M. Gerlach, In
vitro studies of ferritin iron release and neurotoxicity, J. Neurochem.
70 (1998) 2492–2499.
E.A. Mazzio et al. / Brain Research 1004 (2004) 29–4444
[10] M. Ebadi, P. Govitrapong, S. Sharma, D. Muralikrishnan, S. Shavali,
L. Pellett, R. Schafer, C. Albano, J. Eken, Ubiquinone (coenzyme
q10) and mitochondria in oxidative stress of Parkinson’s disease, Biol.
Signals Recept. 10 (2001) 224–253.
[11] S.M. Evans, A. Casartelli, E. Herreros, D.T. Minnick, C. Day, E.
George, C. Westmoreland, Development of a high throughput in
vitro toxicity screen predictive of high acute in vivo toxic poten-
tial, Toxicol. In Vitro 15 (2001) 579–584.
[12] M.F. Galindo, J. Jordan, C. Gonzalez-Garcia, V. Cena, Chromaffin
cell death induced by 6-hydroxydopamine is independent of mito-
chondrial swelling and caspase activation, J. Neurochem. 84 (2003)
1066–1073.
[13] A.R. Giandomenico, G.E. Cerniglia, J.E. Biaglow, C.W. Stevens,
C.J. Koch, The importance of sodium pyruvate in assessing dam-
age produced by hydrogen peroxide, Free Radic. Biol. Med. 23
(1997) 426–434.
[14] Y. Glinka, K.F. Tipton, M.B. Youdim, Mechanism of inhibition of
mitochondrial respiratory complex I by 6-hydroxydopamine and its
prevention by desferrioxamine, Eur. J. Pharmacol. 351 (1998)
121–129.
[15] K.S. Ha, K.M. Kim, Y.G. Kwon, S.K. Bai, W.D. Nam, Y.M. Yoo,
P.K. Kim, H.T. Chung, T.R. Billiar, Y.M. Kim, Nitric oxide pre-
vents 6-hydroxydopamine-induced apoptosis in PC12 cells through
cGMP-dependent PI3 kinase/Akt activation, FASEB J. 17 (2003)
1036–1047.
[16] A. Holt, D.F. Sharman, G.B. Baker, M.M. Palcic, A continuous spec-
trophotometric assay for monoamine oxidase and related enzymes in
tissue homogenates, Anal. Biochem. 244 (1997) 384–392.
[17] J.S. Hothersall, A.L. Greenbaum, P. McLean, The functional signifi-
cance of the pentose phosphate pathway in synaptosomes: protection
against peroxidative damage by catecholamines and oxidants, J. Neu-
rochem. 39 (1982) 1325–1332.
[18] Y. Izumi, A.M. Benz, C.F. Zorumski, J.W. Olney, Effects of lactate
and pyruvate on glucose deprivation in rat hippocampal slices, Neuro-
Report 31 (1994) 617–620.
[19] K.H. Jones, J.A. Senft, An improved method to determine cell via-
bility by simultaneous staining with fluorescein diacetate-propidium
iodide, J. Histochem .Cytochem. 33 (1985) 77–79.
[20] H. Kabuto, L. Yokoi, E. Iwata-Ichikawa, N. Ogawa, EPC-K1, a hy-
droxyl radical scavenger, prevents 6-hydroxydopamine-induced do-
pamine depletion in the mouse striatum by up-regulation of catalase
activity, Neurochem. Res. 24 (1999) 1543–1548.
[21] J.W. Langston, P. Ballard, J.W. Tetrud, I. Irwin, Chronic parkinsonism
in humans due to a product of meperidine-analog synthesis, Science
219 (1983) 979–980.
[22] O.J. Lowry, N.J. Rosebrough, A.L. Farr, R.J. Randall, Protein
measurement with Folin phenol reagent, J. Biol. Chem. 193
(1951) 265–275.
[23] M.J. Marti, J. Saura, R.E. Burke, V. Jackson-Lewis, A. Jimenez, M.
Bonastre, E. Tolosa, Striatal 6-hydroxydopamine induces apoptosis
of nigral neurons in the adult rat, Brain Res. 958 (2002) 185–191.
[24] E. Mazzio, K.F. Soliman, Pyruvic acid cytoprotection against 1-meth-
yl-4-phenylpyridinium, 6-hydroxydopamine and hydrogen peroxide
toxicities in vitro, Neurosci. Lett. 337 (2003) 77–80.
[25] E. Mazzio, K.F.A. Soliman, Cytoprotection of pyruvic acid and re-
duced beta-nicotinamide adenine dinucleotide against hydrogen per-
oxide toxicity in neuroblastoma cells, Neurochem. Res. 28 (2003)
733–741.
[26] E. Mazzio, K.F.A. Soliman, (+)-Glucose rescue against 1-methyl-4-
phenylpyridinium toxicity through anaerobic glycolysis in neuroblas-
toma cells, Brain Res. 962 (2003) 48–60.
[27] K.A. Nath, E.O. Ngo, R.P. Hebbel, A.J. Croatt, B. Zhou, L.M. Nutter,
Alpha-ketoacids scavenge H2O2 in vitro and in vivo and reduce
menadione-induced DNA injury and cytotoxicity, Am. J. Physiol.
268 (1995) C227–C236.
[28] M.F. Notter, I. Irwin, J.W. Langston, D.M. Gash, Neurotoxicity of
MPTP and MPP+ in vitro: characterization using specific cell lines,
Brain Res. 456 (1988) 254–262.
[29] Y. Oiwa, R. Sanchez-Pernaute, J. Harvey-White, K.S. Bankiewicz,
Progressive and extensive dopaminergic degeneration induced by
convection-enhanced delivery of 6-hydroxydopamine into the rat
striatum: a novel rodent model of Parkinson’s disease, J. Neurosurg.
98 (2003) 136–144.
[30] M. Rodriguez, P. Barroso-Chinea, P. Abdala, J. Obeso, T. Gonza-
lez-Hernandez, Dopamine cell degeneration induced by intraven-
tricular administration of 6-hydroxydopamine in the rat: similarities
with cell loss in Parkinson’s disease, Exp. Neurol. 169 (2001)
163–181.
[31] A. Sachinidis, I. Gouni-Berthold, C. Seul, S. Seewald, Y. Ko, U.
Schmitz, H. Vetter, Early intracellular signaling pathway of etha-
nol in vascular smooth muscle cells, Br. J. Pharmacol. 128 (1999)
1761–1771.
[32] M. Santiago, L. Granero, A. Machado, J. Cano, Complex I inhib-
itor effect on the nigral and striatal release of dopamine in the
presence and absence of nomifensine, Eur. J. Pharmacol. 280
(1995) 251–256.
[33] K. Seth, A.K. Agrawal, M.H. Aziz, A. Ahmad, Y. Shukla, N.
Mathur, P.K. Seth, Induced expression of early response genes/
oxidative injury in rat pheochromocytoma (PC12) cell line by 6-
hydroxydopamine: implication for Parkinson’s disease, Neurosci.
Lett. 330 (2002) 89–93.
[34] K. Seya, N. Ohkohchi, N. Watanabe, H. Shibuya, Y. Taguchi, S. Mori,
Rapid fluoremetric assay for mitochondrial proton adenosine triphos-
phatase activity for assessment of viability of liver graft tissue, J. Clin.
Lab. Anal. 8 (1994) 418–423.
[35] E. Shimizu, K. Hashimoto, N. Komatsu, M. Iyo, Roles of endogenous
glutathione levels on 6-hydroxydopamine-induced apoptotic neuronal
cell death in human neuroblastoma SK–N–SH cells, Neuropharma-
cology 43 (2002) 434–443.
[36] R. Soto-Otero, E. Mendez-Alvarez, A. Hermida-Ameijeiras, A.M.
Munoz-Patino, J.L. Labandeira-Garcia, Autoxidation and neurotoxic-
ity of 6-hydroxydopamine in the presence of some antioxidants: po-
tential implication in relation to the pathogenesis of Parkinson’s
disease, J. Neurochem. 74 (2000) 1605–1612.
[37] K. Suzuki, Y. Mizuno, M. Yoshida, Effects of 1-methyl-4-phenyl-
1,2,3,6-tetrahydropyridine (MPTP)-like compounds on mitochondrial
respiration, Adv. Neurol. 53 (1990) 215–218.
[38] K.J. Thompson, S. Shoham, J.R. Connor, Iron and neurodegenerative
disorders, Brain Res. Bull. 55 (2001) 155–164.
[39] A. Woodgate, G. MacGibbon, M. Walton, M. Dragunow, The toxicity
of 6-hydroxydopamine on PC12 and P19 cells, Brain Res. Mol. Brain
Res. 69 (1999) 84–92.
[40] Y. Zhang, V.L. Dawson, T.M. Dawson, Oxidative stress and genetics
in the pathogenesis of Parkinson’s disease, Neurobiol. Dis. 7 (2000)
240–250.
[41] J. Zhang, E.R. Block, J.M. Patel, Down-regulation of mitochondrial
cytochrome c oxidase in senescent porcine pulmonary artery endo-
thelial cells, Mech. Ageing Dev. 123 (2002) 1363–1374.
[42] F.Q. Zhou, Advantages of pyruvate over lactate in peritoneal dialysis
solutions, Acta Pharm. Sin. 22 (2001) 385–392.