Sage-Grouse and Wind Energy: Biology, Habits, and Potential Effects from Development

Digital Object Identifier (DOI):10.1007/s00285-002-0183-5
J. Math. Biol. 48, 119–134 (2004) Mathematical Biology
Rachel Norman · David Ross · M. Karen Laurenson · Peter J. Hudson
The role of non-viraemic transmission on thepersistence and dynamics of a tick borne virus –Louping ill in red grouse (Lagopus lagopus scoticus)and mountain hares (Lepus timidus)
Received: 29 August 2002 /Published online: 6 August 2003 – c© Springer-Verlag 2003
Abstract. There exist many tick borne infections that are of either economic or public healthinterest. Mathematical models have previously been used to describe the dynamics of theseinfections. However it has recently come to light that there is an alternative mechanism forthe transmission of these diseases that has not been considered in a modelling framework.This is transmission through ticks co-feeding on non-viraemic hosts. This paper extends asimple mathematical model to include this alternative transmission mechanism. The modelis used to describe the dynamics of Louping ill virus in red grouse (the viraemic host) andhares (the non-viraemic host). However, these results are applicable to many other systems.The model is analysed using joint threshold density curves. It is found that the presence of anon-viraemic host allows the virus to persist more readily than it would in the presence of ahost that simply amplified the tick population. More importantly, if the level of non-viraemictransmission is high enough the virus can persist in the absence of the viraemic host. Thisresult has important implications for the control of tick borne diseases.
Introduction
Tick borne–viruses are known to have a significant impact on human, livestock andwild animal populations in the tropical and temperate parts of the world (Sonenshineand Mather 1994). However, the dynamics of infection are complicated in tickborne virus systems since ticks feed on a wide range of host species and efficiencyof transmission from host to tick and tick to host varies between host species.
Transmission from host to tick is generally believed to occur when ticks biteand feed on the blood of a viraemic host (e.g. Beasley et al 1978). However, inrecent years it has become clear that pathogen transmission can occur through a
R. Norman, D. Ross: Stirling Mathematical Ecology Group, Department of Computing Sci-ence and Mathematics, University of Stirling, Stirling, FK9 4LA, UK.e-mail: [email protected]
M. K. Laurenson: CVTM, Department of Tropical Animal Health, University of Edinburgh,Easter Bush, Roslin, Midlothian, EH25 9RG, UK
P. J. Hudson: Stirling Mathematical Ecology Group, Department of Biological and Molec-ular Sciences, University of Stirling, Stirling FK9 4LA, UK
Key words or phrases: Tick borne disease – Coupled differential equations – Co-feeding –Louping ill – Multiple hosts

120 R. Norman et al.
number of other routes. For example transmission between infected anduninfected ticks that co-feed on a host can occur in the absence of systemic infection(Jones et al 1987). This has been shown to occur for both viruses and bacteria(Randolph et al 1996). There is evidence that this transmission occurs due to hostmodification at the feeding site and is facilitated by tick saliva (Jones et al 1992,Labuda et al 1993a). However, non-viraemic transmission does not occur on allhost species. For example, in the Louping ill system it has been shown to occur onMountain hares (Lepus timidus) but transmission has not been recorded on red deer(Cervus elaphus), New Zealand white rabbits or domestic sheep although furtherinvestigation is still needed (Jones et al 1997). Furthermore, non viraemic trans-mission has also been observed in mountain hares after sero - conversion implyingthat such hosts may provide suitable habitat for transmission for much longer thannormal viraemic hosts. Indeed if such hosts are relatively abundant they could pro-vide the main route of virus transmission and be the principal mechanism for viruspersistence.
A number of mathematical models have been formulated to describe transmis-sion of tick borne diseases through the normal systemic route (e.g. Cooksey et al1990, O’Callaghan et al 1998, Norman et al 1999). However, such models have notincluded the non-viraemic transmission route so the aim of this paper is to incorpo-rate this transmission mechanism. Specifically we will address three questions:
1) How does non-viraemic transmission alter the dynamics of infection?2) How does it influence virus persistence?3) Are these results applicable to other systems?
Whilst non-viraemic transmission has now been recorded in several differentsystems (e.g. Labuda et al 1993b, Jones et al 1990), we will concentrate initiallyon our system; Louping ill virus which has two viraemic hosts, red grouse (Lag-opus lagopus scoticus) and sheep and where non- viraemic transmission occurs inMountain Hares (Lepus timidus) (Jones et al 1997).
Louping ill
Louping ill is a tick borne virus transmitted by the sheep tick Ixodes ricinus. Whilstthe tick bites a wide variety of hosts it is only in sheep, grouse and 2% of shorttailed voles that the virus invokes a viraemic response sufficiently high for ticksto become infected through the systemic route of infection (Hudson et al 1995).Although Louping ill has economic implications for sheep farmers it is usuallycontrolled in sheep by vaccination and regular treatment with acaricides. Grouse,on the other hand, suffer substantial losses from the disease with 80% of those in-fected with the virus dying (Reid 1978, Hudson 1992). These huge losses coupledwith the fact that adult ticks do not feed on grouse should mean that, if sheep areeffectively removed from the system through vaccination and dipping, then the vi-rus would not persist. In a number of areas, the disease in grouse has been reducedthrough sheep management. However, Louping ill is still prevalent in some parts ofScotland despite applying sheep management procedures. Persistence of the viruscould occur for several possible reasons that are explored by Hudson et al 1995. In

The dynamics of non-viraemic transmission 121
their study they provide evidence to suppose that the presence of the mountain haresplays an important role in the persistence of Louping ill virus. This could operate ina combination of one or two ways. First hares could act as a maintenance host forthe tick vectors and this could allow virus persistence. A generalised mathematicalmodel of tick borne viruses which included a viraemic host and a secondary tickhost that simply allowed adult feeding of ticks showed that for medium densitiesof the non-viraemic host, the virus could persist in areas where it would not persistin the presence of the viraemic hosts alone (Norman et al 1999). This modellingalso showed that if non-viraemic host abundance is too high this could result in thevirus being lost from the system through wasted bites (Norman et al 1999). We nowextend this model to incorporate recent experimental work that shows that harescan act as non-viraemic hosts to Louping ill, permitting the virus to be transmittedbetween co-feeding ticks (Jones et al 1997).
The approach in this paper is to present a simple deterministic model for thetransmission of the virus which causes Louping ill. We parameterise this model forthe Louping ill system before analysing the model output in terms of the possibleimplications of non-viraemic transmission in the Louping ill system.
Biological Assumptions of the model
The dynamics of the tick vector are based on the biology of the tick Ixodes rici-nus that transmits the virus that causes Louping ill. This tick has a life cycle thatdevelops from the egg through two immature stages (larva and nymph) to the adultstage. Each immature stage requires a blood meal from a suitable vertebrate host.The adult female requires a meal before producing eggs once and then dying. Adultfemales can only obtain a feed from large mammals i.e. hares and not grouse, whilstthe immature stages will also feed on smaller warm-blooded vertebrates such asgrouse chicks. Once a questing tick locates a host it generally feeds for severaldays. The tick life cycle usually takes 3 to 4 years but can be longer dependingon host availability and climatic conditions, ticks need high relative humidity tosurvive.
Low tick burdens do not have a direct impact on the host (Hudson 1986, 1992).However, the virus is transmitted inter-stadially so once an immature stage is infect-ed the subsequent stages can transmit the virus to a susceptible host. Transovarialtransmission has not been recorded in the Louping ill system.
We assume that sheep play no part in the dynamics of the system and have beeneffectively removed through vaccination and acaricide treatment.
The model
The model presented here considers two hosts, a viraemic host that does not sup-port adult ticks and a non-viraemic host that supports all stages. We call these hostsgrouse (G) and hares (H) respectively. Grouse are assumed to be susceptible (s),infected (i) or immune (z) with total grouse density, G = Gs + Gi + Gz. Haresare assumed to be at a constant density H. For simplicity the tick stages are addedto give two equations for the tick dynamics, one for infected ticks (Ti) and one for
122 R. Norman et al.
susceptible ticks (Ts) with the total tick population, T = Ti + Ts . Despite this ad-dition of tick stages the parameters values used are calculated in a way which onlyaccounts for the specific tick stages which are involved in a particular mechanism.The model is an extension of the viraemic transmission model analysed previouslyby (Norman et al 1999). The rate of non-viraemic transmission is assumed to beproportional to the number of hares present, the number of infected ticks presentand the number of susceptible ticks present and therefore takes the form θHTiTs
where θ is a measure of the probability of non-viraemic transmission occurring.This is obviously a simple relationship and a more realistic one may be required todescribe the aggregated distribution of ticks. However, we do not currently have thedata available to support any such relationship and so we will start with the simplestone possible. The equations that describe the system are therefore as follows:
dGs
dt= (ag − sgG)G − bgGs − β1TiGs (1)
dGi
dt= β1TiGs − �Gi (2)
dGz
dt= γGi − bgGz (3)
dTs
dt= (aT − sT T )Tβ3H − bT Ts − β2TsGi − θTiTsH − β3TsH (4)
dTi
dt= θTiTsH + β2TsGi − bT Ti − β3TiH (5)
Where for grouse: ag is the per capita birth rate; sg is a measure of the densitydependent constraints acting on the birth rate of the population; bg is the per cap-ita natural death rate; β1 is the probability of an average tick biting a grouse andinfecting it per unit time; γ is the rate at which infectious grouse become immuneand � = α + bg + γ is the rate at which infectious grouse are lost from the systemand is the sum of the death rate due to the disease (α), the natural death rate andthe rate at which individuals become immune. For the ticks: aT is the per capitaproduction rate of larvae; sT is a measure of the density dependence acting on tickproduction rate; bT is the per capita natural death rate. β2 is the probability of anaverage tick biting a grouse and becoming infected per unit time; β3 is the proba-bility of an adult tick being female, biting a hare and then going on to reproduce perunit time before dying and being lost from the system. A measure of non-viraemictransmission is given by θ . In order to calculate the value of θ we really need totake into account the probabilities of susceptible and infected ticks co-feeding ona hare either spatially or temporally and, in addition, the probabilities of infection.
The dynamics of non-viraemic transmission 123
Parameter estimation
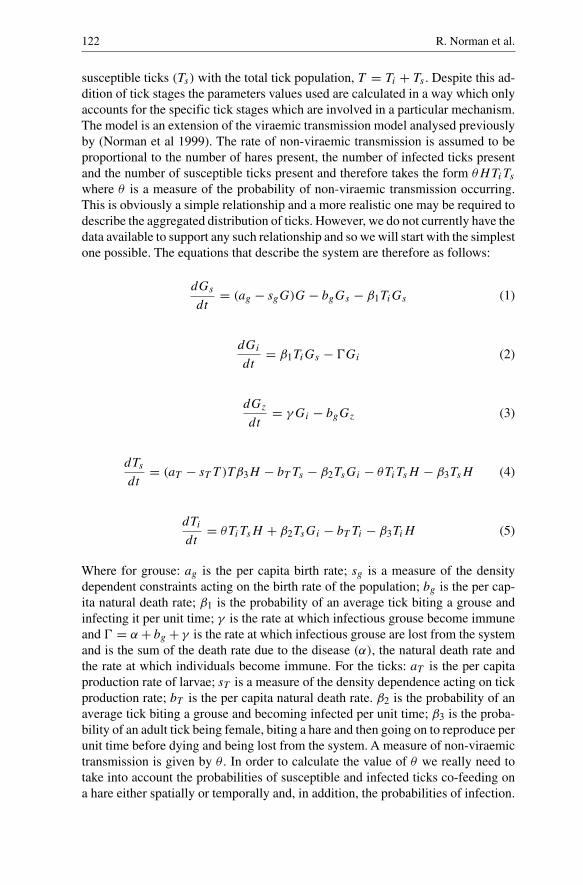
The parameters for the grouse-hare- Louping ill system are estimated from data inthe literature and from our current unpublished results (Table 1). All parameters arecalculated per month and we ignore seasonality in this simple model. Some of thelife history parameters are relatively trivial to calculate. For example, to calculatethe per capita reproductive rate of grouse, ag , we assume that breeding pairs ofgrouse have, on average four chicks per year (Hudson 1992), ignoring singletons,this gives a productivity of 2 chicks per bird per year which is 2/12 = 0.166 chicksper bird per month and hence ag = 0.166. We estimate α from the observation thatit takes approximately 13 days for a grouse to die from Louping ill (Reid 1975) andso the death rate due to the disease, α = 30/13 = 2.31 per month (assuming 30days per month). Since 80% of infected grouse die from the disease (Reid 1978,Hudson 1992) then γ is 4 times smaller than α therefore γ = 0.5775. The transmis-sion parameters are not so easy to measure. The βs are defined as the probability ofan average tick biting an average host and infection occurring per unit time. This isdifficult to estimate, however we do have information on tick biting rates on bothhares and grouse on a major study area in Scotland for the years 1993, 1994 and1995. In order to estimate the βs we make the simplifying assumptions that theratio of larvae to nymphs to adults remains constant and the ratio of ticks bitinghares to ticks biting grouse remains constant. We also assume that the probabilitiesof infection remain constant across tick life stages and across host species. Thetransmission parameters are defined as follows:
β1 is the probability of an average infectious tick biting an average grouse andinfecting it within a unit time. This can only occur within the nymph stage sinceadult ticks do not usually bite grouse. β2 is the probability of an average tick bitingan infected grouse and becoming infected so both larvae and nymphs contribute tothis term. β3 is the probability of an average female adult biting a hare and sub-sequently producing eggs and then larvae and takes into account the proportion ofthe tick population which is female. We can therefore rewrite the biting rates asβ1 = β, β2 = pβ and β3 = qβ. Using the data on tick biting rates described above,
Table 1. Parameter definitions, estimates and their sources.
Parameter Meaning Value per month Sourceag Per capita birth rate for
grouse0.166 Hudson 1992
bg Per capita natural deathrate of grouse
0.087 Jenkins et al 1967Hudson, 1992
α Death rate due to thedisease
2.31 Reid 1975
γ Rate of recovery fromthe disease
0.5775 Calculated from α
at Number of larvaeproduced per tick
83.33 Unpublished data
bt Natural death rate ofticks
0.0277 Unpublished data

124 R. Norman et al.
we estimate that p = 2.525 and q = 1.13. This leaves us with the single param-eter, β, to estimate and we analyse the model for several different values of thisparameter. Another parameter for which we have no estimate is the non-viraemictransmission parameter θ . Again, we consider several values of this parameter tostudy the possible effects of non-viraemic transmission in virus persistence.
Model analysis
Setting the derivatives of equations (1) to (5) to zero we find that there are sixpossible biologically relevant equilibria (see appendix A). Details of the stabilityanalyses of these equilibria are given in appendix B.
The trivial equilibrium has no grouse, ticks or disease present and is only stableif ag < bg and aT β3H < bT +β3H in other words if the death rate of both speciesis higher than their birth rates. One way of interpreting the second inequality is asthe basic reproductive number of the ticks, Ro,ticks < 1 where
Ro,ticks = aT β3H
bT + β3H
Ro,ticks can be derived directly from the equations. If we add equations (4) and (5)we see that if one tick was added to an area that had H hosts then it would livefor 1
bT +β3Hunits of time and produce aT β3H offspring per unit time and so in its
lifetime the initial tick would produce
Ro,ticks = aT β3H
bT + β3H.
The next simple case is no grouse and ticks all susceptible and at their car-rying capacity. This equilibria is only stable if ag < bg , aT β3H > bT + β3H
(Ro,ticks > 1) and θKT H < bT + β3H in other words if the grouse populationhas a negative growth rate, the tick population has a positive growth rate and thedisease cannot be spread non-viraemically because ticks die more quickly than theycan become infected through this route.
The third equilibria has no ticks present, no disease and grouse present at theircarrying capacity. This equilibria is stable, as we might expect, when ag > bg andRo,ticks < 1 i.e. the grouse have a positive growth rate and the ticks have a negativeone. The fourth equilibria has ticks and grouse both at their carrying capacities andno infection. This equilibria is stable if ag > bg , Ro,ticks > 1 and Ro,virus < 1where
Ro,virus = θHKT � + β2KT β1Kg
�(bT + β3H)
Again we can derive this formula from equations (1)–(5). Consider a system inwhich grouse are at their carrying capacity Kg , ticks are at their carrying capacityKT and hares are at density H. If we add one infected tick to this system Ro,virus
is the number of secondarily infected ticks caused by this primary infection. Fromequation (5) the tick would live for 1
bT +β3Hunits of time and produces β1Kg
bT +β3Hin-
fected grouse through feeding and θKT HbT +β3H
infected ticks through co-feeding. Each

The dynamics of non-viraemic transmission 125
infected grouse lives for 1�
units of time and produces β2KT
�infected ticks. Adding
these two routes of infection together gives
Ro,virus = β2KT β1Kg
�(bT + β3H)+ θKT H
bT + β3H
The next equilibrium is one with no grouse present and ticks at their carryingcapacity but with infection. This is stable if ag < bg , Ro,ticks > 1 and θKT H >
bT + β3H in other words if the grouse population has a negative growth rate,the tick population has a positive growth rate and the disease can be spread non-viraemically. The third inequality can be derived from the formula for Ro,virus > 1,given above, with Kg = 0.
The sixth and final equilibrium has grouse, ticks and virus all present and isassumed to be stable (or replaced by cycles) when ag > bg , Ro,ticks > 1 andRo,virus > 1. Numerical simulations support this assumption.
If we first consider Ro,ticks we see that it is not dependent on grouse density,this is because tick reproduction depends purely on hares since adult ticks do notbite grouse. Putting Ro,ticks = 1 gives us a threshold density of hares, HT , belowwhich the ticks cannot persist where,
HT = bT
(aT − 1)β3
For this threshold to be low, i.e. for ticks to persist easily we need a low natural tickdeath rate, a high tick birth rate and high biting rates for adult females.
In order to consider the effects of hares on the persistence of the virus whichcauses Louping ill we plot the curves Ro,virus = 1 in grouse-hare (K-H) parameterspace. We can identify the areas in parameter space in which the virus can andcannot persist. If we first consider the system without non-viraemic transmissionthen we have two parameter values for which we do not have estimates these areβ and sT so we vary these to see how the behaviour of the system is affected. Ifwe keep sT constant and vary β (Figure 1) we find that for large β the curve bendsback upon itself. This means that for a given value of grouse carrying capacity, Kg ,there are two threshold values of H. If there are too few hares then the life cycle ofthe ticks cannot be completed so there are too few ticks for the virus to persist. Ifthere are too many hares then, since there is no non-viraemic transmission in thiscase, the bites on hares are wasted in terms of the virus which becomes diluted inthe tick population and dies out. For smaller values of β the curve no longer bendsback on itself and this dilution effect disappears. It should be noted that for largervalues of β the grouse carrying capacities for which the virus cannot persist arevery low and it is unlikely that these values of β are realistic. For smaller valuesof β whilst the dilution effect has disappeared we need much higher densities ofhares and grouse present before the virus can persist.
If we vary sT we find that the curve does not change shape but moves alongthe Kg axis making persistence of the disease more or less likely depending onwhether sT is increased or decreased. (Figure 2). These changes in the thresholdgrouse carrying capacities are proportional to changes in sT , in other words if sT

126 R. Norman et al.
a b
dc
Fig. 1. Relationship between Ro,virus = 1 for four different values of β. All other parametervalues are as in Table 1 and sT = 0.00001. In figure 1a β = 0.01 and the threshold levelof hares, HT below which the ticks cannot persist is 0.0298. In figure 1b β = 0.001 andHT = 0.298. In figure 1c β = 0.0001 and HT = 2.98 and in figure 1d β = 0.00001 andHT = 29.8.
a b
dc
Fig. 2. Graphs to show the effect of changing sT on the persistence of the virus. In eachcase parameters are as in Table 1 and β = 0.0001. In figure 2a sT = 0.001, in figure 2bsT = 0.0001, in figure 2c sT = 0.00001 and in figure 2d sT = 0.000001.

The dynamics of non-viraemic transmission 127
is decreased by a factor of 10 then we need 10 times fewer grouse for persistence.This is because when sT is smaller then the carrying capacity of ticks is larger andso transmission is more likely.
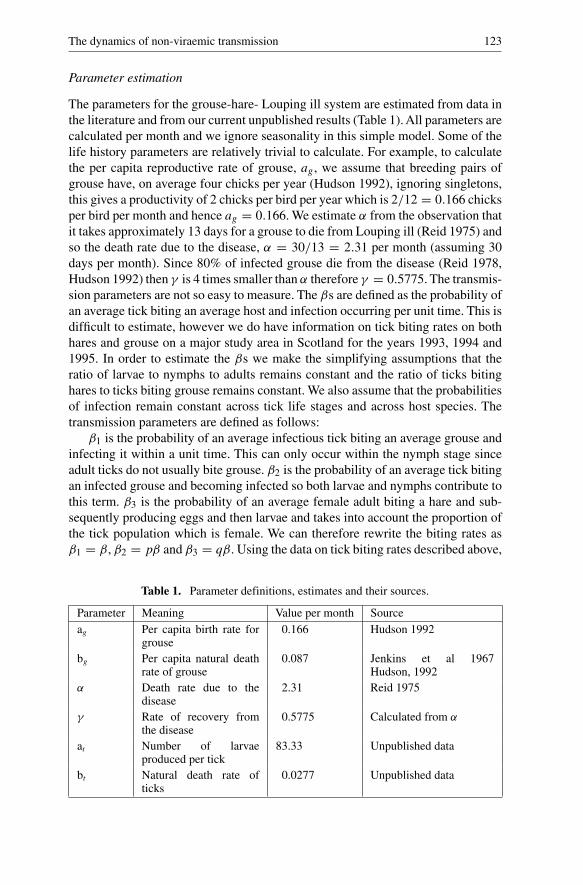
We now add in non-viraemic transmission. In this case we have no availableestimates for the value of θ and so we take different values and see the effect ofthis parameter on system behaviour. We consider two values of β and look at theeffect of increasing θ (Figure 3 and 4). Since Ro,ticks does not depend on θ we findthat HT does not change when we add non-viraemic transmission. In terms of viruspersistence we find that adding non-viraemic transmission to the model makes thevirus more likely to persist. This is mainly seen at low grouse carrying capacities.With the addition of non-viraemic transmission the dilution effect completely dis-appears. Indeed the curve now crosses the ‘Hare’ axis, this means that, for highenough non-viraemic transmission, even if an area could not support grouse thenthe virus could persist if there were enough hares, this result is confirmed by thestability analysis (equilibrium 5, Appendix A). One point of interest is the pointat which the Ro,virus curve crosses the hare axis and how this is influenced bythe amount of non-viraemic transmission occurring. If we assume that grouse can-not be sustained in an area, as shown above, we find Ro,virus = θKT H
bT +β3H. Setting
Ro,virus = 1 and rearranging we can find the threshold number of hares which haveto be present for virus persistence in this area. This gives us
H = bT
θKT − β3
a b
dc
Fig. 3. Graphs to show the effect of non-viraemic transmission on the persistence of thevirus. In each case the parameters are as in Table 1 with sT = 0.00001 and β = 0.0001. Infigures 3a to 3d θ takes the values 0, 1 × 10⁻¹⁰, 1 × 10⁻⁹ and 1 × 10⁻⁸ respectively.
128 R. Norman et al.
a b
dc
Fig. 4. Graphs to show the effect of non-viraemic transmission on the persistence of thevirus. In each case the parameters are as in Table 1 with sT = 0.00001 and β = 0.001. Infigures 4a to 4d θ takes the values 0, 1 × 10⁻¹⁰, 1 × 10⁻⁹ and 1 × 10⁻⁸ respectively.
It is clear that the hare threshold density is lowered if either the ticks are longlived or non-viraemic transmission is more likely to occur.
Discussion
Tick borne diseases are of increasing importance in terms of their economic andhealth implications. Some headway has been made in controlling some of these dis-eases through vaccination and acaricide treatments. However, it has recently cometo light that alternative mechanisms of transmission occur which might make controlof these viruses more difficult. One method that could be of particular importance isnon-viraemic transmission. This is known to occur in several systems and involvestransmission of the virus from an infected tick to a susceptible one when theyco-feed either spatially or temporally on a host that does not produce a viraemic re-sponse (Randolph et al 1996). This paper has used mathematical models to considerthe possible effects of non-viraemic transmission on the persistence of the virus.
We concentrated specifically on the Louping ill system in which we have twohosts, red grouse which produce a viraemic response and mountain hares which donot. A previous model of tick borne diseases in general (Norman et al 1999) hasshown that the presence of a non-viraemic hosts could amplify the tick populationenough to cause persistence of the virus in areas where it could not persist in theabsence of these hosts. However, it is also possible for too many non-viraemic hoststo be present for virus persistence since a ‘dilution effect’ occurs where tick bitesare wasted and the virus dies out (Norman et al 1999). These results are shownhere to be true, for some levels of virus transmission, for parameters that describe

The dynamics of non-viraemic transmission 129
the Louping ill system. However, these levels of transmission are unlikely to berealistic and it appears that the dilution effect is not important in the Louping illsystem. The effect of non-viraemic transmission, if it occurs frequently enough, isto remove any dilution effect that does occur and to generally increase the prob-ability that the virus can persist, particularly at low grouse carrying capacities.Indeed, if the non-viraemic transmission parameter and hare densities were bothhigh enough it would be possible for the hares to sustain the virus in areas wheregrouse are unable to persist. Unfortunately we do not yet have any idea of the levelsof non-viraemic transmission that occur in the field. However, this work suggeststhat non-viraemic transmission could be of great significance in virus persistencein the grouse-hare-Louping ill system.
Whilst the model results here are given for the Louping ill system the modelpresented could be applied to any tick borne virus system in which we have botha viraemic host and a non-viraemic host simply by changing the parameter val-ues. Other systems for which non-viraemic transmission is known to occur includetick-borne encephalitis (Labuda et al 1993b), Lyme disease (Ogden et al 1997) andThogoto virus (Jones et al 1990). Whilst we do not have estimates for the levelof non-viraemic transmission occurring in these systems there is evidence in theLyme disease system that it is significant. Recent work has shown that althoughsheep do not develop systemic infections Lyme disease cycles can be maintainedin habitats dominated by sheep (Ogden et al 1997). Whilst this does not validatethe model results it does provide evidence that they are biologically realistic.
Whilst the model presented here is very simple it produces a result which hasserious implications for disease control. That is, that we cannot simply considerviraemic hosts when we are thinking about the control of tick borne viruses. Wealso have to find out if the system has any non-viraemic hosts and consider waysof removing them from the transmission cycle as well. This will be made difficultby the fact that we will not be able to vaccinate against the virus in order to bringabout this removal since non-viraemic transmission can occur even if an immuneresponse has been mounted.
Appendix A: Equilibria
The biologically relevant equilibria for equations (1)–(5) are found by setting thederivatives equal to zero. We then get the following equilibria, written in the form(Gs, Gi, Gz, Ts, Ti).
1) (0, 0, 0, 0, 0), i.e. no grouse, ticks or disease present.
2) (0, 0, 0, KT , 0), i.e. no grouse or disease and ticks at their carrying capacity,KT , which is given by
KT = aT β3H − bT − β3H
sT β3H.
For this to be biologically relevant (i.e. positive) we need
aT β3H > bT + β3H.

130 R. Norman et al.
3) (Kg , 0, 0, 0, 0), i.e. no ticks or disease and grouse at their carrying capacity,Kg , which is given by
Kg = rg
sg
For this to be biologically relevant we need
rg > 0 i.e. ag > bg
4) (Kg , 0, 0, KT , 0), i.e. grouse and ticks both at their carrying capacity with nodisease present. Here Kg and KT are as given above and for this equilibrium tobe biologically relevant we need both
aT β3H > bT + β3H and ag > bg
5) (0, 0, 0, T +s , T +
i ), i.e. no grouse present but ticks and disease coexisting. In thiscase
T +s = bT + β3H
θH, which is always positive and
T +i = KT − bT + β3H
θH, which is only biologically relevant when
θHKT > bT + β3H.
6) (G∗s , G
∗i , G
∗z , T
∗s , T ∗
i ), i.e. ticks, grouse and disease coexisting together. Thisequilibrium is much more complicated than those above and is given by thefollowing formulae:
G∗ = 1
sg
(bg�
bg� + (bg + γ )β1T∗i
) (ag
(bg� + (bg + γ )β1T
∗i
bg�
)− bg − β1T
∗i
)
with
G∗s = bg�G∗
bg� + (bg + γ )β1T∗i
, G∗i = β1T
∗i G∗
s
�, and G∗
z = γβ1T∗i G∗
s
bg�.
The total tick population T is equal to KT , which has the same formula as givenabove. The susceptible tick density is given by KT − T ∗
i . Hence, we can write allof the densities in terms of the infectious tick density, T ∗
i . However, T ∗i is given by
the following cubic:
f (T ∗i ) = AT ∗3
i + BT ∗2i + CT ∗
i + D
whereA = θHsg(bg + γ )2β2
1
B = −θKT Hsg(bg + γ )2β21 + 2θHsg(bg + γ )β1�bg + β2β
21bgag(bg + γ )
−β2β21b2
g� + (bT + β3H)sg(bg + γ )2β21
C = −2θH�sgbg(bg + γ )β1KT + θH�2sgb2g − β2KT β2
1bgag(bg + γ )
+β2KT β21�b2
g + β2β1�b2gag − β2β1�b3
g + 2β1�sgbg(bg + γ )(bT + β3H)
D = −θHKT sg�2b2
g − β2KT β1�b2gag + β2KT β1�b3
g + �2b2gsg(bT + β3H)

The dynamics of non-viraemic transmission 131
In order to determine the properties of this cubic we will look at f(0) and f(KT ).
f (0) = D
= b2g�sg(�(bT + β3H) − θHKT � − β2β1KT Kg)
This is negative if R0,virus > 1 and hence we have either 1 or three positive roots.
f (KT ) = bT rg(bg + γ )2β21K2
T + β3Hrg(bg + γ )2β21K2
T + 2bT rg�bg(bg + γ )
×β1KT + 2β3Hrg�bg(bg + γ )β1KT + (bT + β3H)rg�2b2
g
which is positive as long as rg > 0. This means that there is at least one rootbetween 0 and KT and there may be three. Therefore, as long as Ro,virus > 1 andrg > 0 there is always at least one positive value for T ∗
i . If T ∗i is positive it is easy
to show that the other terms in the equilibrium are positive and so the coexistenceequilibrium exists. However, it has not been possible to show algebraically that thisequilibrium is unique, however, to date no numerical solutions of this system haveshown more than one positive coexistence equilibrium.
Appendix B: Stability
In order to check the local stability of the six biologically relevant equilibria de-scribed in appendix A we follow a standard method of analysis (Anderson and May1981). This is to perturb the system away from each equilibrium, and determinethe conditions under which it returns to the same equilibrium. This is done bydetermining the eigenvalues of the Jacobian evaluated at each equilibrium. If theeigenvalues have negative real parts then the equilibrium is stable.
The general form of the Jacobian is as follows:
ag − 2sgG − bg − β1Ti ag − 2sgG ag − 2sgG 0 −β1Gs
β1Ti −� 0 0 β1Gs
0 γ −bg 0 0
0 −β2Ts 0aT β3H − 2sT Tβ3H − bT
−β2Gi − θTiH − β3HaT β3H − 2sT Tβ3H − θTsH
0 β2Ts 0 θTiH + β2Gi θTsH − bT − β3H
1) At (0, 0, 0, 0, 0) the eigenvalues of the Jacobian are given by∣∣∣∣∣∣∣∣∣∣
ag − bg − λ ag ag 0 00 −� − λ 0 0 00 γ −bg − λ 0 00 0 0 aT β3H − bT − β3H − λ aT β3H
0 0 0 0 bT − β3H − λ
∣∣∣∣∣∣∣∣∣∣= 0
The solutions of this are ag−bg , −�, −bg , −bT −β3H and aT β3H −bT −β3H .Therefore this equilibrium is stable iff bg > ag and bT + β3H > aT β3H , in otherwords if death rates are higher than birth rates for both grouse and ticks.
2) At (0, 0, 0, KT , 0) the eigenvalues of the Jacobian are given by∣∣∣∣∣∣∣∣
ag − bg − λ ag ag 0 00 −� − λ 0 0 00 γ −bg − λ 0 00 −β2KT 0 aT β3H − 2sT KT β3H − bT − β3H − λ aT β3H − 2sT KT β3H − θKT H
0 β2KT 0 0 θKT H − bT − β3H − λ
∣∣∣∣∣∣∣∣=0

132 R. Norman et al.
The solutions of this are ag−bg , −�, −bg , −sT KT β3H and θKT H−bT −β3H .Therefore this equilibrium is stable iff bg > ag , KT > 0 i.e. bT + β3H < aT β3H
and θKT H < bT + β3H , in other words if grouse death rate is higher than grousebirth rates, if tick birth rate is higher than tick death rate and transmission on thenon-viraemic host cannot occur, i.e. ticks are lost more quickly than they transmitinfection.
3) At (Kg, 0, 0, 0, 0) the eigenvalues of the Jacobian are given by the following:∣∣∣∣∣∣∣∣∣∣
−rg − λ ag − 2rg ag − 2rg 0 −β1Kg
0 −� − λ 0 0 β1Kg
0 γ −bg − λ 0 00 0 0 aT β3H − bT − β3H − λ aT β3H
0 0 0 0 −bT − β3H − λ
∣∣∣∣∣∣∣∣∣∣= 0
The solutions of this are λ = −rg, −bT − β3H, −�, −bg and aT β3H − bT −β3H . Clearly the eigenvalues are negative iff rg > 0 and aT β3H < bT + β3H iegrouse reproductive rate is positive and tick reproductive rate is negative.
4) At (Kg, 0, 0, KT , 0) the eigenvalues of the Jacobian are given by the following∣∣∣∣∣∣∣∣∣∣
−rg − λ ag − 2rg ag − 2rg 0 −β1Kg
0 −� − λ 0 0 β1Kg
0 γ −bg − λ 0 00 −β2KT 0 sT KT β3H −λ aT β3H −2sT KT β3H −θKT H
0 β2KT 0 0 θKT H − bT − β3H − λ
∣∣∣∣∣∣∣∣∣∣= 0
The solutions of this are λ = −rg, −sT KT β3H, −bg and the solutions of∣∣∣∣−� − λ β1Kg
β2KT θKT H − bT − β3H − λ
∣∣∣∣ = 0
The first three solutions are negative as long as rg > 0 and aT β3H > bT +β3H .The determinant gives the following quadratic
λ2 + λ(� + bT + β3H − θKT H) − β1β2KgKT − �(θKT H − bT − β3H) = 0
which has roots with negative real parts iff �(bT +β3H) > θKT H�+β1β2KgKT
i.e. if R0,virus < 1.
5) At (0, 0, 0, T +s , T +
i ) the eigenvalues of the Jacobian are given by∣∣∣∣∣∣∣∣
rg − β1T+i − λ ag ag 0 0
β1T+i −� − λ 0 0 0
0 γ −bg − λ 0 00 −β2T
+s 0 −sT KT β3H − θT +
i H − λ aT β3H − 2sT KT β3H − θT +s H
0 β2T+s 0 θT +
i H θT +s H − bT − β3H − λ
∣∣∣∣∣∣∣∣= 0.
This can be split into two independent determinants∣∣∣∣∣∣rg − β1T
+i − λ ag ag
β1T+i −� − λ 0
0 γ −bg − λ
∣∣∣∣∣∣ = 0

The dynamics of non-viraemic transmission 133
and ∣∣∣∣−sT KT β3H − θT +i H − λ aT β3H − 2sT KT β3H − θT +
s H
θT +i H θT +
s H − bT − β3H − λ
∣∣∣∣ = 0.
Considering the first determinant we get the following cubic.
λ3 + λ2(� + bg + β1T+i − rg) + λ(�bg − β1T
+i rg + β1T
+i � − rg(� + bg))
−rgbg� + β1T+i αbg − β1T
+i rgbg − β1T
+i rgγ = 0
In order to see when this cubic has roots with negative real parts we check the RouthHurwitz conditions which say that if we have a cubic of the form
λ3 + Aλ2 + Bλ + C = 0
Then the roots have negative real parts iff A, B, C >0 and AB>C. In this case,we can see that these conditions hold if ag < bg i.e. if rg < 0. If we consider thesecond determinant we get the following quadratic:
λ2 + λ(sT KT β3H + θT +i H) − θT +
i H(aT β3H − 2sT KT β3H − θT +s H) = 0
In the case of a quadratic of the form
λ2 + Aλ + B = 0
The Routh Hurwitz conditions say that the roots have negative real parts iff A>0and B>0. In this case A>0 iff KT > 0 and T +
i > 0 and B>0 iff bT + β3H <
aT β3H . Therefore for stability and biological relevance of this equilibrium we needbT + β3H < aT β3H and θKT H > bT + β3H and ag < bg .
6) Due to the complexity of the algebraic analysis in this case, the coexistenceequilibrium in which grouse and ticks persist with the virus is assumed to be thestable equilibrium (or replaced with stable limit cycles) when none of the otherequilibria are stable. Numerical simulations back up this assumption.
References
Beasley, S.J., Campbell, J.A., Reid, H.W.: Threshold problems in infection of Ixodes ricinuswith the virus of Louping ill. Tick borne disease and their vectors. Proceedings of aninternational conference held in Edinburgh from 27th September to 1st October 1976.Edited by J.K.H Wilde (1978)
Cooksey, L.M., Haile, D.G., Mount, G.A.: Computer simulation of Rocky Mountain Spot-ted fever transmission by the American dog tick (Acari:ixodidae). J. Med. Ent. 27(4),671–680 (1990)
Hudson, P.J.: Red Grouse: the biology and management of a wild gamebird. The report ofthe North of England Grouse Research Project 1977–1985, Game Conservancy Trust,Fordingbridge (1986)
Hudson, P.J.: Grouse in space and time: the population biology of a managed gamebird.The report of the Game conservancy’s Scottish Grouse Research project and North ofEngland Grouse Research project. Game Conservancy Trust Fordingbridge (1992)
Hudson, P.J., Norman, R., Laurenson, M.K., Newborn, D., Gaunt, M., Jones, L., Reid, H.,Gould, E., Bowers, R., Dobson, A.: Persistence and transmission of tick-borne viruses:Ixodes ricinus and louping-ill virus in red grouse populations. Parasitology 111, 549–558(1995)

134 R. Norman et al.
Jenkins, D., Watson, A., Miller, G.R.: Population fluctuations in the red grouse Lagopuslagopus scoticus. J. Anim. Ecol. 36, 97–122 (1967)
Jones, L.D., Davies, C., Steele, G.M., Nuttall, P.A.: A novel mode of arbovirus transmissioninvolving a non-viraemic host. Science 237, 775–777 (1987)
Jones, L.D., Davies, C.R., Williams, T., Cory, J., Nuttall, P.A.: Non-viraemic transmissionof Thogoto virus- vector efficiency of Rhipicephalus appendiculatus and Amblyommavariegatum. Trans. Roy.Soc Trop.Med. Hyg. 84(6), 846–848 (1990)
Jones, L.D., Kaufman, W.R., Nuttall, P.A.: Modification of the skin feeding site by tick salivamediates virus transmission. Experientia 48(8), 779–782 (1992)
Jones, L.D., Gaunt, M., Hails, R.S., Laurenson, K., Hudson, P.J., Reid, H., Henbest, P.,Gould, E.A.: Efficient transfer of Louping ill virus between infected and uninfected ticksco-feeding on mountain hares (Lepus timidus). Med. Vet. Entomol. 142(6), 1181–1191(1997)
Labuda, M., Jones, L.D., Williams, T., Nuttall, P.A.: Enhancement of tick-borne encephalitistransmission by tick salivary gland extracts. Med. Vet. Entomol. 7(2), 193–196 (1993a)
Labuda, M., Nuttall, P.A., Kozuch, O., Eleckova, E., Williams, T., Zuffova, E., Sabo, A.:Non-viraemic transmission of tick-borne encephalitis virus: a mechanism for arbovirussurvival in nature. Experientia 49, 802–805 (1993b)
Norman, R., Bowers, R.G., Begon, M., Hudson, P.J.: Persistence of tick borne virus in thepresence of multiple host species: ticks act as reservoirs and result in parasite mediatedcompetition. J. Theor. Biol. 200, 111–118 (1999)
O’Callaghan, C.J., Medley, G.F., Peter, T.F., Perry, B.D.: Investigating the epidemiologyof heartwater (Cowdria ruminantium infection) by means of a transmission dynamicsmodel. Parasitology 117, 49–61 (1998)
Ogden, N.H., Nuttall, P.A., Randolph, S.E.: Natural Lyme disease cycles maintained viasheep by cofeeding ticks. Parasitology 115(6), 591–599 (1997)
Randolph, S.E., Gern, L., Nuttall, P.A.: Co-feeding ticks, Epidemiological significance fortick-borne pathogen transmission. Parasitology Today 12(12), 472–479 (1996)
Reid, H.W.: Experimental infection of red grouse with Louping ill virus (flavivirus group)I. The viraemia and antibody response. J. Comp. Path. 85, 223–229 (1975)
Reid, H.W.: The epidemiology of Louping ill. In: Wilde, J.K.H. (ed.), Tick Borne Diseaseand their Vectors. Proceedings of an International Conference held in Edinburgh 27thSeptember to 1st October 1976 (1978)
Sonenshine, D.E., Mather T.N.: Ecological dynamics of tick-borne zoonoses. O.U.P NewYork (1994)
Copyright © 2022 FDOKUMEN