THE ROLE OF LIABILITY, REGULATION AND ECONOMIC INCENTIVES IN BROWNFIELD REMEDIATION AND...
49
Department of Agricultural and Resource Economics The University of Maryland, College Park The Role of Liability, Regulation and Economic Incentives in Brownfield Remediation and Redevelopment: Evidence from Surveys of Developers by Anna Alberini, Alberto Longo, Stefania Tonin, Francesco Trombetta, and Margherita Turvani WP 02-21
-
Upload
independent -
Category
Documents
-
view
4 -
download
0
Transcript of THE ROLE OF LIABILITY, REGULATION AND ECONOMIC INCENTIVES IN BROWNFIELD REMEDIATION AND...
Department of Agricultural and Resource Economics
The University of Maryland, College Park
The Role of Liability, Regulation and Economic Incentives in
Brownfield Remediation and Redevelopment: Evidence from Surveys of Developers
by
Anna Alberini, Alberto Longo, Stefania Tonin, Francesco Trombetta, and Margherita Turvani
WP 02-21

THE ROLE OF LIABILITY, REGULATION AND ECONOMIC INCENTIVES IN BROWNFIELD
REMEDIATION AND REDEVELOPMENT: EVIDENCE FROM SURVEYS OF DEVELOPERS
By
Anna Alberini University of Maryland1
Alberto Longo
Dipartimento di Scienze Economiche, Universita’ di Venezia Ca’ Foscari
Stefania Tonin Istituto Universitario di Architettura di Venezia
Francesco Trombetta
Istituto Universitario di Architettura di Venezia
and
Margherita Turvani Istituto Universitario di Architettura di Venezia
26 November 2002
1 Contact Author: Anna Alberini, Department of Agricultural and Resource Economics, 2200 Symons Hall, University of Maryland, College Park, MD 20742. Telephone (001) 301 405-1267, Fax (001) 301 314-9091, e-mail: [email protected]. We wish to thank Peter B. Meyer and Kris Wernstedt, for their help and suggestions, and the participants of seminars at Queen’s University--Belfast, and the Fondazione ENI Enrico Mattei, Venice, for their comments. This research was funded by a grant from Consorzio per la Gestione del Centro di Coordinamento delle Attivita’ di Ricerca Inerenti al Sistema Lagunare di Venezia (CORILA) (Consortium for the Coordination of Research on the Venice Lagoon System).

2
The Role of Liability, Regulation and Economic Incentives in Brownfield Remediation and
Redevelopment: Evidence from Surveys of Developers Abstract:
We examine different market-based mechanisms and other incentives intended to promote the environmental remediation and reuse of brownfields. Policies that encourage cleanup and re-use of brownfields offer real estate developers reductions in regulatory burden, relief from liability for future cleanups once certain mitigation standards are met, and/or financial support for regeneration of brownfields.
We use conjoint choice experiments—a stated preference approach—to assess the responses of real estate developers to different mixes of these incentives. Our survey instrument was administered in person to a sample of developers and real estate professionals randomly intercepted at the Marché International des Professionnels de l’Immobilier (MIPIM) in Cannes, France, in March 2002.
Conditional and random-coefficient logit models of the responses to the choice questions indicate that developers find sites with contamination problems less attractive than others, and that they value liability relief. This confirms our expectation that contaminated sites are less desirable because of the associated cleanup costs, but refutes earlier claims that liability does not matter. Our developers are not deterred by prior contamination, once it has been cleaned up, suggesting that “contamination stigma” is not very important, and appreciate fast-track review of development and remediation plans, direct financial incentives, and flexible (negotiable) cleanup standards. Developers with prior experience with contaminated sites are more responsive to the policies than are inexperienced developers, especially for subsidies. Inexperienced developers are more responsive to liability relief and regulatory relief than they are to subsidies. Similar considerations hold true for larger developers. JEL Classification: Q28, R38. Key Words: Brownfields, Contaminated sites, Real Estate Developers, Stated Preferences, Conjoint Analysis, Liability Relief, Regulatory Relief, Subsidies.

3
The Role of Liability, Regulation and Economic Incentives in Brownfield Remediation and Redevelopment: Evidence from Surveys of Developers
By
Anna Alberini, Alberto Longo, Stefania Tonin, Francesco Trombetta and Margherita Turvani
I. Introduction This study examines different market-based mechanisms and other incentives intended to
promote the environmental remediation and reuse of “brownfields.” Brownfields are
“abandoned, idled or underused industrial and commercial properties where real or perceived
contamination complicates expansion or redevelopment” (Simons, 1998).
Brownfields were created through two concurrent factors: the downsizing and plant
closings that started in the 1970s as the economy of the US and of Western European countries
moved away from manufacturing, and the passage of legislation that holds responsible parties
liable for the cost of cleanup at contaminated sites. It is often argued that such legislation,
including the Comprehensive Environmental Response, Compensation and Liability Act
(CERCLA, 1980) in the US, has created potential disincentives to the redevelopment and reuse
of potentially contaminated sites, as liability for the cost of cleanup has been construed to extend
to lenders and homeowners (Fogleman, 1992).
Observers believe that fear of liability can have both direct and indirect effects on
brownfield development. The direct effects are that developers may shy away from properties
believed to be contaminated for fear of future liability and because immediate cleanup costs may
prove too high for the development project to be viable. Regarding indirect effects, developers
may fear that lenders deny financing for brownfield projects to avoid involvement in liability at
the site, and/or undervalue the property as a collateral for the loan. In addition, it is often

4
speculated that “contamination stigma” may raise the uncertainty about demand for or reduce the
revenue from the sale of contaminated sites.
Brownfield cleanup and reuse are attractive to communities and policymakers for three
reasons. First, brownfield cleanup reduces the adverse effects of the site’s soil and water
pollution on human health and ecological systems. Second, the reuse of brownfields helps stop
the conversion of agricultural land and rural sites to urban uses and other development patterns
that generate environmental problems, congestion and sprawl. Third, redeveloping abandoned
industrial sites promotes economic growth in inner cities and is, therefore, a potentially
important component of sustainable growth.
The promise of brownfield redevelopment for encouraging cleanup and helping to
regenerate inner city areas has attracted considerable attention in federal, state, and local circles.
In the US, for example, in an effort to mitigate the disincentives created by CERCLA, the States
have passed programs offering entrepreneurs and prospective redevelopers (a) reductions in
regulatory burdens, (b) relief from liability for future cleanups and environmental damage once
certain mitigation standards are met, and/or (c) financial support for regeneration of brownfields.
By late 2000, forty-seven states had instituted voluntary cleanup programs to promote reuse and
cleanup of contaminated sites (Bartsch and Dorfman 2000; Meyer and VanLandingham 2000).
Similar initiatives are under consideration in several European countries, and voluntary cleanup
agreements have been signed and are being implemented at several locales.
We examine the value of interventions and policies targeting brownfields from the
perspective of the key actors involved—private real estate developers. In this paper we ask three
related questions: First, what economic incentives can be offered to developers to encourage
cleanup and reuse of brownfields, and how effective are they? Although economic inducements

5
have been offered for decades to economic agents, little empirical evidence exists documenting
the impact of (a), (b) and (c) on brownfield cleanup and investments.
Second, what kind of site characteristics and available infrastructure make a parcel
attractive for cleanup and reuse, and to what kind of developers? If sites/developers can be
identified that are more likely candidates for development, this may allow more effective
targeting of policies based on economic incentives and liability or regulatory relief. Third, are
developers truly influenced by “contamination stigma”, i.e. a parcel’s loss of value due to its
potential or past contamination even if remediation has already taken place at the site?
To answer these questions, we survey real estate developers using conjoint choice
questions. Our survey questionnaire presents respondents with pairs and triplets of
redevelopment projects, where each project is defined by site attributes (location, contamination,
availability of transportation) and applicable policies. Our policy mix attributes consist of (a)
liability relief, (b) direct financial incentives, (c) and regulatory relief, in the form of fast-track
approvals of plans and flexible cleanup standards. The survey was administered in person to a
sample of developers and real estate professionals randomly intercepted at the Marché
International des Professionnels de l’Immobilier (MIPIM) in Cannes, France, in March 2002.
Conditional logit models of the responses to the choice questions indicate that developers
find sites with contamination problems less attractive than others, and that they value liability
relief. This confirms our expectation that contaminated sites are less desirable because of the
associated cleanup costs, but refutes earlier claims (Urban Institute et al., 1997) that liability does
not matter. Our developers are not deterred by prior contamination, once it has been cleaned up,
suggesting that “contamination stigma” is probably not very important, and appreciate fast-track

6
review of development and remediation plans, direct financial incentives, and flexible
(negotiable) cleanup standards.
We investigate the preferences of specific groups of developers, finding that developers
with prior experience with contaminated sites are more responsive to financial incentives than
other developers (and less deterred by contamination). Large firms are somewhat less responsive
to financial incentives, but similar to other firms in their responses to other policies and site
attributes. Specialization in residential or industrial projects does not result in different
preferences for site attribute and policy mix, whereas developers who sell their development
projects to other parties attach a greater value to government-granted liability relief.
The remainder of the paper is organized as follows: Section II provides some background
information about brownfields. Section III describes the survey instrument, the conjoint choice
questions and the administration of the survey. Section IV discusses how economic incentives
can influence the profitability of brownfield redevelopment projects, and presents the
econometric model of the responses, the variables and the hypotheses. Section V presents the
results, and section VI provides concluding remarks.
II. Background.
A. How Did Brownfields Originate?
The problem of brownfields is the result of two concurrent factors: the numerous plant
closings and downsizing that started in the 1970s as the US and Western Europe experienced a
structural change of their economies away from manufacturing, and the passage of
environmental legislation holding specified parties liable for the cost of cleanup at contaminated
sites.

7
In the US, the Comprehensive Environmental Response, Compensation and Liability Act
(1980, re-authorized and amended in 1986) holds parties that are responsible for the creation of
contaminated sites liable for the cost of cleaning up those sites. Since responsible parties are
sought among the owners and operators of the sites, liability has in some cases been construed to
apply to those persons who acquire contaminated land, and to lenders that foreclose on
contaminated properties.
Many observers believe that the fear of liability keeps investors away from brownfield
properties. Fear of liability can have both direct and indirect effects on brownfield development.
Developers might shy away from properties believed to be contaminated for fear of future
liability, and because immediate cleanup costs may prove too high for the development project to
be viable. These may be interpreted as the direct effects of liability. Regarding indirect effects,
developers may fear that lenders deny financing for brownfield projects to avoid involvement in
liability at the site, and/or undervalue the property as a collateral for the loan. In addition, it is
often speculated that “contamination stigma” may raise the uncertainty about demand for or
reduce the revenue from the sale of contaminated sites.2
The most widely cited source of information about the number of brownfield sites in the
US is a study by the General Accounting Office (1995), which estimates that there are 130,000 to
450,000 contaminated commercial and industrial sites in the US.3 In Europe estimates of the size
2 Contamination stigma is defined as “a market imposed penalty that can affect a property that is known or suspected to be contaminated, a property that was once contaminated but is now considered clean, or a never contaminated property located in proximity to a contaminated property” (Dybvig, 1992). Chan (2002) discusses other definitions of stigma, and refers to it as “the detrimental impact on property value due to the presence of a risk perception driven market resistance.” 3 For comparison, the US Conference of Mayors (1996) estimates that there are 43,000 acres of browfields in 16,000 sites among the 39 cities surveyed, including about 20 larger cities with population over 100,000. One problem with this figure, however, is that the definition of brownfield varies across cities. Simons (1998) reports that as of 1994 brownfields in 31 US cities add to a total of 115,000 acres. Other estimates of the number of brownfields can be formed by examining the list of contaminated sites compiled by the US Environmental Protection Agency (EPA) and state agencies under various environmental programs. For examples, the EPA maintains a registry of active contaminated sites (the CERCLA Information System, or CERCLIS), and has archived some 35,000 sites previously

8
of the problem vary dramatically across countries, depending on the definition of brownfield
(Grimski and Ferber, 1998). With this caveat, Germany reportedly has 35,000 contaminated
sites, mostly concentrated in former Eastern Germany (Meyer, Williams and Yount, 1995) for a
total of 128,000 hectares (Grimski and Ferber, 1998). In reports to the European Union, the
Netherlands claimed to have over 6,000 contaminated sites, Italy 5,400, France 800 and Spain
only 94 (Meyer, Williams and Yount, 1995).
Other reports (Giangrasso and Tassoni, 2001) peg the number of sites suspected to be
contaminated in Europe at the end of the 1980s at roughly 150,000, for a total of more than 100
million hectares, 20 million of which in Western Europe.
B. Contaminated Site Policies
In the US, where federal legislation addressing contaminated sites was passed over 20
years ago (CERCLA, 1980), state programs were recently established to encourage cleanup and
redevelopment of potentially contaminated sites by offering liability relief, regulatory relief,
simplified cleanup standards, and direct financial incentives to developers. Liability relief
usually comes in the form of letters of no further action, certificates of cleanup completion, or
covenants not to sue. The latter is generally the strongest form of liability relief, since it is
essentially a contract by which the granting agency (usually the state’s department of
placed on CERCLIS and subsequently delisted because the site was cleaned up, or was found not be contaminated in the first place. The EPA also maintains a registry documenting roughly 418,000 Leaking Underground Storage Tanks (LUSTs) (http://www.epa.gov/swerust1/cat/index.htm). On adding up several registries of contaminated sites, and correcting for sites that appear simultaneously on more than one registry, the total number of brownfields in the US is pegged at 384,000 (Simons, 1998).

9
environmental protection) commits not to sue the property owner, as long as the cleanup of the
parcel (or any residual contamination) meets certain requirements.4
Some European countries crafted their own Superfund-like legislation to avoid some of
the perverse effects of liability on real estate development. In the Netherlands, for example, an
innocent landowner disclaim exists, and in some cases the municipality may take over the
expenses of remediation. In addition, in some European countries there has been much reliance
on voluntary cleanup initiatives. For instance, in France (Lèvêque, 1996) much of the self-
regulation of the chemical industry was launched in hopes of preventing the passage of an act
similar to CERCLA, which was debated by the Parliament during the 1990s.
In Italy, cleanup legislation exists (Decreto [Executive Order] Ronchi, approved in
February 1997), but liability is not retroactive. As a consequence, at certain locales polluters
have entered into voluntary agreements with the government. For example, in 1998 the City of
Venice and several Ministries entered into a voluntary agreement with a number of chemical
firms and other parties over cleanup at the industrial site of Marghera. Firms committed to
increasing the safety standards of plants, reducing emissions, maintaining the existing levels of
employment, gradually cleaning up abandoned facilities, and adopting voluntary environmental
certification (ISO or EMAS), in exchange for a more cooperative attitude on the part of
government agencies, an informal guarantee of no lawsuits, quicker approvals of projects, and
public monies in support of firms’ improvement projects and to overhaul infrastructure. For
certain aspects, this agreement is, therefore, very similar to voluntary cleanup programs and
brownfield initiatives in the US.
4 Memoranda of understanding may be signed by the state and the US EPA through which the latter recognizes the state’s authority in granting such documents and promises to refrain from prosecuting the property owner or

10
C. Effects of liability and contamination on parcel prices and development
Despite the claims about effects of liability on acquisition and development of
browfields, little empirical work has been done to assess the existence and magnitude of these
effects, and the impacts, if any, of voluntary cleanup and brownfields programs. To our
knowledge, no study has attempted to relate the establishment of such programs to land prices or
has sought to evaluate the impact of the various policy instruments to the number of parcels
cleaned up and redeveloped and/or their location.
Urban Institute et al. (1997) rely on interviews, mostly of qualitative nature, of
developers to investigate a number of claims about the deterrent effect of contamination and
liability, and possible policies for brownfields redevelopment. McGrath (2000) estimates a
switching regression model that relates the redevelopment of a parcel, and a parcel’s sale price,
to physical characteristics of the site and to its probability of being contaminated. This model
assumes that the likelihood of redevelopment is affected by the odds of contamination both via
the price of the parcel and through an independent effect. Howland (2000) combines information
on contamination and sale prices reported by owners of parcels in an industrial area of Baltimore
with state records, finding that contamination reduces the sale price, but does not slow down
transactions. This study, however, was completed before the passage of Maryland’s Voluntary
Cleanup program, and thus cannot establish the effects of the latter on the prices and the rate of
turnover of contaminated property.
Lacking evidence about the response of developers to brownfield contamination and
policies, we turn to stated preference approaches to answer the following questions. First, what
economic incentives can be offered to developers to encourage cleanup and reuse of brownfields,
and how effective are they? Second, what kind of site characteristics and available infrastructure
developer for contamination, provided that certain conditions are met.

11
make a parcel attractive for cleanup and reuse, and to what kind of developers? Third, are
developers truly influenced by contamination stigma, whereby a parcel’s possible or actual
contamination results in its lower desirability?
III. Structure of the Questionnaire and Survey Administration
A. Conjoint choice questions.
In our survey, we ask a sample of real estate developers to tell us which they prefer
between two hypothetical alternative redevelopment projects, A and B, where each project is
described by site attributes (e.g., location and contamination) and a policy mix.5
The policy mix includes (a) liability reduction in the form of a certificate of assurance
that the developer is not going to be held responsible for future cleanups; (b) regulatory relief in
the form of a faster notice of approvals and/or flexible (negotiable) cleanup standards; and (c)
direct financial incentives to the developer.
These policies may affect different components of the costs and revenues associated with
redeveloping the site. Liability relief, for example, reduces or eliminates the risk of future
liability for cleanup costs, as long as the developer meets certain requirements. It may, in
addition, help raise the revenue from the sale or rental of the site by avoiding the stigma due to
existing or suspected contamination. For this attribute, we consider two possible levels: (a)
certificate of assurance not available, and (b) certificate of assurance available upon completion
of remediation.
5 As explained in Section III.B, each of these choice questions is followed by another where the respondent is asked to choose between A, B and not undertaking either project.

12
Faster response times by the agency to the developer’s application should reduce the
costs of the project.6 We use two levels of this attribute, setting response times within 6 months,
and 24 months, respectively, of the date of the application.
Direct financial incentives can take the form of low-cost loans, tax credits, and cash
rebates. In our survey, however, we do not specify what form they can take, and simply tell our
respondents that they are for 10%, 20% and 30% of the value of the project.7
We reason that different policy mixes can have different appeal to developers, depending
on the attributes of the site where the (re-)development project is undertaken. Accordingly, we
include three more attributes to describe the project: the presence of contamination at the site, the
availability of transportation networks near the site, and the presence of a city within 20 km of
the site to capture access to markets and suppliers.
Regarding contamination, each alternative is characterized by one of three possibilities:
(a) no contamination, (b) contamination, or (c) the site was previously contaminated but
remediation has taken place. The latter level of the attribute allows us to check for developers’
fears of contamination stigma even after the parcel is cleaned up. Finally, all sites are assumed to
have regular access to highways, with some alternatives also served by rail, an airport, and a
harbor.
B. Structure of the Questionnaire.
6 They may also eliminate some of the uncertainty typically associated with undertaking brownfield projects. Earlier research in this area (Urban Institute et al., 1997) suggests that reducing uncertainty may be an important component of effective brownfield programs. 7 These figures were based on a review of the legislation and programs in Italy and other European countries, and are similar to the levels of public subsidies in the US. Simons (1998) examines the role of public assistance and subsidies in a number of brownfield projects in the US. He finds that the average public subsidy is 20 percent. For comparison, remediation costs were typically 10 percent of a project’s total value, but some projects using innovative remediation techniques kept the remediation costs to less than 5 percent of the project’s value. Simons
13
The interview begins with a series of screening questions intended to determine whether
the respondent (i) is a developer,8 (ii) works for a private company, a non-profit organization, or
a government agency, and (iii) his/her company’s principal business is within the real estate
development market.
The questionnaire is comprised of four sections. The first section gathers more specific
information on the business of the respondent’s company, such as the typical project the
company is involved in and its revenue. In this section the respondent is also asked whether
his/her company has ever purchased, leased or developed sites located in industrial areas, or
contaminated sites.
Section 2 provides information on cleanup responsibilities, highlights the advantages and
disadvantages of developing contaminated sites, and describes the incentives available in some
countries to encourage re-development of previously used sites. The respondent is then asked
whether he is familiar with the cleanup legislation of the countries where his/her company does
its business, and whether his/her company has ever benefited from financial assistance from the
government for redeveloping used sites.
Section 3 is comprised of four conjoint choice exercises. Each exercise describes two
hypothetical development projects (Site A and Site B). Each site is described by seven attributes:
(i) presence/absence of contamination; (ii) cleanup standards; (iii) availability of transportation
network within 20 km from the site; (iv) presence/absence of a certificate issued by a
government agency that relieves the developer from liability for further cleanup; (v) time for
approval of development/cleanup plans by the appropriate government agency; (vi)
concludes that public subsidies are generally too high, and tend to support development costs other than the costs of remediation. 8 Both developers and real estate consultants took the survey. The latter were instructed to answer the questions as if they were developers like their typical clients.
14
presence/absence of a city within 20 km; and (vii) government financial incentives, expressed as
percentage of the value of the project. In each choice exercise, Site A differs from Site B in the
level of two or more attributes. For each pair, the respondent is first asked which project he/she
finds more attractive between A and B, and then is asked to choose between A, B and the option
of not participating in either project. Figure 1 displays an example of conjoint choice question.
Finally, section 4 gathers further information about the position of the respondent within
his/her company, and asks whether he/she takes part in the final investment decision about a real
estate development project (or collaborates with the committee that makes the final decision).
The respondent is asked to report the number of employees of his/her company and the 2001
level of sales. Other individual characteristics of the respondents, such as age and schooling, are
also collected.
C. Administration of the Survey Instrument.
A preliminary draft of the survey questionnaire was tested on a focus group of
developers, real estate professionals, and members of the public sector in the Venice area on 22
February, 2002. The purpose of the focus group was to test respondent comprehension of the
questions and to solicit comments and suggestions about the questionnaire. In general, the
questionnaire was very well received. Focus group participants were comfortable with the
conjoint questions, and suggested including questions about the type of projects generally
undertaken by developers, and about the value of the projects. These suggestions were
incorporated in a revised version of the questionnaire.

15
The survey was administered in person by five professionally trained interviewers at the
Marché International des Professionnels de l’Immobilier (MIPIM), Europe’s largest international
commercial property conference, in Cannes, France, on March 12-15, 2002.9 10
During that period we interviewed 293 people randomly intercepted at the conference
venue; 84.30% of the respondents were from private companies, and 63.82% defined themselves
as developers. The survey instrument was available in Italian (29% of the respondents), English
(57%) and French (15%).
IV. The Model and the Data
A. What are the Determinants of Brownfield Redevelopment?
The decision to invest or not to invest in a real estate development project should depend
on the revenues and costs of the project. Formally, the profit π associated with a project is:
(1) FLCR +−−=π ,
where R is revenue, C is cost, L is expected liability costs, and F represents transfers to the
developer.
The revenue of a real estate development project should depend on the characteristics of
the land to be developed. The presence of contamination can influence the price received by the
9 MIPIM is held as an annual conference. MIPIM 2002 was one of the busiest ever, with more than 15,000 visitors attending from 65 countries, and 4,830 end-users and investors, of which 988 were developer companies and 1,008 real estate consultants. 10 We became interested in brownfield policies because there are many abandoned or underused contaminated sites in the industrial area of Marghera, near Venice, Italy. Ideally, we would have liked to survey local developers about their preferences for parcels at this locale, but were forced to abandon this plan for two reasons. First, we observed very little redevelopment activity at this locale. Second, we found it impossible to assemble a comprehensive list of developers at the local or national level from which a representative sample could be drawn. Moreover, we worried that, even if a representative sample could be obtained, only a very small fraction of developers would have previously dealt with contaminated sites, making it difficult for us to identify differences in preferences between those who do and do not have prior experience with such sites. Our MIPIM sample is, therefore, expected to be comprised of relatively large developers with international exposure. We also expect a greater proportion of developers that engage in projects at contaminated sites than in the universe of all developers.

16
developer for the completed project, as can other location characteristics, such as proximity to
transportation nodes and to a city.
Contamination should also influence the costs associated with the development project,
raising them because of environmental assessment fees, remediation costs, legal expenses, and
any other punitive and civil penalties linked to known or anticipated contamination. All of these
expenses are incurred in addition to normal development costs, and are, presumably, relatively
well known.
In addition, developers may fear liability, the risk that in the future additional costs may
be incurred as a result of the discovery of previously unknown or unanticipated contamination,
with the associated litigation and other uncertain events, including possible changes in
remediation standards. The costs due to liability are generally thought to be highly uncertain.
Government policies can offset some of these components of the costs of development
projects. They can, for example, offer letters of no further action, certificates of completion, or
covenants not to sue that reduce or eliminate future liability risks. They can also reduce
uncertainty about future changes in cleanup standards, and immediate cleanup costs, by offering
streamlined review of development project plans. Finally, they can offer direct financial
incentives to the developers in the form of loans, grants, rebates and/or tax credits.
Equation (1) can, therefore, be amended to reflect its arguments’ dependence on all of
these factors:
(2) FLCR +−−= ),(),,(),( ZCZXCXCπ ,
where C is a vector of variables denoting the presence and severity of contamination, and X is a
vector of location and site characteristics. C(•) represents development costs, which include (a)
construction costs, a function of X; (b) cleanup costs, a function of C; and (c) policy instruments,
17
Z. L, the expected liability costs, should be influenced by the presence and type of contamination
at the site, C, and by policies offering relief from liability, Z.
In our questionnaire, R is set to be equal to the size of the firm’s typical project. If forced
to choose between two projects, A and B, a developer should choose the one with the higher
profits. When the choice set also includes the option of not undertaking either investment,
economic theory holds that the developer would still choose the same project only if the internal
rate of return associated with it is at least as large as the internal rate of return of alternative
investments. By contrast, if the net profit of that project is negative and/or the internal rates of
return of A and B are less than the internal rate of return of alternative investments, the developer
should choose the “do nothing” option.
B. The Econometric Model
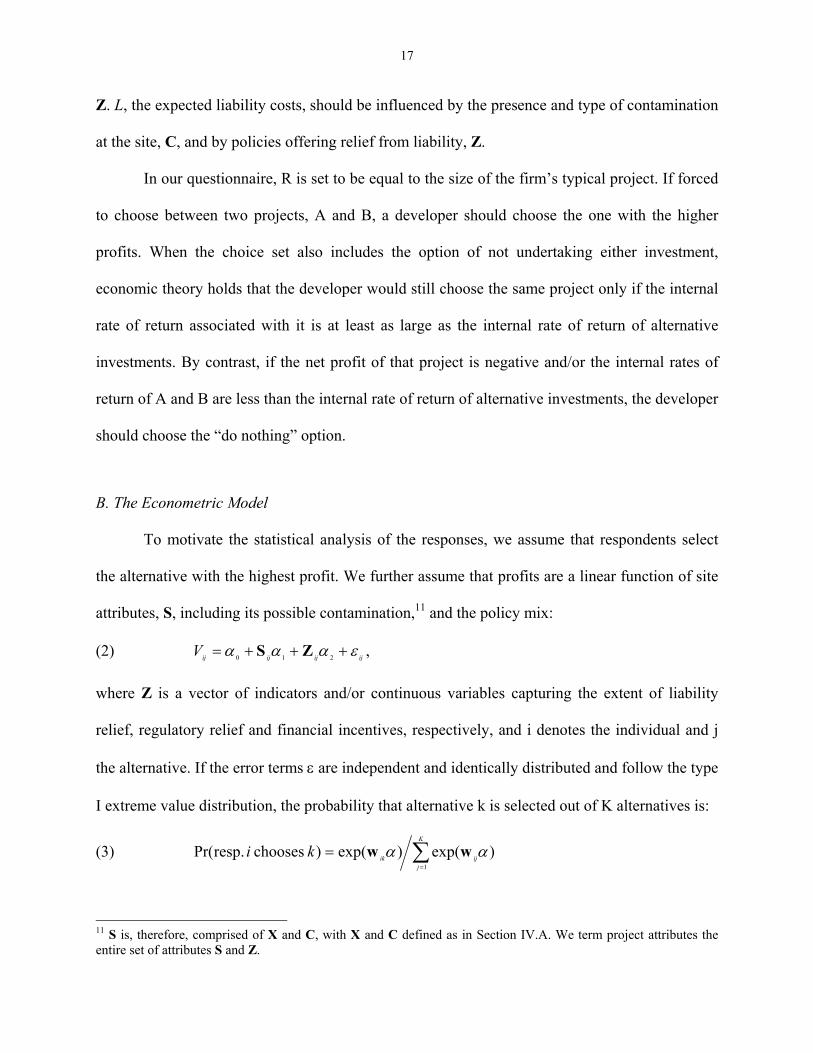
To motivate the statistical analysis of the responses, we assume that respondents select
the alternative with the highest profit. We further assume that profits are a linear function of site
attributes, S, including its possible contamination,11 and the policy mix:
(2) ijijijijV εααα +++= 210 ZS ,
where Z is a vector of indicators and/or continuous variables capturing the extent of liability
relief, regulatory relief and financial incentives, respectively, and i denotes the individual and j
the alternative. If the error terms ε are independent and identically distributed and follow the type
I extreme value distribution, the probability that alternative k is selected out of K alternatives is:
(3) ∑=
=K
jijikki
1
)exp()exp() chooses resp.Pr( αα ww
11 S is, therefore, comprised of X and C, with X and C defined as in Section IV.A. We term project attributes the entire set of attributes S and Z.

18
where w is the vector of alternative-specific attributes and α is the vector of coefficients in (1).12
Equation (3) is the contribution to the likelihood in a conditional logit model.
Once model (3) is estimated, the rate of tradeoff between any two attributes is the ratio of
their respective α coefficients. The marginal value of each attribute is computed as the negative
of the α coefficient on that attribute, divided by the coefficient on the “price” variable. To allow
for heterogeneity among the respondents, the vector w in equation (3) can be augmented to
include interactions between respondent or firm characteristics, such as its profitability, size and
the scale of the market it operates in, and the attributes of the alternatives.
To further allow for heterogeneity—and to relax the assumption of independence of
irrelevant alternatives (IIA) implicitly imposed by the conditional logit model13—we also
estimate random-coefficient logit models. In a random-coefficients model, the vector of
coefficients β breaks down into two components: its expectation, β , and a vector of individual-
specific error terms, ui. The probability of choosing alternative k, given the realization of the
individual-specific error ui, is:
(4) ∑=
+
+= J
jiijij
iikikiuk
1
)exp(
)exp()|Pr(
uww
uww
β
β.
The individual-specific error term u creates correlation between the indirect utilities associated
with the different alternatives, ruling out IIA.
To compute the unconditional probability of choosing project k one must, therefore,
integrate equation (4) with respect to the joint density of the vector of error terms u. In practice,
12 The intercept in equation (2) is not identified and is therefore normalized to zero. 13 Briefly, IIA, which follows from the assumption that the error term in (2) is i.i.d. type I extreme value, states that the ratio between the odds of choosing between any two alternatives does not depend on the attributes of any other alternative. If this assumption is violated in the data, the conditional logit model may overpredict the probability of choosing one of two alternatives that are perceived as close substitutes.

19
estimation of equation (4) requires that assumptions be made about which coefficients are
random, and about the joint distribution of the individual-specific errors ui.
C. The Choice of Regressors
Following equations (1)-(3), we fit conditional logit models of the responses to the choice
questions. In our basic specification, the probability of choosing a project depends only on the
attributes of the alternatives. In subsequent runs, we add interactions intended to test specific
hypothesis about the attractiveness (or unattractiveness) of the attributes to certain types of
developers, and then further incorporate random coefficients.
We expect the coefficient of the contamination dummy (CONTAM_P) to be negative,
reflecting the extra development costs associated with cleanup. Urban Institute et al. (1997)
interview developers and reach the conclusion that it is not the fear of liability that keeps
investors away, but the high costs of cleanup. We therefore formulate our Hypothesis I, that fear
of liability does not matter but cleanup costs do. A negative coefficient on CONTAM_P and an
insignificant coefficient on CERTIFIC, the dummy capturing whether or not a certificate of
completion is offered, would provide empirical support for this hypothesis.
The coefficient of CONTAM_C (contamination was present, but has been removed)
should capture the existence of contamination stigma. We do not have any prior expectations on
this coefficient. While many observers believe contamination stigma to exist, some recent
empirical studies (e.g., Urban Institute et al., 1997) refute this notion. Others (Howland, 2000)
argue that the market adjusts to contamination stigma by lowering the price of contaminated
parcels, so that market activity is not deterred. We wish to test the null hypothesis (Hypothesis

20
II) that there is no contamination stigma. We accept the null hypothesis if the coefficient on
CONTAM_C is not statistically significant.
One would expect sites at locales served by more means of transportation to be more
attractive, all else the same, as should sites located in the proximity of a city. Regarding the
policy instruments, ceteris paribus we would expect direct financial incentives (INCENT),
shorter response times (OVERS) by the agency to developer application, and the issuance of a
certificate of completion (CERTIFIC) to increase the attractiveness of a project. Flexible
(negotiable) standards (FLEXSTDS) should make a project more attractive, unless developers
consider negotiation with the authorities lengthy and costly. The net effect is, therefore, an
empirical issue.
D. Specific Hypotheses and Interaction Terms.
As mentioned above, it is likely that some attributes may be more (less) attractive to
certain types of developers than to others. Testing hypotheses about different impacts of
attributes on different developers requires the use of interaction terms.
We create interactions between several project attributes and a dummy variable denoting
whether the developer has prior experience with contaminated sites. Various project attributes
may hold a different appeal to developers with contaminated site experience for several reasons.
For example, developers with contaminated site experience may have different perceptions of
cleanup costs, in which case the coefficient of CONTAM_P interacted with the dummy for
experience with contaminated sites may partially or even fully offset that of CONTAM_P. Their
views of negotiable cleanup standards and of the value of a letter of completion may reflect their
experience with the government agency in charge. In sum, our hypothesis III is that policy

21
instruments and contamination appeal to or deter developers with contaminated site experience
in a different way.
We also create interactions between selected project attributes and a dummy variable
denoting whether the firm is a “large” firm, in that revenues are greater than revenues for the
average firm. Several effects could be captured into the coefficients of these interactions. Some
observers believe that large firms have traditionally been the target of EPA enforcement effort
over Superfund because of their ability to pay for cleanup. This might make them more reluctant
to take up contaminated sites, and perhaps more accepting of liability relief. On the other hand,
large firms presumably rely more on their own financing than on borrowing from banks, which
might insulate them from the indirect effects of liability through the lenders. Our Hypothesis IV
is that larger firms have different preferences from smaller firms.
Developers who deal primarily with industrial and commercial sites may react to
contamination to a different extent than developers who engage mostly in residential projects.
This is our Hypothesis V, which could be due to the perception, discussed in Urban Institute et
al. (1997), that financing costs are higher—and hence the effects of liability through the lenders
more pronounced—at industrial sites, and to the expectation of higher cash flows at more
densely developed sites, like residential projects and office buildings.
We also wonder whether liability (and liability relief schemes) impacts developers
differently if they are able to transfer the property to others (Hypothesis VI). We create an
interaction term between CERTIFIC and SELL1 (a dummy that takes on a value of one if the
developers sells its completed projects to other parties), and examine the sign and significance of
the coefficient on this interaction. Finally, Urban Institute et al. (1997) emphasizes the
importance of familiarity with cleanup legislation. To test for this effect we include an

22
interaction between attributes of the project and respondent familiarity with cleanup legislation
and programs (Hypothesis VII).
V. Results
A. Characteristics of the Respondents
Because our sample consists of people randomly intercepted at a professional conference,
we cannot claim that it is representative of the universe of developers. Our first order of business
is, therefore, to examine the characteristics of our respondents. Descriptive statistics for
respondent characteristics and firm characteristics are reported in Table 1.
Buying, developing or selling was the principal business of respondents’ company for
66% of the sample, and 64% defined themselves as developers. About 18% of the people
interviewed were consultants who advised companies on real estate investment projects. Among
the developers, about 65% stated that they bought and developed areas in order to sell the final
projects, 38% to keep them for their business, and 27% to lease them to someone else.
Roughly 58% of the companies in our sample do business in Southern Europe, 30% in
Northern Europe, 62% in Western Europe, 36% in Eastern Europe, 17% in North America,
almost 9% in Asia, and 8% in the rest of the world.14 As one would expect of MIPIM attendees,
the respondents’ companies are considerably large: The average number of employees is 3,733
people, and average level of sales is about €15,895 million. The typical project had a minimum
size of about 231,868 m2, and a building of at least 29,160 m2. Median revenue was €7 million.
Approximately two-thirds of the respondents had previous experience with industrial
sites, and 60% of them bought abandoned industrial areas, while 69% worked with industrial
areas that are still used at the time of the acquisition. In our sample, 47% of the respondents
14 These percentages do not add to one to 100 because many firms do business in several parts of the world.

23
stated having previous experience with contaminated sites. In addition, 77% of the respondents
were familiar with the polluted site cleanup legislation in the countries where their company does
business. Moreover, 39% of our interviewees reported to have benefited from governmental
incentives to re-use abandoned areas.
We also found that in the previous three years the majority of the respondents (74%) had
undertaken commercial projects, and had dealt with office buildings or complexes (68%). About
53% of the sample had engaged in residential projects, 49% in industrial projects, and 25% in
other kind of projects.
The majority of the respondents were males (82%), and the average age was 42. The
respondents were highly educated: the majority (88%) had a college degree, and about 10% had
a master’s degree in business administration or had completed post-graduate work. Almost all of
the respondents (94%) indicated that they are responsible for gathering information to support
the decision to undertake a real estate development project, and roughly 79% actually
participates in making the final decision.
Because an important policy question is what it takes to draw developers who have never
worked with brownfields before to engage in brownfields projects, in Table 2 we compare the
characteristics of brownfields-experienced and inexperienced developers. Developers with
brownfield experience tend to engage in projects at larger sites and with larger buildings and
tend to have greater revenues per project. However, t tests indicate that the differences between
the two samples are not statistically significant. The primary activity of both experienced and
inexperienced developers is developing commercial projects, followed by building offices,
housing complexes and industrial projects.

24
B. Testing for Comprehension of the Choice Task
In conjoint choice experiments, and whenever survey participants are queried about
hypothetical, and relatively complex, commodities, it is important to test for respondent
comprehension of tasks and commodities.
In informal debriefing conversations after the completion of the interviews, many
respondents offered spontaneous comments that suggested that they understood the choice task
and were comfortable with it. Some respondents even volunteered attributes of projects that they
felt were more important to them than others.
In addition, we checked our responses for possibly abnormal response patterns. We used
three criteria. First, we checked whether a disproportionate number of respondents selected the
“neither project” option when allowed to do so. This might indicate that respondents were
unwilling to accept the proposed project alternatives, A and B, as reasonable. Our respondents
chose the “neither project” option in about 20 percent of the choice tasks that offered such an
alternative, a frequency that seems reasonable.
Second, following Viscusi et al. (1991), we examined whether there were respondents
who always chose alternative A or B, or always chose the “neither project” option. It should be
noted that selecting always answer A (or B) does not necessarily indicate that the respondent
failed to trade off the attributes of the alternatives. Even if that were the case, this behavior
would be limited to a very small fraction of the sample: only 11 respondents (3.7 percent of the
sample) always preferred alternative A, 11 respondents always preferred alternative B, and 16
people always preferred the “neither A nor B” option (about 5 percent of the sample).
Finally, we checked for “preference reversals.” A preference reversal occurs if a
respondent selects A (B) in the initial choice between A and B, but prefers B (A) in the follow-

25
up choice questions, where he is asked to choose between A, B and the “neither” alternative.
Once again, the random utility model framework (equations (2) and (3)) accommodates
occurrences of this kind. In any case, only 8 respondents exhibited this type of behavior.
Based on these three criteria, we conclude that almost all of our respondents answered the
choice questions in a reasonable fashion. For good measure, however, we run our logit models
first on the full sample, and then after excluding respondents engaging in any of the behaviors
described in the second and third criterion above.
C. The Conditional Logit Model: Effects of the Attributes
The purpose of our conditional logit models is to determine what attributes actually
matter to developers, a task we accomplish by performing statistical tests of significance of the
associated coefficients. We also wish to estimate the marginal price of each attribute or policy
mechanism.
Table 3 reports the results of conditional logit models based on attributes only, without
interactions, for various subsets of the sample. The first column displays the results for the full
sample, showing that contamination of the site, as expected, deters investments, and results in a
lower probability that a project is selected. Interestingly, the coefficient on CONTAM_C is
positive but insignificant, and is not statistically distinguishable from the coefficient of
CONTAM_A, which indicates the absence of contamination. Regarding Hypothesis II, we
therefore conclude that the stated preferences of developers do not provide support for the
existence of contamination stigma, a result that is in line with claims by Urban Institute et al.
(1997) and Howland (2000).
26
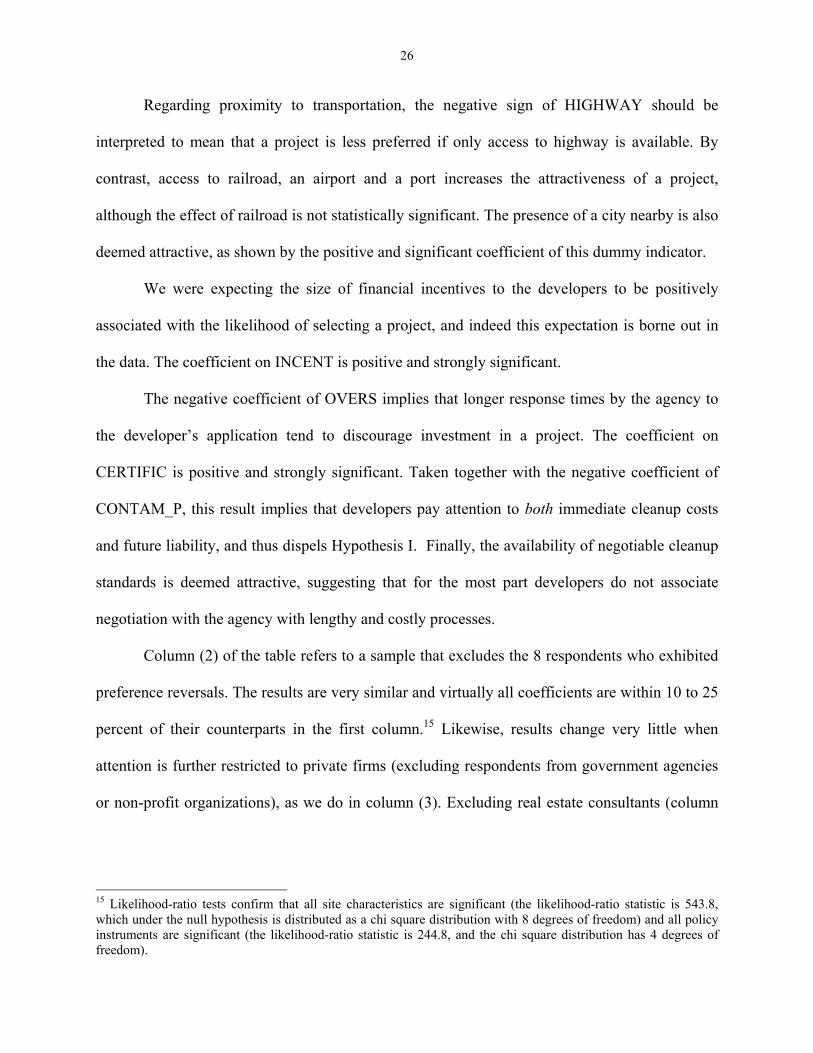
Regarding proximity to transportation, the negative sign of HIGHWAY should be
interpreted to mean that a project is less preferred if only access to highway is available. By
contrast, access to railroad, an airport and a port increases the attractiveness of a project,
although the effect of railroad is not statistically significant. The presence of a city nearby is also
deemed attractive, as shown by the positive and significant coefficient of this dummy indicator.
We were expecting the size of financial incentives to the developers to be positively
associated with the likelihood of selecting a project, and indeed this expectation is borne out in
the data. The coefficient on INCENT is positive and strongly significant.
The negative coefficient of OVERS implies that longer response times by the agency to
the developer’s application tend to discourage investment in a project. The coefficient on
CERTIFIC is positive and strongly significant. Taken together with the negative coefficient of
CONTAM_P, this result implies that developers pay attention to both immediate cleanup costs
and future liability, and thus dispels Hypothesis I. Finally, the availability of negotiable cleanup
standards is deemed attractive, suggesting that for the most part developers do not associate
negotiation with the agency with lengthy and costly processes.
Column (2) of the table refers to a sample that excludes the 8 respondents who exhibited
preference reversals. The results are very similar and virtually all coefficients are within 10 to 25
percent of their counterparts in the first column.15 Likewise, results change very little when
attention is further restricted to private firms (excluding respondents from government agencies
or non-profit organizations), as we do in column (3). Excluding real estate consultants (column
15 Likelihood-ratio tests confirm that all site characteristics are significant (the likelihood-ratio statistic is 543.8, which under the null hypothesis is distributed as a chi square distribution with 8 degrees of freedom) and all policy instruments are significant (the likelihood-ratio statistic is 244.8, and the chi square distribution has 4 degrees of freedom).

27
(4)) also yields generally similar results, except for the contamination dummy, whose coefficient
becomes stronger.
D. The Conditional Logit Model: Interaction Terms
Tables 4-7 report the results of conditional logit models that include interactions between
attributes and characteristics of respondents. Attention is restricted to the sample purged of the
eight cases of possible preference reversals.
Table 4 displays the results of the interactions between site or policy attributes and a
dummy variable indicating whether the respondent’s company has prior experience with
contaminated sites. A likelihood ratio test (the LR statistic is 44.84, which falls in the 1% upper
tail of the chi square with 5 degrees of freedom) suggests that the interaction terms do
significantly improve the fit of the model, and provides support for Hypothesis III, even though
only one of the coefficients on the interaction terms is individually statistically significant at the
1% level (another is statistically significant at the 10% level).
Specifically, developers with contaminated site experience appear to be more sensitive to
the size of the financial incentives offered by the government than other developers: the
coefficient that applies to these developers is (0.0119+0.0335)=0.0454, whereas that for all other
developers is 0.0119. This implies that—all else the same—increasing the incentive by the same
amount raises the probability of selecting a site more than for developers with experience than
for developers without prior contaminated site experience. Developers with contaminated site
experience also appear to be somewhat less deterred by the presence of contamination (the
coefficient on this attribute is [-1.2104+0.2654]=-0.945, roughly three-quarters that for all other
developers), but do not respond to other policies differently from all other developers.

28
Table 5 displays the results of the model with interactions between attributes and a
dummy equal to one if the respondent’s company has sales for more than the average level of
sales in the sample. The likelihood ratio test of the null hypothesis that the coefficients of all
interactions are equal to zero is 10.22, failing to reject the null hypothesis at the conventional
levels and providing little evidence for Hypothesis IV.
However, two interaction coefficients—that on the interaction with the size of the
financial incentives, and that on the interaction with response times by the agency in charge—are
individually statistically significant at the 1% and 10% level, respectively. They imply that larger
firms are less responsive to financial incentives, and less deterred by slower response times by
the agency. For large firms, the relevant coefficient is (0.0347-0.0205)=0.0142, whereas for
smaller firms it is 0.0347. Larger firms, however, do not value the existence of contamination
and liability relief differently from smaller firms, despite their potentially larger exposure to
liability. We also experimented with changing the definition of large firm, finding that, when a
firm with revenues greater than that of the median firm was classified as a large firm, results
were qualitatitively similar, but the differences between larger and smaller firms were no longer
statistically significant.
Table 6 shows that developers who generally sell the properties they develop particularly
appreciate the opportunity to receive a certificate of completion relieving them of liability, but
are not different from other developers in terms of their reaction to the presence of contamination
at the site. Table 6 also reveals that, in contrast to opinions voiced by some observers, primary
involvement with residential or industrial is not likely to change the deterrent effect of
contamination.

29
Finally, table 7 implies that those respondents more familiar with contaminated site
legislation are slightly less deterred by the presence of contamination and by slower response
times by the agency, but distrust negotiable cleanup standards. The magnitude of the coefficients
on the interaction terms, however, implies that in practice the differences between respondents
that are and are not familiar with the applicable cleanup legislation are negligible.
Other interaction terms between attributes of the alternative and characteristics of the
respondents and/or the respondent’s firm were attempted and included in additional runs of the
conditional logit model. For example, in runs not reported we examined whether respondents
who have previously received incentives from the government have different preferences for
contaminated sites and government financial assistance. We found that these developers are
indeed more responsive to financial incentives, as the coefficient on financial incentives that
applies to them is roughly one-half that for all other developers. They do not, however, have a
different perception of the contamination problem.
E. Random Coefficient Models
To further account for heterogeneity of preferences across individual respondents, we
allowed some coefficients to be random in the models with interactions between type of
developer and attributes of the project. In this section, we discuss the results of random-
coefficient models with interactions between attributes and prior experience with contaminated
sites. We began with allowing the coefficients of all interaction terms to be random, assuming
that each such coefficient is normally distributed and independent of the others,16 but found that
16 Train (1999) explains that skewed distributions defined on the positive semi-axis, such as the lognormal, are well suited for situations where individuals may attach a different value to the attributes, but all individual valuations share the same sign (e.g., all individuals perceive the attribute as attractive), whereas a symmetric density like the
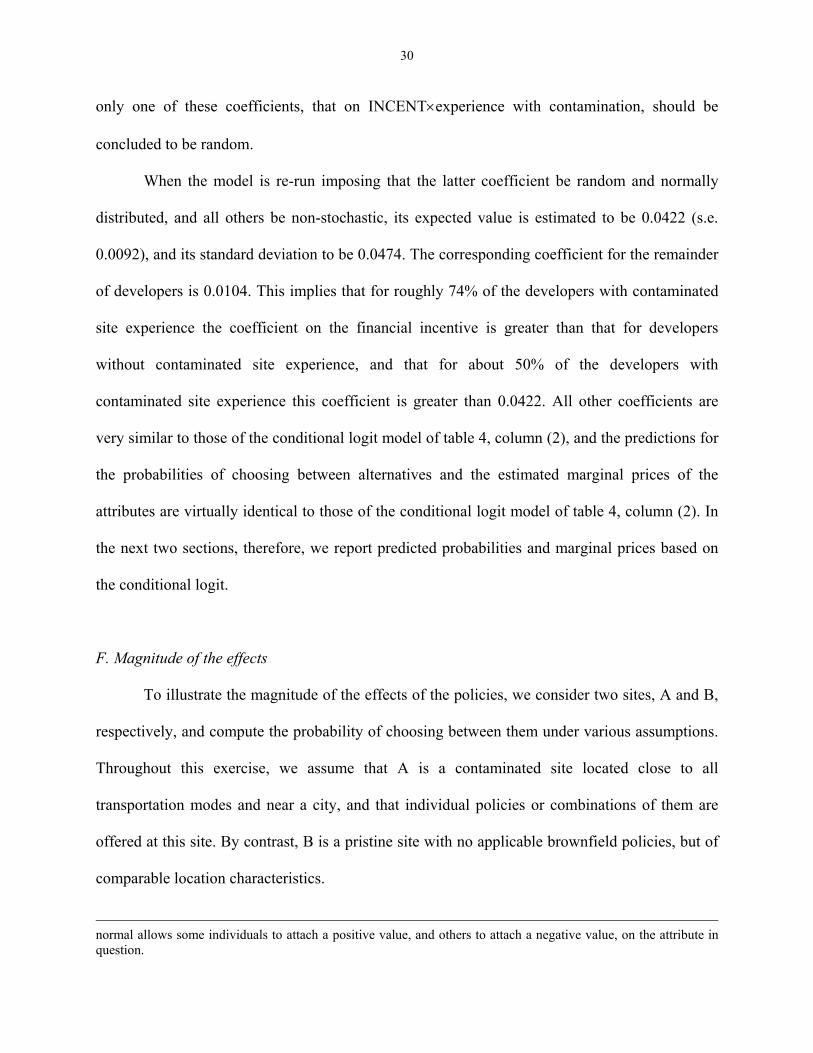
30
only one of these coefficients, that on INCENT×experience with contamination, should be
concluded to be random.
When the model is re-run imposing that the latter coefficient be random and normally
distributed, and all others be non-stochastic, its expected value is estimated to be 0.0422 (s.e.
0.0092), and its standard deviation to be 0.0474. The corresponding coefficient for the remainder
of developers is 0.0104. This implies that for roughly 74% of the developers with contaminated
site experience the coefficient on the financial incentive is greater than that for developers
without contaminated site experience, and that for about 50% of the developers with
contaminated site experience this coefficient is greater than 0.0422. All other coefficients are
very similar to those of the conditional logit model of table 4, column (2), and the predictions for
the probabilities of choosing between alternatives and the estimated marginal prices of the
attributes are virtually identical to those of the conditional logit model of table 4, column (2). In
the next two sections, therefore, we report predicted probabilities and marginal prices based on
the conditional logit.
F. Magnitude of the effects
To illustrate the magnitude of the effects of the policies, we consider two sites, A and B,
respectively, and compute the probability of choosing between them under various assumptions.
Throughout this exercise, we assume that A is a contaminated site located close to all
transportation modes and near a city, and that individual policies or combinations of them are
offered at this site. By contrast, B is a pristine site with no applicable brownfield policies, but of
comparable location characteristics.
normal allows some individuals to attach a positive value, and others to attach a negative value, on the attribute in question.

31
The resulting probability of choosing A, the contaminated site accompanied by the policy
mix, is shown in table 8 for various policy mixes for the entire sample and for various types of
developers.17 The first column shows the probability of selecting site A for all developers in our
sample. With financial assistance for 10% of the project revenue, a developer chooses A, the
contaminated site, with probability 27.33%. This probability increases to 33.10% when the
financial assistance is doubled. Liability relief alone will imply a probability of selecting A of
33.67%, which jumps to 46.76% when financial aid worth 20% of the project revenue is added.
On further adding flexible cleanup standards, the likelihood of choosing the contaminated site
project further increases to about 54%. It should also be noted that flexible cleanup standards
alone imply a probability of selecting A of about 27%, and are thus roughly equivalent to
offering financial assistance for 10% the value of the project.
As shown in columns 2 and 3 of table 8, there is a substantial difference in the propensity
to engage in projects at contaminated sites between those developers who already have
experience with this kind of sites, and those who do not. Specifically, when attention is restricted
to financial assistance, developers with previous activity at contaminated site have a higher
probability of selecting the contaminated site at the lowest possible level of financial assistance
(33.43% versus 21.62%), and are more responsive to an increase in financial assistance.
Doubling the size of the subsidies to 20% raises the probability of opting for the contaminated
site to 44.19% for developers with contaminated experience, but has little effect on developers
with no contaminated site experience, for whom the probability of project A is now only 23.70%.
On further incorporating liability relief, the probability of choosing A is 59% for
developers with contaminated site experience, and 35.77% for developers without contaminated
site experience. This suggest that liability experience is more important than subsidies for
17 The probabilities shown in this table are based on the conditional logit models of tables 3, 4, and 5.

32
developers with no previous contamination experience, at least within the normal subsidy
range.18
It is interesting that the likelihood of selecting A is similar for the two types of developers
when the only policy instrument is flexible cleanup standards. Finally, on combining 20%
financial assistance, liability relief and flexible cleanup standards, the model predicts that the two
types of developers will have probabilities of selecting A equal to 64% and 44%, respectively.
Comparison between larger and smaller firms suggests that they are similar in terms of
their preferences for liability relief and flexible cleanup standards. They do differ, however, in
terms of their responsiveness to financial incentives. Larger firms have a lower probability of
selecting A at all levels of the subsidy. When offered a policy package that includes a 20-percent
subsidy, flexible cleanup standards and liability relief, for larger firms the likelihood of selecting
project A is about 46%, whereas for smaller firms this probability is 58%.
Similar calculations (not reported in Table 8) show that developers who generally sell the
properties they develop particularly appreciate the opportunity to receive a certificate of
completion relieving them of liability. A developer who sells his project to other parties has a
predicted probability of 38.7% of choosing the contaminated site, A, in the presence of liability
relief alone. This probability grows to 52.2% when a 20% financial incentive is also offered. For
developers who do not sell their projects to others, the corresponding probabilities are 26.4% and
38.4%, respectively. Finally, familiarity with the relevant legislation appears to reduce the appeal
of distrust negotiable cleanup standards, but this effect is weak: given the choice between a
contaminated site, A, where negotiable cleanup standards are offered, and a completely pristine
18 These results are confirmed when our preferred specification of the random coefficient logit model is used. Specifically, for developers with prior experience at contaminated sites the probability of preferring A is 34.07% with a 10% subsidy, 46.68% for a 20% subsidy, 59.50% with 20% subsidy and liability relief, 35.98% with liability relief alone, 26.92% with flexible cleanup alone, 50.91% when the flexible cleanup standards are paired with a 20%

33
site, the probability of selecting the former is about 27.2% for those respondents who are familiar
with the cleanup legislation, and 27.63% for those who said that they were not acquainted with
such legislation.
G. Marginal prices
Table 9 displays the marginal prices of the attributes for the sample as a whole and for
specific groups of developers, based on the median value of a project (€7 million). The table
shows that the presence of contamination is worth €2.5 million, in the sense that, all else the
same, developers would require financial assistance for €2.5 million for a €7 million project
involving a contaminated site where remediation has not been undertaken yet.19 An alternative
interpretation is that developers would be willing to sacrifice up to 2.5 million € to obtain a
pristine site. This accounts for almost 37% of the revenue of the project. There is, however,
much variability in the value of avoiding contamination between different types of developers.
Developers with contaminated site experience, for instance, would require only €1.46 million,
smaller developers €2 million, and larger developers €5 million.
The certification of completion, which exempts the developer from future liability over
contamination at the site, is worth about €1.5 million, implying that developers would sacrifice
subsidy, and 63.94% when liability relief is further added. The corresponding probabilities for a developers without contamination experience are 21.13%, 22.94%, 34.64%, 30.05%, 25.48%, 29.67%, and 42.89%. 19 To interpret the concept of implicit marginal price of each attribute in this context, consider the indirect utility function in section IV.A, which is equal to profits. Profits are assumned to be π=R-C(Cont,X)-L(Cont)+F, where C is development costs, L is liability costs, F is transfers to the developer and Cont is a dummy equal to one if the site is contaminated. Consider the expected profit associated with a pristine site: π0=R-C(Cont=0,X)-L(Cont=0). In the absence of contamination, it is reasonable to assume that L(Cont=0)=0, reducing expected profit to π0=R-C(Cont=0,X). We wish to calculate the payment F that must be made to the developer for him or her to undertake a project at a site of identical characteristics, but where contamination exists. The expected profit with contamination and financial assistance is π1=R-C(Cont=1,X)-L(Cont=1)+F. Because the respondent is asked to consider sites with equal revenue, R is identical across projects. Indifference between the two sites will be reached when the difference in profits is zero: ∆π=π1-π0=[C(Cont=1,X)-C(Cont=0,X)]-L(Cont=1)+F=0. This yields F=[C(Cont=1,X)-C(Cont=0,X)]+L(Cont=1), implying that the direct payment required by the developer to undertake the project at the

34
this amount to secure a letter of completion by the appropriate government agency.20 This is
approximately 21% of the revenue from the project. This time, it appears that developers with no
experience at contaminated sites are willing to pay more to obtain one such a letter (€3.4 million
v. €0.9 million of developers with experience).
Our model also implies that each month of delay in the approval of cleanup plans is
worth €108,000. It is interesting that developers who have previously engaged in projects at
contaminated sites and smaller developers attach lower values to a delay of one month in the
agency’s response time (€59,000 and €96,000, respectively).
Finally, the marginal price of flexible standards is €738,000, implying that respondents
would pay this amount to have the opportunity to negotiate the cleanup standards with the
government agency. This figure represents roughly ten percent of the value of the project here
considered (€7 million).
VI. Conclusions.
We have employed conjoint choice experiments to investigate real estate developers’
preferences for public policies that encourage remediation and re-use of brownfields. Our survey
instrument was administered in person to a sample of respondents intercepted at random at the
MIPIM annual conference in Cannes, France, on March 12-15, 2002.
contaminated site must be equal to the full cost of contamination: i.e. the additional development costs—which are equal to the cost of cleaning up contamination—plus liability costs. 20 To interpret the marginal price of the certificate of completion, consider the profit in the presence and absence of certification (π1 and π0), assuming that certification fully removes liability at a contaminated site. Under this assumption, π1= R-C(Cont=1,X)-L(Cont=1, Cert=1)=R-C(Cont=1,X)-0 and π0= R-C(Cont=1,X)-L(Cont=1, Cert=0)+F. On equating profits under the two alternative scenarios, we find that indifference is reached when F=L(Cont=1,Cert=0). Because L(Cont=1,Cert=0) is the liability cost, developers must be offered as much for them to give up certification, or are willing to pay as much to secure relief from liability. Our estimate suggests that on average developers expect the liability cost at a contaminated site worth €7 million in revenue to be €1.5 million.

35
In our conjoint choice experiments, developers are asked to indicate which they prefer
among projects characterized by site attributes and policies such as liability relief, flexible
cleanup standards, fast-track oversight of plans, and subsidies.
Our conditional logit models of the responses to the choice questions indicate that
developers find sites with contamination problems less attractive than others, and that they do
value liability relief. This confirms our expectation that contaminated sites are less desirable
because of the associated cleanup costs, but refutes earlier claims (Urban Institute et al., 1997)
that liability does not matter. Our respondents are not deterred by prior contamination, once it
has been cleaned up, suggesting that “contamination stigma” is not very important, and
appreciate fast-track review of development and remediation plans, direct financial incentives,
and flexible (negotiable) cleanup standards.
Developers with prior experience with contaminated sites are more responsive to
financial assistance than all others. The likelihood of selecting the contaminated site vis-à-vis a
pristine site increases by roughly 11 percent points for every additional 10-percent subsidies for
developers with contaminated site experience, but by only 2 percent points for developers
without contaminated site experience. Those developers who are not experienced with
contaminated sites are relatively insensitive to subsidies and more responsive to liability relief.
Similar considerations hold for larger firms. Those developers who sell their development
projects, as opposed to using them themselves, appear to value liability relief even more highly.
We calculate that for a project worth €7 million in revenue (the median revenue)
developers need to be compensated €2,5 million for them to accept a contaminated site (in the
absence of other policies), and are willing to give up €1,5 million to secure a certificate of
completion that would exempt them from future liability. Each month’s work of delay in

36
obtaining approval of cleanup plans is valued €108,000, while flexible cleanup standards are
valued €738,000.
In sum, our survey data suggest that developers generally are responsive to policies that
encourage redevelopment and reuse of brownfields through market mechanisms, such as
transfers and liability relief, and through regulatory relief. The impact of these policies, however,
varies with the type of developer. This information, especially if confirmed by other studies,
should be useful in recognizing what types of developers respond to brownfield policies and in
designing brownfield policies.

37
REFERENCES
Bartsch, C., and B. Dorfman. (2000), “Brownfields “State of the States”: An End-of-Session
Review of Initiatives and Program Impacts in the 50 States.” Washington, DC: Northeast-Midwest Institute.
Chan, N. (2001), “Stigma and its Assessments Methods,” paper presented at the Pacific Rim
Real Estate Conference, Adelaide, Australia. Dybvig, L. O. (1992), “Contaminated Real Estate Implications for Real Estate Appraisers,” The
Research and Development Fund, Appraisal Institute of Canada. Fogelman, V.M. (1992), “Hazardous Waste Cleanup, Liability, and Litigation: A Comprehensive
Guide to Superfund Law.” Westport, CT: Quorum. Giangrasso M. and E. Tassoni (2001), “Il programma nazionale di bonifica e ripristino
ambientale dei siti inquinati,” in Ambiente e Sicurezza, 10, Milano: IlSole24Ore, April. Grimski, D., and U. Ferber (2001), “Urban Brownfields in Europe,” Land Contamination and
Reclamation, 9(1), 143-148. Howland M. (2000), “The Impact of Contamination on the Canton/Southeast Baltimore Land
Market,” Journal of the American Planning Association, 66(4), 411-420. Lèvêque F. (1996), “The Regulatory Game,” in Lèvêque, F. (ed.), Environmental Policy in
Europe. Industry, Competition and the Policy Process, Cheltenham, UK: Edward Elgar Publishing Ltd.
McGrath, D.T. (2000), “Urban Industrial Land Redevelopment and Contamination Risk,”
Journal of Urban Economics, 47, 414-442. Meyer, P.B., and H.W. VanLandingham (2000), “Reclamation and Economic Regeneration of
Brownfields,” Reviews of Economic Development Literature and Practice, 1, Washington, DC: U.S. Economic Development Administration.
Meyer P. B., R.H. Williams R.H., and K.R. Yount (1995), “Contaminated Land. Reclamation,
Redevelopment and Reuse in the United States and the European Union,” Aldershot, UK: Edward Elgar Publishing Ltd.
Simons, R.A. (1998), “Turning Brownfields into Greenbacks.” Washington, DC: Urban Land
Institute. Train, K.E. (1999), “Mixed Logit Models for Recreation Demand,” Chapter 4 in Joseph A.
Herriges and Catherine L. Kling (eds.), Valuing Recreation and the Environment.

38
Revealed Preference Methods in Theory and Practice, Cheltenham, UK: Edward Elgar Publishing.
Urban Institute, Northeast-Midwest Institute, University of Louisville and University of Northern
Kentucky (1997), “The Effects of Environmental Hazards and Regulation on Urban Redevelopment,” report to the US Department of Urban Development, Washington, DC, August.
US Conference of Mayors (1996), Impact of Brownfields on US Cities: A 39-City Survey,
Washington, DC. US General Accounting Office (1995), “Community Development: Reuse of Urban Industrial
Sites,” GAO/RCED 95-172, Washington, DC. Viscusi, W.K., W. A. Magat, and J. Huber (1991), “Pricing Environmental Health Risks: Survey
Assessments of Risk-Risk and Risk-Dollar Trade-Offs for Chronic Bronchitis,” Journal of Environmental Economics and Management, 21(1), 32-51.

39
Table 1: Descriptive statistics.
Percent of the sample Type of projects Industrial (q3ind) 48.97 Residential (q3res) 53.42 Commercial (q3com) 73.97 Offices (q3off) 68.15 Other (q3oth) 25.09 Sell (sell1) 64.85 Keep (keep1) 38.23 Lease (lease1) 26.96 Geography South Europe (south_eu) 57.88 North Europe (north_eu) 30.14 West Europe (west_eu) 61.64 East Europe (east_eu) 35.62 North America (north_am) 16.84 Asia (asia) 8.90 Rest of the World (rest_of) 8.25 Typical project Minimum land area of project (q1amin) 231,868 m2 Minimum building of project (q1bmin) 29,160 m2 Minimum revenue of project (q2min) € 666,324,069 Experience Experience with industrial area (q5) 66.21 Experience with contaminated site (q6) 46.76 Abandoned area (q5aban) 59.90 Still used area (q5used) 67.71 Familiarity with legislation (familiar) 76.98 Has ever received govt financial incentives (benefit) 39.31 Characteristics of the respondent Visitor (q9) 51.45 Exhibitor (q9) 48.55 Male (q15) 82.00 Age (q17) 42 Makes decision (q13) 78.97 Gathers information for (q14) 93.75 College degree (university) 88.19 MBA (mba) 2.78 Master’s degree, phd and post graduate (masters_degree_or_phd)
7.64
Employees (q11) 3,733 Level of sales (q11) € 15,895,000
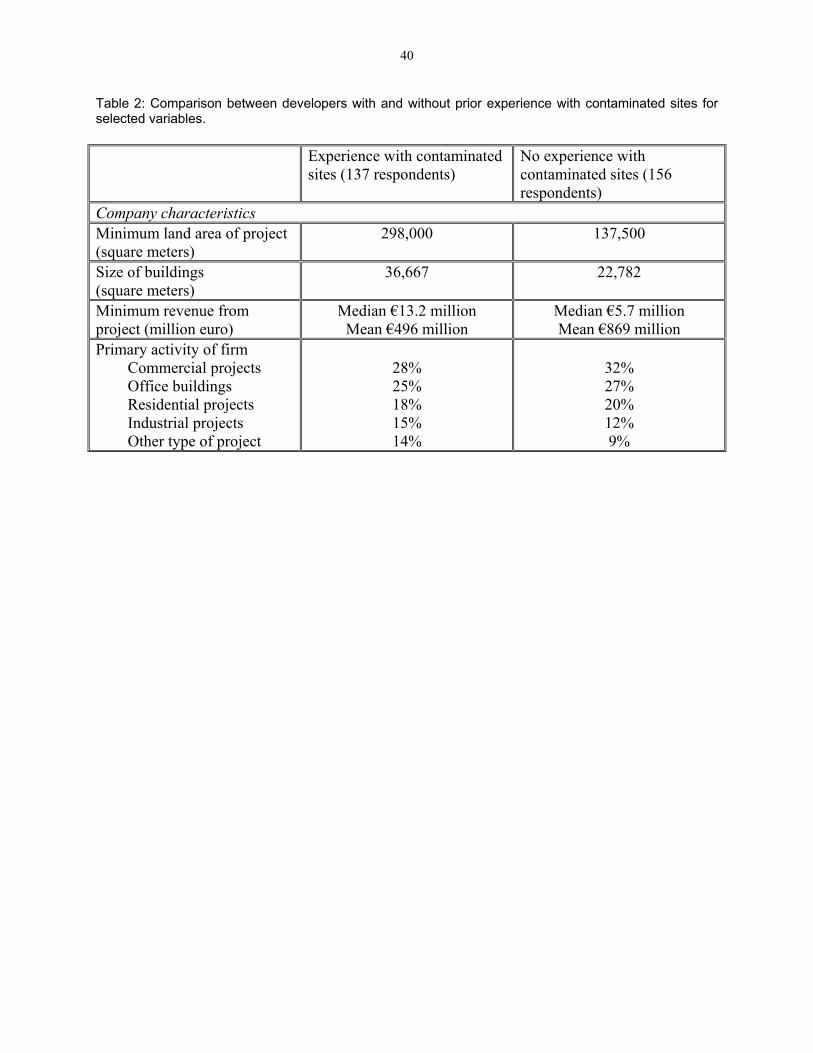
40
Table 2: Comparison between developers with and without prior experience with contaminated sites for selected variables. Experience with contaminated
sites (137 respondents) No experience with contaminated sites (156 respondents)
Company characteristics Minimum land area of project (square meters)
298,000 137,500
Size of buildings (square meters)
36,667 22,782
Minimum revenue from project (million euro)
Median €13.2 million Mean €496 million
Median €5.7 million Mean €869 million
Primary activity of firm Commercial projects Office buildings Residential projects Industrial projects Other type of project
28% 25% 18% 15% 14%
32% 27% 20% 12% 9%

41
41
Table 3: Basic Model. (1)
Complete Sample 2303 obs.
Log L=-1631.026
(2) Cleaned Sample*
2239 obs. Log L=-1574.78
(3) Private Firms*
1886 obs. Log L=-1310.974
(4) Private Firms, No
Consultants,* 1542 obs. Log L=-1072.166
Coefficient (t value)
Coefficient (t value)
Coefficient (t value)
Coefficient (t value)
Site characteristics CONTAM_P -0.8903
(-1.969) -0.9994 (-2.124)
-1.1572 (-1.785)
-2.3487 (-2.059)
CONTAM_C 0.3882 (0.855)
0.2848 (0.603)
0.1757 (0.271)
-1.0548 (-0.925)
CONTAM_A 0.3557 (0.788)
0.2524 (0.538)
0.1280 (0.198)
-1.0753 (-0.945)
HIGHWAY -2.3170 (-1.733)
-2.2667 (-1.685)
-2.1697 (-1.529)
-1.0298 (-0.604)
PORT 0.3952 (4.533)
0.4095 (4.627)
0.4414 (4.543)
0.4383 (4.082)
RAILROAD 1.7802 (1.425)
1.8187 (1.453)
1.8168 (1.454)
1.8699 (1.496)
AIRPORT 0.3153 (3.731)
0.3117 (3.638)
0.2829 (3.043)
0.3121 (3.082)
CITYPRES 1.0278 (14.039)
1.0562 (14.124)
1.0648 (13.013)
1.0785 (11.915)
Policies INCENT 0.0272
(6.295) 0.0274 (6.258)
0.0316 (6.544)
0.0322 (6.069)
CERTIFIC 0.5531 (7.689)
0.5740 (7.835)
0.5047 (6.299)
0.5322 (5.980)
OVERS -0.0413 (-10.477)
-0.0423 (-10.560)
-0.0413 (-9.429)
-0.0408 (-8.457)
FLEXSTDS 0.2969 (4.297)
0.2895 (4.119)
0.3561 (4.570)
0.3597 (4.146)
* = 8 respondents exhibiting preference reversals (e.g., choose A between A and B, choose B between A, B and neither project) are excluded.

42
42
Table 4: Conditional Logit Models with Interactions between attributes and experience with contaminated sites. Cleaned sample only, respondents who exhibited preference reversals excluded. N=2239. Coefficient T statistic Site characteristics CONTAM_P -1.2102 -2.532 CONTAM_C 0.2171 0.462 CONTAM_A 0.1968 0.424 HIGHWAY -2.4220 -1.802 PORT 0.2164 4.658 RAILROAD 2.0647 1.650 AIRPORT 0.3186 3.697 CITYPRES 1.0657 14.159 Policies INCENT 0.0119 2.177 CERTIFIC 0.5836 5.771 OVERS -0.0471 -8.765 FLEXSTDS 0.3513 3.543 Interaction terms INCENT×experienced with contaminated sites
0.0335 4.600
CONTAM_P×experienced with contaminated sites
0.2654 1.642
CERTIFIC×experienced with contaminated sites
0.0145 0.099
OVERS×Experienced with contaminated sites
0.0085 1.151
FLEXSTDS×Experienced with contaminated sites
-0.1444 -1.053
Log likelihood function -1552.36
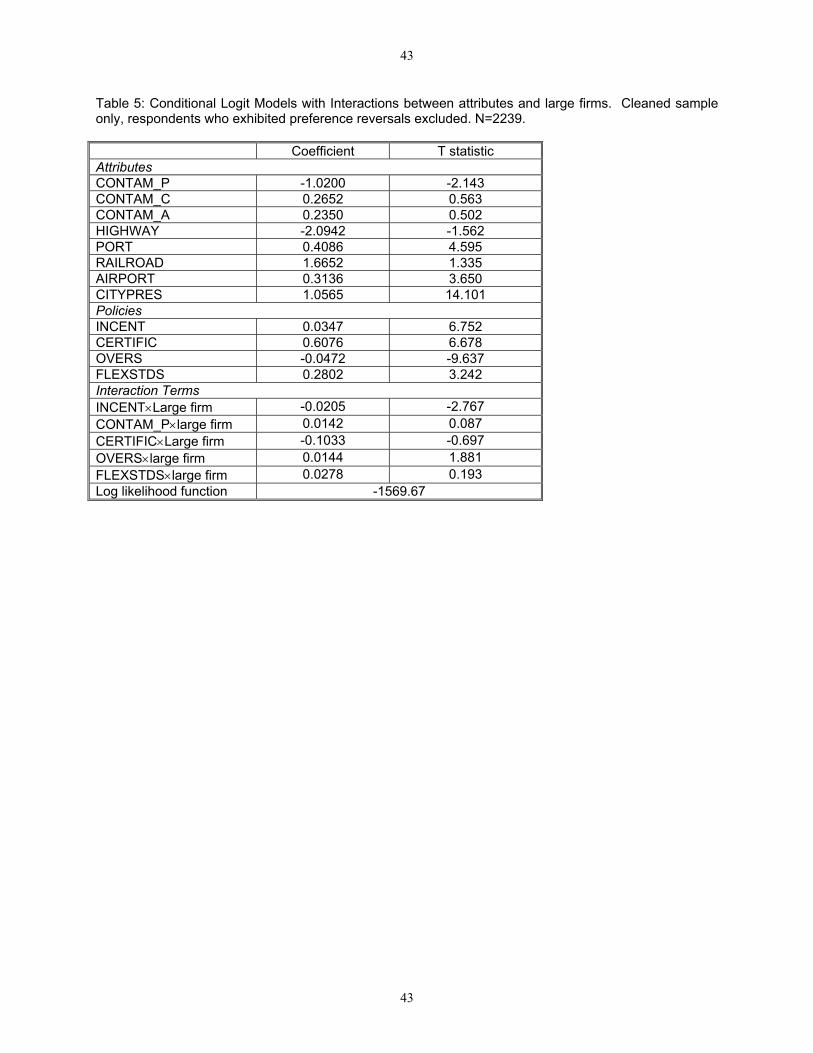
43
43
Table 5: Conditional Logit Models with Interactions between attributes and large firms. Cleaned sample only, respondents who exhibited preference reversals excluded. N=2239. Coefficient T statistic Attributes CONTAM_P -1.0200 -2.143 CONTAM_C 0.2652 0.563 CONTAM_A 0.2350 0.502 HIGHWAY -2.0942 -1.562 PORT 0.4086 4.595 RAILROAD 1.6652 1.335 AIRPORT 0.3136 3.650 CITYPRES 1.0565 14.101 Policies INCENT 0.0347 6.752 CERTIFIC 0.6076 6.678 OVERS -0.0472 -9.637 FLEXSTDS 0.2802 3.242 Interaction Terms INCENT×Large firm -0.0205 -2.767 CONTAM_P×large firm 0.0142 0.087 CERTIFIC×Large firm -0.1033 -0.697 OVERS×large firm 0.0144 1.881 FLEXSTDS×large firm 0.0278 0.193 Log likelihood function -1569.67

44
44
Table 6: Conditional Logit Models with Interactions between attributes and other activities of the firm. Cleaned sample, respondents who exhibited preference reversals excluded. N=2239. T statistics in parentheses. A B C CONTAM_P -1.0753
(-2.250) -1.0279 (-2.176)
-1.0257 (-2.174)
CONTAM_C 0.3049 (0.648)
0.2770 (0.589)
0.2868 (0.608)
CONTAM_A 0.2735 (0.584)
0.2446 (0.521)
0.2532 (0.537)
HIGHWAY -2.4911 (-1.855)
-2.2459 (-1.666)
-2.2908 (-1.704)
PORT 0.3998 (4.502)
0.4087 (4.619)
0.4064 (4.589)
RAILROAD 2.0109 (1.611)
1.8065 (1.441)
1.8407 (1.472)
AIRPORT 0.3162 (3.681)
0.3133 (3.656)
0.3111 (3.629)
CITYPRES 1.0610 (14.142)
1.0564 (14.130)
1.0558 (14.116)
INCENT 0.0276 (6.280)
0.0274 (6.256)
0.0275 (6.282)
CERTIFIC 0.3260 (2.899)
0.5738 (7.835)
0.5752 (7.851)
OVERS -0.0423 (-10.513)
-0.0425 (-10.572)
-0.0424 (-10.565)
FLEXSTDS 0.2884 (4.090)
0.2893 (4.116)
0.2907 (4.134)
CONTAM_P×SELL1 0.1551 (0.955)
CERTIFIC×SELL1 0.4054 (2.912)
CONTAM_P×primary activity is residential projects
0.1226 (0.608)
CONTAM_P×primary activity is industrial projects
0.1761 (0.841)
Log likelihood function -1569.38 -1574.59 -1574.43
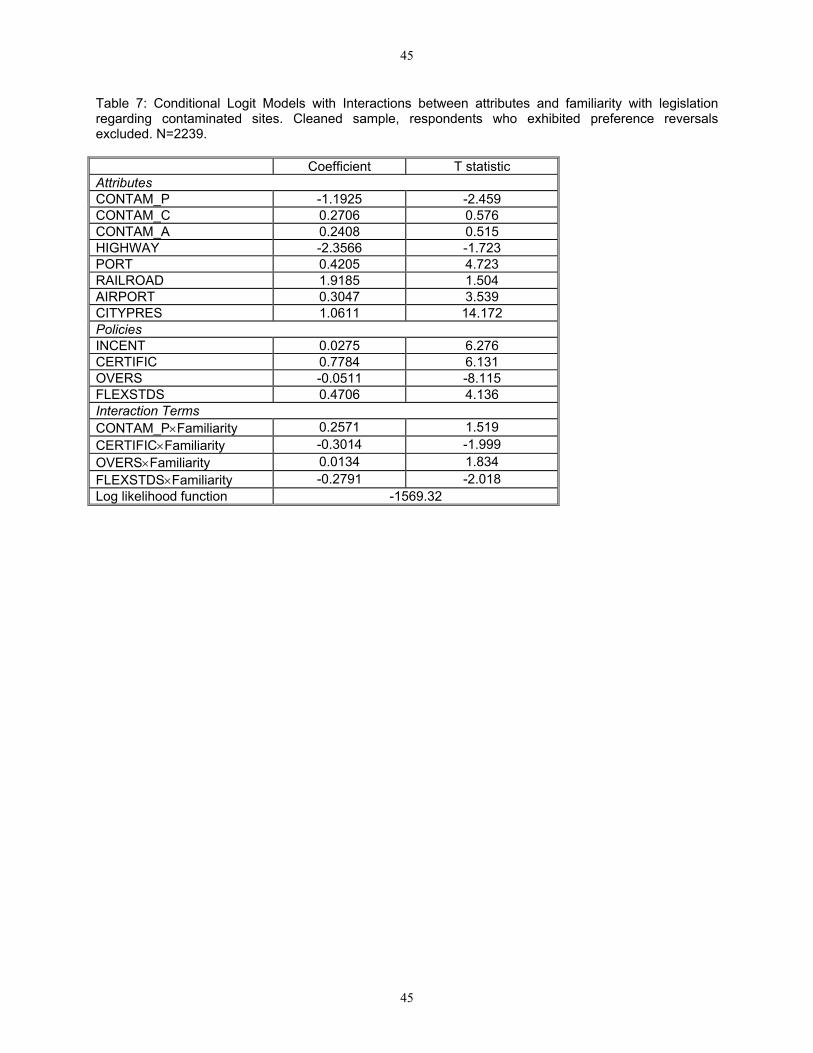
45
45
Table 7: Conditional Logit Models with Interactions between attributes and familiarity with legislation regarding contaminated sites. Cleaned sample, respondents who exhibited preference reversals excluded. N=2239. Coefficient T statistic Attributes CONTAM_P -1.1925 -2.459 CONTAM_C 0.2706 0.576 CONTAM_A 0.2408 0.515 HIGHWAY -2.3566 -1.723 PORT 0.4205 4.723 RAILROAD 1.9185 1.504 AIRPORT 0.3047 3.539 CITYPRES 1.0611 14.172 Policies INCENT 0.0275 6.276 CERTIFIC 0.7784 6.131 OVERS -0.0511 -8.115 FLEXSTDS 0.4706 4.136 Interaction Terms CONTAM_P×Familiarity 0.2571 1.519 CERTIFIC×Familiarity -0.3014 -1.999 OVERS×Familiarity 0.0134 1.834 FLEXSTDS×Familiarity -0.2791 -2.018 Log likelihood function -1569.32

46
46
Table 8. Probability of selecting the contaminated site vis-à-vis a pristine site. Site A=contaminated site with policy incentives. Site B=pristine site with no policy incentives.
Probability of selecting A over B (Percent) Policy incentive offered at site A
(1)
All
(2) Developers
with contaminated
site experience
(3) Developers
with NO contaminated
site experience
(4)
Large firms
(5)
Small firms
10% financial assistance
27.33 33.43 21.62 25.00 28.74
20% financial assistance
33.10 44.19 23.70 27.75 36.33
Liability relief alone
33.67 36.74 30.50 32.37 34.35
20% financial assistance + liability relief
46.76 59.01 35.77 38.87 51.16
Flexible cleanup standards
27.64 28.19 25.81 28.23 27.39
20% financial assistance + flexible cleanup standards
39.79 49.33 30.62 34.32 43.02
20% financial assistance + liability relief +flexible cleanup standards
53.98 63.91 44.17 46.39 58.09
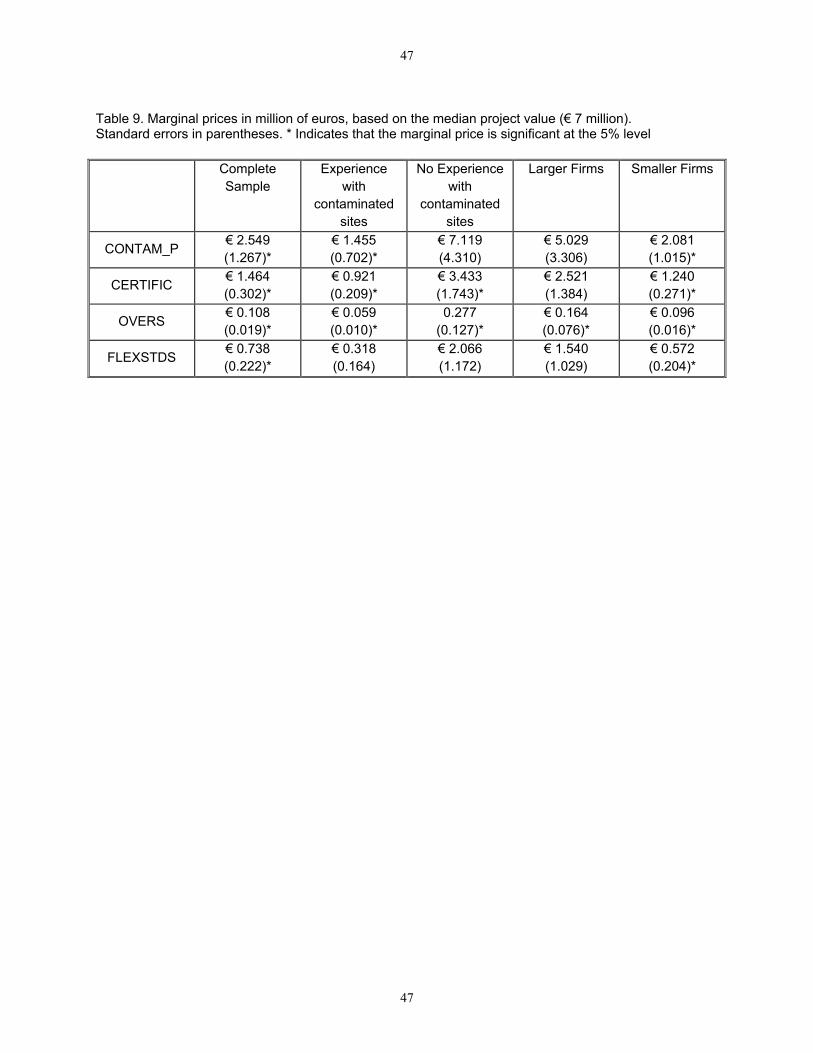
47
47
Table 9. Marginal prices in million of euros, based on the median project value (€ 7 million). Standard errors in parentheses. * Indicates that the marginal price is significant at the 5% level
Complete Sample
Experience with
contaminated sites
No Experience with
contaminated sites
Larger Firms Smaller Firms
CONTAM_P € 2.549 (1.267)*
€ 1.455 (0.702)*
€ 7.119 (4.310)
€ 5.029 (3.306)
€ 2.081 (1.015)*
CERTIFIC € 1.464 (0.302)*
€ 0.921 (0.209)*
€ 3.433 (1.743)*
€ 2.521 (1.384)
€ 1.240 (0.271)*
OVERS € 0.108 (0.019)*
€ 0.059 (0.010)*
0.277 (0.127)*
€ 0.164 (0.076)*
€ 0.096 (0.016)*
FLEXSTDS € 0.738 (0.222)*
€ 0.318 (0.164)
€ 2.066 (1.172)
€ 1.540 (1.029)
€ 0.572 (0.204)*

48
48
Figure 1: Example of Choice Question. SECTION D Site choice Now, we would like to ask you to choose between two hypothetical areas to develop. For each question, you will be described two hypothetical sites and will be asked to choose which one you believe is the more attractive of these two sites, based on the characteristics of the site. In answering the following questions, please imagine that you are considering development projects of value/size similar to those of your company’s typical project. The development project will be in the country or countries where your company generally does its business. Please be assured that your answers will be kept strictly confidential. CHOICE 1
Attributes SITE A Site B
Site contamination Present Present
Transportation network available within 20 km
Highway Highway and railroad
Certificate of no further action Yes No
Oversight by government agency Response to developer’s application
within 6 months Response to developer’s application
within 6 months
Cleanup standards Flexible Flexible
City within 20 km Present Present
Government financial incentives as % of the value of the project
20% 10%
Which project do you find more attractive between A and B?
A B
If you were to choose between A, B, and the option of not participating in either of the two projects, which would you choose?
A B Neither