The role of geographic information systems in wildlife landscape epidemiology: models of chronic...
13
Veterinaria Italiana, 43 (3), 581-593 © IZS A&M 2007 www.izs.it/vet_italiana Vol. 43 (3), Vet Ital 581 The role of geographic information systems in wildlife landscape epidemiology: models of chronic wasting disease in Colorado mule deer Matthew L. Farnsworth (1) , Jennifer A. Hoeting (2) , N. Thompson Hobbs (1) , Mary M. Conner (3) , Kenneth P. Burnham (4) , Lisa L. Wolfe (5) , Elizabeth S. Williams (6) , David M. Theobald (1) & Michael W. Miller (5) Summary The authors present findings from two landscape epidemiology studies of chronic wasting disease (CWD) in northern Colorado mule deer (Odocoileus hemionus). First, the effects of human land use on disease prevalence were explored by formulating a set of models estimating CWD prevalence in relation to differences in human land use, sex and geographic location. Prevalence was higher in developed areas and among male deer suggesting that anthropogenic influences (changes in land use), differences in exposure risk between sexes and landscape-scaled heterogeneity are associated with CWD prevalence. The second study focused on identifying scales of mule deer movement and mixing that had the greatest influence on the spatial pattern of CWD in north-central Colorado. The authors hypothesised that three scales of mixing – individual, winter subpopulation and summer subpopulation – might control spatial variation in disease prevalence. A fully Bayesian hierarchical model was developed to compare the strength of evidence for each mixing scale. Strong evidence was found indicating that the finest mixing scale corresponded best to the observed spatial distribution of CWD prevalence. This analysis demonstrates how information on the scales of spatial processes that generate observed patterns can be used to gain insight into the epidemiology of wildlife diseases when process data are sparse or unavailable. Keywords Bayesian hierarchical model, Chronic wasting disease, Disease ecology, Geographic information system, Land-use change, Model selection, Spatial epidemiology, Spatial model, Spatial scale. (1) Natural Resources Ecology Laboratory, Colorado State University, Fort Collins, Colorado 80523-1499, United States of America [email protected] Present address: USDA-APHIS-VS, Centers for Epidemiology and Animal Health, Natural Resources Research Center, 2150 Centre Avenue, Building B, Fort Collins, Colorado 80526-8117, United States of America (2) Department of Statistics, Colorado State University, Fort Collins, Colorado 80523-1877, United States of America (3) Department of Forest, Range, and Wildlife Sciences, Utah State University, Logan, Utah 84322, United States of America (4) USGS, Colorado Cooperative Fish and Wildlife Research Unit, Colorado State University, Fort Collins, Colorado 80523, United States of America (5) Colorado Division of Wildlife, Wildlife Research Center, 317 West Prospect Road, Fort Collins, Colorado 80526-2096, United States of America (6) Department of Veterinary Sciences, University of Wyoming, 1174 Snowy Range Road, Laramie, Wyoming 82070, United States of America
-
Upload
independent -
Category
Documents
-
view
5 -
download
0
Transcript of The role of geographic information systems in wildlife landscape epidemiology: models of chronic...

Veterinaria Italiana, 43 (3), 581-593
© IZS A&M 2007 www.izs.it/vet_italiana Vol. 43 (3), Vet Ital 581
The role of geographic information systems in wildlife
landscape epidemiology: models of chronic wasting
disease in Colorado mule deer
Matthew L. Farnsworth(1), Jennifer A. Hoeting(2), N. Thompson Hobbs(1), Mary M. Conner(3), Kenneth P. Burnham(4), Lisa L. Wolfe(5), Elizabeth S. Williams(6), David M. Theobald(1) & Michael W. Miller(5)
Summary The authors present findings from two landscape epidemiology studies of chronic wasting disease (CWD) in northern Colorado mule deer (Odocoileus hemionus). First, the effects of human land use on disease prevalence were explored by formulating a set of models estimating CWD prevalence in relation to differences in human land use, sex and geographic location. Prevalence was higher in developed areas and among male deer suggesting that anthropogenic influences (changes in land use), differences in exposure risk between sexes and landscape-scaled heterogeneity are associated with CWD prevalence. The second study focused on identifying scales of mule deer movement and mixing that had the greatest influence on the spatial pattern of CWD in north-central Colorado. The authors hypothesised that three scales of mixing – individual, winter subpopulation and summer subpopulation – might control spatial variation in disease
prevalence. A fully Bayesian hierarchical model was developed to compare the strength of evidence for each mixing scale. Strong evidence was found indicating that the finest mixing scale corresponded best to the observed spatial distribution of CWD prevalence. This analysis demonstrates how information on the scales of spatial processes that generate observed patterns can be used to gain insight into the epidemiology of wildlife diseases when process data are sparse or unavailable.
Keywords Bayesian hierarchical model, Chronic wasting disease, Disease ecology, Geographic information system, Land-use change, Model selection, Spatial epidemiology, Spatial model, Spatial scale.
(1) Natural Resources Ecology Laboratory, Colorado State University, Fort Collins, Colorado 80523-1499,
United States of America [email protected] Present address: USDA-APHIS-VS, Centers for Epidemiology and Animal Health, Natural Resources Research Center, 2150 Centre Avenue, Building B, Fort Collins, Colorado 80526-8117, United States of America
(2) Department of Statistics, Colorado State University, Fort Collins, Colorado 80523-1877, United States of America (3) Department of Forest, Range, and Wildlife Sciences, Utah State University, Logan, Utah 84322, United States of
America (4) USGS, Colorado Cooperative Fish and Wildlife Research Unit, Colorado State University, Fort Collins,
Colorado 80523, United States of America (5) Colorado Division of Wildlife, Wildlife Research Center, 317 West Prospect Road, Fort Collins,
Colorado 80526-2096, United States of America (6) Department of Veterinary Sciences, University of Wyoming, 1174 Snowy Range Road, Laramie,
Wyoming 82070, United States of America

The role of geographic information systems in wildlife Matthew L. Farnsworth, Jennifer A. Hoeting, N. Thompson Hobbs, landscape epidemiology: models of chronic wasting disease Mary M. Conner, Kenneth P. Burnham, Lisa L. Wolfe, in Colorado mule deer Elizabeth S. Williams, David M. Theobald & Michael W. Miller
582 Vol. 43 (3), Vet Ital www.izs.it/vet_italiana © IZS A&M 2007
Il ruolo dei sistemi informativi geografici nell’epidemiologia ambientale degli animali selvatici: modelli della malattia del deperimento cronico nel cervo mulo in Colorado Riassunto Gli autori presentano i risultati di due studi di epidemiologia ambientale sulla malattia del deperimento cronico del cervo mulo (Odocoileus hemionus) nel nord del Colorado. Innanzitutto sono stati valutati gli effetti dell’uso del suolo sulla prevalenza della malattia attraverso la formulazione di un set di modelli che stimano la prevalenza della malattia del dimagrimento cronico in relazione al diverse tipologie di uso del suolo da parte dell’uomo, al sesso e alla localizzazione geografica. Una prevalenza più alta è stata riscontrata nelle aree sviluppate e tra i cervi maschi lasciando così supporre che le influenze antropogeniche (cambiamenti nell’utilizzo del terreno), le differenze di esposizione al rischio tra i sessi e l’eterogeneità ecologiche bilanciate siano associate alla prevalenza della malattia del dimagrimento cronico. Lo studio successivo identifica i diversi livelli di movimento e di mescolanza delle popolazioni del cervo mulo riconosciuti come elementi influenzanti la tipologia di distribuzione spaziale della malattia del dimagrimento cronico nel Colorado centro-settentrionale. Gli autori ipotizzano che tre tipologie di mescolamento – individui, subpopola-zione invernale e subpopolazione estiva – siano in grado di influenzare le variazioni spaziali nella prevalenza della malattia. E’ stato sviluppato un modello gerarchico Bayesiano per mettere a confronto la capacità di prova per ciascuna scala di mescolamento. Mediante questa analisi è stato possibile evidenziare come la scala che descrive i rimescolamenti di popolazione, in maniera più particolareggiata possa essere usata per descrivere la distribuzione spaziale della prevalenza della malattia del dimagrimento cronico osservata. Questa analisi dimostra come le informazioni provenienti dalla definizione dei processi spaziali, che generano le tipologie di diffusione delle patologie osservate, possano essere utilizzate per conseguire nuove informazioni sull’epidemiologia delle malattie della fauna selvatica nel caso in cui i
dati utilizzati siano non omogenei per provenienza o non disponibili.
Parole chiave Cambiamenti dell’uso del suolo, Ecologia delle malattie, Epidemiologia spaziale, Malattia del dimagrimento cronico, Modelli gerarchici Bayesiani, Modello di selezione, Modelli spaziali, Scale spaziali, Sistema informativo geografico.
Introduction Little attention has been paid to the ways in which humans influence the dynamics of pathogens and hosts (6, 19). A variety of emerging, infectious diseases affect wildlife populations (11, 21) and the dynamics of these pathogen-wildlife systems are potentially shaped by human action. Linking spatial disease patterns to the processes that generate them offers a contemporary challenge to the field of landscape epidemiology (12), particularly in wildlife systems where information is often sparse or absent. It is possible that emergent patterns might reflect the outcome of processes operating at more than one nested scale. Hierarchical models provide a natural, unified framework for comparing spatial and temporal processes that operate across a range of scales. Research findings are summarised from two previously reported studies (7, 8). The first study (7) explored how patterns of human land use influence variation in chronic wasting disease (CWD) prevalence across north-central Colorado. The authors hypothesised that human development of mule deer habitat could result in higher CWD prevalence. We also examined the influence of gender and geographic location on prevalence since earlier analyses (13, 15) suggested that these factors may affect patterns of CWD prevalence. In the second study (8), we used hierarchical modelling to investigate the potential contribution of different scales of deer movement and mixing to observed patterns of CWD in northern Colorado mule deer. In addition to gaining insights into the spatial epidemiology of CWD, we demonstrated how
Matthew L. Farnsworth, Jennifer A. Hoeting, N. Thompson Hobbs, The role of geographic information systems in wildlife Mary M. Conner, Kenneth P. Burnham, Lisa L. Wolfe, landscape epidemiology: models of chronic wasting disease Elizabeth S. Williams, David M. Theobald & Michael W. Miller in Colorado mule deer
© IZS A&M 2007 www.izs.it/vet_italiana Vol. 43 (3), Vet Ital 583
hierarchical modelling can be used to understand the relative contribution of hypothesised generating processes to spatial patterns of disease.
Human land use and chronic wasting disease The epidemic area in north-central Colorado includes human communities that are growing more rapidly than almost any in the United States (1). Between 1970 and 2000, areas with housing density greater than 1 per 20 ha within game management units most affected by CWD (18) more than doubled (40 636 to 81 836 ha). The effects of land-use change on disease processes in mule deer populations are poorly understood, however two potential mechanisms could exacerbate disease transmission in developed areas. First, if deer avoid areas of high human population density (for example, because of fences, dogs and other sources of disturbance), development could compress the area of landscape used by deer, thereby increasing their density. It is plausible that increased density could accelerate rates of contact between infected and susceptible individuals. Second, development tends to reduce hunting pressure. As a result, adult deer, particularly males, tend to live longer in areas where hunting pressure is low, which prolongs the average clinical course by eliminating a major source of mortality and increasing the total time infected animals are able to transmit CWD.
Movement scales and chronic wasting disease Mule deer movement in north-central Colorado can be divided into three categories, reflecting the geographic scales of seasonally dependent movement patterns (5). At the largest scale, the summer subpopulation home range, mule deer home range sizes average approximately 310 km2 and exhibit greater overlap (about 22%) than at any other time of year (5). At the winter subpopulation home range scale, deer live in groups with average home range size of approximately 80 km2 and exhibit little overlap (<1%) among wintering groups (5). Finally, individual mule deer have a characteristic home range size that averages
about 9 km2 during the winter when deer are more sedentary (5). High fidelity to seasonal use areas and temporally consistent movement patterns of subpopulations (5) and presumably the resulting home range scales, suggest the importance of local, small-scale contact processes in structuring CWD spatial heterogeneity. Large-scale movement patterns – such as those that occur when subpopulations expand their home range between winter and summer locations – could result in a greater number of contacts among deer that do not interact during the winter months. If large-scale movements were primarily responsible for the structure of the spatial heterogeneity of CWD, then the spatial distribution of infected deer should exhibit greater homogeneity at large geographic scales than would be expected if disease transmission occurs predominately at local winter subpopulation or individual movement scales.
Methods
Study area Our study area included 6 500 km2 in north-central Colorado (Fig. 1) where CWD is endemic in free-ranging cervids (13). Within this area we studied the relationship between CWD infection and human land use using three study sites spanning approximately 1 200 km2 in Larimer County, Colorado, namely: Estes Park (EP), Glacier View Meadows (GVM) and Horsetooth Reservoir (HT). We selected these sites because they were typical of rapidly growing development patterns found in historic mule deer habitat in north-central Colorado where housing developments perforate the landscape (18). Each of the three study sites consisted of a developed zone nested within a larger undeveloped portion of the landscape (Fig. 2). We separated land use into developed and undeveloped categories based on a housing density map (7, 17). Developed zones were defined as having ≥1 dwelling per 8 ha (20 acres) and ‘undeveloped’ zones were remaining areas with <1 dwelling per 8 ha.

The role of geographic information systems in wildlife Matthew L. Farnsworth, Jennifer A. Hoeting, N. Thompson Hobbs, landscape epidemiology: models of chronic wasting disease Mary M. Conner, Kenneth P. Burnham, Lisa L. Wolfe, in Colorado mule deer Elizabeth S. Williams, David M. Theobald & Michael W. Miller
584 Vol. 43 (3), Vet Ital www.izs.it/vet_italiana © IZS A&M 2007
Figure 1 Study site in north-central Colorado overlaid with the spatial distribution of chronic wasting disease (CWD) data and the 540 9-km2 grid cells used in modelling individual-level infection probability at the finest analysis scale
Data The Colorado Division of Wildlife (CDOW) provided georeferenced data for 3 855 mule deer (Fig. 1) tested for CWD infection between 1997 and 2003 within the study area. All samples were georeferenced using either a global positioning system unit or by identifying sample source locations on standardised maps. Sampling methods included deer that were killed by hunters, culled by wildlife managers, or captured and tonsil biopsied in developed areas. Survey and diagnostic methods have been described in detail elsewhere (13, 14, 22). Sampled deer
were classified as CWD-positive or -negative based on immunohistochemistry of retropharyngeal lymph node or tonsil tissue (14).
Figure 2 Locations of the three study sites, Estes Park (EP), Glacier View Meadows (GVM) and Horsetooth Reservoir (HT), in north-central Colorado
For the first analysis, examining the impacts of anthropogenic land use on CWD, we used georeferenced data on presence/absence of CWD infection in individual deer sampled from urban and non-urban areas between 1997 and 2002. We used a geographic information system (GIS) to assign each deer sample location to a land-use class (Fig. 2). Deer sampled in or within 1 km of core developed areas in each study site were categorised as ‘urban’ deer; deer sampled >1 km from developed areas were categorised as ‘non-
CWD status negative positive 3 km ×3 km cells
0 25 50 75 100
km
#######################################################################################
####################
######################################################################
######## ###
########
########### #### # ## # ##
### #
#
# # #
# # # #
## #
#
# ## # ## # #
# # ####
#
#
#####
# # # #
# #
## ##
# # #
## # #
#
# # # # # #
##
# ## #
##
## # ##
##
# #
##
# # #
# # ###
###
# ##
#
##
#### # ### #
# ####
##
# #
# #
## # # # # #
# # # # # # # #
# # #
# # # # # # ## # # #
# # # # # #
##
# # # #
# ## # ### #
# # # #
#
#### #
# # #
# ##
# # #
## # #
##
# # # # # ##
#
#
#
## # # # ## # # # # ## # # # # # # # # # # # # # #
## # # ###### # #
## #### # # # # # # # # # ## # ## # # # # # ## ## # # # # # # # ## ## # # # # ## ## # # # ### # ### # # # ### # ### # # # # # # # # # ## # ## # # # # # # # # ### ## # # ## # # # # ### # # ## # # # ## # ## ## ## ################################################# # ## ##### # ### ###### # # ### # #### ##### ## # ####### # # # # # ######### ################ ########### ## ## ########## # #### #####
# # # # # # # # # # # # # # # # # # # # # # # # # # # # # # # # # # # # # # # # # # # # # # # # # # # # # # # # # # # # # # # # # # # # # # # # # # # # # # # # # # # # # # # # # # # # # # # # # # # # # # # # # # # # # # # # # # # # # # # # # # # # # # # # # # # # # # # # # # # # # # # #
Study site
Colorado
km 0 100 200 300 400 500
GVM
HT
EP
0 10 20 30 40 50 km
N
Study site
Colorado
0 100 200 300 400 500 km
Non-urban deer Urban deer Urban land use

Matthew L. Farnsworth, Jennifer A. Hoeting, N. Thompson Hobbs, The role of geographic information systems in wildlife Mary M. Conner, Kenneth P. Burnham, Lisa L. Wolfe, landscape epidemiology: models of chronic wasting disease Elizabeth S. Williams, David M. Theobald & Michael W. Miller in Colorado mule deer
© IZS A&M 2007 www.izs.it/vet_italiana Vol. 43 (3), Vet Ital 585
urban’ deer. First, we wanted to reduce mapping errors associated with deer sampled near the boundary between developed and undeveloped zones. Second, although deer sampled in developed zones undoubtedly spent time in these areas, some deer residing in developed zones also may spend time in the periphery of these areas, where they could have been sampled. The sample of non-urban deer was specified by using concentric rings extending out from the developed land-use class in half kilometre increments (Fig. 3) until we obtained a sample size of non-urban deer that was similar to the number of urban deer collected from the corresponding developed zone at each study site. Having an equal number from each category provided a balanced design for model fitting and removed any arbitrariness that might be associated with how far out to extend the concentric rings from the urban areas.
Figure 3 Mule deer samples for the Glacier View Meadows site, showing the area defined as ‘developed’ along with the half-kilometre annuli used for allocating deer to ‘undeveloped’ land use class
For the second analysis, we used a GIS to partition the study area into three grids so that each grid had a resolution representing one of the scales of mule deer movement: 9 km2, 81 km2 and 324 km2 overlaid on the map of deer samples (Fig. 1 illustrates the 9 km2
example). The 9 km2 grid (3×3 km square) was the sampling grid established by the CDOW. The two coarser scale grids resulted from combining multiple 9 km2 grid cells. Beginning with the north-western most 9 km2 cell, we used a moving window to combine neighbouring 9 km2 cells until we had achieved a new grid cell with a resolution equal to the next coarsest scale of deer movement. This process was iterated across the entire map at both of the coarser movement scales. Constructing the grids in this manner resulted in all three grids being aligned with the 9 km2 sampling grid established by the CDOW. Finally, because CWD prevalence remained relatively constant within the study area between 1996 and 2003 (13, 16) we aggregated the data across all years. Data on sex and age class (juvenile or adult) were recorded for each deer. In addition, three environmental (Env) covariates were calculated using a GIS containing data grids representing land ownership and vegetation patterns across the study area at a 90-metre resolution. The covariate values were: proportion of private land (%PRIV), proportion of low elevation habitat (%HAB) and an index measure of private land connectivity (DISP), calculated for each grid-cell across the three movement scale grids used in the model. Each environmental covariate was assumed to exert the same influence on all individuals sampled from the same grid cell. Thus, these covariates were scaled to the map resolution considered in each model.
Models for human land use We used likelihood methods and information theoretics (Akaike’s information criterion corrected for small sample size: AICc) (4) to estimate parameters and quantify the strength of evidence, respectively, for 16 alternative logistic regression models describing the relationship between CWD prevalence and the three variables of interest, namely: land use type, sex and study site. Our primary hypothesis was that higher prevalence would be associated with developed, versus nearby
N
0 5 10 15 km
Non-urban land use 1/2 km rings Urban samples 0.5 1.5-2.0
Non-urban samples 0.5-1.0 2-2.5 Urban land use 1-1.5

The role of geographic information systems in wildlife Matthew L. Farnsworth, Jennifer A. Hoeting, N. Thompson Hobbs, landscape epidemiology: models of chronic wasting disease Mary M. Conner, Kenneth P. Burnham, Lisa L. Wolfe, in Colorado mule deer Elizabeth S. Williams, David M. Theobald & Michael W. Miller
586 Vol. 43 (3), Vet Ital www.izs.it/vet_italiana © IZS A&M 2007
undeveloped, areas. Land-use effect was represented by the binary covariate ‘Use’, indicating whether a deer was sampled from the developed or undeveloped land-use class. The influence of gender was coded as ‘Sex’ (male, female). Site level effects were coded as EP, GVM and HT. Model parameters were estimated from data, so there was some uncertainty that the ‘best’ model would emerge as superior if different data were used to compare alternative models. We quantified model uncertainty with Akaike weights, wr (4). The wr can be used to estimate the likelihood of the model, given the data and in so doing offer a way to compare the relative weight of evidence for each model considered.
Models for movement scales and chronic wasting disease Deer movement data was collected from approximately 10% of the study area. Partitioning the study region into aerial units (grid cells) reflecting the various scales of seasonally dependent mule deer movement patterns allowed us to compare different movement scales with limited information. The hierarchical structure accommodated uncertainties in the point-based CWD data by treating all individuals sampled from within the same grid cell as having an identical exposure risk for CWD after adjusting for individual-level sex and age effects. We considered a generalised linear model of disease presence/absence. For each individual deer, we modelled the probability of being CWD-positive as a function of the covariates and two random effects terms, which accounted for any unobserved, correlated covariates as well as the spatial pattern in the probability of disease presence. This generalised linear model can be described in three stages, as follows: the data model linking the data to the model parameters
the process model relating the covariates and random effects to the parameters
the prior distributions for all model parameters (20).
Our interest focused on the posterior distribution, the distribution of the process and
parameters after being informed by the data. For many ecological problems, the high dimensionality of the model can prohibit the use of standard methods. However, Markov Chain Monte Carlo (MCMC) (9) techniques allowed us to estimate the posterior distribution of interest. The data model relates the known infection status for each deer to the probability of infection. With Yij as the known infection status for deer i = 1,…,nj in cell j = 1,…,k, we assume that infection status is Bernoulli distributed with parameter πij:
Yij ∼ Bernoulli (πij), [1] where πij is the probability of infection for individual i in cell j. All observations are assumed to be conditionally independent given this parameter. The process component of the model relates the probability of infection for each deer, Πij, to the individual and environmental covariates. We included two random effects terms to account for variability that is not accounted for by the covariates. To constrain the Bernoulli distributed infection probability to the range 0 to 1, we used a standard logit transformation. Thus we modelled the probability that an individual is infected as: logit( ) T
ij ij j jxπ µ β γ δ= + + + , [2] where µ is the background infection rate common to all deer, βis an m × 1 vector of regression coefficients corresponding to the
Ti jx , the transpose of the m × 1 vector of
individual covariates for the ith deer and the scale-dependent environmental covariates associated with the jth grid cell, γj is the scale-dependent spatial random effects term for the jth grid cell, and δj is the independent random effects term associated with the jth grid cell. The independent random effects vary with the scale of analysis, but exhibit no spatial dependency. The random effect terms are described below. Here we present descriptions of the prior and posterior distributions, but much of the detail has necessarily been omitted. Interested readers will find detailed descriptions in Farnsworth et al. (8). Because our analysis is fully Bayesian, we specify prior distributions

Matthew L. Farnsworth, Jennifer A. Hoeting, N. Thompson Hobbs, The role of geographic information systems in wildlife Mary M. Conner, Kenneth P. Burnham, Lisa L. Wolfe, landscape epidemiology: models of chronic wasting disease Elizabeth S. Williams, David M. Theobald & Michael W. Miller in Colorado mule deer
© IZS A&M 2007 www.izs.it/vet_italiana Vol. 43 (3), Vet Ital 587
for all model parameters in the hierarchy. The spatial component, modelled by γj, is a key parameter of interest because it models the latent, or unobserved, contact process among mule deer resulting in the local structure of CWD. Spatial variation in our model is limited to cells sharing a border; however there are no a priori restrictions on specifying the neighbourhood structure or cell weights. We use second-order neighbourhoods consisting of the eight grid cells surrounding the grid cell in question. Thus, grid cells either sharing a border or immediately diagonal to the focal cell are considered in modelling spatial dependency. We chose a second-order neighbourhood instead of something larger because we wished to maintain a sharp distinction between local dependency and global unstructured heterogeneity, which becomes increasingly blurred as the local neighbourhood is extended. The unstructured heterogeneity term, δj, corresponds to a latent process operating independently in each grid cell at the chosen scale (e.g., home-range scale). This component models the overall, unstructured heterogeneity in the data by assuming no relationship among neighbouring grid cells, but with a variance that is common to all grid cells. The following distributions applied to the remaining model parameters. For the baseline disease risk, µ was assumed to follow an improper (flat) prior on the whole real line. This flat prior must always be used for the intercept term in models containing conditional autoregression (CAR) random effects due to the sum to zero constraint placed on the spatial random effects. For the standardised covariates, we assumed
2~ (0 , I )N ββ σ . We specified uniform priors for the variance parameters, 2
βσ , associated with the fixed effects components. Finally, the joint posterior distribution of all model parameters given the field data was fit at the three scales of interest (grid cells of 9 km2, 81 km2 and 324 km2) for various combinations of predictors selected a priori. Thus, our models contained various combinations of demographic (Demo), Env, spatially structured (Space) and unstructured
(Het) variation. We examined the utility of incorporating continuous spatial functions, by fitting binary variogram models to the data in our models, however we were never able to appropriately estimate the parameters of these variogram models due to the relatively few positives in the data set, e.g. a prevalence rate of approximately 6% across the study site. Finally, although the grid representation for movement scales is heuristic, we believe that it is a reasonable representation of the various spatial scales of movement seen in these mule deer populations. The spatial structure induced by the model is dependent on the underlying grid (3) and the three grid scales are not functionally related, thus it is not possible to directly scale up or down between the different models (2). However, for the current analysis this is not a concern since our interest lies in comparing the fit of the models across the three scales and not on determining how the spatial structure itself changes with scale.
Results
Human land use and chronic wasting disease Of the 16 candidate models fit to the entire data set, the top two models (Table I) suggested that sex, land use and site effects all were important predictors of CWD prevalence. The combined wr for the top two models indicated a 90% probability that the best approximating model for our field data contained all three covariates as additive effects, with the other 14 models sharing the remaining 10% of the support. Estimates of slope terms from the top model suggested that deer in developed areas were almost twice as likely to test positive for CWD than deer in undeveloped areas (odds ratio = 1.98, p = 0.011, 95% credible interval [CI] = 1.17, 3.34) and that males were nearly 2.5 times more likely to be infected than females (odds ratio = 2.35, p = 0.001, 95% CI = 1.39, 3.97). Deer sampled from the EP site were approximately one-fourth as likely to be infected with CWD as those sampled from the HT site (odds ratio = 0.27, p < 0.001, 95% CI = 0.14, 0.51) and

The role of geographic information systems in wildlife Matthew L. Farnsworth, Jennifer A. Hoeting, N. Thompson Hobbs, landscape epidemiology: models of chronic wasting disease Mary M. Conner, Kenneth P. Burnham, Lisa L. Wolfe, in Colorado mule deer Elizabeth S. Williams, David M. Theobald & Michael W. Miller
588 Vol. 43 (3), Vet Ital www.izs.it/vet_italiana © IZS A&M 2007
deer from the GVM site were about one-half as likely to be infected as deer in the HT site (odds ratio = 0.55, p = 0.062, 95% C.I = 0.30, 1.03).
Table I Candidate sets of models used to understand the relative influence of covariates on the probability that an individual mule deer tested positive for chronic wasting disease Only the top five models are shown for clarity
Model (all deer) K Log-lik ∆AICc wr
Sex use EP GVM 5 –224.359 0.000 0.601
Sex use EP 4 –226.063 1.385 0.301
Sex EP GVM 4 –227.742 4.743 0.056
Sex EP 3 –229.516 6.273 0.026
Use EP GVM 4 –229.581 8.420 0.009
K number of estimable parameters Log-lik maximised value of the logarithm of the likelihood
function ∆AICc the difference in Akaike’s information criterion
corrected (AICc) between the model being considered and the best model in the candidate set
wr Akaike weight; quantifies model selection uncertainty EP Estes Park GVM Glacier View Meadows Modelling sexes separately offered additional insight into the relative influences of land-use and site-specific effects on CWD prevalence. Based on model averaged estimates, males in developed areas were more than twice as likely to be infected as males sampled from undeveloped areas (odds ratio = 2.27, 95%
CI = 1.17, 4.42). Males in the EP site had approximately one-third the probability of testing positive for CWD in comparison to those at the HT site (odds ratio = 0.35, p = 0.011, 95% CI = 0.16, 0.78). In the top female-only model containing an EP effect, we observed a more pronounced effect of site, with females sampled from the EP site being approximately one-sixth as likely to be infected as females sampled at the HT site (odds ratio = 0.17, p = 0.002, 95% CI = 0.05, 0.53). Overall, the site effect appeared to be the most informative predictor of CWD prevalence in females, while both land use and site effects contributed almost equally as predictors of prevalence in males.
Movement scales and chronic wasting disease Our analyses revealed strong support for local influences on observed spatial patterns of CWD prevalence in mule deer. For clarity, only results for the top 10 out of 22 models fit are shown in Table II. Based on the wDIC shown in Table I, the individual home range scale of 9 km2 is the only one that deserves consideration as the process scale corresponding to the spatial structure of the CWD data. The combined weights for Models 1 to 4 (Table II), wDIC = 0.99, indicated
Table II Model selection results to identify the candidate models best explaining observed spatial patterns of chronic wasting disease prevalence in mule deer Three analysis scales (grid cells of 9 km2, 81 km2 and 324 km2) were examined, using models that incorporated various combinations of demographic, environmental, spatial and unstructured heterogeneous variation Demo = age + sex; Env = %HAB + %PRIV + DISP (see ‘Methods’ for details) Space is the spatial random effect; Het is the unstructured variation in the model
Model No. Scale (km2) Model pD DIC wDIC
1 9 Demo + Space 71.1 2182.76 0.694
2 9 Demo + Env + Space + Het 80.7 2186.28 0.119
3 9 Demo + Env + Space 50.2 2186.73 0.095
4 9 Demo + Space + Het 95.5 2187.04 0.082
5 81 Demo + Env + Space 22.4 2192.42 0.006
6 9 Demo + Env + Het 65.0 2195.10 0.001
7 81 Demo + Env + Het 30.5 2195.39 0.001
8 81 Demo + Env + Space + Het 34.6 2195.67 0.001
9 81 Demo + Env 6.0 2197.57 0.000
10 81 Demo + Space + Het 78.7 2244.20 0.000
pD effective number of parameters Demo demographic variation DIC deviance information criteria Space variation within second-order neighbourhoods wDIC DIC weight (informally quantifies model selection uncertainty) Env environmental variation Het variation across the entire landscape

Matthew L. Farnsworth, Jennifer A. Hoeting, N. Thompson Hobbs, The role of geographic information systems in wildlife Mary M. Conner, Kenneth P. Burnham, Lisa L. Wolfe, landscape epidemiology: models of chronic wasting disease Elizabeth S. Williams, David M. Theobald & Michael W. Miller in Colorado mule deer
© IZS A&M 2007 www.izs.it/vet_italiana Vol. 43 (3), Vet Ital 589
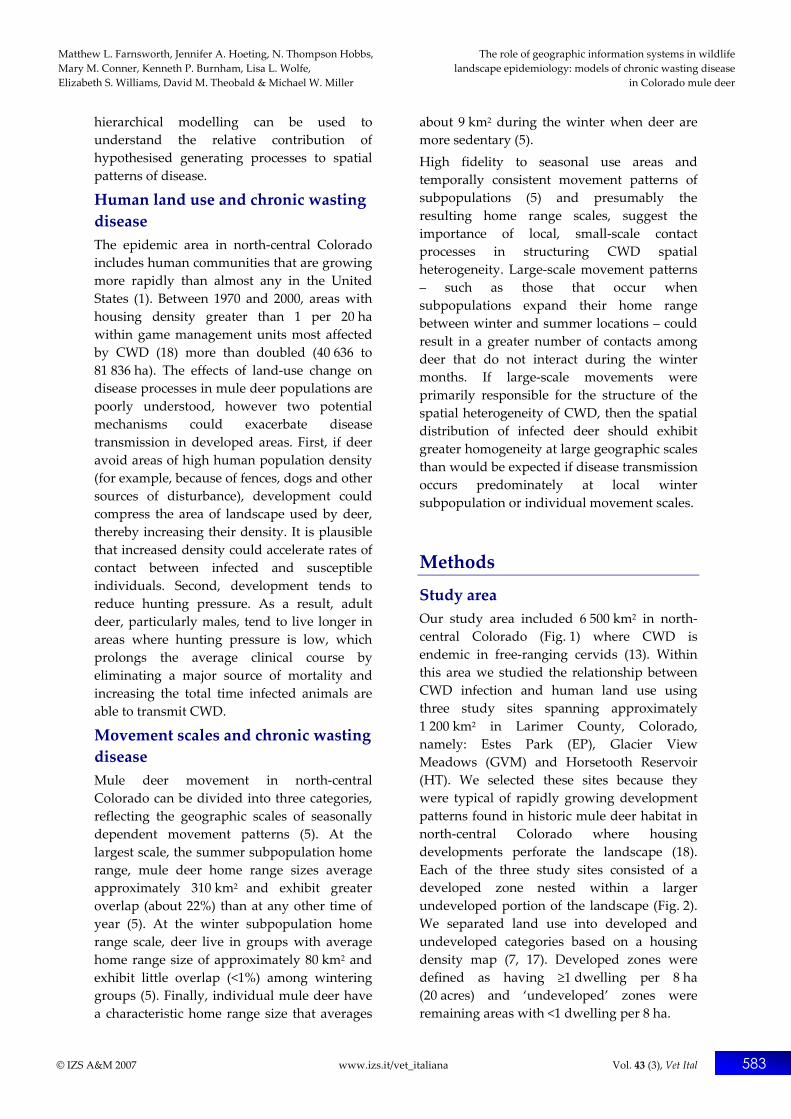
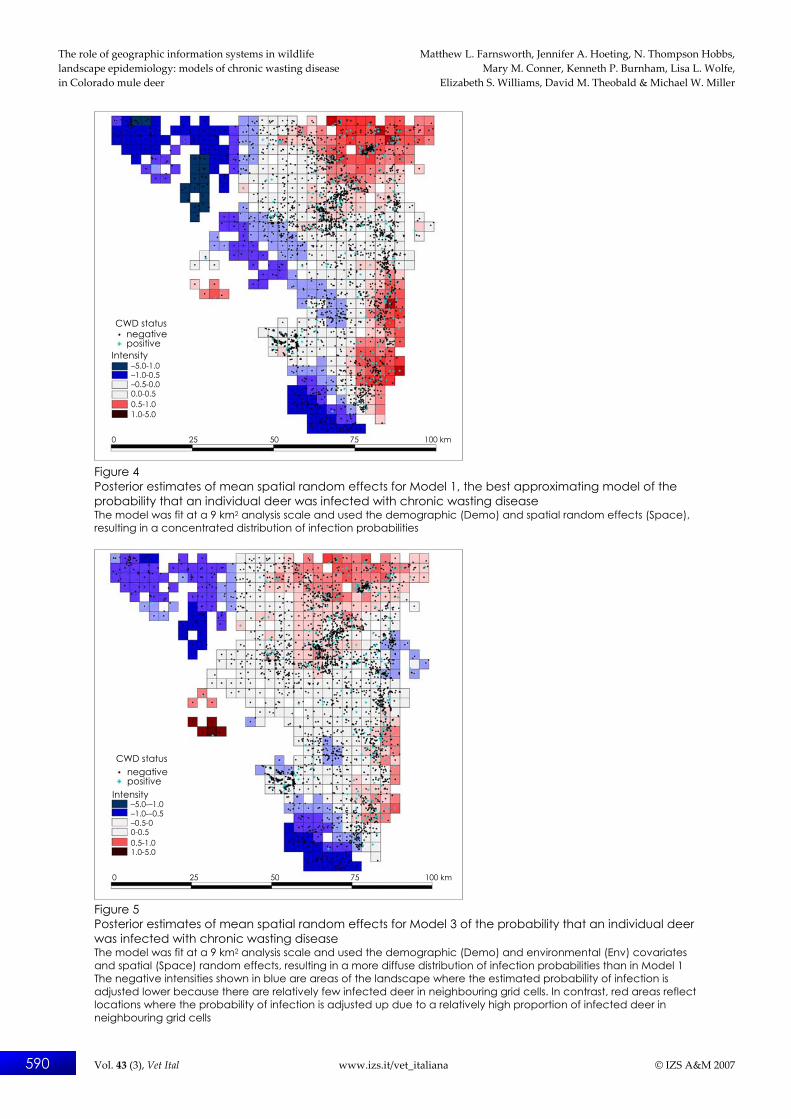
nearly exclusive support for models at the individual-home range scale. Within this set, all four models contained a spatial random effect for estimating the probability of CWD infection. Table III shows the posterior means, standard deviations and 95% credible intervals, all on the logit scale, for the univariate parameters from Models 1 and 2. The individual-level offsets of sex and age show that infection probability is higher in males (odds-ratio = 2.05, 95% CI = 1.60, 2.64) and in deer at least two years old (odds-ratio = 3.46, 95% CI = 2.20, 5.63) after adjusting for the effects due to the environmental variables. Estimates of environmental covariate effects from Model 2 show that %PRIV (odds-ratio = 2.45, 95% CI = 1.25, 4.77) and %HAB (odds-ratio = 2.21, 95% CI = 1.04, 4.54) significantly influenced infection probability. However, these credible intervals were relatively wide, reflecting a high degree of uncertainty in the estimates. A visual comparison (Figs 4 and 5) of the top model containing only demographic covariates and spatial structure (Model 1 in Table II) with this model, but with the addition of the environmental covariates (Model 3 in Table II), shows that Model 1 had a concentrated distribution of posterior spatial random effects across the landscape, whereas Model 3 had a more diffuse distribution and a lower overall intensity of spatial random effects. The negative intensities shown in blue are areas of the landscape where the estimated probability
of infection is adjusted to a lower level because there are relatively few infected deer in neighbouring grid cells. In contrast, red areas reflect locations where the probability of infection is adjusted up due to a relatively high proportion of infected deer in neighbouring grid cells. It is not surprising that including environmental covariates in the model diminished the strength of the local spatial process. This effect can be demonstrated quantitatively by examining the difference in the number of effective parameters, pD, between Models 1 and 3, the top models with and without this effect (Table II). Adding the three environmental covariates to the top model, each contributing a single parameter, reduces pD by more than 20 in the resulting third best model. This reduction occurred because the environmental covariates ‘shrunk’ the variability in the spatial random effect towards an overall mean effect, thereby reducing the effective number of parameters necessary for modelling the spatial variation in CWD infection probability.
Discussion
Human land use and chronic wasting disease CWD in north-central Colorado occurs in an environment undergoing substantial human-induced changes (10). The human population in this region has grown by 68% during the last two decades, making it one of the fastest
Table III Univariate parameter estimates from Model 1 and Model 2 Estimates for individual-level covariates sex and age are from Model 1, the top DIC model, which did not contain environmental covariates, with environmental covariate effects from Model 2, the best model containing these effects
Variable Model rank Mean SD 2.5% CI 97.5% CI
Sex 1 0.72 0.13 0.47 0.97
Age 1 1.24 0.24 0.79 1.73
%PRIV 2 0.89 0.33 0.22 1.57
%HAB 2 0.79 0.39 0.04 1.51
Disp 2 0.03 0.07 –0.13 0.19
SD standard deviation CI credible interval %PRIV proportion of private land %HAB proportion of low elevation habitat Disp index measure of private land connectivity
The role of geographic information systems in wildlife Matthew L. Farnsworth, Jennifer A. Hoeting, N. Thompson Hobbs, landscape epidemiology: models of chronic wasting disease Mary M. Conner, Kenneth P. Burnham, Lisa L. Wolfe, in Colorado mule deer Elizabeth S. Williams, David M. Theobald & Michael W. Miller
590 Vol. 43 (3), Vet Ital www.izs.it/vet_italiana © IZS A&M 2007
Figure 4 Posterior estimates of mean spatial random effects for Model 1, the best approximating model of the probability that an individual deer was infected with chronic wasting disease The model was fit at a 9 km2 analysis scale and used the demographic (Demo) and spatial random effects (Space), resulting in a concentrated distribution of infection probabilities
Figure 5 Posterior estimates of mean spatial random effects for Model 3 of the probability that an individual deer was infected with chronic wasting disease The model was fit at a 9 km2 analysis scale and used the demographic (Demo) and environmental (Env) covariates and spatial (Space) random effects, resulting in a more diffuse distribution of infection probabilities than in Model 1 The negative intensities shown in blue are areas of the landscape where the estimated probability of infection is adjusted lower because there are relatively few infected deer in neighbouring grid cells. In contrast, red areas reflect locations where the probability of infection is adjusted up due to a relatively high proportion of infected deer in neighbouring grid cells
CWD status negative positive
Intensity –5.0-1.0 –1.0-0.5 –0.5-0.0 0.0-0.5 0.5-1.0 1.0-5.0
0 25 50 75 100 km
CWD status negative positive
Intensity –5.0-–1.0 –1.0-–0.5 –0.5-0 0-0.5 0.5-1.0 1.0-5.0
0 25 50 75 100 km
Matthew L. Farnsworth, Jennifer A. Hoeting, N. Thompson Hobbs, The role of geographic information systems in wildlife Mary M. Conner, Kenneth P. Burnham, Lisa L. Wolfe, landscape epidemiology: models of chronic wasting disease Elizabeth S. Williams, David M. Theobald & Michael W. Miller in Colorado mule deer
© IZS A&M 2007 www.izs.it/vet_italiana Vol. 43 (3), Vet Ital 591
growing populations in the United States (1). Expanding human habitation has altered land use as landscapes have been developed. These alterations in land use have changed the extent and configuration of wildlife habitat in this region (7), including specific habitats used by mule deer. Our work suggests that these changes in land use may play a role in the spatial and temporal dynamics of CWD in mule deer. Prevalence of CWD in deer sampled from developed areas was almost twice as high as prevalence in undeveloped areas (about 10% versus 6%) and models that included land use tended to be strongly supported by our field data. Land-use modifications that accelerate contact rates between the infectious agent and susceptible individuals might account for observed differences in prevalence between developed and undeveloped areas. Wolfe et al. (22) suggested that higher prevalence observed in deer in developed locations could be explained by local factors, such as artificial feeding around residences, that concentrate deer at a few points on the landscape. In addition to altering movements or habitat use, urbanised areas also may offer refuge from natural predators and human hunting, thereby allowing CWD-infected deer to survive and shed infectious agent longer than in areas with more predators. The relative paucity of predators in urban areas could also allow infected carcasses to persist longer in urban habitats. Finally, elimination of suitable habitat by development might concentrate mule deer populations on smaller areas of undeveloped winter range, thereby increasing population density and accelerating disease transmission. All of these mechanisms could contribute to higher CWD prevalence in developed areas. Future work should focus on identifying which, if any, of these mechanisms are responsible for the effects associated with land use we observed. Prevalence among male mule deer in our study was nearly twice as high as among females (about 10% versus 6%). Sex-specific analyses revealed that males sampled from developed locations were more than twice as likely to test positive for CWD as males in
undeveloped locations, while there was less of a difference for females. Model selection results also reflected this trend: support for land-use effects on CWD prevalence was stronger in field data from males (wr = 0.84) than from females (wr = 0.44). The relationship observed between land-use and sex effects may have arisen from differences in sex and age structures of mule deer populations in the two land-use categories. Because CWD is probably always fatal, older age classes will have more opportunity to be exposed to the infectious agent and thus should exhibit higher prevalence. Further, hunting is virtually absent from developed areas and, in undeveloped areas, hunting pressure on male deer is much greater than on females. Consequently, land use may have had an additional effect on the composition of male herd segments in our study areas. Higher prevalence in male deer from urban areas could be a product of relatively light hunting pressure that preserves a larger proportion of middle-aged males than in more heavily hunted populations in undeveloped areas; because land use-associated differences in hunting pressure are smaller for females; this effect would be less evident among female subpopulations. Observations of CWD prevalence across north-central Colorado show strong spatial heterogeneity (13) and our finer scale results are consistent with these observations. All of the supported models in our study included a site effect, with differences in prevalence among three study sites. Geographic heterogeneity in CWD prevalence may be structured in part by differences in the time since disease introduction (13), deer migration patterns (5), demography (5), harvest rates (16) and habitat (7) among infected mule deer subpopulations. Which factor or combination of factors gave rise to the differences observed among our three study areas cannot be determined with certainty. The size, duration and intensity of human development do differ somewhat among the GVM, HT and EP areas and these may have produced differential effects on deer habitats and deer use of altered habitats.

The role of geographic information systems in wildlife Matthew L. Farnsworth, Jennifer A. Hoeting, N. Thompson Hobbs, landscape epidemiology: models of chronic wasting disease Mary M. Conner, Kenneth P. Burnham, Lisa L. Wolfe, in Colorado mule deer Elizabeth S. Williams, David M. Theobald & Michael W. Miller
592 Vol. 43 (3), Vet Ital www.izs.it/vet_italiana © IZS A&M 2007
Movement scales and chronic wasting disease Our results provide evidence that the spatial structure of CWD results from small-scale, local contact processes, which most probably occur primarily during the winter season when subpopulation home ranges are reduced in size and the potential for infectious contacts among sympatric individuals is possibly increased (5, 14, 15, 16,). The key to arriving at this conclusion was the use of information about the scales over which the structuring process of movement occurs. As we specified analysis scales to correspond to the crucial epidemiological process of seasonal movements, we were able to better understand which type of movement pattern (wintering individual, winter subpopulation or summer subpopulation) appears to be the most plausible process scale underlying observed spatial patterns of CWD prevalence. Our research differs fundamentally from previous pattern-based analyses used in the few wildlife landscape epidemiological investigations that have been undertaken to date. Unlike other studies, we incorporated both host (sex and age) and environmental factors thought a priori to be important
predictors of CWD spatial heterogeneity. By using a hierarchical model we were able to simultaneously consider the contributions made by these covariates, as well as from local spatial structure and overall landscape heterogeneity, to the risk of disease occurrence at each of the three movement scales. This model provides a powerful approach for a difficult problem in ecology –linking spatial patterns to the scales over which generating processes operate. By maintaining a constant data structure at the lowest (e.g. individual) level in the hierarchy, while varying the scale of the spatial process component of the model, a hierarchical approach allows for direct comparisons of the effect of various process scales on the spatial structure of host-pathogen relationships.
Acknowledgements Our work was supported by the Colorado Division of Wildlife, Federal Aid in Wildlife Restoration Project W-153-R, the University of Wyoming, the National Science Foundation-National Institutes of Health Grant DEB-0091961 and National Science Foundation grant DGE-0221595003.
References 1. Baron J.S., Theobald D.M. & Fagre D.B. 2000. Management of land use conflicts in the United States
Rocky Mountains. Mountain Res Dev, 20, 24-27. 2. Best N.G., Arnold R.A., Thomas A., Waller L.A. & Conlon E.M. 1999. Bayesian models for spatially
correlated disease data. In Bayesian Statistics 6 (J.M. Bernardo, J.O. Berger, A.P. Dawid & A.F.M. Smith, eds). Oxford University Press, Oxford, 131-156.
3. Best N.G., Ickstadt K. & Wolpert R.L. 2000. Spatial Poisson regression for health and exposure data measured at disparate resolutions. J Amer Statist Assoc, 95, 1076-1088.
4. Burnham K.P. & Anderson D.R. 2002. Model selection and multimodel inference: a practical information-theoretic approach, 2nd Ed. Springer, New York, 488 pp.
5. Conner M.M. & Miller M.W. 2004. Movement patterns and spatial epidemiology of a prion disease in mule deer population units. Ecol Appl, 14, 1870-1881.
6. Daszak P., Cunningham A.A. & Hyatt A.D. 2001 Anthropogenic environmental change and the emergence of infectious diseases in wildlife. Acta Trop, 78, 103-116.
7. Farnsworth M.L., Wolfe L.L., Hobbs N.T., Burnham K.P., Williams E.S., Theobald D.M., Conner M.M. & Miller M.W. 2005. Human land use influences chronic wasting disease prevalence in mule deer. Ecol Appl, 15, 119-126.
8. Farnsworth M.L., Hoeting J.A., Hobbs N.T. & Miller M.W. 2006. Linking chronic wasting disease to mule deer movement scales: A hierarchical Bayesian approach. Ecol Appl, 16, 1026-1036.
9. Geman S. & Geman D. 1984. Stochastic relaxation, Gibbs distributions, and the Bayesian restoration of images. Ieee Trans Pattern Anal Mach Intell, 6, 721-741.

Matthew L. Farnsworth, Jennifer A. Hoeting, N. Thompson Hobbs, The role of geographic information systems in wildlife Mary M. Conner, Kenneth P. Burnham, Lisa L. Wolfe, landscape epidemiology: models of chronic wasting disease Elizabeth S. Williams, David M. Theobald & Michael W. Miller in Colorado mule deer
© IZS A&M 2007 www.izs.it/vet_italiana Vol. 43 (3), Vet Ital 593
10. Hansen R.D., Raja C. & Allen B.J. 2000. Total body protein in chronic diseases and in aging. In In vivo body composition studies. Ann N Y Acad Sci, 907, , 345-352.
11. Hudson P.J., Rizzoli A., Grenfell B., Heesterbeek H. & Dobson A. (eds) 2002. The ecology of wildlife diseases. Oxford University Press, New York, 216 pp.
12. Levine J.A., Harris M.M. & Morgan M.Y. 2000. Energy expenditure in chronic alcohol abuse. Eur J Clin Invest, 30, 779-786.
13. Miller M.W., Williams E.S., McCarty C.W., Spraker T.R., Kreeger T.J., Larsen C.T. & Thorne E.T. 2000. Epizootiology of chronic wasting disease in free-ranging cervids in Colorado and Wyoming. J Wildl Dis, 36, 676-690.
14. Miller M.W. & Williams E.S. 2002. Detection of PrPCWD in mule deer by immunohistochemistry of lymphoid tissues. Vet Rec, 151, 610-612.
15. Miller M.W., Williams E.S., Hobbs N.T. & Wolfe L.L. 2004. Environmental sources of prion transmission in mule deer. Emerg Infect Dis, 10, 1003-1006.
16. Miller M.W. & Conner M.M. 2005. Epidemiology of chronic wasting disease in free ranging mule deer; spatial, temporal, and demographic influences on observed prevalence patterns. J Wildl Dis, 41, 275-290.
17. Theobald D.M. 2001. Land use dynamics beyond the American urban fringe. Geogr Rev, 91, 544-564. 18. Theobald D.M. 2003. Targeting conservation action through assessment of protection and exurban
threats. Conserv Biol, 17, 1624-1637. 19. Wasserberg G., Abramsky Z., Kotler B.P., Ostfeld R.S., Yarom I. & Warburg A. 2003. Anthropogenic
disturbances enhance occurrence of cutaneous leishmaniasis in Israel deserts: patterns and mechanisms. Ecol Appl, 13, 868-881.
20. Wikle C.K. 2003. Hierarchical Bayesian models for predicting the spread of ecological processes. Ecology, 84, 1382-1394.
21. Williams E.S., Yuill T., Artois M., Fischer J. & Haigh S.A. 2002. Emerging infectious diseases in wildlife. Rev Sci Tech, 21, 139-157.
22. Wolfe L.L., Conner M.M., Baker T.H., Dreitz V.J., Burnham K.P., Williams E.S., Hobbs N.T. & Miller M.W. 2002. Evaluation of antemortem sampling to estimate chronic wasting disease prevalence in free-ranging mule deer. J Wildl Manage, 66, 564-573.