The Role of Academic Achievement Motivation in Predicting ...
134
University of New Mexico UNM Digital Repository Individual, Family, and Community Education ETDs Education ETDs 7-1-2016 e Role of Academic Achievement Motivation in Predicting Performance on the Northwest Evaluation Association's Measure of Academic Progress. Mindsets: Incremental vs. Entity Beliefs About Intelligence Frank Volpe Follow this and additional works at: hps://digitalrepository.unm.edu/educ_ifce_etds is Dissertation is brought to you for free and open access by the Education ETDs at UNM Digital Repository. It has been accepted for inclusion in Individual, Family, and Community Education ETDs by an authorized administrator of UNM Digital Repository. For more information, please contact [email protected]. Recommended Citation Volpe, Frank. "e Role of Academic Achievement Motivation in Predicting Performance on the Northwest Evaluation Association's Measure of Academic Progress. Mindsets: Incremental vs. Entity Beliefs About Intelligence." (2016). hps://digitalrepository.unm.edu/educ_ifce_etds/48 brought to you by CORE View metadata, citation and similar papers at core.ac.uk provided by University of New Mexico
-
Upload
khangminh22 -
Category
Documents
-
view
0 -
download
0
Transcript of The Role of Academic Achievement Motivation in Predicting ...

University of New MexicoUNM Digital RepositoryIndividual, Family, and Community EducationETDs Education ETDs
7-1-2016
The Role of Academic Achievement Motivation inPredicting Performance on the NorthwestEvaluation Association's Measure of AcademicProgress. Mindsets: Incremental vs. Entity BeliefsAbout IntelligenceFrank Volpe
Follow this and additional works at: https://digitalrepository.unm.edu/educ_ifce_etds
This Dissertation is brought to you for free and open access by the Education ETDs at UNM Digital Repository. It has been accepted for inclusion inIndividual, Family, and Community Education ETDs by an authorized administrator of UNM Digital Repository. For more information, please [email protected].
Recommended CitationVolpe, Frank. "The Role of Academic Achievement Motivation in Predicting Performance on the Northwest Evaluation Association'sMeasure of Academic Progress. Mindsets: Incremental vs. Entity Beliefs About Intelligence." (2016).https://digitalrepository.unm.edu/educ_ifce_etds/48
brought to you by COREView metadata, citation and similar papers at core.ac.uk
provided by University of New Mexico

Frank Volpe Candidate
Department of Individual, Family, and Community Education Department
This dissertation is approved, and it is acceptable in quality
and form for publication:
Approved by the Dissertation Committee:
Dr. Terri Flowerday, Chairperson
Dr. Allison Borden
Dr. Jan Armstrong
Dr. Martin Jones

Running head: ROLE OF MINDSET IN NWEA MAP TEST PERFORMANCE ii
The Role of Academic Achievement Motivation in Predicting Performance on the
Northwest Evaluation Association’s Measure of Academic Progress. Mindsets:
Incremental vs. Entity Beliefs About Intelligence
By
Frank A Volpe
M.A., Counseling and Educational Psychology, New Mexico State University, 2010
M.A., Multicultural Special Education, College of Santa Fe 2003
B.A., Spanish and Political Science, St. Michael’s College 2001
DISSERTATION
Submitted in Partial Fulfillment of the
Requirements for the Degree of
Doctor of Philosophy
In Educational Psychology
The University of New Mexico
July 2016

ROLE OF MINDSET IN NWEA MAP TEST PERFORMANCE iii
DEDICATION
To my wife Emily for her enduring love and support, my daughters, Cadence and
Aria, for their patience with the time dad spent “writing his book”, and to my mother,
Carol D‘Antonio, for instilling in me a never ending curiosity and passion for learning.

ROLE OF MINDSET IN NWEA MAP TEST PERFORMANCE iv
AKNOWLEDGEMENTS
I am forever grateful to Dr. Terri Flowerday for her faith in my abilities and for
her guidance through my doctoral program. Her passion for the study of motivation has
had an impact on me that will endure for the rest of my life.
I am deeply indebted to Dr. Allison Borden for the time, energy, and intellectual
guidance she provided. Dr. Borden is a true scholar, the best teacher I have ever had, and
an overall powerful force for progress in education. Dr. Borden sets a standard I will
forever aspire to meet.
I would also like to extend my gratitude to Dr. Jan Armstrong for her service on
my dissertation committee and for constantly pushing me to include multiple perspectives.
Thank you as well to Dr. Martin Jones for his service on my committee and for
challenging me to express myself with clarity and precision.
Finally, I would like to thank my family, friends, students, and all of the teachers
in my life for helping to make this possible.

ROLE OF MINDSET IN NWEA MAP TEST PERFORMANCE v
The Role of Academic Achievement Motivation in Predicting Performance on the
Northwest Evaluation Association’s Measure of Academic Progress. Mindsets:
Incremental vs. Entity Beliefs About Intelligence
By
Frank A Volpe
M.A., Counseling and Educational Psychology, New Mexico State University, 2010
M.A., Multicultural Special Education, College of Santa Fe 2003
B.A., Spanish and Political Science, St. Michael’s College 2001
Doctor of Philosophy
In Educational Psychology
Abstract
A cross-sectional correlational study was conducted in order to evaluate the
relationship between a student’s mindset (incremental vs. entity beliefs about intelligence)
and their score on the Northwest Evaluation Assessment (NWEA) Measure of Academic
Progress (MAP) in the areas of Math, Reading, and Language. The NWEA MAP is a
computer adaptive test aligned with the Common Core Standards. Students' mindsets
were measured using Dweck’s (2000) Implicit Theories of Intelligence Scale for Children.
The study was conducted at a college preparatory charter school in a metropolitan
area of the Southwestern United States. Participants included 307 middle school students
in grades 6-8. Question predictor and control variables were evaluated through
descriptive statistics and estimated bivariate correlation matrices. Nested taxonomies of
multiple regression models for each of the NWEA MAP subject tests were constructed.
The control variables evaluated include: gender, ethnicity, race, socioeconomic status,

ROLE OF MINDSET IN NWEA MAP TEST PERFORMANCE vi
special education participation, gifted education participation, grade point average,
attendance, and year in school.
Results indicated that there was a small to moderate, statistically significant
estimated correlation between student mindset and NWEA MAP performance across all
subject tests. Contingent on the subject test, specific control predictors were identified as
mediating this relationship. There were negative estimated correlations found between
the NWEA MAP subject tests and ethnicity (math), socioeconomic status (math and
reading), and special education (reading and language). There were positive estimated
correlations found between GPA and gifted program identification across math, reading,
and language subject tests. In support of previous findings suggesting student mindset is
associated with student achievement, this study provides further evidence that student
mindset correlates with student performance on standardized tests and that this estimated
correlation is mediated by subgroup factors.

ROLE OF MINDSET IN NWEA MAP TEST PERFORMANCE vii
TABLE OF CONTENTS
List of Tables………………………………………………………………………… ix
List of Figures……………………………………………………………………….. xi
CHAPTER 1 INTRODUCTION………………………………………………….. 1
Rationale for the study…………………………………………………………….. 2
Theoretical Framework for the Study……………………………………………... 3
Statement of the Problem………………………………………………………….. 4
Research Question…………………………………………………………………. 5
Definition of Terms………………………………………………………………... 5
CHAPTER 2 LITERATURE REVIEW………………………………………...... 7
Mindset: Incremental vs. Entity Beliefs about Intelligence……………………….. 7
Intelligence and the Malleability of Intelligence……………………………….... 8
Mindset Theory: Stages of Theoretical Development………………………….... 10
Stage 1: Learned Helplessness, Attribution Theory, & Goal Orientation……... 13
Stage 2: Underlying Theories of Intelligence: A Motivational Model………... 16
Stage 3: Mindset Measurement………………………………………………... 19
Stage 4: From Measurement to Intervention…………………………………... 28
Beyond Mindset Theoretical Development………………………………………... 32
Mindset and Subgroup Factors………………………………………………… 32
Mindset and Achievement on Standardized Tests…………………………….. 34
NWEA MAP Performance and Construct Irrelevant Variance……………….. 35
Criticisms of the Growth Mindset…………………………………………………. 36
CHAPTER 3 METHEDOLOGY………………………………………………….. 39

ROLE OF MINDSET IN NWEA MAP TEST PERFORMANCE viii
Overview of the Current Study……………………………………………………. 40
Participants………………………………………………………………………… 41
Instrumentation………………………….…………………………………………. 43
Procedure…………………………………………………………………………... 46
Informed Consent…………………….………………………………………….. 49
Survey Completion………………………………………………………………. 50
Data Collection…………………….…………………………………………….. 52
Analysis, Data Screening, and Assumption Testing...…………………………….. 53
Concluding Remarks………………………………………………………………. 56
CHAPTER 4 RESULTS…………………………………………………………… 57
Study Sample………………………………………………………………………. 58
Research Question Analysis……………………………………………………….. 62
Estimated Bivariate Correlations………………………………………………….. 63
Multiple Regression Models and Prototypical Plots………………………………. 74
Results Conclusion………………………………………………………………… 96
CHAPTER 5 DISCUSSION..................................................................................... 100
Consideration of the Findings in the Context of Current Research……………….. 101
Limitations of the Study…………………………………………………………… 104
Recommendations for Further Research…………………………………………... 107
Implications for Professional Practice……………………………………………... 108
REFERENCE………………………………………………………………………. 110
Appendix A………………………………………………………………………… 120
Appendix B………………………………………………………………………… 121

ROLE OF MINDSET IN NWEA MAP TEST PERFORMANCE ix
List of Tables
Table Page
1. Mindset: Stages of Theoretical Development and Significance………………. 12
2. Dweck and Leggett’s Model Adapted…………………………………………. 17
3. Summary of Goals and Predicted Achievement Patterns……………………… 18
4. Summary Statistics and Reliability of the Implicit Theories of Intelligence
Scale for Children………………………………………………………………
22
5. Factor Analyses of the Implicit Theory of Intelligence Measure……………… 24
6. Measures of Implicit Theories of Intelligence and Their Relation to the
Demographic Characteristics of the Respondents……………………………
26
7. Construct Validity of the Implicit Theory of Intelligence Measure………….. 27
8. Participant Demographics……………………………………………………... 42
9. Sample Size Power Calculations……………………………………………… 43
10. Variables to be Used in Regression Models by Type…………………………. 46
11. Theoretical Framework for Regression Models……………………………….. 54
12. Multiple Regression Data Analysis Procedures……………………………….. 55
13. Question Predictor and Control Variable Framework for Regression Models... 58
14. Descriptive Statistics for the Continuous Variables…………………………… 60
15. Descriptive Statistics of the Categorical Variables……………………………. 61
16. Special Education Mindset Frequencies………………………………………. 62
17. Pearson’s Estimated Correlations for the Continuous Variables….…………... 65
18. Mindset, NWEA MAP Performance, and Racial ID Estimated Correlations.....
66

ROLE OF MINDSET IN NWEA MAP TEST PERFORMANCE x
List of Tables Continued
19. Mindset, NWEA MAP Performance, and Ethnicity Identification Estimated
Correlations……………………………………………………………………
68
20. Mindset, NWEA MAP Performance, and Educational Program Participation
Estimated Correlations …………….…………………………………….......
69
21. Mindset, NWEA MAP Performance, and Year in School Estimated
Correlations ……………………………………………………………………
70
22. Continuous vs. Categorical Mindset Estimated Correlations with MAP
Subject Performance…………………………………………………………..
72
23. Math MAP Percentile and ITISCS Nested Models……………………………. 76
24. Math Map Model 5 Regression Equation……………………………………... 80
25. Reading MAP Percentile and ITISCS Nested Models………………………. 84
26. Reading MAP Model 5 Regression Equation………………………………… 88
27. Language MAP Percentile and ITISCS Nested Models………………………. 92
28. Language MAP Model 5 Regression Equation………………………………... 95

ROLE OF MINDSET IN NWEA MAP TEST PERFORMANCE xi
List of Figures
Figure Page
1. Impact of Being Hispanic on Math Percentile Scores Across Possible ITISCS
Scores……………………………………………………………………………...
81
2. Impact of Title I Status Math Percentile Scores Across Possible ITISCS Scores... 82
3. Impact of Title I Status on Reading MAP Percentile Scores Across Possible
ITISCS Scores……………………………………………………………………..
89
4. Impact of Gifted Program Identification on Reading Percentile Score Across
Possible ITISCS Scores…………………………………………….……………..
89
5. Impact of Special Education Program Identification on Reading MAP Percentile
Scores Across Possible ITISCS Scores………………………… ………………..
90
6. Impact of Special Education Status on Language Percentile Scores Across
Possible ITISCS Scores………………………………………...............................
96

ROLE OF MINDSET IN NWEA MAP TEST PERFORMANCE 1
Chapter I: Introduction
Non-cognitive psychological constructs have received increased attention in the
research effort seeking to identify effective and efficient strategies to increase student
achievement and close the achievement gap (Gutman & Schoon, 2013). This shift has
pushed researchers in education and psychology to look beyond psychometrically
measured cognitive traits and observable behaviors to an evaluation of the underlying
psychological processes that drive them. Emotional and motivational constructs are
increasingly being explored in an effort to comprehensively evaluate why some students
find academic success despite setbacks or negative circumstances whereas others do not
(Holmlund & Silva, 2009; Miller, 2013; Seligman, 2012). Of these constructs, Carol
Dweck’s (2006) mindset theory has received increased consideration due to its strong
theoretical foundation and the significant empirical evidence that has been collected in
support of this theory (Blackwell, Trzesniewski, & Dweck, 2007; Paunesku, 2013;
Paunesku et al. (2015); Romero, Paunesku, & Dweck, 2011; Yeager & Walton 2011;
Yeager, Walton, & Cohen, 2013).
Current research into mindset theory focuses on the role of mindset interventions
in increasing academic achievement (Yeager, Paunesku, Walton, & Dweck, 2013).
However, significant gaps in the mindset literature remain when evaluating the role of
mindset in standardized test performance. Given the current K-12 educational reform
emphasis on standardized test performance in the United States, which was amplified by
the passing of No Child Left Behind (Bush, 2001), and the evidence in support of
mindset interventions, there is a relative dearth of research addressing the role mindset
plays in student performance on standardized tests. Furthermore, while mindset research
has provided insight into the role subgroup factors (i.e. race, ethnicity, socioeconomic

ROLE OF MINDSET IN NWEA MAP TEST PERFORMANCE 2
status) play in the ability to use mindset as a predictor of student academic achievement,
limited research has directly assessed the role these factors play in mediating mindset’s
ability to predict performance on standardized tests.
Rationale for the Study
The rationale for this study was to evaluate the role of mindset in the performance
of students on the Northwest Evaluation Association (NWEA) Measure of Academic
Progress (MAP) standardized test. The use of high stakes standardized tests in education
to evaluate students, teachers, schools, and govern graduation and college acceptance
have been on the rise (Amrein & Berliner, 2002), and the manipulability of individual
mindsets and the resulting achievement gains have been established (Blackwell et al.,
2007; Yeager, Paunesku, et al., 2013). These interventions have proven to be cost
effective and can be deployed on a large scale (Paunesku, 2013; Yeager, Paunesku, et al.,
2013). Despite mounting evidence highlighting the importance of mindset in
achievement, there is limited research evaluating the relationship between mindset and
achievement on standardized tests. By examining the predictive value of mindset in
standardized test performance, students and educators can better prioritize the role of
motivational interventions in an effort to increase performance on standardized tests.
Current research indicates that those that may benefit the most from mindset
intervention are those who have found the least success in the educational system,
specifically individuals of lower socioeconomic status (SES) and minority students
(Aronson, Fried, & Good, 2002; Blackwell et al., 2007; Good, Aronson, & Inzlicht,
2003). If mindset is identified as an effective intervention in improving the scores of
these students, it could contribute significantly to closing the standardized test

ROLE OF MINDSET IN NWEA MAP TEST PERFORMANCE 3
achievement gap. Additionally, since non-cognitive skills have been identified as
predictors of numerous major life accomplishments (Rosen, Glennie, Dalton, Lennon, &
Bozick, 2010), evidence for the role of mindset in increasing standardized test
performance could encourage public schools to allocate additional funds for targeting the
development of mindset and other non-cognitive skills.
Theoretical Framework for the Study
Dweck and colleagues’ work on mindset theory in many ways parallels the trends
and developments of the field of psychology dating back to the middle of the 20th
century.
Over the last 60 years, the evolution of psychological theory has been described as a
progression from behaviorism, to cognitivism, to post-cognitivism (Potter, 2000).
Mindset theory helps to bridge the boundaries between these theoretical distinctions by
drawing from and contributing to each theoretical perspective (Higgins, Kruglanski, &
Lange, 2012).
Dweck describes her early work as drawing heavily on Orval Mowrer’s (1960)
pioneering research into hopelessness, Seligman and Maier’s (1967) work studies
exploring the idea of learned helplessness, and Bernard Weiner’s (1985) attribution
theory. Dweck also credits Kelly’s (1955) theory of personality and Heider’s (1958)
theory of social perception as theoretical antecedents to her early work on what would
eventually develop into mindset theory. The foundation for mindset theory was
established when Dweck and Leggett (1988) proposed a motivational model articulating
goal theory. This model not only sought to identify and describe behavior but also
addressed the underlying psychological processes that drove the behaviors.

ROLE OF MINDSET IN NWEA MAP TEST PERFORMANCE 4
Finally, mindset theory draws from the theoretical and empirical debate regarding
the understanding of intelligence. Dweck has characterized this debate as a dichotomy
between entity (fixed) vs. incremental (malleable) views of intelligence. Theorists who
defended intelligence as a fixed trait-like Bell Curve include Herrnstein and Murray
(1996). However, Dweck is a firm incrementalist in agreement with psychologist Alfred
Binet (1909/1973), sociologist Benjamin Bloom (1985), paleontologist Steven Gould
(1981), and creativity researcher John Hayes (1989), and cites research by
neuroscientists in support of her view on malleable intelligence (Dweck, 2006; Doidge,
2007). Mindset theory represents an important nexus across time and fields of research,
providing powerful insights into motivation, how it can be influenced, and the resulting
impact on student achievement.
Statement of the Problem
The primary problem addressed by this study is the lack of research that has been
conducted directly evaluating the relationship between mindset and standardized test
performance. The secondary problem this study sought to examine is the role that
subgroup factors play in the ability of mindset to predict performance on standardized
tests.
Research Question
The primary research question examined in the current study assessed the
relationship between mindset (entity vs. incremental beliefs) and student performance on
the Northwest Evaluation Association’s (NWEA) Measure of Academic Progress (MAP).
The relationship between subgroup factors (demographics, academic programs, and
academic achievement measure by GPA, attendance, and year in school) and mindset’s

ROLE OF MINDSET IN NWEA MAP TEST PERFORMANCE 5
ability to predict student performance on the NWEA MAP was also of interest in the
current study.
Definition of Terms
Mindset Theory. According to Dweck (2006), mindset theory states that people
fundamentally view the world from fixed or growth perspectives. Those with a growth
mindset believe that basic skills and qualities can be formed through effort, strategy
application, and accessing help from others. These individuals see intelligence as a
flexible trait and tend to have more learning or mastery-oriented goals and will more
frequently persist in the face of difficulty or failure. A fixed mindset perspective views
individuals as unchangeable and endowed with an immutable amount of intelligence.
Fixed mindset individuals tend to have more performance-oriented goals and tend to not
persist in the face of failure or difficulty. It is estimated that approximately 40% of
individuals are fixed minded, 40% are growth minded, and 20% are of mixed mindset
(Dweck, 2006). Mindset theory has also been referred to as implicit theories of
intelligence (Dweck, Chiu, & Hong, 1995).
Growth Mindset (incremental beliefs about intelligence). According to Dweck
(2006) this is a view that intelligence is a malleable trait that can be expanded through
effort, strategy application, and accessing the help of others. Growth minded individuals
are more likely to persist in the face of challenge or failure and have learning or mastery
goal orientations. Growth mindedness is synonymous with incremental beliefs about
intelligence (Dweck et al., 1995).
Fixed Mindset (fixed beliefs about intelligence). According to Dweck (2006),
those with a fixed mindset view intelligence as a fixed trait and are less likely to attribute
failure to effort or strategy selection. Fixed minded individuals are less likely to persist
ROLE OF MINDSET IN NWEA MAP TEST PERFORMANCE 6
in failure and tend to be more performance oriented in their goals. Fixed mind set is
synonymous with entity beliefs about intelligence (Dweck et al., 1995).
Northwest Evlauation Association Measure of Academic Progress
(NWEAMAP). The NWEA MAP is a computer adaptive test (CAT) based on the U.S.
Common Core standards. The assessment is normed on students from across all 50 states
in the U.S. and is commonly used in K-12 education as a short cycle assessment
administered each fall, winter, and spring in order to track student proficiency and growth
on curriculum objectives (NWEA, 2004).

ROLE OF MINDSET IN NWEA MAP TEST PERFORMANCE 7
Chapter II: Literature Review
Current research has moved beyond cold cognitive learning models in attempts to
quantify non-cognitive traits that influence academic achievement (Shell, Brooks, Trainin,
Wilson, Kauffman, & Herr, 2010). Examples of non-cognitive academic traits or skills
include self-efficacy, self-regulated learning, and motivation (Rosen, Glennie, Dalton,
Lennon, & Bozick, 2010). Research using mindset theory offers considerable empirical
evidence and clarity for researchers, practitioners, and students. The theory offers a
motivational model that describes clear patterns of behavior and achievement, as well as
the underlying psychological processes that drive them (Dweck and Legget, 1988). More
importantly, effective, scalable interventions that improve academic achievement have
been deployed across many educational settings and significant empirical evidence has
been collected documenting successful intervention (Blackwell et al., 2007; Paunesku,
2013; Yeager & Walton 2011).
Mindset theory has emerged as a leading area of focus in the study of motivation
across primary, secondary, and tertiary educational settings (Yeager, Walton, et al., 2013).
This research suggests that those with a growth mindset view of intelligence are more
likely to apply more effort and persist in the face of failure by viewing setbacks as related
to effort and strategy selection as opposed to those with fixed mindset views of
intelligence who attribute failure and success to immutable or fixed levels of intelligence
(Dweck, 2006).
Current research in this area is largely focused on the effectiveness of growth
mindset interventions on the academic achievement of students (Blackwell et al., 2007;
Romero, Paunesku, & Dweck, 2011; Yeager & Dweck, 2012). While findings suggest
ROLE OF MINDSET IN NWEA MAP TEST PERFORMANCE 8
there is sufficient evidence to warrant growth mindset interventions, additional research
is necessary in order to understand the impact of mindset on subgroup outcomes and
across different measures of academic achievement. Specifically, insufficient
information is available regarding the role demographic or academic program factors
such as gender, SES or giftedness play in mindset’s ability to predict academic
achievement. The growing importance of measuring academic achievement by
performance on standardized tests demonstrates the need to evaluate the role academic
achievement motivation plays in student performance on these assessments. This study
was designed to contribute to answering these questions.
Intelligence and the Malleability of Intelligence
The concept of neuroplasticity, which has had a significant impact on mindset
theory, has established that brains are capable of improvements and growth throughout
the life span (Doidge, 2007). This has fundamentally altered science’s understanding of
how the brain works, and, subsequently the understanding of the nature of intelligence.
Despite these findings, misconceptions regarding intelligence persist.
The contemporary psychological and educational concept of intelligence is rooted
in the general intelligence factor g first articulated by Charles Spearman (1904) and
measured by Alford Binet (1909/1973). With this common definition of intelligence
came a new tool for scientific evaluation of the old debate regarding the role of heredity
on intelligence as compared to environmental influences (nature vs. nurture).
Mainstream twentieth century research promoted the dominant role of heritability in
intelligence. The dominance of this heritability view was challenged by the late 1970’s.
Major contributors to this challenge of the dominance of heritability included Hans

ROLE OF MINDSET IN NWEA MAP TEST PERFORMANCE 9
Jürgen Eysenck (1977), Arthur Jensen (1978) and Stephen J. Gould (1981). These
researchers challenged the methodology of perhaps the most influential researcher of the
heritably of intelligence, Cyril Burt (Jensen, 1978). Despite this effective challenge to
the dominance of hereditability as the definer of intelligence, fixed intelligence views in
the field of psychology and education persisted. One publication that continued to
perpetuate the misconceptions that students were beholden to their predetermined genetic
allocation of intelligence was The Bell Curve (Herrnstein & Murray, 1996). This attempt
to reestablish the dominant role of heredity was effectively challenged again by Gould
(1996) and Neisser et al. (1996). They identified significant methodological errors in the
studies that had concluded with an emphasis on heritability. A comprehensive summary
of the current research on this topic can be found in Nisbett’s (2009) book, Intelligence
and How We Get It. Despite sound scientific evidence challenging the dominance of the
heritability of intelligence theory, popular misconceptions persisted.
It has taken advances in medical and research science for the malleability of
intelligence to be widely accepted in the scientific and research communities (Doidge,
2007). Advances in neuroscience and neuroimaging in the early 21st century have
highlighted the important role that the environment plays in the development of
intelligence and the ability of individuals to alter the structures and functions of the brain
at any age (Doidge, 2007). According to Nisbett (2009), researchers now see an almost
coequal role for environment and heredity in the development of intelligence. Dweck
(Higgins, Kruglanski, & Lange, 2012) cites the above debate as contributing significantly
to her research and the establishment of the mindset theory, which was built on the
premise that intelligence is a malleable trait. With the malleability of intelligence

ROLE OF MINDSET IN NWEA MAP TEST PERFORMANCE 10
established, the role of non-cognitive factors such as motivation have become
progressively more important, resulting in increased attention by researchers.
Mindset Theory and Academic Achievement: Stages of Theoretical Development
Mindset as a theory of intelligence and a motivational construct is the culmination
of three decades of Carol Dweck’s research and writing in the field. From learned
helplessness to goal orientation to implicit theories of intelligence and interventions,
Dweck has provided empirical evidence in the emerging arena of motivational constructs
and their measurement. By tracing the development of mindset theory back to its origins,
the validity and evidence in support of the theory and its measures has been
wellestablished. Through a better understanding of the current interventions being used
to leverage Dweck’s theory (Blackwell et al., 2007) and the efforts to scale up growth
mindset interventions (Paunesku et al., 2015; Yeager, Walton et al., 2013), mindset
theory can move into the mainstream of education and to the forefront of the popular
understanding of intelligence.
This literature review establishes the context and supports the use of mindset
theory in this study. The review of the mindset stages of development seeks to answer
two questions posed by Dweck and her fellow researchers. First, why do some
individuals persist and eventually succeed despite failures and obstacles while others of
similar ability do not? Second, how can interventions be designed to promote persistence
in the face of failure and overall increased academic achievement?
The empirical evidence that has been collected in support of Dweck’s theory has
established the mindset as one of the dominant constructs in motivational research
(Renaud-Dubé, Guay, Talbot, Taylor, & Koestner, 2015) Most importantly, Dweck and

ROLE OF MINDSET IN NWEA MAP TEST PERFORMANCE 11
others have demonstrated that the growth mindset and resulting academic achievement
gains can be attained through practical and affordable interventions (Paunesku et al.,
2015). In order to establish a common understanding of mindset theory, it is important to
operationalize a definition. In an interview, Carol Dweck defined mindsets in the
following way:
“In a fixed mindset students believe their basic abilities, their intelligence, their
talents, are just fixed traits. They have a certain amount and that’s that, and then
their goal becomes to look smart all the time and never look dumb. In a growth
mindset students understand that their talents and abilities can be developed
through effort, good teaching and persistence. They don’t necessarily think
everyone’s the same or anyone can be Einstein, but they believe everyone can get
smarter if they work at it”. (Morehead, 2012)
In order to understand mindset and the constructs the theory represents, Dweck
and colleagues’ previous works will be evaluated through the lens of stages of theoretical
development.
This literature review proposes theoretical stages of the development of mindset
theory. These stages will be proposed and reviewed chronologically. A review of the
role of seminal quantitative studies from each stage is included. In order to more
coherently represent the planned review, the stages of theoretical development are
represented in Table 1.

ROLE OF MINDSET IN NWEA MAP TEST PERFORMANCE 12
Table 1
Mindset: Stages of Theoretical Development and Significance
Stages Significance
Stage 1: Learned
Helplessness, Attribution
Theory, and Goal
Orientation
Stage one connected and integrated mastery and helplessness
orientation drawing heavily on Weiner’s attribution theory (1972,
1985). Diener and Dweck(1978) articulated the divergent
responses to failure based on goal orientation; helpless vs.
mastery
Stage 2: Underlying
Theories of Intelligence: A
Motivational Model. Goal
orientation as a predictor of
academic achievement.
Stage two took the findings of stage one a step further by
developing a motivational model connecting learning behavior to
goal orientation as predicted by theories of intelligence (Dweck
& Legget, 1988). Theories of intelligence are presented as the
underlying psychological processes driving goal orientation and
behavior (Dweck & Leggett, 1988, Elliot & Dweck 1988).
Stage 3: Mindset
Measurement.
Development of the
Theories of Intelligence
Scale.
Stage three was defined by an attempt to empirically test the
model presented by Dweck and Leggett (1988) by developing an
instrument (Dweck et al., 1995; Erdley & Dweck 1993;
Henderson & Dweck, 1990) The publication of the Theories of
Intelligence Scale allowed for a consistent instrument to be used
in studying incremental vs. entity beliefs (Dweck, 2000).
Stage 4: From
Measurement to
Intervention. Mindset
theory as an educational
intervention to improve
achievement.
Stage four was defined by experimental manipulation of
individual’s mindsets and an evaluation of the resulting impact on
academic performance. Blackwell et al. (2007) seminal
longitudinal study measured, manipulated, and tracked the impact
of mindset on student achievement. Large scale follow-up
studies supported targeting mindset as a cost effective
intervention to increase student performance (Paunesku, 2013;
Yeager & Walton, 2011).
These stages are defined by seminal works, which have been influential in the
development of mindset theory. Additional works by Dweck and a range of works from
other authors are incorporated in development of these themes and in extension of them
for each stage of theoretical development. Note that the term mindset did not enter
circulation until after Dweck (2006) published her book aimed at popular audiences,

ROLE OF MINDSET IN NWEA MAP TEST PERFORMANCE 13
Mindset: The New Psychology of Success: How we can learn to fulfill our potential.
However, the term will be used consistently throughout this study for the sake of clarity.
Stage 1: Learned Helplessness, Attribution Theory, and Goal Orientation
Dweck (2000) describes her early research inspiration as arising from a
fascination with individuals who accomplished amazing feats, despite facing significant
challenges. In this first stage of growth mindset theoretical development, Dweck
combines work that was being done in three areas: learned helplessness, attribution
theory, and goal orientation. At this stage, Dweck combined the theoretical and empirical
work of others with her own research as she sought to establish her own pathway to
answering her research question: Why do some of us persist in the face of failure or
challenge while others do not, despite equivalent ability levels?
Bernard Weiner’s (1972) investigation of attribution theory laid the groundwork
for Dweck’s research into learned helplessness (Dweck, 2000). Inspired by Weiner’s
research and the work of others, Dweck went on to investigate how learned helplessness
could be alleviated. The origins of Dweck’s growth mindset can be traced back to her
early research into adaptive and maladaptive reactions to failure (Diener & Dweck1978;
1980; Dweck & Reppucci, 1973). According to Dweck, her research on learned
helplessness built on the work of Mowrer (1960) and Seligman and Maier (1967).
Dweck explained that those she identified as “helpless” were less likely to persist in
failure, less likely to take personal responsibility, and were more likely to attribute failure
to ability rather than effort (Dweck, 1975). The “helpless” label would eventually morph
into the entity theory of intelligence and the “mastery orientation” would become the
early label for the incremental theory of intelligence and learning goals. By 2006, Dweck
would refer to these orientations as fixed and growth mindsets.
ROLE OF MINDSET IN NWEA MAP TEST PERFORMANCE 14
Diener and Dweck (1978) conducted a study to analyze both mastery oriented and
helpless students’ responses to failure. They described the mastery oriented student
failure attribution responses as; “lack of effort” or “increased difficulty of the task”
whereas the helpless students emphasized ability as the reason for their lack of success.
These and other studies were later combined in a model by Dweck and Leggett (1988) in
an attempt to represent the behaviors they were observing and the resulting achievement
patterns.
In the search to identify why some persevere in the face of failure and others do
not, Dweck saw Bernard Weiner’s attribution theory as an important theoretical construct.
Weiner’s (1985) seminal work “An Attributional Theory of Achievement Motivation and
Emotion” clearly influenced Dweck’s development of the growth mindset. Weiner
explained that his work was derived from the dichotomous explanation of the causal
structure of the attribution approach explained by Fritz Heider. Heider wrote, “In
common-sense psychology (as in scientific psychology) the results of an action is felt to
depend on two sets of conditions, namely, factors within the person and factors within the
environment” (Heider, 1958, p.82). Weiner’s attribution theory states that success and
failure perceptions share three common properties: locus, stability, and controllability
with the perceived expectancy resulting in motivational conditions and behaviors (Weiner,
1985). In essence, an individual’s perception of locus, stability, and controllability guides
behavior and impacts achievement. This theory was clearly integrated into Dweck’s
growth mindset in which individuals either see their intelligence as stable and out of their
control or malleable and under their control. Weiner’s work on attributions played a key

ROLE OF MINDSET IN NWEA MAP TEST PERFORMANCE 15
role in Dweck making the connection between learned helplessness, goal orientation,
behavior, and achievement (Dweck, 2000).
Dweck’s most important work in this stage focused on how students responded to
failure. Specifically, when and why did some subjects display a “helpless” response
while others displayed a “mastery” response and the resulting corresponding
performances. Dweck and Reppucci (1973) found that “mastery” subjects responded with
persistence in the face of failure while the “helpless” participants responded by more
frequently giving up. These participants took less responsibility when compared to the
“mastery” participants and when they did take responsibility they focused less on effort
(emphasized by the “mastery” participants) and more on ability (Dweck & Reppucci,
1973). Dweck (1975) next sought to evaluate to what degree participants’ failure
attributions could be manipulated and to what degree this would alter “helpless”
participants’ responses to failure. Dweck found that in fact participants’ attributions in
the face of failure could be manipulated and that these manipulations resulted in
improved performance (Dweck, 1975). There are clear parallels between this study and
the 2007 study conducted by Blackwell et al. Dweck next sought to better understand the
performance differences between “helpless” and “mastery” oriented participants. The
most important findings from this study foreshadow the fixed vs. entity beliefs Dweck
would later incorporate into her theories of intelligence. Specifically, Dweck found that
“helpless” students focused on the reasons for failure (lack of ability) while mastery
oriented participants focused on how to correct the failure (Diener & Dweck, 1978).
In conclusion, Dweck’s early research was heavily influenced by the work done
in the areas of learned helplessness, goal orientation, and attribution theory. In terms of

ROLE OF MINDSET IN NWEA MAP TEST PERFORMANCE 16
the growth mindset, this stage of theoretical development defines the problem. In stage
one, Dweck and fellow researchers identify the two main orientations and their related
behavior patterns as “helpless” and “mastery” orientation. These two goal orientations
would later be known as learning and performance goals. In stage two, these orientations
and related behavior patterns are linked to goal orientations and ultimately theories of
intelligence.
Stage 2: Underlying Theories of Intelligence, A Motivational Model: Goal
Orientation as a Predictor of Academic Achievement
After having clearly defined the problem in stage one, Dweck now began to
answer the questions posed at the start of her research. Why do some of us persist in the
face of failure or challenge while others do not, despite equivalent ability levels? The
answer comes in part by identifying learning vs. performance goals, the theories of
intelligence beliefs, and correlating the resulting behaviors. By connecting behavior
patterns to underlying psychological processes, Dweck moved from defining the problem
to a testable hypothesis.
Stage two is succinctly described by Dweck and Leggett (1988) in the social
cognitive model of motivation and personality they developed. In this model, Dweck and
Legget describe a three component interrelated model. First, individuals have developed
adaptive or maladaptive patterns of behavior (mastery-oriented vs. helpless). Second,
these patterns follow directly from individual goal orientation (learning vs. performance
goals). Third, Dweck and Leggett propose that these goal orientations are derived from
an underlying psychological process related to an individual’s implicit theory of
intelligence. These implicit theories are described by Dweck and Leggett (1988) as
incremental vs. entity theories of intelligence. Those with incremental theories of

ROLE OF MINDSET IN NWEA MAP TEST PERFORMANCE 17
intelligence view intelligence as malleable while those with entity theories see
intelligence as fixed. This breakthrough clearly lays the groundwork for what Dweck
would later popularize as the growth mindset.
Dweck and Leggett (1988) go on to describe the research of mastery orientation
(learning goals) and helpless orientations (performance goals) as adaptive and
maladaptive respectively. They sought to identify a model that would map out the
underlying psychological processes in an attempt to explain how these processes
promoted different goal patterns and resulting behaviors. Although Dweck and others had
explored goal orientation prior to the development of this model, it was in this model that
Dweck formally introduced the now wide spread goal dichotomy of learning goals vs.
performance goals. Table 2 describes the relationships of the constructs up to this point:
Table 2
Dweck and Leggett’s Model Adapted
Initial orientation
constructs as described by
Dweck (1978)
Mastery Orientation Helpless Orientation
Theory of Intelligence Incremental (Intelligence is
Malleable)
Entity (Intelligence is Fixed)
Goal Orientation Learning Goals (Goal is to
increase competence)
Performance Goals (Goal is to
gain positive judgment/avoid
negative judgment of
competence)
Note: Adapted from Leggett, E. L. (1985). Children's entity and incremental theories of
intelligence: Relationships to achievement behavior.
Elliot and Dweck (1988) went on to test this model with 5th
grade students. The study
sought to collect evidence in support of the connection between goal orientation, patterns
of behavior, and resulting achievement. To this end, Elliot and Dweck experimentally
manipulated goal orientation (learning vs. performance) and the participants’ perception

ROLE OF MINDSET IN NWEA MAP TEST PERFORMANCE 18
of ability. Elliot and Dweck then went on to measure their task choice, persistence
during difficulty, and their verbalizations during difficulty. The model tested in this
study is outlined in Table 3.
Table 3
Summary of Goals and Predicted Achievement Patterns
Predicted Achievement Pattern
Goal Value Confidence
(perceived
level of
ability)
Task choice Response to Difficulty
Performance
goal
highlighted
High Sacrifice learning and choose
moderate or moderately
difficult task to display
competence
Mastery-orientation of
effective problem
solving
Low
Sacrifice learning and choose
moderately easy task to
avoid display of
incompetence
Learned-helpless
response of
deterioration in
problem-solving and
negative overall
response
Learning
goal
highlighted
High or
low
Choose learning at risk of
displaying
mistakes to increase
competence
Mastery-orientation of
effective problem
solving
Note: Adapted from Elliott, E. S., & Dweck, C. S. (1988). Goals: an approach to
motivation and achievement. Journal of Personality and Social Psychology, 54(1), 5.
The study conducted by Elliot and Dweck (1988) resulted in evidence supporting
the model in Table 3. For example, students who had their goal values experimentally
manipulated through ability level feedback followed the predicted achievement patterns.
Thus, Dweck and fellow researchers had proposed a motivational model and collected
evidence in support of that model.
It is important to note here that at this stage of the development Dweck began
articulating the generalizability of her theory. For example, Dweck and Leggett (1988)

ROLE OF MINDSET IN NWEA MAP TEST PERFORMANCE 19
reviewed the role of entity vs. incremental beliefs in the areas of personality. While the
development of this topic is outside of the scope of this review, it is important to note that
Dweck has collected convincing empirical evidence to support the application of theories
of intelligence (growth mindset) to theories of personality (fixed vs. flexible personality
traits and resulting behaviors). Furthermore, Dweck’s research continues to address both
domains in parallel through her contemporary work.
In summary, stage two marks an important stage in the development of the growth
mindset. Dweck and fellow researchers established a testable motivational model
integrating the observed behavior patterns of “helpless” and “mastery” oriented children
with corresponding goal orientations (performance vs. learning). Finally, Dweck and
colleagues described their theoretical hypotheses of the underlying psychological process
driving these goal orientations and resulting behavior patterns. Theories of intelligence
(entity vs. incremental) are identified as the root psychological process, which would in
time form the foundation of Dweck’s theory of the growth mindset. In order to
empirically evaluate the model Dweck and Leggett proposed, the development of a valid
and reliable instrument would be essential. This brings us to the measurement stage of
Dweck’s development of the growth mindset Stage 3: Measurement of Theories of
Intelligence
Once Dweck and Leggett proposed their influential motivational model, the next
step was to develop an instrument to measure it. The first attempts to measure Dweck
and Leggett’s (1988) model took place in the early1990s (Erdley & Dweck 1993;
Henderson & Dweck 1990,). However, the first comprehensive attempt to measure
implicit theories came with the collaboration between Dweck, Chiu and Hong in 1995.

ROLE OF MINDSET IN NWEA MAP TEST PERFORMANCE 20
Dweck and colleagues developed a number of related scales that measured an
individual’s view of traits as malleable or fixed. These scales would later be published
by Dweck (2000) in her seminal book, Self-Theories: Their Role in Motivation,
Personality, and Development. These scales include one domain general scale and a
number of domain specific scales. The domain general scale seeks to measure an
individual’s view on how much individuals can change in general (“Kind of Person”
Implicit Theory Form). Domain specific scales include theories of personality, theories
of morality, theories of the world, and theories of intelligence. While both domain
general and domain specific scales have amassed compelling validity and reliability
evidence, those not related to intelligence are beyond the scope of this study except
where they are used to provide supportive validity and reliability evidence for the theory
of intelligence measures. This section will specifically review Dweck’s (2000) Theory of
Intelligence Scale for Children-Self Form. This scale is referred to in the rest of this
document as Theory of Intelligence Scale or ITISCS. First, the measure itself will be
described. Next, early stage validity and reliability evidence are presented.
Since Dweck’s publication of her scales in 2000, they have been deployed in a
wide variety of settings and have been adapted for specific research projects. The scale
that will be evaluated here first is the Implicit Theory of Intelligence scale (Dweck, 2000).
It is important to note that in addition to the validity and reliability evidence supporting
the use of these measures, the results have consistently supported theories of intelligence
as an independent construct uncorrelated with other constructs and measures (Dweck et
al., 1995; Levy, Stroessner, & Dweck 1998). Dweck emphasizes that these scales
support her theory that implicit theories of intelligence represent assumptions about one’s

ROLE OF MINDSET IN NWEA MAP TEST PERFORMANCE 21
self that have cognitive, emotional, motivational, and behavioral consequence but that the
Theory of Intelligence Scale does not correlate with measures of those traits (Dweck,
2000).
The Theory of Intelligence Scale as first investigated in depth by Dweck et al.
(1995) consisted of 3 items. The researchers were comfortable with the limited number
of items because they viewed implicit theories as a simple unitary theme. Despite the
fact that internal reliability of a measure typically increases with the number of questions,
the researchers wanted to avoid repetition and disinterest in the scale and were confident
in their ability to measure participants’ implicit theories with the limited number of items.
The items of the implicit theory of intelligence scale include the following; (a) "You have
a certain amount of intelligence and you really can't do much to change it,” (b) "Your
intelligence is something about you that you can't change very much," and (c) "You can
learn new things, but you can't really change your basic intelligence." Participant
responses were measured on a 6 point Likert scale from 1 (strongly agree) to 6 (strongly
disagree). The scores on each of the 3 items were then averaged to arrive at a composite
score ranging from 1 to 6. The higher the score, the more incremental the orientation of
the participants’ theory of intelligence. In order to ensure that participants were clearly
identified as incremental or entity theorists, those with averaged scores greater than 3 and
less than 4 were excluded. Participants scoring a 4 or above were identified as
incremental theorists while those with averaged scores of 3 or below were identified as
entity theorists. Only 15% of the participants were left uncategorized because of
averaged scores greater than 3 and less than 4. The remaining 85% were evenly
distributed between incremental and entity orientations.

ROLE OF MINDSET IN NWEA MAP TEST PERFORMANCE 22
The measure demonstrated significant reliability evidence. Cronbach’s alpha
internal reliability scores for implicit theories of intelligence scale ranged from .94 to .98.
Other domain specific and the domain general scales demonstrated similar reliability.
Furthermore, the test retest reliability with a 2-week interval was .80 for the intelligence
theory measure. Thus, Dweck et al. (1995) documented considerable reliability evidence
across five separate studies including a total of 638 participant (U.S. college students),
each of which yielded similar reliability evidence. Much of Dweck and colleague’s
subsequent work with this measure was built on the validity and reliability evidence
collected in this seminal 1995 study but include the evaluation of other populations.
Table 4
Summary Statistics and Reliability of the Implicit Theories of Intelligence Scale
Mean score SD Internal Reliability
Study 1 (N=69) 3.96 1.34 .96
Retest (N=62)
(2 week test-retest,
r=.80)
3.71 1.39 .98
Study 2 (N=184) 3.80 1.32 .94
Study 3 (N=139) 3.79 1.28 .94
Study 4 (N=121) 3.97 1.13 .96
Study 5 (N=93) 3.73 1.40 .96
Study 6 (N=32) 3.57 1.49 .97
Note: Adapted from: Dweck, et al., (1995). Implicit theories and their role in judgments
and reactions: A word from two perspectives. Psychological inquiry, 6(4), 267-285.
In addition to the reliability evidence amassed in these studies, considerable
validity evidence was collected, building on the strong theoretical frameworks outlined in
the previous stages. Stage one of the theoretical development of the growth mindset
established the research question, why do some persist and succeed in the face of failure
while others do not. Stage two, proposed a theoretical hypothesis in response to that
question. The collection of validity evidence based on test content, response process,

ROLE OF MINDSET IN NWEA MAP TEST PERFORMANCE 23
internal structure, relationship to other variables, and the collection of reliability evidence
for instruments to empirically study the theoretical model characterize stage three.
Content validity evidence was clearly laid out in Dweck and Leggett’s model
(1998). In summary, Dweck and Leggett’s model hypothesizes a causal relationship
between theories of intelligence (entity vs. incremental), goal orientation (learning vs.
performance), and resulting behaviors (attributional response). Based on previous
research, they identified theories of intelligence as the underlying psychological process
driving goal orientation and the resulting attributional response behaviors. These
theoretical findings can be divided into two stages: a) learned helplessness, attribution
theory, and goal orientation and b) underlying theories of intelligence. Dweck and
colleagues established the link between learned helplessness responses, attribution and
goal orientation (Diener & Dweck, 1978, 1980; Dweck, 1975; Dweck & Reppucci, 1973).
In this stage, Dweck built on the work of prominent researchers in the field including
Bernard Weiner’s (1972) Attribution Theory, work done by Mowrer (1960) and Seligman
and Maier (1967) regarding learned helplessness, Nicholls (1975) work in the area of
effort attributions role in avoiding learned helplessness, and Dweck’s (Dweck, 1986;
Elliot & Dweck, 1988) conceptualization of learning versus performance goals. The
second stage of theoretical development explored the underlying psychological processes
that drove individuals to opposing goal orientations and resulting behavior. Dweck and
fellow researchers identified the underlying process driving goal selection as incremental
and entity theories of intelligence (Dweck & Leggett, 1988, Elliot & Dweck, 1988).
Those who believed intelligence was malleable versus those who believed intelligence
was a fixed trait responded to failure in different ways. Those who viewed intelligence as

ROLE OF MINDSET IN NWEA MAP TEST PERFORMANCE 24
malleable cited strategy and effort as reasons for failure and were less likely to choose a
challenging task in subsequent activities while entity theorists more frequently cited lack
of ability and chose less difficult tasks (Dweck & Leggett, 1988; Elliot & Dweck 1988).
Response process evidence was collected in support of valid and accurate
assessment of participants’ theories of intelligence through what today would be a called
mixed methods research designs. In a study conducted by Henderson (1990),
respondents were asked to explain their answers on the implicit theory of intelligence
measure. These respondents’ answers were then analyzed and coded. Responses
supported the results of the instrument. For example, when participants were asked to
explain the reasoning behind their response, those who did not agree with an entity
statement would provide justifications clearly aligned to the incremental theory.
Furthermore, in a study conducted by Elliot and Dweck (1988) participants were asked to
allocate the importance of effort and ability in success along with their completion of
theories of intelligence measures using percentages. Participants consistently allocated
effort and ability in alignment with their results on the implicit theories of intelligence
measure. Those whose results identified them as incremental theorists consistently
allocated a higher percentage to effort while those identified as entity theorists more
consistently allocated percentages toward ability.
Dweck et al. (1995) presented clear validity evidence based on internal structure
of the theories of intelligence measure. Factor analysis was conducted on three separate
scales, including theories of intelligence, theories of morality, and theories of the world.
Theses scales were represented as separate factors across each of the five studies (see
Table 5). As the table shows, the response to each of the questions in the theory of

ROLE OF MINDSET IN NWEA MAP TEST PERFORMANCE 25
intelligence scale (F1) correlate with one another to a high degree across all five studies.
Similar correlations were found for theories of morality (F2) and theories of the world
(F3). Thus, high factor loading across studies provided persuasive evidence that the 3
items in the theories of intelligence scale represent one factor and that they are unique
from the other factors assessed by the morality and world theories scales.
Table 5
Factor Analyses of the Implicit Theory of Intelligence Measure
Factor Loadings
Study 1 Study 2 Study 3 Study 4 Study 5
Items F1 F3 F2 F1 F3 F2 F1 F2 F3 F1 F2 F3 F1 F2 F3
1. You have a
certain amount
of intelligence
and you really
can't do much
to change it.
95 12 17 94 13 12 94 13 12 96 4 16 96 7 9
2. Your
intelligence is
something
about you that
you can't
change very
much.
94 20 13 95 12 7 96 15 10 95 6 15 94 13 15
3. You can
learn new
things, but you
can't
really change
your basic
intelligence.
93 13 16 91 5 13 91 7 12 93 6 14 95 11 15
Note: Adapted from: Dweck et al., (1995). Implicit theories and their role in judgments
and reactions: A word from two perspectives. Psychological inquiry, 6(4), 267-285.
In seeking to establish entity vs. incremental theoretical orientations as unique
constructs, it is important to empirically differentiate them from other variables. Dweck
and colleagues provided evidence in support of theory of intelligence as a unique
ROLE OF MINDSET IN NWEA MAP TEST PERFORMANCE 26
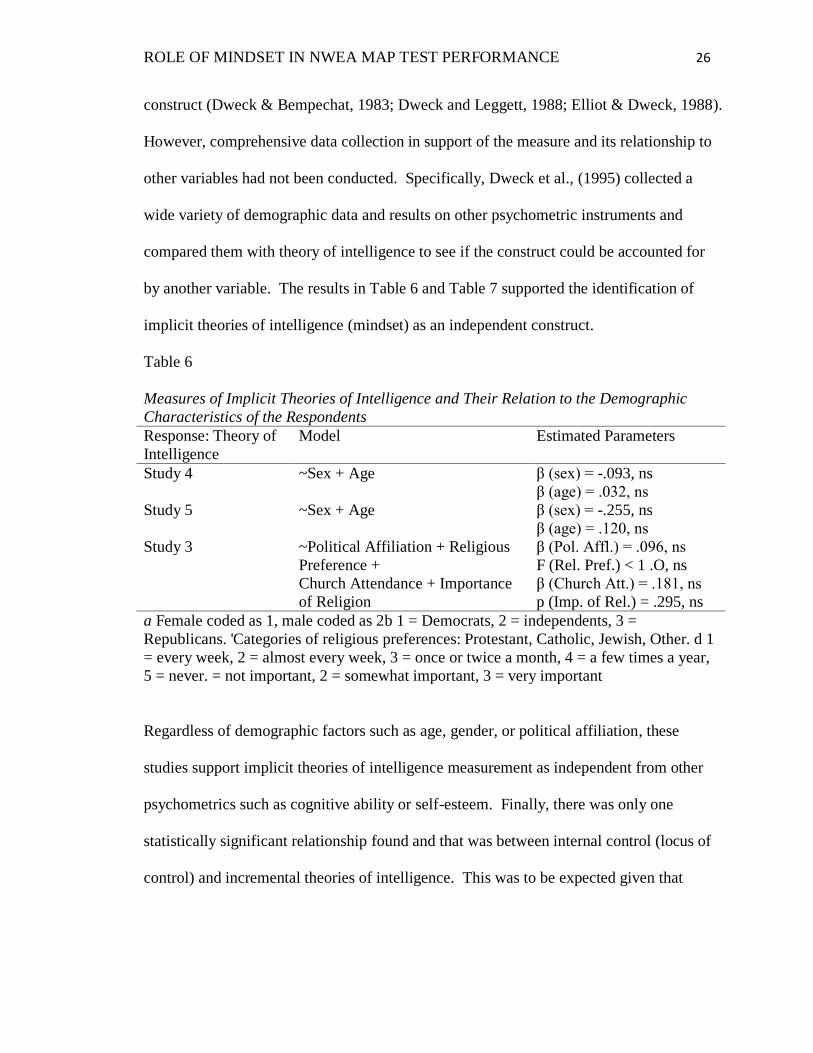
construct (Dweck & Bempechat, 1983; Dweck and Leggett, 1988; Elliot & Dweck, 1988).
However, comprehensive data collection in support of the measure and its relationship to
other variables had not been conducted. Specifically, Dweck et al., (1995) collected a
wide variety of demographic data and results on other psychometric instruments and
compared them with theory of intelligence to see if the construct could be accounted for
by another variable. The results in Table 6 and Table 7 supported the identification of
implicit theories of intelligence (mindset) as an independent construct.
Table 6
Measures of Implicit Theories of Intelligence and Their Relation to the Demographic
Characteristics of the Respondents
Response: Theory of
Intelligence
Model Estimated Parameters
Study 4 ~Sex + Age β (sex) = -.093, ns
β (age) = .032, ns
Study 5 ~Sex + Age β (sex) = -.255, ns
β (age) = .120, ns
Study 3 ~Political Affiliation + Religious
Preference +
Church Attendance + Importance
of Religion
β (Pol. Affl.) = .096, ns
F (Rel. Pref.) < 1 .O, ns
β (Church Att.) = .181, ns
p (Imp. of Rel.) = .295, ns
a Female coded as 1, male coded as 2b 1 = Democrats, 2 = independents, 3 =
Republicans. 'Categories of religious preferences: Protestant, Catholic, Jewish, Other. d 1
= every week, 2 = almost every week, 3 = once or twice a month, 4 = a few times a year,
5 = never. = not important, 2 = somewhat important, 3 = very important
Regardless of demographic factors such as age, gender, or political affiliation, these
studies support implicit theories of intelligence measurement as independent from other
psychometrics such as cognitive ability or self-esteem. Finally, there was only one
statistically significant relationship found and that was between internal control (locus of
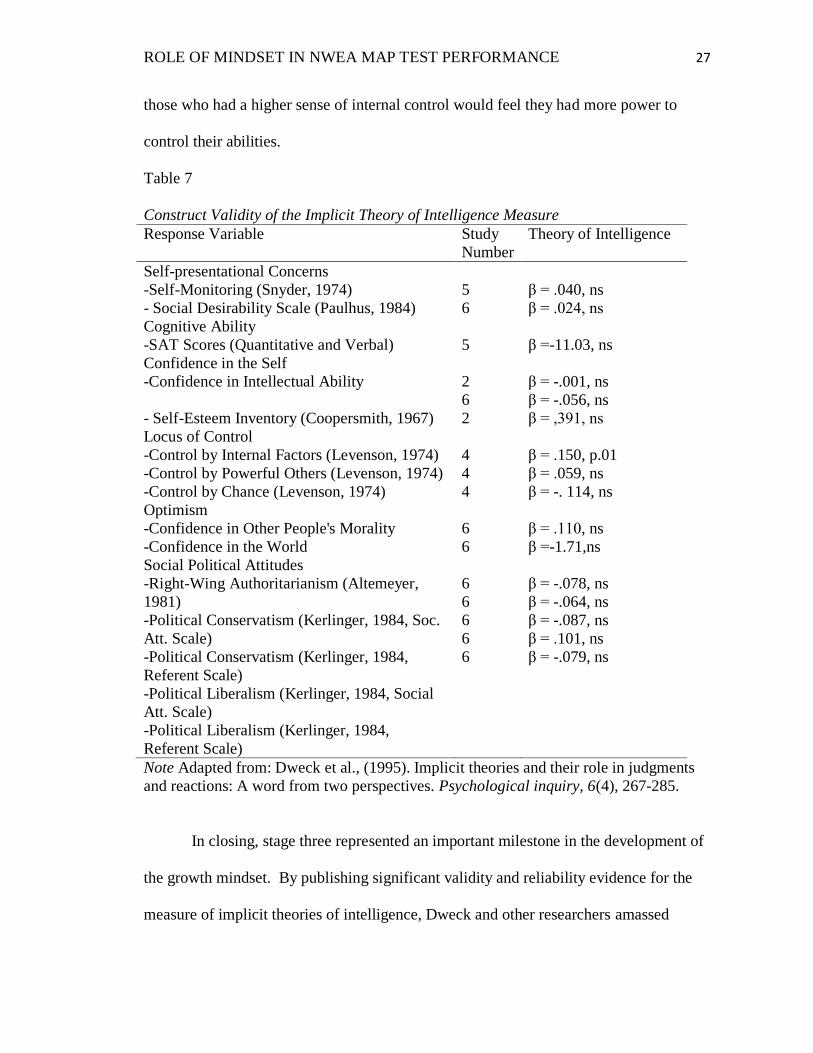
control) and incremental theories of intelligence. This was to be expected given that
ROLE OF MINDSET IN NWEA MAP TEST PERFORMANCE 27
those who had a higher sense of internal control would feel they had more power to
control their abilities.
Table 7
Construct Validity of the Implicit Theory of Intelligence Measure
Response Variable Study
Number
Theory of Intelligence
Self-presentational Concerns
-Self-Monitoring (Snyder, 1974)
- Social Desirability Scale (Paulhus, 1984)
5
6
β = .040, ns
β = .024, ns
Cognitive Ability
-SAT Scores (Quantitative and Verbal)
5
β =-11.03, ns
Confidence in the Self
-Confidence in Intellectual Ability
- Self-Esteem Inventory (Coopersmith, 1967)
2
6
2
β = -.001, ns
β = -.056, ns
β = ,391, ns
Locus of Control
-Control by Internal Factors (Levenson, 1974)
-Control by Powerful Others (Levenson, 1974)
-Control by Chance (Levenson, 1974)
4
4
4
β = .150, p.01
β = .059, ns
β = -. 114, ns
Optimism
-Confidence in Other People's Morality
-Confidence in the World
6
6
β = .110, ns
β =-1.71,ns
Social Political Attitudes
-Right-Wing Authoritarianism (Altemeyer,
1981)
-Political Conservatism (Kerlinger, 1984, Soc.
Att. Scale)
-Political Conservatism (Kerlinger, 1984,
Referent Scale)
-Political Liberalism (Kerlinger, 1984, Social
Att. Scale)
-Political Liberalism (Kerlinger, 1984,
Referent Scale)
6
6
6
6
6
β = -.078, ns
β = -.064, ns
β = -.087, ns
β = .101, ns
β = -.079, ns
Note Adapted from: Dweck et al., (1995). Implicit theories and their role in judgments
and reactions: A word from two perspectives. Psychological inquiry, 6(4), 267-285.
In closing, stage three represented an important milestone in the development of
the growth mindset. By publishing significant validity and reliability evidence for the
measure of implicit theories of intelligence, Dweck and other researchers amassed

ROLE OF MINDSET IN NWEA MAP TEST PERFORMANCE 28
empirical evidence and measurement tools to take the study of the growth mindset to the
stage of intervention. Now that researchers could accurately measure implicit theories of
intelligence, the next logical step was to attempt to manipulate them.
Stage 4: From Measurement to Intervention: The Growth Mindset
Although Dweck consistently conducted experimental studies to evaluate her
hypothesis, only with the development of an instrument to measure theories of
intelligence could the final stage of the growth mindset emerge. Once measurement of
theories of intelligence was established, Dweck and fellow researchers turned their
attention to studying its manipulation. Dweck had already established that participants’
goal orientation could be manipulated (Elliot & Dweck, 1988). However, according to
Dweck and Leggett’s model (1988), manipulating a participant’s goal orientation was not
directly impacting the underlying psychological process known as theories of intelligence.
Evidence that participants’ theories of intelligence could be manipulated surfaced in the
1990s with work done by Henderson (1990), Dweck et al., (1995), and Hong, Chiu,
Dweck, Lin, and Wan (1999). Early evidence in support of the potential for specific
interventions resulted from research done in the area of praise and stereotype threat by
Mueller and Dweck (1998) and Steele and Aronson (1995) respectively. The most
persuasive evidence in support of the effectiveness of the growth mindset of intelligence
theory intervention came with the work of Blackwell et al. (2007), which built on the
previously mentioned work.
Dweck’s collaboration with Claudia Mueller (1998) in their widely cited article
“Praise for Intelligence Can Undermine Children’s Motivation and Performance”
provided some of the first evidence in support of manipulation of theories of intelligence.
In their studies, students praised for intelligence chose more performance goals while

ROLE OF MINDSET IN NWEA MAP TEST PERFORMANCE 29
those praised for their efforts consistently chose more learning goal oriented tasks. These
students also demonstrated increased attributions in line with the type of praise received.
That is, students praised for intelligence produced more ability related explanations in
response to failure while those who received the effort praise were more likely to explain
failure through attributions based on effort or strategy use. Thus, through specifically
designed, measured, and assessed interventions, participants’ theories of intelligence
were shown to be manipulable.
Research conducted by Aronson et al. (2002) also provided early clues to the
powers of theories of intelligence intervention. Aronson and colleagues hypothesized
that African American students would be less vulnerable to stereotype threat if they were
first exposed to messages regarding the malleability of intelligence. Their study showed
that African American (and to some degree white) participants exposed to messages
promoting the malleability of intelligence reported greater academic enjoyment,
engagement and obtained higher grades.
Hong et al., (1999) sought to integrate Dweck and Leggett model’s ability to
predict effort attributions with students’ willingness to participate in remediation when
feedback was suggested in order to establish if the intelligence theories of participants
could be manipulated. They conducted three separate studies to explore these research
questions. In study one they found that theoretical orientation (entity vs. incremental) did
predict effort attributions. Specifically, incremental theorists were more likely to
attribute performance to effort. On the other hand, entity theorists were more likely to
attribute performance to ability. The second study explored whether a student’s theory of
intelligence would predict their willingness to take remedial action if feedback suggested

ROLE OF MINDSET IN NWEA MAP TEST PERFORMANCE 30
it was necessary. The researchers found in this case that incremental theorists were more
likely than entity theorists to pursue remediation in this scenario. Finally, in study three
researchers sought to manipulate the student’s theory of intelligence by exposing them to
a Psychology Today article endorsing either incremental or entity beliefs. The
researchers found that they were able to manipulate the students’ theoretical orientations
to a statistically significant degree and that these manipulations resulted in altered
likelihoods of the students to take remedial action. In summary, Hong et al., (1999)
found evidence that attributions predicted by theoretical orientation (entity vs.
incremental views of intelligence) as frameworks for meaning had important implications
for the understanding of motivation. This article outlined the important identification of
measureable and manipulable orientations that predict effort attributions and resulting
action in educational settings. This powerful finding would soon be articulated by
Dweck as the growth mindset.
Blackwell et al. (2007) combined the findings of the Henderson and Dweck (1990)
study and the Hong et al. (1999) study described above. They took it one step further in a
longitudinal study by introducing an experimental intervention to see if they could alter
the intelligence theories of the participants and as a result, improve academic
achievement as measured by grades in mathematics. Two separate studies were
conducted. Study one sought to examine the link between students’ intelligence theories
and achievement results. Study two evaluated the results of an intervention that sought to
change the students’ mind sets. In study one, 373 7th
graders’ intelligence theories were
followed over two years. Students who were identified as having a fixed mindset had a
flat trajectory of achievement. On the contrary, students who were identified as having an

ROLE OF MINDSET IN NWEA MAP TEST PERFORMANCE 31
incremental or growth mindset demonstrated an upward trajectory. Study two taught the
incremental mindset to a group of 7th
graders (N=48) and simultaneously followed a
control group of 7th
graders (N=43) over the same period as the first study. As a result,
the experimental group demonstrated improved motivation in the classroom compared
with the control group, which demonstrated a downward trajectory. Although these
findings were statistically significant, Blackwell et al., (2007) noted that the effect sizes
for the positive results of the interventions on academic achievement were small.
However, the researchers also stated that if these interventions were carried out over the
course of a student’s educational career, the results could be more powerful.
The work done by Dweck and others through 2007 demonstrated promising
results for the growth mindset manipulation resulting in positive achievement outcomes.
With the publication of Dweck’s (2006) Mindset, The New Psychology of Success, How
We Can Fulfill Our Potential, Dweck set off a rapid expansion of research into the
growth mindset in the area of academic achievement and beyond. Following these early
ground breaking studies, Dweck’s colleagues and former graduate students along with
many others began studies to replicate and expand on her findings. For example, current
attempts to teach the growth mindset on a large scale, such as Paunesku’s (2013) growth
mindset study utilizing Khan Academy and involving 250,000 participants has found
success. In closing this section, it is important to note that growth mindset interventions
are not seen as a means on their own to improve achievement but rather an important
complement to effective instruction. Yeager and Walton (2011) point to the power of
social-psychological interventions like the growth mindset as required components of
effective instruction.

ROLE OF MINDSET IN NWEA MAP TEST PERFORMANCE 32
Beyond Mindset Theoretical Development
Mindset and subgroup factors. The original mindset research reported that
mindsets are evenly distributed across demographics (Dweck et al., 1995). Generally
stated, Dweck and colleagues have conveyed a 40-20-40 principal (Dweck, 2006),
meaning that 40 percent of the population is fixed minded, 20 percent neutral, and 40
percent is growth minded. Despite these assertions, it is important to closely evaluate
subgroups against these percentages in order to establish whether or not the examined
population follows this distribution. Beyond the distribution of mindsets in a population,
it has been established that demographic factors and subgroup classification can impact
the degree to which mindset influences academic performance (O'Rourke, Haimovitz,
Ballweber, Dweck, & Popović, 2014). The growing number of studies documenting the
differing role of mindset based on demographics and subgroup identity demands further
attention (Dar-Nimrod & Heine, 2006; Dvorak, 2014; Grant & Dweck, 2003).
When evaluating the correlation between mindset and standardized test
performance the role of demographic and subgroup identity as potential moderator
variables must be evaluated. Commonly measured demographic variables including, race,
ethnicity, socioeconomic status (SES), gender, and year in school must be included in
order to isolate the impact of mindset and evaluate any potentially statistically significant
differences between groups. The literature suggests that race and SES may amplify the
importance of having a growth mindset for increased academic achievement (Blackwell
et al., 2007). Specifically, having a growth mindset for minority students of lower SES
has a statistically significant positive impact on achievement (Blackwell et al., 2007).
Dweck (2008) has also reported mindsets may play a greater role for females when it

ROLE OF MINDSET IN NWEA MAP TEST PERFORMANCE 33
comes to math and science achievement and career attainment. Dweck (2000) has
speculated that females receive more entity related messages as children based on their
behavior (“you are a good girl”) when compared to boys, thus promoting the
development of a more fixed mindset. This relationship between females and an
enhanced role the growth mindset plays in academic success has been found repeatedly
(Dar-Nimrod & Heine, 2006; Grant & Dweck, 2003).
Similarly, student GPA, attendance, and educational program classification are
included as educational moderators within this study. GPA has consistently been used to
evaluate the relationship between growth mindset and academic achievement (Blackwell
et al., 2007). It has also been suggested that motivational variables actually play a greater
role in GPA than they do in tests scores when compared to intelligence (Duckworth,
Quinn, & Tsukayama, 2012). Attendance has also been found to correlate highly with
mindset (West et al., 2014). Finally, educational program classification (regular education,
special education, and gifted) are a subgroup classification that warrants additional
research regarding the role of mindset in academic performance. One study found that
students with learning disabilities (identified in special education) are more likely to have
a fixed mindset or entity view of intelligence (Baird, Scott, Dearing, & Hamill, 2009).
There is also evidence that gifted student’s mindsets have less of an impact on their
academic performance when compared to their non-gifted peers (Siegle, Rubenstein,
Pollard, & Romey, 2009), although other studies have reported that gifted students are
equally susceptible to the negative effects of a fixed mindset on academic performance
(Ziegler & Stoeger, 2010). By effectively studying the relationship between mindsets

ROLE OF MINDSET IN NWEA MAP TEST PERFORMANCE 34
and different demographics and subgroup identities, interventions can be targeted more
efficiently to those who would most benefit from them.
Mindset and achievement on standardized tests. This study evaluates the role
of mindset, a non-cognitive measure, in predicting performance on a standardized test.
The high stakes role of standardized tests in schools brought about by the No Child Left
Behind Act (Bush, 2001) now known as the Every Student Succeeds Act, has focused
educational research resources on exploring these assessments. Investigating the role of
non-cognitive factors in standardized test performance has become increasingly
important as policy makers seek financially efficient methods of improving test
performance. The role of mindset in academic achievement as measured by grades and
grade point average has been consistently documented (Blackwell et al., 2007; Grant &
Dweck, 2003). Additional research has been conducted that demonstrates that a growth
mindset in women (Good, Rattan, & Dweck, 2007, Rattan, Good, & Dweck, 2012) and
African American and Latino students (Aronson et al. 2002; Good et al., 2003) protects
against stereotype threat when measuring performance on standardized tests. However,
limited research regarding the role of mindset in predicting standardized test performance
has been conducted. This study seeks to address this limitation in the literature.
Previous research that has been conducted using non-cognitive traits as predictors
of standardized test performance have been inconclusive. One study conducted by
Duckworth et al., (2012) demonstrated that standardized test scores correlated highest
with IQ while achievement measured by grades correlated higher with measures of self-
control. A study conducted by Holmlund and Silva (2009) evaluated English as a second
language non-cognitive remediation programs, which included the targeting of self-

ROLE OF MINDSET IN NWEA MAP TEST PERFORMANCE 35
confidence, locus of control, self-esteem, and motivation. They found no statistically
significant effect on standardized test performance when compared to a control group.
On the other hand, Liu, Bridgeman, and Adler (2012) conducted a randomized
experiment in which they induced different motivational conditions. This study yielded
statistically significant differences in performance (effect size of .68) for those who
received the treatment designed to increase motivation. In another study, using the
Nebraska State Accountability Test, Dvorak (2014) found a moderate positive correlation
between being growth minded and 8th
and 11th
grade reading scores. Finally, another
recent study found that motivation and cognitive strategy use predicted growth of
performance on standardized tests more than intelligence (Murayama, Pekrun,
Lichtenfield, & Vom Hofe, 2013).
NWEA MAP performance and construct irrelevant variance. An exhaustive
review of the literature yielded no studies specifically evaluating mindset and NWEA
MAP performance. However, there has been research conducted evaluating the role of
effort in NWEA MAP performance and potential negative distortion of results. Negative
distortion of results is described as assessment results that are lower than the student’s
true achievement level (Wise, Ma, Cronin, & Theaker, 2013). Negative distortions are
described as threats to the validity of a test score due to construct-irrelevant variance
(CIV) (Haladyna, & Downing, 2004). Haladyna and Downing (2004) describe these
CIVs as potentially impacting scores positively (increasing a score) or negatively
(decreasing scores). An example of positive distortion would be cheating, where an
examinee would obtain a higher score than they would without cheating. On the other
hand, test anxiety is an example of negative distortion if a score is decreased because the
ROLE OF MINDSET IN NWEA MAP TEST PERFORMANCE 36
anxiety does not allow the examinee to demonstrate their true performance. Motivation
is another example of a CIV that could play a positive or negative distorting role.
Computer adaptive testing’s ability to record the time spent on individual items and tests
as a whole creates a new method of analyzing student motivation. This method of
evaluating student motivation known as response time effort (RTE) provides researchers
with a new quantitative tool for evaluating motivation on standardized assessments (Wise
& Kong, 2005). While RTE is beyond the focus of this study, it is theorized that higher
mindset scores will represent a positive CIV and lower mindset scores represent negative
CIV. Thus, it was theorized that this study would identify a statistically significant
relationship between mindset scores and NWEA MAP subject test performance based on
the CIV theory presented here.
Criticisms of the Growth Mindset. The expanding growth mindset movement is
not without its critics. The main vein of criticism regarding the growth mindset has been
primarily focused on implementation and integration of mindset theory and interventions
into educational environments. Dweck has responded to these criticisms with her own
warnings about over simplifying her theory and the importance of proper implementation.
Dweck has publicly stated that one of her greatest fears is that mindset becomes the new
self-esteem movement (Dweck, 2016).
Perhaps the most passionate and public criticism of the growth mindset movement
has come from Alfie Kohn whohas raised criticisms of the growth mindset as an over
simplified theory, which over emphasizes the importance of an educator’s
communication styles, and distracts from overall structural problems within education by
putting the emphasis on the student’s effort rather than the state of the education system.

ROLE OF MINDSET IN NWEA MAP TEST PERFORMANCE 37
Kohn (2015) published an article in Slate Magazine entitled “The perils of “Growth
Mindset” education: Why we’re trying to fix our kids when we should be fixing the
system.” Kohn made three main critiques of mindset theory, namely the emphasis on
effort, teacher praise, and a lack of focus on improving instruction. First, Kohn claims
that mindset theory over emphasizes effort to the detriment of the student who may be
forced to feel that lack of success is their fault for not putting in sufficient effort. Second,
Kohn takes issue with the praise research conducted around growth mindset. He asserts
that by emphasizing extrinsic motivation in the form of teacher praise in an effort to
promote student learning, educators will unwittingly decrease intrinsic motivation. Third,
Kohn raises the concern that by emphasizing traits internal to students, educators are
tempted to abdicate their responsibility to work to improve the system within which that
student is learning.
While well-articulated, Kohn’s criticism lacks empirical challenge to Dweck’s
work and instead focuses on historical and policy debates, which while important, do not
detract from Dweck’s findings. On one point, Dweck does agree with Kohn. She has
stated a number of times that she believes that the concept of the growth mindset has
been over simplified and that the role of effort has been over emphasized to the detriment
of other important aspects of a growth mindset, namely the application of strategies and
the seeking of guidance from others (Dweck, 2015, 2016).
Others criticize the growth mindset not for its theoretical underpinnings but for its
inadequate implementation in schools. Peter Dewitt (2015) cites work done by John
Hattie claiming low effect sizes for growth mindset interventions in his claim that
mindset interventions are not living up to their hype. Dewitt’s primary argument is that

ROLE OF MINDSET IN NWEA MAP TEST PERFORMANCE 38
educators are only paying lip services to mindset theory by changing their language but
not their underlying beliefs which are communicated non-verbally and through classroom
instructional practices. Dewitt emphasizes that teachers must reevaluate their own deeply
held beliefs, before they can pass on a growth mindset to their students. He goes further
to note that instructional and assessment practice must change as well if the school
culture is to shift to one based on the core values of the growth mindset. Dweck herself
in recent writings and presentations has begun to echo these same concerns (Dweck,
2016).
Concerns regarding the misapplication of Dweck’s theory have also been raised by
researchers, journalists and Dweck herself. The most important misconception is that
mindset is synonymous with effort. Dweck cautions parents and educators alike that it is
important to emphasize effort by praising specific aspects of the learning process and
strategies and tying them back to the learning outcome rather than just effort itself
(Barshay, 2015). Dweck also urges parents and educators to evaluate their own response
to challenges and failures to ensure they are modeling a growth mindset. According to
Dweck, only by constantly monitoring one’s own growth and fixed mindset triggers and
responses can one hope to model the growth mindset and instill it in others (Dweck,
2016).

ROLE OF MINDSET IN NWEA MAP TEST PERFORMANCE 39
Chapter III: Methods
This quantitative cross-sectional study investigated the relationship between
mindset and performance on the NWEA MAP assessment. The study combined
secondary data and survey data within the analysis. The statistical relationship between
mindset and NWEA MAP performance and the mediation of control variables was
evaluated throughout this study. Gender, ethnicity, race, socioeconomic status, special
education participation, gifted education participation, grade point average, attendance,
and year in school were used as control variables.
Research Question: What is the relationship between mindset (entity vs.
incremental beliefs) and student performance on the Northwest Evaluation Association’s
(NWEA) Measure of Academic Progress (MAP)? In order to respond to this
overarching research question, the researchers addressed the following questions: 1) what
is the relationship between mindset (entity vs. incremental beliefs) and student
performance on the Northwest Evaluation Association’s (NWEA) Measure of Academic
Progress (MAP)? 2) What is the relationship between subgroup factors (demographics,
academic program, and academic achievement measure by GPA, attendance, and year in
school) and mindset’s ability to predict student performance on the NWEA MAP?
Hypotheses
Null Hypothesis #1: There is no statistically significant relationship between mindset and
student performance on the NWEA MAP.
Null Hypothesis #2: There is no statistically significant relationship between subgroup
factors and the ability of mindset to predict performance on the NWEA MAP.

ROLE OF MINDSET IN NWEA MAP TEST PERFORMANCE 40
Overview of the Current Study
In order to evaluate the research question, a cross-sectional design was utilized.
The study drew on both archival data from the school and survey data collected as part of
this study. The archival data consisted of parent supplied demographic information from
the school’s enrollment process and educational records including achievement data,
educational program facts, number absences, and NWEA MAP assessment results. The
survey data was collected by the researcher with the cooperation of the school staff. The
participants were middle school students in grades 6-8 in a college preparatory charter
school in a metropolitan area of the southwestern United States. The survey instrument
used to establish mindset scores was Dweck’s Implicit Theories of Intelligence Scale for
Children (Dweck, 2000).
The study explored the findings through estimated bivariatecorrelations and a
series of nested multiple regression models to answer each question. The primary
research question sought to evaluate the relationship between mindset (independent
variable) and student performance on the NWEA MAP subject tests (dependent variable).
Mindset’s relationship to NWEA MAP subject tests was first evaluated through
descriptive statistics and estimated bivariate correlation matrices. The second phase of
data analysis relied on multiple regression analysis to evaluate the impact of control
variables on mindset as a predictor of student performance on the NWEA MAP. The
secondary research questions were explored using similar techniques in order to identify
potential mediating variables.

ROLE OF MINDSET IN NWEA MAP TEST PERFORMANCE 41
Participants
The participants for this study were drawn from a high achieving college
preparatory charter school in a metropolitan area of the southwestern United States. The
students attending this school were selected through a lottery system. The only allowed
preference for enrollment is sibling preference, which guarantees enrollment for siblings
of students selected through the lottery. The participants were drawn from grades 6-8.
Participation in the study was voluntary and open to all students enrolled in these grades.
This sample is in part a convenience sample due to the researcher’s access to the facility
but is also purposive in that the study seeks to evaluate the applicability of previous
research to this setting (high achieving charter schools). At the time of the study, the
school had a 6th
-8th
grade population of 333 students. Of those students, 307 students
were present on the day of the study, consented to participate, and had completed the
NWEA MAP assessments. Table 8 provides descriptive statistics for the participants.
Further review of these descriptive statistics can be found in the results section.

ROLE OF MINDSET IN NWEA MAP TEST PERFORMANCE 42
Table 8
Participant demographics
Variables (N=307) Variable Categories Frequency %
Gender 0=Male 140 45.6
1=Female 167 54.4
Year In School 6th
Grade 101 32.9
7th
Grade 103 33.6
8th
Grade 103 33.6
Special Education 0=Not in Special
Education
291 94.8
1=Special Education 16 5.2
Gifted 0=Non-Gifted 246 80.1
1=Gifted 61 19.9
Socioeconomic Status 0=Not Title I
Eligible
275 89.6
1=Title I Eligible 32 10.4
Ethnicity 0=Non-Hispanic 205 66.8
1=Hispanic 102 33.2
Race 1= Caucasian 274 89.3
2=African American 11 3.6
3=Asian 12 3.9
4=Pacific Islander 5 1.6
5=Native American 5 1.6
In designing the study, the researcher proposed building regression models for 1-
14 predictor variables. The proposed multiple regression models required a determined
number of participants in order to have sufficient power to identify effect sizes as can be
seen in Table 9. The A-priori calculations identifying the proposed sample size allowed
for the identification of conventionally accepted effect size parameters: small (.02),
medium (.15), and large (.35).

ROLE OF MINDSET IN NWEA MAP TEST PERFORMANCE 43
Table 9
Sample size power calculations.
N Power Probability
level
Number of predictor
variables
Attainable effect
size
309 .8 .05 1 .025
307 .8 .05 14 .062
Note: Values were calculated using: Soper, D.S. (2015). A-priori Sample Size Calculator
for Multiple Regression [Software]. Available from http://www.danielsoper.com/statcalc
Instrumentation
The instruments used for this study are established instruments with published
validity and reliability data. De-identified student demographic and educational
information was obtained from the school staff through the student information system
(SIS). Finally, standardized test scores for the fall 2015 administration of the NWEA
MAP were obtained as part of de-identified secondary archival data provided by the
school.
The Implicit Theories of Intelligence Scale for Children (Dweck, 2000) is the
primary scale for identification of entity vs. incremental beliefs. The scale was
developed by Dweck (2000) and her colleagues. They were primarily responsible for the
theoretical development of the constructs and have been the principal researchers in this
area. The NWEA MAP assessment (2004) was selected because it assesses student
achievement on Common Core State Standards (National Governors Association Center
for Best Practices & Council of Chief State School Officers, 2010) and is normed on a
national scale involving students from all 50 states.
Implicit Theories of Intelligence Scale for Children (ITISC) is a six item inventory
measured on a six-point Likert-type scale (Dweck, 2000). The first three items of the
scale can be used in isolation as a brief form. The inventory measures students’ beliefs

ROLE OF MINDSET IN NWEA MAP TEST PERFORMANCE 44
about intelligence as an entity (immutable) trait or an incremental (mutable) trait. Scores
of 1-3 indicate entity beliefs, scores of 5-6 indicate incremental beliefs, and scores greater
than 3 and less than 4 are recognized as mixed beliefs. Incremental items (4-6) are coded
as 6 points for strongly agree, 5 points for agree, 4 points for mostly agree, 3 points for
mostly disagree, 2 points for disagree, and 1 point for strongly disagree. Entity items (1-
3) are coded as 1 point for strongly agree, 2 points for agree, 3 points for mostly agree, 4
points for mostly disagree, 5 points for disagree, and 6 point for strongly disagree. Points
are totaled and divided by 6 in order to obtain the results. Entity (fixed) vs. incremental
(growth) beliefs are also referred to in this dissertation as the measure of growth
mindedness.
According to Dweck et al., (1995), the internal reliability of the ITISC items ranged
from .94 to .98. The test-retest reliability score with a two-week interval was .80. Dweck
(2000) and colleagues have also provided clear validity evidence in the literature. First,
the authors explored validity evidence based on response process related to the measure.
Citing Henderson (1990), Dweck (2000) explained that validation studies yielded
qualitative explanations for items responses that corresponded with the item choice. The
explanations provided by the subjects paralleled the responses provided on the scale.
Internal structure validity evidence was collected through factor analysis further
supporting the validity of the measure (Dweck et al., 1995). See Appendix A for a copy
of the measure.
The Northwest Evaluation Association (NWEA) Measure of Academic Progress
(MAP) is a short cycle Common Core-aligned computer adaptive assessment
administered in the fall, winter and spring in K-12 settings. The assessment provides

ROLE OF MINDSET IN NWEA MAP TEST PERFORMANCE 45
instructionally relevant feedback to teachers and students in the areas of math, reading,
and language. According to the NWEA (2004), test-retest rates of reliability range from
the mid .80s to .90 across grade levels as measured by Pearson’s estimated correlational
coefficient. Content and concurrent validity information provided by NWEA (2004)
suggest alignment with tested standards and other assessments.
The school’s Student Information System (SIS) was the source for all additional
data. School-based student information systems store demographic and educational
information. Student demographics are supplied by students and families through online
enrollment software and then uploaded. Academic program and achievement
information is entered on an ongoing basis by the teachers and staff members. The
following data were obtained from the school through the SIS: gender, ethnicity, race,
SES, special education program participation, gifted program participation, GPA,
attendance, and year in school. NWEA MAP results in the areas of math, reading, and
language were also provided by school staff members via the SIS.

ROLE OF MINDSET IN NWEA MAP TEST PERFORMANCE 46
Table 10
Variables to be used in regression models by type
Code Variable Type Independent/Dependent
HISP Hispanic Ethnicity Categorical Independent
REID Racial identification (recoded
into dummy variables in SPSS)
Categorical Independent
GEN Male/Female Categorical Independent
GPA Semester progress report grade
point average (GPA)
Continuous Independent
ATTEN School attendance as of progress
report
Continuous Independent
SPED Special Education Traits Categorical Independent
GIFT
SES
Students are in the Gifted Prog.
Title I participation
Categorical
Categorical
Independent
Independent
YINSC Year in school (6-8) Categorical Independent
ITISCS Total score on Implicit Theories
of Intelligence Scale for Children
Categorical Independent
MMAP NWEA MAP Math subject test
performance percentile score
Continuous Dependent
RMAP NWEA MAP Reading subject
test performance percentile score
Continuous Dependent
LMAP NWEA MAP Language subject
test performance percentile score
Continuous Dependent
Procedure
This study is cross-sectional in nature in that data were collected within a short period
of time in order to evaluate the relationship between mindset and student performance on
the NWEA MAP. Students completed the surveys, the NWEA MAP, and had their
demographic information collected in the first semester of the school year. The following
procedures represent the actual steps taken as outlined in the submitted institutional
review board protocol. The study procedures are presented in a numbered list for clarity
and simplicity of replication.
1. Step 1: Following approval from the university IRB office, the study information
was communicated to families through digital and hard copy communications two

ROLE OF MINDSET IN NWEA MAP TEST PERFORMANCE 47
weeks prior to the planned collection of survey data. Parents/guardians were
provided the informed consent information in this communication (the researcher
was granted an alteration of the parental consent requirement by the university
IRB. Written parental permission was not required by the IRB).
2. Step 2: Students were surveyed in their advisory classes (student assent was
sought at the time of the survey). Advisory class is a combination of study hall
and homeroom. Assent from students for participation in the study including
permission to access secondary school data was requested at the time of the
survey. The survey took place during the students’ advisory period which is the
last period of the day. Teacher advisors facilitated student participation in the
survey or the alternate activity if the student declined to assent. Links for the
survey/alternate activity were emailed out to each student prior to their advisory
period. All student interaction with the study took place through their email and
over the internet with the survey delivered via an online google form.
3. Step 3: The researcher obtained de-identified student information from the school
(secondary data) for the students who assented to participate in the study and
whose parents did not opt them out of the study.
a. Data access procedure: Survey information was not evaluated until it was
de-identified through the following process.
i. Student survey information was used to populate a spreadsheet.
The first 2 columns of the sheet were participant number and name.
ii. One copy of the first 2 columns linking participant number to
student ID was printed in order to use as a key for requesting

ROLE OF MINDSET IN NWEA MAP TEST PERFORMANCE 48
student information (secondary data set) from the school.
Researchers retained the survey information identified only by
participant number. Survey responses were all Likert scale
responses and thus no identifiable information remained in the
survey data set.
iii. The school used the provided key to construct the secondary data
set identified only by participant number.
iv. The school was instructed to destroy the key linking students to
participant number. The researcher did not retain a copy of the key.
v. The secondary data provided by the school therefore included only
unidentifiable data and thus was not subject to the FERPA
requirement of written consent (see alteration of consent
explanation).
b. Based on consenting/assenting participants identified, the following
information was provided by the school in the secondary data set to the
researcher. Participants were identified by participant number only.
i. Demographics (gender, ethnicity, race, year in school, SES)
ii. Ed. Program (special education, gifted education, regular education)
iii. GPA
iv. Attendance (number of unexcused absences by period)
v. Time on test (measured in minutes used to complete the MAPS test)
vi. NWEA MAP Assessment results for math, language, and reading
tests.

ROLE OF MINDSET IN NWEA MAP TEST PERFORMANCE 49
4. Step 4: Any student who did not provide assent or whose parent/guardian opted
them out of the study after data was collected had their information excluded from
the data set and survey results deleted with all hard copies destroyed.
5. Step 5: The researcher then combined the survey data with the school provided
secondary data for those participants who assented and whose parents had not
opted them out of the study. Student survey responses were matched to the data
set by participant number.
a. Once the secondary and survey data was combined, participant’s numbers
were randomly changed again in order to further reduce any potential
breach of confidentiality.
6. Step 6: The researcher analyzed the data set according to previously stated
research questions, hypotheses, and outlined data procedures. The findings were
recorded, analyzed, and discussed in this document.
7. Step 7: The researcher offered to provide school staff with Growth Mindset
professional development at the school’s request.
Informed consent. Participation in the study was voluntary. Given that the
participant population was under the age of 18, both informed consent and informed
assent were required. Participants and families in grades 6-8 were informed of the study
in a letter through the school email system and were provided a hard copy. All
participants had family emails provided by the school (school domain specific Gmail
accounts) and families were familiar with the school expectation to monitor the email on
a regular basis. Given that the nature of the data collected (surveys, educational program,

ROLE OF MINDSET IN NWEA MAP TEST PERFORMANCE 50
and achievement data) is a part of the participants’ regular experience at the school, this
research was deemed to be of minimal risk. Because of the established minimal risk, an
alteration of the informed consent procedure was sought and granted by the university
IRB. This alteration allowed for informed consent to be achieved through parental
notification, requiring parents or students to actively opt out if they did not want to
participate. The letter distributed served as informed consent and included the required
components of informed consent. Informed assent was obtained from students at the time
of the administration of the survey. Students read the informed assent letter as the first
step in the survey process. If students chose not to provide assent they were thanked and
their survey reverted to the alternate activity. This informed assent letter was based on
the informed consent letter to parents but was modified to ensure it was age appropriate
for the participants.
Informed consent was sought two weeks prior to the start of the study and no data
collection was conducted until the informed consent procedures were completed. The
school provided the researcher with an email account, which was included in the
informed consent letter in order to facilitate communication between the families, the
participants, and the researcher. Questions were answered and withdrawal of informed
consent (opt outs) were collected via this email address. After the participants were
presented with the student survey no additional opt out requests were received.
Survey completion. All students in 6th
through 8th
grades in the school
population were assigned to an advisory period, which functioned as a combined
homeroom and study hall. The survey was disseminated during the advisory period and
the survey was facilitated by the advisory teachers who had no access to survey results.

ROLE OF MINDSET IN NWEA MAP TEST PERFORMANCE 51
The surveys were administered through computers via an online survey Google Form
developed in Google docs, an online tool affiliated with the school’s Gmail domain The
survey was delivered directly to the students’ individual email accounts and was sent
from an email created specifically for the purpose of this study and provided by school
officials ([email protected]). Student participation was tracked through their
individual email addresses, which automatically populated a Google Sheets document
with responses. Participant email addresses were then converted to their individual
participant number in order to anonymize the data while still making it possible for
school officials to provide the data connected to the participant’s survey information.
The survey form was partitioned, requiring participants to read and assent to the
study prior to being able to complete the survey. Those participants who did not assent
received a message thanking them for their time and they were provided a link to a study
skills-related online reading as an alternate task. Advisory teachers were instructed to
ensure that participants had privacy during the completion of the survey or the alternate
activity to ensure participants did not feel obligated to participate. It was calculated that
students would be able to complete the assent document reading and the Implicit
Theories of Intelligence scale in 10 minutes. In order to ensure that participants had
sufficient time, 30 minutes were scheduled in the technology environment. Students
were instructed to bring along a book to read when they finished. Participant surveys
were collected in October which overlapped with the end of the NWEA MAP assessment
window. In order to minimize the time for the survey, the brief three item version of the
scale was used. The student mindset scores were calculated using these first three items
of the ITISCS which can be used in isolation (Dweck, 2000). Thus, individual

ROLE OF MINDSET IN NWEA MAP TEST PERFORMANCE 52
participant mindset scores were the average on these 3 items. Cronbach’s Alpha for this
survey were calculated using SPSS and resulted in a .788.
Data collection. Secondary, de-identified data was obtained from the school in
order to construct the comprehensive data set for analysis. The researcher added a
participant number to student survey results, the student name and participant number
were provided to the school personnel. School officials combined secondary data to the
participant number and student name spreadsheet provided. After the secondary data
were added, the student name column was deleted by the school prior to providing the
data set to the researcher. The researcher did not retain a copy of the key linking the
student to participant ID and thus only received unidentifiable student information. This
was combined with the survey data by the researcher according to participant number.
There were two sources of the participant data provided by the school. The first was
student demographic information (i.e. gender, race, ethnicity, SES, and grade level),
which was provided by parents/guardians upon enrollment of their students. The second
data type was educational program, GPA, attendance, and assessment information, which
was collected and entered into the Student Information System (SIS) by school staff.
All archival and survey data was combined into one spreadsheet once the
secondary data set was obtained from the school. After the data was combined, the
identities of the participants were converted to a new participant number in order to
promote confidentiality. This newly created spreadsheet contained student survey
information and school provided secondary data which contained no identifiable data.
For a complete list of the data collected, see the codebook in Appendix B.

ROLE OF MINDSET IN NWEA MAP TEST PERFORMANCE 53
Analysis. The collected data was analyzed using IBM SPSS (v22) and Microsoft
Excel (2007). The collected data was screened and related assumptions were checked.
Appropriate statistical procedures relevant to each research question and tests of the null
hypotheses were conducted. Specifically, nested taxonomies of regression models were
fit and analysis of variance was conducted. Final data analysis procedures deployed in
this study followed the research question and appropriately fit the collected data.
Data screening and assumption testing. Appropriate data screening techniques as
outlined by Tabachnick and Fidell (2013) were conducted. Examples of data screening
requirements include evaluating the amount and distribution of missing data, checking for
outliers, evaluating residuals, and identifying the procedure for dealing with missing data
(impute mean, etc.). Assumptions related to multiple regression and analysis of variance
were checked. These procedures include tests for normality, linearity, homoscedasticity,
and homogeneity of variance (Tabachnick & Fidell, 2013). All data screening procedures
were recorded and relevant information was included in the results chapter.
Appropriate statistical procedures were utilized in order to answer the research
question. These included calculating descriptive statistics, general linear modeling, and
analysis of variance procedures. Examples of descriptive statistics for continuous
variables include range, mean, and standard deviations. Examples of descriptive statistics
for categorical data include frequency tables, proportions, and histograms. A nested
taxonomy of regression models was fitted to evaluate the question predictor (mindset)
against NWEA MAP performance, controlling for subgroup factors. Table 11 describes
the theoretical approach in designing the planned multiple regression analysis. Table 12

ROLE OF MINDSET IN NWEA MAP TEST PERFORMANCE 54
describes the planned taxonomy of nested regression models and the variables included in
the models.
Table 11
Theoretical Framework for Regression Models
Level Predictor Literature References
High Priority:
Question Predictor
Model 1
Intelligence
Beliefs
(Continuous
and
Categorical)
Academic Achievement: Dweck & Legget,
1988; Blackwell et al., 2007; Paunesku,
2013; Romero, Paunesku, & Dweck, 2011;
Paunesku et al., 2015; Yeager & Walton,
2011; Yeager, Walton, et al., 2013
Assessment: Dvorak, 2014; Liu et al., 2012;
Murayama et al., 2013
Medium Priority:
Primary Control
Predictors
Models 2 & 3
Race, Ethnicity,
SES
Aronson et al., 2002; Good et al., 2003;
Good et al., 2007; Blackwell et al., 2007;
Dar-Nimrod & Heine, 2006; Grant &
Dweck, 2003; Dvorak, 2014; O'Rourke et al.,
2014
Medium Priority:
Primary Control
Predictors
Model 4
SPED, Gifted Baird et al., 2009;
Ziegler & Stoeger, 2010
Low Priority:
Secondary Control
Predictors
Model 5
GPA,
Attendance,
Year in School
Blackwell et al., 2007; Duckworth et al.,
2012

ROLE OF MINDSET IN NWEA MAP TEST PERFORMANCE 55
Table 12
Multiple Regression Data Analysis Procedures
Model Dependent
Variable
Independent
Variable
Control
Variable(s)
Analysis
Model 1 MAP scores (by
subject)
Mindset 1.Descriptive
statistics
2. Estimated
Correlation
Matrix
3. Simple Linear
Regression
Model 2 MAP scores (by
subject)
Mindset 1.Demographics:
Gender, Ethnicity,
Race
1.Descriptive
statistics
2. Estimated
Correlation
Matrix
3. Multiple
Regression:
Model 3 MAP scores (by
subject)
Mindset 1.Demographics:
Gender, Ethnicity,
Race
2. SES (Title I)
1.Descriptive
statistics
2. Estimated
Correlation
Matrix
3. Multiple
Regression:
Model 4 MAP scores (by
subject)
Mindset 1.Demographics:
Gender, Ethnicity,
Race
2. SES (Title I)
3. Educational
Program: Special
Education, Gifted
1.Descriptive
statistics
2. Estimated
Correlation
Matrix
3. Multiple
Regression
Model 5 MAP scores (by
subject)
Mindset 1.Demographics:
Gender, Ethnicity,
Race
2. SES (Title I)
3. Educational
Program: Special
Education, Gifted
4. GPA, Attendance,
Year in School
1.Descriptive
statistics
2. Estimated
Correlation
Matrix
3. Multiple
Regression:
The results of the statistical procedures are presented in the results section.
Aggregate descriptive statistics and estimated bivariate correlation tables are presented

ROLE OF MINDSET IN NWEA MAP TEST PERFORMANCE 56
first. The relationships identified in the estimated bivariate correlation matrices were
used to construct the multiple regression model. Next, the nested taxonomy of five
multiple regression models per subject tests are presented organized by dependent
variables; Math, Reading, and Language MAP subject tests.
Concluding Remarks
This study was intended to evaluate the relationship between mindset and student
performance on the NWEA MAP assessment. The impact of subgroup traits on the
ability mindset to predict performance on standardized tests was also analyzed. With this
research completed, the hope is that future studies will be able to target specific
subgroups in order to more efficiently focus mindset interventions.

ROLE OF MINDSET IN NWEA MAP TEST PERFORMANCE 57
Chapter IV: Results
The purpose of this quantitative correlational study was to evaluate the
relationship between student’s Implicit Theories of Intelligence Scale for Children results
and performance on the NWEA Measure of Academic Progress academic achievement
test. The cross-sectional data collected was analyzed and the results are presented in this
chapter. The chapter is divided into the following sections: sample description, research
question findings, and concluding remarks. Statistical analyses are presented in the
following order organized by dependent variable (NWEA MAP subject test): descriptive
statistics, estimated bivariate correlation matrices, multiple regression models, analysis of
variance results, and prototypical plots highlighting interesting relationships.
Research Question
What is the relationship between mindset (entity vs. incremental beliefs) and
student performance on the Northwest Evaluation Association’s (NWEA) Measure of
Academic Progress (MAP)? The evaluation of this research question included the
analysis of subgroup factors (i.e. demographics, socio-economic status, academic
program: special education and gifted education, academic achievement measured by
GPA, attendance, and year in school) and their impact on mindset’s ability to predict
student performance on the NWEA MAP.
Null Hypothesis #1: There is no statistically significant relationship between
mindset and student performance on the NWEA MAP.
Null Hypothesis #2: There is no statistically significant relationship between
subgroup factors and the ability of mindset to predict performance on the NWEA
MAP.
Five nested hierarchical regression models were constructed for each subject
assessment in order to test the above null hypotheses. These models represent 3 levels of

ROLE OF MINDSET IN NWEA MAP TEST PERFORMANCE 58
question predictors grounded in the literature. Table 13 represents the theoretical
framework for the construction of the regression models.
Table 13
Question Predictor and Control Variable Framework for Regression Models
Level Predictor
High Priority:
Question Predictor
Model 1
Intelligence Beliefs (Continuous and
Categorical)
Medium Priority:
Primary Control Predictors
Models 2 & 3
Gender, Race, Ethnicity, SES
Medium Priority:
Primary Control Predictors
Model 4
SPED, Gifted
Low Priority:
Secondary Control Predictors
Model 5
GPA, Attendance, Year in School
Study Sample
The sample in this study includes 307 middle school students attending a college
preparatory charter school in a metropolitan area of the southwestern United States.
Student enrollment was dependent on lottery selection and was open to students across
the state. The only recognized lottery preference was for students applying who already
had a sibling enrolled in the school. Apart from this lottery preference, the selection of
the students was random. However, student inclusion in the lottery was solely based on
family self-selection into the lottery. Furthermore, the lottery process is conducted
entirely online and promotional information is only available in English. The school
offers transportation services from varying locations across the metropolitan area. School
officials explained that no promotional recruitment efforts had been conducted over the
ROLE OF MINDSET IN NWEA MAP TEST PERFORMANCE 59
previous 3 years beyond the school’s website due to the high demand for student
enrollment. This information is provided in order to contextualize the demographic
makeup of the school, which is reported in Table 15.
The entire middle school population was targeted for this study. On the day that
the students were presented with the survey and their assent to participate in the study
was requested, there was a total of 333 students present. Of those, 312 students assented
(or had not previously been opted out by their parent/guardian) to participate,
representing a 93.69 percent participation rate. Five students were excluded from the
study because they were not present at school for the NWEA MAPS test and therefore
had no assessment data. The existing data of these five students obtained from the school
was reviewed and no discernable pattern was detected and therefore it was determined
they did not represent systematic error. These five participants were excluded from the
analysis. All participant data were reviewed and no significant outliers were detected.
Therefore, the remaining 307 participants were retained in the dataset.

ROLE OF MINDSET IN NWEA MAP TEST PERFORMANCE 60
Table 14
Descriptive Statistics for the Continuous Variables
Variables (N=307) Mean SD Min Max
Math MAP Percentile (MPILE) 59.81 22.26 3.0 99
Math MAP RIT (MRIT) 226.98 13.21 188 259
Math MAP Time (MTIME) 58.88 20.59 11 191
Reading MAP Percentile (RPILE) 68.49 23.02 1 99
Reading MAP RIT (RRIT) 222.84 13.14 163 254
Reading MAP Time (RTIME) 53.31 21.53 8 103
Language (LPILE) 66.82 21.79 1 99
Language MAP RIT (LRIT) 220.30 10.73 178.0 245.0
Language MAP Time (LTIME) 40.57 13.36 8.0 103.0
Total score on Implicit Theories
of Intelligence Scale for Children
(ITISC)
3.87 1.22 1 6
Grade Point Average (GPA) 3.27 .7715 0 4.22
Attendance (ATTEN): Periods
Missed
7.5251 9.59434 0 65
The sample’s mean test performance as measured by their performance on the
NWEA MAP assessment of achievement indicates that the students were academically
advanced when compared to their peers across the country. Percentile scores are reported
based on 2011 NWEA MAP national norms. Aggregate student Math, Reading, and
Language percentile scores were in the 60th, 68
th, and 67
th percentiles respectively.
Furthermore, the sample mean GPA of 3.27 (sd=.77) also indicates that the sample was
advanced academically, which may be explained by student self-selection into the lottery
of the charter school because of its college preparatory nature. Due to the school’s
demographic makeup and academically advanced mean performance, generalizability of
these findings will be limited.

ROLE OF MINDSET IN NWEA MAP TEST PERFORMANCE 61
Table 15.
Descriptive Statistics of the Categorical Variables
Variables (N=307) Variable Categories Frequency %
Gender (GEN) 0=Male 140 45.6
1=Female 167 54.4
Year In School
(YINSCH)
6th
Grade 101 32.9
7th
Grade 103 33.6
8th
Grade 103 33.6
Special Education 0=Not in Special
Education
291 94.8
1=Special Education 16 5.2
Gifted 0=Non-Gifted 246 80.1
1=Gifted 61 19.9
Socioeconomic Status
(SES)
0=Not Title I
Eligible
275 89.6
1=Title I Eligible 32 10.4
Ethnicity (HISP) 0=Non-Hispanic 205 66.8
1=Hispanic 102 33.2
Race 1= Caucasian 274 89.3
2=African American 11 3.6
3=Asian 12 3.9
4=Pacific Islander 5 1.6
5=Native American 5 1.6
Total score on
Implicit
Theories of
Intelligence
Scale for
Children(ITISC)
1=Entity Beliefs 89 29
2=Neutral 59 19.2
3=Incremental
Beliefs
159 51.8
The sample included 46% males (n=140) and 54% females (n=167). The sample
participants were evenly represented across grade levels, 6th
(n=101), 7th
(n=103), and 8th
(n=103) grade students. The ethnicity profile of the sample included 33% Hispanic
students (n=102) and 67% non-Hispanic students (n=205). Eighty-nine percent of the

ROLE OF MINDSET IN NWEA MAP TEST PERFORMANCE 62
participants were Caucasian (n=274), 4% African American (n=11), 4% Asian (n=12), 2%
Pacific Islander (n=5), and 2% Native American (n=5). The socioeconomic status of
participants was measured by student eligibility for Title I services. Title I eligibility was
calculated based on the total family income and the number of individuals in the family.
Title I program participants are considered at risk due to their lower socioeconomic status.
Ten percent of students (n=32) were classified as eligible for Title I services compared
with 90% of students (n=275) who were not eligible. The sample included 20% of
students (n=61) identified as receiving state recognized gifted education services
compared to 80% (n=246) who were not receiving gifted services. Students participating
in special education as defined by the federally recognized categories represented 5% of
the sample (n=16) compared to 95% of the sample (n=291) who were not identified as
students receiving special education. In Table 16, students identified as special education
students where more consistently identified as fixed minded (62.5 %) according to the
ITISCS results when compared to their non-special education peers (27%).
Table 16
Special Education Mindset Frequencies
SPED (N=16) Non-SPED
(n=291)
Total Predicted
Fixed 62.50%
(N=10)
27.14% (N=79) 28.99% (N=89) 40%
Neutral .06% (N=1) 19.93% (N=58) 19.21% (N=59) 20%
Growth 31.25% (N=5) 52.92%(N=154) 51.79% (N=159) 40%
Research Question Analyses
Descriptive and inferential statistics were calculated in order to answer the
research question and test the null hypotheses. The following section will review the
research question, provide the results of the hypothesis testing, and review the statistical

ROLE OF MINDSET IN NWEA MAP TEST PERFORMANCE 63
procedures calculated. Both null hypotheses 1 and 2 were rejected as statistically
significant relationships were identified.
Research Question. What is the relationship between mindset (entity vs.
incremental beliefs) and student performance on the Northwest Evaluation Association’s
(NWEA) Measure of Academic Progress (MAP)? The evaluation of this research
question included the analysis of subgroup factors (demographics, socioeconomic status,
academic program: special education and gifted education, academic achievement
measured by GPA, attendance, and year in school) and their impact on mindset’s ability
to predict student performance on the NWEA MAP.
Null Hypothesis #1: There is no statistically significant relationship between
mindset and student performance on the NWEA MAP.
Null Hypothesis #2: There is no statistically significant relationship between
subgroup factors and the ability of mindset to predict performance on the NWEA
MAP
Both null hypotheses were rejected according to the results of the statistical
procedures conducted. Statistically significant relationships between math, reading, and
language performance on the NWEA MAP assessment and participant mindset scores
were identified through Pearson’s and Spearman’s estimated bivariate correlation
procedures, multiple regression analysis, and analysis of variance procedures.
Furthermore, this relationship was impacted based on subgroup factors identified through
estimated bivariate correlation matrices and nested hierarchical multiple regression
analysis. These relationships are described below.
Estimated bivariate correlations. All variables were included in one
comprehensive estimated bivariate correlation matrix in order to evaluate the
relationships between all variables. Pearson’s correlations were estimated for all

ROLE OF MINDSET IN NWEA MAP TEST PERFORMANCE 64
continuous variables and Spearman correlation coefficients were estimated for
categorical variables. While all correlations were estimated in one comprehensive matrix,
they are presented here in separate estimated bivariate correlation tables in order to
facilitate their display and for ease of interpretation. All statistically significant
relationships identified in the comprehensive matrix are included here. Furthermore, all
variables’ correlations with the dependent variables (NWEA MAP results) and the
highest level question predictor (mindset) are reported.
Each of the bivariate correlation matrices are presented and the most interesting
relationships as they relate to the research questions are highlighted. The results of the
estimated bivariate correlation matrices support the rejection of the null hypotheses. The
first null hypothesis stated there was no statistically significant relationship between
mindset score on the ITISCS and NWEA MAP performance. The following estimated
bivariate correlation matrices show that there was in fact a statistically significant
relationship between mindset scores and student performance on all NWEA MAP subject
tests when estimating Spearman’s and Pearson’s correlational coefficients. This result
was present when calculating mindset as a continuous variable (1-6 scores) and when
calculating mindset as a series of categorical variables (fixed vs. growth). The supporting
statistics are presented in this chapter.
The second null hypothesis stated that there was no statistically significant
relationship between subgroup factors and the ability of mindset to predict performance
on the NWEA MAP. The following estimated bivariate correlation matrices indicate that
there was in fact a number of statistically significant relationships that impacted
mindset’s ability to predict performance across all NWEA MAP subject tests. Clear

ROLE OF MINDSET IN NWEA MAP TEST PERFORMANCE 65
groups of variables emerged from the results demonstrating that there are variables that
correlate with higher NWEA MAP performance beyond mindset scores and other
variables that correlate with lower NWEA MAP performance beyond mindset scores.
These individual correlations and their level of statistical significance are evaluated in
Table 17. Correlation coefficients for a two tailed test between dependent variables Math,
Reading, and Language percentile performance on the NWEA MAP assessment and
independent variables mindset score, attendance, and GPA are also presented in Table 17.
Table 17
Estimated Pearson’s Correlation Coefficients for Continuous Variables
~p<.10, *p<.05, **p<.01, ***p<.001
Of the three NWEA MAP subject tests: Math, Reading, and Language, mindset scores all
had a small to moderate positive correlation (.288,.236, and .244 respectively) at a p
value <.001 with mindset. The results suggest that the higher a student’s mindset score,
the higher the percentile performance will be across subject tests. Grade Point Average
(GPA) had a large estimated correlation with Math (.505) and Reading (.539) subject
tests at p<.001. While GPA and MAP Language performance had a moderate to large
estimated correlation (.425) at a p<.01. Each of the MAP subject tests had large
estimated correlations with each other at statistically significant p values (<.001). The
GPA and inter-MAP estimated correlations are to be expected as theory suggests that
Math
Map %ile
Reading
Map %ile
Language
Map %ile
ITISCS Absences GPA
Math Map %ile -
Reading Map %ile .645*** -
Language Map %ile .511*** .580*** -
ITISCS .228**
*
.236*** .244*** -
Attendance -.054 -.020 -.075 -.175** -
Grade Point Average .505*** .539*** .425*** .167** -.207*** -

ROLE OF MINDSET IN NWEA MAP TEST PERFORMANCE 66
these values would correlate with latent factor g. Furthermore, GPA and mindset
demonstrated a small positive estimated correlation (.167) at p<.01.
Table 18 evaluates the relationships between race, MAP performance, and
mindset. Race as an independent control variable, mindset as the independent predictor
variable and NWEA MAP subject test percentile performance as the dependent variable
are presented.
~p<.10, *p<.05, **p<.01, ***p<.001
As expected GPA and MAP scores were highly correlated as stated above, which
further supports the predictive validity of mindset score when related to overall academic
achievement. These findings support the rejection of both null hypotheses. Attendance
did not have a statistically significant relationship with any of the dependent variables but
did have a small to moderate, negative estimated correlation with mindset (-.207) at a p
Table 18
Mindset, NWEA MAP Performance, and Racial ID Estimated correlations
(Spearman’s)
Math
Map %i
le
Read
Map %i
le
Lang
Map %i
le
ITISC
S
Cauc. Afr.
Ame
r.
Asian Pac.
I.
Nat.
Amer
.
Math
Map %ile
-
Read Map %ile .627** -
Lang Map %ile .449** .508** -
ITISCS .229** .234** .244** -
Caucasian -.008 .013 -.034 .040 -
African Amer. -.107 -.107 -.099 -
.118*
-
.555**
-
Asian .007 .014 .054 -.006 -
.581**
-.039 -
Pacific Islander .119* .104 .048 .022 -
.371**
-.025 -.026 -
Native
American
.047 .000 .097 .062 -
.371**
-.025 -.026 -.017 -

ROLE OF MINDSET IN NWEA MAP TEST PERFORMANCE 67
value<.01 (.002). While this estimated correlation is interesting, its evaluation is beyond
the scope of this study.
Table 18 presents a small negative Spearman’s estimated correlation (-.118)
between African American identification and mindset at p value<.05(.039). This
estimated correlation indicates that within the sample, being African American correlated
with having a lower mindset score. There was also a small positive Spearman’s
estimated correlation (.119) between Pacific Islander identification and Math MAP
percentile score at a p value<.05 (.038). Thus, in this sample, being a Pacific Islander
correlated with a high percentile ranking. While these findings are statistically
significant, the effects are small and generalizability is limited given the small
representation of these racial identifications in the sample size (African American n=11
and Pacific Islander n=5). These findings support the rejection of both null hypotheses
given the evidence that racial identification correlates with mindset, it is predicted that
this would impact mindset’s ability to predict MAP performance.
Table 19 presents mindset, NWEA MAP performance, and ethnicity estimated
correlations. The table displays small to moderate negative Spearman’s estimated
correlations between Math MAP percentile and Reading MAP percentile scores for
participants that identify as Hispanic (-.201 and -.155).

ROLE OF MINDSET IN NWEA MAP TEST PERFORMANCE 68
Table 19
Mindset, NWEA MAP Performance, and Ethnicity Identification Estimated correlations
(Spearman’s)
Math Map %ile
Read Map %ile
Lang Map %ile
ITISCS Hispanic 1/0
Math
Map %ile
-
Read
Map %ile
.627** -
Lang
Map %ile
.449** .508** -
ITISCS .229** .234** .244** -
Hispanic 1/0 -.201** -.155** -.079 -.080 -
~p<.10, *p<.05, **p<.01, ***p<.001
These estimated correlations were statistically significant at a p<.001 for math (.000) and
p<.01 for reading (.006). According to the results for this sample, Hispanic student
identification correlated with lower reading and math percentile performance.
Interestingly, there was no statistically significant relationship between Hispanic student
identification and mindset score. The non-significant Spearman estimated correlation
coefficient was -.08. Therefore, according to this sample, there is no statistically
significant relationship between ethnicity and mindset score. However, given the
statistically significant relationship between Hispanic ethnicity and MAP performance,
participant ethnicity would likely have a statistically significant impact on mindset’s
estimated correlation or ability to predict MAP performance. This finding supports the
rejection of the second null hypothesis.
The Spearman’ estimated correlations between mindset, NWEA MAP
Performance, and educational program participation are presented in Table 20.

ROLE OF MINDSET IN NWEA MAP TEST PERFORMANCE 69
Table 20
Mindset, NWEA MAP Performance, and Educational Program Participation Estimated
Correlations (Spearman’s)
Math
Map %il
e
Read
Map %il
e
Lang
Map %il
e ITISCS Gender
Special
Ed
Gifted
Ed
Title I
Y/N(SE
S)
Math Map %ile -
Read Map %ile .627**
-
Lang Map %ile .449**
.508**
-
ITISCS .229**
.234**
.244**
-
Gender -.039 .108 .151**
.050 -
Special Ed. -.192**
-.177**
-.220**
-.101 -.021 -
Gifted Ed .395**
.334**
.234**
.043 -.085 -.117* -
Title I Y/N
(SES) -.297
** -.278
** -.140
* .010 .013 .064 -.116
* -
~p<.10, *p<.05, **p<.01, ***p<.001
Of the four other variables, gender only had a small positive estimated correlation (.151)
with the Language MAP score. This estimated correlation was statistically significant at
a p value<.01 (p=.008). Therefore, in this sample, being female had a small positive
estimated correlation with Language percentile performance. Special Education program
participation had a small negative estimated correlation with Math (-.192), Reading (-
.177), and Language (-.220) MAP performance. Math (.001), Reading (.002), and
Language (.000) were all statistically significant at p values<.01. Gifted Education
program participation had positive moderate estimated correlations with Math (.395) and
Reading (.334) MAP performance, and a small to moderate positive estimated
correlations with Language (.234) performance. These estimated correlations were all
statistically significant at p values<.001. Finally, Title I program participation had
moderate negative estimated correlations with Math (-.297) and Reading (-.278) MAP
performance and a small negative estimated correlation with Language (-.140) MAP
performance. Math and Reading estimated correlations with Title I were significant at p

ROLE OF MINDSET IN NWEA MAP TEST PERFORMANCE 70
values<.001 and Language and Title I estimated correlations were significant at a p
value<.05 (.014).
There was no statistical significant estimated correlation between educational
program participation and mindset scores. However, the estimated correlation between
Special Education participation and mindset score displayed in Table 20 is worth
reviewing as it approaches statistical significance at the .05 level. Given the small
representation of Special Education in the sample (n=16 or 5%), it is a noteworthy
finding. Special Education participation had a small negative estimated correlation (-.101)
with mindset score. While this relationship was not statistically significant, the p value of
this estimated correlation was .077, which is approaching statistical significance. This
relationship is important to identify given the elevated frequency of the special education
student’s identification as fixed minded when compared to non-special education students
(See Table 16).
Table 21 displays the estimated correlations between mindset, MAP subject test
performance and year in school measured by grade level.
Table 21
Mindset, NWEA MAP Performance, and Year in School Estimated Correlations
(Spearman’s)
Math
Map
%ile
Read
Map
%ile
Lang
Map
%ile
ITISCS Grade 6 Grade 7 GRADE 8
Math Map %ile -
Read Map %ile .627** -
Lang Map %ile .449** .508** -
ITISCS .229** .234** .244** -
GRADE 6 -.296** -.099 -.152** -.172** -
GRADE 7 .049 .024 .095 .058 -.498** -
GRADE 8 .246** .075 .056 .114* -.498** -.505** -
~p<.10, *p<.05, **p<.01, ***p<.001

ROLE OF MINDSET IN NWEA MAP TEST PERFORMANCE 71
Sixth grade students demonstrated a small to moderate negative estimated correlation
across Math (-.296), and Language (-.152) MAP performance, as well as mindset score (-
.172). Math (p=.000) and Language (.008) MAP performance and mindset (.002)
estimated correlations were statistically significant at a p value<.01. Being part of the 6th
grade cohort predicted an overall lower Math and Language MAP score, as well as a
lower mindset score. Conversely, Table 21 displays that 8th
grade students demonstrated
a small to moderate positive estimated correlation with Math MAP (.246) performance
and mindset scores (.114). Eighth grade Math MAP performance’s positive estimated
correlation was statistically significant at a p value<.001 (.000) and mindset positive
estimated correlations were statically significant at a p value<.05(.046). Thus, being part
of the 8th
grade cohort predicted an overall higher math and mindset score.
Table 22 demonstrates Spearman’s estimated correlations between Dweck’s
identified mindset categories (Fixed, Growth, and Neutral), the continuous mindset scale:
ITISCS, and MAPS subject test performance.

ROLE OF MINDSET IN NWEA MAP TEST PERFORMANCE 72
Table 22
Continuous vs Categorical Mindset Estimated Correlations with MAP Subject
Performance
Math
Map %ile
Reading
Map %ile
Language
Map %ile
ITISCS Fixed Neutral Growth
Math Map %ile -
Reading
Map %ile
.627** -
Language
Map %ile
.449** .508** -
ITISCS .229** .234** .244** -
Fixed -.235**
-.224** -.250** -
.788**
-
Neutral -.031 -.051 .036 -
.193**
-
.312**
-
Growth .238** .243** .198** .868** -
.662**
-
.506**
-
~p<.10, *p<.05, **p<.01, ***p<.001
Consistent with the continuous mindset measure, growth and fixed mindset
categorical classifications had a small to moderate, statistically significant estimated
correlation with each MAP subject performance at p<.001. Conversely, neutral mindset
scores had no statistically significant relationship with MAP subject performance.
Therefore, there was a small to moderate positive estimated correlation between growth
mindedness and performance on MAP subject tests and a small to moderate negative
estimated correlation between fixed mindedness and performance on MAP subject tests.
These results support the rejection of the first null hypothesis as the Spearman’s
estimated correlations demonstrate there is a statistically significant relationship between
mindset and MAP performance across all three MAP subject tests. These effects while
small, are consistent across MAP subject tests. Furthermore, there are large Spearman’s
estimated correlations between ITISCS continuous scores and the categorical
classifications of growth and fixed mindsets. The large Spearman’s estimated

ROLE OF MINDSET IN NWEA MAP TEST PERFORMANCE 73
correlations between continuous ITISCS score and growth mindedness (.868) and fixed
mindedness (-.788) were both statistically significant at p<.001. These results support the
use of the ITISCS score as a continuous measure in the regression models that follow.
Bivariate correlations were estimated using Pearson’s and Spearman’s estimated
correlation statistical procedures. All variables were examined simultaneously in one
comprehensive matrix using SPSS in order to identify and evaluate all estimated
correlational relationships. These variables were presented in Tables 17,18,19,20,21, and
22 in separate thematic estimated correlation matrices in order to simplify interpretation
and highlight variable groupings. The estimated bivariate correlations provide evidence
in support of the rejection of both null hypotheses. The evidence in support of the
rejection of the first null hypothesis is based on the consistently statistically significant
relationships identified in the estimated correlation matrices between mindset and MAP
performance. This evidence supports a small to moderate positive relationship between a
student’s mindset score and MAP performance across subject tests. Higher mindset
scores are consistently associated with higher MAP performance across Reading, Math,
and Language subtests. The evidence in support of rejecting the second null hypothesis
is based on the statistically significant relationships identified between mindset and
demographic variables as well as MAP performance and demographic variables. Control
variables were identified that had positive and negative impacts on student scores. The
control variables that were identified with the strongest positive estimated correlations
with MAP performance were GPA and gifted educational program status. Thus, those
identified as being in the gifted program were more likely to have higher MAP
performance scores. A higher GPA also correlated with higher MAP scores. On the

ROLE OF MINDSET IN NWEA MAP TEST PERFORMANCE 74
other hand, participation in special education, the Title I program (low SES), and
Hispanic ethnic identity all correlated with lower MAP scores. Given these results,
subgroup factors played a statistically significant role in mindset scores’ ability to predict
MAP performance leading to a rejection of the second null hypothesis. The preceding
estimated bivariate correlation results were used as a guide in constructing the following
hierarchical regression models.
Multiple Regression Models and Prototypical Plots. A series of nested hierarchical
regression models were constructed for each of the NWEA MAP subject tests in order to
test the two null hypotheses. Models were constructed for each of the subject tests using
identical hierarchical models in order to consistently test the null hypotheses across each
of the subject tests. Consistent with the results from the estimated bivariate correlation
matrices, the following results from the fitted regression models support the rejection of
both null hypotheses. This section contains five models constructed for each subject test
as the dependent variable, Math, Reading, and Language NWEA MAP. A number of
prototypical plots were constructed in order to highlight variables in the selected models
that had the greatest impact on predicting NWEA MAP performance. It is important to
note while interpreting the following regression models that unstandardized betas are
reported in the models. The unstandardized betas represent actual percentile points on
the standardized NWEA MAP tests. These unstandardized betas were selected for
reporting purposes here for ease of interpretation and because they represent betas on an
already standardized percentile scale (NWEA MAP, 2004).
Math, Reading, and Language hierarchical regression models demonstrated
consistent results across the models and subject tests. Model 5 in each of the taxonomy

ROLE OF MINDSET IN NWEA MAP TEST PERFORMANCE 75
of models was chosen as the model of best fit because they represented the most accurate
results for the predictor and control variables, as well as the most robust overall R
squared and R squared change statistic. Controlling for gender, ethnicity, race, SES,
special education participation, gifted participation, GPA, attendance, and grade level,
statistically significant, unstandardized beta weights for mindset scores were identified.
Across NWEA MAP subject specific models, model 5 provided consistent evidence to
support the rejection of the first null hypothesis. Across Math, Reading, and Language
tests, at p<.01, higher mindset scores were associated with higher percentile performance.
Unstandardized betas representing actual percentile point performance units for Math
(1.995), Reading (3.067), and Language (2.797) revealed a statistically significant
positive MAP performance trend as mindset scores increased. The second null
hypothesis’s rejection was also supported by the consistent results across Math, Reading,
and Language selected models. Selected models for each subject had a range of 3-5
statistically significant control variables, (excluding year in school) which demonstrated a
statistically significant relationship among subgroup factors impacting mindsets ability to
predict NWEA MAP performance. The following section explores each of the models
individually and the resulting evidence which supports the rejection of both null
hypotheses.
Math MAP Regression Models and Prototypical Plots. Table 23 represents the
hierarchal taxonomy of five multiple regression models constructed with NWEA MAP
Math subject performance as the dependent variable.
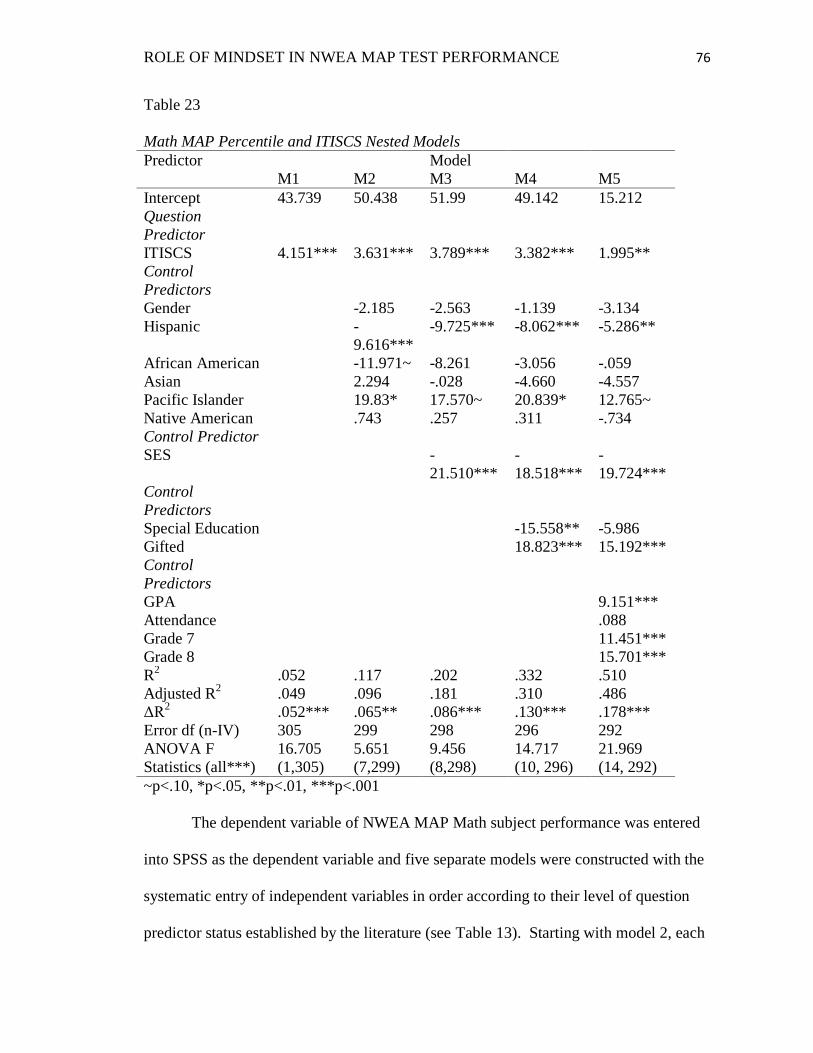
ROLE OF MINDSET IN NWEA MAP TEST PERFORMANCE 76
Table 23
Math MAP Percentile and ITISCS Nested Models
Predictor Model
M1 M2 M3 M4 M5
Intercept 43.739 50.438 51.99 49.142 15.212
Question
Predictor
ITISCS 4.151*** 3.631*** 3.789*** 3.382*** 1.995**
Control
Predictors
Gender -2.185 -2.563 -1.139 -3.134
Hispanic -
9.616***
-9.725*** -8.062*** -5.286**
African American -11.971~ -8.261 -3.056 -.059
Asian 2.294 -.028 -4.660 -4.557
Pacific Islander 19.83* 17.570~ 20.839* 12.765~
Native American .743 .257 .311 -.734
Control Predictor
SES -
21.510***
-
18.518***
-
19.724***
Control
Predictors
Special Education -15.558** -5.986
Gifted 18.823*** 15.192***
Control
Predictors
GPA 9.151***
Attendance .088
Grade 7 11.451***
Grade 8 15.701***
R2 .052 .117 .202 .332 .510
Adjusted R2 .049 .096 .181 .310 .486
ΔR2 .052*** .065** .086*** .130*** .178***
Error df (n-IV) 305 299 298 296 292
ANOVA F
Statistics (all***)
16.705
(1,305)
5.651
(7,299)
9.456
(8,298)
14.717
(10, 296)
21.969
(14, 292)
~p<.10, *p<.05, **p<.01, ***p<.001
The dependent variable of NWEA MAP Math subject performance was entered
into SPSS as the dependent variable and five separate models were constructed with the
systematic entry of independent variables in order according to their level of question
predictor status established by the literature (see Table 13). Starting with model 2, each

ROLE OF MINDSET IN NWEA MAP TEST PERFORMANCE 77
model contained the same question and control predictors (independent variables) as the
previous model nested within it, and then introduced additional control variables. This
procedure is referred to as nested hierarchical modeling because each subsequent model
includes the previous model as the model raises in number culminating in the final model,
which includes all variables. Only the model chosen as the model of best fit, model 5,
will be reviewed in-depth here, however all statistics for each model can be reviewed in
Table 23.
Model 5 was chosen as the model of best fit because it had the highest, R squared
and adjusted R squared values, includes the highest number of statistically significant
predictor variables, and because it controlled for variables identified in the literature as
theoretically important. Prior to interpreting model 5, the ratio of cases to IVs was
evaluated and multiple regression assumptions of linearity, normality, homoscedasticity
and non-collinearity were checked. Results of model 5 provide evidence in support of
the rejection of null hypotheses 1 and 2. Controlling for gender, ethnicity, race, SES,
special education participation, gifted participation, GPA, attendance, and grade level,
there was a clear, statistically significant relationship between mindset score and Math
MAP performance. Furthermore, controlling for other IVs in the model, there were
statistically significant subgroup factors that impacted the ability of mindset as measured
by the ITISCS to predict student performance on the Math MAP assessment.
With an N of 307 and 14 independent variables, there was an average of 21.92
cases per IV, meeting the requirement according to the standard acceptable rule of thumb
for this ratio (Tabachnick & Fidell, 2013). The linearity assumption was established as
met through an eyeball analysis of scatterplots generated through SPSS. The normality

ROLE OF MINDSET IN NWEA MAP TEST PERFORMANCE 78
assumption was established as met by evaluating the histogram and P-P Plots generated
through SPSS. Normality, linearity and homoscedasticity of the residuals was evaluated
through evaluation of the residual plots generated in SPSS, which supported that the
assumptions were met. Finally, the assumption of non-collinearity was met through
evaluation of the estimated bivariate correlation matrices and collinearity statistics in the
SPSS output. There was no missing data and no cases were removed as a results of the
assumption testing.
Model 5 containing all 14 predictor and control variables produced an R²= .510,
F(14, 292)= 21.969, p<.001. Thus, model 5’s R² indicates that 51% of the variance in
Math MAP assessment scores can be explained by the combined independent variables
contained in the model. As can be seen in Table 23, mindset measured on the ITISCS
had a statistically significant (p<.01) positive beta weight of 1.995. Thus, when
controlling for gender, ethnicity, race, socioeconomic status, educational program, GPA,
attendance, and grade level; higher mindset scores were associated with higher Math
MAP percentile performance. According to the regression equation when controlling for
the other predictors in the model, each one unit increase in mindset on the scale of 1-6
would result in an increased student’s percentile score of 1.995 percentile points. Thus, a
score of 6 on the ITISCS would result in a predicted increase of 11.97 (1.995 x 6)
percentile points. This relationship provides significant evidence in support of the
rejection of null hypothesis number 1, as there is a strong, positive statistically significant
relationship between mindset score and performance on the NWEA MAP Math
assessment.

ROLE OF MINDSET IN NWEA MAP TEST PERFORMANCE 79
Controlling for each of the included predictor variables, model 5 identified four
statistically significant subgroup factors that influenced mindsets prediction of Math
MAP performance. Thus, significant evidence is present for the rejection of the second
null hypothesis based on the results of the following four variables; ethnicity,
socioeconomic status, educational program, and GPA. Controlling for ITISCS score,
gender, race, socioeconomic status, educational program, GPA, attendance, and grade
level; ethnic identification as Hispanic was associated with lower predicted Math MAP
percentile performance. At p<.01, Hispanic identified students were predicted to perform
5.286 percentile points lower on the Math MAP assessment. Similarly, lower
socioeconomic status was associated with a negative impact on Math MAP performance.
Controlling for ITISCS scores, gender, ethnicity, race, educational program, GPA,
attendance, and grade level; socioeconomic status measured by participation in the Title I
program predicted that a student would score 19.724 percentile points lower on the Math
MAP assessment (at p<.001). Conversely, student participation in the gifted educational
program was associated with higher performance on the Math MAP assessment.
Controlling for ITISCS scores, gender, ethnicity, race, socioeconomic status, special
education program participation, GPA, attendance, and grade level; gifted program
participation is associated with higher Math MAP percentile performance. At p<.001,
students participating in the gifted program were predicted to perform 15.192 points
higher on the Math MAP assessment than those not participating in the gifted program.
GPA was the final variable that was identified in model 5 as having a statistically
significant impact on Math MAP performance. Controlling for ITISCS scores, gender,
ethnicity, race, socioeconomic status, special education program participation, gifted

ROLE OF MINDSET IN NWEA MAP TEST PERFORMANCE 80
program participation, attendance, and grade level, GPA was positively associated with
higher Math MAP percentile performance. At p<.001, students were predicted to
perform 9.151 percentile points higher on the Math MAP assessment per unit of GPA.
Results from model 5 clearly support the rejection of both null hypotheses. In
order to more clearly demonstrate these findings, some of the variables’ impact have been
highlighted in the prototypical plots that follow (Figure 1 & Figure 2). The two variables
that will be highlighted below are ethnicity and socioeconomic status. In order to
illustrate the impact of these variables, the regression equation was entered into Excel in
order to produce prototypical plots based on the model 5 equation. Table 24 shows the
generic regression equation, the regression equation with specified variables, and
provides a variable key.
Table 24
Math Map Model 5 Regression Equation
Generic Equation:
Y=15.212+(1.995*X1)+(-3.134* X2)+(-5.286*X3)+(-.059*X4)+(-4.557*
X5)+(12.765* X6)+(-.734* X7)+(-19.724* X8)+(-5.986 X9)+(15.192* X10)+
(9.151* X11)+(.088* X12) + (11.451 X13)+15.701* X14)
Solved for Equation in Excel:
Y=15.212+(1.995*1-6)+(-3.134*1)+(-5.286*1)+(-0.059*0)+(-4.557*0)+(12.765*0)+
(-0.734*0)+(-19.724*0/1)+(-5.986*0)+(15.192*0)+(9.151*3.2722)+ (0.088*7.5251)
+(11.451*1)+(15.701*0)
Variable Labels:
X1=ITISCS, X2=gender, X3=Ethnicity, X4=African American, X5=Asian,
X6=Pacific Islander, X7=Native American, X8=SES, X9=SPED, X10=Gifted,
X11=GPA, X12=Absences, X13=Grade 7, X14=Grade 8
Figure 1 graphs the estimated regression equation in Table 24 generated in Excel
for Hispanic and non-Hispanic students across possible mindset scores on the ITISCS
solved for a student with the remaining variables set at the following: female student,

ROLE OF MINDSET IN NWEA MAP TEST PERFORMANCE 81
Caucasian, non-gifted, non-special education, non-Title I, 7th
grader with the mean GPA
(3.27), and the average number of periods absent (7.5).
Figure 1. Impact of being Hispanic on math percentile scores across possible ITISC
scores*.
Figure 1 demonstrates that across possible mindsets as measured by the ITISCS, there
was a persistent achievement gap on the Math MAP assessment between those that
identified as Hispanic and non-Hispanic. Mindset’s ability to predict Math MAP
performance was significantly mediated by a student’s ethnicity, supporting the rejection
of the second null hypothesis.
According to the results of model 5, a student’s socioeconomic status also
significantly impacted mindset’s ability to predict student performance on the Math MAP
assessment as demonstrated in Figure 2. Figure 2 graphs the regression equation in Table
24 generated in Excel for Title I and non-Title I students across possible mindset scores
0
10
20
30
40
50
60
70
0 1 2 3 4 5 6 7
Mat
h M
AP
%ile
Sco
re
ITISCS Scores
Hispanic
Non-Hispanic
*Female, Hispanic, Non-Gifted, Non-SPED, 7th grade student with mean GPA of 3.27 and 7.5 periods absent

ROLE OF MINDSET IN NWEA MAP TEST PERFORMANCE 82
on the ITISCS solved for students with the remaining variables set at the following:
female, non-Hispanic, Caucasian student, non-gifted, non-special education, in 7th grade
with the mean GPA (3.27), and the average number of periods absent (7.5). Figure 2
demonstrates that there was a significant achievement gap between Title I and non-Title I
students across all possible mindset scores on the ITISCS. This persistent achievement
regardless of mindset scores supports the rejection of the second null hypothesis because
Title I subgroup identification did have a statistically significant impact at a large effect
size on mindset’s ability to predict Math MAP performance.
Figure 2. Impact of Title I status on math MAP percentile scores* across possible ITISC
scores.
The nested taxonomy of regression models developed for Math MAP
performance and the highlighted variables in the prototypical plots support the rejection
of both null hypotheses. There was evidence of a statistically significant relationship
between mindset scores on the ITISCS and student performance on the NWEA Math
MAP assessment and this relationship was mediated by a statistically significant
0
10
20
30
40
50
60
70
0 1 2 3 4 5 6 7
Mat
h M
AP
%ile
ITISC Scores
Non-Title I
Title I
*Female, Hispanic, Non-Gifted, Non-SPED, 7th grade student with mean GPA of 3.27 and 7.5 periods absent

ROLE OF MINDSET IN NWEA MAP TEST PERFORMANCE 83
relationship between Math MAP performance and subgroup identification. Model 5 was
chosen as the model of best fit to describe these relationships.
Reading MAP Regression Models and Prototypical Plots. Table 25 represents
the hierarchal taxonomy of 5 multiple regression models constructed with NWEA MAP
Reading subject performance as the dependent variable. NWEA MAP Reading subject
performance was entered into SPSS as the dependent variable and 5 separate models
were constructed with the systematic entry of independent variables according to their
level of question predictor status established by the literature (see Table 13). Starting
with model 2, each model contained the same question and control predictors
(independent variables) as the previous model nested within it, and then introduced
additional control variables. Only the model chosen as the model of best fit, model 5,
will be reviewed in-depth here, however all statistics for each model can be reviewed in
Table 25.

ROLE OF MINDSET IN NWEA MAP TEST PERFORMANCE 84
Table 25
Reading MAP Percentile and ITISCS Nested Models
~p<.10, *p<.05, **p<.01, ***p<.001
Model 5 was chosen as the model of best fit because it had the highest, R squared
and adjusted R squared values, included the highest number of statistically significant
predictor variables, and because it controlled for variables identified in the literature as
theoretically important. Prior to interpreting model 5, the ratio of cases to independent
variables was evaluated and multiple regression assumptions of linearity, normality,
Predictor Model
M1 M2 M3 M4 M5
Intercept 51.245*** 52.591*** 54.178*** 52.817*** 11.794~
Question
Predictor
ITISCS 4.452*** 3.989*** 4.150*** 3.692*** 3.067**
Control
Predictors
Gender 4.175 4.431~ 5.530* 1.53
Hispanic -4.652~ -4.762~ -3.358 -.580
African American -13.245~ -9.477 -4.338 2.880
Asian .953 -1.405 -5.507 -.895
Pacific Islander 16.44 14.147 16.362~ 10.808
Native American -1.209 -1.702 -1.719 -2.266
Control Predictor
SES -21.852*** -19.147*** -15.286***
Control
Predictors
Special Education -21.031*** -11.363*
Gifted 14.223*** 10.178***
Control
Predictors
GPA 12.257***
Attendance .252*
Grade 7 3.663
Grade 8 3.144
R2 .056 .093 .175 .283 .414
Adjusted R2 .053 .071 .153 .258 .386
ΔR2 .056*** .037~ .083*** .107*** .132***
Error df (n-IV) 305 299 298 296 292
ANOVA F
Statistics (all***)
18.046
(1,305)
4.359
(7,299)
7.915
(8,298)
11.659
(10,296)
14.746
(14,292)

ROLE OF MINDSET IN NWEA MAP TEST PERFORMANCE 85
homoscedasticity and non-collinearity were checked. Results of model 5 provide
evidence in support of the rejection of null hypotheses 1 and 2. There was a clear,
statistically significant relationship between mindset score and Reading MAP
performance and there were statistically significant subgroup factors that impact the
ability of mindset as measured by the ITISCS to predict student performance on the
Reading MAP assessment.
With an N of 307 and 14 independent variables, there was an average of 21.92
cases per IV, meeting the requirement according to the standard acceptable rule of thumb
for this ratio (Tabachnick & Fidell, 2013). The linearity assumption was established as
met through an eyeball analysis of the scatterplots generated through SPSS. The
normality assumption was established as met by evaluating the histogram and P-P Plots
generated through SPSS. Normality, linearity and homoscedasticity of the residuals was
evaluated through evaluation of the residual plots generated in SPSS, which supported
that the assumptions were met. Finally, the assumption of non-collinearity was met
through evaluation of the estimated bivariate correlation matrices and collinearity
statistics in the SPSS output. There were no missing data and no cases were removed as
a results of the assumption testing.
Model 5 containing all 14 predictor and control variables produced an R²= .414,
F(14, 292)= 14.746,p<.001. Thus, given model 5’s R² results, 41.4% of the variance in
Reading MAP assessment performance was explained by the combined independent
variables contained in the model. As can be seen in Table 25, mindset measured on the
ITISCS had a statistically significant (p<.01) positive beta weight of 3.067. Thus, when
controlling for gender, ethnicity, race, socioeconomic status, educational program, GPA,

ROLE OF MINDSET IN NWEA MAP TEST PERFORMANCE 86
attendance, and grade level, higher mindset scores were associated with higher Reading
MAP percentile performance. According to the regression equation, when controlling for
the other predictor variables, each one unit increase in mindset on the scale of 1-6
resulted in an increased student’s percentile score of 3.067 percentile points. Thus, a
score of 6 on the ITISCS would result in a predicted increase of 18.402 (3.067 x 6)
percentile points. This relationship provides significant evidence in support of the
rejection of null hypothesis number 1, as there was a strong, positive statistically
significant relationship between mindset score and performance on the NWEA MAP
Reading assessment.
Model 5 results represented in Table 25 identified five statistically significant
subgroup factors that impacted mindset’s prediction of Reading MAP performance. Thus,
significant evidence is present for the rejection of the 2nd null hypothesis based on the
results of the following four variables; socioeconomic status, special education program
participation, gifted education program participation, GPA, and number of absences.
Controlling for ITISCS score, gender, ethnicity, race, educational program, GPA,
attendance, and grade level, socioeconomic status measured by Title I program
participation was associated with lower Reading MAP percentile performance. At p<.01,
Title I program identified students were predicted to perform 15.286 percentile points
lower on the Reading MAP assessment. Similarly, special education program
participation was associated with a negative impact on Reading MAP performance.
Controlling for ITISCS scores, gender, ethnicity, race, gifted educational program, Title I
program, GPA, attendance, and grade level; special education program participation
predicted that a student would score 11.363 percentile points lower on the Reading MAP
ROLE OF MINDSET IN NWEA MAP TEST PERFORMANCE 87
assessment at p<.05. Conversely, student participation in the gifted educational program
was associated with higher performance on the Reading MAP assessment. Controlling
for ITISCS scores, gender, ethnicity, race, socioeconomic status, special education
program participation, GPA, attendance, and grade level, gifted program participation
was associated with higher Reading MAP percentile performance. At p<.001, students
were predicted to perform 10.178 percentile points higher on the Reading MAP
assessment than those that were not participants in the gifted program. Controlling for
ITISCS scores, gender, ethnicity, race, socioeconomic status, special education program
participation, gifted program participation, attendance, and grade level, GPA was also
identified in model 5 to have a statistically significant positive impact on Reading Map
performance. At p<.001, students were predicted to perform 12.257 percentile points
higher on the Reading MAP assessment per unit of GPA. Finally, controlling for ITISCS
scores, gender, ethnicity, race, socioeconomic status, special education program
participation, gifted participation, GPA, and grade level, higher absentee rates as
measured by periods missed were found in this model to be associated with higher
reading scores. However, according to the school administration, there was a consistent
pattern of high performing students struggling with attendance due to diagnoses of
anxiety, which may be responsible for these findings.
Results of model 5 clearly support the rejection of both null hypotheses. In order
to more clearly demonstrate these findings, some of the variables’ impact have been
highlighted in the prototypical plots that follow. The three variables that are highlighted
below are special education program participation, gifted education program participation,
and socioeconomic status. In order to illustrate the impact of these variables, the

ROLE OF MINDSET IN NWEA MAP TEST PERFORMANCE 88
regression equation was entered into Excel in order to produce prototypical plots based
on the model 5 equation. Table 26 shows the generic regression equation, the regression
equation with specified variables, and provides a variable key.
Table 26
Reading MAP Model 5 Regression Equation
Generic Equation:
Y=11.794+(3.067*X1)+(1.532 * X2)+(-.580 *X3)+(2.880 *X4)+(-.895 * X5)+(10.808*
X6)+(-2.266* X7)+(-15.286* X8)+(-11.363 X9)+(10.178* X10)+(12.257* X11)+(.252*
X12)+(3.663 X13)+3.144* X14)
Solved for Equation in Excel:
Y=11.794+(3.067*1-6)+(1.532 * 1)+(-.580 *1)+(2.880 *0)+(-.895 * 0)+(10.808* 0)+
(-2.266* 0)+(-15.286* 1/0)+(-11.363 *0)+(10.178* 0)+(12.257*
3.2722)+(.252*7.5251)+(3.663*1)+3.144* 0)
Variable Labels:
X1=ITISCS, X2=gender, X3=Ethnicity, X4=African American, X5=Asian,
X6=Pacific Islander, X7=Native American, X8=SES, X9=SPED, X10=Gifted,
X11=GPA, X12=Absences, X13=Grade 7, X14=Grade 8
Similar to the findings of the Math MAP model 5, Reading MAP Model 5
identified a number of subgroup factors with statistically significant relationships that
impacted mindset’s ability to predict performance on the Reading MAP assessment.
Title I status, Special Education program participation, gifted program participation are
highlighted below in Figures 3, 4, and 5 respectively.

ROLE OF MINDSET IN NWEA MAP TEST PERFORMANCE 89
Figure 3. Impact of Title I Status on Reading Map Percentile Scores* Across Possible
ITISCS Scores
Figure 4. Impact of Gifted Program Identification on Reading Percentile Scores* Across
Possible ITISC Scores
0
10
20
30
40
50
60
70
80
90
0 1 2 3 4 5 6 7
Rea
din
g M
AP
%ile
Sco
re
ITISC Score
Non Title I
Title I
0
10
20
30
40
50
60
70
80
90
100
0 1 2 3 4 5 6 7
Rea
din
g M
ap %
ile S
core
ITISC Score
Non-Gifted
Gifted

ROLE OF MINDSET IN NWEA MAP TEST PERFORMANCE 90
Figure 5. Impact of Special Education Program Identification on Reading MAP
Percentile Scores* Across Possible ITISCS Scores
Language MAP Regression Models and Prototypical Plots. Table 27 presents
the hierarchal taxonomy of five multiple regression models constructed with NWEA
MAP Language subject performance as the dependent variable. The dependent variable
of NWEA MAP Language subject performance was entered into SPSS as the dependent
variable and 5 separate models were constructed with the systematic entry of independent
variables entered in order according to their level of question predictor status established
by the literature (see Table 13). Starting with model 2, each model contained the same
question and control predictors (independent variables) as the previous model nested
within it, and then introduced additional control variables. Only the model chosen as the
model of best fit, model 5, will be reviewed in-depth here, however all statistics for each
model can be reviewed in Table 27.
Model 5 was chosen as the model of best fit because it had the highest, R squared
and adjusted R squared values, included the highest number of statistically significant
0
10
20
30
40
50
60
70
80
90
0 1 2 3 4 5 6 7
Rea
din
g M
AP
%ile
Sco
res
ITISC Scores
Non-Sped
Sped

ROLE OF MINDSET IN NWEA MAP TEST PERFORMANCE 91
predictor variables, and because it controlled for variables identified in the literature as
theoretically important. Prior to interpreting model 5, the ratio of cases to IVs was
evaluated and multiple regression assumptions of linearity, normality, homoscedasticity
and non-collinearity were checked. Results from model 5 provide evidence in support of
the rejection of null hypotheses 1 and 2. There was a clear, statistically significant
relationship between mindset score and Language MAP performance and there were
statistically significant subgroup factors that impacted the ability of mindset as measured
by the ITISCS to predict student performance on the Language MAP assessment.

ROLE OF MINDSET IN NWEA MAP TEST PERFORMANCE 92
Table 27
Language MAP Percentile and ITISCS Nested Models
Predictor Model
M1 M2 M3 M4 M5
Intercept 49.983**
*
50.085**
*
50.806*** 50.544*** 23.018**
Question
Predictor
ITISCS 4.349*** 3.900*** 3.973*** 3.542*** 2.797**
Control
Predictors
Gender 4.657~ 4.774* 5.531* 2.770
Hispanic -3.222 -3.273 -2.209 -.142
African American -8.300 -6.587 -2.147 1.901
Asian 3.297 2.224 -1.025 1.404
Pacific Islander 9.146 8.103 9.382* 5.269
Native American 2.394 2.170 2.112 1.475
Control Predictor
SES -9.933* -7.751* -5.874
Control
Predictors
Special Education -21.721*** -14.952**
Gifted 10.178** 7.483**
Control
Predictors
GPA 8.236***
Attendance .058
Grade 7 7.041*
Grade 8 3.996
R2 .059 .091 .110 .198 .280
Adjusted R2 .056 .069 .086 .171 .245
ΔR2 .059*** .031 .019* .089*** .081***
Error df (n-IV) 305 299 298 296 292
ANOVA F
Statistics (all***)
19.288
(1,305)
4.256
7,299)
4.589
(8,298)
7.323
(10,296)
8.099
14,292)
~p<.10, *p<.05, **p<.01, ***p<.001
With an N of 307 and 14 independent variables, there was an average of 21.92
cases per IV, meeting the requirement according to the standard acceptable rule of thumb
for this ratio (Tabachnick & Fidell, 2013). The linearity assumption was established as
met through an eyeball analysis of the scatterplot generated through SPSS. The
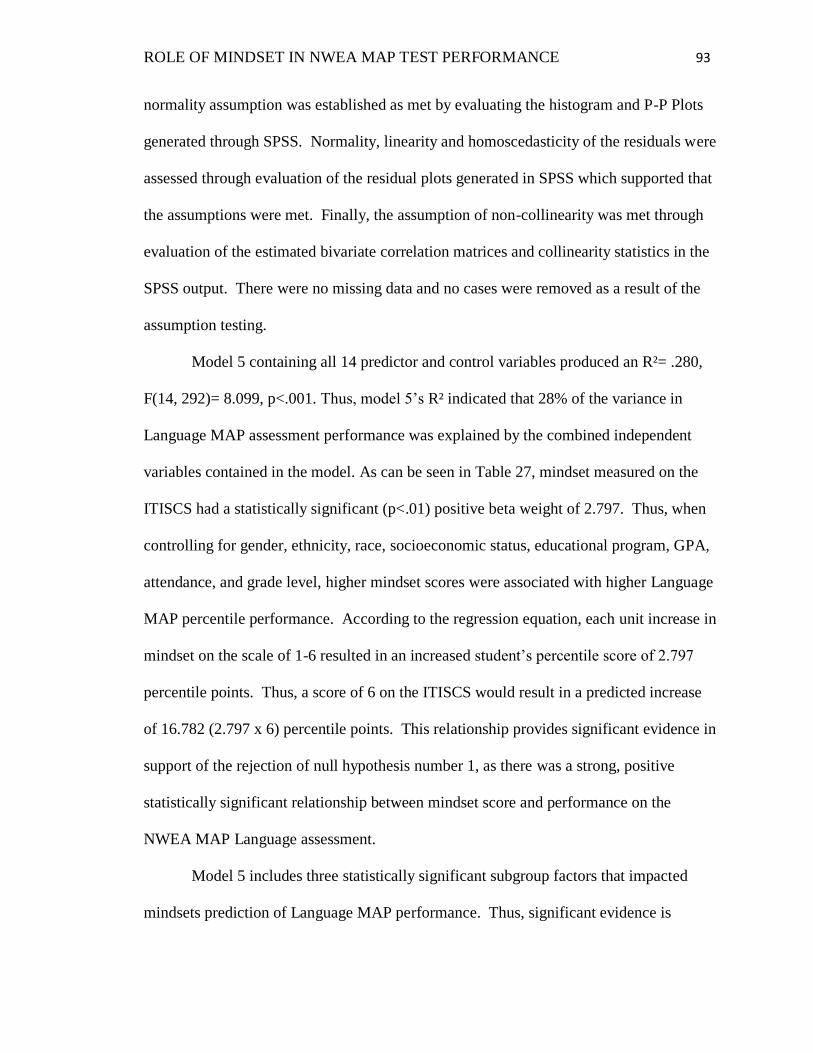
ROLE OF MINDSET IN NWEA MAP TEST PERFORMANCE 93
normality assumption was established as met by evaluating the histogram and P-P Plots
generated through SPSS. Normality, linearity and homoscedasticity of the residuals were
assessed through evaluation of the residual plots generated in SPSS which supported that
the assumptions were met. Finally, the assumption of non-collinearity was met through
evaluation of the estimated bivariate correlation matrices and collinearity statistics in the
SPSS output. There were no missing data and no cases were removed as a result of the
assumption testing.
Model 5 containing all 14 predictor and control variables produced an R²= .280,
F(14, 292)= 8.099, p<.001. Thus, model 5’s R² indicated that 28% of the variance in
Language MAP assessment performance was explained by the combined independent
variables contained in the model. As can be seen in Table 27, mindset measured on the
ITISCS had a statistically significant (p<.01) positive beta weight of 2.797. Thus, when
controlling for gender, ethnicity, race, socioeconomic status, educational program, GPA,
attendance, and grade level, higher mindset scores were associated with higher Language
MAP percentile performance. According to the regression equation, each unit increase in
mindset on the scale of 1-6 resulted in an increased student’s percentile score of 2.797
percentile points. Thus, a score of 6 on the ITISCS would result in a predicted increase
of 16.782 (2.797 x 6) percentile points. This relationship provides significant evidence in
support of the rejection of null hypothesis number 1, as there was a strong, positive
statistically significant relationship between mindset score and performance on the
NWEA MAP Language assessment.
Model 5 includes three statistically significant subgroup factors that impacted
mindsets prediction of Language MAP performance. Thus, significant evidence is

ROLE OF MINDSET IN NWEA MAP TEST PERFORMANCE 94
present for the rejection of the 2nd null hypothesis based on the results of the following
three variables; special education program participation, gifted education program
participation, and GPA. Controlling for ITISCS score, gender, ethnicity, race,
socioeconomic status, gifted education program participation, GPA, attendance, and
grade level, special education program participation was associated with lower Language
MAP percentile performance. At p<.01, special education program participants were
predicted to perform 14.952 percentile points lower on the Language MAP assessment.
Conversely, controlling for ITISCS scores, gender, ethnicity, race, socioeconomic status,
special education program participation, GPA, attendance, and grade level, gifted
program participation was associated with higher Language MAP percentile performance.
At p<.01, students in the gifted program were predicted to perform 7.483 percentile
points higher on the Language MAP assessment than those that were not participants in
the gifted program. Controlling for ITISCS score, gender, ethnicity, race, socioeconomic
status, special education participation, gifted education program participation, attendance,
and grade level, GPA was also identified in model 5 to have a statistically significant
positive impact on Language Map performance. At p<.001, students were predicted to
perform 8.236 percentile points higher on the Language MAP assessment per unit of
GPA.
Results of model 5 clearly support the rejection of both null hypotheses. In order
to more clearly demonstrate these findings, impact of special education program
participation has been highlighted in the prototypical plots that follow (Figure 6). In order
to illustrate the impact of these variables, the regression equation was entered into Excel
in order to produce prototypical plots based on the model 5 equation. Table 28 shows the

ROLE OF MINDSET IN NWEA MAP TEST PERFORMANCE 95
generic regression equation, the regression equation with specified variables, and
provides a variable key.
Table 28
Language MAP Model 5 Regression Equation
Generic Equation:
Y=23.018+(2.797*X1)+(2.770 * X2)+(-.142 *X3)+(1.901 *X4)+(1.404 * X5)+(5.269*
X6)+(1.475 * X7)+(-5.874* X8)+(-14.952 X9)+(7.483* X10)+(8.236* X11)+(.058*
X12)+(7.041*X13)+(3.996* X14)
Solved for Equation in Excel:
Y=23.018+(2.797*1-6)+( 2.770 * 1)+(-.142 *1)+(1.901 *0)+(1.404 * 0)+(5.269*
0)+(1.475 * 0)+(-5.874 * 1/2)+(-14.952*0)+(7.483*0)+(8.236* 3.2722)+(.058*
7.5251)+(7.041*1)+(3.996* 0)
Variable Labels:
X1=ITISCS, X2=gender, X3=Ethnicity, X4=African American, X5=Asian,
X6=Pacific Islander, X7=Native American, X8=SES, X9=SPED, X10=Gifted,
X11=GPA, X12=Absences, X13=Grade 7, X14=Grade 8
In order to highlight the role special education program participation had on mediating
mindset’s ability to predict student performance on the Language MAP assessment,
Figure 6 was developed.

ROLE OF MINDSET IN NWEA MAP TEST PERFORMANCE 96
Figure 6. Impact of Special Education Status on Language Percentile Scores* Across
ITISCS Scores
Results Conclusion
The findings of the statistical procedures conducted in this study provide clear
evidence for the rejection of both null hypotheses. The first null hypothesis was rejected
because a consistent statistically significant relationship was found between mindset
scores measured by the ITISCS and performance on the NWEA MAP assessments across
Math, Reading, and Language subject tests. The total possible predicted impact for the
highest mindset score on the ITISCS on student MAP performance (the difference
between a score of 1 and 6 on the ITISCS) measured in percentile points when
controlling for the other independent variables in the model was substantial (Math=11.97,
Reading=18.402, and Language=16.782). The second null hypothesis was rejected
because consistent, statistically significant relationships were found across MAP subject
tests where subgroup factors mediated mindset score’s ability to predict MAP
performance. The primary subgroup factors that were found to mediate mindset’s ability
0
10
20
30
40
50
60
70
80
90
0 1 2 3 4 5 6 7
Lan
guag
e M
AP
%ile
Sco
re
ITISC Score

ROLE OF MINDSET IN NWEA MAP TEST PERFORMANCE 97
to predict MAP performance were Hispanic ethnicity (negative impact: Math),
socioeconomic status (negative impact: Math and Reading), special education
participation (negative impact: Reading and Language), gifted education participation
(positive impact: Math, Reading, and Language), and GPA (positive impact: Math,
Reading, and Language). As demonstrated here, there was a clear relationship between
mindset and NWEA performance, which was mediated by subgroup factors.

ROLE OF MINDSET IN NWEA MAP TEST PERFORMANCE 98
Chapter V: Discussion
This chapter will discuss the findings of the study in order to respond to the stated
research question and contextualize the results. These questions will be responded to with
an overview of the findings, their connection to the theory described in the literature, the
potential limitations of the study, suggestions for further research, and finally
implications for practitioners.
The research question for this study was: What is the relationship between
mindset (entity vs. incremental beliefs) and student performance on the Northwest
Evaluation Association’s (NWEA) Measure of Academic Progress (MAP)? The sub-
questions of this study were; 1) What is the relationship between mindset (entity vs.
incremental beliefs) and student performance on the Northwest Evaluation Association’s
(NWEA) Measure of Academic Progress (MAP)? and 2) What is the relationship
between subgroup factors (demographics, academic program, academic achievement
measure by GPA, and time spent on the assessment) and mindset’s ability to predict
student performance on the NWEA MAP?
Overall, the findings of this study support the rejection of the null hypotheses.
The study found that mindset scores correlated with standardized test performance and
that subgroup factors mediated this relationship. The findings in this study both confirm
the research that has been done in connecting mindset to academic achievement outcomes
and extends the understanding of this relationship to include student performance on
standardized tests. While it has been established that student mindsets can predict
academic achievement (Blackwell et al., 2007; Dweck et al., 1995; Yeager, Walton, et al.,
2013), the evidence in support of a similar relationship between mindset scores and
standardized test achievement has been limited. In addition to contributing to the

ROLE OF MINDSET IN NWEA MAP TEST PERFORMANCE 99
understanding of the impact of mindset scores on standardized tests, this study also
highlights important subgroup factors that, controlling for mindset scores, have strong
relationships with test performance.
This study demonstrates that student mindset has a consistent measurable
relationship with student NWEA MAP performance. The researcher obtained student
assessment data for three separate subject test administrations (tests were given over the
course of 3 weeks) of the NWEA MAP subject tests in math, reading, and language.
When these results were compared to student mindsets through estimated bivariate
correlation tables and multiple regression analysis, a statistically significant relationship
was consistently identified. When measured in percentile points, controlling for gender,
ethnicity, race, SES, special education program participation, gifted education program
participation, GPA, attendance, and grade level, students who scored a 1(lowest)
compared to those scoring a 6 (highest) score on the mindset measure were predicted to
differ by 12 (Math), 18 (Reading), and 17 (Language) percentile points. Given the
documented manipulability of mindsets through interventions (Blackwell et al., 2007;
Yeager, Paunesku, et al., 2013) and the documented ability to deliver these interventions
at scale efficiently (Paunesku, 2013; Yeager, Walton, et al., 2013), these findings
represent a clear path forward for increasing student performance on standardized tests.
Through the evaluation of subgroup traits this study also helps to identify groups of
students who may benefit most from interventions.
Beyond establishing a link between student mindsets and standardized test
performance, this study also helps identify those who would most benefit from these
interventions. While the link between mindset and test performance was consistent

ROLE OF MINDSET IN NWEA MAP TEST PERFORMANCE 100
across subject tests, subgroup factors that mediated mindset’s ability to predict
standardized test performance varied by subject test. According to the results of this
study, depending on the subject test, specific groups were identified as performing better
or worse when controlling for mindset. For example on the math subject test, Hispanic
students performed (controlling for the measured independent variables including
mindset) 5 percentile points lower than non-Hispanic students. Students of lower SES
(controlling for the measured independent variables including mindset) were predicted to
score 20 percentile points lower than their higher SES counterparts. Gifted students on
the other hand (controlling for the measured independent variables including mindset)
were predicted to score an average of 15 percentile points higher on the math subject test.
The reading test yielded similar results. Students of lower SES background and special
education participants (controlling for the measured independent variables including
mindset) scored 15 and 11 percentile points lower than their higher SES and non-Special
Education counterparts. Consistent with math subject test performance, students
identified as gifted (controlling for all other independent variables including mindset)
were predicted to score 10 percentile points higher than their non-gifted peers. Finally,
the language subject test (controlling for the measured independent variables including
mindset) revealed that special education students were predicted to score 15 percentile
points lower than their non-special education peers while gifted students were predicted
to perform 7 percentile points higher than non-gifted students.
The consistency of these results across subject tests support the validity of the
findings. The three separate administrations of the NWEA MAP subject tests over a
period of 3 weeks and their consistent estimated correlation with mindset scores supports

ROLE OF MINDSET IN NWEA MAP TEST PERFORMANCE 101
the predictive validity of the mindset score. These findings provide evidence that
mindset scores have a consistent relationship with standardized test performance on the
NWEA MAP across subject tests. Furthermore, the impact of subgroup factors on test
performance provides guidance as to which groups of students would benefit the most
from mindset interventions. These findings are consistent with existing literature, while
also increasing the understanding of the relationship between mindset and standardized
test scores and the subgroup factors that influence this relationship.
Consideration of the Findings in the Context of Current Research
This study is a small part of a broader trend in educational research that has
increased attention and the allocation of research resources toward the study of non-
cognitive traits and their role in student achievement (Gutman & Schoon, 2013). This
trend seeks to broaden cold cognitive models to include the role of emotion and
motivation in academic achievement (Shell et al., 2010). To date, the empirical evidence
that has been collected regarding the role of mindset in student achievement has
established mindset as one of the dominant motivational constructs in the educational
research literature (Renaud-Dubé et al., 2015).
Mindset’s role in student academic achievement has been well documented
(Blackwell et al., 2007; Dweck, 2007; Dweck & Legget, 1988; Paunesku, 2013;
Paunesku et al. 2015; Romero, Paunesku, & Dweck, 2011; Yeager & Walton, 2011;
Yeager, Walton et al., 2013). This study sought to further the understanding of the role
of mindsets in a specific area of academic achievement, namely the relationship between
standardized test performance and mindset.
The findings of this study both confirm and challenge existing literature.
Duckworth et al., (2012), suggested that motivational constructs correlate higher with

ROLE OF MINDSET IN NWEA MAP TEST PERFORMANCE 102
GPA than with standardized test performance. This study found the opposite. As shown
in Table 17, mindset scores on the ITISCS were found to correlate with GPA at only .167
(p<.01) while mindset scores correlated with Math, Reading, and Language scores each
to a higher degree at a lower p value (.228, .236, and .244 respectively at p<.001). This
study also challenges the findings of Holmlund and Silva (2009) who found that non-
cognitive skills did not correlate with higher test performance. They found that non-
cognitive interventions, including those targeting motivation did not have an impact on
standardized test performance. The current study, while not establishing a causal link,
found evidence that mindset does in fact correlate with higher standardized tests scores.
The findings of the current study are consistent with the findings that mindset can
improve test performance, especially for minority students (Aronson, et al. 2002; Dweck,
2007; Good et al., 2003; Good et al., 2007). Overall, this study supports the results of
other studies that have found mindset and motivation to correlate positively with
standardized test performance (Dvorak, 2014; Liu et al., 2012; Murayama et al., 2013).
This study found that, while mindset scores on the ITISCS consistently
contributed to predicting student achievement across sub-groups, the traits and factors of
these sub-groups impacted mindset’s ability to predict standardized test performance.
Specifically, while students within a sub-group had different predicted test performance
levels based on their mindset scores, these sub-groups differed significantly from each
other. This study confirmed some of the existing literature regarding sub-group traits and
challenges other findings.
Previous studies have found that mindset’s ability to predict achievement,
particularly in the area of math, is mediated by gender (Dar-Nimrod & Heine, 2006;

ROLE OF MINDSET IN NWEA MAP TEST PERFORMANCE 103
Dweck, 2000; Grant & Dweck, 2003). The current study did not find this relationship.
Specifically, gender did not correlate to a statistically significant degree with math
performance, reading performance, or ITISCS mindset scores. As shown in Table 20,
there was only a small estimated correlation between language performance and gender
(.151 at p<.01). Gender beta weights also lacked statistical significance across Math,
Reading, and Language multiple regression models. However, it is important to note
here that this may be due to the specific nature of the population studied (higher
achieving students) as female underachievement in math, which is a consistent finding in
the literature was not present in this sample.
Three consistent themes from the literature regarding sub-group factors that were
confirmed in this study were the underperformance of Hispanic students, low SES
students, and special education students. Consistent with the literature, students
identified as Hispanic and those students eligible for the Title I program (a measure of
SES) were predicted to perform consistently below their peers (Blackwell et al., 2007;
Dar-Nimrod & Heine, 2006; Dvorak, 2014; Grant & Dweck, 2003; O'Rourke et al., 2014).
This achievement gap consistently found in the literature was also represented in this
sample providing validity evidence as these results establish consistency with evidence
based on relation to other variables. These results should inform the systematic
monitoring and intervention of students’ academic achievement. Also consistent with the
literature, special education students were found to have a higher prevalence of fixed
mindedness (Baird et al., 2009). Table 16 shows that 62.5% of the special education
students in the sample had ITISCS results in the fixed minded range while only 27% of
non-special education students were identified as fixed minded. Given these findings,

ROLE OF MINDSET IN NWEA MAP TEST PERFORMANCE 104
mindset interventions should be considered when designing individual education plans
for students in special education. Finally, this study also confirmed the findings of
Ziegler and Stoeger (2010), that mindset equally impacts the performance of students
who are identified as gifted and non-gifted. Given that the stability of giftedness over the
course of a student’s career has been shown to be limited (Bronson & Merryman, 2009),
it is important that students identified as gifted are not excluded from mindset
interventions and monitoring.
In closing, the results of this study contribute to the understanding of the role a
student’s mindset plays in researchers’ abilities to predict standardized test performance.
Overall, this study confirms previous findings regarding mindset’s role in predicting
student achievement and the impact of subgroup factors. However, it is important that
given the specific sample used in this study, the results should not be over generalized.
Specific guidance on limitations of this study’s results can be found in the following
sections.
Limitations of the Study
There are two primary limitations of this study that inhibit the generalizability of
the results. First, this study was correlational in design, thus predictive conclusions are
limited. Secondly, the sample chosen, while of ample size to conduct the statistical
analyses, was in many ways unique to the school where the study was conducted and
should be strictly evaluated before generalizing results. The nuances of these limitations
will be reviewed here and should be used as a guide for generalization of results and
replication of the study.

ROLE OF MINDSET IN NWEA MAP TEST PERFORMANCE 105
According to Vogt (2007), there are three main criteria when assessing causation.
These are; Y must precede X, X and Y must covary, and other possible causes must be
ruled out. In the variable language of this study, in order to demonstrate causation that
mindset scores result in NWEA MAP performance, these three criteria would need to be
satisfied. First, it would need to be established that the mindset preceded the NWEA
MAP performance. This criterion was not met as this was a cross-sectional correlational
study where the data were gathered during the same period of time. Second, mindset and
NWEA MAP performance would need to be seen to covary. This criterion was met
according to the results of the estimated bivariate correlation procedure and the multiple
regression analyses. Finally, other possible causes for NWEA MAP performance would
need to be ruled out. This criterion was partially met as there were a number of control
variables included in the multiple regression analyses that isolated the effect of mindset
on NWEA MAP performance. Given Vogt’s criteria, a major limitation of the results of
this study is that causation was not established, thus limiting the generalizability of the
results.
Perhaps more important than the failure to establish a causal link between mindset
score and NWEA MAP performance, is the fact that the sample of students in this study
represents a potentially unique population and therefore generalization of these results
may only be applicable to environments with similar profiles. According to Tabachnick
and Fidell (2013), generalization of research findings is limited by the degree to which
the sample represents the overall population of interest. Specifically, this population was
defined by voluntary participation in the lottery to enter the college preparatory charter
school, its demographics were not representative of the region, and its academic

ROLE OF MINDSET IN NWEA MAP TEST PERFORMANCE 106
achievement was well above the local and national averages. This can be attributed to the
purposive nature of the sample and the researcher’s interest in investigating the high
achieving charter school’s population. According to Fraenkel and Wallen (2009), the
sample in this study can best be described as a purposive sample as there was a specific
population of interest and the study does not purport to be generalizable to all students.
First, the students in the school, despite being randomly selected by the lottery or
achieving enrollment due to a sibling preference, have all self-selected their enrollment in
the school lottery (student or parent). The school studied is a public charter school with
no geographic boundaries, or criteria beyond sibling preference. Thus, all students
enrolled are enrolled as an alternate choice to their local public school to which they
would have otherwise been assigned. Second, the student demographics do not have a
similar profile to the general population of the metro area within which the charter school
is located. The school has fewer students who identify as Hispanic, has a larger portion
of its population that identifies as Caucasian, and has less than one quarter the number of
students who qualify for Title I support when compared to the local metropolitan school
system as a whole. Finally, the average academic achievement of the students was
significantly higher than the local and national averages. For example, student mean
NWEA MAP scores for Math (59.81 percentile), Reading (68.49 percentile), and
Language (66.82 percentile) demonstrated that the students’ performed consistently well
above the national average. Given the self-selected nature of the school’s population, its
lack of representative demographics, and its above average academic performance, the
generalizability of results is limited.

ROLE OF MINDSET IN NWEA MAP TEST PERFORMANCE 107
In conclusion, the primary limitation of this study is the limited generalizability of
the study results. Due to the correlational design, a causal claim between mindset scores
and NWEA MAP performance could not be established. Furthermore, the unique nature
of the charter population studied can be described as a purposive sample, which should
serve as a warning to those attempting to generalize the results beyond schools with
similar profiles.
Recommendations for Further Research
While the findings of this study are compelling, the next steps in the research
process should be primarily guided by this study’s limitations. Specifically, the next step
that should be taken in order to continue the line of inquiry of this study should be to
design a randomized, experimental study, which would attempt to establish a causal link
between mindset and NWEA MAP assessment performance in a sample population that
would be generalizable. Beyond the sample, additional research should also be
conducted using other standardized test measures.
Further research should seek to evaluate if these effects can be identified across
numerous standardized testing formats. It is important to note that the NWEA MAP
assessment is a computer adaptive test (CAT). As a CAT, the test questions are
constantly adjusting based on the student’s previous answer. If the student answers
correctly, the questions become more difficult. If the student answers incorrectly, the
questions become easier. This particular CAT is also untimed. The specific
characteristics of the NWEA MAP assessment may make it uniquely sensitive to student
motivation and mindsets in particular. Further research is required to evaluate whether or
not results similar to this study would be found on standardized assessments that are not
computer adaptive and are limited by time parameters.
ROLE OF MINDSET IN NWEA MAP TEST PERFORMANCE 108
Implications for Professional Practice
Educational practitioners can use these findings in conjunction with the published
literature to justify a classroom, school, and district level emphasis on cultivating a
growth mindset in students. The development of a growth mindset should be seen as
most important in at risk student populations. Groups identified in this study as at risk
for poor test performance include Hispanic students, low SES students, and special
education students. Growth mindset interventions should be a part of a comprehensive
approach to supporting the performance of at risk students.
There are two practical paths for school districts to take when seeking to include
mindset interventions as part of a comprehensive strategy to improve student
achievement. First, teachers should be properly trained on the benefits of cultivating a
growth mindset in students and on classroom based intervention strategies that support
mindset development in students (Dweck, 2016). Second, districts should investigate the
deployment of online, standardized mindset intervention strategies. These strategies have
been shown to impact student mindsets and resulting achievement in as few as two, 45
minute sessions (Paunesku et al., 2015).
The most sustainable approach to incorporating mindset interventions into
professional practice is to imbed them in already established structures and activities. For
example, if schools are already practicing the Professional Learning Community (PLC)
approach to teacher collaboration, mindset should be imbedded in this approach. PLCs
have as an essential agreement that all students can learn and emphasizes systematically
evaluating the reasons for the lack of student’s progress. Mindset theory can be woven
into this practice, allowing for a common theoretical framework as to why students can
all learn and how to evaluate their lack of progress in a productive way. PLCs are only

ROLE OF MINDSET IN NWEA MAP TEST PERFORMANCE 109
one example of widespread existing school practices which are compatible with an
emphasis on mindset theory. School and district leaders should identify the current
practices in their own environment and work to incorporate mindset theory into those
practices that are already successful.

ROLE OF MINDSET IN NWEA MAP TEST PERFORMANCE 110
References
Amrein, A. L., & Berliner, D. C. (2002). High-stakes testing & student learning.
Education policy analysis archives, 10, 18.
Aronson, J., Fried, C. B., & Good, C. (2002). Reducing the effects of stereotype threat on
African American college students by shaping theories of intelligence. Journal of
Experimental Social Psychology, 38(2), 113-125.
Barshay, J. (2015, November 23). Growth mindset guru Carol Dweck says teachers and
parents often use her research incorrectly - The Hechinger Report. Retrieved
March 19, 2016, from http://hechingerreport.org/growth-mindset-guru-carol-
dweck-says-teachers-and-parents-often-use-her-research-incorrectly/
Baird, G. L., Scott, W. D., Dearing, E., & Hamill, S. K. (2009). Cognitive self-regulation
in youth with and without learning disabilities: Academic self-efficacy, theories
of intelligence, learning vs. performance goal preferences, and effort attributions.
Journal of Social and Clinical Psychology, 28(7), 881-908.
Binet, A. (1909/1973). Les idées modernes sur les enfants [Modern ideas on children].
Paris: Flamarion. (Original work published 1909)"
Blackwell, L. S., Trzesniewski, K. H., & Dweck, C. S. (2007). Implicit theories of
intelligence predict achievement across an adolescent transition: A longitudinal
study and an intervention. Child development, 78(1), 246-263.
Bloom, B. S. (1985). Developing talent in young people.
Bronson, P., & Merryman, A. (2009). Nurture Shock: New thinking about children.
Bush, G. W. (2001). No Child Left Behind.

ROLE OF MINDSET IN NWEA MAP TEST PERFORMANCE 111
Dar-Nimrod, I., & Heine, S. J. (2006). Exposure to scientific theories affects women's
math performance. Science, 314(5798), 435-435.
Dewitt, P. (2015, July 17). Why a 'Growth Mindset' Won't Work. Education Week.
Retrieved March 16, 2016, from
http://blogs.edweek.org/edweek/finding_common_ground/2015/07/why_a_growt
h_mindset_wont_work.html?cmp=eml-eb-mindset101315
Diener, C. I., & Dweck, C. S. (1978). An analysis of learned helplessness: Continuous
changes in performance, strategy, and achievement cognitions following failure.
Journal of Personality and Social Psychology, 36(5), pp. 451-462.
Diener, C. I., & Dweck, C. S. (1980). An analysis of learned helplessness: II. The
processing of success. Journal of Personality and Social Psychology, 39(5), 940.
Doidge, N. (2007). The brain that changes itself: Stories of personal triumph from the
frontiers of brain science. Penguin.
Duckworth, A. L., Quinn, P. D., & Tsukayama, E. (2012). What No Child Left Behind
leaves behind: The roles of IQ and self-control in predicting standardized
achievement test scores and report card grades. Journal of Educational
Psychology, 104(2), 439.
Dvorak, A. E. (2014). Student Mindset Compared to Performance on the Nebraska State
Accountability Test.
Dweck, C. S. (1975). The role of expectations and attributions in the alleviation of
learned helplessness. Journal of Personality and Social Psychology, 31(4), 674.
Dweck, C. S. (1986). Motivational processes affecting learning. American Psychologist,
41(10), 1040.
ROLE OF MINDSET IN NWEA MAP TEST PERFORMANCE 112
Dweck, C. S. (2000). Self-theories: Their role in motivation, personality, and
development. Psychology
Dweck, C. (2006). Mindset: The new psychology of success. Random House LLC.
Dweck, C. S. (2007). Boosting achievement with messages that motivate. Education
Canada, 47(2), 6-10.
Dweck, C. (2008). Mindsets and math/science achievement.
Dweck, C. (2015). Carol Dweck Revisits the'Growth Mindset'. Education Weekly
9/22/2015 Accessed 3/17/2015 at url:
http://www.edweek.org/ew/articles/2015/09/23/carol-dweck-revisits-the-growth-
mindset.html?cmp=eml-eb-mindset101315
Dweck, C. S. (2016). The Journey to a Growth Mindset. Education Week, Leaders to
Learn from. Washington D.C. 3/11/2016 [PPT presentation and Lecture]
Dweck, C. S., & Bempechat, J. (1983). Children's theories of intelligence: Consequences
for learning. Learning and motivation in the classroom, 239-256.
Dweck, C. S., Chiu, C. Y., & Hong, Y. Y. (1995). Implicit theories and their role in
judgments and reactions: A word from two perspectives. Psychological inquiry,
6(4), 267-285.
Dweck, C., & Leggett, E. (1988). A social-cognitive approach to motivation and
personality. Psychological review, 95(2), 256.
Dweck, C. S., & Reppucci, N. D.(1973) Learned helplessness and reinforcement
responsibility in children. Journal of Personality and Social Psychology, 25, 109-
116.
ROLE OF MINDSET IN NWEA MAP TEST PERFORMANCE 113
Elliott, E. S., & Dweck, C. S. (1988). Goals: an approach to motivation and achievement.
Journal of Personality and Social Psychology, 54(1), 5.
Erdley, C. A., & Dweck, C. S. (1993). Children's implicit personality theories as
predictors of their social judgments. Child development, 64(3), 863-878.
Eysenck, H. J. (1977). The case of Sir Cyril Burt: On Fraud and Prejudice in a scientific
controversy. Encounter, 48(1), 19-24. Chicago.
Fraenkel, J. & Wallen, N. E. (2009). How to design and evaluate research in education.
McGraw-Hill. Seventh edition.
Good, C., Aronson, J., & Inzlicht, M. (2003). Improving adolescents' standardized test
performance: An intervention to reduce the effects of stereotype threat. Journal of
Applied Developmental Psychology, 24(6), 645-662.
Good, C., Rattan, A., & Dweck, C. S. (2007). Adults’ theories of intelligence affects
feedback to males and females in math. Unpublished data, Columbia University.
Gould, S. J. (1981). The Mismeasure of Man. WW Norton & Company.
Grant, H., & Dweck, C. S. (2003). Clarifying achievement goals and their impact.
Journal of Personality and Social Psychology, 85(3), 541.
Gutman, L. M., & Schoon, I. (2013). The impact of non-cognitive skills on outcomes for
young people. Education Endowment Foundation. Available at:
http://educationendowmentfoundation. org. uk/uploads/pdf/Non-
cognitive_skills_literature_review. pdf.
Haladyna, T. M., & Downing, S. M. (2004). Construct‐irrelevant variance in high‐stakes
testing. Educational Measurement: Issues and Practice, 23(1), 17-27. Chicago
Hayes, J. R. (1989). Cognitive processes in creativity (pp. 135-145). Springer US.

ROLE OF MINDSET IN NWEA MAP TEST PERFORMANCE 114
Heider, F. (1958). The Psychology of Interpersonal Relations.
Henderson, V. L., & Dweck, C. S. (1990). Motivation and achievement. At the
Threshold: the Developing Adolescent. 308-329.
Herrnstein, R. J., & Murray, C. (1996) The Bell curve: Intelligence and class structure in
American life. Simon and Schuster.
Higgins, E. T., Kruglanski, A. W., & Lange, P. V. (2012). Handbook of Theories of
Social Psychology. Los Angeles: SAGE Publications Ltd.
Holmlund, H., & Silva, O. (2009). Targeting non-cognitive skills to improve cognitive
outcomes: Evidence from a remedial education intervention.
Hong, Y. Y., Chiu, C. Y., Dweck, C. S., Lin, D. M. S., & Wan, W. (1999). Implicit
theories, attributions, and coping: A meaning system approach. Journal of
Personality and Social Psychology, 77(3), 588.
IBM Corp. Released 2013. IBM SPSS Statistics for Windows, Version 22.0. Armonk,
NY: IBM Corp.
Jensen, A. R. (1978). Sir Cyril Burt in perspective.
Kelly, E. L. (1955). Consistency of the adult personality. American Psychologist, 10(11),
659.
Kohn, A. (2015, August 16). The perils of “Growth Mindset” education: Why we’re
trying to fix our kids when we should be fixing the system. Slate.
Leggett, E. L. (1985, March). Children's entity and incremental theories of intelligence:
Relationships to achievement behavior. In annual meeting of the Eastern
Psychological Association, Boston.
ROLE OF MINDSET IN NWEA MAP TEST PERFORMANCE 115
Levy, S. R., Stroessner, S. J., & Dweck, C. S. (1998). Stereotype formation and
endorsement: The role of implicit theories. Journal of Personality and Social
Psychology, 74(6), 1421.
Liu, O. L., Bridgeman, B., & Adler, R. M. (2012). Measuring learning outcomes in
higher education motivation matters. Educational Researcher, 41(9), 352-362.
Miller, G. (2013). Understanding John Hattie’s Visible Learning Research in the Context
of Carol Dweck’s Growth Mindset. Retrieved from Influence on Student Learning
by John Hattie. http://growthmindseteaz.org/johnhattie.html
Morehead, J. (Interviewer) & Dweck, C.S. (Interviewee). (2012). Stanford University’s
Carol Dweck on the Growth Mindset and Education. Retrieved from
OneDublin.org
http://onedublin.org/2012/06/19/stanford-universitys-carol-dweck-on-the-growth-
mindset-and-education/
Mowrer, O. H. (1960) Learning theory and behavior. NewYork: Wiley.
Mueller, C. M., & Dweck, C. S. (1998). Praise for intelligence can undermine children's
motivation and performance. Journal of Personality and Social Psychology, 75(1),
33.
Murayama, K., Pekrun, R., Lichtenfeld, S., & Vom Hofe, R. (2013). Predicting Long‐
Term Growth in Students' Mathematics Achievement: The Unique Contributions
of Motivation and Cognitive Strategies. Child development, 84(4), 1475-1490.
National Governors Association Center for Best Practices & Council of Chief State
School Officers. (2010). Common Core State Standards. Washington, DC:
Authors.

ROLE OF MINDSET IN NWEA MAP TEST PERFORMANCE 116
Neisser, U., Boodoo, G., Bouchard Jr, T. J., Boykin, A. W., Brody, N., Ceci, S. J.&
Urbina, S. (1996). Intelligence: knowns and unknowns. American psychologist,
51(2), 77.
Nicholls, J. G. (1975). Causal attributions and other achievement-related cognitions:
Effects of task outcome, attainment value, and sex. Journal of Personality and
Social Psychology, 31(3), 379.
Nisbett, R. E. (2009). Intelligence and how to get it: Why schools and cultures count.
WW Norton & Company.
Northwest Evaluation Association. (2004). Reliability and validity estimates: NWEA
achievement level tests and measures of academic progress. Retrieved March, 3,
2015
O'Rourke, E., Haimovitz, K., Ballweber, C., Dweck, C., & Popović, Z. (2014, April).
Brain points: a growth mindset incentive structure boosts persistence in an
educational game. In Proceedings of the 32nd annual ACM conference on Human
factors in computing systems (pp. 3339-3348). ACM.
Paunesku, D. (2013). Scaled-up social psychology: Intervening wisely and broadly in
education (Doctoral dissertation, Stanford University).
Paunesku, D., Walton, G. M., Romero, C., Smith, E. N., Yeager, D. S., & Dweck, C. S.
(2015). Mind-Set Interventions Are a Scalable Treatment for Academic
Underachievement. Psychological Science,.
Potter, J. (2000). "Post cognitivist psychology", Theory and Psychology, 10, 31-37.
ROLE OF MINDSET IN NWEA MAP TEST PERFORMANCE 117
Rattan, A., Good, C., & Dweck, C. S. (2012). “It's ok—Not everyone can be good at
math”: Instructors with an entity theory comfort (and demotivate)
students. Journal of Experimental Social Psychology, 48(3), 731-737.
Renaud-Dubé, A., Guay, F., Talbot, D., Taylor, G., & Koestner, R. (2015). The relations
between implicit intelligence beliefs, autonomous academic motivation, and
school persistence intentions: a mediation model. Social Psychology of Education,
1-18.
Romero, C., D. Paunesku, and C. Dweck. "Brainology in the classroom: An online
growth mindset intervention affects GPA, conduct, and implicit theories." Poster
presented at the biennial meeting for the Society for Research in Child
Development, Montreal, Canada. 2011
Rosen, J. A., Glennie, E. J., Dalton, B. W., Lennon, J. M., & Bozick, R. N. (2010). Non-
cognitive Skills in the Classroom: New Perspectives on Educational Research.
RTI International. PO Box 12194, Research Triangle Park, NC 27709-2194.
Seligman, M. E. (2012). Flourish: A visionary new understanding of happiness and well-
being. Simon and Schuster.
Seligman, M., & Maier, S. (1967) Failure to escape traumatic shock. Journal of
Experimental Psychology, 74,1-9.
Shell, D. F., Brooks, D. W., Trainin, G., Wilson, K. M., Kauffman, D. F., & Herr, L. M.
(2010). The unified learning model (pp. 1-4). Springer Netherlands.
Siegle, D., Rubenstein, L. D., Pollard, E., & Romey, E. (2009). Exploring the relationship
of college freshmen honors students’ effort and ability attribution, interest, and
implicit theory of intelligence with perceived ability. Gifted Child Quarterly.

ROLE OF MINDSET IN NWEA MAP TEST PERFORMANCE 118
Soper, D.S. (2015). A-priori Sample Size Calculator for Multiple Regression [Software].
Available from http://www.danielsoper.com/statcalc
Spearman, C. (1904). “General Intelligence," objectively determined and measured. The
American Journal of Psychology, 15(2), 201-292.
Steele, C. M., & Aronson, J. (1995). Stereotype threat and the intellectual test
performance of African Americans. Journal of Personality and Social
Psychology, 69(5), 797.
Tabachnick, B. G., & Fidell, L. S. (2013). Using Mutlivariate Statistics.
Vogt, W. P. (2007). Quantitative research methods for professionals. Pearson College
Division.
Weiner, B. (1985). An attributional theory of achievement motivation and emotion.
Psychological review, 92(4), 548.
Weiner, B. (1972). Theories of motivation. Chicago: Markham.
West, M. R., Kraft, M. A., Finn, A. S., Martin, R., Duckworth, A. L., Gabrieli, C. F., &
Gabrieli, J. D. (2014, June). Promise and paradox: Measuring students’ non-
cognitive skills and the impact of schooling. In CESifo Area Conference on
Economics of Education Munich: CESifo (September).
Wise, S. L., & Kong, X. (2005). Response time effort: A new measure of examinee
motivation in computer-based tests. Applied Measurement in Education, 18(2),
163-183. Chicago
Wise, S. L., Ma, L., Cronin, J., & Theaker, R. A. (2013). Student test-taking effort and
the assessment of student growth in evaluating teacher effectiveness. In Annual

ROLE OF MINDSET IN NWEA MAP TEST PERFORMANCE 119
Conference of the American Educational Research Association, San Francisco,
CA.
Yeager, D. S., & Dweck, C. S. (2012). Mindsets that promote resilience: When students
believe that personal characteristics can be developed. Educational Psychologist,
47(4), 302-314.
Yeager, D. S., & Walton, G. M. (2011). Social-psychological interventions in education
They’re not magic. Review of Educational Research, 81(2), 267-301.
Yeager, D. S., Paunesku, D., Romero, C., Brown, R., Muhich, J., & Walton, G. M. (2013).
Engineering psychological interventions for scale: The case of the “growth
mindset” in community colleges. Manuscript in preparation.
Yeager, D. S., Paunesku, D., Walton, G., & Dweck, C. S. (2013, May). How can we
instill productive mindsets at scale? A review of the evidence and an initial R&D
agenda. In white paper prepared for the White House meeting on “Excellence in
Education: The Importance of Academic Mindsets”.
Yeager, D., Walton, G., & Cohen, G. L. (2013). Addressing achievement gaps with
psychological interventions. Phi Delta Kappan, 94(5), 62-65.
Ziegler, A., & Stoeger, H. (2010). Research on a modified framework of implicit
personality theories. Learning and individual Differences, 20(4), 318-326.

ROLE OF MINDSET IN NWEA MAP TEST PERFORMANCE 120
Appendix A
ITISC: Implicit Theories of Intelligence Scale for Children-Self Form (Dweck, 2000)
This questionnaire has been designed to investigate ideas about intelligence. There are
no right or wrong answers. We are interested in your ideas. Using the scale below,
please indicate the extent to which you agree or disagree with each of the following
statements by writing the number that corresponds to your opinion in the space next to
each statement.
1=Strongly Agree
2=Agree
3=Mostly Agree
4=Mostly Disagree
5=Disagree
6=Strongly Disagree
*___1. You have a certain amount of intelligence, and you really can’t do much to
change it.
*___2. Your intelligence is something about you that you can’t change very much.
*___3. You can learn new things, but you can’t really change your basic intelligence.
___4. No matter who you are, you can change your intelligence a lot.
___5. You can always greatly change how intelligent you are.
___6. No matter how much intelligence you have, you can always change it quite a bit.
*These items can you be used alone.
Note: For studies of how people’s theories of intelligence affect they judge and teat
others, use the “Others” form of the theories of intelligence scales. The “Others” form is
constructed by replacing the word “you” with the words “people,” “someone,” or
“everyone” (as in the “kind of person” scale below).

ROLE OF MINDSET IN NWEA MAP TEST PERFORMANCE 121
Appendix B
Col # Variable Name Variable Description Variable Metric
1 HISP Hispanic Ethnicity 0=No
1=Yes
2 REID Racial identification 1=White
2=Black
3=Asian or Pacific Islander
4=American Indian or Alaskan
Native
3 GEN Gender Female=0
Male=1
4 GPA Grade point average at
quarter
1= ≦ 1.49
2=1.5-1.99
3=2.0-2.49
4=2.5-2.99
5=3.0-3.49
6=3.5-4.0+
5 ATTEN School attendance at
quarter measured by
number of missed days
Number of days missed
6 EDPRO Educational Program 1=General Education
2=Gifted Education
3=Non-gifted Special
Education
7 SES Socioeconomic Status as
measured by title one
program participation
0=Not Title I Eligible
1=Title I Eligible
8 YINSCH Year in school 1=6th
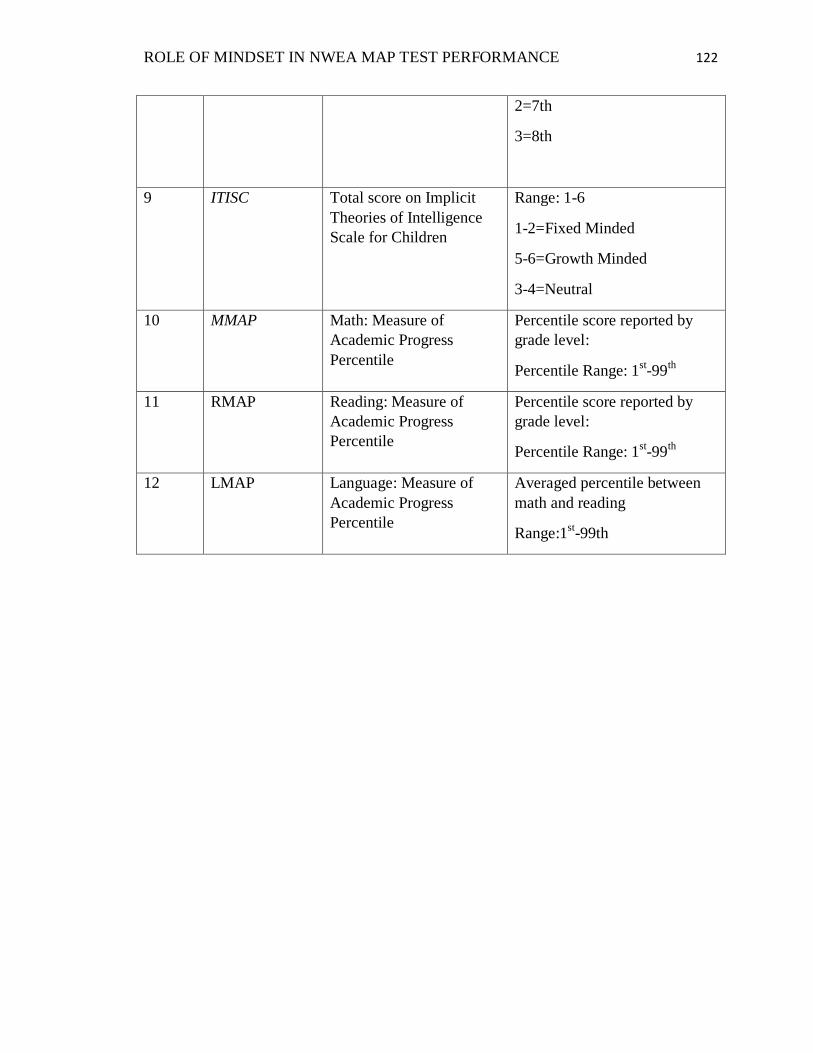
ROLE OF MINDSET IN NWEA MAP TEST PERFORMANCE 122
2=7th
3=8th
9 ITISC Total score on Implicit
Theories of Intelligence
Scale for Children
Range: 1-6
1-2=Fixed Minded
5-6=Growth Minded
3-4=Neutral
10 MMAP Math: Measure of
Academic Progress
Percentile
Percentile score reported by
grade level:
Percentile Range: 1st-99
th
11 RMAP Reading: Measure of
Academic Progress
Percentile
Percentile score reported by
grade level:
Percentile Range: 1st-99
th
12 LMAP Language: Measure of
Academic Progress
Percentile
Averaged percentile between
math and reading
Range:1st-99th