Predicting the Literacy Achievement of Struggling Readers: Does Intervening Early Make a Difference
25
Predicting the Literacy Achievement of Struggling Readers: Does Intervening Early Make a Difference? Emily Rodgers and Francisco Gomez-Bellenge The Ohio State University Chuang Wang University of North Carolina- Chapel Hill Melissa Schulz The Ohio State University Paper presented at the Annual Meeting of the American Educational Research Association Montreal, Quebec April, 2005
Transcript of Predicting the Literacy Achievement of Struggling Readers: Does Intervening Early Make a Difference

Predicting the Literacy Achievement of Struggling Readers:
Does Intervening Early Make a Difference?
Emily Rodgers and Francisco Gomez-Bellenge
The Ohio State University
Chuang Wang
University of North Carolina- Chapel Hill
Melissa Schulz
The Ohio State University
Paper presented at the Annual Meeting of the
American Educational Research Association
Montreal, Quebec
April, 2005

Predicting the Literacy Achievement of Struggling Readers Rodgers, Gomez-Bellenge, Wang & Schulz
2
Mounting evidence continues to document an achievement gap between students.
The gap is evident as early as kindergarten on measures of letter recognition and letter-sound
relationships, between European Americans (Whites) and African Americans, and between
Whites and Hispanic children (West, Denton & Reaney, 2000). A similar gap is also found
along economic lines (West, Denton & Germino Hausken 2000 in Denton, West & Walston,
2003; Zill & West, 2000).
Early intervention, in the form of one-to-one tutoring, has proven to be effective in
accelerating the progress of the lowest performing children in first grade to reach average
levels of performance (Pinnell, Lyons, DeFord, Bryk & Seltzer, 1994; Vellutino & Scanlon,
2002). In addition, findings from recent research on one intervention in particular, Reading
Recovery, shows that the achievement gap between average and low performing groups
either narrowed or closed along economic and race/ethnicity lines (Rodgers, E., Gómez-
Bellengé, F.X. & Wang, C., 2004). We do not know, however, whether the intervention itself
was a factor in the students’ progress towards closing the achievement gap.
The purpose of this study therefore is to examine whether having an early literacy
intervention or not, in this case Reading Recovery, is a significant predictor of a student’s
reading achievement in spring. The findings should add to our understandings of how the
achievement gap might be impacted by intervening early when students first encounter
difficulty with literacy learning.
Theoretical Frame
Two constructs are explored in greater detail in this section: the achievement gap and
early intervention. We also describe Reading Recovery, the early intervention that we use as
the context for this study.

Predicting the Literacy Achievement of Struggling Readers Rodgers, Gomez-Bellenge, Wang & Schulz
3
Understanding the Achievement Gap
The concept of “closing the gap” stems from years of research that shows certain
demographic groups academically under-perform relative to other groups. Differences in
progress are evident in reports which identify gaps in achievement along economic and
race/ethnicity lines as early as Kindergarten, and in first (Denton & West, 2002) and fourth
grade (U.S. Department of Education 2001). In fact, only Asians/Pacific Islanders have
shown an improvement in their scores since 1992; African Americans, Hispanics and
American Indians continue to score at lower levels than Whites (U.S. Department of
Education, 2001) and the gains that were made in the early 1990’s are now decreasing (Lee,
2002).
Achievement gaps are not limited to the United States; similar gaps have been
documented between minority and majority cultures in other countries. In New Zealand for
example, Maori and Pacific Island children typically achieve at lower levels than other
children, and children in less economically advantaged schools achieve at lower levels than
children in schools that are more economically advantaged (McNaughton, Phillips, &
MacDonald, 2003).
Although research findings converge on variables such as race/ethnicity, language
status and economic status as potent predictors of reading difficulties, (Snow, Burns &
Griffin, 1998) it is not known why the gap exists. It is unlikely, however, that race is a
determining factor. The achievement gap is far more likely a result of an interaction of social,
familial and economic factors (Bainbridge & Lasley, 2002). For example, research shows that
parents’ education level and the economic level of the family are more meaningful predictors
of school achievement than race. These interacting factors mean that individual children
come to school with different experiences, making some children less prepared for school

Predicting the Literacy Achievement of Struggling Readers Rodgers, Gomez-Bellenge, Wang & Schulz
4
than others. As Bainbridge and Lasley note, “Prior learning influences future achievement
for all students, regardless of race” (p.427).
A second set of factors that appear to contribute to achievement differences, in
addition to those that exist at the level of the individual, are those at the school level (Land
& Legters, 2002). School climate, in terms of expectations for student progress, and policies
such as tracking and retention, all have a negative impact on student achievement and are
likely to represent differences that become manifested as achievement gaps along racial and
economic lines.
What is clear is that the achievement gap must be closed and that it will take more
than a quick fix such as mandating a phonics program or emphasizing direct teaching, to
compensate for the differences that exist (Bainbridge and Lasley (2002). Nor can the
problem be left up to individual teachers to solve, because as Bainbridge and Lasley note,
change is needed on a grander scale to compensate for the inequities present in our society.
Early Intervention and Reading Recovery
A substantial body of research demonstrates that students who experience difficulty
learning to read early in their academic career continue to struggle in later years (Juel, 1988;
Vellutino and Scanlon 2002). On the basis of what we know about the achievement gap and
who is affected, we can expect therefore that not only will children fall behind their peers
along racial and economic lines, but that this gap may stay with them and impact their class
ranking for years to come.
`One-to-one teaching is a recognized form of intervention for children having
extreme difficulty learning to read and is becoming more widely used to prevent literacy
difficulties (Wasik & Slavin, 1993). One well documented example of an early intervention is
Reading Recovery (RR), a short-term series of lessons for students who have the lowest

Predicting the Literacy Achievement of Struggling Readers Rodgers, Gomez-Bellenge, Wang & Schulz
5
achievement in literacy learning in the first grade. Students are individually taught by a
specially trained teacher daily for 30 minutes for an average of 12-20 weeks. The goal is for
students to develop an effective reading and writing processing system in order to work
within an average range of classroom performance (Clay, 1993).
Initial Reading Recovery teacher professional development is for one academic year.
Following the year of training, teachers continue to participate in professional development
sessions with other Reading Recovery teachers. A central feature of this professional
development includes teaching lessons behind a one-way mirror while colleagues observe
and discuss on the other side (Askew et. al, 1998). Their inquiry is led by a staff developer
called a teacher leader who guides their observations and challenges their conclusions about
the teaching and learning that they are observing. Teachers develop skills in observation and
analysis of moment-by-moment teacher decision-making. This emphasis on using talk to
guide thinking and understanding is rooted in a Vygotskian understanding of the role of
language in cognition (Luria, 1982).
The present report is the second in a series of research studies that we conducted to
address the problem of the achievement gap. In the first paper, we reported the results of a
state-wide study which compared the progress of students who received Reading Recovery
to a random sample of first grade students (Rodgers, Gómez-Bellengé, & Wang, 2004). In
that state-wide study, we disaggregated students’ progress on literacy measures along two
lines, race/ethnicity and economic status, and we analyzed differences in scores using
independent t-tests and measures of mean gains. We established that a gap did exist in the
state along race/ethnicity and economic lines between the random sample and the students
who received the early intervention. We also found that the differences between the random

Predicting the Literacy Achievement of Struggling Readers Rodgers, Gomez-Bellenge, Wang & Schulz
6
sample and the intervention students were no longer significant in spring, leading us to
conclude that the students in the intervention group either closed or narrowed the gap.
While that initial study demonstrated that the students who received the Reading
Recovery intervention made sufficient gains to make the differences between their scores
and the scores of students in the random sample insignificant by spring, it did not tell us
whether those gains were attributable to the intervention itself. In this present study
therefore, we hypothesize that participation in Reading Recovery predicts progress in reading
achievement. The following research question guided our inquiry: To what extent does
participation in Reading Recovery explain whether a student reaches an average reading level
or not, by the end of first grade?
Method
For the present study, we relied on national evaluation data of Reading Recovery for
the 2002-2003 school year. We describe in this section first how national data are collected,
and then how we formed two matched groups from the national sample, a group that
received Reading Recovery and a group that did not, in order to investigate whether having
Reading Recovery is a significant predictor of reading achievement, as measured by spring
text reading level.
Reading Recovery National Data Collection Procedures
As part of the annual national evaluation, Reading Recovery teachers collect and
enter data for all students served as well as data for a national comparison group of first
grade students in schools with Reading Recovery. Data are entered on a web site and
processed at the National Data Evaluation Center (NDEC) at The Ohio State University. In
2002-03, data were collected by nearly 17,000 teachers on 137,887 students who received
Reading Recovery that year and a comparison group of 18,210 first grade students (Gómez-
Predicting the Literacy Achievement of Struggling Readers Rodgers, Gomez-Bellenge, Wang & Schulz
7
Bellengé & Rodgers, 2004). This process was led by a network of about 700 teacher leaders
and 35 university faculty.
The comparison sample consists of two students selected at random from the
mainstream first grade population of each school with Reading Recovery. Since there are
often not enough Reading Recovery teachers in each school to serve all of the children who
need it (see Askew et. al, 1998 for a discussion of full coverage), the comparison group
encompasses a range of reading abilities and includes low readers not served by the
intervention.
Literacy achievement data are collected at fall and in spring, including each student’s
scores on the six tasks of Clay’s An Observation Survey of Early Literacy Achievement (OS) (Clay,
2002): Letter identification (LI) measures how many upper and lower case letters a child can
identify by either a name, sound or word that starts with that letter. The highest score that
can be achieved is 54. The Ohio Word Test (OWT) measures the number of words a child
can correctly identify from a list of 20 words (adapted from the Dolch Word List; see
Pinnell, Lyons, Young and DeFord, 1987). Concepts about Print (CAP) examines the child’s
concepts or understandings about print. The highest score that can be achieved is 24. The
Hearing and Recording Sounds in Words (HRSW) task measures how many phonemes a
student can hear and record when dictated a sentence that contains 37 phonemes. The
Writing Vocabulary (WV) task measures the number of words that a child can write in 10
minutes. The sixth task, Text Reading Level (TRL) involves taking a running record (Clay,
2002) of the child’s oral reading. The highest level at which the child reads with no less than
90 percent accuracy is considered the child’s instructional text reading level. There is no
ceiling score on this task. (See Clay, 2002, for the established validity and reliability
coefficients for each task).

Predicting the Literacy Achievement of Struggling Readers Rodgers, Gomez-Bellenge, Wang & Schulz
8
Text reading levels have been applied to approximately 2500 children’s trade books.
The lowest level books, 1-4, are equivalent to a basal readiness level. These books are highly
predictable; generally with only 1-2 sentence patterns and a good match between pictures
and print. Sentence patterns become quite varied by levels 13-15 and include structures that
might be rare in oral language (for example, “Once upon a time…”). Beyond level 15 the
stories become more episodic, and the pictures provide only low support (Rodgers, 2005).
School districts that use RR levels to set benchmarks often cite levels 16-18 as appropriate
for end of first grade (see for example, Dantas, 2003). The running record measure which is
used to determine text reading level has good face validity (Clay, 2002) and established
reliabilities based on data from 96 urban children in fall 1990. Rasch item separation
reliability (equivalent to Cronbach’s Alpha) is .9896 (Wright, 1989).
Achievement data external to the OS are also collected as part of the national data
evaluation. Classroom teachers rank each student’s reading achievement relative to
classroom peers and report a reading group placement for fall and spring.
In addition, teachers collect data on the outcome status of each student’s series of
Reading Recovery lessons: successfully discontinued, recommended for further assessment
and action after a full series of lessons, moved, incomplete (which occurs if the student runs
out of time in the school year to receive a full series of lessons) or none of the above; a
category used if the student is removed from RR for unusual reasons such as placement back
in kindergarten.
Finally, background demographic variables including price paid for school lunches
(free, reduced, regular, used as a proxy for economic status), sex, language status and
race/ethnicity are also collected annually.
Participants
Predicting the Literacy Achievement of Struggling Readers Rodgers, Gomez-Bellenge, Wang & Schulz
9
Reading Recovery teachers use scores from the six tasks of the OS to select the
lowest achieving readers in first grade for the series of lessons. Their selection decisions are
externally validated in the national evaluation by the classroom teachers’ rankings of each
student. In 2002-03 for example, classroom teachers rated 92% of the students selected for
RR as being low readers in the fall of first grade. As well, when compared to a national
sample representing mainstream first grade children, students served by RR are
overwhelmingly concentrated in the low and low-average achievement quintiles for all six
tasks of the OS before receiving the intervention (Gómez-Bellengé & Rodgers, 2004).
Because Reading Recovery students are low achieving readers by definition, the
comparison sample that we formed for this study also needed to be comprised of low
achieving readers from the national comparison group. In order to form the two groups
from the national sample then, we first formed the comparison group (Not Reading
Recovery) from the national random sample (RS) and then randomly selected students from
the Reading Recovery (RR) group in order to have two matched groups.
We used the following steps to select students from the national sample for the
Reading Recovery and Not Reading Recovery groups:
1. Factor analysis was run using national data for RR students (n=137,887),
indicating a single factor which consists of all six measures of OS. The
combination of all six measures explains 52.75% of the total variance.
2. Percentile rankings of all random sample (RS) students’ (n=18,120) fall TRL in
the database were examined. All six measures of the OS were used to locate the
lowest 20th percentile. When the exact 20th percentile was not identifiable, the
closest percentile was used.

Predicting the Literacy Achievement of Struggling Readers Rodgers, Gomez-Bellenge, Wang & Schulz
10
3. Descriptive statistics including frequency distributions, box-plots and
histograms were scrutinized in order to select RS students with the same
characteristics as RR students with respect to all six measures of OS.
4. From the group of RS students who were not served by RR, we selected those
whose fall reading group was either lower middle or low in order to form the
Not Reading Recovery Group as a match with RR students whose fall reading
group was either lower middle or low.
5. Descriptive statistics of the means and percentile ranks as well as histograms for
fall TRL were compared between the selected groups from RS students and RR
students. The distributions and means were all very close to each other and
independent sample t-test failed to detect a statistically significant difference of
fall TRL between the two groups (p=.309).
6. To make data more interpretable, only White, Hispanic, and African American
students were selected among the race/ethnic group categories and students
eligible for regular and free-priced school lunches among the socio-economic
classifications. For students served by RR, only those who received a full series
of lessons (20 weeks), whether successful or not, were selected in order to
exclude those who had moved, run out of time at the end of the school year to
have a full series of lessons, or were removed from Reading Recovery under
unusual circumstances. Those children who received a full series of lessons
represent about 77% of all children served. We did not limit student selection
to only those who were selected, but only to those who had an opportunity to
receive the full intervention.

Predicting the Literacy Achievement of Struggling Readers Rodgers, Gomez-Bellenge, Wang & Schulz
11
The final sample of students contained 744 students in all. Table 1 displays the
demographic information of the sample.
Table 1: Demographic Characteristics of the Study Groups
Groups Reading
Recovery
Not Reading
Recovery
Sex
Boys (%)
Girls (%)
181 (48%)
197 (52%)
242 (66%)
124 (34%)
Race/Ethnicity White (%)
African American (%)
Hispanic (%)
205 (54%)
102 (27%)
71 (19%)
226 (62%)
81 (22%)
59 (16%)
Economic Status
Free School Lunch (%)
Regular Priced School
221 (58%)
157 (42%)
179 (49%)
187 (51%)
Table 2 contains the descriptive statistics of the sample for students in the Reading Recovery
group and those in the Not Reading Recovery group, on the fall Text Reading measure.
Table 2: Fall text level means and standard deviations (SD) for the final sample.
White
Mean(SD)
African
American
Mean(SD)
Hispanic
Mean(SD)
Free Lunch
Mean(SD)
Regular
Lunch
Mean(SD)
RR .91 (1.00) .63 (.86) .68 (.88) .66 (.85) .97 (1.05)
Not RR .85 (.85) .73 (.78) .57 (.72) .64 (.77) .91 (.84)
Total .88 (.92) .68 (.82) .62 (.80) .65 (.81) .94 (.94)

Predicting the Literacy Achievement of Struggling Readers Rodgers, Gomez-Bellenge, Wang & Schulz
12
Independent sample t-tests on all six tasks of the Observation Survey (Clay, 2002)
indicated that the RR group and Not RR group were similar to each other in the fall.
Although multiple t-tests introduce an increased chance of type-I error, no statistically
significant differences were found (all p’s >.10).
Model Building and Data Analysis
To test the effect that participation in Reading Recovery has on reaching a criterion
reading level, we used logistic regression analysis with students’ year end spring text reading
level (STRL) as the dependent variable and participating or not in Reading Recovery as an
independent variable. We also included variables which are thought to be powerful
predictors of a student’s reading progress economic status and race/ethnicity (e.g. Snow,
Burns, Griffin, 1998), We used lunch status (free or regular priced) as a proxy for
socioeconomic status (SES) and White or Other for race,
To classify students into two groups according to spring text reading level (STRL)
we set average performance in spring at text level 16. Students who scored at or above level
16 were considered successful, while those who scored below were considered unsuccessful.
We used text level 16 because it corresponds to the fourth Stanine on national norms
(Gómez-Bellengé & Thompson, 2005). Spring means on the TRL measure for each
subgroup of the sample are presented in Table 3, broken down by demographic
characteristics.
Predicting the Literacy Achievement of Struggling Readers Rodgers, Gomez-Bellenge, Wang & Schulz
13
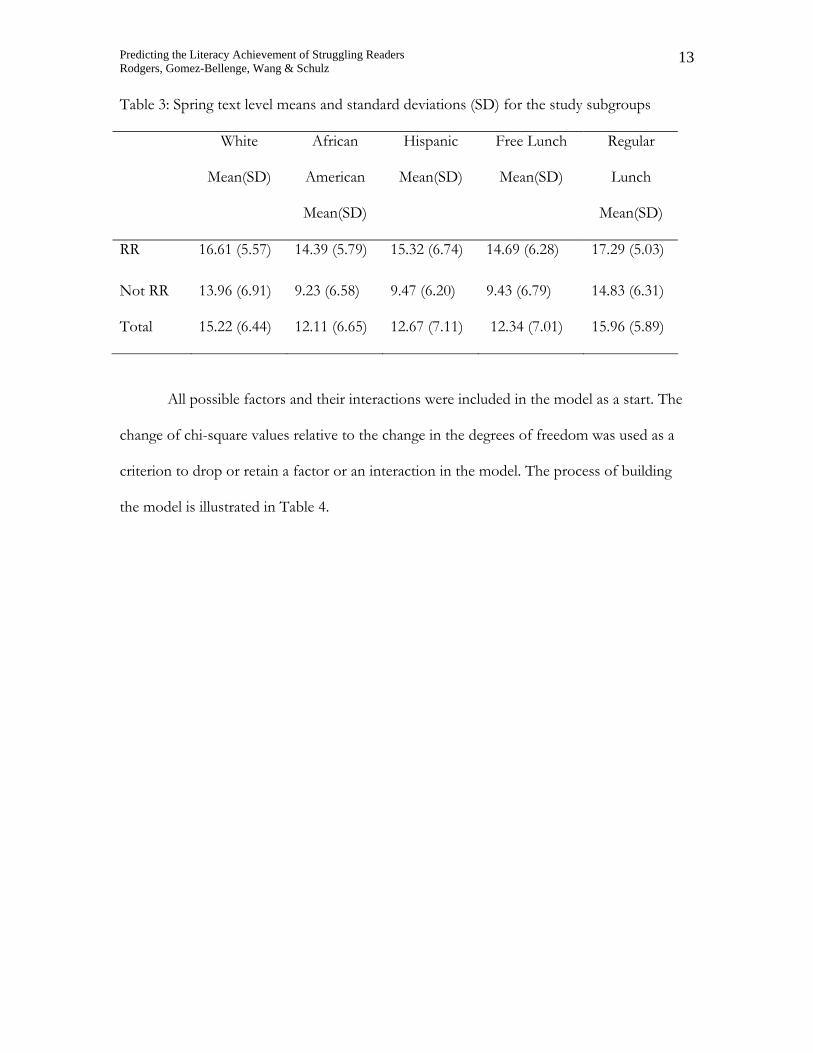
Table 3: Spring text level means and standard deviations (SD) for the study subgroups
White
Mean(SD)
African
American
Mean(SD)
Hispanic
Mean(SD)
Free Lunch
Mean(SD)
Regular
Lunch
Mean(SD)
RR 16.61 (5.57) 14.39 (5.79) 15.32 (6.74) 14.69 (6.28) 17.29 (5.03)
Not RR 13.96 (6.91) 9.23 (6.58) 9.47 (6.20) 9.43 (6.79) 14.83 (6.31)
Total 15.22 (6.44) 12.11 (6.65) 12.67 (7.11) 12.34 (7.01) 15.96 (5.89)
All possible factors and their interactions were included in the model as a start. The
change of chi-square values relative to the change in the degrees of freedom was used as a
criterion to drop or retain a factor or an interaction in the model. The process of building
the model is illustrated in Table 4.

Predicting the Literacy Achievement of Struggling Readers Rodgers, Gomez-Bellenge, Wang & Schulz
14
Table 4: Model Building with Logistic Regression
Predictors 2χ df Hosmer and
Lemeshow Test
(p-value)
2χΔ dfΔ p
Model 1
Race, SES,
RR
RR*Race
RR*SES
SES*Race
140.494 9.000 0.972
2 Race, SES,
RR
RR*Race
RR*SES
138.191 7.000 0.985Model1-
Model22.303 2.000 0.316
3 Race, SES,
RR
RR*SES
133.664 5.000 0.808Model2-
Model34.527 2.000 0.104
4 Race, SES,
RR
RR*Race
135.460 6.000 0.591Model 2-
Model 42.731 1.000 0.098
5 SES, RR
RR*SES 132.197 3.000 1.000
Model 3-
Model 51.467 2.000 0.480

Predicting the Literacy Achievement of Struggling Readers Rodgers, Gomez-Bellenge, Wang & Schulz
15
Note: Model 5 was selected as the final model because dropping Race from Model 3 did not
make a significant change to the chi-square value relative to the change of the degree of
freedom (p=.480).
The final model included RR, SES, and the interaction between these two factors.
Table 5 contains the coefficients and Wald statistics of the final model.
Table 5. Logistic Regression Using Text Reading Level as the Criterion for Success or Not
Variable B Wald Exp(B)
RR or Not (RR) -1.789 62.206** .167
(.227)
Economic Status (SES) -1.650 50.872** .192
(.231)
RR * SES .893 7.587** 2.441
(.324)
Constant 1.040 32.766 2.829
(.182)
Note: G2 = 946.212; Cox & Snell R2=.156. Nagelkerke R2 = .208. **p <.01. Standard error
indicated in parentheses.
Since the interaction between RR and economic status (SES) was significant (Table
4), we examined whether this interaction was orthogonal or not to see if we could interpret
one factor for each level of the other factor. Figure 1 shows the percentages of RR and not-
RR students who met the success criterion for each level of SES (free lunch versus regular
lunch) and the percentages of students receiving free lunch and regular lunch who met the
criterion for each level of RR or not (RR versus not-RR). Neither of these trends indicates a

Predicting the Literacy Achievement of Struggling Readers Rodgers, Gomez-Bellenge, Wang & Schulz
16
non-orthogonal interaction. Therefore, we can interpret the factor of RR for each level of
SES (free lunch versus regular lunch).
0
10
20
30
40
50
60
70
80
Not RR RR
Free LunchRgular Lunch
0
10
20
30
40
50
60
70
80
Free Lunch Regular Lunch
Not RRRR
Figure 1: Success Rate for Each Group of Students under Study
Appendix A is a crosstab that shows the success and non-success frequencies and
rates for RR and Not RR students as well as free lunch and regular lunch students. Figure 2
illustrates the frequencies of success and not-success for RR students and Not RR students
with regular and free school lunches respectively.

Predicting the Literacy Achievement of Struggling Readers Rodgers, Gomez-Bellenge, Wang & Schulz
17
Figure 2: Frequencies of Success and Not-Success for Each Group of Students
Results
The model was a good fit (G2 = 946.212; df = 3) and the variables for students’
economic status and whether they were served by RR or not exceeded the usual significance
levels (p<.01). Race (African American, White, or Hispanic) was not significant. The
Bayesian Information Criterion (BIC) (Pampel, 2000) was 55.59 for RR or Not and 44.26 for
economic status, suggesting both variables were very strong predictors of students’ TRL in
spring.
Since both factors in the model, RR or not and SES are dichotomous, the
coefficients for this logistic regression represent the change in log odds for success in TRL
when a student is identified as RR or not and free lunch or regular lunch. Negative values
favor RR or regular lunch and positive values favor Not RR and free lunch.
An odds ratio is the probability of an event occurring (p) divided by the probability
of an event not occurring (1-p)., The coefficient for RR or not is -1.789. This means that the
odds of success for Not RR students decreased by a factor of e-1.789, or 0.167. This is the new
0 20 40 60 80
100 120 140 160 180
Not RR RR Not RR RR
Free Lunch Regular Lunch
Not Successful Success

Predicting the Literacy Achievement of Struggling Readers Rodgers, Gomez-Bellenge, Wang & Schulz
18
odds ratio for students not served by RR when student SES is controlled. With the odds
ratio of 0.167, the probability of success (p) is 0.14. When applied to 100 Not RR students
who have the same SES, only 14 students succeeded in reading using TRL 16 as a criterion.
This implies that not providing RR to students of the same SES changes the 50-50 sample to
14 students succeeded and 86 students failed (Figure 3.A).
Similarly, the coefficient for SES is -1.650. This means that the odds of success
decreased by a factor of e-1.650, or 0.192. This is the new odds ratio for students having free
lunch when students’ status in RR is controlled. With the odds ratio of 0.192, the probability
of success (p) is 0.16. When applied to 100 Free Lunch students whose status of RR is the
same, only 16 students succeeded in reading using TRL as a measure. This implies that free
lunch status changes the 50-50 sample to 16 students succeeded and 84 students failed
(Figure 3.B).
14%
86%
successnot success
16%
84%
successnot success
(A) (B)
Figure 3: Probability of Success for Not RR Students When Their SES is Controlled (A) and
for Free Lunch Students Whose RR status is Controlled (B)

Predicting the Literacy Achievement of Struggling Readers Rodgers, Gomez-Bellenge, Wang & Schulz
19
Discussion
We hypothesized that participating in Reading Recovery, an early literacy
intervention, would be related to a student’s reading achievement at the end of first grade
and the analyses supported that hypothesis. We also found that students’ economic status
was significantly related to their achievement in reading in spring, supporting research that
shows pronounced differences in the achievement of children along economic lines (see
Snow, Burns & Griffin, 1998 for an extensive review of the literature).
The more significant finding, however, is that the logistic regression reported higher
absolute coefficient values for the variable of being served or not served by Reading
Recovery than for the variable of economic status, indicating that having an early literacy
intervention is more significantly related to students’ performance in reading in spring than
students’ economic status. The model building process revealed that race, the interaction
between race and RR, and the interaction between race and SES are all dropped from the
logistic regression model, indicating that race is not a statistically significant predictor of
first-grader’s success in reading when other variables, RR and SES, are controlled. This
finding underscores the potency, we think, of teaching and of intervening early to make a
difference in students’ reading progress.
The progress of RR students runs counter to what might normally be expected for
low achieving students. Evidence from longitudinal research suggests that it is extremely
unlikely that children will change their rank within their cohort: the lowest achieving first
grade students tend to remain low achieving through fourth grade, and average students tend
to remain average (Juel, 1988).
Our findings support Bainbridge and Lasley’s hypothesis that it will take a systemic
effort, and not a “one-shot workshop” or a “quick fix” to make a difference to the
Predicting the Literacy Achievement of Struggling Readers Rodgers, Gomez-Bellenge, Wang & Schulz
20
achievement gap. Reading Recovery teachers take part in professional development for a
year that comprises weekly graduate classes with a focus on the teaching of children. .
Following the first year of weekly professional development, Reading Recovery teachers take
part in regularly scheduled, ongoing professional development sessions, so they continue to
focus on teaching and learning after their initial training year. The sustained nature of the
professional development of Reading Recovery, along with the in-depth, long-term nature of
the training, qualifies it, we think, as a systemic effort.
Limitations
Findings are limited because the data are from a quasi-experimental instead of an
experimental design. Students served by Reading Recovery and student not served by
Reading Recovery are from different school districts and different regions, therefore, other
factors such as teaching practices, school policies, and regional differences also impact
students’ achievement in reading and are unaccounted for in this study.
Educational Significance
Reading difficulties and the achievement gap are well-documented problems in the
literacy field and related findings are of considerable interest to educational researchers. By
now, the gains made by students who receive an early intervention are familiar to educators,
but findings that show differential progress that narrows or closes the achievement gap are
recent. To date, intervening early has not been evaluated as a predictor of student
achievement, therefore this study may add to our understanding of the impact of an early
intervention, such as Reading Recovery, on student achievement and on the achievement
gap.
Several important implications for educators and administrators arise from the
findings of this study. First, we think a complex response to the achievement gap is called

Predicting the Literacy Achievement of Struggling Readers Rodgers, Gomez-Bellenge, Wang & Schulz
21
for because the reasons for the gap existing along racial and economic lines are complex.
Societal factors play out within and outside the school that are resistant to change and affect
each child’s future. While we cannot draw a causal relationship between the teachers’
Reading Recovery professional development to the progress of the Reading Recovery
students, the results of Pinnell, Lyons, Deford, Bryk and Seltzer’s (1994) quasi-experimental
study lead us to think that the instruction and the teacher training likely did make a
difference to student achievement. An investment in long term professional development in
which teachers receive specialized preparation to work with the lowest achieving children,
may constitute a complex response to a complex problem.
Finally, in order to make a difference to the achievement gap, it seems that educators
should intervene early, as soon as students fall behind their peers, to provide help to children
having difficulty learning to read as soon as they can be identified. This response may mean
a shifting of resources, away from the current trend of allocating more teacher time to help
third or fourth grade children pass high stakes tests, to providing extra help early on when
students initially fall behind.
It is wholly unacceptable that factors which place children at risk for reading
difficulties would have to do with their race/ethnicity or family economic status, yet as Zill
(2002) points out, this seems to be the case. We agree with Bainbridge and Lasley (2002) that
race/ethnicity and economic status are not in and of themselves determining factors; school
effects play a large role in the gap. We suggest that it will take changes in school effects, in
the form of one-to-one teaching with specially trained teachers, and intervening earlier rather
than later, to make a difference to the achievement gap.

Predicting the Literacy Achievement of Struggling Readers Rodgers, Gomez-Bellenge, Wang & Schulz
22
References Askew, B. J., Fountas, I. C., Lyons, C. A., Pinnell, G. S., Schmitt, M. C., (1988) Reading
Recovery Review: Understandings Outcomes & Implications. Reading Recovery Council of
North America, Columbus OH. (1998).
Bainbridge, W. L., & Lasley, T. (2002). Demographics, diversity, and K-12 accountability:
The challenge of closing the achievement gap. Education and Urban Society, 34, 422-
437.
Clay, M. M. (1993/2002). An observation survey of early literacy achievement. Portsmouth, NH:
Heinemann.
Clay, M. M. (2002). An observation survey of early literacy achievement. Auckland, New Zealand
Heinemann.
Dantas, M.L. (2003). You go to b ab t rod the 16 levo [You got to be able to read the 16
level]: Derek’s literacy learning story in first grade. Literacy teaching and learning, 7, 31-
55.
Denton, K., & West, J. (2002). Children's reading and mathematics achievement in kindergarten and
first grade (ERIC Document Reproduction Service No. ED461438).
Denton, K., West, J., & Walston, J. (2003). Reading: Young children's achievement and
classroom experiences. Retrieved February 9, 2004, from the National Center for
Education Statistics Web site: http://nces.ed.gov/pubs2003/2003070.pdf
Gómez-Bellengé, F. X., Rodgers, E. (2004). Reading Recovery and Descubriendo la Lectura
National Report, 2002 - 2003. Columbus, OH: National Data Evaluation Center.
Juel, C. (1988). Learning to read and write: A longitudinal study of fifty-four children from
first through fourth grades. Journal of Educational Psychology, 80(4), 437-447.

Predicting the Literacy Achievement of Struggling Readers Rodgers, Gomez-Bellenge, Wang & Schulz
23
Land, D., & Legters, N. (2002). The extent and consequences of risk in U.S. education. In S.
Stringfield & D. Land (Eds.), Educating at-risk students (pp. 1-28). Chicago, IL:
National Society for the Study of Education.
Lee, J. (2002). Racial and ethnic achievement gap trends: Reversing the progress toward
equity? Educational Researcher, 31(1), 3-12
Luria, A.R. (1982). Language and cognition. NY: Wiley.
McNaughton, S., Phillips, G., & MacDonald, S. (2003). Profiling teaching and learning needs
in beginning literacy instruction: The case of children in "low decile" schools in New
Zealand. Journal of Literacy Research, 35, 703 - 770.
Pinnell, G. S., Lyons, C. A., DeFord, D. E., Bryk, A. S., & Seltzer, M. (1994). Comparing
instructional models for the literacy education of high-risk first graders. Reading
Research Quarterly, 29, 8-39.
Rodgers, E. (2005). Interactions that scaffold reading performance. Journal Of Literacy
Research, 36, 501-532.
Rodgers, E., Gómez-Bellengé, F.X. & Wang, C. (2004, April). Closing the literacy achievement
gap with early intervention. Paper presented at the Annual Meeting of the American
Educational Research Association, San Diego, CA.
Snow, C.E., Burns, M.S., & Griffin, P. (Eds.) (1998). Preventing reading difficulties in young
children. Washington, DC: National Academy Press.
U.S. Department of Education. (2001). The Nation's Report Card: Fourth-Grade Reading 2000.
Retrieved June 25, 2003, from the National Center for Education Statistics Web site:
http://nces.ed.gov/nationsreportcard/
Vellutino, F. R., & Scanlon, D. M. (2002). Research for the future: The interactive strategies
approach to reading intervention. Contemporary Educational Psychology, 27, 573-635.

Predicting the Literacy Achievement of Struggling Readers Rodgers, Gomez-Bellenge, Wang & Schulz
24
Wasik, B. A., & Slavin, R. E. (1993). Preventing early reading failure with one-to-one
tutoring: A review of five programs. Reading Research Quarterly, 28, 179-200.
West, J., Denton, K., & Germino Hausken, E. (2000). Kindergartners' educational progress
in reading: A study of language minority and non-language minority children.
Education Statistics Quarterly, 2(1), 7-13.
West, J., Denton, K., & Reaney, L. M. (2000). The kindergarten year: Findings from the early
childhood longitudinal study, kindergarten class of 1998-99. Education Statistics
Quarterly, 2(4), 25-30.
Zill, N., & West, J. (2000). Entering kindergarten: A portrait of American children when they begin
school. Findings from the condition of education, 2000 (ERIC Document Reproduction
Service No. ED448899).

Predicting the Literacy Achievement of Struggling Readers Rodgers, Gomez-Bellenge, Wang & Schulz
25
Appendix A. Crosstab: Interaction between RR and SES
Student Lunch binomial Success
not success success Total RR or not Count 167 37 204Not RR
% within RR or not 81.9% 18.1% 100.0%
Count 95 126 221RR
% within RR or not 43.0% 57.0% 100.0%
Free Lunch
Total Count 262 163 425% within RR or not 61.6% 38.4% 100.0%
RR or not Count 91 105 196Not RR
% within RR or not 46.4% 53.6% 100.0%
Count 41 116 157RR
% within RR or not 26.1% 73.9% 100.0%
Regular Lunch
Total Count 132 221 353% within RR or not 37.4% 62.6% 100.0%