A Synthesis of Reading Interventions and Effects on Reading Comprehension Outcomes for Older...
33
A Synthesis of Reading Interventions and Effects on Reading Comprehension Outcomes for Older Struggling Readers Meaghan S. Edmonds, Sharon Vaughn, Jade Wexler, Colleen Reutebuch, Amory Cable, Kathryn Klingler Tackett, and Jennifer Wick Schnakenberg University of Texas at Austin Abstract This article reports a synthesis of intervention studies conducted between 1994 and 2004 with older students (Grades 6–12) with reading difficulties. Interventions addressing decoding, fluency, vocabulary, and comprehension were included if they measured the effects on reading comprehension. Twenty-nine studies were located and synthesized. Thirteen studies met criteria for a meta-analysis, yielding an effect size (ES) of 0.89 for the weighted average of the difference in comprehension outcomes between treatment and comparison students. Word-level interventions were associated with ES = 0.34 in comprehension outcomes between treatment and comparison students. Implications for comprehension instruction for older struggling readers are described. Keywords reading; meta-analysis; comprehension Although educators have historically emphasized improving students’ reading proficiency in the elementary school years, reading instruction for secondary students with reading difficulties has been less prevalent. As a result, secondary students with reading difficulties are infrequently provided reading instruction, thus widening the gap between their achievement and that of their grade-level peers. Recent legislation, such as the No Child Left Behind Act (NCLB; 2002), has prompted schools to improve reading instruction for all students, including those in middle and high school. Many secondary students continue to demonstrate difficulties with reading, and educators continue to seek information on best practices for instructing these students. The National Assessment of Educational Progress (NAEP) administered a reading assessment in 2002 to approximately 343,000 students in Grades 4 and 8. According to the NAEP data, there was no significant change in progress for students between 1992 and 2002, and Grade 8 scores in 2003 actually decreased (Grigg, Daane, Jin, & Campbell, 2003). The NAEP also conducted a long-term trend assessment in reading, which documented performance from 1971 to 2004 for students ages 9, 13, and 17. Although scores for the 9-year-olds showed improvements compared to the scores for this age in 1971 and 1999, this was not the case for the 13- and 17-year-olds. Although the scores at the 75th and 90th percentile for the 13-year- olds significantly improved from 1971 to 2004, there were no significant differences between scores in 1999 and 2004. For the 17-year-olds, there were no significant differences at any of the percentiles selected in 2004, nor were there differences between the 1971 and 1999 scores. These data suggest that the education system is not effectively preparing some adolescents for reading success and that information on effective instructional practices is needed to improve these trends. NIH Public Access Author Manuscript Rev Educ Res. Author manuscript; available in PMC 2010 January 12. Published in final edited form as: Rev Educ Res. 2009 March 1; 79(1): 262–300. doi:10.3102/0034654308325998. NIH-PA Author Manuscript NIH-PA Author Manuscript NIH-PA Author Manuscript
Transcript of A Synthesis of Reading Interventions and Effects on Reading Comprehension Outcomes for Older...

A Synthesis of Reading Interventions and Effects on ReadingComprehension Outcomes for Older Struggling Readers
Meaghan S. Edmonds, Sharon Vaughn, Jade Wexler, Colleen Reutebuch, Amory Cable,Kathryn Klingler Tackett, and Jennifer Wick SchnakenbergUniversity of Texas at Austin
AbstractThis article reports a synthesis of intervention studies conducted between 1994 and 2004 with olderstudents (Grades 6–12) with reading difficulties. Interventions addressing decoding, fluency,vocabulary, and comprehension were included if they measured the effects on readingcomprehension. Twenty-nine studies were located and synthesized. Thirteen studies met criteria fora meta-analysis, yielding an effect size (ES) of 0.89 for the weighted average of the difference incomprehension outcomes between treatment and comparison students. Word-level interventionswere associated with ES = 0.34 in comprehension outcomes between treatment and comparisonstudents. Implications for comprehension instruction for older struggling readers are described.
Keywordsreading; meta-analysis; comprehension
Although educators have historically emphasized improving students’ reading proficiency inthe elementary school years, reading instruction for secondary students with reading difficultieshas been less prevalent. As a result, secondary students with reading difficulties areinfrequently provided reading instruction, thus widening the gap between their achievementand that of their grade-level peers. Recent legislation, such as the No Child Left Behind Act(NCLB; 2002), has prompted schools to improve reading instruction for all students, includingthose in middle and high school. Many secondary students continue to demonstrate difficultieswith reading, and educators continue to seek information on best practices for instructing thesestudents.
The National Assessment of Educational Progress (NAEP) administered a reading assessmentin 2002 to approximately 343,000 students in Grades 4 and 8. According to the NAEP data,there was no significant change in progress for students between 1992 and 2002, and Grade 8scores in 2003 actually decreased (Grigg, Daane, Jin, & Campbell, 2003). The NAEP alsoconducted a long-term trend assessment in reading, which documented performance from 1971to 2004 for students ages 9, 13, and 17. Although scores for the 9-year-olds showedimprovements compared to the scores for this age in 1971 and 1999, this was not the case forthe 13- and 17-year-olds. Although the scores at the 75th and 90th percentile for the 13-year-olds significantly improved from 1971 to 2004, there were no significant differences betweenscores in 1999 and 2004. For the 17-year-olds, there were no significant differences at any ofthe percentiles selected in 2004, nor were there differences between the 1971 and 1999 scores.These data suggest that the education system is not effectively preparing some adolescents forreading success and that information on effective instructional practices is needed to improvethese trends.
NIH Public AccessAuthor ManuscriptRev Educ Res. Author manuscript; available in PMC 2010 January 12.
Published in final edited form as:Rev Educ Res. 2009 March 1; 79(1): 262–300. doi:10.3102/0034654308325998.
NIH
-PA Author Manuscript
NIH
-PA Author Manuscript
NIH
-PA Author Manuscript

ExpectationsSecondary students face increasing accountability measures along with a great deal of pressureto meet the demands of more difficult curricula and content (Swanson & Hoskyn, 2001). Inthe past decade, students have become responsible for learning more complex content at a rapidpace to meet state standards and to pass outcome assessments (Woodruff, Schumaker, &Deschler, 2002).
Our educational system expects that secondary students are able to decode fluently andcomprehend material with challenging content (Alvermann, 2002). Some struggling secondaryreaders, however, lack sufficient advanced decoding, fluency, vocabulary, and comprehensionskills to master the complex content (Kamil, 2003).
In a climate where many secondary students continue to struggle with reading and schools faceincreasingly difficult accountability demands, it is essential to identify the instruction that willbenefit struggling secondary readers. Secondary teachers require knowledge of best practicesto provide appropriate instruction, prevent students from falling farther behind, and help bringstruggling readers closer to reading for knowledge and pleasure.
Comprehension ResearchThe ultimate goal of reading instruction at the secondary level is comprehension—gainingmeaning from text. A number of factors contribute to students’ not being able to comprehendtext. Comprehension can break down when students have problems with one or more of thefollowing: (a) decoding words, including structural analysis; (b) reading text with adequatespeed and accuracy (fluency); (c) understanding the meanings of words; (d) relating contentto prior knowledge; (e) applying comprehension strategies; and (f) monitoring understanding(Carlisle & Rice, 2002; National Institute for Literacy, 2001; RAND Reading Study Group,2002).
Because many secondary teachers assume that students who can read words accurately canalso comprehend and learn from text simply by reading, they often neglect teaching studentshow to approach text to better understand the content. In addition, because of increasingaccountability, many teachers emphasize the content while neglecting to instruct students onhow to read for learning and understanding (Pressley, 2000; RAND Reading Study Group,2002). Finally, the readability level of some text used in secondary classrooms may be too highfor below-grade level readers, and the “unfriendliness” of some text can result incomprehension challenges for many students (Mastropieri, Scruggs, & Graetz, 2003).
The RAND Reading Study Group (2002) created a heuristic for conceptualizing readingcomprehension. Fundamentally, comprehension occurs through an interaction among threecritical elements: the reader, the text, and the activity. The capacity of the reader, the valuesascribed to text and text availability, and reader’s activities are among the many variables thatare influenced and determined by the sociocultural context that both shapes and is shaped byeach of the three elements. This synthesis addresses several critical aspects of this proposedheuristic—the activity or intervention provided for students at risk and, when described in thestudy, the text that was used. Because the synthesis focuses on intervention research, questionsabout what elements of interventions were associated with reading comprehension wereaddressed. This synthesis was not designed to address other critical issues, including the valuesand background of readers and teachers and the context in which teachers and learnersinteracted. Many of the social and affective variables associated with improved motivation andinterest in text for older readers and how these variables influenced outcomes are part of theheuristic of reading comprehension, but we were unable to address them in this synthesis.
Edmonds et al. Page 2
Rev Educ Res. Author manuscript; available in PMC 2010 January 12.
NIH
-PA Author Manuscript
NIH
-PA Author Manuscript
NIH
-PA Author Manuscript

Rationale and Research QuestionMany of the instructional practices suggested for poor readers were derived from observing,questioning, and asking good and poor readers to “think aloud” while they read (Dole, Duffy,Roehler, & Pearson, 1991; Heilman, Blair, & Rupley, 1998; Jiménez, Garcia, & Pearson,1995, 1996). These reports described good readers as coordinating a set of highly complex andwell-developed skills and strategies before, during, and after reading so that they couldunderstand and learn from text and remember what they read (Paris, Wasik, & Tumer, 1991).When compared with good readers, poor readers were considerably less strategic (Paris,Lipson, & Wixson, 1983). Good readers used the following skills and strategies: (a) readingwords rapidly and accurately; (b) noting the structure and organization of text; (c) monitoringtheir understanding while reading; (d) using summaries; (e) making predictions, checking themas they read, and revising and evaluating them as needed; (g) integrating what they know aboutthe topic with new learning; and (h) making inferences and using visualization (Jenkins,Heliotis, Stein, & Haynes, 1987; Kamil, 2003; Klingner, Vaughn, & Boardman, 2007;Mastropieri, Scruggs, Bakken, & Whedon, 1996; Pressley & Afflerbach, 1995; Swanson,1999; Wong & Jones, 1982).
Previous syntheses have identified critical intervention elements for effective readinginstruction for students with disabilities across grade levels (e.g., Gersten, Fuchs, Williams, &Baker, 2001; Mastropieri et al., 1996; Swanson, 1999). For example, we know that explicitstrategy instruction yields strong effects for comprehension for students with learningdifficulties and disabilities (Biancarosa & Snow, 2004; Gersten et al., 2001; National ReadingPanel [NRP], 2000; RAND Reading Study Group, 2002; Swanson, 1999). We also know thateffective comprehension instruction in the elementary grades teaches students to summarize,use graphic organizers, generate and answer questions, and monitor their comprehension(Mastropieri et al., 1996; Kamil, 2004).
However, despite improved knowledge about effective reading comprehension broadly, muchless is known regarding effective interventions and reading instruction for students with readingdifficulties in the middle and high school grades (Curtis & Longo, 1999). The synthesespreviously discussed focused on students identified for special education, examined specificcomponents of reading, and did not present findings for older readers. In recognition of thisvoid in the research, the report on comprehension from the RAND Reading Study Group(2002) cited the need for additional knowledge on how best to organize instruction for low-achieving students. We have conducted the following synthesis to determine the outcome ofcomprehension, word study, vocabulary, and fluency interventions on reading comprehensionof students in Grades 6 through 12. Furthermore, we extended the synthesis to include allstruggling readers, not just those with identified learning disabilities. We addressed thefollowing question: How does intervention research on decoding, fluency, vocabulary, andcomprehension influence comprehension outcomes for older students (Grades 6 through 12)with reading difficulties or disabilities?
MethodFor this synthesis, we conducted a comprehensive search of the literature through a three-stepprocess. The methods described below were developed during prior syntheses conducted byteam members (Kim, Vaughn, Wanzek & Wei, 2004; Wanzek, Vaughn, Wexler, Swanson, &Edmonds, 2006). We first conducted a computer search of ERIC and PsycINFO to locatestudies published between 1994 and 2004. We selected the last decade of studies to reflect themost current research on this topic. Descriptors or root forms of those descriptors (readingdifficult*, learning disab*, LD, mild handi*, mild disab* reading disab*, at-risk, high-risk,reading delay*, learning delay*, struggle reader, dyslex*, read*, comprehen*, vocabulary,fluen*, word, decod*, English Language Arts) were used in various combinations to capture
Edmonds et al. Page 3
Rev Educ Res. Author manuscript; available in PMC 2010 January 12.
NIH
-PA Author Manuscript
NIH
-PA Author Manuscript
NIH
-PA Author Manuscript
the greatest possible number of articles. We also searched abstracts from prior syntheses andreviewed reference lists in seminal studies to assure that all studies were identified.
In addition, to assure coverage and because a cumulative review was not located in electronicdatabases or reference lists, a hand search of 11 major journals from 1998 through 2004 wasconducted. Journals examined in this hand search included Annals of Dyslexia, ExceptionalChildren, Journal of Educational Psychology, Journal of Learning Disabilities, Journal ofSpecial Education, Learning Disability Quarterly, Learning Disabilities Research andPractice, Reading Research Quarterly, Remedial and Special Education, and Scientific Studiesof Reading.
Studies were selected if they met all of the following criteria:
• Participants were struggling readers. Struggling readers were defined as low achieversor students with unidentified reading difficulties, with dyslexia, and/or with reading,learning, or speech or language disabilities. Studies also were included ifdisaggregated data were provided for struggling readers regardless of thecharacteristics of other students in the study. Only disaggregated data on strugglingreaders were used in the synthesis.
• Participants were in Grades 6 through 12 (ages 11–21). This grade range was selectedbecause it represents the most common grades describing secondary students. Whena sample also included older or younger students and it could be determined that thesample mean age was within the targeted range, the study was accepted.
• Studies were accepted when research designs used treatment–comparison, single-group, or single-subject designs.
• Intervention consisted of any type of reading instruction, including word study,fluency, vocabulary, comprehension, or a combination of these.
• The language of instruction was English.
• At least one dependent measure assessed one or more aspects of reading.
• Data for calculating effect sizes were provided in treatment–comparison and single-group studies.
• Interrater agreement for article acceptance or rejection was calculated by dividing thenumber of agreements by the number of agreements plus disagreements and wascomputed as 95%.
Data AnalysisCoding procedures—We employed extensive coding procedures to organize pertinentinformation from each study. We adapted previously designed code sheets that were developedfor past intervention syntheses (Kim, Vaughn, Wanzek, & Wei, 2004). The code sheet includedelements specified in the What Works Clearinghouse Design and Implementation AssessmentDevice (Institute of Education Sciences, 2003), a document used to evaluate the quality ofstudies.
The code sheet was used to record relevant descriptive criteria as well as results from eachstudy, including data regarding participants (e.g., number, sex, exceptionality type), studydesign (e.g., number of conditions, assignment to condition), specifications about conditions(e.g., intervention, comparison), clarity of causal inference, and reported findings. Participantinformation was coded using four forced-choice items (socioeconomic status, risk type, theuse of criteria for classifying students with disabilities, and gender) and two open-ended items(age as described in text and risk type as described in text). Similarly, design information was
Edmonds et al. Page 4
Rev Educ Res. Author manuscript; available in PMC 2010 January 12.
NIH
-PA Author Manuscript
NIH
-PA Author Manuscript
NIH
-PA Author Manuscript

gathered using a combination of forced-choice (e.g., research design, assignment method,fidelity of implementation) and open-ended items (selection criteria). Intervention andcomparison information was coded using 10 open-ended items (e.g., site of intervention, roleof person implementing intervention, duration of intervention) as well as a written descriptionof the treatment and comparison conditions.
Information on clarity of causal inference was gathered using 11 items for true experimentaldesigns (e.g., sample sizes, attrition, plausibility of intervention contaminants) and 15 itemsfor quasiexperimental designs (e.g., equating procedures, attrition rates). Additional itemsallowed coders to describe the measures and indicate measurement contaminants. Finally, theprecision of outcome for both effect size estimation and statistical reporting was coded usinga series of 10 forced-choice yes–no questions, including information regarding assumptionsof independence, normality, and equal variance. Effect sizes were calculated using informationrelated to outcome measures, direction of effects, and reading outcome data for eachintervention or comparison condition.
After extensive training (more than 10 hr) on the use and interpretation of items from the codesheet, interrater reliability was determined by having six raters independently code a singlearticle. Responses from the six coders were used to calculate the percentage of agreement (i.e.,agreements divided by agreements plus disagreements). An interrater reliability of .85 wasachieved. Teams of three coded each article, compared results, and resolved any disagreementsin coding, with final decisions reached by consensus. To assure even higher reliability than .85 on coding, any item that was not unambiguous to coders was discussed until a clear codingresponse could be determined. Finally, two raters who had achieved 100% reliability on itemsrelated to outcome precision and data calculated effect sizes for each study.
After the coding had been completed, the studies were summarized in a table format. Table 1contains information on study design, sample, and intervention implementation (e.g., durationand implementation personnel). In Table 2, intervention descriptions and effect sizes forreading outcomes are organized by each study’s intervention type and design. Effect sizes andp values are provided when appropriate data were available.
Effect size calculation—Effect sizes were calculated for studies that provided adequateinformation. For studies lacking data necessary to compute effect sizes, data were summarizedusing findings from statistical analyses or descriptive statistics. For treatment–comparisondesign studies, the effect size, d, was calculated as the difference between the mean posttestscore of the participants in the intervention condition minus the mean posttest score of theparticipants in the comparison condition divided by the pooled standard deviation. For studiesin this synthesis that employed a treatment–comparison design, effect sizes can be interpretedas d = 0.20 is small, d = 0.50 is medium, and d = 0.80 is a large effect (Cohen, 1988). Effectswere adjusted for pretest differences when data were provided. For single-group studies, effectsizes were calculated as the standardized mean change (Cooper, 1998). Outcomes from single-subject studies were calculated as the percentage of nonoverlapping data (PND) (Scruggs,Mastropieri, & Casto, 1987). PND is calculated as the percentage of data points during thetreatment phase that are higher than the highest data point from the baseline phase. PND wasselected because it offered a more parsimonious means of reporting outcomes for single-subjectstudies and provided common criteria for comparing treatment impact.
ResultsData Analysis Plan
A range of study designs and intervention types was represented in this synthesis. To fullyexplore the data, we conducted several types of analyses. First, we synthesized study features
Edmonds et al. Page 5
Rev Educ Res. Author manuscript; available in PMC 2010 January 12.
NIH
-PA Author Manuscript
NIH
-PA Author Manuscript
NIH
-PA Author Manuscript
(e.g., sample size and study design) to highlight similarities, differences, and salient elementsacross the corpus of studies. Second, we conducted a meta-analysis of a subset of treatment–comparison design studies to determine the overall effect of reading interventions on students’reading comprehension. In addition to an overall point estimate of reading intervention effects,we reported effects on comprehension by measurement and intervention type. Last, wesynthesized trends and results by intervention type across all studies, including single-groupand single-subject design studies.
Study FeaturesA total of 29 intervention studies, all reported in journal articles, met our criteria for inclusionin the synthesis. Studies appeared in a range of journals (as can be seen in the reference list)and were distributed relatively evenly across the years of interest (1994 to 2004). Each study’sdesign and sample characteristics are described in Table 1. In the following sections, wesummarize information on study features, including sample characteristics, design, andduration of the intervention as well as fidelity of implementation.
Sample characteristics—The 29 studies included 976 students. Sample sizes ranged from1 to 125, with an average of 51 participants for treatment–comparison studies. The majorityof studies targeted middle school students (n = 19). Five studies focused on high schoolstudents, 2 on both middle and high school students, and 3 reported only students’ ages.Although our criteria included interventions for all struggling readers, including those withoutidentified disabilities, only 8 studies included samples of struggling readers without disabilities.The other studies included students with learning or reading disabilities (n = 17) or acombination of both students with and without disabilities (n = 4).
Study design—The corpus of studies included 17 treatment–comparison, 9 single-subject,and 3 single-group design studies. The distribution of intervention type by design is displayedin Table 3. The number of treatment–comparison studies with specific design elements thatare characteristic of high quality studies (Institute of Education Sciences, 2003;Raudenbush,2005;Shadish, 2002) is indicated in Table 4. The three elements in Table 4 were selectedbecause they strengthen the validity of study conclusions when appropriately employed. Asindicated, only 2 studies (Abbott & Berninger, 1999;Allinder, Dunse, Brunken, & Obermiller-Krolikowski, 2001) randomly assigned students to conditions, reported implementationfidelity, and measured student outcomes using standardized measures.
Intervention design and implementation—The number of intervention sessions rangedfrom 2 to 70. For 11 studies, the number of sessions was not reported and could not bedetermined from the information provided. Similarly, the frequency and length of sessions wasinconsistently reported but is provided in Table 1 when available. For studies that reported thelength and number of sessions (n = 12), students were engaged in an average of 23 hr ofinstruction. For treatment–comparison design studies, the average number of instructionalhours provided was 26 (n = 10).
Narrative text was used in most text-level interventions (n = 12). Two studies used bothnarrative and expository text during the intervention, and 7 used expository text exclusively.For 4 studies, the type of text used was not discernable, and as would be expected, the word-level studies did not include connected text. About an equal number of study interventions wasimplemented by teachers (n = 13) and researchers (n = 12). Two interventions wereimplemented by both teachers and researchers, and the person implementing the interventioncould not be determined from 2 studies.
Edmonds et al. Page 6
Rev Educ Res. Author manuscript; available in PMC 2010 January 12.
NIH
-PA Author Manuscript
NIH
-PA Author Manuscript
NIH
-PA Author Manuscript

Meta-AnalysisTo summarize the effect of reading interventions on students’ comprehension, we conducteda meta-analysis of a study subset (k = 13; Abbott & Berninger, 1999; Alfassi, 1998; Allinderet al., 2001; Anderson, Chan, & Henne, 1995; DiCecco & Gleason, 2002; L. S. Fuchs, Fuchs,& Kazdan, 1999; Hasselbring & Goin, 2004; Jitendra, Hoppes, & Xin, 2000; Mastropieri etal., 2001; Moore & Scevak, 1995; Penney, 2002; Wilder & Williams, 2001; Williams, Brown,Silverstein, & deCani, 1994). Studies with theoretically similar contrasts and measures ofreading comprehension were included in the meta-analysis. All selected studies compared theeffects of a reading intervention with a comparison condition in which the construct of interestwas absent. By selecting only studies with contrasts between a treatment condition and a no-treatment comparison condition, we could ensure that the resulting point estimate of the effectcould be meaningfully interpreted.
The majority of qualifying studies reported multiple comprehension dependent variables. Thus,we first calculated a composite effect for each study using methods outlined by Rosenthal andRubin (1986) such that each study contributed only one effect to the aggregate. In thesecalculations, effects from standardized measure were weighted more heavily (w = 2) thaneffects from research-developed measures. We analyzed a random-effects model with onepredictor variable (intervention type) to account for the presence of unexplained variance andto provide a more conservative estimate of effect significance. A weighted average of effectswas estimated and the amount of variance between study effects calculated using the Q statistic(Shadish & Haddock, 1994). In addition to an overall point estimate of the effect of readinginterventions, we also calculated weighted averages to highlight effects of certain interventioncharacteristics (e.g., using narrative versus expository text). When reporting weighted meaneffects, only outcomes from studies with treatment–comparison conditions were included.Effects from single-group studies were excluded because only one study (Mercer, Campbell,Miller, Mercer & Lane, 2000) provided the information needed to convert the repeated-measures effect size into the same metric as an independent group effect size.
Overall effect on comprehension—The 13 treatment–comparison studies were includedin the meta-analysis because they (a) had theoretically similar contrasts and measures ofreading comprehension and (b) examined the effects of a reading intervention with acomparison in which the construct of interest was absent. In 8 studies, the contrast was betweenthe intervention of interest and the school’s current reading instruction. In 5 studies, thecomparison condition also received an intervention, but the construct or strategy of interestwas absent from that condition. The remaining 4 treatment–comparison studies in the synthesiswere eliminated from the meta-analysis because they did not include a comprehension measure(Bhat, Griffin, & Sindelair, 2003; Bhattacharya & Ehri, 2004) or they did not include a no-treatment comparison condition (Chan, 1996; Klingner & Vaughn, 1996).
A random-effects model was used to provide a more conservative estimate of interventioneffect significance. In this model, the weighted average of the difference in comprehensionoutcomes between students in the treatment conditions and students in the comparisonconditions was large (effect size = 0.89; 95% confidence interval (CI) = 0.42, 1.36). That is,students in the treatment conditions scored, on average, more than two thirds of a standarddeviation higher than students in the comparison conditions on measures of comprehension,and the effect was significantly different from zero.
To examine whether researcher-developed or curriculum-based measures inflated the effect ofreading interventions, we also calculated the effect based on standardized measures only. Forthis analysis, seven studies were included; the other six studies were eliminated from thissecondary analysis because they did not include a standardized measure of comprehension.When limited to only studies that included a standardized measure of comprehension, the
Edmonds et al. Page 7
Rev Educ Res. Author manuscript; available in PMC 2010 January 12.
NIH
-PA Author Manuscript
NIH
-PA Author Manuscript
NIH
-PA Author Manuscript

random-effects model yielded a moderate average effect (effect size = 0.47; 95% CI = 0.12,0.82). The effect of reading interventions on comprehension was quite large (effect size = 1.19;95% CI = 1.10, 1.37) when researcher-developed measures were used to estimate the effect(k = 9).
In a fixed-effects model, intervention type was a significant predictor of effect size variation(Qbetween = 22.33, p < .05), which suggests that the effect sizes were not similar across thecategories. Weighted average effects for each intervention type (comprehension, fluency, wordstudy, and multicomponent) were calculated and are presented in Table 5. For fluency andword study interventions, the effect was not significant—the average effect on comprehensionwas not different from zero. For the other intervention types, the effect was significantlydifferent from zero but differed in magnitude. Bonferroni post hoc contrasts showed asignificant difference in effects on comprehension between comprehension and multicompo-nent interventions (p < .025). There was no significant difference between the effects of wordstudy interventions and multicomponent interventions (p > .025).
We also computed weighted average effects for studies with common characteristics. Whetheran intervention was implemented by the researcher (n = 4, average effect size = 1.15) or thestudents’ teacher (n = 8, effect size = 0.77), the effects were large. The 95% CIs for these twoconditions did not overlap, suggesting that they are significantly different. Effects oncomprehension were different depending on the student population. Moderate average effectswere found for samples of struggling readers (n = 5, effect size = 0.45) or both strugglingreaders and students with disabilities (n = 4, effect size = 0.68), but a large effect (n = 4, effectsize = 1.50) was found for studies with samples of only students with disabilities.
Eleven of the 13 studies included in the meta-analysis used reading of connected text as partof the intervention. In an analysis of studies that reported the type of text used, the weightedaverage effect for interventions using expository text was moderate (n = 3, effect size = 0.53),whereas the average effect for those focusing on narrative text was high (n = 6, effect size =1.30). Closer examination of the studies with interventions focused on expository text (Alfassi,1998; DiCecco & Gleason, 2002; Moore & Scevak, 1995) showed that two studies tested theeffects of a multicomponent intervention similar in structure to reciprocal teaching and oneexamined the effects of using graphic organizers.
Intervention VariablesFor this synthesis, we examined findings from treatment–comparison design studies first,because the findings from these studies provide the greatest confidence about causal inferences.We then used results from single-group and single-subject design studies to support or refutefindings from the treatment–comparison design studies. Findings are summarized byintervention type. Intervention type was defined as the primary reading component addressedby the intervention (i.e., word study, fluency, vocabulary, comprehension). The corpus ofstudies did not include any vocabulary interventions but did include several studies thataddressed multiple components in which vocabulary instruction was represented. Within eachsummary, findings for different reading outcomes (e.g., fluency, word reading,comprehension) are reported separately to highlight the interventions’ effects on componentreading skills.
Comprehension—Nine treatment–comparison studies (Alfassi, 1998; Anderson et al.,1995; Chan, 1996; DiCecco & Gleason, 2002; Jitendra et al., 2000; Klingner & Vaughn,1996; Moore & Scevak, 1995; Wilder & Williams, 2001; Williams et al., 1994) focused oncomprehension. Among these studies, several (Alfassi, 1998; Anderson et al., 1995; Klingner& Vaughn, 1996; Moore & Scevak, 1995) examined interventions in which students weretaught a combination of reading comprehension skills and strategies, an approach with
Edmonds et al. Page 8
Rev Educ Res. Author manuscript; available in PMC 2010 January 12.
NIH
-PA Author Manuscript
NIH
-PA Author Manuscript
NIH
-PA Author Manuscript

evidence of effectiveness in improving students’ general comprehension (NRP, 2000; RANDReading Study Group, 2002). Two studies (Alfassi, 1998; Klingner & Vaughn, 1996) employedreciprocal teaching (Palincsar, Brown, & Martin, 1987), a model that includes previewing,clarifying, generating questions, and summarizing and has been shown to be highly effectivein improving comprehension (see for review, Rosenshine & Meister, 1994). Klingner andVaughn (1996) reported mixed results when the grouping structure of a reciprocal teachingintervention was manipulated during student application and practice. On a standardizedmeasure of comprehension, cooperative grouping was the more effective model (effect size =1.42). On a researcher-developed comprehension measure, the effects were small but favoredthe peer tutoring group (effect size = 0.35). It is likely that the standardized test outcome ismore reliable, suggesting greater effects from the use of cooperative grouping structures, atleast for English language learners with reading difficulties. In another study, effects ofreciprocal teaching on comprehension were moderate to high (effect size = 0.35 to 1.04; Alfassi,1998) when implemented in a remedial high school setting, a context not typically examinedin previous studies of reciprocal teaching (Alfassi, 1998).
The multiple-strategy intervention in Anderson et al. (1995) resulted in large effects (effectsize = 0.80 to 2.08). The repertoire of strategies included previewing and using knowledge oftext structure to facilitate understanding. However, another study (Moore & Scevak, 1995),which focused on teaching students to use text structure and features to summarize expositorytext, reported no effects (effect size = −0.57 to 0.07). It should be noted that the interventionprovided in the Anderson and colleagues study (1995) was conducted for 140 hr (a veryextensive intervention), and the amount of time for the intervention in the Moore and Scevakstudy (1995) was not specified, but the study was conducted for only 7 weeks—suggesting asignificantly less extensive intervention.
Chan (1996) manipulated both strategy instruction and attribution training and found that poorreaders benefited from some attribution training, with the most effective model beingattribution training plus successive strategy training (effect size = 1.68). In addition, all threestrategy conditions were more effective than the attribution-only condition, which suggeststhat poor readers also benefit from explicit strategy instruction.
Using graphic organizers is another strategy with demonstrated efficacy in improvingcomprehension (Kim et al., 2004). One experimental study (DiCecco & Gleason, 2002) andtwo single-subject studies (Gardhill & Jitendra, 1999; Vallecorsa & deBettencourt, 1997)examined the impact of teaching students to use graphic organizers. In DiCecco and Gleason(2002), the effect of a concept relationship graphic organizer intervention on relationalstatement production was large (effect size = 1.68). However, the effect was mixed formeasures of content knowledge (effect size = 0.08 to 0.50). Other studies also indicated thatgraphic organizers assisted students in identifying information related to the organizer but wereless effective in improving students’ overall understanding of text. For example, in a single-subject study of a story mapping intervention, Gardhill and Jitendra (1999) found mixed resultson general comprehension questions (PND = 13% to 100%) but consistent improvementcompared to baseline on story retell (PND = 100%). Similarly, all three students in a study ofexplicit story mapping (Vallecorsa & deBettencourt, 1997) increased the number of storyelements included in a retell (PND = 67% to 100%).
Other studies focused on a single comprehension strategy (Jitendra et al., 2000; Wilder &Williams, 2001; Williams et al., 1994). Studies of single-strategy interventions showed largeeffects on measures aligned closely with the intervention but limited examples of transfer tomore general comprehension measures. For example, students who were taught to identifymain ideas within text outperformed students in the comparison condition on a task ofidentifying and producing main idea statements (effect size = 2.23; Jitendra et al., 2000).
Edmonds et al. Page 9
Rev Educ Res. Author manuscript; available in PMC 2010 January 12.
NIH
-PA Author Manuscript
NIH
-PA Author Manuscript
NIH
-PA Author Manuscript

Although the treatment effects were maintained on near and far transfer measures (effect size= 1.84 to 2.57), scores decreased significantly for both conditions on transfer passages,indicating a lack of transfer to novel contexts. Similarly, interventions in which students weretaught to identify and apply story themes (Wilder & Williams, 2001; Williams et al., 1994)resulted in large effects on measures of theme identification and application (effect size = 1.41to 5.93). Effects of this intervention on general comprehension tasks were somewhatattenuated, although still demonstrating moderate effects (effect size = 0.41 to 0.59; Wilder &Williams, 2001).
Three studies included information about students’ decoding abilities (Alfassi, 1998; DiCecco& Gleason, 2002; Jitendra et al., 2000). In all three studies, students were adequate decodersbut poor comprehenders. The average effect of the comprehension interventions was large(effect size = 1.04).
Multicomponent—Studies (L. S. Fuchs et al., 1999; Hasselbring & Goin; 2004; Mastropieriet al., 2001) were classified as multicomponent when the interventions included instruction inmore than one component of reading, such as word study with fluency or fluency withcomprehension. Two multicomponent studies (L. S. Fuchs et al., 1999; Mastropieri et al.,2001) featured a slightly modified version of a peer-assisted learning comprehension andfluency intervention, an instructional model with demonstrated efficacy in the early elementarygrades (D. Fuchs, Fuchs, Mathes, & Simmons, 1997). Results when using this interventionmodel with older struggling readers were mixed. When implemented in an inclusive setting ona biweekly basis, effects on comprehension skills were small (effect size = 0.31; L. S. Fuchset al., 1999) yet were quite large when implemented daily in a self- contained resource room(effect size = 1.18; Mastropieri et al., 2001). It should be noted that the large effect size wascomputed from data on a researcher-developed measure, whereas the smaller effect was basedon data from a standardized measure, which is a more reliable measure of the intervention’seffect.
In a single-group design study (Bryant et al., 2000), students participated in an enhancedcollaborative strategic reading intervention during which they applied word learning, wordreading, and comprehension strategies and practiced fluent reading. This was the only studythat examined the effects of an instructional model with all four components included. Effectson word identification and oral reading fluency were moderate (effect size = 0.64, effect size= 0.67, respectively), but effects on comprehension were small (effect size = 0.22).
Hasselbring and Goin (2004) implemented a computer-based intervention that providedstudents with word reading and spelling practice and comprehension support during textreading. Effects on comprehension (effect size = 1.0) and vocabulary (effect size = 0.75) werelarge. Effects on word-level skills, however, were small (effect size = 0.23 to 0.44). Resultsfrom a single-subject design study with word study as one instructional component (Strong,Wehby, Falk, & Lane, 2004), indicated more consistent improvement in students’ oral readingfluency when word study was combined with fluency practice than when word study instructionalone was provided. However, Steventon and Frederick (2003) had less success with onestudent who participated in a similar word study and fluency intervention. Their results showedless improvement compared to baseline for oral reading fluency and virtually no transfer offluent reading to novel text.
There were only two studies that featured technology prominently in the instruction. One wasthe previously discussed multicomponent intervention by Hasselbring and Goin (2004). Theother was a study that used computers to enhance text and support reading (MacArthur &Haynes, 1995), which yielded an effect size in favor of basic text support (word recognitionand decoding with vocabulary support) when compared with enhanced text support (additional
Edmonds et al. Page 10
Rev Educ Res. Author manuscript; available in PMC 2010 January 12.
NIH
-PA Author Manuscript
NIH
-PA Author Manuscript
NIH
-PA Author Manuscript

support that includes question windows, glossary, teacher comments, and speech synthesis)for comprehending expository text.
Fluency—The synthesis included one treatment–comparison design study of fluency(Allinder et al., 2001). Allinder et al. (2001) studied the effects of prompting students to usestrategies for fluent reading (e.g., reading with inflection) and found no effects on standardizedword-level or comprehension measures. The other studies of fluency focused on improvingoral reading fluency, often through word or phrase reading fluency and/or repeated reading.Results were mixed with inconsistent improvements in oral reading fluency compared tobaseline (Freeland, Skinner, Jackson, McDaniel & Smith, 2000; Mercer et al., 2000; Valleley& Shriver, 2003).
Word study—Three of four experimental word-level studies examined the effects ofadvanced word reading strategies (Abbott & Berninger, 1999; Bhattacharya & Ehri, 2004;Penney, 2002). The fourth (Bhat et al., 2003) studied the effects of a phonemic awarenessintervention. Results of the phonemic awareness intervention were positive, with large effectson phonemic processing (effect size = 1.59). However, the overall effect of improved phonemicprocessing transferred minimally to improved word identification (effect size = 0.15).
Results for the three structural analysis studies were mixed, with effects ranging from −0.31to 1.40. Bhattacharya and Ehri (2004) found that although having students practice whole-wordreading versus providing no word reading instruction at all had a small effect (effect size =0.43), teaching students a structural analysis approach (i.e., multisyllabic chunking) had a largeeffect (effect size = 1.40). In another study that compared a structural analysis approach totypical reading instruction, the effects on word reading were moderate (effect size = 0.43 to0.48; Penney, 2002). In the third study (Abbott & Berninger, 1999), the effect of phonics andstructural analysis instruction on word reading skills was minimal (effect size = −.31 to .04).However, in the latter study, the comparison and treatment conditions received identicalinterventions, with the exception of the decoding strategy taught: The comparison conditionwas taught a synthetic phonics strategy and the treatment condition a combination of phonicsand structurally analysis. Results may have been lower in this study because, with bothconditions being provided a fairly robust treatment, the contrasted conditions were not asdissimilar as in the other two studies.
Across studies, the weighted average effect of structural analysis instruction on word readingskills was moderate (effect size = .36, 95% CI = .03, .69). Two studies (Abbott & Berninger,1999; Penney, 2002) measured comprehension as an outcome of a word-level intervention.Again, the results were mixed (effect size = −0.12 to 0.65).
DiscussionResults from the meta-analysis indicate that students with reading difficulties and disabilitiescan improve their comprehension when provided with a targeted reading intervention incomprehension, multiple reading components, or, to a lesser extent, word reading strategies.Even when using standardized measures, which offer a more generalized measure ofcomprehension, the effect is moderate, providing students with an average of a half standarddeviation advantage compared to their peers without the treatment.
A primary finding from this synthesis is that struggling readers can improve in their readingcomprehension when taught reading comprehension practices. Seemingly obvious, thisphenomenon is quite significant because many struggling readers in older grades (6 through12) are not provided effective instruction in reading comprehension. In fact, interventions thatspecifically targeted students with learning disabilities were associated with the highest gains
Edmonds et al. Page 11
Rev Educ Res. Author manuscript; available in PMC 2010 January 12.
NIH
-PA Author Manuscript
NIH
-PA Author Manuscript
NIH
-PA Author Manuscript
in reading comprehension. Results from this synthesis suggest that explicit instruction incomprehension benefited students with reading difficulties and disabilities. Findings alsosuggest that there may be a diminishing relationship between accuracy (e.g., word recognitionand fluent reading) and comprehension with secondary students. When students reach the upperelementary grades, other factors, such as background knowledge, word knowledge, and use ofstrategies, contribute to comprehension (Kintsch & Kintsch, 2004). The large effects ofinterventions that developed students’ strategy knowledge and use and the relatively lowereffects of other types of interventions on comprehension support these previous findings. Thus,for students who lack word reading skills, it is necessary to build these word-level skills whileteaching comprehension so that access to increasingly difficult levels of print is available tothem.
As indicated by the meta-analysis, word-level interventions are associated with small tomoderate effects on comprehension (d = .34). This supports some studies in early grade levels(e.g., Baumann et al., 2002) that found little effect on comprehension from structural analysisinterventions. Although the average effect was not significantly different from zero, the smallto moderate effect is an important finding, particularly for older students with very lowdecoding skills who require extensive instruction in word-level skills. It is valuable to knowthat there is a small to moderate effect for comprehension from word-level interventions.
The data trend from the studies of fluency indicates that increased reading rate and accuracydid not always result in improved comprehension (e.g., Allinder et al., 2001). These resultssupport other research on the relationship between comprehension and fluency for olderstudents. For example, Kuhn and Stahl (2003) found that although fluency instruction improvedthe processing skills that facilitate comprehension, few fluency interventions fostered bettergeneral comprehension. Stated more succinctly, as students improved their oral readingfluency, comprehension did not jointly improve. Others also report that the correlation betweenoral reading fluency and comprehension appears to be a developmental relationship, decreasingsteadily with age and with text difficulty (Francis, Fletcher, Catts, & Tomblin, 2004; Paris,Carpenter, Paris, & Hamilton, 2004). For educators, the message from these findings is that“an intense focus on fluency may pay a short-term dividend, [however] the cost-benefit analysisof such an emphasis for adolescent learners looks less attractive” (Underwood & Pearson,2004, p. 139).
Although we do not think the evidence from this synthesis would suggest forgoing instructionin reading skills such as fluency or advanced decoding strategies with secondary strugglingreaders—particularly for students whose word reading skills are exceedingly low—thefindings from this synthesis do encourage educators to include instruction targetingcomprehension skills. Results from this synthesis suggest that older struggling readers benefitfrom explicit comprehension strategy instruction—that is, modeling and thinking aloud howto self-question and reflect during and after reading and engaging students to become activelyinvolved in monitoring their understanding and processing text meaning. This form ofcollaboration among students as they read and construct meaning has been well defined byBeck and colleagues in their work on “questioning the author” (Beck & McKeown, 2006; Beck,McKeown, Worthy, Sandora, & Kucan, 1997).
The moderate and large effects on training and near-transfer measures did not frequentlygeneralize to measures of broader, more general comprehension. It appears that comprehensionand multicomponent interventions can result in students’ becoming more proficient in applyinglearned strategies and learning taught content, but they often do not result in readers who usethe strategies independently and flexibly in novel contexts. For example, Alfassi (1998) foundthat the significant effect for condition on researcher-developed measures (effect size = 1.04)did not generalize to standardized measures of broad comprehension and vocabulary skills
Edmonds et al. Page 12
Rev Educ Res. Author manuscript; available in PMC 2010 January 12.
NIH
-PA Author Manuscript
NIH
-PA Author Manuscript
NIH
-PA Author Manuscript

(0.35 and 0.16, respectively). For single-strategy interventions, students were successful onmeasures related to the targeted strategy (e.g., identifying the main idea after explicit main ideainstruction; Jitendra et al., 2000), but on broader measures of comprehension, effects weregenerally lower and less consistent. These results suggest that older struggling readers mayneed additional opportunities to apply newly learned strategies to novel text or may need tolearn other practices related to text reflection, self-questioning, and engagement.
On the basis of the mixed results from studies that examined the effects of early readinginstructional practices (e.g., reciprocal teaching and graphic organizers), we conclude thateducators cannot assume that instructional practices with demonstrated efficacy in the lowergrades will be equally as effective when implemented with older struggling readers. There areseveral possible explanations for this. First, the learning needs of this population may differfrom those of younger students. Some of these students may have had extensive interventionsaddressing word-level skills and few interventions addressing practices for comprehendingtext. This may explain why comprehension interventions for students with learning disabilitieswere associated with exceedingly high effect sizes. It may be that students with disabilitieshave had relatively limited instruction in this area. Second, older readers are required to readmore information or expository text. Although the number of expository text studies was fewin this synthesis, overall narrative text was associated with higher effect sizes fromcomprehension interventions than expository text. Thus, comprehension practices developedto address narrative text comprehension may benefit narrative text comprehension and have alower impact on reading expository text—at least for older struggling readers. It may also bethat older struggling readers display reading difficulties that are more recalcitrant and requiremore intensive interventions (e.g., longer duration, more targeted) to achieve similar results.
LimitationsAs with any synthesis, our findings are tempered by a few limitations. First, issues ofmeasurement in the area of comprehension are extensive (Snow, 2003). Comprehension is adifficult construct to assess, and many of the studies measured comprehension in varied ways.Comprehension was measured by tasks that ranged from memorization activities (e.g., recall)to indications of complex cognitive behaviors (drawing inferences). Some theorists wouldargue that pooling or comparing outcomes from measures assessing a spectrum of skills maybe misleading. Given the limited number of measures and the limited number of studies withineach given category of skill complexity, however, we believed that gaining an understandingof the overall effect on comprehension provides a summary of what we know and insight intofuture research needed.
Second, the use of researcher-developed measures (or nonstandardized measures) wasassociated with higher effect sizes than standardized measures. This is a consistent findingfrom intervention research in education (e.g., Swanson, Hoskyn, & Lee, 1999) and should beconsidered when interpreting the results from intervention studies.
Finally, syntheses are only as good as the quality of the research articles available. We thinkthat this synthesis yields valuable findings; however, only additional research and better-quality research will determine whether these findings will be supported over time.
Implications and Future ResearchThis synthesis yields several implications for educators. First, we think that these studiesindicate that comprehension practices that engage students in thinking about text, learning fromtext, and discussing what they know are likely to be associated with improved comprehensionoutcomes for students with reading difficulties and disabilities. Second, the comprehensionpractices used are more effective for narrative text than expository text. We think that teachers
Edmonds et al. Page 13
Rev Educ Res. Author manuscript; available in PMC 2010 January 12.
NIH
-PA Author Manuscript
NIH
-PA Author Manuscript
NIH
-PA Author Manuscript
may want to consider the use of additional elements, such as graphic organizers and callingstudents’ attention to text structures when students are reading relevant expository orinformation texts. Third, comprehension outcomes were higher when interventions wereimplemented by researchers in contrast to when implemented by teachers. Because it is likelythat researchers are more attentive to implementing interventions with high levels of fidelity,teachers may want to consider their fidelity of implementation when targeting comprehensionpractices.
There are several important areas related to reading comprehension that this synthesis wasunable to address and would be important to consider in future syntheses. As stated in theintroduction, RAND Reading Study Group (2002) identified several critical elements thatcontributed to comprehension: the reader, the text, and the activity. This synthesis examinedthe extent to which students identified by previous researchers as having reading difficultiesor disabilities could demonstrate improved comprehension when participating in specifiedinterventions designed to improve their reading. There are many other key areas related toreading comprehension, including the relationship between the sociocultural context and thestudent, teacher, and setting. We think that these variables as well as social and affectivevariables related to students’ interest and motivation would make for valuable understandingof the role of context on students’ comprehension. This synthesis also did not examine therelationship between writing interventions on reading comprehension outcomes for olderstruggling readers. An extension of this synthesis may provide additional insight into effectsof writing interventions on comprehension for struggling readers in middle and high school.
We also think that this synthesis provides ample support for additional research in the area ofreading comprehension. Recently, a report on adolescent literacy indicated that as many as70% of secondary students require some form of reading remediation (Biancarosa & Snow,2004). The type of reading instruction required for this large number of secondary students isnot well defined; however, we can be certain that many of these students will require effectiveinstruction targeted at improving their reading comprehension. Future research addressing theneeds of this varied group of struggling adolescent readers is needed, including improvedmeasurement in reading comprehension; effective interventions for various text types,including information text; studies that improve our confidence of effectiveness by adheringto experimental design principles; and studies that align the intervention with the specific needsof students (e.g., decoding, vocabulary, and/or comprehension). We also acknowledge thatessential aspects of reading comprehension with older students include consideration ofengagement and involvement with text, motivation, self-efficacy, and how to nurture andexpand reading interests. Many of these variables are considered to be primary sources ofvariance when attempting to positively influence the reading comprehension of older studentswith reading difficulties (Guthrie, Wigfield, & VonSecker, 2000). A better understanding ofthese key variables will assist teachers and educational decision makers in improving readinginstruction for older students.
ReferencesAbbott SP, Berninger VW. It’s never too late to remediate: Teaching word recognition to students with
reading disabilities in Grades 4–7. Annals of Dyslexia 1999;49:223–250.Alfassi M. Reading for meaning: The efficacy of reciprocal teaching in fostering reading comprehension
in high school students in remedial reading classes. American Educational Research Journal1998;35:309–332.
Allinder RM, Dunse L, Brunken CD, Obermiller-Krolikowski HJ. Improving fluency in at-risk readersand students with learning disabilities. Remedial and Special Education 2001;22:48–45.
Alvermann DE. Effective literacy instruction for adolescents. Journal of Literacy Research 2002;34:189–208.
Edmonds et al. Page 14
Rev Educ Res. Author manuscript; available in PMC 2010 January 12.
NIH
-PA Author Manuscript
NIH
-PA Author Manuscript
NIH
-PA Author Manuscript
Anderson, V.; Chan, KK.; Henne, R. The effects of strategy instruction on the literacy models andperformance of reading and writing delayed middle school students. In: Hinchman, KA.; Leu, DJ.;Kinzer, CK., editors. Perspectives on literacy research and practice: Forty-fourth yearbook of theNational Reading Conference. Chicago: National Reading Conference; 1995. p. 180-189.
Baumann JF, Edwards EC, Font G, Tereshinski CA, Kameenui EJ, Olejnik J. Teaching morphemic andcontextual analysis to fifth-grade students. Reading Research Quarterly 2002;37(2):150–176.
Beck, IL.; McKeown, MG. Improving comprehension with questioning the author. New York: Scholastic;2006.
Beck IL, McKeown MG, Worthy J, Sandora CA, Kucan L. Questioning the author: A year-long classroomimplementation to engage students with text. Elementary School Journal 1996;96:385–414.
Bhat P, Griffin CC, Sindelair PT. Phonological awareness instruction for middle school students withlearning disabilities. Learning Disability Quarterly 2003;26:73–87.
Bhattacharya A, Ehri LC. Graphosyllabic analysis helps adolescent struggling readers read and spellwords. Journal of Learning Disabilities 2004;37:331–348. [PubMed: 15493405]
Biancarosa, G.; Snow, CE. Reading next: A vision for action and research in middle and high schoolliteracy. A report to the Carnegie Corporation of New York. Washington, DC: Alliance for ExcellentEducation; 2004.
Bryant DP, Vaughn S, Linan-Thomason S, Ugel N, Hamff A, Hougen M. Reading outcomes for studentswith and without reading disabilities in general education middle-school content area classes.Learning Disabilities Quarterly 2000;23:238–252.
Carlisle, JF.; Rice, MS. Improving reading comprehension: Research-based principles and practices.Baltimore; York: 2002 .
Chan LKS. Combined strategy and attributional training for seventh-grade average and poor readers.Journal of Research in Reading 1996;19:111–127.
Cohen, J. Statistical power analysis for the behavioral sciences. Vol. 2. Hillsdale, NJ: Lawrence Erlbaum;1988.
Cooper, H. Synthesizing research: A guide for literature reviews. Vol. 3. Thousand Oaks, CA: Sage;1998 .
Curtis, ME.; Longo, AM. When adolescents can’t read: Methods and materials that work. Cambridge,MA: Brookline; 1999.
Daly EJ, Martens BK. A comparison of three interventions for increasing oral reading performance:Application of the instructional hierarchy. Journal of Applied Behavioral Analysis 1994;27:459–469.
DiCecco VM, Gleason MM. Using graphic organizers to attain relational knowledge from expositorytexts. Journal of Learning Disabilities 2002;35:306–320. [PubMed: 15493240]
Dole JA, Duffy GG, Roehler LR, Pearson PD. Moving from the old to the new: Research on readingcomprehension instruction. Review of Educational Research 1991;61(2):239–264.
Francis, DJ.; Fletcher, JM.; Catts, HW.; Tomblin, JB. Dimensions affecting the assessment of readingcomprehension. In: Paris, SG.; Stahl, SA., editors. Children’s reading comprehension andassessment. Mahwah, NJ: Lawrence Erlbaum; 2004. p. 369-394.
Freeland JT, Skinner CH, Jackson B, McDaniel CE, Smith S. Measuring and increasing silent readingcomprehension rates: Empirically validating a repeated readings intervention. Psychology in theSchools 2000;37:415–429.
Fuchs D, Fuchs LS, Mathes P, Simmons D. Peer-assisted learning strategies: Making classroom moreresponsive to diversity. American Educational Research Journal 1997;34(1):174–206.
Fuchs LS, Fuchs D, Kazdan S. Effects of peer-assisted learning strategies on high school students withserious reading problems. Remedial and Special Education 1999;20:309–319.
Gardhill MC, Jitendra AK. Advanced story map instruction: Effects on the reading comprehension ofstudents with learning disabilities. Journal of Special Education 1999;33:2–17. 28.
Gersten R, Fuchs LS, Williams JP, Baker S. Teaching reading comprehension strategies to students withlearning disabilities: A review of research. Review of Educational Research 2001;71:279–320.
Grigg, WS.; Daane, MC.; Jin, Y.; Campbell, JR. The nation’s report card: Reading 2002. Washington,DC: U.S. Department of Education, National Center for Education Statistics, Institute of Education
Edmonds et al. Page 15
Rev Educ Res. Author manuscript; available in PMC 2010 January 12.
NIH
-PA Author Manuscript
NIH
-PA Author Manuscript
NIH
-PA Author Manuscript
Sciences; 2003. NCES 2003-521Retrieved January 25, 2006, fromhttp://nces.ed.gov/pubsearch/pubsinfo.asp?pubid=2003521
Guthrie JT, Wigfield A, VonSecker C. Effects of integrated instruction on motivation and strategy usein reading. Journal of Educational Psychology 2001;92(2):331–341.
Hasselbring TS, Goin LI. Literacy instruction for older struggling readings: What is the role oftechnology? Reading and Writing Quarterly 2004;20:123–144.
Heilman, AW.; Blair, TR.; Rupley, WH. Principles and practices of teaching reading. Vol. 9. Columbus,OH: Merrill/Prentice Hall; 1998.
Jenkins JR, Heliotis J, Stein ML, Haynes M. Improving reading comprehension by using paragraphrestatements. Exceptional Children 1987;54:54–59. [PubMed: 3653217]
Jiménez RT, Garcia GE, Pearson PD. Three children, two languages, and strategic reading: Case studiesin bilingual/monolingual reading. American Educational Research Journal 1995;32:67–97.
Jiménez RT, Garcia GE, Pearson PD. The reading strategies of bilingual Latino students who aresuccessful English readers: Opportunities and obstacles. Reading Research Quarterly 1996;31:90–112.
Institute of Education Sciences. What Works Clearinghouse study review standards. 2003. RetrievedJanuary 10, 2005, from http://www.whatworks.ed.gov/reviewpro-cess/study_standards_final.pdf
Jitendra AK, Hoppes MK, Xin YP. Enhancing main idea comprehension for students with learningproblems: The role of a summarization strategy and self-monitoring instruction. Journal of SpecialEducation 2000;34:127–139.
Kamil, ML. Adolescents and literacy: Reading for the 21st century. Washington, DC: Alliance forExcellent Education; 2003.
Kamil, ML. Vocabulary and comprehension instruction: Summary and implications of the NationalReading Panel findings. In: McCardle, P.; Chhabra, V., editors. The voice of evidence in readingresearch. Baltimore: Paul H. Brookes; 2004. p. 213-234.
Kim A, Vaughn S, Wanzek J, Wei S. Graphic organizers and their effects on the reading comprehensionof students with learning disabilities. Journal of Learning Disabilities 2004;37:105–118. [PubMed:15493233]
Kintsch, W.; Kintsch, E. Comprehension. In: Paris, SG.; Stahl, SA., editors. Children’s readingcomprehension and assessment. Mahwah, NJ: Lawrence Erlbaum; 2004. p. 71-92.
Klingner JK, Vaughn S. Reciprocal teaching of reading comprehension strategies for students withlearning disabilities who use English as a second language. Elementary School Journal 1996;96:275–293.
Klingner, JK.; Vaughn, S.; Boardman, A. Teaching reading comprehension to students with learningdisabilities. New York: Guilford; 2007.
Kuhn MR, Stahl SA. Fluency: A review of developmental and remedial practices. Journal of EducationalPsychology 2003;95(1):3–21.
Lauterbach SL, Bender WN. Cognitive strategy instruction for reading comprehension: A success forhigh school freshmen. High School Journal 1995;79(1):58–64.
MacArthur CA, Haynes JB. Student Assistant for Learning from Text (SALT): A hypermedia readingaid. Journal of Learning Disabilities 1995;28:150–159. [PubMed: 7699302]
Mastropieri MA, Scruggs TE, Bakken JP, Whedon C. Reading comprehension: A synthesis of researchin learning disabilities. Advances in Learning and Behavioral Disabilities 1996;10B:201–227.
Mastropieri MA, Scruggs TE, Graetz JE. Reading comprehension instruction for secondary students:Challenges for struggling students and teachers. Learning Disability Quarterly 2003;26:103–116.
Mastropieri MA, Scruggs T, Mohler L, Beranek M, Spencer V, Boon RT, et al. Can middle school studentswith serious reading difficulties help each other and learn anything? Journal of Learning Disabilities2001;16:18–27.
Mercer CD, Campbell KU, Miller MD, Mercer KD, Lane HB. Effects of a reading fluency interventionfor middle schoolers with specific learning disabilities. Learning Disabilities Research and Practice2000;15:179–189.
Moore PJ, Scevak JJ. The effects of strategy training on high school students’ learning from science texts.European Journal of Psychology of Education 1995;10:401–410.
Edmonds et al. Page 16
Rev Educ Res. Author manuscript; available in PMC 2010 January 12.
NIH
-PA Author Manuscript
NIH
-PA Author Manuscript
NIH
-PA Author Manuscript
National Institute for Literacy. Put reading first: The research building blocks for teaching children toread. Jessup, MD: Author; 2001.
National Reading Panel. Report of the national reading panel: Teaching children to read. Rockville, MD:National Institute of Child Health and Human Development; 2000.
No Child Left Behind Act of 2001, Pub. L. No. 107–110, 115 Stat. 1425 (2002).Palincsar AS, Brown AL, Martin SM. Peer interaction in reading comprehension instruction. Educational
Psychologist 1987;22:231–253.Paris, SG.; Carpenter, RD.; Paris, AH.; Hamilton, EE. Spurious and genuine correlates of children’s
reading comprehension. In: Paris, SG.; Stahl, SA., editors. Children’s reading comprehension andassessment. Mahwah, NJ: Lawrence Erlbaum; 2004. p. 131-160.
Paris SG, Lipson MY, Wixson KK. Becoming a strategic reader. Contemporary Educational Psychology1983;8(3):293–316.
Paris, SG.; Wasik, BA.; Turner, JC. The development of strategic readers. In: Pearson, PD.; Barr, R.;Kamil, ML.; Mosenthal, P., editors. Handbook of reading research. Vol. 2. White Plains, NY:Longman; 1991. p. 609-640.
Penney CG. Teaching decoding skills to poor readers in high school. Journal of Literacy Research2002;34:99–118.
Pressley, M. What should comprehension instruction be the instruction of?. In: Kamil, M.; Mosenthal,P.; Pearson, P.; Barr, R., editors. Handbook of reading research. Vol. 3. Mahwah, NJ: LawrenceErlbaum; 2000. p. 545-562.
Pressley, M.; Afflerbach, P. Verbal protocols of reading: The nature of constructively responsive reading.Hillsdale, NJ: Lawrence Erlbaum; 1995.
RAND Reading Study Group. Reading for understanding: Toward an R&D program in readingcomprehension. Santa Monica, CA: RAND; 2002.
Raudenbush SW. Learning from attempts to improve schooling: The contribution of methodologicaldiversity. Educational Researcher 2005;34(5):25–31.
Rosenshine B, Meister C. Reciprocal teaching: A review of the research. Review of Educational Research1994;64(4):479–530.
Rosenthal R, Rubin DB. Meta-analytic procedures for combining studies with multiple effect sizes.Psychological Bulletin 1986;99(3):400–406.
Scott TM, Shearer-Lingo A. The effects of reading fluency instruction on the academic and behavioralsuccess of middle school students in a self-contained EBD classroom. Preventing School Failure2002;46:167–173.
Scruggs TE, Mastropieri MA, Casto G. The quantitative synthesis of single subject research. Remedialand Special Education 1987;8(2):24–33.
Shadish WR. Revisiting field experimentation: Field notes for the future. Psychological Methods 2002;7(1):3–18. [PubMed: 11928889]
Shadish, WR.; Haddock, CK. Combining estimates of effect size. In: Cooper, H.; Hedges, L., editors.The handbook of researcher synthesis. New York: Sage; 1994. p. 261-284.
Snow, CE. Assessment of reading comprehension. In: Sweet, AP.; Snow, CE., editors. Rethinking readingcomprehension. New York: Guilford; 2003. p. 192-206.
Steventon CE, Frederick LD. The effects of repeated readings on student performance in the correctivereading program. Journal of Direct Instruction 2003;3:17–27.
Strong AC, Wehby JH, Falk KB, Lane KL. The impact of a structured reading curriculum and repeatedreading on the performance of junior high students with emotional and behavioral disorders. SchoolPsychology Review 2004;33:561–581.
Swanson HL. Reading research for students with LD: A meta-analysis of intervention outcomes. Journalof Learning Disabilities 1999;32:504–532. [PubMed: 15510440]
Swanson HL, Hoskyn M. Instructing adolescents with learning disabilities: A component and compositeanalysis. Learning Disabilities Research and Practice 2001;16:109–120.
Swanson, HL.; Hoskyn, M.; Lee, C. Interventions for students with learning disabilities. New York:Guilford; 1999.
Edmonds et al. Page 17
Rev Educ Res. Author manuscript; available in PMC 2010 January 12.
NIH
-PA Author Manuscript
NIH
-PA Author Manuscript
NIH
-PA Author Manuscript

Underwood, T.; Pearson, DP. Teaching struggling adolescent readers to comprehend what they read. In:Jetton, TL.; Dole, JA., editors. Adolescent literacy research and practice. New York: Guilford; 2004.p. 135-161.
Vallecorsa AL, deBettencourt LU. Using a mapping procedure to teach reading and writing skills tomiddle grade students with learning disabilities. Education and Treatment of Children 1997;20:173–189.
Valleley RJ, Shriver MD. An examination of the effects of repeated readings with secondary students.Journal of Behavioral Education 2003;12(1):55–76.
Wanzek J, Vaughn S, Wexler J, Swanson EA, Edmonds M. A synthesis of spelling and readinginterventions and their effects on the spelling outcomes for students with LD. Journal of LearningDisabilities 2006;39(6):528–543. [PubMed: 17165620]
Wilder AA, Williams JP. Students with severe learning disabilities can learn higher order comprehensionskills. Journal of Educational Psychology 2001;93:268–278.
Williams JP, Brown LG, Silverstein AK, deCani JS. An instructional program in comprehension ofnarrative themes for adolescents with learning disabilities. Learning Disabilities Quarterly1994;17:205–221.
Wong BYL, Jones W. Increasing metacomprehension in learning disabled and normally achievingstudents through self-questing training. Learning Disability Quarterly 1982;5:228–240.
Woodruff, S.; Schumaker, JB.; Deschler, D. The effects of an intensive reading intervention on thedecoding skills of high school students with reading deficits. Washington, DC: Special EducationPrograms; 2002. Report No. RR-15ERIC Document Reproduction Service No. ED46929
BiographiesMEAGHAN S. EDMONDS, PhD, is a research associate at the Vaughn Gross Center forReading and Language Arts at the University of Texas at Austin, Meadows Center forPreventing Educational Risk, College of Education SZB 228, 1 University Station D4900,Austin, TX 78712-0365; [email protected]. She holds a doctorate in educationalpsychology, a master’s degree in curriculum and instruction, and an MEd in programevaluation. Her current research is focused on reading comprehension and policy evaluation.
SHARON VAUGHN, PhD, holds the H. E. Hartfelder/Southland Corporation Regents Chairin Human Development and is the executive director of the Meadows Center for PreventingEducational Risk at the University of Texas at Austin, College of Education SZB 228, 1University Station D4900, Austin, TX 78712-0365; [email protected]. She was the editorin chief of the Journal of Learning Disabilities and the coeditor of Learning DisabilitiesResearch and Practice. She is the recipient of the American Educational Research AssociationSpecial Education SIG Distinguished Researcher award. She is currently the principalinvestigator or coprincipal investigator on several Institute for Education Science, NationalInstitute for Child Health and Human Development, and Office of Special Education Programsresearch grants investigating effective interventions for students with reading difficulties aswell as students who are English language learners.
JADE WEXLER, PhD, is a research associate at the Meadows Center for PreventingEducational Risk at the University of Texas at Austin, College of Education SZB 228, 1University Station D4900, Austin, TX 78712-0365; [email protected]. Her researchinterests are interventions for adolescents with reading difficulties, response to intervention,and teacher education.
COLLEEN REUTEBUCH, PhD, serves as a project coordinator for the Center for Researchof the Educational Achievement and Teaching of English Language Learners (CREATE)Project at the Meadows Center for Preventing Educational Risk at the University of Texas atAustin, College of Education SZB 228, 1 University Station D4900, Austin, TX 78712-0365;
Edmonds et al. Page 18
Rev Educ Res. Author manuscript; available in PMC 2010 January 12.
NIH
-PA Author Manuscript
NIH
-PA Author Manuscript
NIH
-PA Author Manuscript

[email protected]. Her research interests include reading and content areainterventions.
AMORY CABLE, PhD, is a speech-language pathologist and is currently writing summariesof research for a speech-language clinical database. Via Siciliani 44, Bisceglie, BA CAP 70052;[email protected]. KATHRYN KLINGLER TACKETT, MEd, is a doctoral candidateat the University of Texas at Austin in the Department of Special Education (in learningdisabilities and behavior disorders), an assistant instructor with the Department of SpecialEducation, and a research assistant with the Center on Instruction, Special Education Strand,which is housed at the Vaughn Gross Center for Reading and Language Arts, University ofTexas at Austin, College of Education SZB 228, 1 University Station D4900, Austin, TX78712-0365; [email protected].
JENNIFER WICK SCHNAKENBERG is the associate director of the Texas Reading FirstInitiative at the Vaughn Gross Center for Reading and Language Arts at the University of Texasat Austin, College of Education SZB 228, 1 University Station D4900, Austin, TX 78712-0365;[email protected]. She provides technical assistance to state-level, district-level, andcampus-level personnel. She trains personnel on using assessment, implementing the three-tier model effectively, and providing effective and comprehensive reading instruction to allstudents. In addition, she supervises technical assistance and professional development teammembers.
Edmonds et al. Page 19
Rev Educ Res. Author manuscript; available in PMC 2010 January 12.
NIH
-PA Author Manuscript
NIH
-PA Author Manuscript
NIH
-PA Author Manuscript

NIH
-PA Author Manuscript
NIH
-PA Author Manuscript
NIH
-PA Author Manuscript
Edmonds et al. Page 20
TAB
LE 1
Inte
rven
tion
char
acte
ristic
s
Stud
ySt
udy
desi
gnN
umbe
r of
par
ticip
ants
Gra
deD
urat
ion
Pers
on im
plem
entin
gT
ype
of in
terv
entio
n
1. A
bbot
t &B
erni
nger
(199
9);
rand
omas
sign
men
t;tre
atm
ent f
idel
ity:
yes
Trea
tmen
t-com
paris
on (m
ultip
le tr
eatm
ents
)20
(stru
gglin
g re
ader
s)4t
h–7t
h16
(1/w
eek;
60
min
a )R
esea
rche
rW
ord
stud
y
2. A
lfass
i (19
98);
quas
iexp
erim
enta
l;tre
atm
ent f
idel
ity:
NR
Trea
tmen
t-com
paris
on75
(stru
gglin
g re
ader
s)9t
h20
sess
ions
(dai
ly ×
4w
eeks
; 45
min
)Te
ache
rC
ompr
ehen
sion
3. A
llind
er, D
unse
,B
runk
en, &
Obe
rmill
er-
Kro
likow
ski
(200
1); r
ando
mas
sign
men
t;tre
atm
ent f
idel
ity:
yes
Trea
tmen
t-com
paris
on (m
ultip
le tr
eatm
ents
)49
(LD
and
stru
gglin
gre
ader
s)7t
h30
sess
ions
(3/w
eek)
Teac
her
Flue
ncy
4. A
nder
son,
Cha
n,&
Hen
ne (1
995)
;ra
ndom
assi
gnm
ent;
treat
men
t fid
elity
:N
R
Trea
tmen
t-com
paris
on17
(stru
gglin
g re
ader
s)6t
h70
sess
ions
(dai
ly ×
14 w
eeks
; 120
min
)R
esea
rche
rC
ompr
ehen
sion
5. B
hat,
Grif
fin, &
Sind
elar
(200
3)Tr
eatm
ent-c
ompa
rison
40 (L
D)
6th–
8th
18 se
ssio
ns (3
day
s/w
eek,
2 se
ssio
ns/
day)
Teac
her
Wor
d st
udy
6. B
hatta
char
ya &
Ehri
(200
4);
rand
omas
sign
men
t;tre
atm
ent f
idel
ity:
NR
Trea
tmen
t-com
paris
on60
(stru
gglin
g re
ader
s)6t
h–9t
h4
sess
ions
(dai
ly 4
days
; 30
min
)R
esea
rche
rW
ord
stud
y
7. C
han
(199
6);
rand
omas
sign
men
t;tre
atm
ent f
idel
ity:
NR
Trea
tmen
t-com
paris
on (m
ultip
le tr
eatm
ents
)40
(stru
gglin
g re
ader
s)7t
h9
sess
ions
(acr
oss 3
wee
ks; 6
0 m
in)
Res
earc
her
Com
preh
ensi
on
8. D
iCec
co &
Gle
ason
(200
2);
rand
omas
sign
men
t;tre
atm
ent f
idel
ity:
yes
Trea
tmen
t-com
paris
on (m
ultip
le tr
eatm
ents
)24
(LD
)6t
h–8t
h20
sess
ions
(dai
ly 4
wee
ks; 4
0 m
in)
Res
earc
her a
nd te
ache
rC
ompr
ehen
sion
Rev Educ Res. Author manuscript; available in PMC 2010 January 12.

NIH
-PA Author Manuscript
NIH
-PA Author Manuscript
NIH
-PA Author Manuscript
Edmonds et al. Page 21
Stud
ySt
udy
desi
gnN
umbe
r of
par
ticip
ants
Gra
deD
urat
ion
Pers
on im
plem
entin
gT
ype
of in
terv
entio
n
9. L
. S. F
uchs
,Fu
chs,
& K
azda
n(1
999)
;qu
asie
xper
i-m
enta
l; tre
atm
ent
fidel
ity: y
es
Trea
tmen
t-com
paris
on10
2 (L
D, s
trugg
ling
read
ers,
MM
R)
9th
40 se
ssio
ns (5
eve
ry2
wee
ks)
Teac
her
Mul
ticom
pone
nt(c
ompr
ehen
sion
and
fluen
cy)
10. H
asse
lbrin
g &
Goi
n (2
004)
; NR
;tre
atm
ent f
idel
ity:
NR
Trea
tmen
t-com
paris
on12
5 (R
D a
nd st
rugg
ling
read
ers)
6th–
8th
NR
(dai
ly; 3
0 m
in)
NR
Mul
ticom
pone
nt(c
ompr
ehen
sion
,w
ord
stud
y)
11. J
itend
ra,
Hop
pes,
& X
in(2
000)
; ran
dom
assi
gnm
ent;
treat
men
t fid
elity
:ye
s
Trea
tmen
t-com
paris
on33
(LD
and
stru
gglin
gre
ader
s)6t
h–8t
h15
sess
ions
(dai
ly 1
5da
ys; 3
0–40
min
)R
esea
rche
rC
ompr
ehen
sion
12. K
lingn
er &
Vau
ghn
(199
6);
rand
omas
sign
men
t;tre
atm
ent f
idel
ity:
NR
Trea
tmen
t-com
paris
on (m
ultip
le tr
eatm
ents
)26
(LD
, ESL
)7t
h–8t
h27
sess
ions
(dai
ly;
35–4
0 m
in)
Res
earc
her
Com
preh
ensi
on
13. M
astro
pier
i et
al. (
2001
); qu
asi-
expe
rimen
tal;
treat
men
t fid
elity
:ye
s
Trea
tmen
t-com
paris
on24
(LD
and
MR
)7t
h25
sess
ions
Teac
her
Mul
ticom
pone
nt(c
ompr
ehen
sion
and
fluen
cy)
14. M
oore
&Sc
evak
(199
5);
rand
omas
sign
men
t;tre
atm
ent f
idel
ity:
NR
Trea
tmen
t-com
paris
on21
(stru
gglin
g re
ader
s)N
R (h
igh
scho
ol)
NR
(7 w
eeks
)Te
ache
rC
ompr
ehen
sion
15. P
enne
y (2
002)
;qu
asi-
expe
rimen
tal;
treat
men
t fid
elity
:ye
s
Trea
tmen
t-com
paris
on33
(stru
gglin
g re
ader
s)N
R (1
7-ye
ar-o
lds)
18 se
ssio
ns (5
6 m
in)
Teac
her
Wor
d st
udy
16. W
ilder
&W
illia
ms (
2001
);qu
asi-
expe
rimen
tal;
treat
men
t fid
elity
:ye
s
Trea
tmen
t-com
paris
on (m
ultip
le tr
eatm
ents
)91
(LD
)6t
h–8t
hN
R (3
/wee
k; 4
5 m
in)
Teac
her
Com
preh
ensi
on
17. W
illia
ms,
Bro
wn,
Silv
erst
ein,
&de
Can
i (19
94);
rand
om
Trea
tmen
t-com
paris
on (m
ultip
le tr
eatm
ents
)93
(LD
)7t
h–8t
hN
R (4
wee
ks; 4
0m
in)
Teac
her
Com
preh
ensi
on
Rev Educ Res. Author manuscript; available in PMC 2010 January 12.

NIH
-PA Author Manuscript
NIH
-PA Author Manuscript
NIH
-PA Author Manuscript
Edmonds et al. Page 22
Stud
ySt
udy
desi
gnN
umbe
r of
par
ticip
ants
Gra
deD
urat
ion
Pers
on im
plem
entin
gT
ype
of in
terv
entio
nas
sign
men
t;tre
atm
ent f
idel
ity:
yes
18. B
ryan
t et a
l.(2
000)
; tre
atm
ent
fidel
ity: y
es
Sing
le g
roup
14 (R
D)
6th
NR
(4 m
onth
s; 9
0m
in)
Teac
her
Mul
ticom
pone
nt(w
ord
iden
tific
atio
n,flu
ency
,co
mpr
ehen
sion
)
19. M
acA
rthur
&H
ayne
s (19
95);
treat
men
t fid
elity
:N
R
Sing
le g
roup
10 (L
D)
9th–
10th
2 se
ssio
nsR
esea
rche
rsC
ompr
ehen
sion
20. M
erce
r,C
ampb
ell,
Mill
er,
Mer
cer,
& L
ane
(200
0); t
reat
men
tfid
elity
: NR
Sing
le g
roup
49 (L
D)
6th–
8th
NR
(dai
ly; 5
–6 m
in)
Teac
her
Flue
ncy
21. D
aly
&M
arte
ns (1
994)
;tre
atm
ent f
idel
ity:
yes
Sing
le su
bjec
t2
(LD
)N
R (1
1.11
yr.)
21 (1
–2/d
ay)
Teac
her a
nd re
sear
cher
sFl
uenc
y
22. F
reel
and,
Skin
ner,
Jack
son,
McD
anie
l, &
Smith
(200
0);
treat
men
t fid
elity
:ye
s
Sing
le su
bjec
t3
(LD
)7t
h–8t
h, 1
1th
NR
(dai
ly)
Res
earc
her
Flue
ncy
23. G
ardh
ill &
Jite
ndra
(199
9);
treat
men
t fid
elity
:ye
s
Sing
le su
bjec
t6
(LD
)6t
h an
d 8t
hN
R (1
4–20
wee
ks;
40–5
0 m
in)
NR
Com
preh
ensi
on
24. L
aute
rbac
h &
Ben
der (
1995
);tre
atm
ent f
idel
ity:
NR
Sing
le su
bjec
t3
(LD
, MM
R)
9th
NR
Teac
her
Com
preh
ensi
on
25. S
cott
&Sh
eare
r-Li
ngo
(200
2); t
reat
men
tfid
elity
: yes
Sing
le su
bjec
t3
(RD
, EB
D)
7th
NR
Res
earc
her
Mul
ticom
pone
nt(w
ord
stud
y an
dflu
ency
)
26. S
teve
nton
&Fr
eder
ick
(200
3);
treat
men
t fid
elity
:ye
s
Sing
le su
bjec
t1
(stru
gglin
g re
ader
)N
R (1
5-ye
ar-o
ld)
26 se
ssio
nsTe
ache
rM
ultic
ompo
nent
(wor
d st
udy,
flue
ncy)
27. S
trong
, Weh
by,
Falk
, & L
ane
(200
4); t
reat
men
tfid
elity
: yes
Sing
le su
bjec
t6
(RD
)7t
h–8t
hN
R (1
0–15
min
/se
ssio
n, p
erpr
ogra
m)
Res
earc
her
Mul
ticom
pone
nt(w
ord
stud
y, fl
uenc
y)
28. V
alle
cors
a &
deB
ette
ncou
rtSi
ngle
subj
ect
3 (L
D)
7th
6 se
ssio
ns (3
0 m
in)
Teac
her
Com
preh
ensi
on
Rev Educ Res. Author manuscript; available in PMC 2010 January 12.
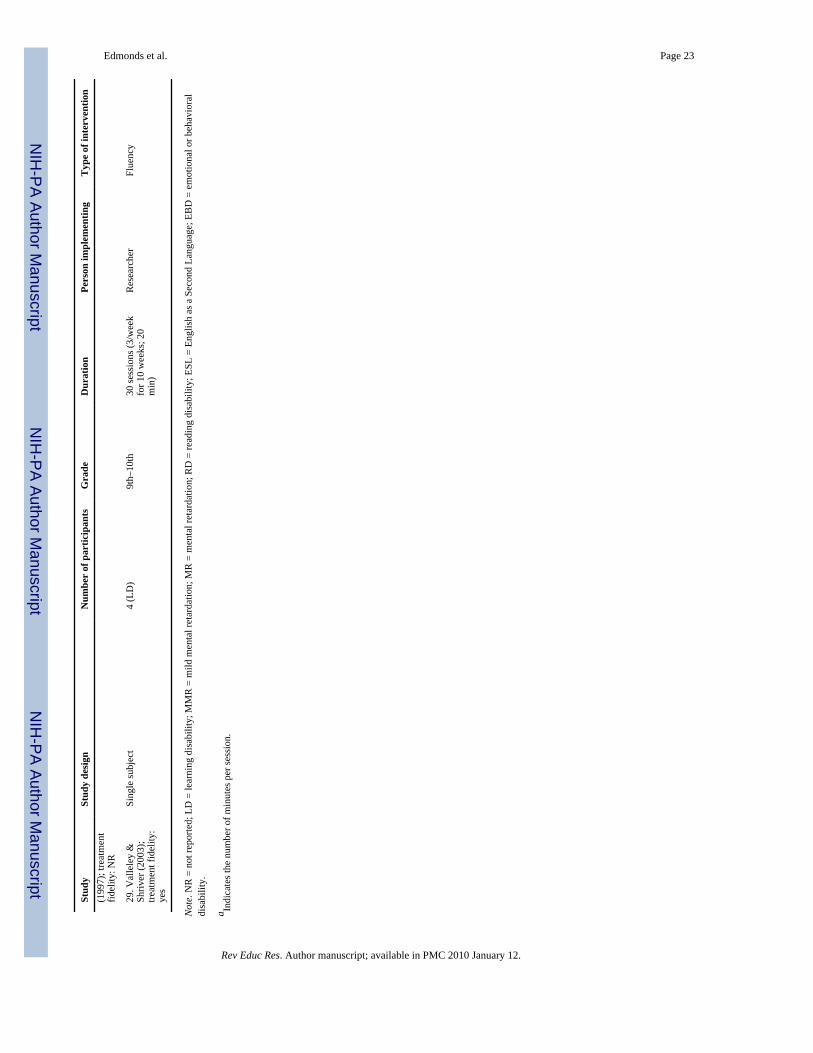
NIH
-PA Author Manuscript
NIH
-PA Author Manuscript
NIH
-PA Author Manuscript
Edmonds et al. Page 23
Stud
ySt
udy
desi
gnN
umbe
r of
par
ticip
ants
Gra
deD
urat
ion
Pers
on im
plem
entin
gT
ype
of in
terv
entio
n(1
997)
; tre
atm
ent
fidel
ity: N
R
29. V
alle
ley
&Sh
river
(200
3);
treat
men
t fid
elity
:ye
s
Sing
le su
bjec
t4
(LD
)9t
h–10
th30
sess
ions
(3/w
eek
for 1
0 w
eeks
; 20
min
)
Res
earc
her
Flue
ncy
Not
e. N
R =
not
repo
rted;
LD
= le
arni
ng d
isab
ility
; MM
R =
mild
men
tal r
etar
datio
n; M
R =
men
tal r
etar
datio
n; R
D =
read
ing
disa
bilit
y; E
SL =
Eng
lish
as a
Sec
ond
Lang
uage
; EB
D =
em
otio
nal o
r beh
avio
ral
disa
bilit
y.
a Indi
cate
s the
num
ber o
f min
utes
per
sess
ion.
Rev Educ Res. Author manuscript; available in PMC 2010 January 12.
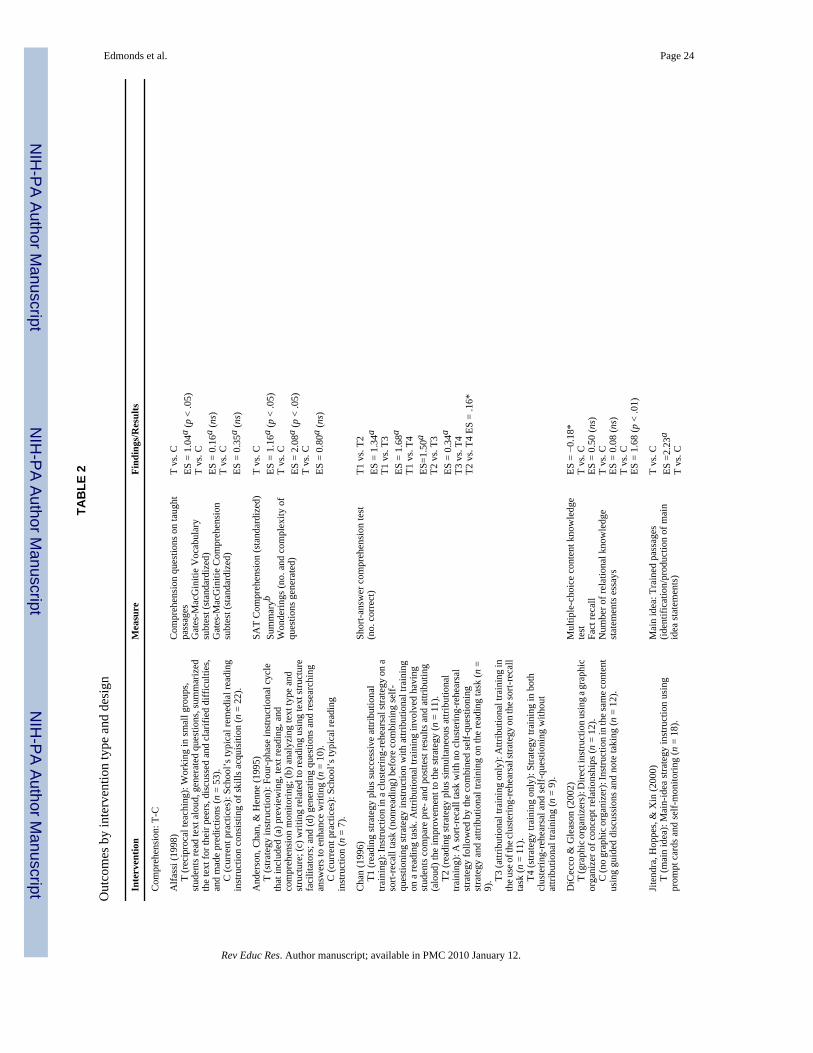
NIH
-PA Author Manuscript
NIH
-PA Author Manuscript
NIH
-PA Author Manuscript
Edmonds et al. Page 24
TAB
LE 2
Out
com
es b
y in
terv
entio
n ty
pe a
nd d
esig
n
Inte
rven
tion
Mea
sure
Find
ings
/Res
ults
Com
preh
ensi
on: T
-C
Alfa
ssi (
1998
)
T (r
ecip
roca
l tea
chin
g): W
orki
ng in
smal
l gro
ups,
stud
ents
read
text
alo
ud, g
ener
ated
que
stio
ns, s
umm
ariz
edth
e te
xt fo
r the
ir pe
ers,
disc
usse
d an
d cl
arifi
ed d
iffic
ultie
s,an
d m
ade
pred
ictio
ns (n
= 5
3).
C
(cur
rent
pra
ctic
es):
Scho
ol’s
typi
cal r
emed
ial r
eadi
ngin
stru
ctio
n co
nsis
ting
of sk
ills a
cqui
sitio
n (n
= 2
2).
Com
preh
ensi
on q
uest
ions
on
taug
htpa
ssag
esG
ates
-Mac
Gin
itie
Voc
abul
ary
subt
est (
stan
dard
ized
)G
ates
-Mac
Gin
itie
Com
preh
ensi
onsu
btes
t (st
anda
rdiz
ed)
T vs
. CES
= 1
.04a
(p <
.05)
T vs
. CES
= 0
.16a
(ns)
T vs
. CES
= 0
.35a
(ns)
And
erso
n, C
han,
& H
enne
(199
5)
T (s
trate
gy in
stru
ctio
n): F
our-
phas
e in
stru
ctio
nal c
ycle
that
incl
uded
(a) p
revi
ewin
g, te
xt re
adin
g, a
ndco
mpr
ehen
sion
mon
itorin
g; (b
) ana
lyzi
ng te
xt ty
pe a
ndst
ruct
ure;
(c) w
ritin
g re
late
d to
read
ing
usin
g te
xt st
ruct
ure
faci
litat
ors;
and
(d) g
ener
atin
g qu
estio
ns a
nd re
sear
chin
gan
swer
s to
enha
nce
writ
ing
(n =
10)
.
C (c
urre
nt p
ract
ices
): Sc
hool
’s ty
pica
l rea
ding
inst
ruct
ion
(n =
7).
SAT
Com
preh
ensi
on (s
tand
ardi
zed)
Sum
mar
ybW
onde
rings
(no.
and
com
plex
ity o
fqu
estio
ns g
ener
ated
)
T vs
. CES
= 1
.16a
(p <
.05)
T vs
. CES
= 2
.08a
(p <
.05)
T vs
. CES
= 0
.80a
(ns)
Cha
n (1
996)
T1
(rea
ding
stra
tegy
plu
s suc
cess
ive
attri
butio
nal
train
ing)
: Ins
truct
ion
in a
clus
terin
g-re
hear
sal s
trate
gy o
n a
sort-
reca
ll ta
sk (n
onre
adin
g) b
efor
e co
mbi
ning
self-
ques
tioni
ng st
rate
gy in
stru
ctio
n w
ith a
ttrib
utio
nal t
rain
ing
on a
read
ing
task
. Attr
ibut
iona
l tra
inin
g in
volv
ed h
avin
gst
uden
ts c
ompa
re p
re- a
nd p
ostte
st re
sults
and
attr
ibut
ing
(alo
ud) t
he im
prov
emen
t to
the
stra
tegy
(n =
11)
.
T2 (r
eadi
ng st
rate
gy p
lus s
imul
tane
ous a
ttrib
utio
nal
train
ing)
: A so
rt-re
call
task
with
no
clus
terin
g-re
hear
sal
stra
tegy
follo
wed
by
the
com
bine
d se
lf-qu
estio
ning
stra
tegy
and
attr
ibut
iona
l tra
inin
g on
the
read
ing
task
(n =
9).
T3
(attr
ibut
iona
l tra
inin
g on
ly):
Attr
ibut
iona
l tra
inin
g in
the u
se o
f the
clus
terin
g-re
hear
sal s
trate
gy o
n th
e sor
t-rec
all
task
(n =
11)
.
T4 (s
trate
gy tr
aini
ng o
nly)
: Stra
tegy
trai
ning
in b
oth
clus
terin
g-re
hear
sal a
nd se
lf-qu
estio
ning
with
out
attri
butio
nal t
rain
ing
(n =
9).
Shor
t-ans
wer
com
preh
ensi
on te
st(n
o. c
orre
ct)
T1 v
s. T2
ES =
1.3
4aT1
vs.
T3ES
= 1
.68a
T1 v
s. T4
ES=1
.50a
T2 v
s. T3
ES =
0.3
4aT3
vs.
T4T2
vs.
T4 E
S =
.16*
DiC
ecco
& G
leas
on (2
002)
T
(gra
phic
org
aniz
ers)
: Dire
ct in
stru
ctio
n us
ing
a gra
phic
orga
nize
r of c
once
pt re
latio
nshi
ps (n
= 1
2).
C
(no
grap
hic o
rgan
izer
): In
stru
ctio
n in
the s
ame c
onte
ntus
ing
guid
ed d
iscu
ssio
ns a
nd n
ote
taki
ng (n
= 1
2).
Mul
tiple
-cho
ice
cont
ent k
now
ledg
ete
stFa
ct re
call
Num
ber o
f rel
atio
nal k
now
ledg
est
atem
ents
ess
ays
ES =
−0.
18*
T vs
. CES
= 0
.50
(ns)
T vs
. CES
= 0
.08
(ns)
T vs
. CES
= 1
.68
(p <
.01)
Jite
ndra
, Hop
pes,
& X
in (2
000)
T
(mai
n id
ea):
Mai
n-id
ea st
rate
gy in
stru
ctio
n us
ing
prom
pt c
ards
and
self-
mon
itorin
g (n
= 1
8).
Mai
n id
ea: T
rain
ed p
assa
ges
(iden
tific
atio
n/pr
oduc
tion
of m
ain
idea
stat
emen
ts)
T vs
. CES
=2.
23a
T vs
. C
Rev Educ Res. Author manuscript; available in PMC 2010 January 12.
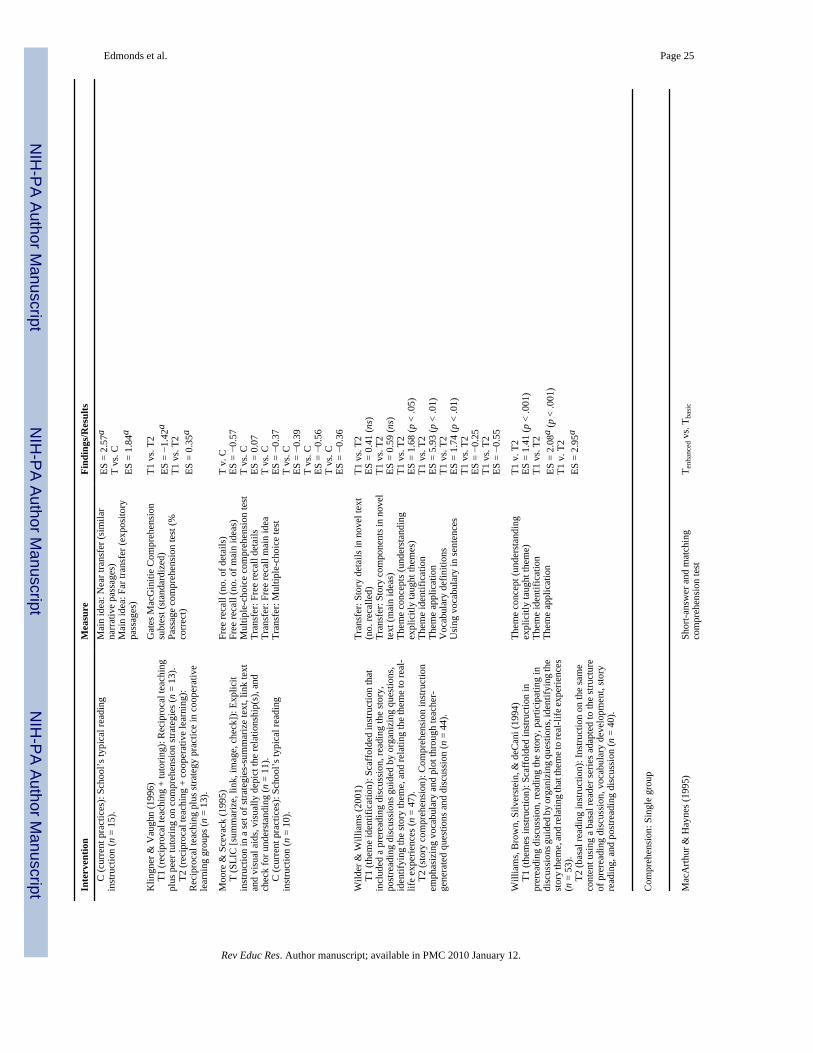
NIH
-PA Author Manuscript
NIH
-PA Author Manuscript
NIH
-PA Author Manuscript
Edmonds et al. Page 25
Inte
rven
tion
Mea
sure
Find
ings
/Res
ults
C
(cur
rent
pra
ctic
es):
Scho
ol’s
typi
cal r
eadi
ngin
stru
ctio
n (n
= 1
5).
Mai
n id
ea: N
ear t
rans
fer (
sim
ilar
narr
ativ
e pa
ssag
es)
Mai
n id
ea: F
ar tr
ansf
er (e
xpos
itory
pass
ages
)
ES =
2.5
7aT
vs. C
ES =
1.8
4a
Klin
gner
& V
augh
n (1
996)
T1
(rec
ipro
cal t
each
ing
+ tu
torin
g): R
ecip
roca
l tea
chin
gpl
us p
eer t
utor
ing
on c
ompr
ehen
sion
stra
tegi
es (n
= 1
3).
T2
(rec
ipro
cal t
each
ing
+ co
oper
ativ
e le
arni
ng):
Rec
ipro
cal t
each
ing
plus
stra
tegy
pra
ctic
e in
coo
pera
tive
lear
ning
gro
ups (
n =
13).
Gat
es M
acG
initi
e C
ompr
ehen
sion
subt
est (
stan
dard
ized
)Pa
ssag
e co
mpr
ehen
sion
test
(%co
rrec
t)
T1 v
s. T2
ES =
−1.
42a
T1 v
s. T2
ES =
0.3
5a
Moo
re &
Sce
vack
(199
5)
T (S
LIC
[sum
mar
ize,
link
, im
age,
che
ck])
: Exp
licit
inst
ruct
ion
in a
set o
f stra
tegi
es-s
umm
ariz
e te
xt, l
ink
text
and
visu
al a
ids,
visu
ally
dep
ict t
he re
latio
nshi
p(s)
, and
chec
k fo
r und
erst
andi
ng (n
= 1
1).
C
(cur
rent
pra
ctic
es):
Scho
ol’s
typi
cal r
eadi
ngin
stru
ctio
n (n
= 1
0).
Free
reca
ll (n
o. o
f det
ails
)Fr
ee re
call
(no.
of m
ain
idea
s)M
ultip
le-c
hoic
e co
mpr
ehen
sion
test
Tran
sfer
: Fre
e re
call
deta
ilsTr
ansf
er: F
ree
reca
ll m
ain
idea
Tran
sfer
: Mul
tiple
-cho
ice
test
T v.
CES
= −
0.57
T vs
. CES
= 0
.07
T vs
. CES
= −
0.37
T vs
. CES
= −
0.39
T vs
. CES
= −
0.56
T vs
. CES
= −
0.36
Wild
er &
Will
iam
s (20
01)
T1
(the
me
iden
tific
atio
n): S
caff
olde
d in
stru
ctio
n th
atin
clud
ed a
pre
read
ing
disc
ussi
on, r
eadi
ng th
e st
ory,
post
read
ing
disc
ussi
ons g
uide
d by
org
aniz
ing
ques
tions
,id
entif
ying
the
stor
y th
eme,
and
rela
ting
the
them
e to
real
-lif
e ex
perie
nces
(n =
47)
.
T2 (s
tory
com
preh
ensi
on):
Com
preh
ensi
on in
stru
ctio
nem
phas
izin
g vo
cabu
lary
and
plo
t thr
ough
teac
her-
gene
rate
d qu
estio
ns a
nd d
iscu
ssio
n (n
= 4
4).
Tran
sfer
: Sto
ry d
etai
ls in
nov
el te
xt(n
o. re
calle
d)Tr
ansf
er: S
tory
com
pone
nts i
n no
vel
text
(mai
n id
eas)
Them
e co
ncep
ts (u
nder
stan
ding
expl
icitl
y ta
ught
them
es)
Them
e id
entif
icat
ion
Them
e ap
plic
atio
nV
ocab
ular
y de
finiti
ons
Usi
ng v
ocab
ular
y in
sent
ence
s
T1 v
s. T2
ES =
0.4
1 (n
s)T1
vs.
T2ES
= 0
.59
(ns)
T1 v
s. T2
ES =
1.6
8 (p
< .0
5)T1
vs.
T2ES
= 5
.93
(p <
.01)
T1 v
s. T2
ES =
1.7
4 (p
< .0
1)T1
vs.
T2ES
= −
0.25
T1 v
s. T2
ES =
−0.
55
Will
iam
s, B
row
n, S
ilver
stei
n, &
deC
ani (
1994
)
T1 (t
hem
es in
stru
ctio
n): S
caff
olde
d in
stru
ctio
n in
prer
eadi
ng d
iscu
ssio
n, re
adin
g th
e st
ory,
par
ticip
atin
g in
disc
ussi
ons g
uide
d by
org
aniz
ing
ques
tions
, ide
ntify
ing
the
stor
y th
eme,
and
rela
ting
that
them
e to
real
-life
expe
rienc
es(n
= 5
3).
T2
(bas
al re
adin
g in
stru
ctio
n): I
nstru
ctio
n on
the
sam
eco
nten
t usi
ng a
bas
al re
ader
serie
s ada
pted
to th
e st
ruct
ure
of p
rere
adin
g di
scus
sion
, voc
abul
ary
deve
lopm
ent,
stor
yre
adin
g, a
nd p
ostre
adin
g di
scus
sion
(n =
40)
.
Them
e co
ncep
t (un
ders
tand
ing
expl
icitl
y ta
ught
them
e)Th
eme
iden
tific
atio
nTh
eme
appl
icat
ion
T1 v
. T2
ES =
1.4
1 (p
< .0
01)
T1 v
s. T2
ES =
2.0
8a (p
< .0
01)
T1 v
. T2
ES =
2.9
5a
Com
preh
ensi
on: S
ingl
e gr
oup
Mac
Arth
ur &
Hay
nes (
1995
)Sh
ort-a
nsw
er a
nd m
atch
ing
com
preh
ensi
on te
stT e
nhan
ced v
s. T b
asic
Rev Educ Res. Author manuscript; available in PMC 2010 January 12.

NIH
-PA Author Manuscript
NIH
-PA Author Manuscript
NIH
-PA Author Manuscript
Edmonds et al. Page 26
Inte
rven
tion
Mea
sure
Find
ings
/Res
ults
T
(SA
LT [S
tude
nt A
ssis
tanc
e fo
r Lea
rnin
g fr
om T
ext])
:H
yper
med
ia v
ersi
ons o
f tex
tboo
ks th
at p
rovi
ded
eith
erba
sic
wor
d re
cogn
ition
/dec
odin
g an
d vo
cabu
lary
supp
ort
or a
n en
hanc
ed v
ersi
on w
ith a
dditi
onal
supp
ort (
ques
tion
win
dow
s, gl
ossa
ry, t
each
er c
omm
ents
, and
spee
chsy
nthe
sis)
for c
ompr
ehen
ding
exp
osito
ry te
xt (n
= 1
0).
ES =
0.8
8(n
ot c
onve
rted)
(p <
.05)
Com
preh
ensi
on: S
ingl
e su
bjec
t
Gar
dhill
& Ji
tend
ra (1
999)
T
(Adv
ance
d st
ory
map
con
stru
ctio
n): E
xplic
itin
stru
ctio
n in
stor
y gr
amm
ar e
lem
ents
; pha
ses i
nclu
ded
mod
el, l
ead,
and
inde
pend
ent p
ract
ice
(n =
6).
M1:
Sto
ry re
tell
PND
(%)
Stud
ent
M1
M2
Mar
vin
100
63
Mar
k10
025
M2:
Bas
al c
ompr
ehen
sion
test
Cha
d10
025
Mitc
h10
013
Tara
100
88
Jack
100
100
Laut
erba
ch &
Ben
der i
n re
f (19
95)
T
(rea
d, a
sk a
nd p
arap
hras
e st
rate
gy):
Stud
ents
taug
ht to
read
the
para
grap
h, id
entif
y th
e m
ain
idea
and
two
deta
ils,
and
rew
rite
them
in th
eir o
wn
wor
ds (n
= 3
).
Para
phra
sing
(% c
orre
ct)
PND
(%)
A91
B92
Mul
tiple
-cho
ice
com
preh
ensi
on te
st(s
even
th-,
eigh
th- a
nd n
inth
-gra
de-
leve
le m
ater
ials
)
C10
0
Seve
nth
Eigh
thN
inth
A33
033
B10
010
010
0
Val
leco
rsa
& d
eBet
tenc
ourt
(199
7)
T (s
tory
map
ping
): Ex
plic
it in
stru
ctio
n in
eig
ht st
ory
elem
ents
(def
initi
ons a
nd m
ultip
le ex
ampl
es) a
nd d
epic
ting
stor
y el
emen
ts o
n a
stor
y m
ap (n
= 3
).
Ret
ell (
no. o
f sto
ry e
lem
ents
incl
uded
in re
tell)
C0
00
Stud
ent
PND
(%)
Dav
id67
Jaso
n10
0
Nic
k83
Flue
ncy:
T-C
Alli
nder
, Dun
se, B
runk
en, &
Obe
rmill
er-K
rolik
owsk
i(2
001)
WJR
M W
ord
Iden
tific
atio
n(s
tand
ardi
zed)
WJR
M W
ord
Atta
ck (s
tand
ardi
zed)
T vs
. CES
= −
0.02
T vs
. C
Rev Educ Res. Author manuscript; available in PMC 2010 January 12.

NIH
-PA Author Manuscript
NIH
-PA Author Manuscript
NIH
-PA Author Manuscript
Edmonds et al. Page 27
Inte
rven
tion
Mea
sure
Find
ings
/Res
ults
T
(flu
ency
stra
tegy
inst
ruct
ion)
: Stu
dent
s tau
ght t
o fo
cus
on u
sing
one
or m
ore
of th
e fo
llow
ing
stra
tegi
es d
urin
g a
read
-alo
ud c
onfe
renc
e: re
adin
g w
ith in
flect
ion,
self-
mon
itorin
g fo
r acc
urac
y, re
adin
g at
an
appr
opria
te p
ace,
wat
chin
g fo
r wor
d en
ding
s, an
d fin
ger t
rack
ing
(n =
33)
.
C (n
o st
rate
gy in
stru
ctio
n): S
tude
nts e
ncou
rage
d to
do
thei
r bes
t whi
le re
adin
g al
oud
(n =
16)
.
WJR
M C
ompr
ehen
sion
(sta
ndar
dize
d)Sl
ope
on m
aze
task
ES =
0.0
8T
vs. C
ES =
−0.
03T
vs. C
ES =
0.7
9
Flue
ncy:
Sin
gle
grou
p
Mer
cer,
Cam
pbel
l, M
iller
, Mer
cer,
& L
ane
(200
0)
T1 (G
reat
Lea
ps re
adin
g pr
ogra
m):
Inst
ruct
ion
in si
ght
phra
ses a
nd o
ral r
eadi
ng w
ith g
raph
ing
of o
ral r
eadi
ngflu
ency
for 1
9–25
mon
ths (
n =
11).
T2
: T1
for 1
0–18
mon
ths (
n =
19).
T3
: T1
for 6
–9 m
onth
s (n
= 19
).
CB
M o
ral r
eadi
ng fl
uenc
yT1 ES
= 0
.37c
T2 ES =
0.1
3T3 ES
= 0
.24
Flue
ncy:
Sin
gle
subj
ect
Dal
y &
Mar
tens
(199
4)
T1 (s
ubje
ct p
assa
ge p
revi
ew):
Stud
ent r
ead
a pa
ssag
ew
ith fe
edba
ck fr
om in
stru
ctor
(n =
2).
T2
(tap
ed w
ords
): St
uden
t rea
d al
ong
with
an
audi
o-ta
ped
wor
d lis
t (n
= 2)
.
T3 (l
iste
ning
pas
sage
pre
view
): St
uden
t lis
tene
d to
an
audi
o-ta
ped
pass
age w
hile
follo
win
g al
ong
sile
ntly
(n =
2).
Wor
ds re
ad c
orre
ctly
per
min
ute:
Pass
age
PND
(%)
T1T2
T3
Wor
ds re
ad c
orre
ctly
per
min
ute:
Wor
d lis
tS3
100
5757
S410
057
14
S343
2929
S457
8671
Fr
eela
nd, S
kinn
er, J
acks
on, M
cDan
iel,
& S
mith
(200
0)
T (r
epea
ted r
eadi
ng):
Rep
eate
d ora
l pas
sage
read
ing (
two
read
s) w
ith e
rror
cor
rect
ion
by th
e te
ache
r (n
= 3)
.
Bas
elin
e (s
ilent
read
ing)
: Sile
nt p
assa
ge re
adin
g (tw
ore
ads)
(n =
3).
CB
M c
ompr
ehen
sion
que
stio
nsSt
uden
tPN
D (%
)d
CB
M fl
uenc
y ra
teJa
son
71
Bill
29
Chr
is86
Jaso
n14
Bill
57
Chr
is57
Val
lele
y &
Shr
iver
(200
3)
T (r
epea
ted
read
ings
): En
gage
in re
peat
ed re
adin
gs in
whi
ch th
e st
uden
t rer
eads
the
sam
e pa
ssag
e un
til h
e or
she
exhi
bits
thre
e co
nsec
utiv
e flu
ency
impr
ovem
ents
.
Com
preh
ensi
on q
uest
ions
(no.
corr
ect,
n =
10)
S16–
10
S24–
10
Ora
l rea
ding
flue
ncy
S36–
10
PND
(%)
Rev Educ Res. Author manuscript; available in PMC 2010 January 12.

NIH
-PA Author Manuscript
NIH
-PA Author Manuscript
NIH
-PA Author Manuscript
Edmonds et al. Page 28
Inte
rven
tion
Mea
sure
Find
ings
/Res
ults
S112
S224
S317
Wor
d st
udy:
T-C
Abb
ott &
Ber
ning
er (1
999)
T1
(stru
ctur
al a
naly
sis)
: Ins
truct
ion
in th
e al
phab
etic
prin
cipl
e, p
hono
logi
cal d
ecod
ing
(app
lied
phon
ics a
ndst
ruct
ural
ana
lysi
s), s
truct
ural
ana
lysi
s foc
used
on
affix
esan
d suf
fixes
, and
repe
ated
oral
read
ing w
ith er
ror c
orre
ctio
n(u
sing
stru
ctur
al a
naly
sis)
and
com
preh
ensi
on m
onito
ring
(n =
10)
.
T2 (s
tudy
skill
s): T
1 w
ith sy
nthe
tic p
honi
cs st
rate
gies
(i.e.
, let
ter-
soun
d co
rres
pond
ence
) and
stud
y sk
ills
inst
ruct
ion
(wor
kboo
k pa
ges o
n no
te ta
king
, out
linin
g, a
ndpa
ragr
aph
writ
ing)
in p
lace
of s
truct
ural
ana
lysi
sin
stru
ctio
n an
d ap
plic
atio
n (n
= 1
0).
WR
MT-
R: C
ompr
ehen
sion
(sta
ndar
dize
d)W
RM
T-R
Wor
d Id
entif
icat
ion
(sta
ndar
dize
d)W
RM
T-R
Wor
d A
ttack
(sta
ndar
dize
d)Q
ualit
ativ
e R
eadi
ng In
vent
ory
(sta
ndar
dize
d)TO
WR
E (s
tand
ardi
zed)
TOW
RE
Pseu
dow
ords
(sta
ndar
dize
d)
T1 v
s. T2
ES =
−0.
12a
(ns)
T1 v
s. T2
ES =
−0.
17a
(ns)
T1 v
s. T2
ES =
−0.
08a
(ns)
T1 v
s. T2
ES =
0.1
9a (n
s)T1
vs.
T2ES
= −
0.31
a (n
s)T1
vs.
T2ES
= 0
.04a
(ns)
Bha
t, G
riffin
, & S
inde
lair
(200
3)
T (G
reat
Lea
ps re
adin
g pro
gram
+ ph
onem
ic aw
aren
ess)
:Ph
onol
ogic
al a
nd p
hone
mic
aw
aren
ess l
esso
ns fr
om G
reat
Leap
s rea
ding
pro
gram
supp
lem
ente
d w
ith a
dditi
onal
phon
emic
aw
aren
ess a
ctiv
ities
, inc
ludi
ng p
hone
me
blen
ding
, seg
men
ting,
reve
rsal
, and
subs
titut
ion
(n =
20)
.C
(cur
rent
pra
ctic
es):
Scho
ol’s
typi
cal r
eadi
ng in
stru
ctio
n(n
= 2
0).
CTO
Pp (s
tand
ardi
zed)
WR
MT
Wor
d Id
entif
icat
ion
(sta
ndar
dize
d)
T vs
. CES
= 1
.59a
(p <
.001
)T
vs. C
ES =
0.1
5a (n
s)
Bha
ttach
arya
& E
hri (
2004
)
T1 (s
ylla
ble
chun
king
stra
tegy
): St
uden
ts w
ere
taug
ht to
oral
ly d
ivid
e m
ultis
ylla
bic
wor
ds in
to sy
llabl
es, s
tate
the
num
ber o
f syl
labl
es, m
atch
them
to th
eir s
pelli
ng, a
nd b
lend
the
sylla
bles
to sa
y th
e w
hole
wor
d. C
orre
ctiv
e fe
edba
ckw
as p
rovi
ded
afte
r eac
h st
ep (n
= 2
0).
T2
(who
le-w
ord
read
ing)
: Stu
dent
s pra
ctic
ed re
adin
gm
ultis
ylla
bic
wor
ds w
ith n
o ap
plie
d st
rate
gy. C
orre
ctiv
efe
edba
ck w
as p
rovi
ded
(n =
20)
.
C1
(cur
rent
pra
ctic
es):
Scho
ol’s
typi
cal r
eadi
ngin
stru
ctio
n (n
= 2
0).
WR
MT-
R W
ord
Atta
ck(s
tand
ardi
zed)
Sylla
ble
segm
enta
tion
Dec
odin
g w
ords
Dec
odin
g su
btle
mis
spel
lings
Dec
odin
g ps
eudo
wor
ds b
y an
alog
y
T1 v
s. C
ES =
1.4
0T2
vs.
CES
= 0
.43
T1 v
s. C
ES =
1.1
4T2
vs.
CES
= 0
.20
T2 v
s. C
ES =
0.2
0T1
vs.
CES
= 0
.65
T2 v
s. C
ES =
0.4
2T1
vs.
CES
= 1
.14
T2 v
s. C
ES =
0.5
1T1
vs.
CES
= 0
.50
Penn
ey (2
002)
T
(pho
nem
ic d
ecod
ing)
: Stu
dent
s rea
d al
oud
from
text
;w
ords
read
slow
ly o
r inc
orre
ctly
wer
e the
n ta
ught
usi
ng th
eG
lass
ana
lysi
s met
hod
of re
hear
sing
the
pron
unci
atio
n of
PPV
T (s
tand
ardi
zed)
WR
MT
Wor
d Id
entif
icat
ion
(sta
ndar
dize
d)W
RM
T W
ord
Atta
ck
T2 v
s. C
ES =
0.0
3T
vs. C
ES =
0.8
2
Rev Educ Res. Author manuscript; available in PMC 2010 January 12.
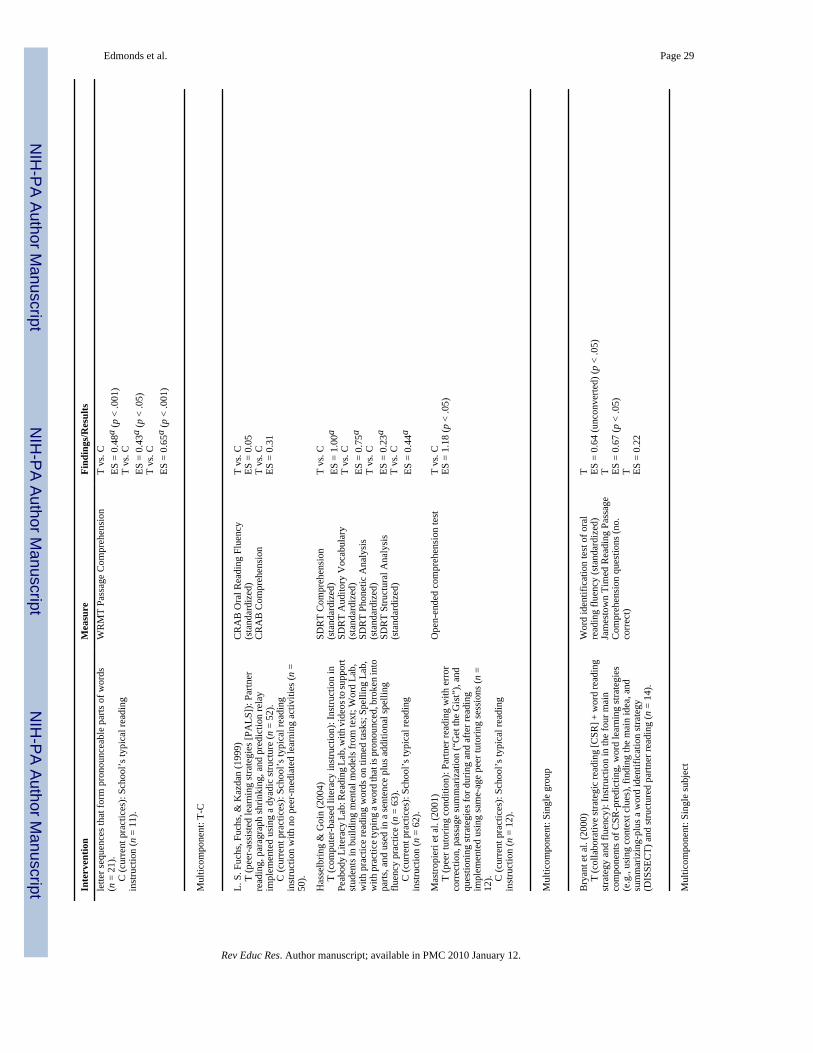
NIH
-PA Author Manuscript
NIH
-PA Author Manuscript
NIH
-PA Author Manuscript
Edmonds et al. Page 29
Inte
rven
tion
Mea
sure
Find
ings
/Res
ults
lette
r seq
uenc
es th
at fo
rm p
rono
unce
able
par
ts o
f wor
ds(n
= 2
1).
C
(cur
rent
pra
ctic
es):
Scho
ol’s
typi
cal r
eadi
ngin
stru
ctio
n (n
= 1
1).
WR
MT
Pass
age
Com
preh
ensi
onT
vs. C
ES =
0.4
8a (p
< .0
01)
T vs
. CES
= 0
.43a
(p <
.05)
T vs
. CES
= 0
.65a
(p <
.001
)
Mul
ticom
pone
nt: T
-C
L. S
. Fuc
hs, F
uchs
, & K
azda
n (1
999)
T
(pee
r-as
sist
ed le
arni
ng st
rate
gies
[PA
LS])
: Par
tner
read
ing,
par
agra
ph sh
rinki
ng, a
nd p
redi
ctio
n re
lay
impl
emen
ted
usin
g a
dyad
ic st
ruct
ure
(n =
52)
.
C (c
urre
nt p
ract
ices
): Sc
hool
’s ty
pica
l rea
ding
inst
ruct
ion
with
no
peer
-med
iate
d le
arni
ng a
ctiv
ities
(n =
50).
CR
AB
Ora
l Rea
ding
Flu
ency
(sta
ndar
dize
d)C
RA
B C
ompr
ehen
sion
T vs
. CES
= 0
.05
T vs
. CES
= 0
.31
Has
selb
ring
& G
oin
(200
4)
T (c
ompu
ter-
base
d lit
erac
y in
stru
ctio
n): I
nstru
ctio
n in
Peab
ody
Lite
racy
Lab
: Rea
ding
Lab
, with
vid
eos t
o su
ppor
tst
uden
ts in
bui
ldin
g m
enta
l mod
els f
rom
text
; Wor
d La
b,w
ith p
ract
ice
read
ing
wor
ds o
n tim
ed ta
sks;
Spe
lling
Lab
,w
ith p
ract
ice t
ypin
g a w
ord
that
is p
rono
unce
d, b
roke
n in
topa
rts, a
nd u
sed
in a
sent
ence
plu
s add
ition
al sp
ellin
gflu
ency
pra
ctic
e (n
= 6
3).
C
(cur
rent
pra
ctic
es):
Scho
ol’s
typi
cal r
eadi
ngin
stru
ctio
n (n
= 6
2).
SDR
T C
ompr
ehen
sion
(sta
ndar
dize
d)SD
RT
Aud
itory
Voc
abul
ary
(sta
ndar
dize
d)SD
RT
Phon
etic
Ana
lysi
s(s
tand
ardi
zed)
SDR
T St
ruct
ural
Ana
lysi
s(s
tand
ardi
zed)
T vs
. CES
= 1
.00a
T vs
. CES
= 0
.75a
T vs
. CES
= 0
.23a
T vs
. CES
= 0
.44a
Mas
tropi
eri e
t al.
(200
1)
T (p
eer t
utor
ing
cond
ition
): Pa
rtner
read
ing
with
err
orco
rrec
tion,
pas
sage
sum
mar
izat
ion
(“G
et th
e G
ist”
), an
dqu
estio
ning
stra
tegi
es fo
r dur
ing
and
afte
r rea
ding
impl
emen
ted
usin
g sa
me-
age
peer
tuto
ring
sess
ions
(n =
12).
C
(cur
rent
pra
ctic
es):
Scho
ol’s
typi
cal r
eadi
ngin
stru
ctio
n (n
= 1
2).
Ope
n-en
ded
com
preh
ensi
on te
stT
vs. C
ES =
1.1
8 (p
< .0
5)
Mul
ticom
pone
nt: S
ingl
e gr
oup
Bry
ant e
t al.
(200
0)
T (c
olla
bora
tive
stra
tegi
c re
adin
g [C
SR] +
wor
d re
adin
gst
rate
gy a
nd fl
uenc
y): I
nstru
ctio
n in
the
four
mai
nco
mpo
nent
s of C
SR-p
redi
ctin
g, w
ord
lear
ning
stra
tegi
es(e
.g.,
usin
g co
ntex
t clu
es),
findi
ng th
e m
ain
idea
, and
sum
mar
izin
g-pl
us a
wor
d id
entif
icat
ion
stra
tegy
(DIS
SEC
T) a
nd st
ruct
ured
par
tner
read
ing
(n =
14)
.
Wor
d id
entif
icat
ion
test
of o
ral
read
ing
fluen
cy (s
tand
ardi
zed)
Jam
esto
wn
Tim
ed R
eadi
ng P
assa
geC
ompr
ehen
sion
que
stio
ns (n
o.co
rrec
t)
T ES =
0.6
4 (u
ncon
verte
d) (p
< .0
5)T ES
= 0
.67
(p <
.05)
T ES =
0.2
2
Mul
ticom
pone
nt: S
ingl
e su
bjec
t
Rev Educ Res. Author manuscript; available in PMC 2010 January 12.

NIH
-PA Author Manuscript
NIH
-PA Author Manuscript
NIH
-PA Author Manuscript
Edmonds et al. Page 30
Inte
rven
tion
Mea
sure
Find
ings
/Res
ults
Scot
t & S
hear
er-L
ingo
(200
2)
T1 (T
each
You
r Chi
ld):
Phon
ics i
nstru
ctio
n w
ith te
ache
rm
odel
ing
of le
tter-
soun
d re
latio
nshi
ps a
nd o
ppor
tuni
ties
for g
uide
d pr
actic
e (n
= 3
).
T2 (G
reat
Lea
ps re
adin
g pr
ogra
m):
1-m
in ti
min
gs o
fle
tter s
ound
s, si
ght p
hras
es, a
nd st
ory
read
ing
with
teac
her
mon
itorin
g (n
= 3
).
Ora
l rea
ding
flue
ncy
PND
(%)
Stud
ent
T1T2
Tony
100
100
Bill
y10
095
John
010
0
Stev
ento
n &
Fre
deric
k (2
003)
T
(cor
rect
ive
read
ing
+ re
peat
ed re
adin
g): E
xplic
itde
codi
ng in
stru
ctio
n us
ing
the C
orre
ctiv
e Rea
ding
pro
gram
plus
repe
ated
read
ing
(n =
1).
Ora
l rea
ding
flue
ncy
PND
(%)
Car
l: Pr
actic
ed te
xt54
Car
l: N
ovel
text
8
Stro
ng, W
ehby
, Fal
k, &
Lan
e (2
004)
T1
(cor
rect
ive
read
ing)
: Ins
truct
ion
in d
ecod
ing
stra
tegi
es th
roug
h le
sson
s tha
t con
sist
of w
ord
atta
ck sk
ills,
grou
p re
adin
g, a
nd w
orkb
ook
exer
cise
s (n
= 6)
.
T2 (c
orre
ctiv
e re
adin
g +
repe
ated
read
ing)
: T1
plus
partn
er re
adin
g w
ith te
ache
r-pr
ovid
ed c
orre
ctiv
e fe
edba
ckdu
ring
first
two
read
s and
par
tner
-pro
vide
d fe
edba
ck fo
rth
e su
bseq
uent
read
(n =
6).
SRA
pro
bes (
wor
ds c
orre
ct p
erm
inut
e)PN
D (%
)
Stud
ent
T1T2
Jim
2992
Dav
e29
100
Joe
5583
Mik
e45
100
Stev
e93
100
Jay
4075
Not
e. T
= tr
eatm
ent;
C =
com
paris
on; E
S =
effe
ct si
ze; P
ND
= p
erce
ntag
e of
non
over
lapp
ing
data
; SA
T =
Stan
ford
Ach
ieve
men
t Tes
t; W
JRM
= W
oodc
ock
John
son
Rea
ding
Mas
tery
; CB
M =
cur
ricul
um-b
ased
mea
sure
; WR
MT
= W
oodc
ock
Rea
ding
Mas
tery
Tes
t; W
RM
T-R
= W
oodc
ock
Rea
ding
Mas
tery
Tes
t-Rev
ised
; TO
WR
E =
Test
of W
ord
Rea
ding
Eff
icie
ncy;
CTO
Pp =
Com
preh
ensi
ve T
est o
f Pho
nolo
gica
lPr
oces
sing
; PPV
T =
Peab
ody
Pict
ure
Voc
abul
ary
Test
; CR
AB
= C
ompr
ehen
sive
Rea
ding
Ass
essm
ent B
atte
ry; S
DR
T =
Stan
ford
Dia
gnos
tic R
eadi
ng T
est;
SRA
= S
cien
ce R
esea
rch
Ass
ocia
tes.
a Indi
cate
s eff
ect s
ize
adju
sted
for p
rete
st d
iffer
ence
s.
b All
mea
sure
s are
rese
arch
er d
evel
oped
unl
ess i
ndic
ated
by
a pa
rent
hetic
al n
ote
(e.g
., st
anda
rdiz
ed).
c Rep
eate
d m
easu
res e
ffec
t siz
e co
nver
ted
to th
e m
etric
of C
ohen
’s d
.
d PND
cal
cula
ted
as th
e pe
rcen
tage
non
over
lapp
ing
data
bet
wee
n th
e ba
selin
e an
d tre
atm
ent i
nstru
ctio
nal c
ondi
tions
for e
ach
stud
ent.
Rev Educ Res. Author manuscript; available in PMC 2010 January 12.

NIH
-PA Author Manuscript
NIH
-PA Author Manuscript
NIH
-PA Author Manuscript
Edmonds et al. Page 31
TABLE 3
Type of intervention by study design
Study design
Intervention type Treatment–comparison Single group Single subject Marginal totals
Comprehension 9 1 3 13
Fluency 1 1 3 5
Word study 4 0 0 4
Multicomponent 3 1 3 7
Marginal totals 17 3 9 29
Rev Educ Res. Author manuscript; available in PMC 2010 January 12.

NIH
-PA Author Manuscript
NIH
-PA Author Manuscript
NIH
-PA Author Manuscript
Edmonds et al. Page 32
TABLE 4
Quality of treatment–comparison studies
Element Number of studies
Random assignment to conditions 10
Fidelity of treatment reported 9
Standardized dependent measures 10
Random assignment, treatment fidelity, and standardized measures 2
Rev Educ Res. Author manuscript; available in PMC 2010 January 12.

NIH
-PA Author Manuscript
NIH
-PA Author Manuscript
NIH
-PA Author Manuscript
Edmonds et al. Page 33
TABLE 5
Average weighted effects by measurement and intervention type
Effect size (95% confidence interval)
Measurement type
All measures (n = 13) 0.89 (0.42, 1.36)
Standardized measures (n = 7) 0.47 (0.12, 0.82)
Researcher developed measures (n = 9) 1.19 (1.10, 1.37)
Intervention Type
Fluency (n = 1) −0.03 (−0.56, 0.62)
Word study (n = 2) 0.34 (−0.22, 0.88)
Multicomponent (n = 3) 0.72 (0.45, 0.99)
Comprehension (n = 7) 1.23 (0.96, 1.5)
Rev Educ Res. Author manuscript; available in PMC 2010 January 12.