Growth in Precursor and Reading-Related Skills: Do Low-Achieving and IQ-Discrepant Readers Develop...
16
Learning Disabilities Research & Practice, 17(1), 19–34 Copyright C 2002, The Division for Learning Disabilities of the Council for Exceptional Children Growth in Precursor and Reading-Related Skills: Do Low-Achieving and IQ-Discrepant Readers Develop Differently? Kimberly J. O’Malley Houston Center for Quality of Care and Utilization Studies David J. Francis University of Houston Barbara R. Foorman and Jack M. Fletcher University of Texas–Houston Health Science Center Paul R. Swank UT-Houston School of Nursing Poor readers who met low achievement and IQ-discrepancy definitions of reading disability were compared with nonimpaired readers on their development of eight precursor and reading- related skills to evaluate developmental differences prior to students’ identification as reading disabled. Results indicated no evidence for differences between the two groups of poor readers in the development of the eight skills, with three exceptions. Students in the IQ-discrepant group demonstrated greater growth in letter sound knowledge, greater mean performance in visual- motor integration at the beginning of first grade, and greater deceleration in rapid naming of letters. When compared to the nonimpaired group, low-achieving readers demonstrated poorer performance and development in all skills, while the IQ-discrepant readers demonstrated poorer performance and development in phonemic awareness, rapid naming of letters and objects, spelling, and word reading. The largely null results for comparisons between the two groups of poor readers challenges the validity of the two-group classification of reading disabilities based on IQ-discrepancy. The number of students with reading disabilities and the cost for educating these students have increased over the past decade. In 1997, the U.S. Department of Education reported that more than 2 million students in special ed- ucation demonstrated their most significant problems in reading. The number of students with learning disabilities has increased 37.8 percent since 1990 (U.S. Department of Education, 1998). Unfortunately, traditional efforts to remediate reading problems through identification of chil- dren as learning disabled and placement in resource classes have not been particularly successful (Moody, Vaughn, Hughes, & Fischer, 2000; Vaughn, Moody, & Shuman, 1998). Bartoli (1989) reported that “once a child has been iden- tified, about 98 percent are likely to retain the disabil- ity label and remain in special education for their en- tire academic career” (p. 295). Improving the treatment and prevention of reading disabilities is therefore a crit- ical activity. Efficient and cost-effective prevention and treatment of reading disabilities require a clear definition of reading disability and precise methods for identifying students. Requests for reprints should be sent to Kimberly J. O’Malley, Veterans Affairs Medical Center (39A), 2002 Holcombe Boulevard, Building 110T, Houston, Texas 77030. Currently, definitions of reading disability based on dis- crepancies between IQ test scores and achievement test scores as specified in the Federal Register (U.S. Office of Education, 1977) prevail in schools across the nation (Frankenberger & Fronzaglio, 1991; Mercer, Jordon, & Allsop 1996; Nye & Montgomery, 1989). Students with reading scores that are lower than would be predicted based on IQ-test scores are el- igible for special education services and defined as having a reading disability, although the degree of discrepancy varies from state to state. Prior research has demonstrated that IQ-discrepancy def- initions of reading disability suffer from imprecision and inconsistency. Specifically, problems such as the lack of (1) standard procedures for assessing intelligence and achievement, (2) psychometric precision in discrepancy definitions, and (3) empirical support for their use have been identified (Fletcher, Shaywitz, Shankweiler, Katz, Liberman, Stuebing, Francis, Fowler, & Shaywitz, 1994, 1998; Reynolds, 1985; Stanovich & Siegel, 1994). The weakness of the definitions leads to anomalies, such as a student con- sidered reading disabled in one state moving to another state and not qualifying for special services. Similarly, two stu- dents with identical reading achievement can exist in one classroom, with only one of these students receiving special education assistance.
Transcript of Growth in Precursor and Reading-Related Skills: Do Low-Achieving and IQ-Discrepant Readers Develop...

Learning Disabilities Research & Practice, 17(1), 19–34Copyright C© 2002, The Division for Learning Disabilities of the Council for Exceptional Children
Growth in Precursor and Reading-Related Skills: Do Low-Achievingand IQ-Discrepant Readers Develop Differently?
Kimberly J. O’MalleyHouston Center for Quality of Care and Utilization Studies
David J. FrancisUniversity of Houston
Barbara R. Foorman and Jack M. FletcherUniversity of Texas–Houston Health Science Center
Paul R. SwankUT-Houston School of Nursing
Poor readers who met low achievement and IQ-discrepancy definitions of reading disabilitywere compared with nonimpaired readers on their development of eight precursor and reading-related skills to evaluate developmental differences prior to students’ identification as readingdisabled. Results indicated no evidence for differences between the two groups of poor readersin the development of the eight skills, with three exceptions. Students in the IQ-discrepant groupdemonstrated greater growth in letter sound knowledge, greater mean performance in visual-motor integration at the beginning of first grade, and greater deceleration in rapid naming ofletters. When compared to the nonimpaired group, low-achieving readers demonstrated poorerperformance and development in all skills, while the IQ-discrepant readers demonstrated poorerperformance and development in phonemic awareness, rapid naming of letters and objects,spelling, and word reading. The largely null results for comparisons between the two groupsof poor readers challenges the validity of the two-group classification of reading disabilitiesbased on IQ-discrepancy.
The number of students with reading disabilities and thecost for educating these students have increased over thepast decade. In 1997, the U.S. Department of Educationreported that more than 2 million students in special ed-ucation demonstrated their most significant problems inreading. The number of students with learning disabilitieshas increased 37.8 percent since 1990 (U.S. Departmentof Education, 1998). Unfortunately, traditional efforts toremediate reading problems through identification of chil-dren as learning disabled and placement in resource classeshave not been particularly successful (Moody, Vaughn,Hughes, & Fischer, 2000; Vaughn, Moody, & Shuman, 1998).Bartoli (1989) reported that “once a child has been iden-tified, about 98 percent are likely to retain the disabil-ity label and remain in special education for their en-tire academic career” (p. 295). Improving the treatmentand prevention of reading disabilities is therefore a crit-ical activity. Efficient and cost-effective prevention andtreatment of reading disabilities require a clear definitionof reading disability and precise methods for identifyingstudents.
Requests for reprints should be sent to Kimberly J. O’Malley, VeteransAffairs Medical Center (39A), 2002 Holcombe Boulevard, Building 110T,Houston, Texas 77030.
Currently, definitions of reading disability based on dis-crepancies between IQ test scores and achievement test scoresas specified in the Federal Register (U.S. Office of Education,1977) prevail in schools across the nation (Frankenberger &Fronzaglio, 1991; Mercer, Jordon, & Allsop 1996; Nye &Montgomery, 1989). Students with reading scores that arelower than would be predicted based on IQ-test scores are el-igible for special education services and defined as having areading disability, although the degree of discrepancy variesfrom state to state.
Prior research has demonstrated that IQ-discrepancy def-initions of reading disability suffer from imprecision andinconsistency. Specifically, problems such as the lack of(1) standard procedures for assessing intelligence andachievement, (2) psychometric precision in discrepancydefinitions, and (3) empirical support for their use have beenidentified (Fletcher, Shaywitz, Shankweiler, Katz, Liberman,Stuebing, Francis, Fowler, & Shaywitz, 1994, 1998;Reynolds, 1985; Stanovich & Siegel, 1994). The weaknessof the definitions leads to anomalies, such as a student con-sidered reading disabled in one state moving to another stateand not qualifying for special services. Similarly, two stu-dents with identical reading achievement can exist in oneclassroom, with only one of these students receiving specialeducation assistance.

20 O’MALLEY ET AL.: DIFFERENCES IN PRECURSOR READING GROWTH
Most importantly, the validity of the two-group classifica-tion of low-achieving and IQ-discrepant poor readers implicitin special education eligibility has been questioned. Findingsfrom a series of studies have indicated that these two groups ofpoor readers share similar genetic determinants, demonstratesimilar phonological and other cognitive abilities, performsimilarly on reading achievement measures, display similarsocial skills, and respond similarly to intervention (Fletcheret al., 1994; Fletcher, Francis, Shaywitz, Lyon, Foorman,Stuebing, & Shaywitz, 1998; Gresham, MacMillan, &Bocian, 1996; Haager & Vaughn, 1995; Hurford, Schauf,Bunce, Blaich, & Moore, 1994; Pennington, Gilger, Olson,& DeFries, 1992; Siegel, 1992; Stanovich & Siegel, 1994;Torgesen, Wagner, Rashotte, Rose, Lindamood, Conway,& Garvan, 1999; Vellutino, Scanlon, & Lyon, 2000). Theabsence of statistically or practically significant differencesbetween poor readers with and without IQ-discrepancies im-plies that discrepancy definitions may not be useful as thesole basis for determining eligibility status.
A limitation of many previous studies is that they largelyinvolve static group comparisons and have not generallylooked at students’ development prior to identification. Read-ing development is a dynamic process that occurs over time,and cross-sectional studies fail to capture the true devel-opment of students’ reading ability. The possibility existsthat while the two groups of poor readers perform simi-larly on reading measures taken at the time of identification,the IQ-discrepant and low-achieving poor readers may per-form differently at prior occasions on precursor and reading-related skills and may demonstrate different developmentalpatterns.
This hypothesis was supported by Rutter and Yule (1975),who concluded that the prognosis for reading difficultieswas poorer for IQ-discrepant than for low-achieving poorreaders. In contrast, Francis, Shaywitz, Stuebing, Shaywitz,and Fletcher (1996) were unable to detect differences in thegrowth of reading skills in the two subgroups of poor readersin a longitudinal study in which reading skills were assessedin grades 1 through 9. However, Francis et al. (1996) evalu-ated reading skills only.
Studies by Ellis and Large (1987), Jorm, Share, Maclean,and Matthews (1986), Silva, McGee, and Williams (1985),and Shaywitz, Fletcher, Holahan, and Shaywitz (1992) com-pared variously defined IQ-discrepant and low-achievingpoor reader groups on a variety of measures obtained inkindergarten, with subsequent follow up to establish groupmembership. Ellis and Large (1987) found few differencesbetween IQ-discrepant and low-achieving groups, largelyon measures of visual processing that were lower in thelow-achieving group. Jorm et al. (1986) found that low-achieving poor readers scored lower than IQ-discrepant poorreaders on a variety of language and motor tasks. However,no lower limit on IQ was specified and some children in thelow-achieving group had scores consistent with mental defi-ciency. Neurologically impaired children were not excluded.Silva et al. (1986) reported on the same cohort as Jorm et al.(1984), observing differences in the early motor and languagedevelopment between children subsequently identified asIQ-discrepant and low achieving in reading, with the formergroup showing slower development in these areas. However,
the same concerns about mental deficiency and neurologicabnormalities in the low-achieving group observed for Jormet al. (1986) pertain. Shaywitz et al. (1992) found lowerscores in children defined as low-achieving poor readers ingrade 2 on measures of finger agnosia and naming obtainedin kindergarten.
With the exception of Francis et al. (1996), none ofthese studies assessed growth and none involved contempo-rary assessments of measures commonly identified as read-ing precursors, such as phonological awareness and rapidnaming.
The present study extended Francis et al. (1996) by com-paring the early development of readers who were subse-quently identified under traditional psychometric definitionsas low-achieving poor readers, IQ-discrepant poor readers,and not reading impaired on skills believed to precede andsupport the development of reading. It is possible that changesmay occur in precursor and reading-related skills not appar-ent in subsequent reading ability. Different developmentalpatterns in these precursor and reading-related skills by thetwo groups of poor readers might provide some support forthe need for different interventions for the two groups andalso some evidence for the validity of the two-group clas-sification. Conversely, lack of differences in developmentalpatterns would not support the validity of the underlying clas-sification or suggest a need for differential treatment.
Based on Francis et al. (1996), we hypothesized that low-achieving and IQ-discrepant poor readers develop precursorand reading-related skills similarly. We also hypothesized thatthe developmental trajectories of both groups of poor read-ers would have lower means at the beginning of first gradeand slower rates of change compared to students who werenot reading impaired. Support for these hypotheses wouldprovide further evidence that the two-group classification ofreading disability lacks validity, despite its common imple-mentation in practice.
METHOD
Participants
The students included in the present study participated ina larger multiethnic, longitudinal study of students’ devel-opment of reading and reading precursor skills commonlyreferred to as the “Early Assessment of Reading Skills”(EARS). This study focused on early (K–G3) developmen-tal patterns of students in their acquisition of reading ability.Students were recruited and followed in an ethnically andculturally diverse suburban school district in the Houstonmetropolitan area for the period 1992–1996.
The larger study was a modified, longitudinal, time-sequential design with five cohorts of students. The totalsample represented a random selection of children in kinder-garten through grade 2 who participated in a regular educa-tion program at three elementary schools. The five cohortsof students, defined as students with the same birth year, in-cluded one cohort that was assessed only in grade 2, onecohort that was assessed only in grades 1–2, two cohorts thatwere assessed in grades K–2, and one cohort that was assessed

LEARNING DISABILITIES RESEARCH 21
in grades K–1. Children were excluded from the overallsample because of severe emotional problems, uncorrectedvision problems, hearing loss, acquired neurological dis-orders, or classification at the lowest level of English as asecond language. In the three schools, the percentage of par-ticipation in the Federal Lunch Program was 13 percent,15 percent, and 30 percent. The percentage of boys wasapproximately the same as the percentage of girls. Inkindergarten, the following ethnic breakdown was obtained:Caucasian (54 percent), African-American (18 percent),Hispanic (15 percent), Asian (12 percent), and other(1 percent). Socioeconomic status was reported as follows:lower class (9 percent), working class (43 percent), andmiddle class (48 percent).
The present study examined growth in precursor andreading-related skills over kindergarten and grade 1. Grade2 scores were used to define subgroups of low-achievingand IQ-discrepant poor readers. Therefore, only studentswith kindergarten or grade 1 data and grade 2 data in theparent study were used in the present study. Out of the945 students from the parent study, data from 379 stu-dents in three of the five cohorts were used in thisstudy. Specifically, the sample included 156 students whostarted kindergarten in 1992–1993, 132 students who startedkindergarten in 1993–1994, and 91 students who startedkindergarten in 1994–1995. Of the included students, 288had grades K–2 data and 91 had grades 1–2 data. For themost part, students were excluded from the present studybecause of data that were missing by design. Most of the re-maining students who were excluded attended the one schoolthat elected not to participate during the 1995–1996 schoolyear.
To evaluate whether selection bias posed a problem withthe sample, a comparison of students in the sample withstudents in the parent study was conducted. The sample of379 students used in the present study did not significantly dif-fer from the larger sample in gender, χ2(1, N = 945) = 0.00)or ethnicity, χ2(3, N = 945) = 1.5), p > 0.05, respectively.No intellectual differences between students selected for thesample and those not selected were found on the Wechsler In-telligence Scale for Children–Revised in first grade, t(596) =1.24, p > 0.05, or on the Woodcock-Johnson Psychoeduca-tional Battery-Revised (W-J) Broad Reading Cluster in firstgrade, t(594) = 188, p > 0.05. Spelling differences werenot found on the Kaufman Test of Educational Achieve-ment Spelling Subscale in first or second grade, t(597) =−0.30, p > 0.05 and t(774) = −0.57, p > 0.05, respec-tively. These missing data analyses suggest that data weremissing at random, and that selection bias was not aproblem.
Procedures
Each year, trained research assistants administered a skillsassessment battery individually to students in October,December, February, and April. Kindergarten studentswere assessed with measures of letter sound knowledge,phonological processing, rapid automatized naming (lettersand objects), perceptual discrimination, and visual-motor
integration. First graders were assessed using all the kinder-garten skills with one exception and two additions—lettersound knowledge was not assessed due to ceiling effects andserial assessment of spelling and word reading were added. InMay, grade 1 and grade 2 students were individually assessedwith norm-referenced achievement tests, including measuresof reading, spelling, and math achievement, and intelligencemeasures.
Measures: Precursor and Reading-Related Skills
Letter Sound Knowledge
Kindergartners’ knowledge of the letter sounds of the al-phabet was assessed by showing students printed cardswith both the upper and lower case letters and asking thestudents to say the sound of the letter. Credit was given forno more than one correct sound per letter. Schwa soundsdid not receive credit and vowels required that the studentprovide the short vowel sound in order to distinguish thevowel sound from the vowel name. Reliability estimatesfrom past research studies have exceeded 0.90 (de Hirsch,Jansky, & Langford, 1966; Satz, Taylor, Friel, & Fletcher,1978).
Students’ scores on the letter sound knowledge test werebased on a separate analysis of that test using a two-parameteritem-response (IRT) model using Bilog MG (Zimowski,Muraki, Mislevy, & Bock, 1996). Scores in this study werescaled to have a mean of 0 and standard deviation of 1.These IRT ability estimates differ somewhat from the sim-ple “number correct” score because they take into accountinformation, such as item difficulty, about those items an-swered correctly and those items answered incorrectly. Al-though these ability estimates correlate very highly (typicallyabove 0.9) with the “number correct” score, they can providean equal-interval scale, which is advantageous for growthmodeling. Item response theory is a strong (i.e., refutable)theory about psychological measurement that has largely re-placed classical test theory in the commercial production ofpsychological and educational tests because of several ad-vantages. In addition to the ability to produce equal-intervalscales, ability estimates based on IRT scaled tests are inde-pendent of the specific items used in the test. Consequently,examinees can be administered different subsets of items andstill obtain a score on the same scale. Similarly, item char-acteristics such as item-difficulty and item-discriminability(i.e., item-validity) are independent of the abilities of theexaminees in the sample used to calibrate the items. Thus,the difficulty of an item remains the same even though thepass-rate for an item (i.e., item difficulty under classical testtheory) will change depending on whether a high-abilityor low-ability pool of examinees are used to calibrate thetest. These invariance properties of IRT ability estimates anditem characteristics give IRT-based tests important advan-tages over tests based on classical test theory. For a morecomplete discussion of IRT, see Hambleton, Swamminathan,and Rogers (1991) for an introductory presentation, andHambleton and Swaminathan (1985) for a more advancedpresentation.

22 O’MALLEY ET AL.: DIFFERENCES IN PRECURSOR READING GROWTH
Phonemic Awareness
Phonemic awareness was measured using a prepublicationversion of the Comprehensive Test of Phonological Pro-cesses (CTOPP; Wagner, Torgesen, & Rashotte, 1999). Forthis study, we estimated students’ phonemic awareness basedon an IRT model involving six of the seven subtests in thebattery. The seven subtests included sound categoriza-tion, blending onset and rime, blending phonemes intowords, blending phonemes into nonwords, phoneme eli-sion, phoneme segmentation, and first-sound comparison.Schatschneider, Francis, Foorman, Fletcher, and Mehta(1999) found that the sound categorization subtest providedlittle information about phonemic awareness because it didnot discriminate well between students at different abilitylevels. Consequently, we excluded this subtest when esti-mating students’ phonemic awareness scores. Scores wereexpressed as IRT-model-based estimates of each student’s la-tent ability and were scaled to have a mean of 0 and standarddeviation of 1. Internal consistency estimates for the subtestsas reported by Wagner, Torgesen, Laughon, Simmons, andRashotte (1993) ranged from 0.71 to 0.87 over the subtests,and estimates calculated in the present study ranged from 0.85to 0.95.
Rapid Serial Naming
Rapid naming was assessed through administration ofDenckla and Rudel’s (1976) Rapid Automatized Naming(RAN) tests for objects and letters. The object task consistedof line drawings of common objects (i.e., flag, drum, book,moon, and wagon); the letter task consisted of high-frequencylower-case letters (i.e., a, d, o, s, and p). For each task, thestimuli consisted of five items repeated 10 times in randomsequences. The child was asked to name each stimulus asquickly as possible. The correct number of responses namedwithin 60 seconds was recorded. Scores presented in thispaper were base 2 log transformed. Test-retest reliabilityhas been estimated at 0.57 from kindergarten to grade 1,which may reflect variability in true change over this agerange, and at 0.77 from grade 1 to 2 (Wolf, Bally, &Morris, 1986). Test-retest reliability was 0.87 for RapidNaming of Letters (RNL) and 0.76 for Rapid Naming ofObjects (RNO) when the test and retest were two monthsapart.
Perceptual Discrimination
Perceptual discrimination, measured by the Recognition-Discrimination Test (Satz & Fletcher, 1982), involves avisual-perceptual (matching to sample) task requiring thechild to identify a geometric stimulus design among a groupof four figures, three of which were rotated and one of whichwas identical in shape to the stimulus figure. The test hasthree practice items and 24 test items and is timed. This testwas one of the tasks in the Florida Kindergarten ScreeningBattery (Satz & Fletcher, 1982). We included it here as anadditional nonlinguistic measure because it is motor-free,
has good reliability (Kuder-Richardson coefficient of 0.94),and has demonstrated good predictive validity for reading-group classification throughout elementary school (Satzet al., 1978).
Visual-Motor Integration
Visual-motor abilities were assessed using the Beery Test ofVisual-Motor Integration (VMI; Beery, 1989). The measuresfrom kindergarten and first grade were used in the presentresearch. This instrument required students to copy 24 geo-metric line drawings of increasing difficulty without erasures.In past studies, interrater reliability was reported to be 0.93and split-half reliability was estimated at 0.79 (Beery, 1989).In the present study, trained examiners scored this measure,and interrater reliability was found to be above 0.80 at theitem level.
Word Reading and Spelling
Word Reading
Students were presented a list of 50 words on 3′′ × 5′′index cards. Words were presented one at a time and thestudent was asked to read each word as it was presented. The50 words included 36 single-syllable, 11 two-syllable, and 3three-syllable real words. According to Carroll, Davies, andRichman (1971), the 50 words had similar word frequency inprint. The construction of the word list is described in greaterdetail elsewhere (Foorman, Francis, Fletcher, Schatschneider,& Mehta, 1998). For the present study, word-reading abilitywas estimated using a 2-parameter logistic model for the itemresponses (Hambleton, Swaminathan, & Rogers, 1991). Thismodel was based on analyses of the data from the larger sam-ple of students (N = 945). Scores were expressed as IRT-model-based estimates of each student’s latent ability andwere scaled to have a mean of 0 and standard deviation of 1.Internal consistency estimates calculated in the present studyexceeded 0.90 on all occasions.
Spelling
Children were presented the same list of 50 reading wordsand asked to write them on a sheet of paper. Of the 50 words,32 percent had four letters, 40 percent had five letters,18 percent had six letters, and 10 percent had seven let-ters. Half had predictable spelling patterns and half had un-predictable spelling patterns. Words were presented aloneand in a sentence. The spelling test was administered ina group format in the students’ regular classrooms. Wordswere presented in blocks of 10 over a period of five days.All other tests were individually administered. Scores wereexpressed as IRT-model-based estimates of each student’s la-tent ability and were scaled to have a mean of 0 and standarddeviation of 1. Internal consistency estimates calculated inthe present study exceeded 0.85 on all occasions for thissubtest.

LEARNING DISABILITIES RESEARCH 23
Norm-Referenced Achievement Measures
Reading
The reading measures used to operationalize the low-achie-ving and IQ-discrepant criteria were taken from an in-dividually administered, norm-referenced instrument, theWoodcock-Johnson Psycho-Educational Battery-Revised(WJ-R; Woodcock & Johnson, 1989). All WJ-R subtests wereincluded in the fifth wave of data collection in grades 1–2. Forthe present study, only the Broad Reading Cluster in grade 2was used as a composite of reading skills. It is composed ofthe Word Identification and Comprehension subtests and wastaken as a measure of general reading ability. Internal con-sistency was estimated at 0.95 in the standardization sampleof six-year-olds (Woodcock & Johnson, 1989).
Intelligence
Students were administered the Hobby short form (Hobby,1982) of the Wechsler Intelligence Scale for Children-Revised (WISC-R) (Wechsler, 1974) at the end of grades1 and 2. The WISC-R was standardized on a large sample ofchildren, ages 6.0–16.5 years, stratified for age, gender, race,and SES according to 1970 U.S. census information. Test-retest reliabilities for all tasks ranged from 0.73–0.95. Theaverage correlations among Stanford-Binet IQ scores andWISC-R Verbal, Performance, and Full-Scale IQs were 0.71,0.60, and 0.73, respectively. The Hobby short form (Hobby,1982) was used because of the large number of children whoneeded evaluation. This short form administers all subtestsof the WISC-R but only uses every other item and correctsscores on some subtests. Correlations of the Hobby estimatesof IQ scores with full WISC-R administration are 0.98 andabove (Hobby, 1982; Sattler, 1993).
Definition of Reading Disability
Students were initially classified into one of four groups—low achieving only, IQ-discrepant only, both IQ-discrepantand low achieving, and not reading impaired. Groups weredefined using two criteria, an IQ-discrepancy criterion anda low-achieving criterion. The IQ-discrepancy criterionwas based on a regression discrepancy method defined inReynolds (1985) and Fletcher et al. (1994). The readingachievement scores were regressed on the intelligence scoressuch that:
RACHi = β0 + β1FIQi + ei (1)
where RACHi represents each student’s reading achievementscore, β0 (29 in this study) represents the intercept of the re-gression equation, β1 (0.71 in this study) is the unstandard-ized regression coefficient, and ei represents each student’sresidual, or the difference between the actual and predictedreading scores. Students were defined as IQ-discrepant whentheir actual reading achievement scores fell 1.5 standard devi-ations below their predicted reading achievement scores. Stu-
dents were placed in the low-achievement group with scoresbelow the 25th percentile (a standard score of 90 or below) fol-lowing Fletcher et al. (1994) and Stanovich and Siegel (1994).
Of the 379 students, 29 met the low-achieving criteriononly, five met the IQ-discrepancy criterion only, 20 met bothcriteria, and 325 did not meet either criterion. Since onlyfive students met the IQ-discrepancy criterion only, they werecombined with the students who met both criteria, produc-ing the following groups: low-achievement (N = 29), IQ-discrepancy (N = 25), and not reading impaired (N = 325).It should be noted that combining the students who met theIQ-discrepancy criterion only with those who met both worksagainst the hypothesis motivating this study, since those IQ-discrepant students had higher performance levels becausetheir IQ scores were higher than those of the low-achievementgroup.
Demographic, achievement, and intellectual function-ing information on the three groups is presented inTable 1. Analyses demonstrated that the three groups werenot comparable on all these variables. An association wasfound between reading group and gender (χ2(2, N = 379) =6.8, p < 0.05). Specifically, more males (72 percent) werein the IQ-discrepant group than the low-achievement group(32 percent). The not reading impaired group was 50 percentmale. An association between reading group and social classwas also found (χ2(4, N = 355) = 23.9, p < 0.01). The notreading impaired group had a larger proportion of middleclass students (52 percent) than the IQ-discrepant (39 percent)and low-achieving groups (38 percent). No social classdifferences were found between the IQ-discrepant and low-achieving groups, p > 0.05. The mean age for the not read-ing impaired group was not different than the mean age forthe IQ-discrepant group (t(348) = 1.8, p > 0.05), but was
TABLE 1Reader Group Demographics, Achievement,
and Intellectual Functioning
Group
Variable NRI DISC LA
DemographicsGender (% male)∗ 50% 72% 32%Ethnicity (% white) 53% 50% 32%Social class 52% 39% 38%
(% middle class)∗∗Age in years 7.2 (0.34) 7.3 (0.38) 7.4 (0.45)
(end grade 2)∗∗
Intellectual Functioning(Grade 2)WJ-R Broad 112.3 (12.4) 86.9 (7.4) 87.2 (2.8)
Reading Score∗∗Full Scale IQ∗∗ 112.5 (12.5) 116.5 (10.8) 95.5 (8.3)Verbal IQ∗∗ 110.0 (13.2) 110.2 (13.7) 92.1 (9.0)Performance IQ∗∗ 115.2 (13.7) 121.9 (11.4) 102.5 (11.1)
Note. NRI = not reading impaired group, DISC = IQ-discrepant group,LA = low-achieving group, WJ-R = Woodcock-Johnson PsychoeducationalBattery-Revised.
∗ p < 0.05.∗∗ p < 0.01.
24 O’MALLEY ET AL.: DIFFERENCES IN PRECURSOR READING GROWTH
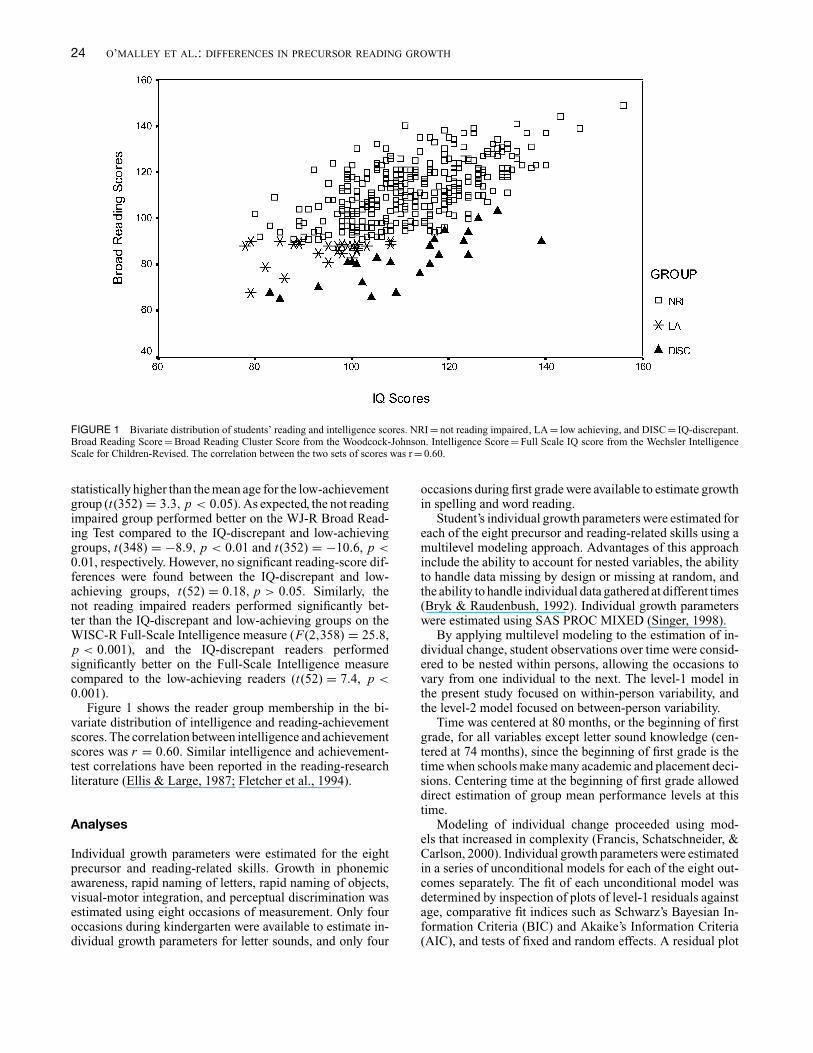
FIGURE 1 Bivariate distribution of students’ reading and intelligence scores. NRI = not reading impaired, LA = low achieving, and DISC = IQ-discrepant.Broad Reading Score = Broad Reading Cluster Score from the Woodcock-Johnson. Intelligence Score = Full Scale IQ score from the Wechsler IntelligenceScale for Children-Revised. The correlation between the two sets of scores was r = 0.60.
statistically higher than the mean age for the low-achievementgroup (t(352) = 3.3, p < 0.05). As expected, the not readingimpaired group performed better on the WJ-R Broad Read-ing Test compared to the IQ-discrepant and low-achievinggroups, t(348) = −8.9, p < 0.01 and t(352) = −10.6, p <0.01, respectively. However, no significant reading-score dif-ferences were found between the IQ-discrepant and low-achieving groups, t(52) = 0.18, p > 0.05. Similarly, thenot reading impaired readers performed significantly bet-ter than the IQ-discrepant and low-achieving groups on theWISC-R Full-Scale Intelligence measure (F(2,358) = 25.8,p < 0.001), and the IQ-discrepant readers performedsignificantly better on the Full-Scale Intelligence measurecompared to the low-achieving readers (t(52) = 7.4, p <0.001).
Figure 1 shows the reader group membership in the bi-variate distribution of intelligence and reading-achievementscores. The correlation between intelligence and achievementscores was r = 0.60. Similar intelligence and achievement-test correlations have been reported in the reading-researchliterature (Ellis & Large, 1987; Fletcher et al., 1994).
Analyses
Individual growth parameters were estimated for the eightprecursor and reading-related skills. Growth in phonemicawareness, rapid naming of letters, rapid naming of objects,visual-motor integration, and perceptual discrimination wasestimated using eight occasions of measurement. Only fouroccasions during kindergarten were available to estimate in-dividual growth parameters for letter sounds, and only four
occasions during first grade were available to estimate growthin spelling and word reading.
Student’s individual growth parameters were estimated foreach of the eight precursor and reading-related skills using amultilevel modeling approach. Advantages of this approachinclude the ability to account for nested variables, the abilityto handle data missing by design or missing at random, andthe ability to handle individual data gathered at different times(Bryk & Raudenbush, 1992). Individual growth parameterswere estimated using SAS PROC MIXED (Singer, 1998).
By applying multilevel modeling to the estimation of in-dividual change, student observations over time were consid-ered to be nested within persons, allowing the occasions tovary from one individual to the next. The level-1 model inthe present study focused on within-person variability, andthe level-2 model focused on between-person variability.
Time was centered at 80 months, or the beginning of firstgrade, for all variables except letter sound knowledge (cen-tered at 74 months), since the beginning of first grade is thetime when schools make many academic and placement deci-sions. Centering time at the beginning of first grade alloweddirect estimation of group mean performance levels at thistime.
Modeling of individual change proceeded using mod-els that increased in complexity (Francis, Schatschneider, &Carlson, 2000). Individual growth parameters were estimatedin a series of unconditional models for each of the eight out-comes separately. The fit of each unconditional model wasdetermined by inspection of plots of level-1 residuals againstage, comparative fit indices such as Schwarz’s Bayesian In-formation Criteria (BIC) and Akaike’s Information Criteria(AIC), and tests of fixed and random effects. A residual plot

LEARNING DISABILITIES RESEARCH 25
in which the residuals were randomly distributed with meanof zero and constant variance implied a well-specified model.In addition, decreasing the magnitude of the level-1 residualvariance and decreasing values of the comparative fit indicesindicated improved fit.
The series of unconditional models evaluated for each out-come began with a single random intercepts model. After fit-ting this model to the data, we fit a random intercepts andfixed slope model to the data. If the residual plot and tests ofeffects indicated lack of fit, a model with random interceptsand random slopes was fit to the data. This process contin-ued by introducing higher order coefficients into the model(e.g., quadratic growth parameters) until no improvement wasfound in model fit. After a well-specified unconditional modelwas identified with time as the predictor at level-1, reading-group classifications were added as level-2 predictors of theindividual change parameters to test for growth parameterdifferences across groups.
Although the sample sizes for the two reading-disabledgroups were comparable to many other studies examiningclassification hypotheses, we were essentially predicting thenull hypothesis. In such a situation, power is an importantconsideration. To maximize power, we did not correct formultiple comparisons and tested all reader group differencesusing a Type I error rate of 0.05. In addition, we examinedthe 95 percent confidence intervals around the growth pa-rameters to determine situations where the growth parameterconfidence intervals did not overlap substantially for the twogroups of poor readers.
RESULTS
Two growth trajectories best typified students’ growth in theeight precursor and reading-related skills. The mean growthtrajectories for the three groups are presented in Figures 2–5.Students’ growth in phonemic awareness and visual-motorintegration was best represented by a linear trajectory. Thelevel of performance at the designated intercept, 80 months,and the rate of change varied across students for these twoskills, so that intercept and slope were considered randomeffects. The means and standard deviations for skills at eachoccasion are presented overall and separately for the groupsin Table 2.
Students’ growth in the other six skills was best mod-eled using a quadratic trajectory with randomly varying inter-cepts (i.e., performance levels) and rates of change (slopes).Students’ acceleration did not vary for letter sounds, so thequadratic parameter was fixed when letter sound knowledgewas modeled. The acceleration varied significantly across stu-dents for the other five precursor and reading-related skills—rapid naming of letters, rapid naming of objects, perceptualdiscrimination, spelling, and word reading. Therefore, thequadratic parameter was included as a random effect whenmodeling students’ growth in these five skills.
Results from the comparison of reading group differencesin mean growth for the eight precursor and reading-relatedskills are presented in Table 3. No evidence was found to indi-cate that developmental differences existed (intercept, slope,or acceleration) between the IQ-discrepant and low-achieving
readers in five of the eight precursor and reading-relatedskills—phonemic awareness, rapid naming of objects, per-ceptual discrimination, spelling, and word reading. Specif-ically, the IQ-discrepant group’s mean intercept, slope, andacceleration were not statistically different from those of thelow-achieving group in these five skills. Examination of the95 percent confidence intervals around the reader groups’growth parameters (Table 3) revealed that the intervals over-lapped substantially for the two groups of poor readers forall growth parameters in these five skills. The absence of dif-ferences in the growth parameters meant that both groupsof poor readers did not perform statistically different at thebeginning of first grade, did not have different growth rates,and did not have different acceleration of skill development.
When growth in letter sound knowledge, rapid namingof letters, and visual-motor integration was compared forthe low-achieving and IQ-discrepant groups, they differedin only one of the growth parameters for each of these skills.Specifically, the IQ-discrepant group demonstrated faster let-ter sound knowledge growth than the low-achieving group.The difference in the slope parameter was not statisticallysignificant, but the 95 percent confidence intervals aroundthe slope parameters did not overlap substantially. It is pos-sible that this slope difference would likely be statisticallysignificant with a larger sample. The IQ-discrepant group’sgreater slope resulted in a separation of developmental tra-jectories for the two groups of poor readers over time. Whenthe groups were compared on rapid naming of letters, nodifferences were found between the groups’ mean interceptsor slopes. However, the low-achieving group demonstratedstatistically less deceleration than the IQ-discrepant group.While statistically significant, the deceleration differences inthe two groups of poor readers did not result in developmentaltrajectories that spread apart over kindergarten and first grade(see Figure 3). Instead, the trajectory for the IQ-discrepantreaders started below the trajectory for the low achievers andthe two groups’ trajectories crossed twice over the two yearsof the study.
When growth in visual-motor integration was considered,the two poor-reader groups did not demonstrate differentslopes or accelerations; however, the confidence intervalsaround their intercepts did not overlap greatly, suggesting thatthe mean level of visual-motor integration performance at thebeginning of first grade was higher for the IQ-discrepancygroup compared to the low-achieving group. This differencein intercepts resulted in approximately parallel developmen-tal trajectories that were spread apart over kindergarten andfirst grade for the two groups of poor readers.
Consistent with the first hypothesis, results indicated thatat the beginning of first grade, the IQ-discrepant readers’performance did not differ from low-achieving readers’performance in seven of the eight precursor and reading-related skills (intercepts). The two groups of poor readersdid not differ in their rates of development of seven of eightskills over kindergarten and grade 1 (slopes). Similarly, nodifferences were found in the curvature of students’ growthtrajectories for seven of the eight skills (acceleration). Thethree growth parameter differences found between the twogroups of poor readers resulted in separated developmentaltrajectories for only two skills, letter sound knowledge and

26 O’MALLEY ET AL.: DIFFERENCES IN PRECURSOR READING GROWTH
FIGURE 2 Mean growth trajectories for reader groups in letter sound knowledge and phonemic awareness. Scores are represented as IRT-model-basedestimates of each student’s latent ability and were scaled to have a mean of 0 and standard deviation of 1. Students’ letter sound knowledge was assessedin kindergarten only, while students’ phonemic awareness was assessed in kindergarten and first grade. NRI = not reading impaired, DISC = IQ-discrepant,LA = low achieving.

LEARNING DISABILITIES RESEARCH 27
FIGURE 3 Mean growth trajectories for reader groups in rapid naming of letters and rapid naming of objects. Scores are expressed as base 2 log transformedscores of number of correctly named letters or objects in 60 seconds. NRI = not reading impaired, DISC = IQ-discrepant, LA = low achieving.

28 O’MALLEY ET AL.: DIFFERENCES IN PRECURSOR READING GROWTH
FIGURE 4 Mean growth trajectories for reader groups in perceptual discrimination and visual-motor integration. Scores are expressed as the number ofcorrect items on the Recognition-Discrimination test and Beery Test of Visual-Motor Integration, respectively. The total number of items on each test was 24.NRI = not reading impaired, DISC = IQ-discrepant, LA = low achieving.

LEARNING DISABILITIES RESEARCH 29
FIGURE 5 Mean growth trajectories for reader groups in spelling and word reading. Scores are expressed as IRT-model-based estimates of each student’slatent ability and were scaled to have a mean of 0 and standard deviation of 1. Students’ spelling and word reading was assessed in first grade only. NRI = notreading impaired, DISC = IQ-discrepant, LA = low achieving.

30 O’MALLEY ET AL.: DIFFERENCES IN PRECURSOR READING GROWTH
TABLE 2Reader Group Means and Standard Deviations at Each Occasion
PrecursorReadingSkill Wave NRI DISC LA Total
LS 1 −0.38 (1.1) −1.0 (1.0) −.079 (0.84) −0.44 (1.1)2 0.28 (0.79) −0.41 (1.0) −0.32 (0.67) 0.21 (0.82)3 0.67 (0.76) 0.14 (0.63) −.015 (0.77) 0.59 (0.79)4 1.1 (0.85) 0.62 (0.86) 0.30 (0.85) 1.0 (0.88)
PA 1 −1.1 (0.58) −1.3 (0.62) −1.4 (0.31) −1.1 (0.58)2 −0.84 (0.66) −1.1 (0.58) −1.4 (0.38) −0.89 (0.65)3 −0.59 (0.72) −1.2 (0.68) −1.2 (0.37) −.066 (0.72)4 −0.38 (0.81) −1.1 (0.71) −1.1 (0.48) −0.46 (0.81)5 −0.02 (0.64) −0.51 (0.57) −.054 (0.66) −.08 (0.65)6 0.29 (0.60) −.023 (0.62) −0.31 (0.56) 0.22 (0.63)7 0.50 (0.59) −0.05 (0.61) −.015 (0.55) 0.43 (0.62)8 0.70 (0.60) 0.18 (0.59) 0.001 (0.50) 0.62 (0.63)
RNL 1 −1.3 (1.9) −2.8 (2.4) −2.3 (2.6) −1.5 (2.0)2 −.067 (1.1) −1.7 (2.2) −1.1 (0.86) −0.75 (1.2)3 −0.45 (0.88) −1.1 (1.1) −.076 (0.48) −.050 (0.88)4 −.022 (0.65) −.081 (0.71) −0.88 (0.48) −0.29 (0.67)5 0.17 (0.43) −0.20 (0.50) −.021 (0.57) 0.12 (0.46)6 0.36 (0.42) −0.05 (0.44) −0.04 (0.39) 0.31 (0.43)7 0.42 (0.58) 0.07 (0.37) 0.07 (0.37) 0.38 (0.57)8 0.56 (0.33) 0.09 (0.41) 0.23 (0.37) 0.51 (0.36)
RNO 1 −0.67 (0.42) −0.90 (0.60) −.075 (0.33) −.069 (0.67)2 −0.64 (0.45) −.086 (0.47) −0.55 (0.38) −0.57 (0.39)3 −0.51 (0.37) −0.64 (0.45) −.074 (0.33) −.053 (0.38)4 −.046 (0.42) −.067 (0.41) −0.77 (0.29) −0.49 (0.42)5 −0.29 (0.33) −0.44 (0.41) −.055 (0.34) −.031 (0.34)6 −.018 (0.32) −.043 (0.31) −0.48 (0.38) −0.21 (0.34)7 −0.22 (0.53) −0.44 (0.28) −.042 (0.34) −.24 (0.51)8 −.015 (0.31) −.033 (0.34) −0.41 (0.34) −0.18 (0.32)
PD 1 13.3 (3.5) 12.2 (4.2) 10.2 (3.2) 13.0 (3.6)2 14.6 (3.1) 13.4 (3.8) 12.9 (2.3) 14.5 (3.1)3 15.2 (2.8) 13.8 (3.7) 14.0 (3.0) 15.1 (2.9)4 15.9 (2.5) 15.0 (3.3) 13.9 (3.8) 15.7 (2.7)5 16.0 (2.7) 14.4 (3.0) 14.1 (3.6) 15.8 (2.9)6 16.8 (2.5) 16.0 (3.1) 15.7 (2.2) 16.7 (2.5)7 17.4 (2.3) 17.2 (2.6) 16.1 (2.4) 17.3 (2.3)8 17.7 (2.2) 17.1 (2.4) 16.7 (2.2) 17.6 (2.2)
VMI 1 9.9 (3.0) 9.3 (3.5) 8.5 (2.2) 9.8 (3.0)2 11.3 (3.7) 10.1 (3.0) 10.4 (3.5) 11.2 (3.7)3 11.4 (3.4) 11.4 (3.8) 10.4 (3.2) 11.3 (3.4)4 12.1 (4.0) 11.2 (5.1) 11.3 (2.7) 12.0 (4.0)5 14.1 (4.9) 14.2 (4.9) 11.4 (2.6) 14.2 (4.8)6 14.9 (5.0) 15.7 (6.5) 13.1 (3.5) 14.8 (5.0)7 15.7 (5.3) 15.1 (5.4) 12.5 (2.8) 15.5 (5.2)8 16.4 (5.0) 15.8 (7.2) 13.6 (4.1) 16.2 (5.1)
SP 5 −0.86 (0.71) −1.4 (0.25) −1.2 (0.40) −.090 (0.69)6 −.053 (0.80) −1.3 (0.34) −1.3 (0.36) −0.62 (0.80)7 −0.21 (0.78) −1.1 (0.56) −1.0 (0.56) −.031 (0.79)8 0.06 (0.78) −1.1 (0.52) −0.66 (0.45) −0.05 (0.81)
WR 5 −0.73 (0.84) −1.6 (0.26) −1.4 (0.45) −.082 (0.84)6 −.040 (0.81) −1.3 (0.44) −1.2 (0.56) −0.50 (0.83)7 −0.11 (0.83) −1.2 (0.49) −1.1 (0.56) −.024 (0.87)8 0.17 (0.77) −1.0 (0.54) −0.73 (0.50) 0.05 (0.82)
Note. NRI = not reading impaired group, DISC = IQ-discrepantgroup, LA = low-achieving group, LS = letter sound knowledge, PA =phonological awareness, RNL = rapid naming of letters, RNO = rapidnaming of objects, PD = perceptual discrimination, VMI = visual-motorintegration, SP = spelling, WR = word reading.
TABLE 3Reader Group Growth Differences in Precursor Reading Skills
PrecursorReading Random Fixed Coefficient ConfidenceSkill Effect Effect (SE) Interval
LS Intercept NRIa 1.2 (0.08) (1.0, 1.4)DISCa,b 0.84 (0.32) (0.22, 1.5)LAb 0.08 (0.04) (−.41, 0.68)
Slope NRIa 0.17 (0.01) (0.14, 0.20)DISCa,b 0.23 (0.05) (0.14, 0.32)LAb 0.08 (0.04) (0.00, 0.16)
Curvature NRIa −0.008 (<0.01) (−0.01, −0.006)DISCa −0.01(<0.01) (−0.02, 0.003)LAa −0.003 (<0.01) (−0.01, 0.006)
PA Intercept NRIa 0.13 (0.03) (0.06, 0.20)DISCb −0.49 (0.15) (−0.77, −0.20)LAb −0.65 (0.13) (−0.91, −0.40)
Slope NRIa 0.09 (<0.01) (0.09, 0.10)DISCb 0.07 (0.01) (0.05, 0.09)LAb 0.07 (0.01) (0.05, 0.08)
RNL Intercept NRIa 0.28 (0.03) (0.21, 0.35)DISCb −0.10 (0.14) (−0.37, −0.16)LAb −0.28 (0.11) (−0.50, −0.06)
Slope NRIa 0.06 (<0.01) (0.05, 0.07)DISCb 0.10 (0.02) (0.06, 0.13)LAa,b 0.08 (0.01) (0.06, 0.11)
Curvature NRIa −0.004 (<0.01) (−0.005, −0.003)DISCb −0.008 (<0.01) (−0.01, −0.006)LAa −0.004 (<0.01) (−0.005, −0.002)
RNO Intercept NRIa −0.26 (0.02) (−0.29, −0.23)DISCb −0.47 (0.08) (−0.62, −0.32)LAb −0.61 (0.07) (−0.75, −0.48)
Slope NRIa 0.02 (<0.01) (0.02, 0.03)DISCa 0.02 (<0.01) (0.01, 0.03)LAa 0.02 (<0.01) (0.01, 0.03)
Curvature NRIa −0.000 (<0.01) (−0.001, −0.0003)DISCa,b −0.001 (<0.01) (−0.002, 0.0003)LAb 0.000 (<0.01) (−0.0003, 0.001)
PD Intercept NRIa 16.6 (0.12) (16.4, 16.9)DISCa,b 15.6 (0.56) (14.5, 16.7)LAb 14.5 (0.48) (13.6, 15.4)
Slope NRIa 0.18 (0.01) (0.16, 0.19)DISCa 0.17 (0.04) (0.08, 0.25)LAa 0.20 (0.03) (0.13, 0.26)
Curvature NRIa −0.005 (<0.01) (−0.007, −.003)DISCa −0.005 (<0.01) (−0.01, 0.003)LAa −0.000 (<0.01) (−0.005, 0.004)
VMI Intercept NRIa 14.5 (0.21) (14.1, 14.9)DISCa,b 14.0 (0.87) (12.3, 15.6)LAb 11.7 (0.76) (10.2, 13.2)
Slope NRIa 0.30 (0.01) (0.27, 0.33)DISCa,b 0.24 (0.05) (0.13, 0.34)LAb 0.19 (0.04) (0.10, 0.27)
SP Intercept NRIa −0.75 (0.05) (−0.83, −0.66)DISCb −0.15 (0.20) (−1.9, −1.1)LAb −1.5 (0.18) (−1.9, −1.1)
Slope NRIa 0.13 (0.01) (0.12, 0.14)DISCb 0.05 (0.03) (−0.01, 0.11)LAb 0.05 (0.03) (−0.01, 0.10)
Curvature NRIa 0 (<0.01) (−0.002, 0.001)DISCa 0 (<0.01) (−.005, 0.004)LAa 0.003 (<0.01) (−0.003, 0.007)
LEARNING DISABILITIES RESEARCH 31
TABLE 3—Continued
PrecursorReading Random Fixed Coefficient ConfidenceSkill Effect Effect (SE) Interval
WR Intercept NRIa −0.66 (0.05) (−0.76, −0.56)DISCb −1.8 (0.23) (−2.2, −1.3)LAb −1.5 (0.20) (−1.9, −1.1)
Slope NRIa 0.15 ( .01) (0.14, 0.16)DISCb 0.07 (0.03) (0.01, 0.13)LAb 0.07 (0.03) (0.02, 0.12)
Curvature NRIa −0.002 (<0.01) (−0.003, −0.001)DISCa,b 0.001 (<0.01) (−0.003, 0.006)LAb 0.002 (<0.01) (−0.002, 0.005)
Note. NRI = not reading impaired group, DISC = IQ-discrepant, LA =low achieving, LS = letter sound knowledge, PA = phonological awareness,RNL = rapid naming of letters, RNO = rapid naming of objects, PD =perceptual discrimination, VMI = visual-motor integration, SP = spelling,WR = word reading.
a, b = groups with same superscript have mean parameter values that arenot statistically different with p < 0.05 indicating statistical significance.
visual-motor integration. As seen in Figures 2–5, similaritiesin the poor-reader groups’ developmental trajectories werestriking for phonemic awareness, rapid naming of letters,rapid naming of objects, perceptual discrimination, spelling,and word-reading ability.
Results provide support for the second hypothesis, whichstated that students who were not reading impaired wouldhave higher levels of performance at the beginning of firstgrade and greater growth rates compared to the low-achievingand IQ-discrepant reader groups. Synthesizing the resultsfrom Table 3, we found that the low-achieving group had sig-nificantly lower mean performance levels at the beginning offirst grade, or intercepts, than the not reading impaired groupfor all eight precursor and reading-related skills. The low-achieving group had significantly slower growth rates thanthe not impaired group in letter sound knowledge, phone-mic awareness, visual-motor integration, spelling, and wordreading. The low-achieving group demonstrated significantlyless deceleration compared to the not impaired group inword reading. Overall, these findings indicate that the low-achieving readers’ performance on all eight precursor andreading-related skills was worse than that of the not readingimpaired group at the beginning of first grade. This differ-ence remained essentially constant over time for rapid nam-ing of letters, rapid naming of objects, and perceptual dis-crimination. The difference between the poor-reader groups’trajectories increased over time for letter sound knowledge,phonemic awareness, visual-motor integration, and spelling,which meant that the discrepancy between the low-achievingand not reading impaired groups got worse over time inthese skills. When growth in word reading was considered,the low-achieving readers’ performance and instantaneousrate of change (slope) were poorer at the beginning of firstgrade compared to the not impaired readers. However, thelow-achieving readers demonstrated statistically greater ac-celeration. The difference between the low-achieving and notreading impaired groups’ acceleration was small and the dif-ference between the groups’ intercepts and slopes was quite
large, resulting in trajectories that were separated at the be-ginning of first grade and continued to separate over time (seeFigure 5).
When the IQ-discrepant group was compared to the notimpaired group, it demonstrated significantly lower interceptsfor five skills—phonemic awareness, rapid naming of letters,rapid naming of objects, spelling, and word reading. The IQ-discrepant group had significantly slower growth rates thanthe not impaired group in phonemic awareness, rapid namingof letters, spelling, and word reading. The acceleration ratesfor the IQ-discrepant and not impaired groups were similarfor most skills, but the IQ-discrepant group demonstratedsignificantly more deceleration than the not impaired groupin rapid naming of letters. Overall, these findings suggestthe IQ-discrepant group performed worse than the not read-ing impaired group at the beginning of first grade in all theskills except letter sound knowledge and the two visual spatialskills—perceptual discrimination and visual-motor integra-tion. The differences between the groups remained constantover kindergarten and first grade for the rapid naming of ob-jects skill. The difference increased for phonemic awareness,rapid naming of letters, spelling, and word reading, whichmeant that the disparity in skill performance between IQ-discrepant group and the not impaired group increased overtime in these skills.
The IQ-discrepant readers’ performed worse in lettersound knowledge than their not impaired peers at the be-ginning of kindergarten, but their rapid growth in this skillresulted in performance that approached their not impairedpeers’ performance at the end of first grade (see Figure 2). TheIQ-discrepant readers’ level of performance in the two visual-spatial skills, perceptual discrimination and visual-motor in-tegration, at the beginning of first grade was not statisticallydifferent from their not impaired peers. No statistical dif-ferences were found in the IQ-discrepant and not impairedgroups’ slopes or accelerations, resulting in developmentaltrajectories that were similar over kindergarten and first grade(see Figure 4).
DISCUSSION
Most current educational systems in the United States deter-mine eligibility for special education assistance based on IQ-discrepancy definitions (Mercer et al., 1996). Students whodemonstrate a discrepancy between reading achievement andintelligence are provided with special education assistance,while students who demonstrate poor reading achievementcommensurate with their intelligence are often denied spe-cial assistance. The differential treatment of the two groupsof poor readers assumes that the groups have underlying dif-ferences in cognitive ability, response to intervention, andrelated factors. Previous studies have found little evidence tosupport this assumption, calling into question the differen-tial treatment of the two poor-reader groups (Fletcher et al.,1994, 1998; Stanovich & Siegel, 1994). However, researchershave not examined growth in precursor and reading-relatedskills prior to identification to determine if these groups dif-fer in those skills known to affect the development of read-ing. The present study examined whether differences between

32 O’MALLEY ET AL.: DIFFERENCES IN PRECURSOR READING GROWTH
poor-reader groups existed in the development of eight pre-cursor and reading-related skills. In general, the findings donot provide strong support for the validity of the classificationof poor readers into subgroups based on IQ-discrepancies.
The lack of performance differences found between theIQ-discrepant and low-achieving readers in this study isconsistent with findings from many other studies that havenot found differences between the groups of poor readers(Fletcher, Francis, Rourke, Shaywitz, & Shaywitz, 1992;Fletcher et al., 1998; Foorman, Francis, Fletcher, & Lynn,1996; Francis et al., 1996; Siegel, 1992; Vellutino et al.,2000). While these other studies approached the two-groupclassification hypothesis using a variety of techniques, theyall obtained results that did not support the classification. Thelack of differences in performance or growth in six of theeight precursor and reading-related skills further supportedthe lack of differences between the two groups. This studyis unique as it evaluated development prior to identification,thereby adding important prereading development evidencethat fails to indicate differences between the two groups ofpoor readers.
The differences in visual-motor integration and the ab-sence of differences in domains closely related to reading (aswell absence of differences in reading and spelling) is consis-tent with the phonological-core variable-difference researchframework presented by Stanovich (1988). This frameworksuggests that some students with reading disabilities haveimpairment in multiple components of cognition, while oth-ers have impairments in the phonological component only.In this study, the low-achieving readers appear more likelyto represent the former group, while the IQ-discrepant read-ers may have more representatives of the latter group. Thelow-achieving readers demonstrated performance and devel-opment deficits in all skills, while the IQ-discrepant read-ers demonstrated their main deficits in phonological-specificprocesses. Keep in mind that there is a 21-point differencein Full Scale IQ between the two groups at the beginning offirst grade. Moreover, the difference in Verbal IQ (M = 18.1;SD = 11.2) is smaller than the difference in PerformanceIQ (M = 20.4; SD = 10.6). As the visual-motor integrationtask is more highly correlated with Performance IQ (Fletcheret al., 1996), the emergence of differences on this task isnot surprising. Note that Figure 4 shows a similar trend forthe perceptual discrimination measure, which also assessesspatial cognition. In contrast, Figures 2 and 3 show littleoverlap in the development of phonological awareness andrapid naming skills. Similarly, Figure 5 shows little overlapin word reading and spelling. Since the measures of spatialcognition are not strongly linked to reading and spelling—in contrast to measures of phonological awareness and rapidnaming—the significance of this finding for eligibility deci-sions and intervention of children with reading disabilities isquestionable.
The exception to this general pattern is the letter soundtask. The higher growth rate for the IQ-discrepant studentssuggests that the IQ-discrepant group’s letter sound knowl-edge was beginning to approach that of the not impairedgroup’s knowledge. One possible explanation is that the IQ-discrepant group’s poor phonemic awareness initially im-pedes their letter sound knowledge growth, but with instruc-tion the IQ-discrepant readers start acquiring letter sound
knowledge. However, the increased development of lettersound knowledge does not translate to word-reading skillsfor the IQ-discrepant group in a similar manner as it doesfor the not impaired group. Without such translation, the im-portance of the letter sound knowledge gains are unclear asIQ-discrepant and low-achieving readers are both poor inword-reading skill development.
An important limitation to this study is the sample sizesof the two groups of disabled readers. The sample sizes re-sulted in comparisons between the two groups that may havelacked adequate power to reject the null hypothesis. To mini-mize this problem, we estimated growth parameters using allavailable data from individuals within the longitudinal frame-work, thereby maximizing the information used to evaluatedifferences and maximizing our power. In addition, we in-creased our power by conservatively testing all 22 growthparameter differences between groups using a Type I error of0.05 and not correcting for multiple comparisons. We also ex-amined confidence intervals and identified differences wherethe confidence intervals for the groups being compared didnot overlap considerably. Out of all comparisons between thelow-achieving and IQ-discrepant groups, only three param-eters significantly differentiated the groups, and confidenceintervals showed little evidence for overlap except, possibly,for perceptual-discrimination skills.
These results raise questions about the use of IQ testsin establishing eligibility for special education as learningdisabled. The provision of services to IQ-discrepant readersfollows from the notion of unexpected poor performance. IQtests are commonly used to benchmark “expectedness” oraptitude for learning, reflecting an interpretation of IQ testsscores as indicators of an ability to learn. Expecting a cer-tain level of performance based on intelligence emerges fromthree assumptions about achievement and intelligence. Thefirst assumes that achievement predicts intelligence (Francis,Fletcher, Shaywitz, Shaywitz, & Rourke, 1996). The secondassumption is that intelligence is a static characteristic. Thethird assumes that intelligence serves as a measure of learningcapacity (Share, McGee, & Silva, 1989). These assumptionshave influenced researchers’ thinking about reading disabilityfor many years, as evidenced by Burt (1937), who suggestedthat “capacity must obviously limit content. It is impossiblefor a pint jug to hold more than a pint of milk and it is equallyimpossible for a child’s educational attainment to rise higherthan his educable capacity” (p. 477).
Burt’s statement assumes that educable capacity is a fixedquantity that limits the amount of a child’s achievement.While the possibility exists that each child has an educa-ble capacity, current educational practice frequently assumesthat this educable capacity is measured by intelligence tests.Yet, intelligence tests often include measures that are likely tobe affected by achievement, such as vocabulary, comprehen-sion, and arithmetic (Fletcher et al., 1998; Share et al., 1989).These skills are taught in elementary schools and have beenshown to improve with training and practice, even thoughresearch shows that IQ scores for the population at large arestable. In contrast, norm-referenced scores on IQ tests in chil-dren with reading problems decline over time (Ackerman &Dykman, 1993; Shaywitz, Holford, Holahan, Fletcher,Stuebing, Francis, & Shaywitz, 1995). The possibility clearlyexists that intelligence-test scores change with education and

LEARNING DISABILITIES RESEARCH 33
practice. If performance on intelligence measures change,or if some components assessed by intelligence measureschange, then performance on such measures does not ade-quately represent the fixed quantity called educable capac-ity. Thus, IQ tests may represent assessment of prior schoolachievement—not ability potential (Kaufman, 1994).
An additional problem with the use of intelligence scoresin decisions about special education eligibility relates to ex-pectations for low-achieving students. If IQ-discrepant poorreaders are those for whom we expect adequate readingachievement, then low-achieving readers must be readers forwhom we expect poor reading achievement. Yet the predic-tors and correlates of reading achievement are essentially thesame and do not appear to vary between these two groups.The message sent to students and teachers is that the edu-cational system has hope only for students with at least av-erage intelligence. The hope is represented by funding andtime spent on special programs for IQ-discrepant readers.The perceived message for students who have below-averageintelligence scores and low achievement scores is that theeducational system has little to offer them. As these studentsstruggle and perform poorly in school, the system potentiallyoffers no extra assistance unless they qualify under anotherrubric. For example, depending on the school’s designation,the child could be served under Title 1, which typically doesnot require IQ scores or the complicated eligibility processassociated with special education eligibility.
Research has demonstrated a positive relation betweeneducational expectations and student performance (Cooper,Findley, & Good, 1982; Crano & Mellon, 1978; Dusek &O’Connell, 1973). By excluding certain types of poor read-ers from services, educational institutions inadvertently placelow expectations on these students. Since low expectationshave been shown to lead to poor performance, the possibilityexists that the low expectations exacerbate the impact of read-ing disability. This problem is compounded by the lack of evi-dence of relationships of IQ-discrepancy scores and responseto intervention (Torgesen et al., 1999; Vellutino et al., 2000).Thus, while it may be useful to focus on subgroups of poorreaders in relationship to treatment outcomes (Lyon, 1995),this differential prognosis is not indexed by IQ-discrepancymodels of reading disability.
Results from the present research also demonstrate thatpoor readers differ from adequate readers as early as kinder-garten and first grade. Detecting these differences in kinder-garten and first grade offers the possibility of early identifica-tion of students at risk for reading problems. If students can beidentified prior to the manifestation of reading problems, thenschool systems can apply early interventions. Advantages ofearly identification combined with early interventions includethe ability to intervene when secondary consequences of thereading problems (failure, poor self-esteem) are minimal andwhen students are most responsive to the interventions. Theseadvantages might facilitate the prevention of reading prob-lems in many students as indicated by the results of several re-cent studies (Foorman et al., 1998; Torgesen et al., 1999; Vel-lutino, Scanlon, Sipay, Small, Chen, Pratt, & Denckla, 1996).
In summary, we found little evidence to suggest that low-achieving and IQ-discrepant readers develop precursor andreading-related skills differently. The differences that didoccur were largely outside of the reading domain. Our study
was unique in that we investigated differences prior to sec-ond grade and prior to identification as reading disabled undercurrent practices. Incorporating these results into the body ofliterature comparing IQ-discrepant and low-achieving read-ers, we have little evidence to suggest that the two groupsof poor readers develop precursor reading skills or readingdifferently. Therefore, the implicit classification of poor read-ers into subgroups based on IQ-discrepancy criteria does notreceive strong support in this study.
ACKNOWLEDGEMENTS
This research was supported in part by the Veterans Af-fairs Health Services Research and Development Service,by Baylor College of Medicine, Section of Health ServicesResearch, and by Grants HD28172 and HD 30995 from theNational Institutes of Child Health and Human Development(NICHD).
REFERENCES
Ackerman, P. T., & Dykman, R. A. (1993). Phonological Processes, con-frontational naming, and immediate memory in dyslexia. Journal ofLearning Disabilities, 26, 597–609.
Ackerman, P. T., Dykman, R. A., Oglesby, D. M., & Newton, J. E. O. (1995).Adolescents earlier diagnosed as dyslexic show major IQ declines onthe WISC-III. Reading and Writing: An Interdisciplinary Journal, 7,163–170.
Beery, K. (1989). Developmental test of visual-motor integration. Chicago,IL: Follett.
Bryk, A. S., & Raudenbush, S. W. (1992). Hierarchical linear models. New-bury Park, NJ: Sage Publications, Inc.
Burt, C. (1937). The backward child. London: University of London Press.Carroll, J., Davies, P., & Richman, B. (1971). The American heritage word
frequency book. Boston, MA: Houghton Mifflin.Cooper, H., Findley, M., & Good, T. (1982). Relations between student
achievement and various indexes of teacher expectations. Journal ofEducational Psychology, 74, 577–579.
Crano, W. D., & Mellon, P. M. (1978). Causal influence of teachers’ ex-pectations on children’s academic performance: A cross-lagged panelanalysis. Journal of Educational Psychology, 70, 39– 49.
de Hirsch, K., Jansky, J., & Langford, W. (1966). Predicting reading failure.New York: Harper & Row.
Denckla, M. B., & Rudel, R. E. (1976). Naming of objects by dyslexic andother learning-disabled children. Brain and Language, 3, 1–15.
Dusek, J. B., & O’Connell, E. J. (1973). Teacher expectancy effects on theachievement test performance of elementary school children. Journalof Educational Psychology, 65, 371–377.
Ellis, N., & Large, B. (1987). The development of reading: As you seek soshall you find. British Journal of Psychology, 78, 1–28.
Fletcher, J. M., Francis, D. J., Rourke, B. P., Shaywitz, S. E., &Shaywitz, B. A. (1992). Cognitive profiles of reading disability: Com-parisons of discrepancy and low achievement definitions. Journal ofLearning Disabilities, 25, 555–561, 573.
Fletcher, J. M., Francis, D. J., Shaywitz, S. E., Lyon. G. R., Foorman,B. R., Stuebing, K. K., & Shaywitz, B. A. (1998). Intelligence test-ing and the discrepancy model for children with learning disabilities.Learning Disabilities Research & Practice, 13, 186–203.
Fletcher, J. M., Francis, D. J., Stuebing, K. K., Shaywitz, B. A., Shaywitz,S. E., Shankweiler, D. P., Katz, C., & Morris, R. (1996). Conceptualand methodological issues in construct definition. In G. P. Lyon (Ed.),Validating the constructs of attention, memory, and effective functions(pp. 17–42). Baltimore, MD: Brookes.
Fletcher, J. M., Shaywitz, S. E., Shankweiler, D. P., Katz, L., Liberman,I. Y., Stuebing, K. K., Francis, D. J., Fowler, A. E., & Shaywitz,B. A. (1994). Cognitive profiles of reading disability: Comparisons of

34 O’MALLEY ET AL.: DIFFERENCES IN PRECURSOR READING GROWTH
discrepancy and low achievement definitions. Journal of EducationalPsychology, 86, 6–23.
Foorman, B. R., Francis, D. J., Fletcher, J. M., & Lynn, A. (1996). Relationof phonological and orthographic processing to early reading: Compar-ing two approaches to regression-based, reading-level-match designs.Journal of Educational Psychology, 88, 639–652.
Foorman, B. R., Francis, D. J., Fletcher, J. M., Schatschneider, C., & Mehta,P. (1998). The role of instruction in learning to read: Preventing readingfailure in at-risk children. Journal of Educational Psychology, 90, 37–55.
Francis, D. J., Fletcher, J. M., Shaywitz, B. A., Shaywitz, S. E., & Rourke, B. P.(1996). Defining learning and language disabilities: Conceptual andpsychometric issues with the use of IQ tests. Language, Speech, andHearing Services in Schools, 27, 132–143.
Francis, D. J., Schatschneider, C., & Carlson, C. D. (2000). Introduction togrowth curve analysis. In D. Drotar (Ed.), Handbook of research inpediatric and clinical child psychology. New York: Kluwer Academic/Plenum Publishers.
Francis, D. J., Shaywitz, S. E., Stuebing, K. K., Shaywitz, B. A., & Fletcher,J. M. (1996). Developmental lag versus deficit models of reading dis-ability: A longitudinal, individual growth curves analysis. Journal ofEducational Psychology, 88, 3–17.
Frankenberger, W., & Fronzaglio, K. (1991). A review of states’ criteria andprocedures for identifying children with learning disabilities. Journalof Learning Disabilities, 24, 495–500.
Gresham, F. M., MacMillan, D. L., & Bocian, K. M. (1996). Learning dis-abilities, low achievement, and mild mental retardation: More alike thandifferent? Journal of Learning Disabilities, 29, 570–581.
Haager, D., & Vaughn, S. (1995). Parent, teacher, peer, and self-reports ofthe social competence of students with learning disabilities. Journal ofLearning Disabilities, 28, 205–215.
Hambleton, R. K., & Swaminathan, H. (1985). Item response theory: Prin-ciples and applications. Boston, MA: Kluwer.
Hambleton, R. K., Swaminathan, H., & Rogers, H. J. (1991). Fundamentalsof item response theory. Newbury Park, CA: Sage Publications.
Hobby, K. L. (1982). WISC-R split-half short form. Los Angeles, CA: West-ern Psychological Services.
Hurford, D. P., Schauf, J. D., Bunce, L., Blaich, T., & Moore, K. (1994).Early identification of children of risk for reading disabilities. Journalof Reading Disabilities, 27, 371–382.
Jorm, A. F., Share, D. L., Maclean, R., & Matthews, R. (1986). Cognitivefactors at school entry predictive of specific reading retardation andgeneral reading backwardness: A research note. Journal of Child Psy-chology, 27, 45–54.
Kaufman, A. S. (1994). Intelligent testing with the WISC-III. New York:Wiley.
Lyon, R. G. (1995). Towards a definition of dyslexia. Annals of Dyslexia,45, 3–27.
Mercer, C. D., Jordan, L., & Allsop, D. H. (1996). Learning disabilitiesdefinitions and criteria used by state education departments. LearningDisability Quarterly, 19, 217–232.
Moody, S. W., Vaughn, S. R., Hughes, M. T., & Fischer, M. (2000) Read-ing instruction in the resource room: Set up for failure. ExceptionalChildren, 16, 305–316.
Nye, C., & Montgomery, J. K. (1989). Identification criteria for languagedisordered children: A national survey. Journal of the Ohio Speech andHearing Association, 4, 26–33.
Pennington, B. F., Gilger, J. W., Olson, R. K., & DeFries, J. C. (1992). Theexternal validity of age- versus IQ-discrepancy definitions of readingdisability: Lessons from a twin study. Journal of Learning Disabilities,25, 562–573.
Reynolds, C. R. (1985). Measuring the aptitude-achievement discrepancyin learning disability diagnosis. Remedial and Special Education, 6,37–55.
Rutter, M., & Yule, W. (1975). The concept of specific reading retardation.Journal of Child Psychology and Psychiatry, 16, 181–197.
Sattler, J. M. (1993). Assessment of children’s intelligence and special abil-ities. New York: Allyn and Bacon.
Satz, P., & Fletcher, J. M. (1982). The Florida kindergarten screening battery.Odessa, FL: Psychological Assessment Resources.
Satz, P., Taylor, H. G., Friel, J., & Fletcher, J. M. (1978). Some developmentaland predictive precursors of reading disabilities: A six-year follow-up.
In A. L. Benton & D. Pearl (Eds.), Dyslexia: An appraisal of currentknowledge (pp. 457–501). New York: Oxford.
Schatschneider, C., Francis, D. J., Foorman, B. F., Fletcher, J. M., & Mehta, P.(1999). The dimensionality of phonological awareness: An applicationof item response theory. Journal of Educational Psychology, 91, 467–478.
Share, D. L., McGee, R., & Silva, P. D. (1989). IQ and reading progress: Atest of the capacity notion of I. Q. Journal of the American Academy ofChild and Adolescent Psychiatry, 28, 97–100.
Shaywitz, B. A., Fletcher, J. M., Holahan, J. M., & Shaywitz, S. E. (1992).Discrepancy compared to low achievement definitions of reading dis-ability: Results from the Connecticut longitudinal study. Journal ofLearning Disabilities, 25, 639–648.
Shaywitz, B. A., Holford, T. R., Holahan, J. M., Fletcher, J. M.,Stuebing, K. K., Francis, D. J., & Shaywitz, S. E. (1995). A Mattheweffect for IQ but not for reading: Results from a longitudinal study.Reading Research Quarterly, 30, 894–906.
Siegel, L. S. (1992). Dyslexics vs. poor readers: Is there a difference? Journalof Learning Disabilities, 25, 618–629.
Silva, P. A., McGee, R., & Williams, S. (1985). Some characteristics of 9-year-old boys with general reading backwardness or specific readingretardation. Journal of Child Psychology, 26, 407– 421.
Singer, J. D. (1998). Using PROC MIXED to fit multilevel models, hierar-chical models, and individual growth models. Journal of Educationaland Behavioral Statistics, 24, 323–355.
Stanovich, K. E. (1988). Explaining the differences between the dyslexicand the garden-variety poor reader: The phonological-care variable-difference model. Journal of Learning Disabilities, 21, 590–612.
Stanovich, K. E., & Siegel, L. S. (1994). Phenotypic performance pro-file of children with reading disabilities: A regression-based test ofphonological-core variable-difference model. Journal of EducationalPsychology, 86, 24–53.
Torgesen, J. K., Wagner, R. K., Rashotte, C. A., Rose, E., Lindamood, P.,Conway, T., & Garvan, C. (1999). Preventing reading failure in youngchildren with phonological processing disabilities: Group and individ-ual responses to instruction. Journal of Educational Psychology, 91,3–30.
U.S. Department of Education. (1998). IDEA report to Congress.Washington, DC: ED Initiatives Biweekly Report.
U.S. Office of Education. (1977). Assistance to states for education for hand-icapped children: Procedures for evaluating specific learning disabili-ties. Federal Register, 42, G1082–G1085.
Vaughn, S. R., Moody, S. W., & Shuman, J. S. (1998). Broken promises:Reading instruction in the resource room. Exceptional Children, 64,211–225.
Vellutino, F. R., Scanlon, D. M., & Lyon, G. R. (2000). Differentiating be-tween difficult-to-remediate and readily remediated poor readers: Moreevidence against the IQ-achievement discrepancy definition for readingdisability. Journal of Learning Disabilities, 33, 223–238.
Vellutino, F. R., Scanlon, D. M., Sipay, E. R., Small, S. G., Chen, R., Pratt, A.,& Denckla, M. B. (1996). Cognitive profiles of difficult-to-remediateand readily remediated poor readers: Early intervention as a vehiclefor distinguishing between cognitive and experiential deficits as basiccauses of specific reading disability. Journal of Educational Psychol-ogy, 88, 601–638.
Wagner, R. K., Torgesen, J. K., Laughon, P., Simmons, K., &Rachotte, C. (1993). Development of young readers’ phonologicalprocessing abilities. Journal of Educational Psychology, 85, 83–103.
Wagner, R. K., Torgesen, J. K., & Rashotte, C. A. (1999). Comprehensivetest of phonological processing. Austin, TX: Pro-Ed.
Wechsler, D. (1974). Manual for the Wechsler Intelligence Scale for children-revised. San Antonio, TX: Psychological Corporation.
Wolf, M., Bally, H., & Morris, R. (1986). Automaticity, retrieval processes,and reading: A longitudinal study in average and impaired readers.Child Development, 57, 988–1000.
Woodcock, R. W., & Johnson, M. B. (1989). Woodcock-Johnson psycho-educational battery-revised. Allen, TX: DLM Teaching Resources.
Zimowski, M. F., Muraki, E., Mislevy, R. J., & Bock, R. D. (1996). BILOG-MG: Multiple group IRT analysis and test maintenance for binary items.Chicago, IL: Scientific Software International, Inc.