The release of water-bound and organic sodium from Loy Yang coal during the combustion of single...
12
The release of water-bound and organic sodium from Loy Yang coal during the combustion of single particles in a flat flame Philip J. van Eyk a,b,⇑ , Peter J. Ashman a,b , Zeyad T. Alwahabi b , Graham J. Nathan c a South Australian Coal Research Laboratory, School of Chemical Engineering, The University of Adelaide, SA 5005, Australia b Centre for Energy Technology, School of Chemical Engineering, The University of Adelaide, SA 5005, Australia c Centre for Energy Technology, School of Mechanical Engineering, The University of Adelaide, SA 5005, Australia article info Article history: Received 21 May 2010 Received in revised form 27 July 2010 Accepted 26 October 2010 Available online 18 November 2010 Keywords: Coal Sodium LIF Fouling abstract The concentration of atomic sodium in the plume of single brown-coal particles burning in a flat flame environment is measured using quantitative planar laser-induced fluorescence (LIF). A run-of-mine Loy Yang brown coal (LY-ROM) and two Loy Yang brown coals (MTE1 and MTE2) that were processed using Mechanical/Thermal Expression, which removed a fraction of the inherent moisture and concomitant dis- solved salts, were investigated. By applying a chemical equilibrium model, at an appropriate location in the flame, the total sodium release is estimated from the measured atomic sodium concentration profile. For LY-ROM, MTE1 and MTE2 the total proportion of sodium release following devolatilisation, as a per- centage of the initial sodium in the coals, was 80.9 ± 19.5%, 87.9 ± 19.0% and 93.0 ± 28.0% respectively. Using this data, it is inferred that approximately 67% of water-bound sodium and approximately 100% of the organically-bound sodium is released following devolatilisation. Furthermore, in the present experiments up to 60% of the total sodium is released during the period in which the ash remains within the flat flame, following char combustion. A mechanism is proposed to explain this observation in which Na 2 O in the ash reacts with ambient water vapour at high temperature. Ó 2010 The Combustion Institute. Published by Elsevier Inc. All rights reserved. 1. Introduction Sodium release within industrial coal-fired boilers is a signifi- cant contributor to fouling and corrosion of heat transfer surfaces [1]. Sodium (Na) species have been shown to form an initial sticky deposit, which then accommodates the subsequent build up of other ash particles from the burning coal particles [2]. The behav- iour of sodium species during the combustion of coal has been studied experimentally by many authors [2–11], predominantly by analysing the deposits formed during coal combustion. The final forms of sodium in the post-flame gases are also very well under- stood, and can be modelled using well established reaction mech- anisms [12–14]. However, the rate of sodium release during the various stages of coal combustion is not well known and requires further study in order for the phenomena of fouling and corrosion to be better understood. Specifically, experimental data under well-defined conditions are required so that models can be devel- oped, and then subsequently employed to develop improved mea- sures to mitigate fouling and corrosion problems. Sodium in brown coals may occur in two main forms. It may be dissolved within moisture that is inherent in the coal or it may be organically bound to the coal matrix. Sodium chloride is the major sodium salt present within the inherent moisture of coals [15,16], but sodium sulphate and carbonate can also occur. Due to the nat- ure of low-rank coal, which includes a high content of carboxylic acid groups, sodium (and other metallic elements) may occur in brown coal as cations attached to carboxylate groups [17]. Mechanical Thermal Expression (MTE) is a process for de- watering of brown coal that involves the combined application of pressure (typically 2.5–15 MPa) and temperature (typically, 120– 250 °C). Hulston et al. [18] have previously showed that MTE sig- nificantly reduced the water-soluble inorganic elements present in the coal, including sodium, but that organically-bound sodium is essentially unaffected. In the present study, MTE processing has been exploited as a method for varying the ratio of water-sol- uble to organically-bound sodium in raw coals, allowing the effect of sodium form on the release of sodium during coal utilisation to be investigated. During combustion, coal particles undergo various physical and chemical changes that affect the sodium within the coal. The first step is the evaporation of moisture and subsequent crystallisation of sodium salts within the coal particle as it enters the hot environ- ment. During devolatilisation, further chemical transformations of the sodium occur in the coal. Previous studies of pyrolysis [19,20] 0010-2180/$ - see front matter Ó 2010 The Combustion Institute. Published by Elsevier Inc. All rights reserved. doi:10.1016/j.combustflame.2010.10.024 ⇑ Corresponding author at: South Australian Coal Research Laboratory, School of Chemical Engineering, The University of Adelaide, SA 5005, Australia. Fax: +61 8 8303 4373. E-mail address: [email protected] (P.J. van Eyk). Combustion and Flame 158 (2011) 1181–1192 Contents lists available at ScienceDirect Combustion and Flame journal homepage: www.elsevier.com/locate/combustflame
Transcript of The release of water-bound and organic sodium from Loy Yang coal during the combustion of single...
Combustion and Flame 158 (2011) 1181–1192
Contents lists available at ScienceDirect
Combustion and Flame
journal homepage: www.elsevier .com/locate /combustflame
The release of water-bound and organic sodium from Loy Yang coal duringthe combustion of single particles in a flat flame
Philip J. van Eyk a,b,⇑, Peter J. Ashman a,b, Zeyad T. Alwahabi b, Graham J. Nathan c
a South Australian Coal Research Laboratory, School of Chemical Engineering, The University of Adelaide, SA 5005, Australiab Centre for Energy Technology, School of Chemical Engineering, The University of Adelaide, SA 5005, Australiac Centre for Energy Technology, School of Mechanical Engineering, The University of Adelaide, SA 5005, Australia
a r t i c l e i n f o a b s t r a c t
Article history:Received 21 May 2010Received in revised form 27 July 2010Accepted 26 October 2010Available online 18 November 2010
Keywords:CoalSodiumLIFFouling
0010-2180/$ - see front matter � 2010 The Combustdoi:10.1016/j.combustflame.2010.10.024
⇑ Corresponding author at: South Australian Coal RChemical Engineering, The University of Adelaide, SA8303 4373.
E-mail address: [email protected] (P.
The concentration of atomic sodium in the plume of single brown-coal particles burning in a flat flameenvironment is measured using quantitative planar laser-induced fluorescence (LIF). A run-of-mine LoyYang brown coal (LY-ROM) and two Loy Yang brown coals (MTE1 and MTE2) that were processed usingMechanical/Thermal Expression, which removed a fraction of the inherent moisture and concomitant dis-solved salts, were investigated. By applying a chemical equilibrium model, at an appropriate location inthe flame, the total sodium release is estimated from the measured atomic sodium concentration profile.For LY-ROM, MTE1 and MTE2 the total proportion of sodium release following devolatilisation, as a per-centage of the initial sodium in the coals, was 80.9 ± 19.5%, 87.9 ± 19.0% and 93.0 ± 28.0% respectively.Using this data, it is inferred that approximately 67% of water-bound sodium and approximately 100%of the organically-bound sodium is released following devolatilisation. Furthermore, in the presentexperiments up to 60% of the total sodium is released during the period in which the ash remains withinthe flat flame, following char combustion. A mechanism is proposed to explain this observation in whichNa2O in the ash reacts with ambient water vapour at high temperature.
� 2010 The Combustion Institute. Published by Elsevier Inc. All rights reserved.
1. Introduction
Sodium release within industrial coal-fired boilers is a signifi-cant contributor to fouling and corrosion of heat transfer surfaces[1]. Sodium (Na) species have been shown to form an initial stickydeposit, which then accommodates the subsequent build up ofother ash particles from the burning coal particles [2]. The behav-iour of sodium species during the combustion of coal has beenstudied experimentally by many authors [2–11], predominantlyby analysing the deposits formed during coal combustion. The finalforms of sodium in the post-flame gases are also very well under-stood, and can be modelled using well established reaction mech-anisms [12–14]. However, the rate of sodium release during thevarious stages of coal combustion is not well known and requiresfurther study in order for the phenomena of fouling and corrosionto be better understood. Specifically, experimental data underwell-defined conditions are required so that models can be devel-oped, and then subsequently employed to develop improved mea-sures to mitigate fouling and corrosion problems.
ion Institute. Published by Elsevier
esearch Laboratory, School of5005, Australia. Fax: +61 8
J. van Eyk).
Sodium in brown coals may occur in two main forms. It may bedissolved within moisture that is inherent in the coal or it may beorganically bound to the coal matrix. Sodium chloride is the majorsodium salt present within the inherent moisture of coals [15,16],but sodium sulphate and carbonate can also occur. Due to the nat-ure of low-rank coal, which includes a high content of carboxylicacid groups, sodium (and other metallic elements) may occur inbrown coal as cations attached to carboxylate groups [17].
Mechanical Thermal Expression (MTE) is a process for de-watering of brown coal that involves the combined application ofpressure (typically 2.5–15 MPa) and temperature (typically, 120–250 �C). Hulston et al. [18] have previously showed that MTE sig-nificantly reduced the water-soluble inorganic elements presentin the coal, including sodium, but that organically-bound sodiumis essentially unaffected. In the present study, MTE processinghas been exploited as a method for varying the ratio of water-sol-uble to organically-bound sodium in raw coals, allowing the effectof sodium form on the release of sodium during coal utilisation tobe investigated.
During combustion, coal particles undergo various physical andchemical changes that affect the sodium within the coal. The firststep is the evaporation of moisture and subsequent crystallisationof sodium salts within the coal particle as it enters the hot environ-ment. During devolatilisation, further chemical transformations ofthe sodium occur in the coal. Previous studies of pyrolysis [19,20]
Inc. All rights reserved.
1182 P.J. van Eyk et al. / Combustion and Flame 158 (2011) 1181–1192
have shown that chlorine is almost completely released as HCl attemperatures below 600 �C. Kosminski and Manzoori [21] showedthat the release of chlorine during pyrolysis occurs above 400 �C,while sodium is stable up to 750 �C. Kosminski et al. [22] showed,through both pyrolysis and gasification experiments, that the re-lease of sodium and chlorine is disproportionate. They also identi-fied sodium carbonate in the residual char following pyrolysis of acoal initially containing only sodium chloride. Carboxyl groupscontaining sodium in the coal structure have been shown todecompose during pyrolysis to release carbon dioxide [23,24] inthe range 400–600 �C. The form of residual sodium in the char afterthe decomposition was found to be sodium carbonate [23,25]. Thusit appears that a significant quantity of both water-bound andorganically-bound sodium remains in the char following the devol-atilisation of brown coal, however the exact proportion of eachform retained is uncertain. A better understanding of the distribu-tion of water-bound and organically-bound sodium in the char,and the relative evolution rates of these sodium forms, is impor-tant in the development of accurate models of sodium release dur-ing coal utilisation.
At the high temperatures that prevail during char combustion(from 800 �C to as high as 1700 �C depending on the combustionconditions) there is considerable evidence that a significantamount of sodium is vaporised. The concentration of sodium hasbeen shown to be enriched in the finer fly ash [2,3], with sodiumsulphate being enriched on the surface of the fly ash particles forhigh sulphur coal [4]. Sodium sulphate has also been observed inthe inner layers of boiler convection deposits [4]. For coals withhigh silicon content in the ash, sodium silicates can form, thusreducing the amount of sodium in the finer fly ash [6], but forlow-ash coals, all the sodium may be vaporised to form a sub-mi-cron fume [6,7]. The proportion of sodium released during the charcombustion stage remains unclear, and new measurements underwell-defined conditions are required for a full understanding of so-dium release during coal combustion.
Equilibrium calculations predict the presence of atomic sodiumat high levels within the reducing conditions of a flame environ-ment, except where very large amounts of chlorine are also present[8]. In the post-flame gases, sodium chloride and sodium hydrox-ide are the principle sodium species [9]. More recently, studieshave used on-line optical diagnostic methods and Mass Spectro-metric studies to measure the sodium content in flue gases in alarge variety of systems (reviewed by Monkhouse [26]). Althoughthese methods give useful information about the amounts and finalgaseous forms of sodium within the post-flame gases from coalcombustion, it is not possible to infer from them the rate of sodiumrelease at various times during combustion. This data is essential ifthe phenomenon of fouling in boilers is to be fully understood. Toaddress this need, a method for the direct measurement of atomicsodium release from a single coal particle has been established re-cently in our laboratory [27]. The experimental technique uses di-rect, in situ quantitative planar laser-induced fluorescence (LIF)measurements in the plume above single particles. The measure-ments are resolved in two spatial dimensions and time, with asampling frequency that is fast compared with the burn-out timeof the particle [27].
The aim of this current work is to provide new insight into therelease of sodium from brown coal during combustion and the ef-fect of de-watering on the behaviour of sodium. Results of newmeasurements of atomic sodium release, obtained using planarLIF, are presented for Loy Yang brown coal and two MTE-processedcoals with varying particle size. The methodology employed allowsthe measurement of instantaneous atomic sodium concentrationwith three independent variables: combustion time, axial distanceand radial distance. By utilising equilibrium calculations and themeasured atomic sodium concentration field, the variation of total
sodium that is released during coal combustion with combustiontime is determined for these three coals. The results of this studyprovide for the first time quantitative data on the proportions ofsodium released during the various stages of brown coal combus-tion from both water-bound and organically-bound sodium. Suchdata are essential for the development of sodium release modelsfor brown coal combustion.
2. Experimental methods
The concentration of atomic sodium was measured in theplume above single coal particles using quantitative planar laser-induced fluorescence (LIF), employing an experimental methodthat was established previously in our laboratory [27]. The LIFmeasurement was calibrated using laser absorption to provide anoverall accuracy of ±6%, and a sensitivity of 0.2 ppb for a signal-to-noise ratio of 10.
The details of the flat flame burner have been documented pre-viously [27]. The burner was operated with natural gas and air toprovide an equivalence ratio of 0.93 (excluding the contributionof the coal particle) for all the experiments. Individual coal parti-cles, weighing approximately 10, 20, 30, 40, or 50 mg, were sus-pended 10 mm above the burner surface on a loop made from0.5-mm diameter platinum wire. The temperature of the flameabove the coal particles at 15 mm above the wire was determinedto be �1200 �C using corrected thermocouple measurements. Axialand radial temperature gradients were small in the vicinity of thewire loop and within the region of sodium measurement. Threeindividual tests were undertaken for each of the three types of coal,at each sample weight, to account for particle-to-particle variation.In total, 45 experiments were performed for this study.
The coals used for these tests were run-of-mine Loy Yang browncoal and two Loy Yang brown coals processed by Mechanical Ther-mal Expression. The MTE coals were obtained from the same labo-ratory as the previous work by Hulston et al. [18]. MTE sampleswere produced by using an ‘‘axial’’ batch MTE cell. The featuresand operation of this cell have been described previously [18].Briefly, 100 g of raw lignite was placed in the MTE sample cham-ber, which was then filled with 100 ml of deionised water to expelany air present in the coal. A piston was then inserted into thechamber, applying pressure, to expel any residual air trapped in-side the system. The temperature was then ramped to the desiredvalue, and compression was continued until the desired pressurehad been reached, after which the pressure was maintained at aconstant level for a further 20 min. The sample was then cooledto room temperature and the MTE product was collected. A chem-ical analysis of the run-of-mine Loy Yang coal (LY-ROM) is given inTable 1. Table 2 shows the MTE Process conditions of the coalsused. Table 3 shows the variations in some inorganic componentsbetween the three coals used. Subsequently, the coal samples usedin these experiments were air-dried in an oven at 50 �C overnight,and crushed to produce particles of the size used for the presentexperiments (10–50 mg).
A tuneable dye laser (Lambda Physics Scanmate), pumped by aNd:YAG laser (Coherent Brilliant B), was used to excite fluores-cence from sodium atoms. The laser and optical configuration aredescribed in detail by van Eyk et al. [27]. Measurements were per-formed using the D1 line (589.59 nm) for sodium. A parallel lasersheet was established with cylindrical lenses. Each image was cal-ibrated following the method of van Eyk et al. [27] and thus thetwo-dimensional concentration field of atomic sodium was deter-mined for each individual shot. The bottom of the imaged regionwas set sufficiently high to avoid any interference of direct laserscattering from the particle surface, and the top of the imaged re-gion was 30 mm above the bottom of the image. The laser-induced
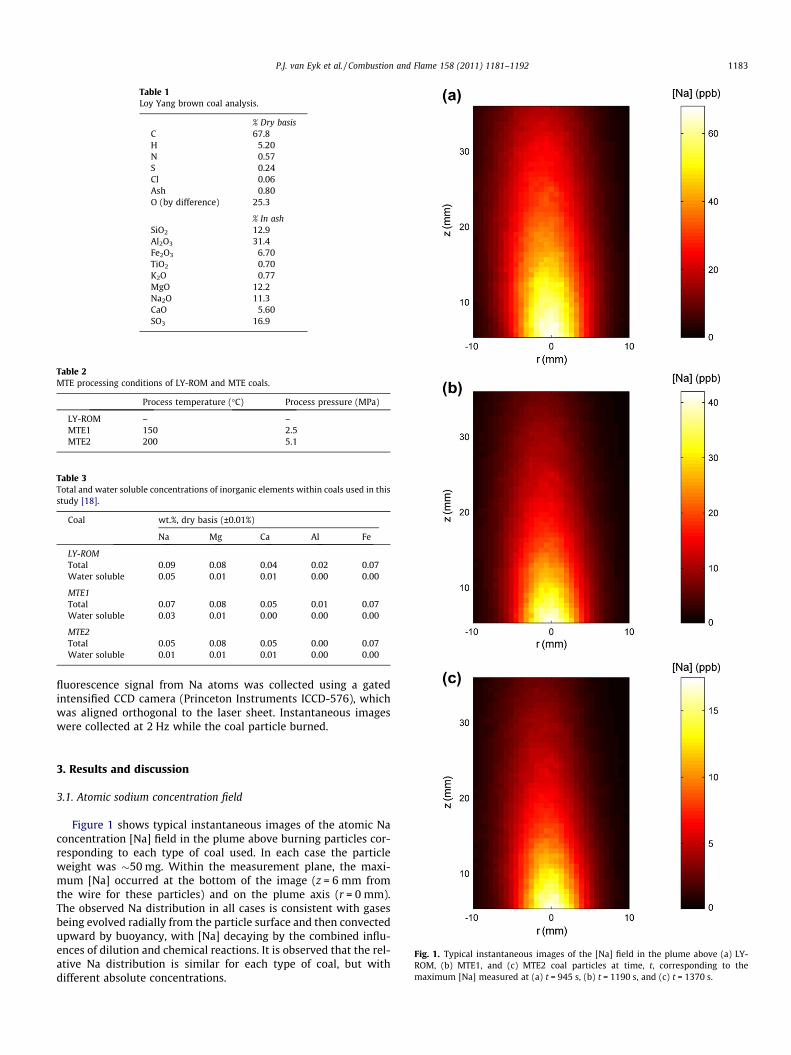
Table 1Loy Yang brown coal analysis.
% Dry basisC 67.8H 5.20N 0.57S 0.24Cl 0.06Ash 0.80O (by difference) 25.3
% In ashSiO2 12.9Al2O3 31.4Fe2O3 6.70TiO2 0.70K2O 0.77MgO 12.2Na2O 11.3CaO 5.60SO3 16.9
Table 2MTE processing conditions of LY-ROM and MTE coals.
Process temperature (�C) Process pressure (MPa)
LY-ROM – –MTE1 150 2.5MTE2 200 5.1
Table 3Total and water soluble concentrations of inorganic elements within coals used in thisstudy [18].
Coal wt.%, dry basis (±0.01%)
Na Mg Ca Al Fe
LY-ROMTotal 0.09 0.08 0.04 0.02 0.07Water soluble 0.05 0.01 0.01 0.00 0.00
MTE1Total 0.07 0.08 0.05 0.01 0.07Water soluble 0.03 0.01 0.00 0.00 0.00
MTE2Total 0.05 0.08 0.05 0.00 0.07Water soluble 0.01 0.01 0.01 0.00 0.00
P.J. van Eyk et al. / Combustion and Flame 158 (2011) 1181–1192 1183
fluorescence signal from Na atoms was collected using a gatedintensified CCD camera (Princeton Instruments ICCD-576), whichwas aligned orthogonal to the laser sheet. Instantaneous imageswere collected at 2 Hz while the coal particle burned.
Fig. 1. Typical instantaneous images of the [Na] field in the plume above (a) LY-ROM, (b) MTE1, and (c) MTE2 coal particles at time, t, corresponding to themaximum [Na] measured at (a) t = 945 s, (b) t = 1190 s, and (c) t = 1370 s.
3. Results and discussion
3.1. Atomic sodium concentration field
Figure 1 shows typical instantaneous images of the atomic Naconcentration [Na] field in the plume above burning particles cor-responding to each type of coal used. In each case the particleweight was �50 mg. Within the measurement plane, the maxi-mum [Na] occurred at the bottom of the image (z = 6 mm fromthe wire for these particles) and on the plume axis (r = 0 mm).The observed Na distribution in all cases is consistent with gasesbeing evolved radially from the particle surface and then convectedupward by buoyancy, with [Na] decaying by the combined influ-ences of dilution and chemical reactions. It is observed that the rel-ative Na distribution is similar for each type of coal, but withdifferent absolute concentrations.
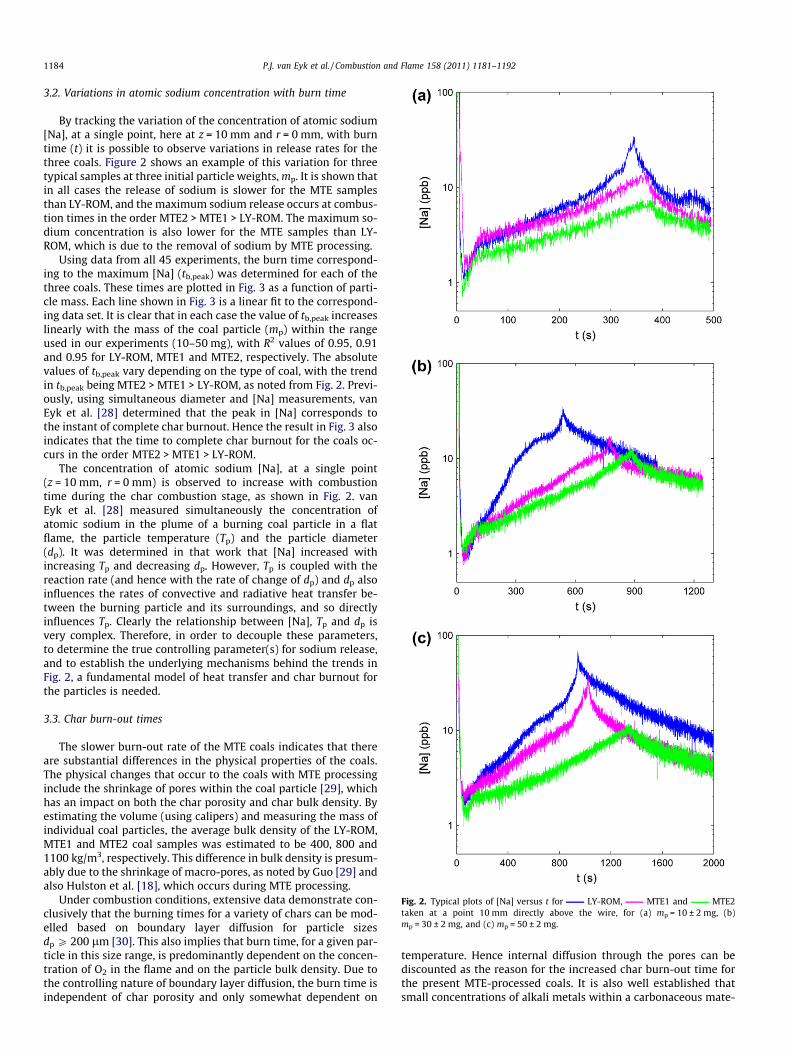
Fig. 2. Typical plots of [Na] versus t for LY-ROM, MTE1 and MTE2taken at a point 10 mm directly above the wire, for (a) mp = 10 ± 2 mg, (b)mp = 30 ± 2 mg, and (c) mp = 50 ± 2 mg.
1184 P.J. van Eyk et al. / Combustion and Flame 158 (2011) 1181–1192
3.2. Variations in atomic sodium concentration with burn time
By tracking the variation of the concentration of atomic sodium[Na], at a single point, here at z = 10 mm and r = 0 mm, with burntime (t) it is possible to observe variations in release rates for thethree coals. Figure 2 shows an example of this variation for threetypical samples at three initial particle weights, mp. It is shown thatin all cases the release of sodium is slower for the MTE samplesthan LY-ROM, and the maximum sodium release occurs at combus-tion times in the order MTE2 > MTE1 > LY-ROM. The maximum so-dium concentration is also lower for the MTE samples than LY-ROM, which is due to the removal of sodium by MTE processing.
Using data from all 45 experiments, the burn time correspond-ing to the maximum [Na] (tb,peak) was determined for each of thethree coals. These times are plotted in Fig. 3 as a function of parti-cle mass. Each line shown in Fig. 3 is a linear fit to the correspond-ing data set. It is clear that in each case the value of tb,peak increaseslinearly with the mass of the coal particle (mp) within the rangeused in our experiments (10–50 mg), with R2 values of 0.95, 0.91and 0.95 for LY-ROM, MTE1 and MTE2, respectively. The absolutevalues of tb,peak vary depending on the type of coal, with the trendin tb,peak being MTE2 > MTE1 > LY-ROM, as noted from Fig. 2. Previ-ously, using simultaneous diameter and [Na] measurements, vanEyk et al. [28] determined that the peak in [Na] corresponds tothe instant of complete char burnout. Hence the result in Fig. 3 alsoindicates that the time to complete char burnout for the coals oc-curs in the order MTE2 > MTE1 > LY-ROM.
The concentration of atomic sodium [Na], at a single point(z = 10 mm, r = 0 mm) is observed to increase with combustiontime during the char combustion stage, as shown in Fig. 2. vanEyk et al. [28] measured simultaneously the concentration ofatomic sodium in the plume of a burning coal particle in a flatflame, the particle temperature (Tp) and the particle diameter(dp). It was determined in that work that [Na] increased withincreasing Tp and decreasing dp. However, Tp is coupled with thereaction rate (and hence with the rate of change of dp) and dp alsoinfluences the rates of convective and radiative heat transfer be-tween the burning particle and its surroundings, and so directlyinfluences Tp. Clearly the relationship between [Na], Tp and dp isvery complex. Therefore, in order to decouple these parameters,to determine the true controlling parameter(s) for sodium release,and to establish the underlying mechanisms behind the trends inFig. 2, a fundamental model of heat transfer and char burnout forthe particles is needed.
3.3. Char burn-out times
The slower burn-out rate of the MTE coals indicates that thereare substantial differences in the physical properties of the coals.The physical changes that occur to the coals with MTE processinginclude the shrinkage of pores within the coal particle [29], whichhas an impact on both the char porosity and char bulk density. Byestimating the volume (using calipers) and measuring the mass ofindividual coal particles, the average bulk density of the LY-ROM,MTE1 and MTE2 coal samples was estimated to be 400, 800 and1100 kg/m3, respectively. This difference in bulk density is presum-ably due to the shrinkage of macro-pores, as noted by Guo [29] andalso Hulston et al. [18], which occurs during MTE processing.
Under combustion conditions, extensive data demonstrate con-clusively that the burning times for a variety of chars can be mod-elled based on boundary layer diffusion for particle sizesdp P 200 lm [30]. This also implies that burn time, for a given par-ticle in this size range, is predominantly dependent on the concen-tration of O2 in the flame and on the particle bulk density. Due tothe controlling nature of boundary layer diffusion, the burn time isindependent of char porosity and only somewhat dependent on
temperature. Hence internal diffusion through the pores can bediscounted as the reason for the increased char burn-out time forthe present MTE-processed coals. It is also well established thatsmall concentrations of alkali metals within a carbonaceous mate-
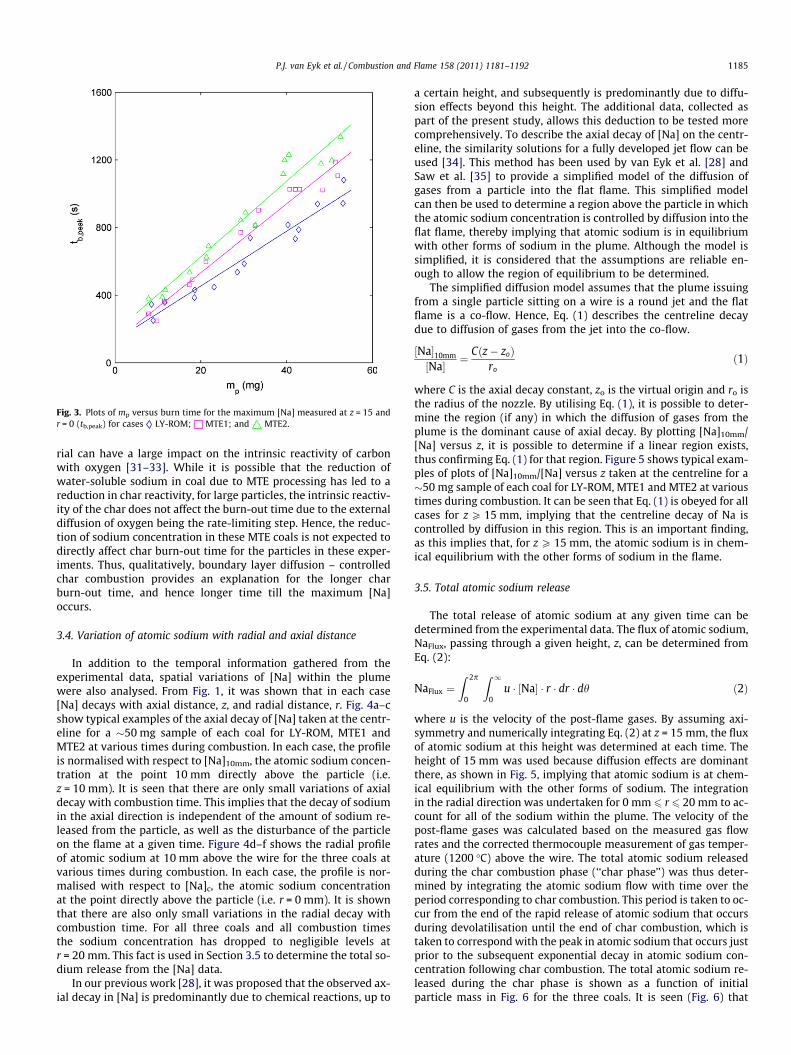
Fig. 3. Plots of mp versus burn time for the maximum [Na] measured at z = 15 andr = 0 (tb,peak) for cases LY-ROM; MTE1; and MTE2.
P.J. van Eyk et al. / Combustion and Flame 158 (2011) 1181–1192 1185
rial can have a large impact on the intrinsic reactivity of carbonwith oxygen [31–33]. While it is possible that the reduction ofwater-soluble sodium in coal due to MTE processing has led to areduction in char reactivity, for large particles, the intrinsic reactiv-ity of the char does not affect the burn-out time due to the externaldiffusion of oxygen being the rate-limiting step. Hence, the reduc-tion of sodium concentration in these MTE coals is not expected todirectly affect char burn-out time for the particles in these exper-iments. Thus, qualitatively, boundary layer diffusion – controlledchar combustion provides an explanation for the longer charburn-out time, and hence longer time till the maximum [Na]occurs.
3.4. Variation of atomic sodium with radial and axial distance
In addition to the temporal information gathered from theexperimental data, spatial variations of [Na] within the plumewere also analysed. From Fig. 1, it was shown that in each case[Na] decays with axial distance, z, and radial distance, r. Fig. 4a–cshow typical examples of the axial decay of [Na] taken at the centr-eline for a �50 mg sample of each coal for LY-ROM, MTE1 andMTE2 at various times during combustion. In each case, the profileis normalised with respect to [Na]10mm, the atomic sodium concen-tration at the point 10 mm directly above the particle (i.e.z = 10 mm). It is seen that there are only small variations of axialdecay with combustion time. This implies that the decay of sodiumin the axial direction is independent of the amount of sodium re-leased from the particle, as well as the disturbance of the particleon the flame at a given time. Figure 4d–f shows the radial profileof atomic sodium at 10 mm above the wire for the three coals atvarious times during combustion. In each case, the profile is nor-malised with respect to [Na]c, the atomic sodium concentrationat the point directly above the particle (i.e. r = 0 mm). It is shownthat there are also only small variations in the radial decay withcombustion time. For all three coals and all combustion timesthe sodium concentration has dropped to negligible levels atr = 20 mm. This fact is used in Section 3.5 to determine the total so-dium release from the [Na] data.
In our previous work [28], it was proposed that the observed ax-ial decay in [Na] is predominantly due to chemical reactions, up to
a certain height, and subsequently is predominantly due to diffu-sion effects beyond this height. The additional data, collected aspart of the present study, allows this deduction to be tested morecomprehensively. To describe the axial decay of [Na] on the centr-eline, the similarity solutions for a fully developed jet flow can beused [34]. This method has been used by van Eyk et al. [28] andSaw et al. [35] to provide a simplified model of the diffusion ofgases from a particle into the flat flame. This simplified modelcan then be used to determine a region above the particle in whichthe atomic sodium concentration is controlled by diffusion into theflat flame, thereby implying that atomic sodium is in equilibriumwith other forms of sodium in the plume. Although the model issimplified, it is considered that the assumptions are reliable en-ough to allow the region of equilibrium to be determined.
The simplified diffusion model assumes that the plume issuingfrom a single particle sitting on a wire is a round jet and the flatflame is a co-flow. Hence, Eq. (1) describes the centreline decaydue to diffusion of gases from the jet into the co-flow.
½Na�10mm
½Na� ¼ Cðz� zoÞro
ð1Þ
where C is the axial decay constant, zo is the virtual origin and ro isthe radius of the nozzle. By utilising Eq. (1), it is possible to deter-mine the region (if any) in which the diffusion of gases from theplume is the dominant cause of axial decay. By plotting [Na]10mm/[Na] versus z, it is possible to determine if a linear region exists,thus confirming Eq. (1) for that region. Figure 5 shows typical exam-ples of plots of [Na]10mm/[Na] versus z taken at the centreline for a�50 mg sample of each coal for LY-ROM, MTE1 and MTE2 at varioustimes during combustion. It can be seen that Eq. (1) is obeyed for allcases for z P 15 mm, implying that the centreline decay of Na iscontrolled by diffusion in this region. This is an important finding,as this implies that, for z P 15 mm, the atomic sodium is in chem-ical equilibrium with the other forms of sodium in the flame.
3.5. Total atomic sodium release
The total release of atomic sodium at any given time can bedetermined from the experimental data. The flux of atomic sodium,NaFlux, passing through a given height, z, can be determined fromEq. (2):
NaFlux ¼Z 2p
0
Z 1
0u � ½Na� � r � dr � dh ð2Þ
where u is the velocity of the post-flame gases. By assuming axi-symmetry and numerically integrating Eq. (2) at z = 15 mm, the fluxof atomic sodium at this height was determined at each time. Theheight of 15 mm was used because diffusion effects are dominantthere, as shown in Fig. 5, implying that atomic sodium is at chem-ical equilibrium with the other forms of sodium. The integrationin the radial direction was undertaken for 0 mm 6 r 6 20 mm to ac-count for all of the sodium within the plume. The velocity of thepost-flame gases was calculated based on the measured gas flowrates and the corrected thermocouple measurement of gas temper-ature (1200 �C) above the wire. The total atomic sodium releasedduring the char combustion phase (‘‘char phase’’) was thus deter-mined by integrating the atomic sodium flow with time over theperiod corresponding to char combustion. This period is taken to oc-cur from the end of the rapid release of atomic sodium that occursduring devolatilisation until the end of char combustion, which istaken to correspond with the peak in atomic sodium that occurs justprior to the subsequent exponential decay in atomic sodium con-centration following char combustion. The total atomic sodium re-leased during the char phase is shown as a function of initialparticle mass in Fig. 6 for the three coals. It is seen (Fig. 6) that
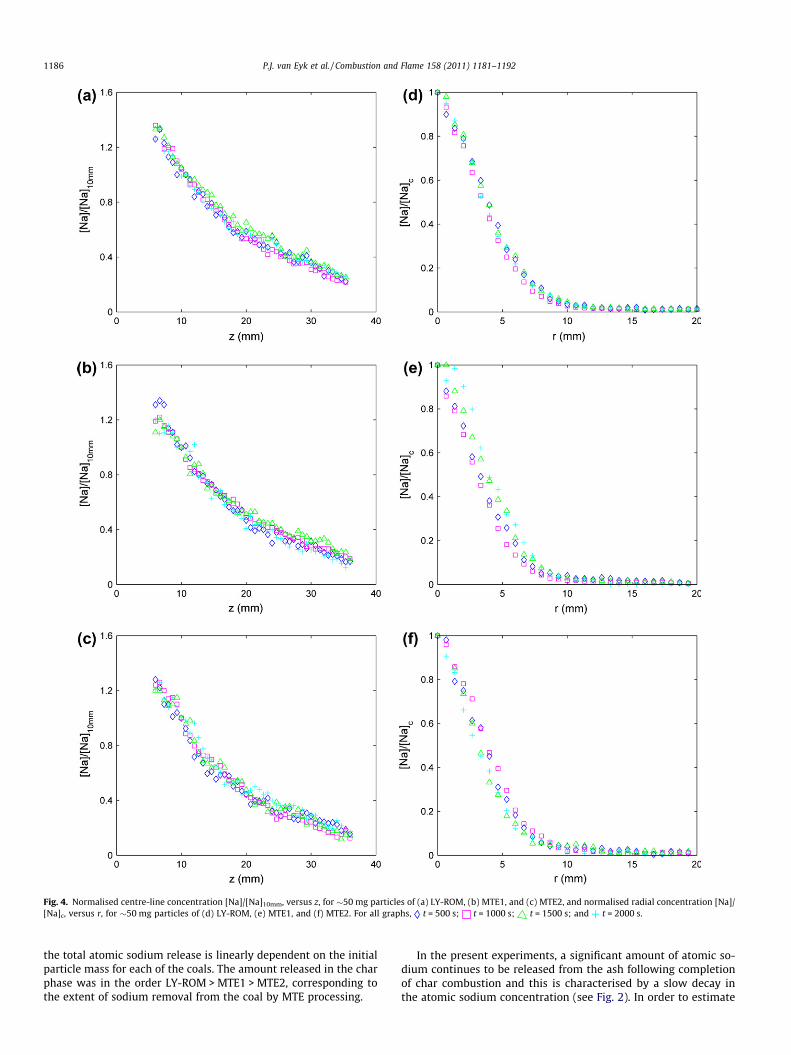
Fig. 4. Normalised centre-line concentration [Na]/[Na]10mm, versus z, for �50 mg particles of (a) LY-ROM, (b) MTE1, and (c) MTE2, and normalised radial concentration [Na]/[Na]c, versus r, for �50 mg particles of (d) LY-ROM, (e) MTE1, and (f) MTE2. For all graphs, t = 500 s; t = 1000 s; t = 1500 s; and t = 2000 s.
1186 P.J. van Eyk et al. / Combustion and Flame 158 (2011) 1181–1192
the total atomic sodium release is linearly dependent on the initialparticle mass for each of the coals. The amount released in the charphase was in the order LY-ROM > MTE1 > MTE2, corresponding tothe extent of sodium removal from the coal by MTE processing.
In the present experiments, a significant amount of atomic so-dium continues to be released from the ash following completionof char combustion and this is characterised by a slow decay inthe atomic sodium concentration (see Fig. 2). In order to estimate
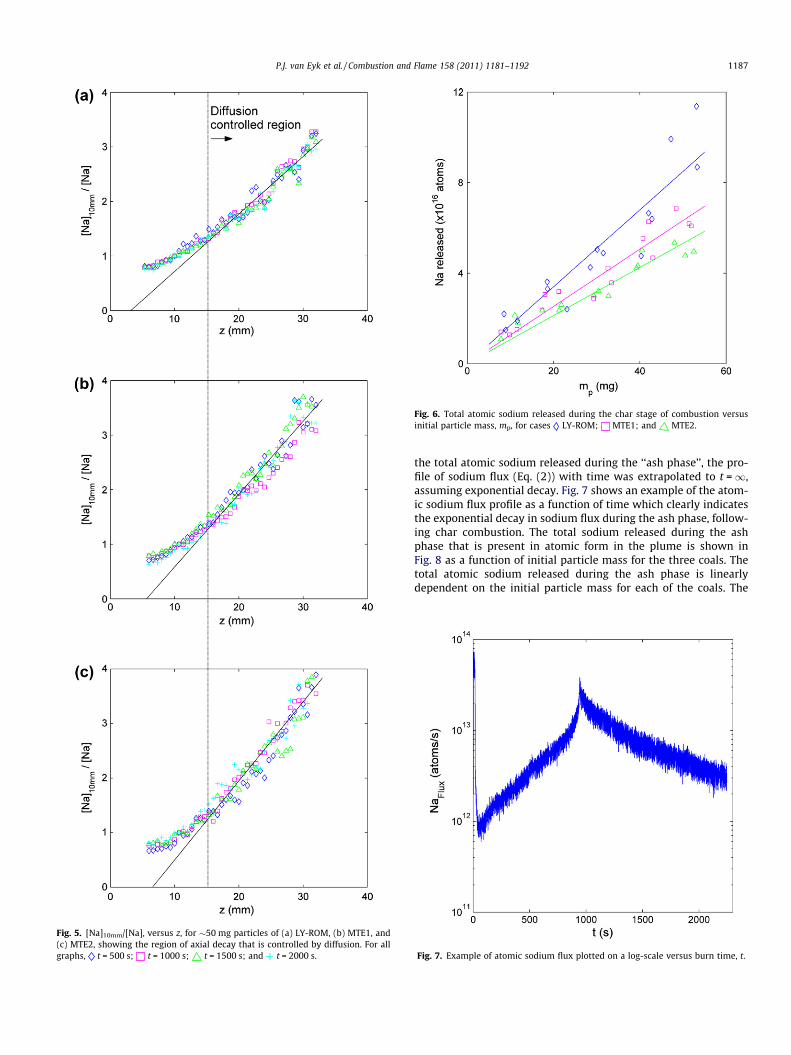
Fig. 5. [Na]10mm/[Na], versus z, for �50 mg particles of (a) LY-ROM, (b) MTE1, and(c) MTE2, showing the region of axial decay that is controlled by diffusion. For allgraphs, t = 500 s; t = 1000 s; t = 1500 s; and t = 2000 s.
Fig. 6. Total atomic sodium released during the char stage of combustion versusinitial particle mass, mp, for cases LY-ROM; MTE1; and MTE2.
P.J. van Eyk et al. / Combustion and Flame 158 (2011) 1181–1192 1187
the total atomic sodium released during the ‘‘ash phase’’, the pro-file of sodium flux (Eq. (2)) with time was extrapolated to t =1,assuming exponential decay. Fig. 7 shows an example of the atom-ic sodium flux profile as a function of time which clearly indicatesthe exponential decay in sodium flux during the ash phase, follow-ing char combustion. The total sodium released during the ashphase that is present in atomic form in the plume is shown inFig. 8 as a function of initial particle mass for the three coals. Thetotal atomic sodium released during the ash phase is linearlydependent on the initial particle mass for each of the coals. The
Fig. 7. Example of atomic sodium flux plotted on a log-scale versus burn time, t.
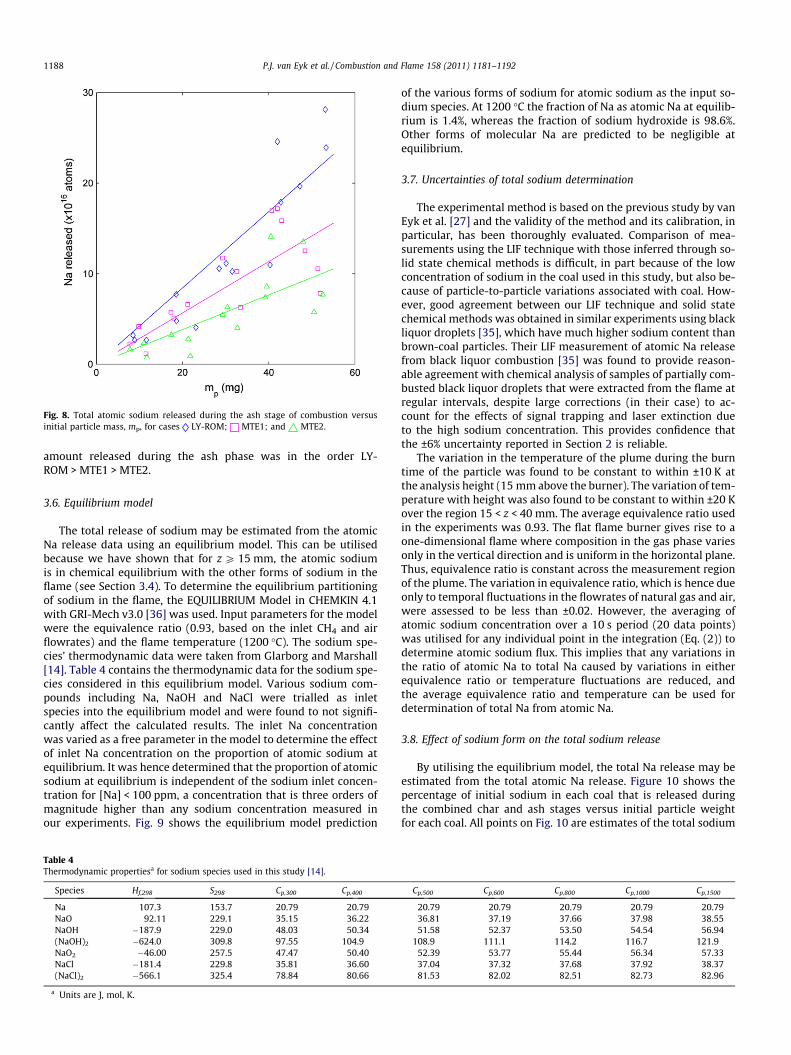
Fig. 8. Total atomic sodium released during the ash stage of combustion versusinitial particle mass, mp, for cases LY-ROM; MTE1; and MTE2.
1188 P.J. van Eyk et al. / Combustion and Flame 158 (2011) 1181–1192
amount released during the ash phase was in the order LY-ROM > MTE1 > MTE2.
3.6. Equilibrium model
The total release of sodium may be estimated from the atomicNa release data using an equilibrium model. This can be utilisedbecause we have shown that for z P 15 mm, the atomic sodiumis in chemical equilibrium with the other forms of sodium in theflame (see Section 3.4). To determine the equilibrium partitioningof sodium in the flame, the EQUILIBRIUM Model in CHEMKIN 4.1with GRI-Mech v3.0 [36] was used. Input parameters for the modelwere the equivalence ratio (0.93, based on the inlet CH4 and airflowrates) and the flame temperature (1200 �C). The sodium spe-cies’ thermodynamic data were taken from Glarborg and Marshall[14]. Table 4 contains the thermodynamic data for the sodium spe-cies considered in this equilibrium model. Various sodium com-pounds including Na, NaOH and NaCl were trialled as inletspecies into the equilibrium model and were found to not signifi-cantly affect the calculated results. The inlet Na concentrationwas varied as a free parameter in the model to determine the effectof inlet Na concentration on the proportion of atomic sodium atequilibrium. It was hence determined that the proportion of atomicsodium at equilibrium is independent of the sodium inlet concen-tration for [Na] < 100 ppm, a concentration that is three orders ofmagnitude higher than any sodium concentration measured inour experiments. Fig. 9 shows the equilibrium model prediction
Table 4Thermodynamic propertiesa for sodium species used in this study [14].
Species Hf,298 S298 Cp,300 Cp,400
Na 107.3 153.7 20.79 20.79NaO 92.11 229.1 35.15 36.22NaOH �187.9 229.0 48.03 50.34(NaOH)2 �624.0 309.8 97.55 104.9NaO2 �46.00 257.5 47.47 50.40NaCl �181.4 229.8 35.81 36.60(NaCl)2 �566.1 325.4 78.84 80.66
a Units are J, mol, K.
of the various forms of sodium for atomic sodium as the input so-dium species. At 1200 �C the fraction of Na as atomic Na at equilib-rium is 1.4%, whereas the fraction of sodium hydroxide is 98.6%.Other forms of molecular Na are predicted to be negligible atequilibrium.
3.7. Uncertainties of total sodium determination
The experimental method is based on the previous study by vanEyk et al. [27] and the validity of the method and its calibration, inparticular, has been thoroughly evaluated. Comparison of mea-surements using the LIF technique with those inferred through so-lid state chemical methods is difficult, in part because of the lowconcentration of sodium in the coal used in this study, but also be-cause of particle-to-particle variations associated with coal. How-ever, good agreement between our LIF technique and solid statechemical methods was obtained in similar experiments using blackliquor droplets [35], which have much higher sodium content thanbrown-coal particles. Their LIF measurement of atomic Na releasefrom black liquor combustion [35] was found to provide reason-able agreement with chemical analysis of samples of partially com-busted black liquor droplets that were extracted from the flame atregular intervals, despite large corrections (in their case) to ac-count for the effects of signal trapping and laser extinction dueto the high sodium concentration. This provides confidence thatthe ±6% uncertainty reported in Section 2 is reliable.
The variation in the temperature of the plume during the burntime of the particle was found to be constant to within ±10 K atthe analysis height (15 mm above the burner). The variation of tem-perature with height was also found to be constant to within ±20 Kover the region 15 < z < 40 mm. The average equivalence ratio usedin the experiments was 0.93. The flat flame burner gives rise to aone-dimensional flame where composition in the gas phase variesonly in the vertical direction and is uniform in the horizontal plane.Thus, equivalence ratio is constant across the measurement regionof the plume. The variation in equivalence ratio, which is hence dueonly to temporal fluctuations in the flowrates of natural gas and air,were assessed to be less than ±0.02. However, the averaging ofatomic sodium concentration over a 10 s period (20 data points)was utilised for any individual point in the integration (Eq. (2)) todetermine atomic sodium flux. This implies that any variations inthe ratio of atomic Na to total Na caused by variations in eitherequivalence ratio or temperature fluctuations are reduced, andthe average equivalence ratio and temperature can be used fordetermination of total Na from atomic Na.
3.8. Effect of sodium form on the total sodium release
By utilising the equilibrium model, the total Na release may beestimated from the total atomic Na release. Figure 10 shows thepercentage of initial sodium in each coal that is released duringthe combined char and ash stages versus initial particle weightfor each coal. All points on Fig. 10 are estimates of the total sodium
Cp,500 Cp,600 Cp,800 Cp,1000 Cp,1500
20.79 20.79 20.79 20.79 20.7936.81 37.19 37.66 37.98 38.5551.58 52.37 53.50 54.54 56.94
108.9 111.1 114.2 116.7 121.952.39 53.77 55.44 56.34 57.3337.04 37.32 37.68 37.92 38.3781.53 82.02 82.51 82.73 82.96
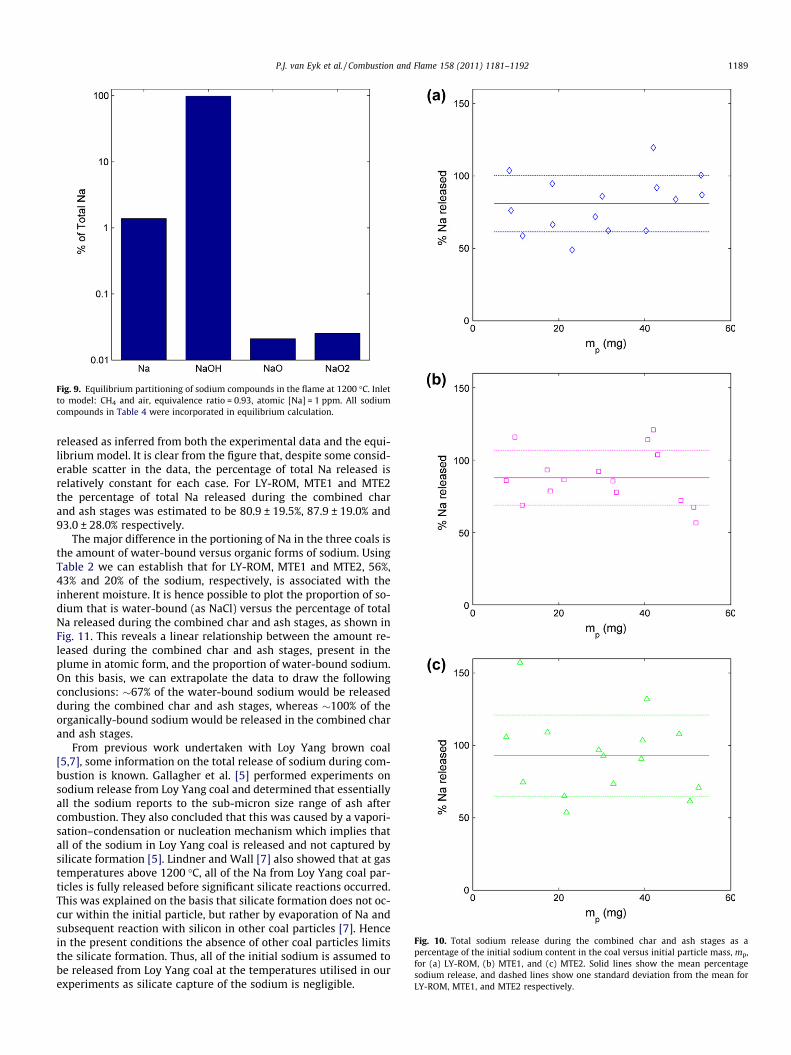
Fig. 10. Total sodium release during the combined char and ash stages as apercentage of the initial sodium content in the coal versus initial particle mass, mp,for (a) LY-ROM, (b) MTE1, and (c) MTE2. Solid lines show the mean percentagesodium release, and dashed lines show one standard deviation from the mean forLY-ROM, MTE1, and MTE2 respectively.
Fig. 9. Equilibrium partitioning of sodium compounds in the flame at 1200 �C. Inletto model: CH4 and air, equivalence ratio = 0.93, atomic [Na] = 1 ppm. All sodiumcompounds in Table 4 were incorporated in equilibrium calculation.
P.J. van Eyk et al. / Combustion and Flame 158 (2011) 1181–1192 1189
released as inferred from both the experimental data and the equi-librium model. It is clear from the figure that, despite some consid-erable scatter in the data, the percentage of total Na released isrelatively constant for each case. For LY-ROM, MTE1 and MTE2the percentage of total Na released during the combined charand ash stages was estimated to be 80.9 ± 19.5%, 87.9 ± 19.0% and93.0 ± 28.0% respectively.
The major difference in the portioning of Na in the three coals isthe amount of water-bound versus organic forms of sodium. UsingTable 2 we can establish that for LY-ROM, MTE1 and MTE2, 56%,43% and 20% of the sodium, respectively, is associated with theinherent moisture. It is hence possible to plot the proportion of so-dium that is water-bound (as NaCl) versus the percentage of totalNa released during the combined char and ash stages, as shown inFig. 11. This reveals a linear relationship between the amount re-leased during the combined char and ash stages, present in theplume in atomic form, and the proportion of water-bound sodium.On this basis, we can extrapolate the data to draw the followingconclusions: �67% of the water-bound sodium would be releasedduring the combined char and ash stages, whereas �100% of theorganically-bound sodium would be released in the combined charand ash stages.
From previous work undertaken with Loy Yang brown coal[5,7], some information on the total release of sodium during com-bustion is known. Gallagher et al. [5] performed experiments onsodium release from Loy Yang coal and determined that essentiallyall the sodium reports to the sub-micron size range of ash aftercombustion. They also concluded that this was caused by a vapori-sation–condensation or nucleation mechanism which implies thatall of the sodium in Loy Yang coal is released and not captured bysilicate formation [5]. Lindner and Wall [7] also showed that at gastemperatures above 1200 �C, all of the Na from Loy Yang coal par-ticles is fully released before significant silicate reactions occurred.This was explained on the basis that silicate formation does not oc-cur within the initial particle, but rather by evaporation of Na andsubsequent reaction with silicon in other coal particles [7]. Hencein the present conditions the absence of other coal particles limitsthe silicate formation. Thus, all of the initial sodium is assumed tobe released from Loy Yang coal at the temperatures utilised in ourexperiments as silicate capture of the sodium is negligible.
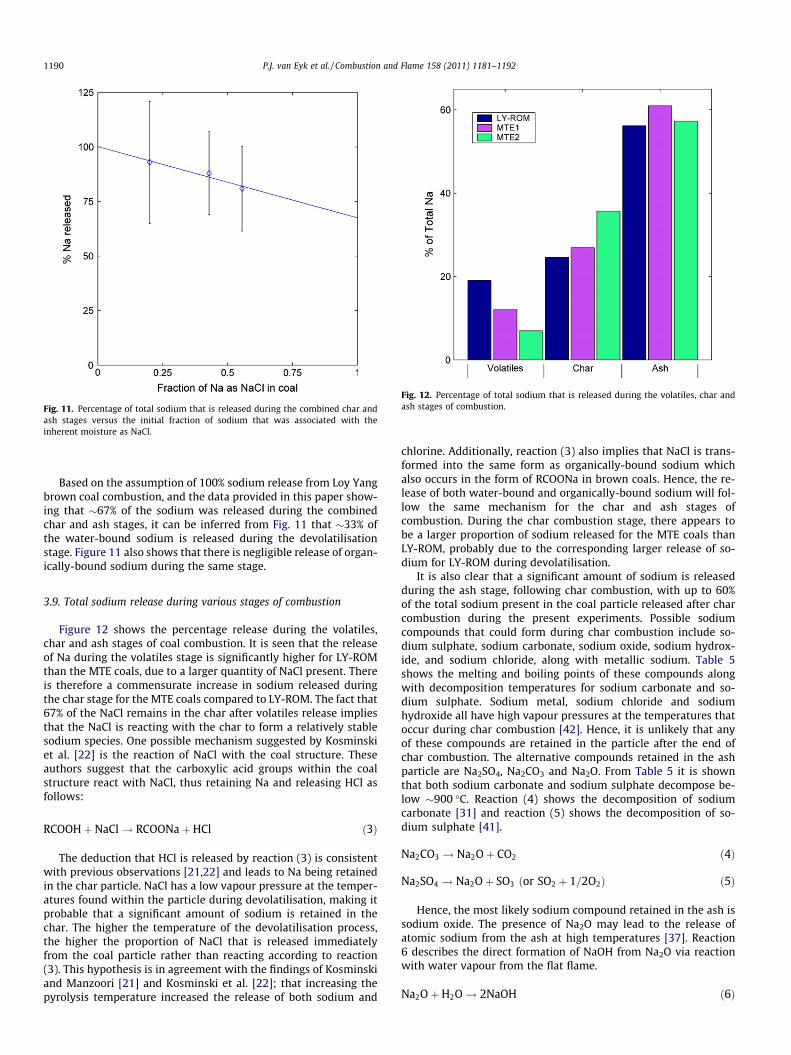
Fig. 11. Percentage of total sodium that is released during the combined char andash stages versus the initial fraction of sodium that was associated with theinherent moisture as NaCl.
Fig. 12. Percentage of total sodium that is released during the volatiles, char andash stages of combustion.
1190 P.J. van Eyk et al. / Combustion and Flame 158 (2011) 1181–1192
Based on the assumption of 100% sodium release from Loy Yangbrown coal combustion, and the data provided in this paper show-ing that �67% of the sodium was released during the combinedchar and ash stages, it can be inferred from Fig. 11 that �33% ofthe water-bound sodium is released during the devolatilisationstage. Figure 11 also shows that there is negligible release of organ-ically-bound sodium during the same stage.
3.9. Total sodium release during various stages of combustion
Figure 12 shows the percentage release during the volatiles,char and ash stages of coal combustion. It is seen that the releaseof Na during the volatiles stage is significantly higher for LY-ROMthan the MTE coals, due to a larger quantity of NaCl present. Thereis therefore a commensurate increase in sodium released duringthe char stage for the MTE coals compared to LY-ROM. The fact that67% of the NaCl remains in the char after volatiles release impliesthat the NaCl is reacting with the char to form a relatively stablesodium species. One possible mechanism suggested by Kosminskiet al. [22] is the reaction of NaCl with the coal structure. Theseauthors suggest that the carboxylic acid groups within the coalstructure react with NaCl, thus retaining Na and releasing HCl asfollows:
RCOOHþ NaCl! RCOONaþHCl ð3Þ
The deduction that HCl is released by reaction (3) is consistentwith previous observations [21,22] and leads to Na being retainedin the char particle. NaCl has a low vapour pressure at the temper-atures found within the particle during devolatilisation, making itprobable that a significant amount of sodium is retained in thechar. The higher the temperature of the devolatilisation process,the higher the proportion of NaCl that is released immediatelyfrom the coal particle rather than reacting according to reaction(3). This hypothesis is in agreement with the findings of Kosminskiand Manzoori [21] and Kosminski et al. [22]; that increasing thepyrolysis temperature increased the release of both sodium and
chlorine. Additionally, reaction (3) also implies that NaCl is trans-formed into the same form as organically-bound sodium whichalso occurs in the form of RCOONa in brown coals. Hence, the re-lease of both water-bound and organically-bound sodium will fol-low the same mechanism for the char and ash stages ofcombustion. During the char combustion stage, there appears tobe a larger proportion of sodium released for the MTE coals thanLY-ROM, probably due to the corresponding larger release of so-dium for LY-ROM during devolatilisation.
It is also clear that a significant amount of sodium is releasedduring the ash stage, following char combustion, with up to 60%of the total sodium present in the coal particle released after charcombustion during the present experiments. Possible sodiumcompounds that could form during char combustion include so-dium sulphate, sodium carbonate, sodium oxide, sodium hydrox-ide, and sodium chloride, along with metallic sodium. Table 5shows the melting and boiling points of these compounds alongwith decomposition temperatures for sodium carbonate and so-dium sulphate. Sodium metal, sodium chloride and sodiumhydroxide all have high vapour pressures at the temperatures thatoccur during char combustion [42]. Hence, it is unlikely that anyof these compounds are retained in the particle after the end ofchar combustion. The alternative compounds retained in the ashparticle are Na2SO4, Na2CO3 and Na2O. From Table 5 it is shownthat both sodium carbonate and sodium sulphate decompose be-low �900 �C. Reaction (4) shows the decomposition of sodiumcarbonate [31] and reaction (5) shows the decomposition of so-dium sulphate [41].
Na2CO3 ! Na2Oþ CO2 ð4Þ
Na2SO4 ! Na2Oþ SO3 ðor SO2 þ 1=2O2Þ ð5Þ
Hence, the most likely sodium compound retained in the ash issodium oxide. The presence of Na2O may lead to the release ofatomic sodium from the ash at high temperatures [37]. Reaction6 describes the direct formation of NaOH from Na2O via reactionwith water vapour from the flat flame.
Na2OþH2O! 2NaOH ð6Þ
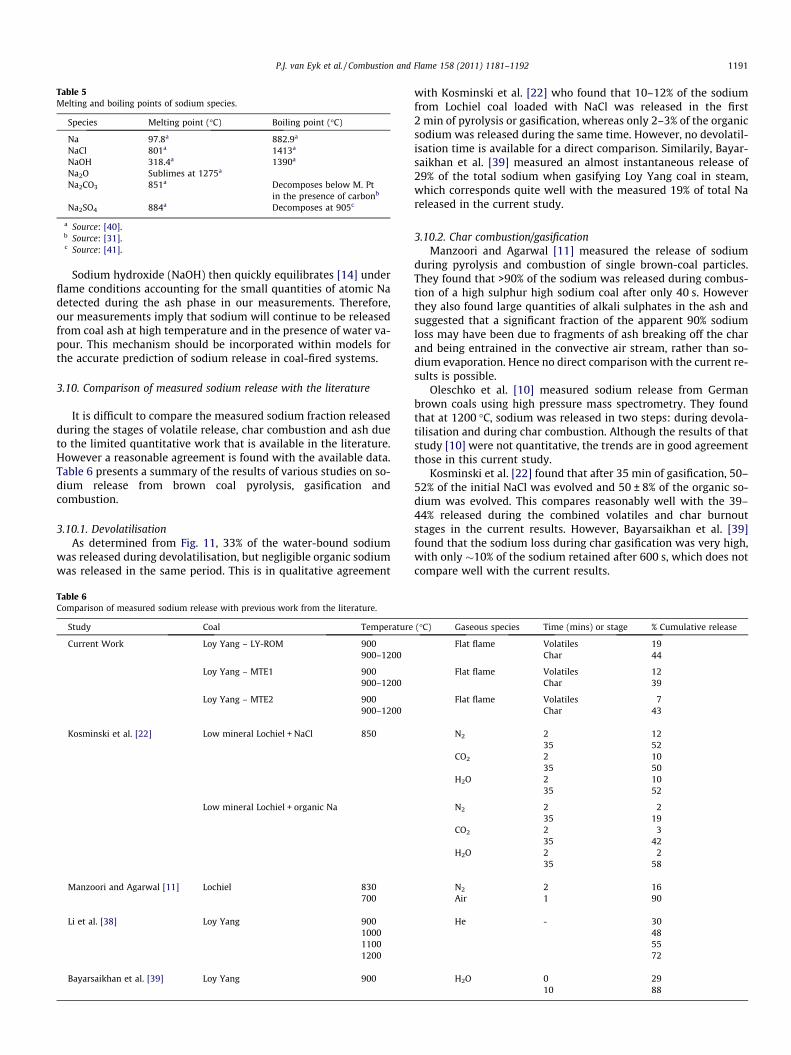
Table 5Melting and boiling points of sodium species.
Species Melting point (�C) Boiling point (�C)
Na 97.8a 882.9a
NaCl 801a 1413a
NaOH 318.4a 1390a
Na2O Sublimes at 1275a
Na2CO3 851a Decomposes below M. Ptin the presence of carbonb
Na2SO4 884a Decomposes at 905c
a Source: [40].b Source: [31].c Source: [41].
P.J. van Eyk et al. / Combustion and Flame 158 (2011) 1181–1192 1191
Sodium hydroxide (NaOH) then quickly equilibrates [14] underflame conditions accounting for the small quantities of atomic Nadetected during the ash phase in our measurements. Therefore,our measurements imply that sodium will continue to be releasedfrom coal ash at high temperature and in the presence of water va-pour. This mechanism should be incorporated within models forthe accurate prediction of sodium release in coal-fired systems.
3.10. Comparison of measured sodium release with the literature
It is difficult to compare the measured sodium fraction releasedduring the stages of volatile release, char combustion and ash dueto the limited quantitative work that is available in the literature.However a reasonable agreement is found with the available data.Table 6 presents a summary of the results of various studies on so-dium release from brown coal pyrolysis, gasification andcombustion.
3.10.1. DevolatilisationAs determined from Fig. 11, 33% of the water-bound sodium
was released during devolatilisation, but negligible organic sodiumwas released in the same period. This is in qualitative agreement
Table 6Comparison of measured sodium release with previous work from the literature.
Study Coal Temperature
Current Work Loy Yang – LY-ROM 900900–1200
Loy Yang – MTE1 900900–1200
Loy Yang – MTE2 900900–1200
Kosminski et al. [22] Low mineral Lochiel + NaCl 850
Low mineral Lochiel + organic Na
Manzoori and Agarwal [11] Lochiel 830700
Li et al. [38] Loy Yang 900100011001200
Bayarsaikhan et al. [39] Loy Yang 900
with Kosminski et al. [22] who found that 10–12% of the sodiumfrom Lochiel coal loaded with NaCl was released in the first2 min of pyrolysis or gasification, whereas only 2–3% of the organicsodium was released during the same time. However, no devolatil-isation time is available for a direct comparison. Similarily, Bayar-saikhan et al. [39] measured an almost instantaneous release of29% of the total sodium when gasifying Loy Yang coal in steam,which corresponds quite well with the measured 19% of total Nareleased in the current study.
3.10.2. Char combustion/gasificationManzoori and Agarwal [11] measured the release of sodium
during pyrolysis and combustion of single brown-coal particles.They found that >90% of the sodium was released during combus-tion of a high sulphur high sodium coal after only 40 s. Howeverthey also found large quantities of alkali sulphates in the ash andsuggested that a significant fraction of the apparent 90% sodiumloss may have been due to fragments of ash breaking off the charand being entrained in the convective air stream, rather than so-dium evaporation. Hence no direct comparison with the current re-sults is possible.
Oleschko et al. [10] measured sodium release from Germanbrown coals using high pressure mass spectrometry. They foundthat at 1200 �C, sodium was released in two steps: during devola-tilisation and during char combustion. Although the results of thatstudy [10] were not quantitative, the trends are in good agreementthose in this current study.
Kosminski et al. [22] found that after 35 min of gasification, 50–52% of the initial NaCl was evolved and 50 ± 8% of the organic so-dium was evolved. This compares reasonably well with the 39–44% released during the combined volatiles and char burnoutstages in the current results. However, Bayarsaikhan et al. [39]found that the sodium loss during char gasification was very high,with only �10% of the sodium retained after 600 s, which does notcompare well with the current results.
(�C) Gaseous species Time (mins) or stage % Cumulative release
Flat flame Volatiles 19Char 44
Flat flame Volatiles 12Char 39
Flat flame Volatiles 7Char 43
N2 2 1235 52
CO2 2 1035 50
H2O 2 1035 52
N2 2 235 19
CO2 2 335 42
H2O 2 235 58
N2 2 16Air 1 90
He - 30485572
H2O 0 2910 88
1192 P.J. van Eyk et al. / Combustion and Flame 158 (2011) 1181–1192
Li et al. [38] pyrolysed Loy Yang coal at temperatures rangingfrom 900 to 1200 �C and found that 30–72% of the sodium was re-leased. Considering our experiments had char particles burning inthe 900–1200 �C range and 39–44% released during the combinedvolatiles and char burnout stages, the results of Li et al. [38] agreewell with the current results.
4. Conclusions
The results of this study provide for the first time quantitativedata on the proportions of sodium released during each of thestages of devolatilisation, char combustion and ash in the combus-tion of brown coal. From the experimental results of this study, thefollowing conclusions have been drawn on the release of sodiumfrom low-rank coals during combustion.
1. The release of sodium was found to be slower for the (dewa-tered) MTE samples than LY-ROM, and the peak sodium releaseoccurred at later times for MTE coals.
2. For the coals used in this study, the total sodium release wasestimated based on the experimental measurements of atomicsodium in the plume and a theoretical equilibrium model. Thepercentage of total Na released, compared to the initial sodiumin the coals, during the combined char and ash stages wasdetermined to be 80.9 ± 19.5%, 87.9 ± 19.0% and 93.0 ± 28.0%respectively for LY-ROM, MTE1 and MTE2 respectively.
3. It was inferred by extrapolation that �33% of the water-boundsodium is released in the volatiles stage, whereas only a negli-gible amount of organically-bound sodium is released duringdevolatilisation.
4. During char combustion, a larger proportion of organic sodiumin the parent coal led to a corresponding larger release ofsodium.
5. A possible mechanism for the incomplete release of water-bound sodium during the volatiles stage is proposed to be thereaction of NaCl within the coal structure whereby the charretains Na, and HCl is released to the gas phase.
6. Up to 60% of the sodium was found to be released during theash stage, following char combustion, under these experimentalconditions. A possible mechanism is postulated involving thehigh-temperature reaction of Na2O with water vapour torelease NaOH, which equilibrates to produce atomic Na.
Acknowledgments
The authors gratefully acknowledge the financial and other sup-port received for this research from the Cooperative Research Cen-tre for Clean Power from Lignite which was established under theAustralian Government’s Cooperative Research Centre’s program.The project also received partial support from the Australian Re-search Council Discovery scheme. The preparation of MTE-dewa-tered brown coal samples by Mr. Ross Ellingham from MonashUniversity is also gratefully appreciated. We would also like tothank Dr. Adam Kosminski for helpful discussions. The paper has
also been strengthened by addressing the insightful comments ofthe anonymous reviewers of the paper, for which the authors arealso very grateful.
References
[1] R. Bryers, Prog. Energy Combust. Sci. 22 (1996) 29–120.[2] M. Neville, A.F. Sarofim, Fuel 64 (1985) 384–390.[3] D. Ounsted, J. Schoen, J. Inst. Fuel 33 (1960) 199–206.[4] E. Raask, Power Ind. Res. 1 (1981) 233.[5] N.B. Gallagher, L.E. Bool, J.O.L. Wendt, T.W. Peterson, Combust. Sci. Technol. 74
(1) (1990) 211–221.[6] N.B. Gallagher, T.W. Peterson, J.O.L. Wendt, Proc. Combust. Inst. 26 (1996)
3197–3204.[7] E.R. Lindner, T.F. Wall, Proc. Combust. Inst. 23 (1990) 1313–1321.[8] E.A. Sondreal, H. Gronhovd, P.H. Tufte, W. Beckering, Ash Fouling Studies of
low-rank Western U.S. Coals, in: International Conference on Ash Deposits andCorrosion from Impurities in Combustion Gases, New England College, 1977.
[9] L.J. Wibberley, T.F. Wall, Fuel 61 (1982) 87–92.[10] H. Oleschko, A. Schimrosczyk, H. Lippert, M. Müller, Fuel 86 (2007) 2275–
2282.[11] A.R. Manzoori, P.K. Agarwal, Fuel 71 (1992) 513–522.[12] A.J. Hynes, M. Steinberg, K. Schofield, J. Chem. Phys. 80 (1984) 2585–2597.[13] S. Srinivasachar, J.J. Helble, D.O. Ham, G. Domazetis, Prog. Energy Combust. Sci.
16 (1990) 303–309.[14] P. Glarborg, P. Marshall, Combust. Flame 141 (2005) 22–39.[15] L.J. Edgecombe, Fuel 35 (1956) 38–48.[16] N.J. Hodges, W.R. Ladner, T.G. Martin, J. Inst. Energy 158–169 (September)
(1983).[17] R.A. Durie, D.J. Swaine, Inorganic constituents in coal, Coal Res. CSIRO 45
(1971) 9.[18] J. Hulston, G. Favas, A.L. Chaffee, Fuel 84 (2005) 1940–1948.[19] J.J. Gibb, J.G. Angus, J. Inst. Energy 53 (1983) 149–157.[20] D. Shao, E.J. Hutchinson, H. Cao, W.–P. Pan, C.–L. Chou, Energy Fuels 8 (1994)
399–401.[21] A. Kosminski, A. R. Manzoori, Technical Services Department, The Electricity
Trust of South Australia, Internal Report, September 1990.[22] A. Kosminski, D.P. Ross, J.B. Agnew, Fuel Process. Technol. 87 (2006) 943–952.[23] J.B. Murray, Fuel 52 (1973) 105–111.[24] H.N.S. Schafer, Fuel 58 (1979) 667–672.[25] J.B. Murray, R.C. Ledger, State Electricity Commission of Victoria, Planning and
Investigations Dept. Scietific Div. Report No. 255, 1972.[26] P. Monkhouse, Prog. Energy Combust. Sci. 28 (2002) 331–381.[27] P.J. van Eyk, P.J. Ashman, Z.T. Alwahabi, G.J. Nathan, Combust. Flame 155
(2008) 529–537.[28] P.J. van Eyk, P.J. Ashman, Z.T. Alwahabi, J. Nathan, Proc. Combust. Inst. 32
(2009) 2099–2106.[29] J. Guo, PhD Thesis, Monash University, Australia, 2000.[30] N.M. Laurendeau, Prog. Energy Combust. Sci. 4 (1978) 221–270.[31] D.W. McKee, D. Chaterji, Carbon 13 (1975) 381–390.[32] R. Wagner, H.-J. Muhlen, Fuel 68 (1989) 251–253.[33] J.A. Moulijn, F. Kapteijn, Carbon 33 (1995) 1155–1165.[34] H.A. Becker, H.C. Hottel, G.C. Williams, J. Fluid Mech. 30 (1967) 285–303.[35] W.L. Saw, G.J. Nathan, P.J. Ashman, Z.T. Alwahabi, Combust. Flame 156 (2009)
1471–1479.[36] G.P. Smith, D.M. Golden, M. Frenklach, N.W. Moriarty, B. Eiteneer, M.
Goldenberg, C.T. Bowman, R.K. Hanson, S. Song, W. C. Gardiner, Jr., V.V.Lissianski, Z. Qin, <http://www.me.berkeley.edu/gri_mech/>.
[37] V.M. Zamansky, V.V. Lissianski, P.M. Maly, L. Ho, D. Rusli, W.C. Gardner Jr.,Combust. Flame 117 (1999) 821–831.
[38] C.-Z. Li, C. Sathe, J.R. Kershaw, Y. Pang, Fuel (2000) 427–438.[39] B. Bayarsaikhan, C. Sathe, T. Shimada, C.-Z. Li, J.-I. Hayashi, T. Chiba,
Proceedings of the 12th International Conference on Coal Science, Cairns,Australia, 2–6 November, 2003: Paper No. 6D4.
[40] R.C. Weast, M.J. Astle (Eds.), CRC Handbook of Chemistry and Physics, 59th ed.,CRC Press, Florida, 1979.
[41] J.C. Halle, K.H. Stern, Corrosion Sci. 20 (1980) 1139–1142.[42] P.J. Jackson, The Physicochemical Behaviour of Alkali-metal Compounds in
Fireside Boiler Deposits, The Mechanism of Corrosion by Fuel Impurities,Butterworth, London, 1963. p. 484.