THE RELATION OF REMITTANCE WITH ECONOMIC GROWTH AND POVERTY REDUCTION IN ETHIOPIA
16
RIJS Volume 4, Issue 5 (May, 2015) ISSN: 2250 – 3994 Journal of Radix International Educational and Research Consortium 1 | Page www.rierc.org THE RELATION OF REMITTANCE WITH ECONOMIC GROWTH AND POVERTY REDUCTION IN ETHIOPIA WONDAFERAHU MULUGETA Assistant Professor, Department of Economics, Jimma University, Ethiopia TEMESGENYAEKOB Lecturer, Department of Economics, Jimma University, Ethiopia JIBRILHAJE Lecturer, Department of Economics, Jimma University, Ethiopia ABSTRACT There is rapidly growing literature on the interaction between remittance, economic growth and poverty reduction. This study attempts to investigate empirically impactof migrant remittances on economic growth and poverty reduction in Ethiopia using time series data over the period 1980-2011. Employing modern time series econometric techniques such as unit root tests, bound test co-integration approach and error correction techniques within an ARDL framework yields most robust estimates. The empirical results reveal that remittances have a significant impact on Economic growth by increasing real private investment and fixed capital accumulation. It also found that remittance have a strong and statistically significant long run impact on poverty reduction, through the direct increase in the incomes of the poor, thus smoothening household consumption and easing capital constraints. The study suggested policies which aimed at sustained increases in remittances through the formal channel where significant amounts can be recorded and improve the impacts particularly to the poor. Finally, it is strongly recommended that, the government could develop appropriate training or education programs to assist returning migrants or remittance receipts in making effective investment decision. Key words: Remittance, economic growth, poverty, ARDL A Journal of Radix International Educational and Research Consortium RIJS RADIX INTERNATIONAL JOURNAL OF RESEARCH IN SOCIAL SCIENCE
-
Upload
independent -
Category
Documents
-
view
2 -
download
0
Transcript of THE RELATION OF REMITTANCE WITH ECONOMIC GROWTH AND POVERTY REDUCTION IN ETHIOPIA

RIJS Volume 4, Issue 5 (May, 2015) ISSN: 2250 – 3994
Journal of Radix International Educational and Research Consortium
1 | P a g e www.rierc.org
THE RELATION OF REMITTANCE WITH ECONOMIC GROWTH AND POVERTY REDUCTION IN ETHIOPIA
WONDAFERAHU MULUGETA
Assistant Professor, Department of Economics, Jimma University, Ethiopia
TEMESGENYAEKOB
Lecturer, Department of Economics, Jimma University, Ethiopia
JIBRILHAJE
Lecturer, Department of Economics, Jimma University, Ethiopia
ABSTRACT
There is rapidly growing literature on the interaction between remittance, economic growth and poverty
reduction. This study attempts to investigate empirically impactof migrant remittances on economic
growth and poverty reduction in Ethiopia using time series data over the period 1980-2011. Employing
modern time series econometric techniques such as unit root tests, bound test co-integration approach and
error correction techniques within an ARDL framework yields most robust estimates. The empirical results
reveal that remittances have a significant impact on Economic growth by increasing real private
investment and fixed capital accumulation. It also found that remittance have a strong and statistically
significant long run impact on poverty reduction, through the direct increase in the incomes of the poor,
thus smoothening household consumption and easing capital constraints. The study suggested policies
which aimed at sustained increases in remittances through the formal channel where significant amounts
can be recorded and improve the impacts particularly to the poor. Finally, it is strongly recommended that,
the government could develop appropriate training or education programs to assist returning migrants or
remittance receipts in making effective investment decision.
Key words: Remittance, economic growth, poverty, ARDL
A Journal of Radix International Educational and
Research Consortium
RIJS
RADIX INTERNATIONAL JOURNAL OF
RESEARCH IN SOCIAL SCIENCE

RIJS Volume 4, Issue 5 (May, 2015) ISSN: 2250 – 3994
Journal of Radix International Educational and Research Consortium
2 | P a g e www.rierc.org
1 INTRODUCTION
Migrants have a lot to put forward remittance to their homelands, from knowledge to money. It is often
the latter has an easier way finding its way back to percolate through the borders of nations, as the former
requires the physical mobility of individuals. Diffusing remittance money has remained one important
stream of revenue for the governments and peoples of developing countries. Over 192 million migrants
across the world actively remit money back to their country of origin. Their net remittances amounted to
be 414 billion dollars, out of which 316 billion dollars went to developing countries in 2010. Africa's share
from total remittances flows to developing countries ranges between 40 billion dollars and 50 billion
dollars annually originating from 30 million adults working in the developed world (World Bank 2010).
Ethiopia received remittance 387 million dollar in the same year (ibid).
Explosion of growth in remittance over the 1990‘s especially in developing countries has inspired a
stream of literatures focusing on the impact of remittance on the dynamics of economic growth and
poverty alleviation of the recipient country. Therefore, the relationship between the three variables has
motivated a voluminous empirical literature was center of attention on both industrial and developing
countries [Calaro (2008); Jongwanich (2007); Stark and Lucas (1988); Gupta et al. (2009)]. Jongwanich
(2007) examined that the impact of workers remittance on growth and poverty in developing Asian-Pacific
countries using penal time series data from 1993 - 2000. He found that the remittance have a significant
impact on poverty reduction, but insignificant impact on the in economic growth.
Bigsten et al (2005) investigated income dynamics in Ethiopia for the period 1994-1997 and
concluded that households in Ethiopia relied heavily on remittances in that period. Therefore the
studies investigates that effects of remittances on economy of Ethiopia in terms of aggregate fixed
capital accumulation, private investment which increase capital accumulation, reduction in current
account deficit, external debt burden and improve education/skills of the households by improving
human capital and poverty alleviation by improving income inequality Smoothing consumption in period of
1980-2011 by using ARDL analysis.
This paper is organized as follows. Section two provides an overview of remittance. The data and
methodology to be employed in the thesis are deal with under section three and the econometric results
and discussions given in section four. Finally, the conclusions and policy recommendations were drawn in
section five.
2. AN OVERVIEW OF OVERSEA MIGRATIONS AND REMITTANCE
Before proceeding to empirical analysis, it may be useful to have an overview of overseas migration and
development of workers’ remittances since 1980. Approximately 2 million Ethiopians have migrated to
different countries around the world during 1980-2010(CSA, 2010). Majority of the Ethiopians have
migrated to the African countries especially Kenya ,Somalia ,Sudan and south Africa ,USA ,European

RIJS Volume 4, Issue 5 (May, 2015) ISSN: 2250 – 3994
Journal of Radix International Educational and Research Consortium
3 | P a g e www.rierc.org
countries ,united Arab emirates ,sued Arab and etc. Other major concentrations and absorptions are
Oman and Kuwait. Ethiopian workers also migrated to several other countries both developing and
developed around the world. In the decade of 1970s, the total amount of remittances sent home by the
migrant workers increases as the number of migrant to Middle East, Arab emirates and South Africa
increases. However, remittance flows continue to decline after reaching a peak in 1993-95. The declining
trend in remittances continues to persist till 2000. The Ethiopian overseas migrant showed a recurring and
fluctuating behavior from 1995 to 2010.
The high unemployment, massive poverty, expectations for higher earnings abroad may be reasons for
over the time increase in the number of Ethiopia going abroad. Majority of migrant workers are either
unskilled or semi-skilled from low income backgrounds which allowed their families behind to establish
small business, get hold of real assets and make considerable and extensive enhancement and
improvement in their standard of living.
Studies have demonstrated that Ethiopian migrants generally spend 1-3 years in neighboring countries
(such as Kenya, Djibouti, or Somalia) before immigrating to the west. Ethiopian refugees residing in
refugee camps in neighboring countries may also receive resettlement in other countries further abroad,
as in the case of 130 Ethiopian refugees who were resettled in the UK in 2006 (HDI, 2007). Figure 3.1
illustrates the destination of Ethiopian migrants. In the figure below illustrated as that the largest
Ethiopian migrants are lived Asia (37%) and USA (29%) in which the least are Latin America (0.2%) and
Oceania (1.5%)
Figure 3.1: Proportion of Ethiopia's International Migration Stock, Residence by Continent: 2000-2002
Source World Bank (2008).Note L.AM.CA is Latin America and Cambrian countries
Remittance flows tend to act counter-cyclically in Ethiopia that is they increase at times of distress in the
receiving countries, working effectively as an informal Stabilization Fund. Specifically it shows that

RIJS Volume 4, Issue 5 (May, 2015) ISSN: 2250 – 3994
Journal of Radix International Educational and Research Consortium
4 | P a g e www.rierc.org
remittances as a proportion of RGDP tend to increase whenever real GDP growth loosens, this assertion is
particularly the case after 2005(Beyene,2005). Of course, this correlation does not deal with all the
complexities involved in slow-downs in economic activity, when we can witness the common effects of
devaluations, adjustment policies, and adverse external conditions. The result obtained in this study is
consistent with the findings ofGiuliano and Ruiz-Arranz(2005) in that remittances are more countercyclical
in countries with less developed financial systems.
Figure 3.2 Time series plot among remittance, real GDP and poverty.
Source: Authors computation
The above figure Depicts that positive relationship between GDP and remittances and negative
relationships between remittance inflow and poverty head count, GDP and poverty. GDP and remittances
inflow show an increasing trend from 1987 till 1994, however, after 1994 remittances inflow depict
consistently declining trend till 1996, and also increasing till 1999 and GDP increase at decreasing rate
during this two period. After 2000 both series move in the upward direction. The figure makes it clear
that over the time, trend in remittances and GDP growth are almost the similar. From this two graphs the
studies achieved that flow remittance to Ethiopia cyclical patterns as (Giuliano and Ruiz-Arranz, 2005)
whereas, GDP is increasing after 2000 to 2003 at decreasing rate from 2004 to 2011 at increasing rate. The
above data analysis is also supported by the empirical finding in literature as Siddiqui and Kemal (2006)
pointed out that increase in poverty during 1990s may be due to short fall of remittances in this decade.
Therefore data and literature both support the hypothesis that remittance contributes to economic
growth and poverty reduction in Ethiopia.

RIJS Volume 4, Issue 5 (May, 2015) ISSN: 2250 – 3994
Journal of Radix International Educational and Research Consortium
5 | P a g e www.rierc.org
3. STUDY DESIGN AND METHODOLOGY
The study was employed secondary sources of data. The nature of data is time series data that will cover
over the periods of 1980-2011. Secondary data was on macroeconomic variables was obtained from
different institutions such as World Bank (2012), Ministry of Finance and Economic Development (2012),
National Bank of Ethiopia (20120, and International Monetary Fund (2012).
3.1 REMITTANCE AND ECONOMIC GROWTH.
The explicated econometric model formulated as
tttttt OPHCRIRMLnGDP lnlnlnln 4321 ------------------------ (1)
Whereas Ln logarithms GD real growth domestic product, proxy for growth, RM remittance as share of
GD, RI real private investment, HCt human capital and OPt openings to trade.
3.1.1 UNIT ROOT PROCEDURE
While the bounds test for co integration does not depend on pre-testing the order of integration, the
variables need to either be I(0) or I(1) or mutually integrated and not I(2).Hence the need to test for unit
root to ascertain the absence or otherwise of I(2) variables cannot be Overemphasized(Gloria,2008). To
estimate bound test procedure co-integration, the estimated conditional ARDL model to test the long run
relationship between poverty and its determinants variables is as follows.
p
t
p
t
p
t
tititi
p
t
tit OPHCRIRMTGD1 1 1
11
1
1 lnlnlnlnln
tttttt uOPHCRIRM lnlnlnln 4331211
The parameters ,,,, and denote the short-run dynamics of the model to be estimated via the
error correction framework and ,,,, 4321 and 5 represent the long-run parameters. Moreover, is
the constant term (drift term) in the ARDL model and tu is the white noise error term. In the second step,
once co integration is established the conditional ARDL (p1, q2, q3, q4, q5, q6) Long run model for GD can
be estimated as: by using above the re-parameterization of ARDL which is done by the help of (Verbic,
2004).
p
i
p
i
p
i
titiiti
p
i
ti
p
i
tit OPHCRIRMTGDGD1 1 1
111
1
1
1
1 lnlnlnlnlnln ----------
-------------- (3)
The estimation of (3) involves selecting the orders of the ARDL (p, q1, q2, q3, q4) long-run model using AIC
and SBC.

RIJS Volume 4, Issue 5 (May, 2015) ISSN: 2250 – 3994
Journal of Radix International Educational and Research Consortium
6 | P a g e www.rierc.org
p
i
p
i
p
i
tititi
p
i
ti
p
i
tit OPHCRIRMTGDGD1 1 1
111
1
1
1
1 lnlnlnlnlnln
ttECM 1 -------------------------------- (4)
The coefficients of parameters are dynamic coefficients of the model’s convergence to equilibrium, is
the speed of adjustment to long-run equilibrium following a shock to the system and ECM error correction
mechanism.
3.2 REMITTANCE AND POVERTY REDUCTION
The researcher uses similar model suggested by Ravalli on (1997), Ravalli on and Chen (1997) and Adam
and Page (2005) to explore the impact of remittances on poverty. Thus its explicit econometric form is
ttttt OPRMINRGDPLnPV 432110 lnlnln ------------------------------ (5)
Whereas PV , poverty measure ,whether head count ratio or poverty gap or both due to availability of
data RGDP, real growth domestic product, IN income inequality, the coefficients of explanatory variables
will expected to be, 321 ,, ,and 4 arenegative, positive, positive/negative, respectively. The estimated
conditional ARDL model to test the long run relationship between poverty and its determinants variables is
as follows.
1211
11
1
1
0 lnlnlnlnln ttt
p
i
it
p
i
i
p
i
it GDPVRMTINGDPPVLn
tttt uOPRMTIN 151413 lnln ------------------------------------------------ (6)
All parameters are similarly defined as growth model.Next the long run ARDL (p, q1, q2, q3) for poverty
can be estimated as.
tt
q
i
t
q
i
t
q
i
t
q
i
t
p
i
t uOPRMTINGDPVTLnPV
1
4
`
51
3
1
41
2
1
31
1
1
21
1
1 lnlnlnlnln -------------------
------------------------- (7)
The estimation of above model, involves by the information of SBC. Finally, its error correction model
becomes.
1
4
`
1
3
1
1
1
1
1
1
1
lnlnlnlnln t
q
i
it
q
i
it
p
i
it
p
i
it
p
i
it OPRMTINGDPVTPVLn
tt uECM 1 ------------------------------------------------- (8)
Where , , , and are short run dynamic coefficients of model to adjustments of equilibrium, ζ
speed of adjustment, ECM error coercions mechanism.
RIJS Volume 4, Issue 5 (May, 2015) ISSN: 2250 – 3994
Journal of Radix International Educational and Research Consortium
7 | P a g e www.rierc.org
4. RESULTS AND DISCUSSIONS
4.1 Remittance and economic growth.
The result shows that in all the three cases (i.e., columns) the variables are non-stationary when they are
tested in levels. This is shown by the computed results which are less than the critical values in absolute
term both at 5%, 1% and 10%. The variables in first difference are however, stationary. This implies that all
the variables are integrated of order one [i.e., I (1)]. That is, the variables attained stationary after first
difference. On other hand none of the variables are integrated order two; i.e. I (2)
4.1.1 THE BOUND TESTS RESULTS OF ARDL MODEL
Since calculated F (6.03) statistics are higher than the upper bound critical value of 4.74 at the 1 % level.
This implies evidence of co-integration relationships between the variables also rules out the possibility of
estimated relationship being 'spurious' (See Table 1.1 in Appendix I).
4.1.2 RESULTS OF THE LONG RUN RELATIONSHIP
The result indicates that an increase in remittance leads to encourage economic growth. This means that,
in the long-run, increases inflow of remittance from abroad has positive impact in real output of Ethiopian
economy. The results show that the coefficient of real GDP is statistically significant at 1 percent level,
indicating that if the country were to increase her remittance 1 percent, growth rate per capita will
increased by 0.03869 percent.
The coefficient of human capital (H) is consistent with (Gloria, 2006) and most of previous studies that a
positive relationship should be observed between human capital and economic growth. Theoretically, if
the human capital factor in Ethiopia increases, it increases opportunities of increasing per capita by
generating income and consequently increases the growth. By the same token, decrease in human capital
is expected to worsen for economic growth. The finding of this study show the expected positive
relationship (0.356) between the two variables, which means that increase in human capital factor by 1
percent in the long run, will increases economic growth of Ethiopia by approximately 0.36 % and is
significant at 5%, 1% and 10% (See Table 1.3 A and B in Appendix I).
4.1.3 SHORT RUN DYNAMICS
These studies examined that the variables in the model are co integrated provides support for the use of
an error correction mechanism (ECM) in order to investigate the short run dynamics. More importantly,
the error correction coefficient has the expected negative sign and is highly significant. This helps reinforce
the finding of a long run relationship among the variables in the model.
RIJS Volume 4, Issue 5 (May, 2015) ISSN: 2250 – 3994
Journal of Radix International Educational and Research Consortium
8 | P a g e www.rierc.org
The results suggest that the immediate impact of changes in remittance on economic growth is positive.
That is to say, the coefficient of the real GDP has the theorized in literature review positive sign indicating
a positive impact on economy of Ethiopia in the short run which is consistent with the long run results
.When we came to real private investment, it can readily be separated that this variable has a positive
effect on economic growth and statistically significant at 95% level.
As a final point, the error correction term ECMt−1 which increases the speed of adjustment to restore
equilibrium following shock has the expected positive sign and is statistically significant at 1 percent, thus
reinforcing the attainment of a long run equilibrium relationship among the variables. The size of the error
correction term (-0.34039) precisely indicates that around 34% of the deviation from the long run
equilibrium is corrected every year (see Table 1.3C in Appendix I).
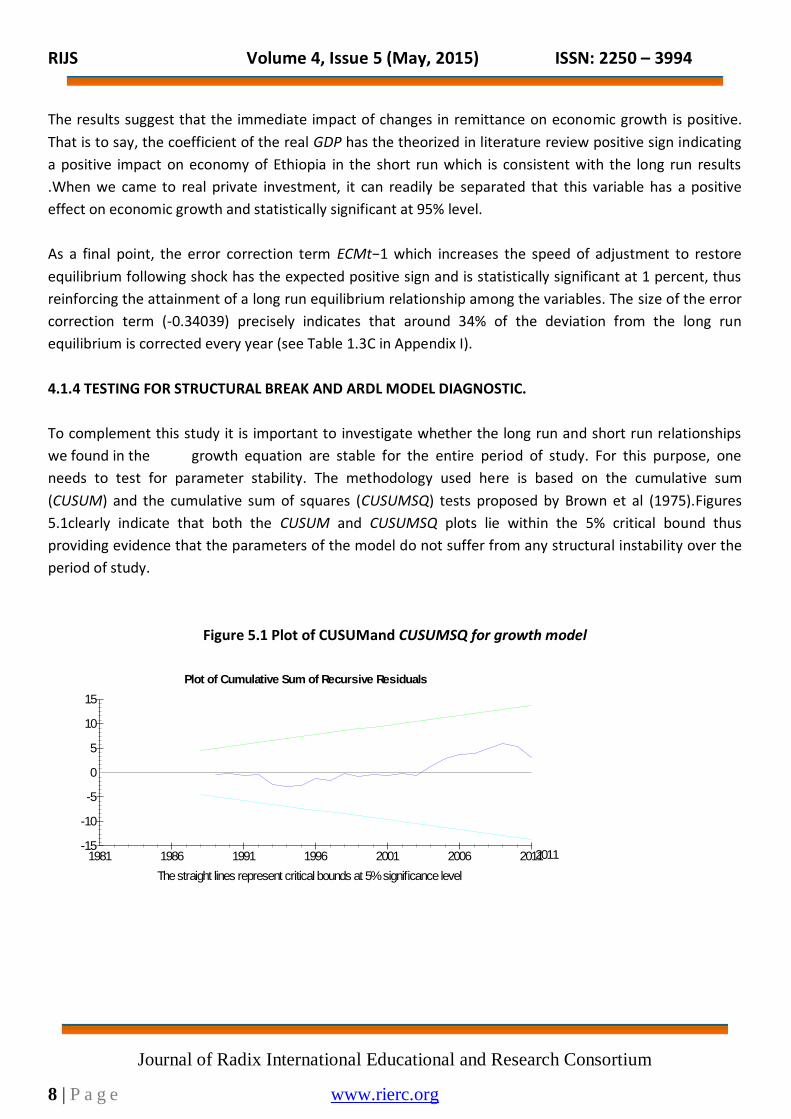
4.1.4 TESTING FOR STRUCTURAL BREAK AND ARDL MODEL DIAGNOSTIC.
To complement this study it is important to investigate whether the long run and short run relationships
we found in the growth equation are stable for the entire period of study. For this purpose, one
needs to test for parameter stability. The methodology used here is based on the cumulative sum
(CUSUM) and the cumulative sum of squares (CUSUMSQ) tests proposed by Brown et al (1975).Figures
5.1clearly indicate that both the CUSUM and CUSUMSQ plots lie within the 5% critical bound thus
providing evidence that the parameters of the model do not suffer from any structural instability over the
period of study.
Figure 5.1 Plot of CUSUMand CUSUMSQ for growth model
Plot of Cumulative Sum of Recursive Residuals
The straight lines represent critical bounds at 5% significance level
-5
-10
-15
0
5
10
15
1981 1986 1991 1996 2001 2006 20112011

RIJS Volume 4, Issue 5 (May, 2015) ISSN: 2250 – 3994
Journal of Radix International Educational and Research Consortium
9 | P a g e www.rierc.org
The result of the diagnostic test confirms the adequacy of the model. That is, the null of there is no serial
correlation is not rejected at any conventional significant level which shows that there is absence of serial
correlation (autocorrelation) at the 5% significance level and the null of there is homoscedastic variance
(assumption of constant variance) between the regression of squared residual is not rejected at any of
significance level (See Table 1.3 D in Appendix I).
4.2 REMITTANCE AND POVERTY REDUCTION
The variables in first difference suggest the presence of stationary. By using the same procedure as growth
model there is Evidence of co-integration relationships between the variables also rules out the possibility
of estimated relationship being 'spurious' (See Table 1.2 in Appendix I).
4.2.1 LONG RUN RELATIONSHIP
The results indicate that, an increase in remittances can directly lead to poverty reduction in the long run.
This may be due to the fact that remittances directly increase the income of poor people, smooth
household consumption and ease capital constraint. The studies from this results predict that, an increase
remittance at 1% the same as to reduce poverty approximately by 0.0213 percent.
The results suggest that openings to trade have positive and significant impact on poverty reductions of
Ethiopia as many theory of review hypothesis in most developing countries and its coefficients is (-
0.11730). On the other hands perhaps trade liberalization over the period improved the income
distribution, thus making the poor as good as possible as a result of the adoption of skilled – based
technical methods in response to increase national competition. Thus in the long run, openness to trade
shrinks the poverty situation in Ethiopia (Gloria, 2008).
Finally, the results indicate that, an increase in economic growth leads to reduction in poverty incidence
which is consistent with analysis of poverty reduction (Adam and page, 2005). That is to say, in the long-
run, an increases in real output has the potential of improving poverty in Ethiopia. The results show that
RIJS Volume 4, Issue 5 (May, 2015) ISSN: 2250 – 3994
Journal of Radix International Educational and Research Consortium
10 | P a g e www.rierc.org
the coefficient of real GDP is statistically significant at 5% percent level, indicating that if the country were
to increase her GDP by 1 percent, poverty incidence will reduce by 0.137 percent (See Table 1.4 A and B in
Appendix I).
4.2.2 SHORT RUN DYNAMICS
From output of micro fit4 software the studies suggests that the immediate impact of changes in real GDP
on poverty reduction is positive. That is to say, the coefficient of the real GDP both inlags and normalized
formhas the theorized negative sign specifying a positive impact on poverty reduction, in the short run
which is consistent with the long run results; the coefficient is highly significant at 5%. This means that in
the short run, growth in economic activities in Ethiopia has the potential of reducing poverty. The short
run impact of poverty with respect to income inequality (Gini coefficient) is positive and significant which
is according most of the theorized review. This positive and significant relation indicate that at a given rate
of economic growth, poverty reduces more in low inequality countries, as opposed to high inequality
countries, so the income inequality variable is positive and significant (Adam and Page, 2005).
Finally, the error correction term ECMt−1 which increases the speed of adjustment to restore equilibrium
following shock has the theoretically expected negative sign and is statistically significant at 5 percent. The
size of the error correction term (-0.49) precisely indicates that around 49% of the deviation from the long
run equilibrium is corrected every year (See Table 1.4 C in Appendix I)
4.2.3 TESTING FOR STRUCTURAL BREAK AND MODEL DIAGNOSTIC
The methodology used in poverty model based on the cumulative sum (CUSUM) and the cumulative sum
of squares (CUSUMSQ) tests proposed by Brown et al (1975). Figures 5.2 shows that both the CUSUM and
CUSUMSQ plots lie within the 5% critical bound.
Figure 5.2 plot of CUSUM and CUSUMSQ for poverty model

RIJS Volume 4, Issue 5 (May, 2015) ISSN: 2250 – 3994
Journal of Radix International Educational and Research Consortium
11 | P a g e www.rierc.org
Plot of Cumulative Sum of Squares of Recursive Residuals
The straight lines represent critical bounds at 5% significance level
-0.5
0.0
0.5
1.0
1.5
1981 1986 1991 1996 2001 2006 20112011
Evidence shows that the parameters of the model do not suffer from any structural instability over the
period of study.
5. CONCLUSIONS AND POLICY RECOMMENDATIONS
The researchers analyze the impact of remittances inflow on economic growth and poverty. It is found that
remittances effect on economic growth positively and significantly by increasing real private investment
and fixed capital accumulation which increase capital accumulation, reduction in current account
deficit, external debt burden and improve education/skills of the households by improving human
capital. The finding of this study suggests that international migration of labour has substantial potential
benefits for poor people in developing countries like Ethiopia. In the long run the remittance inflow can
leads to sustainable growth and welfare improvement and up gradation of poor households as the impact
of remittance broaden and enlarge over the Time.

RIJS Volume 4, Issue 5 (May, 2015) ISSN: 2250 – 3994
Journal of Radix International Educational and Research Consortium
12 | P a g e www.rierc.org
Two key policy systems are needed to sharpen impacts of remittance. Firstly, government needs to have
the policy scheme that aims to enhance the amount of remittances, particularly through formal channel.
Secondly, policy scheme should be emphasized toward how remittances will be used for productive
activities. According to our econometric estimates, physical and human capital investments are two key
channels through which remittances could generate the positive effects on economic development.
Measures that encourage remittances to such investments would enhance its developmental impact.
The major limitation the study encountered, typical of such studies in developing countries, was quality
and limited availability of data. Furthermore, most of the time series data were not in quarterly format and
therefore variables such as real GDP, external remittances, human capital etc., have to be used in their
annual form. An attempt to extend the data length to 20012/13 or further was constrained by
unavailability of these macro series from domestic official sources as the researcher had to fall on mainly
foreign sources such as the World Bank, IMF, among others at a tremendous financial expense. Thus,
future studies on remittances on economic growth and poverty reduction in Ethiopia should extend the
context of the present study by simultaneously estimating a robust relationship between economic
growth, poverty reduction and remittances by incorporating other relevant variables such as foreign aid,
government consumption, etc. particularly by panel time series data.
References
Adams. R and John Page (2005).Do International Migration and Remittances Reduce Poverty in Developing
Countries. World Bank, Washington, DC, USA.Arif .G Remittances and investment at the household
level in Pakistan.PIDE Research report #166.
Acosta.P; Calderon.C; Fajnzylber.P; Lopez. H (2007), “The Impact of International Remittances on Poverty
and Inequality in Latin America:, World Development Vol. 36, No. 1, pp. 89–114.Calero, Carla
(2008) Remittances, Liquidity Constraints and Human Capital Investments in Ecuador.
Aredo, D. (1998), “Skilled Labor Migration from Developing Countries: An Assessment of Brain Drain from
Ethiopia”, In: S. Siyoum and A. Siyoum(eds.), Human Development in Ethiopia, Ethiopian Economic
Association.
Aredo, D. (2005), “Migration Remittances, Shocks, and Poverty in Urban Ethiopia: An Analysis of Micro
Level Panel Data”, Addis Ababa University.
Atnafu, A. (2006), “Aspects of Ethiopian Return Migration”, MA dissertation, Department of Regional and
Local Development.
Brook R. and Davila J., (2000), “Peri- Urban Interface, Tale of Two Cities.GwasgFrancon Printers.Burgess,
Robert and Haksar, Vikram (2005), migration and foreign remittances in the Philippines, IMF
working paper.WP/05/111.
Beyene (2005), The impact of migrants remittance on poverty reduction using household survey in
Ethiopia.
Bigsten,Kebede and Shimelese (2005), The impact of remittance on poverty reduction in Ethiopia using
crossctional analysis.
CSA, (2010), Central housing survey statistics agency in Ethiopia.

RIJS Volume 4, Issue 5 (May, 2015) ISSN: 2250 – 3994
Journal of Radix International Educational and Research Consortium
13 | P a g e www.rierc.org
Chami, R., C. Fullenkamp and S. Jahjah (2003), “Immigrant Remittance Flows a Source of Capital for
Development”, IMF Working Paper01/189, International Monetary Fund, Washington DC.
Giuliano, P. and Ruiz-Arranz, M., (2005), “Remittances, Financial Development, and Growth,” AIMF
Working Paper 05/234,(Washington: International Monetary Fund).
Gloria Owife (2006), The impact of remittance on poverty reduction in Ghanaian economy.
Naseem S. (2004), Overseas Migration, Outsourcing and Economic Growth in South Asia edited by Debdas
and Goldfield, Labor, Globalization and the State Workers.
Qayyun, A.; Jeved, M.; Arif, U. (2008),The impact of remittance on economic growth and poverty: new
evidence from Pakistan economy.
Orozco, M. (2003): “Worker Remittances: An International Comparison,” Working paper commissioned by
the Multilateral Investment Fund of the Inter-American Department Bank.
Jongwanic.J (2007), International Migration and Economic Development: Lesson from low Income
Countries, Edward Elgar Cheltenham UK
Kemal.A. (2001), Structural Adjustment, Macroeconomic Policies, and Poverty Trends in Pakistan. Asia and
Pacific Forum on Poverty: Reforming Policies and Institutions for Poverty Reduction.
Pesaran, M. H; Shin.Y and Smith, R.J. (2001), “Bounds Testing Approaches to theAnalysis of Level
Relationships”,Journal of Applied Econometrics 16: 289-326.
Phillips, P .C.B. and Perron. P (1988): “Testing for a Unit Root in Time Series Regression”, Biometric, 75, pp.
335-446.
Pieke, F. Van Hear. N and Lindley .A (2005).“Synthesis Study: A Part of the Report on Informal Remittance
Systems in Africa, Caribbean and Pacific Countries” ESRC Centre on Migration, Policy and Society.
Poirine, B. (1997), “A Theory of Remittances as an Implicit Family Loan Arrangement”, World
Development, 25(4): 589-611.
Ravallion M (1997),“The impact of High inequality developing countries escape absolute poverty
Economics”,Letters, 56, 51-57.
Revallion.M& Chen. S (1997), “What can new survey data tell us about recent change in Distribution and
poverty?”World Bank Economic Review, 11, 357-382
Kozel .V and Harold.A (1990), “Factors determining work participation and labor supply decision in
Pakistan”,The PDR 29, 473-479.
Lucas.R (2005), International Migration and Economic Development: Lessons from Low-Income Countries,
London, Edward Elgar Publishing. Women and migrants confront neoliberalism Routledge
Siddiqui, R and A R, Kemal (2006),“Remittances Trade liberalization and poverty in Pakistan: the role of
excluded variables in poverty change analysis”,The PDR 45:3, 383-415
Stark and R Lucus (1988),“Migration, Remittances and Family”, Economic Development and Cultural
Change, Vol. 31(1): 191-96
Taylor.J (1992), “Remittances and Inequality Reconsidered; Direct, Indirect and International
Effects”,Journal of Policy Modeling, Vol.14 (2); 187-208.

RIJS Volume 4, Issue 5 (May, 2015) ISSN: 2250 – 3994
Journal of Radix International Educational and Research Consortium
14 | P a g e www.rierc.org
Appendix I for growth and poverty equations
Table 1.1: Bound test procedures for growth model
K critical values F-statistics (Frgdp (RGDP /REMT HC, OP, RPIVt).
5 1% 5% 10% 6.03**
I(0) 3.71 2.98 2.62
I(1) 4.74 3.67 3.45
Table 1.2:For Poverty model
5 F-statistics (Frgdp (pov /REMT LNIVT, OP, LNHCT).
I(0) 4.71 3.58 3.72 7.09**
I(1) 5.72 3.67 3.45
Notes: Critical values are obtained from Narayan (2004). *** represents statistical significance at the 1% level.
K is the number of regressors
Table 1.3: ARDL to estimate for growth model.
A. Autoregressive Distributed Lag Estimate ARDL(1,0,0,0,1) selected based on Schwarz Bayesian
Criterion Dependent variable is LNRGDP
Regressor Coefficient Standard Error Ratio[Prob]
LGDPT (-1) 1.0340 .078764 13.1284[.000] **
LNRPIVT .0076139 .0079979 .995 [.351]
LnREMITT .018336 .036862 .49743[.623]
LNOPPT -.44301 .11274 -3.9295 [.000]**
LNOPPT (-1 .65814 .10311 6.3829[0.00]**
LNHCT -.012447 .0187 .6625[.514]
CONS -.48983 .3175 -1.54[.014]**
R-Squared .962547 R-Bar-Squared .953 S.E. of Regression .038411 F-
stat. F (6, 24) 102.8782[.000] Mean of Dependent Variable 4 .034 S.D. of Dependent Variable
.176Residual Sum of Squares .0354 Equation Log-likelihood 61.02 Akaike Info. Criterion
54.02 Schwarz Bayesian Criterion 49.003 DW-statistic 2.0423 Durbin's h-statistic -.
123[0.891]
Estimated long run coefficients using the ARDL approach
B) ARDL(1,0,0,0,1) selected based on Schwarz Bayesian criteria
Regeressor Coefficien
t
Standard
Error
T-Ratio[prob]
LNPRIVT .224 .599 -.373[.712]
LNRMIT .366 .790 .462[.038]*
LNOPPt -.117 .051 -.469[.058]
LNHCT .366 .704 .462[.008]*
CONS 14.390 25.56 .563[0.009]*
C. Error Correction Representation for the Selected ARDL Model
ARDL (1, 0, 0, 0, 1) selected based on Schwarz Bayesian Criterion

RIJS Volume 4, Issue 5 (May, 2015) ISSN: 2250 – 3994
Journal of Radix International Educational and Research Consortium
15 | P a g e www.rierc.org
Dependent variable is LNRGDP
Regresso Coefficient Standard Error T.Ratio[p]
DLGDPT .018336 .036862 .49743[.062]
DLNRPIV .0076139 .0079979 .95199[.035]*
DLNREMt .012447 .018795 -.66225[.014]*
DLNOPPt -.44301 .11274 -3.9295[.061]
LNHCT -.012447 .018795 -.66225[.514]
CONS -.48983 . 31754 .6625[.004]*
ECM (-1) -.34039 .3175 -1.54[.014]*
R-Squared .67712 R-Bar-Squared .59640 S.E. of Regression .038411 F-stat. F (5, 25)
10.0664[.000] Mean of Dependent Variable .020523 S.D. of Dependent Variable .060462 Residual
Sum of Squares .035409 Equation Log-likelihood 61.0218 Akaike Info. Criterion 54.0218
Schwarz Bayesian Criterion 49.0028 DW-statistic 2.04
D. Diagnostic test
Test Statistics LM Version F Version
*A: Serial Correlation CHSQ ( 1) = 3.78[.052] F( 1, 21)= 3.0363[.096]
* B: Functional Form CHSQ ( 1) = 1.183[.277] *F( 1, 21)= .86268[.364]
* C: Normality CHSQ( 2)= 140.341[.050] Not applicable
*D: Heteroscedasticity CHSQ( 1)=1.8712[.171] F( 1, 28)= 1.8626[.183]
Wald Statistic CHSQ( 1)= 30.4801[.000]
A: Lagrange multiplier test of residual serial correlation B: Ramsey’s RESET test using the square of the
fitted values C: Based on a test of skewness and kurtosis of residuals D: Based on the regression of
squared residuals
The resections for Wald test is imposed as the coefficients for short run independent variables assigned as
A1+A2+A3+A4+A5=A6 ,AS are coefficients of explanatory variables
Table 1.4: ARDL lag estimate for poverty model.
A) Autoregressive Distributed Lag Estimates ARDL(1,0,0,0,2) selected based on Schwarz Bayesian
Criterion Dependent variable is LNPOVT
Regressor Coefficient Standard Error T-Ratio[Prob]
LNPOVt(-1) .515 .15437 3.3140[.003]
LNINT -.0088511 .15437 11987[.001]
LnREMITt -.010395 .0050186 -2.0712[.005]
LNOPPt -.057316 .032256 -1.7769[.089]
LRGDPT(-2) -.17866 .065314 -2.7354[.012]
CONST .59742 .59742 3.2728[.003]

RIJS Volume 4, Issue 5 (May, 2015) ISSN: 2250 – 3994
Journal of Radix International Educational and Research Consortium
16 | P a g e www.rierc.org
R-Squared .95854 R-Bar-Squared .94535 S.E. of Regression .012952 F-stat. F (7, 22) 72.6624[.000]
Mean of Dependent Variable .503S Dependent Variable .055401 Residual Sum of Square .0036903
Equation Log-likelihood 92.4805 Akaike Info. Criterion 84.4805 Schwarz Bayesian Criterion 78.8757
DW-statistic 2.4953
Estimated Long Run Coefficients using the ARDL Approach
B) ARDL (1, 0, 0, 0,2) selected based on Schwarz Bayesian criteria
Regressor Coefficient Standard Err T-Ratio [Prob]
LNIN .018122 0.151 -.1963[.106]
LNRMIT -0.2182 .01002 -2.1225[.025]*
LNOPPt -0.1173 .0519 2.2574[.014]*
LRGDPt -0.137 .05074 2.703[.013]*
Constant 1.23 .01663 7.35[0.00]*
C.Error Correction Representation for the Selected ARDL Model ARDL (1, 0, 0, 0, 2) selected based on
Schwarz Bayesian Criteria Dependent variable is LNPOV
Regressor Coefficient Standard Error T.Ratio[p]
DLNINT 0.088511 0.073836 -.11987[.006] **
DLNRMIT -0.010395 0.050186 -2.0712[.050]
DLNOPPT -0.057316 -0.057316 -1.7769[.089]
DLRGDPT -0.050982 0.53036 -.96129[.016]**
dLRGDPt(-) -0.050982 0.065314 2.7354[.012]**
CONS 0.5973 0.18254 3.2728[.003]**
ECM (-1) -0.48983 0.15437 -3.1639[.004]**
R-Squared .70600 R-Bar-Squared .61700 S.E. of Regression .012952 F-stat. F (6, 23)
2.5062[.002] Mean of Dependent Variable -.0062102 S.D.of Dependent Variable .014637 Residual Sum
of Squares .0036903 Equation Log-likelihood 92.4805 Akaike Info. Criterion 84.4805 Schwarz
Bayesian Criterion 78.8757 DW-statistic 2.4953
D. Diagnostic test
Test Statistics LM version F-version
* A: Serial Correlation CHSQ ( 1) = 3.78[.052] F( 1, 21)= 3.0363[.096]
* B: Functional Form CHSQ ( 1) = 1.183[.277] *F( 1, 21)= .86268[.364]
* C: Normality CHSQ(2)= 140.341[.050] Not applicable
* D: Heteroscedasticity CHSQ( 1)=1.8712[.171] F( 1, 28)= 1.8626[.183]
Wald Statistic CHSQ(1)= 30.4801[.000]
A, B, Cand D are defined the same as growth model. -