The reducibility of mixed Mo/V oxide materials to carbides and ...
240
The reducibility of mixed Mo/V oxide materials to carbides and their reactivity in the activation of propane vorgelegt von BSc.(Hons) Chemiker Thomas Cotter aus Christchurch (Neuseeland) Von der Fakultät II - Mathematik und Naturwissenschaften der Technischen Universität Berlin zur Erlangung des akademischen Grades Doktor der Naturwissenschaften Dr.rer.nat. genehmigte Dissertation Promotionsausschuss: Vorsitzender: Prof. Dr. Arne Thomas Berichter/Gutachter: Prof. Dr. Reinhard Schomäcker Berichter/Gutachter: Prof. Dr.Robert Schlögl Berichter/Gutachter: Prof. Dr.Klaus Christmann Tag der wissenschaftlichen Aussprache: 19. August 2011 Berlin 2011 D 83
-
Upload
khangminh22 -
Category
Documents
-
view
1 -
download
0
Transcript of The reducibility of mixed Mo/V oxide materials to carbides and ...

The reducibility of mixed Mo/V oxide materials to carbides and their reactivity in the
activation of propane
vorgelegt von
BSc.(Hons) Chemiker
Thomas Cotter
aus Christchurch (Neuseeland)
Von der Fakultät II - Mathematik und Naturwissenschaften
der Technischen Universität Berlin
zur Erlangung des akademischen Grades
Doktor der Naturwissenschaften
Dr.rer.nat.
genehmigte Dissertation
Promotionsausschuss:
Vorsitzender: Prof. Dr. Arne Thomas
Berichter/Gutachter: Prof. Dr. Reinhard Schomäcker
Berichter/Gutachter: Prof. Dr.Robert Schlögl
Berichter/Gutachter: Prof. Dr.Klaus Christmann
Tag der wissenschaftlichen Aussprache: 19. August 2011
Berlin 2011
D 83


“There is nothing like looking, if you want to find something…
You certainly usually find something if you look, but it is not always quite the
something you were after.”
– Thorin (The Hobbit)


Preface and Acknowledgments
The work presented in this thesis was carried out from July 2007 to June 2011 at the Department of Inorganic Chemistry at the Fritz Haber Institute in Berlin. Herein I would like to give thanks to the numerous people who have made it a pleasure to work here as well as to those people who have supported me in my studies.
First and foremost I would like to thank Professor Dr. Robert Schlögl for giving me the opportunity to carry out my studies at this wonderful institution, imbued with such a deep sense of history and academic excellence. Your energy and capacious intellect has strongly influenced my thinking and I am indebted to you. I would also like to thank my supervisor, Dr. Annette Trunschke, for her kind and unwavering support over the last four years, guiding me to the endpoint while allowing me to explore interesting topics along the way.
In the organization and defense of my thesis at the Technical University of Berlin I would like to especially thank Professor Dr. Reinhard Schomäcker for taking me on as an external student. In addition I am very grateful to Professor Dr. Klaus Christmann of the Freie University and Professor Dr. Arne Thomas of the Technical University for agreeing to be part of my examining committee.
Without the help of a number of people this thesis would not have been possible. For their help with regards to measurements, advice and technical assistance I would like to acknowledge the following people (in no particular order); Gisela Lorenz, Raoul Naumann, Daniel Brennecke, Doreen Steffen, Gisela Weinberg, Wei Zhang, Manfred Schuster, Almudena Celaya, Edith Kitzelmann, Frank Girgsdies, Andrey Tarasov, Olaf Timpe, Malte Behrens, Yury Kolen'ko, Kazuhiko Amakawa, Maike Hashagen, Jean-Phillippe Tessonier, Ed Kunkes, Lénárd-Istvan Csepei, and Siegfried Engelschalt. A special thank you goes out to Manfred Schuster who donated a lot of his time for the acquisition and analysis of microscopy data presented here.
For their help in writing and correcting this dissertation I owe a debt of gratitude to my sister Rosie Cotter for correcting the entire thesis for grammar. I would also like to thank Maricruz Sanchez, Kazuhiko Amakawa and Andrey Tarasov for correcting individual chapters for content.
For their support and interesting discussion I would like to acknowledge the members of the Reactivity group and the AC department, and additionally Yury, Till and Peter for their friendship early on and for helping me to settle in a new city. I would like to thank my flatmates, Tallulah and Veronica (the ‘Neukölln Princesses’), for their good
humour for the last two years and I especially thank my girlfriend Maricruz for her love, support and consideration over the last 12 months.
Finally I would like to thank my parents for their unceasing encouragement and belief in me. You inspire me to always look for the best in life and I owe everything that I have and that I am to you.


To my parents


Eidesstattliche Versicherung
Hiermit erkläre ich, dass ich die Dissertation selbst angefertigt habe. Die Arbeit
enthält– auch in Anteilen – keine Kopien andere Arbeiten. Verwendete Hilfsmittel
und Quellen sind vollständig angegeben. Die Namen alle Wissenschaftler die mit mir
zusammengearbeiten haben, sind in den Anlagen vollständig genannt.


i
Abstract:
A series of mixed Mo/V oxide materials was treated under varying carbon-rich, reducing conditions in order to model conditions found when high-performance multi-metal oxide catalysts are operated at high conversion in selective oxidation reactions. The objectives were twofold: to better understand the mechanism of reduction-carburisation in the bimetallic oxide system, and to determine the influence of chemical composition and oxidation state on the reactivity in propane activation.
Bimetallic carbides of the form (Mo1-xVx)2C were synthesised by carbothermal reduction of the corresponding h-Mo1-xVxO3 oxide precursors. The reduction was followed by in situ X-ray diffraction and the mechanism was investigated using solid-state kinetic modeling techniques. The reactivity of the resultant carbides for the catalytic dehydrogenation of propane was measured under various conditions including CO2- and H2O-containing feeds. To probe the surface structure-activity relationships, in situ reaction methods were applied as characterisation tools in addition to the standard structural and surface analysis techniques.
The kinetic and structural analysis of carbothermal reduction revealed a strong stabilising influence of the vanadium dopant via modification of the oxygen mobility in the lattice. With respect to the catalytic dehydrogenation of propane, it was observed that vanadium doping increased the initial conversion of propane but decreased selectivity to propylene. In soft-oxidative feeds (CO2, H2O) the carbide surface is oxidised, promoting the dehydrogenation reaction. Notably, Mo2C is an excellent catalyst for the hydrogenation of CO2 via reverse water-gas-shift reaction. In situ XPS experiments correlate propane dehydrogenation activity with an oxycarbide surface modification and alkyl-recombinative products are observed in concert with clear changes in the valence band spectra. Post-mortem analyses of the catalysts by transmission electron microscopy reveal significant surface and bulk restructuring as well as the recrystallisation of metastable phases and inhomogeneous bloating of the structure by aliphatic carbon.
Vanadium is proposed to exert a stabilising influence due to its strongly oxophilic nature, resulting in the formation of V=O moieties which kinetically hinder the mobility of oxygen and carbon through the oxide/carbide lattice. The resulting higher initial activity for propane activation is attributed to the increased activity of sites selective to hydrogenolysis. Hexagonal (Mo/V)2C is proposed to be a reasonable model for bronze-like multi-metal oxide catalysts in propane activation due to the recrystallisation of the metastable fcc carbide structure observed under reaction conditions.

ii

iii
The reducibility of mixed Mo/V oxide materials to carbides and their reactivity in the activation of propane
vorgelegt von Thomas Cotter
Zusammenfassung
Der Effekt von Vanadium auf die chemische Beständigkeit und Reaktivität von Molybdänoxid-basierten Hochleistungskatalysatoren, die in Selektivoxidationen unter hohem Umsatz gefahren werden, wurde an einer Serie von gemischten Mo/V Oxidmaterialien modelliert. Dabei standen folgende Fragen im Mittelpunkt des Interesses:
1. Nach welchem Mechanismus verläuft die Carbidbildung?
2. Welchen Einfluss hat die chemische Zusammensetzung des gebildeten Carbids auf die Aktivierung von Propan an seiner Oberfläche?
Bimetallische Carbide der Form (Mo1-xVx)2C wurden durch carbothermische Reduktion der entsprechenden oxidischen Vorstufen der allgemeinen Zusammensetzung h-Mo1-xVxO3 synthetisiert. Die Reduktion wurde mittels in situ Röntgenbeugung verfolgt und der Mechanismus wurde unter Heranziehung festkörperkinetischer Modelle studiert. Die Reaktivität der erhaltenen Carbide in der katalytischen Dehydrierung von Propan wurde unter verschiedenen Bedingungen, unter anderem auch in Gegenwart von eingespeistem CO2 und H2O-Dampf, getestet. Neben herkömmlichen Struktur- und Oberflächenanalysemethoden, wurden zur Aufklärung von Struktur-Reaktivitätsbeziehungen auch oberflächensensitive in-situ Methoden zur Charakterisierung der Katalysatoren unter Reaktionsbedingungen verwendet. Die kinetische und strukturelle Analyse der carbothermischen Reduktion zeigte einen starken stabilisierenden Effekt der Vanadiumdotierung, die auf eine Veränderung der Sauerstoffmobilität im Kristallgitter zurückzuführen ist. In der katalytischen Dehydrierung von Propan konnte beobachtet werden, dass die Vanadiumdotierung den anfänglichen Umsatz von Propan erhöht aber die Selektivität zu Propen reduziert. In leicht-oxidierender Umgebung (CO2, H2O) wird die Carbidoberfläche oxidiert, was die Dehydrierungsreaktion fördert. Mo2C ist ein hervorragender Katalysator für die Hydrierung von CO2 in der umgekehrten Wassergasreaktion. In situ XPS Experimente zeigen, dass die Aktivität in der Dehydrierung von Propan mit der Umwandlung in eine Oxicarbidoberfläche korreliert und dass Hochtemperatur-Metathese-Produkte gemeinsam mit signifikanten Veränderungen in den Valenzbandspektren beobachtet werden. Die hohe Anfangsaktivität wird der erhöhten Aktivität von carbidischen Zentren für die Hydrogenolyse des Propans zugeschrieben. Die Untersuchung der gebrauchten Katalysatoren durch Transmissionselektronenmikroskopie macht signifikante Oberflächen- und Volumen-Restrukturierungen sowie eine Rekristallisation der metastabilen Phasen und eine Bildung inhomogener, blasenartiger Strukturen durch den aliphatischen Kohlenstoff deutlich. Es wird vorgeschlagen, dass Vanadium aufgrund seiner stärkeren „oxophilen“ Natur als Stabilisator wirkt, indem die Bildung von V=O Gruppen die Mobilität des Kohlenstoffs und Sauerstoffs durch das Oxid/Karbid Gitter kinetisch hemmt.

iv

v
Table of Contents
Chapter 1: Introduction and Overview ................................................................................. 1
1.1 Introduction ................................................................................................................ 1
1.2 Preface ........................................................................................................................ 3
1.3 Aims of this work and thesis structure ..................................................................... 7
1.4 Introduction to early transition metal carbides ........................................................ 9
1.5 Structure of molybdenum carbide .......................................................................... 10
1.6 Synthesis of molybdenum carbide .......................................................................... 12
1.6.1 Temperature programmed reduction (TPR) of metal oxides ................................ 13
1.6.2 Stability .................................................................................................................... 15
1.7 Activation of light alkanes over molybdenum-based catalysts ............................ 16
1.7.1 Conversion of methane to synthesis gas ................................................................ 16
1.7.2 Dehydrogenation Reactions .................................................................................... 18
1.7.3 Isomerisation reactions ............................................................................................ 19
1.7.4 Interaction of light alkanes on supported Mo2C catalysts ..................................... 20
1.7.5 Partial oxidation reactions ....................................................................................... 21
1.8 References ................................................................................................................ 23
Chapter 2: The synthesis of mixed Mo-V carbides ........................................................... 29
2.1 Abstract .................................................................................................................... 29
2.1.1 Introduction .............................................................................................................. 30
2.1.2 Motivation ................................................................................................................ 31
2.1.3 Experimental goals and approach ........................................................................... 32
2.2 Experimental ............................................................................................................ 34
2.2.1 Synthesis................................................................................................................... 34

vi
2.3 Results and discussion ............................................................................................. 39
2.3.1 Hexagonal precursor oxides .................................................................................... 39
2.3.2 Carburisation of hexagonal Mo/V oxides .............................................................. 47
2.3.3 Temperature-programmed reduction-carburisation ............................................... 51
2.3.4 Solid state kinetic analysis of TPR curves ............................................................. 57
2.3.5 Analysis of X-ray diffraction patterns .................................................................... 66
2.3.6 Carbon determination .............................................................................................. 66
2.3.7 Surface area, porosity and microstructure of the resulting carbides..................... 67
2.3.8 Upscaled synthesis of (Mo1-xVx)2C ........................................................................ 72
2.4 Discussion ................................................................................................................ 74
2.5 Summary .................................................................................................................. 77
2.6 References ................................................................................................................ 79
Chapter 3: Reactivity of propane over Mo/V carbides I: ......................................................
Catalytic reactivity and temperature programmed studies .................................... 83
3.1 Abstract .................................................................................................................... 83
3.2 Introduction .............................................................................................................. 84
3.2.1 Motivation ................................................................................................................ 86
3.2.2 Experimental goals and approach ........................................................................... 88
3.2.3 Previous studies on Mo2C ....................................................................................... 89
3.3 Experimental ..........................................................................................................100
3.3.1 Experimental setup ................................................................................................100
3.3.2 Experimental procedure ........................................................................................103
3.3.3 Notes on catalyst characterisation ........................................................................105
3.4 Results ....................................................................................................................106
3.4.1 Dehydrogenation vs. oxydehydrogenation vs. steam dehydrogenation .............106
3.4.2 Propane activation in H2 ........................................................................................109
3.4.1 Propane activation in H2/H20 ................................................................................117
vii
3.4.2 CO2 as an alternative oxidant source ....................................................................123
3.4.3 Reverse water-gas shift over Mo2C ......................................................................124
3.4.4 Temperature-programmed reduction-carburisation reaction ....................................
– H2/C3H8 over h-Mo1-xVxO3 ...............................................................................125
3.5 Discussion ..............................................................................................................129
3.5.1 Reactions of propane/hydrogen over carbide surfaces ........................................131
3.5.2 Reactions of propane/steam (or CO2)/hydrogen over carbide surfaces .............135
3.6 Summary ................................................................................................................136
3.7 References ..............................................................................................................138
Chapter 4: Reactivity of propane over Mo/V carbide II:.......................................................
Surface reactivity studies and post-catalytic characterisation ............................145
4.1 Abstract ..................................................................................................................145
4.2 Introduction ............................................................................................................146
4.2.1 Motivation and experimental goals ......................................................................147
4.2.2 Previous studies and literature review ..................................................................147
4.3 Experimental ..........................................................................................................160
4.3.1 Raman studies ........................................................................................................160
4.3.2 XPS ....................................................................................................................161
4.3.3 TEM ....................................................................................................................162
4.4 Results and discussion ...........................................................................................163
4.4.1 Raman studies of fresh and used catalysts ...........................................................163
4.4.2 In situ Raman .........................................................................................................167
4.4.3 XPS studies ............................................................................................................169
4.4.4 TEM study of Mo/V materials after reaction in H2/C3H8 ...................................182
4.5 Discussion ..............................................................................................................192
4.5.1 Raman microscopy studies ....................................................................................192
4.5.2 XPS studies ............................................................................................................193
4.5.3 TEM studies ...........................................................................................................195
viii
4.6 Conclusions ............................................................................................................195
4.7 References ..............................................................................................................197
Chapter 5: Summary and Conclusions .............................................................................201
5.1 Summary of achieved project goals......................................................................201
5.2 The synthesis of Mo/V carbides ...........................................................................202
5.3 The reactivity of Mo/V carbides ...........................................................................203
5.4 Characterisation of Mo/V carbides .......................................................................205
5.5 Conclusions ............................................................................................................206
Appendix A: Acknowledgements for permission to reprint published material ..........211
List of Figures .......................................................................................................................215
Chapter 1 ..........................................................................................................................215
Chapter 2 ..........................................................................................................................215
Chapter 3 ..........................................................................................................................217
Chapter 4 ..........................................................................................................................220
1
Chapter 1: Introduction and Overview
1.1 Introduction
The catalytic properties of a given material depend upon the chemical and physical
nature of the surface as well as the chemical environment and temperature. These
conditions determine the dynamic nature of the catalyst surface and control the
subsequent; adsorption, bond-breaking, diffusion and bond-forming processes. The
interplay of thermodynamic and kinetic processes at the nanoscale can mean that the
activity of a single catalytic site for an undesired pathway exceeds that of the desired
pathway by many orders of magnitude. The implications of this are such that the
consideration of all possible surface species must be taken into account when
modeling the kinetics of a reaction, and that small inhomogeneities in the chemical
potential of a system may lead to measurable differences in reactivity.
The selective or partial oxidation of light hydrocarbons is an increasingly important
field in industrial heterogeneous catalysis, and molybdenum and vanadium-based
oxide materials have long been recognised as key components owing to their manifold
structural and electronic complexity.[1, 2] Oxydehydrogenation and partial oxidation
reactions already play an important role in this emerging chemical economy.[1] On an
industrial scale at high conversions these catalysts are subject to a wide range of
conditions which can vary considerably in chemical potential and composition as well
as temperature.[3] From an extensive body of research it is recognised that these
influences control the oxidation state at the surface and subsequently the phase
composition of the catalyst active surface.[4, 5]
In Table 1.1 the partial and total oxidation reactions for propane and butane are listed
along with their enthalpies of formation and the adiabatic temperature change in the
reaction mixture. In the oxidation reactions of these two alkanes it can be seen that
even the selective (dehydrogenation) pathway is highly exothermic and results in a
considerable adiabatic temperature rise. This generated heat energy serves to greatly
increase the local temperature and greatly decrease the oxygen concentration over an
atomic area scale. Locally, the conditions are vastly different from that observed for
the integrated bulk of the catalyst. Subsequently it can be expected that the catalyst
surface responds dynamically by means of electron exchange and potentially atomic

2
rearrangement as well. On a mesoscopic scale, this phenomenon is referred to as ‘hot
spot’ formation.
Table 1.1: Partial and total oxidation reactions of propane and butane with enthalpy and
adiabatic temperature change.
In the case of partial oxidation reactions, it can be expected that the chemical potential
over local areas will average out and hypoxic areas will be rapidly reoxidised upon
the introduction of oxygen, however, this is not necessarily the case. In any plug-flow
gas reactor there is necessarily a gradient of chemical potential ranging from the inlet
conditions to outlet conditions, which may be at complete oxygen conversion and at
high concentrations of product gases.
It is demonstrated in literature regarding partial oxidation reactions that conversion of
oxygen in fixed bed reactors results in a strongly varying profile of reactive
atmosphere along the direction of gas flow.[6, 7] Under conditions of total oxygen
consumption it is evident that the gas potential of the atmosphere will become
reducing, however, this phenomenon is widely ignored in studies which cite partial
oxygen conversion in order to remain in a regime whereby the reaction kinetics may
be analysed by conventional means. Several studies by Sinev and others, however,
point to the persistent presence of hydrogen (not commonly measured in catalytic
studies) in reactions in which only partial conversion of oxygen is demonstrated.[8-10]
These studies as well as others suggest that the conventional kinetic models which
integrate over the entire reactor do not account for all observed species in these
reactions. On a mesoscopic scale, highly exothermic total oxidation reactions in the
often rich mixtures applied may hypothetically result in the generation of transient
Reaction ∆H°, kJ/mol ∆Tad, °C
C3H8 + ½O2 → C3H6 + H2O -117 1000
C3H8 + 1½O2 → 3CO + 4H2 -226 900
C3H8 + 5O2 → 3CO2 + 4H2O -2050 2800
C4H10 + ½O2 → C4H8 + H2O -117 800
C4H10 + 2O2 → 4CO + 5H2 -569 1700
C4H10 + 6½O2 → 4CO2 + 5H2O -2636 2700

3
and dynamic pockets of reduced surface species which are easily reoxidised upon
cooldown and are also not evident spectroscopically.
Figure 1.1: Schematic diagram of a partial oxidation reactor at high conversion.
Vanadium substituted molybdenum carbide (α-Mo2C) is chosen as a model for a
highly reduced catalyst for the reasons that molybdenum and vanadium are widely
found as a components in oxidation catalysts, such as Mo5O14-type catalysts for
acrolein oxidation, and more recently the novel class of MoVNbTeOx materials for
the partial oxidation of propane to acrylic acid.[11, 12] Furthermore, because the
chemistry of Mo2C is now widely studied there exist a number of studies detailing the
synthesis and structural characterization of such materials.[13-15]
1.2 Preface
The partial oxidation of paraffins to industrially useful oxygenates has been studied
intensively over the last twenty-five years.[16] A number of industrially important
advances have been made in this field but most still rely on alkene feedstocks which
are generally derived from non-renewable petrochemical resources. A currently
applied and industrially important reaction in this class is the partial (amm)oxidation
of propene to acrylic acid and acrylonitrile. To meet the growing demands for such
materials, more readily available and renewable feedstocks must be considered.

4
Development of catalytic systems for the direct oxyfunctionalisation of propane to
acrylic acid is therefore an important step in the progression of this field.
With respect to the selective oxidation of light alkanes over reducible oxides (i.e. Mo,
V), there are a number of mechanisms and pathways proposed in the literature.
However, it is generally agreed that first step of oxyfunctionalisation is the oxidative
dehydrogenation of the substrate alkane.[1] For example, in the case of the selective
oxidation of propane to acrylic acid, propane is initially dehydrogenated and the
propene reacts further to the oxygenated product, in this case acrylic acid.
C3H8 → C3H6 → C3H4O2
However, for considering a simplified surface redox chemistry in such reactions we
may consider the initial oxidative dehydrogenation (ODH) alone. The efficient ODH
of light alkanes has long been a goal of researchers and industry and as a result many
potential catalysts for this process are being explored. The catalysts currently being
developed with the goal of industrialization can be divided into two categories: [1,17, 18]
• Redox catalysts based on oxides of transition metals such as: Mo, V, W. These
are active at relatively low temperatures (350-400°C)
• Non-redox metal oxide catalysts such as alkaline-earth and rare-earth oxides
(also B, Sn, and Si). Generally active at temperatures above 500°C
For the ODH of propane, Mo/V-based oxides are most commonly used and indeed
MoVTe catalysts are high performing materials for the ODH of propane under the
appropriate conditions.[19] In the case of ODH of propane to propene, the overall
reaction can be characterised by the following general steps which have been
surmised from previous studies.[18]
1. Propane adsorption/interaction with the catalyst surface
2. Scission of the methylene C-H bond resulting in an isopropyllic radical
species
3. Reaction of a methyl C-H bond with a neighbouring oxygen atom resulting in
β-elimination and the formation of a C=C bond
4. Desorption of propene
5. Elimination of H2O from the catalyst surface resulting in an oxygen vacancy
6. Reoxidation of the catalyst surface

5
The general steps outlined above, along with the diffusion of educts and products to
and from from the catalytic site make up the basis of our understanding of these
reaction processes and allow us with an extension of theory to develop appropriate
rate equations and kinetic models for the oxidative dehydrogenation (ODH) of light
alkanes.
There are five commonly cited kinetic models which are used to describe the kinetics
of light alkane ODH: a) Eley-Rideal (ER) model; b) Langmuir-Hinshelwood (LH)
model; c) The ‘rake’ model; d) Mars Van Krevelen (MVK) or redox model and; e) the
power law model. Of these models, the first two (ER, LH) involve the direct reaction
of oxygen with the adsorbed alkane either on the surface (LH), or from oxygen in the
gas phase (ER). These models are largely discounted because they involve the direct
reaction of oxygen with the alkane or the activation of oxygen on the surface to form
a peroxide species, the first of which is spin-prohibited while the second is indicated
to result in deep oxidation.[20, 21] Of the remaining models, the ‘rake’ model and the
power law models are purely phenomenological approaches to describe the rates of
reaction and can be used to determine rate constants for theoretical reactions steps in
the absence of a true mechanistic model.
The remaining model which is very commonly applied in the case of selective
oxidation over reducible metal oxide catalysts[22] is the Mars Van Krevelen model,
sometimes referred to as the redox model.[23] This approach makes the assumption
that the oxygen of reaction is derived from the lattice and that the subsequently
reduced surface is reoxidised by oxygen which is adsorbed in the vicinity of the
reduced site. The concerted action of the catalyst surface is such that in a steady state:
rate of O2 adsorption = rate of surface reduction
This model is claimed to be supported by studies for various catalyst systems[24, 25] but
it does not provide a complete understanding of the mechanism of reoxidation and is
frequently cited without strong evidence. Further to this, the model can be criticised
for failing to describe elementary steps adequately. Dioxygen must be adsorbed on the
surface and activated before it dissociates and is incorporated into the vacancies of the
solid.

6
The process must also be reversible, allowing the oxygen to diffuse out of the surface
and react with adsorbed gaseous species. In some catalytic studies it is purportedly
shown, by isotopic labeling and transient analysis of products, that the redox
vacancies may be replenished from the oxygen in the bulk of the catalyst.[24, 26, 27] This
is contrary to the assumption of a direct reoxidation of the surface vacancy and there
appear to be disagreement as to the validity of this mechanism in some selective
oxidation reactions which is as yet unresolved.[28, 29]
It has been observed that the surface of the well-studied MoVTeNbOx catalyst is
dynamic and changes under reaction conditions to give the active surface.[30] In
general the complexity of the material has defied attempts to elucidate the catalytic
mechanism however it is widely believed that the redox chemistry of vanadium is the
key to its performance. In the standard models of propane selective oxidation over
transition metal oxides there are commonly discussed mechanisms for the formation
of propylene, acetone, acrolein, acrylic acid and ‘COx’. However the C2 oxygenate,
acetic acid, is commonly the second most abundant oxygenate and under certain
condition maleic anhydride may be observed in the outlet gas.[19, 31, 32] There is no
commonly accepted mechanism to account for this C-C bond breaking and formation.
Further to this, the balance of CO/CO2 in the outlet gas of such catalyst systems
freqently favours CO despite strongly oxidising conditions. It is hereby proposed that
there may be other contributing phases or sites (possibly micro-crystalline or
amorphous) that participate in these catalytic reactions. A possibility exists that
carbides or nitrides formed during preparation (from NH4+), or under reaction
conditions (C3H8), may contribute to the overall activity of the catalyst.[9]
Metal carbides are well known to undergo facile surface oxidation[33-37] and
molybdenum carbide has been explored as a potential catalyst in a number of
hydrocarbon transformation reactions.[38-43] Mo2C may therefore provide a non-oxidic
support material by which we can understand not only aspects of the surface reactivity
of complex oxides in reduced/carburised states, but also draw some conclusions
regarding oxygen mobility in the oxide lattice as we study the formation of these
materials and their catalytic activity in conditions relevant to selective oxidation
catalysis.

7
1.3 Aims of this work and thesis structure
The overall goal of this project is to develop an understanding of the
reduction/carburisation process with respect to Mo-based multi-metal oxide (MMO)
catalysts used in alkane and alkene selective oxidation processes. Of particular
interest is the catalyst class of MoVTe oxides used for the partial oxidation of propane
to acrylic acid. By generating a simplified model for the MoVTe catalyst it can
subsequently be studied in the TPR-carburisation and for reactivity of the reduced
system in the activation of propane. To simplify this goal it may be broken down into
parts:
• To synthesise a series of well-defined mixed-metal oxide precursors for
carburisation
• Characterise the precursors and understand the carburisation process with respect
to the dopant element
• Prepare the model carbide system in sufficient quantities for characterisation and
catalytic testing
• Design and construct an apparatus for the catalytic testing of the carbides
• Test the catalytic properties of the series of catalysts and gain an insight into the
nature and influence of the secondary metal constituent
• Characterise the catalysts using in situ techniques to gain a mechanistic
understanding of the catalytic properties with relation to those observed for the
functioning MoVTe system
In order to address this broad thesis, the realisation of the above goals is described
over three chapters with each chapter constructed as a self-contained story;
containing: introduction, literature review, methods, results, discussion and
conclusions. The structure is as follows:
Chapter Two — The synthesis of mixed Mo-V carbides is a study of the reduction-
carburisation of mixed Mo/V oxides. The experimental section describes the synthesis
and characterisation of molybdenum carbide materials as well as the measurement of
kinetic data with regards to the reduction-carburisation. Structural and mechanistic
aspects of the reactions are discussed with reference to the solid-state kinetics.

8
Chapter Three — Reactivity of propane over Mo/V carbide I: Catalytic reactivity and
temperature programmed studies is concerned with the measurement and analysis of
the catalytic properties of molybdenum carbide materials in the activation of propane.
The various reaction pathways are discussed with respect to the changing dynamics of
the surface and also the influence of differing feed compositions. This chapter is also
tied to Chapter Two by a series in situ oxide carburisation experiments (temperature-
programmed reactions) which explore the simultaneous activation of propane and
carburisation of the model oxide material.
Chapter Four — Reactivity of propane over Mo/V carbide II: Surface reactivity
studies and post-catalytic characterisation seeks to connect the observed reactivity of
the Mo/V materials with a picture of the surface and bulk chemistry and also
electronic structure. The final chapter is connected to Chapters 2 & 3 by the
discussion of alkane activation and post-mortem characterisation of the carbides and
oxides after high temperature reaction in propane environments.
Chapter Five — Summary and Conclusions gives a brief synopsis of each chapter’s
results followed by a summary of the combined findings and the conclusions that can
be drawn from this work.
Although finding relevant connection to the multi-metallic oxide MoVTe is a
motivation of this thesis, it must be stressed here that it is not a goal of this work to
definitively prove the existence of a carbidic overlayer in such materials. Nor is it to
explore the reactivity of the MoVTe system. The two primary goals of this thesis are
principally to: discuss the mechanistic aspects of carbide formation in the
aforementioned Mo/V oxides and thereby relate the influence of carbon potential and
chemical complexity to such oxidic materials. Secondly, it is to determine the
reactivity of these reduced carbidic systems with respect to alkane activation in
conditions which bear some relevance to selective oxidation catalysis. To achieve
these goals and develop a less ambiguous understanding of the surface processes has
frequently required the use of conditions more forcing than those found in oxidation
catalysis. It is stressed that these conditions are chosen purely because they reflect and
preserve the extremes of chemical potential which may be found in the boundaries of
the reaction.

9
1.4 Introduction to early transition metal carbides
Early transition metal carbides have been shown to have promising catalytic
properties in a number of hydrocarbon transformation reactions.[44, 45] Since Levy and
Boudart first demonstrated the Pt-like catalytic properties of WC,[46] there has been
increasing interest in these materials as substitutes for noble metals in industrial
catalytic reactions. The progress of this research has been primarily driven by
innovation in the synthesis of such carbides and nitrides, allowing researchers to make
materials with reproducible physical properties and chemical compositions. Formerly,
transition metal carbides were formed only at very high temperatures by direct
combination of the component elements. This inevitably produces materials with low
surface area, as the temperatures involved generally lead to extensive sintering, and
relatively high levels of carbon impurity. Lee et al. successfully developed a
temperature programmed reduction (TPR) method[47] that allowed for carbide and
nitride materials of appreciably high surface area to be formed under a wide range of
conditions. Many catalytic studies since have made use of this technique to synthesise
transition metal (TM) carbides and nitrides material. More recently, a number of
groups have made group V and VI carbides via the high-temperature decomposition
of various solution-based precursors.[48-50] This technique looks to be promising
because the precursor solutions provide a definite stoichiometry which can be
manipulated before treatment. Also, there is potential for the facile synthesis of mixed
metal precursors.[51-57] Various other synthetic techniques include; chemical vapour
deposition,[58, 59] organometallic-based syntheses,[60] and solid state substitutions.[61]
The reactions of light hydrocarbons over group V and VI TM carbides are highly
varied and the reported catalytic activities include; Fischer-Tropsch chemistry,[62]
isomerisation,[44, 63] hydrodesulfurisation (HDS),[39, 53, 64, 65] hydrodenitrogenation
(HDN),[54, 66] hydrogenolysis,[67, 68] oxidative dehydrogenation,[69, 70] hydrogenation,[71]
methane reforming,[72-74] and dehydroaromatisation.[75-77] The catalytic activity of
carbides in some cases exceeds that of the noble metals and they have been shown to
be resistant to poisoning by reaction byproducts such as carbon and sulfur.[78-80]
In contrast to industrially produced carbides which are relatively inert, high surface
area TM carbides are reactive to oxygen and must be passivated to prevent extensive
oxidation. Numerous studies have been carried out probing the active surfaces and the

10
conditions under which they are formed but it seems to be consensus that excess
carbon must be removed to fully activate the catalyst and that oxidation of the carbide
surface dramatically reduces catalytic activity in many cases.
The use of characterisation techniques for transition metal carbides is relatively
limited in the literature, perhaps owing to the fact that the unsupported material is
opaque to many spectroscopic techniques. X-ray diffraction (XRD) is widely used as
a tool to confirm the bulk composition in many papers and its use in situ is discussed.
X-ray absorption fine structure (XAFS) can be very useful in confirming the extent of
reaction throughout the solid and it is discussed with regards to supported and
unsupported materials. Other bulk analyses include the use of differential thermal
analysis (DTA), usually in conjunction with thermogravimetry (TG) and mass
spectroscopy (MS). These techniques may be used in situ during the carburisation
reaction or in various oxidative tests. Further methods primarily involve probing the
surface composition and structure using spectroscopic techniques such as: X-ray
photoelectron spectroscopy (XPS), UV, Raman, diffuse reflectance infrared Fourier
transform spectroscopy (DRIFTS), and reflection absorption infrared spectroscopy
(RAIRS). Some of these techniques commonly make use of the adsorption of small
probe molecules in order to titrate/investigate the active sites on the catalyst surface.
1.5 Structure of molybdenum carbide
Early transition metals of the groups; IVa (Ti, Zr, Hf), Va (V, Nb, Ta), VIa (Cr, Mo,
W), VIIa (Mn), and VIII (Fe, Co, Ni) all react under certain conditions to form stable
carbides.[81] These materials have been investigated thoroughly due to their unique
physical properties and the role which they play in the field of metallurgy. More
recently this has role has grown to include phenomena such as superconductivity and
catalysis. These binary compounds are often termed ‘refractory materials’ and in
general such transition metal carbides are known for their:
i. Extreme hardness/brittleness
ii. High melting points
iii. Good electrical and thermal conductivities
The first two features, i. and ii., are reminiscent of the properties of covalently or
ionically bonded compounds while iii., along with the observation that many carbides

11
exhibit non-stoichiometry, would suggest that the bonding is metallic. In reality the
properties reflect a mixture of these characteristics and as such are not easily
understood purely on the basis of electronic structure.
With respect to the simple binary carbide structures observed for these elements the
atomic arrangement can be in part determined by Hägg’s rule which states that the
structure depends on the ratio of the radii of the nonmetal (rx) and metal (rm) atoms,
respectively. For r = rx/rm < 0.59, the following structures may arise: face-centered
cubic (fcc), hexagonal closed packed (hcp) or simple hexagonal (SH). The carbon
atoms reside in the large interstitial sites of octahedral or cubic prismatic geometry.
For r > 0.59 the metallic arrangement distorts to accommodate the larger nonmetal
atoms and preserve metal-metal interactions. Further to this, Engel-Brewer theory
may be used to predict the structures of some compounds according to the electronic
structures of the parent metals. However, overall there exist a range of structures for
each element and no simple rules exist to predict every possibility.
Molybdenum along with tungsten is known to form simple carbides with varying
structures depending upon the synthesis conditions. Due to the low scattering power
of interstitial C atoms, a search of the historical literature reveals a wide variety of
binary phases for the Mo/C system, some of which have been duplicated. In reality
there are a range of stoichiometries and degrees of ordering in many of the crystal
systems, however, a synopsis of the primary crystalline phases is given in Table 1.2.
Table 1.2: Six known molybdenum phases.[81]
Phase Metal lattice
structure Space Group
C atom position
Stacking sequence
Remarks
α-Mo2C ortho. Pbcn Oct. ABAB
β-Mo2C hcp P63/mmc Oct. ABAB α-W2C
η-MoC1-x hcp P63/mmc Oct. ABCACB (η-Mo3C2)
α-MoC1-x fcc Pm3m Oct. ABCABC β-W2C x = 0.54
γ-MoC sh P6m2 Prism AAAA WC
γ’-MoC hcp P63/mmc Oct, and
prism AABB

12
The most stable and commonly reported modification is α-Mo2C which is
differentiated from β-Mo2C by a slight orthorhombic distortion of the metal lattice,
resulting in a ‘pseudo-hexagonal’ lattice. β-Mo2C is a high temperature variation of
this phase in which the lattice is purely hcp, however, in the literature α- & β- are
frequently interchanged and in practice the phases are not easily distinguishable. Of
the phases in Table 1.2, two are commonly found in the literature regarding catalysis
— orthorhombic/pseudo-hexagonal α-Mo2C (often referred to as β-Mo2C), and face-
centred cubic α-MoC1-x (see Figure 1.2). For ease of reference, these phases will be
referred to as hcp and fcc, respectively, hereafter. In a large number of publications
these distinctions are either not referred to or contradict other sources. This confusion
almost certainly arises due to the indefinite stoichiometries and the fact that the fcc
carbide is often formed with a stoichiometry very close to Mo2C. These problems are
further exacerbated by a lack of consistency in the XRD reference diffractograms. A
full discussion of the structural characteristics of molybdenum carbide is beyond the
scope of this literature review at present but further analysis will be given as
appropriate.
Figure 1.2: crystallographic views of the structures of; (left) orthorhombic αααα-Mo2C and
(right) fcc αααα-MoC1-x. Note that αααα-MoC1-x displays a Mo:C stoichiometry of 1:1 and
represents all possible positions for interstitial carbon in the structure.
1.6 Synthesis of molybdenum carbide
Metal carbides are traditionally used in tool manufacture and in mechanical
applications where considerable hardness is required. Most commonly the materials
are synthesised by combining the native elements at very high temperatures, resulting
in a heavily sintered product. These materials are not useful in catalysis as they

13
exhibit low surface areas and significant impurities which serve to reduce the overall
activity. For the purpose of catalysis, transition metal carbides with high purity and
high surface area must by synthesised. This can be done in several ways; the
decomposition of organometallic precursors,[60] chemical vapour deposition using
volatile precursors,[58, 59] heat-treatment of solution-based precursors,[82-85] and among
others, the reduction and carburization of metal oxide powders.[47] The final two
methods are of particular interest because they have been shown to produce high
surface area materials and are also processes which are potentially scalable.
1.6.1 Temperature programmed reduction (TPR) of metal oxides
For the last twenty years the principle method that researchers have used to produce
high surface area carbides is the temperature-programmed reaction (TPR) of precursor
metal oxides. In a landmark paper, Lee et al. outline the synthesis of molybdenum
carbide and molybdenum nitride from MoO3.[47] The resultant carbide and nitrides
exhibit high surface areas (50-200m2g-1), consistent stoichiometry, and are largely
free from graphitic carbon. This is achieved using temperature programmed reduction
(TPR) under a CH4/H2 stream (NH3 in the case of nitrides) of a high purity starting
material. All products are characterized by XRD, BET surface area measurement, and
the reaction monitored using gas chromatography (GC). It is shown that the reduction
occurs in two steps — the first being the reaction MoO3 → MoO2, and the second
corresponds to the synthesis of the carbide, MoO2 → Mo2C (see Figure 1.3).
Figure 1.3: From left, crystallographic representations of: αααα-MoO3, MoO2, and ββββ-Mo2C.
The second reduction is dependent on the ratio of CH4/H2 used: a high ratio (up to
100% CH4) will result in a higher surface area material but there will be deposition of
graphitic carbon, at lower ratios the deposition of coke is less favourable but the
14
surface area is lower. At very low ratios, it is observed that the oxide is reduced to Mo
metal.
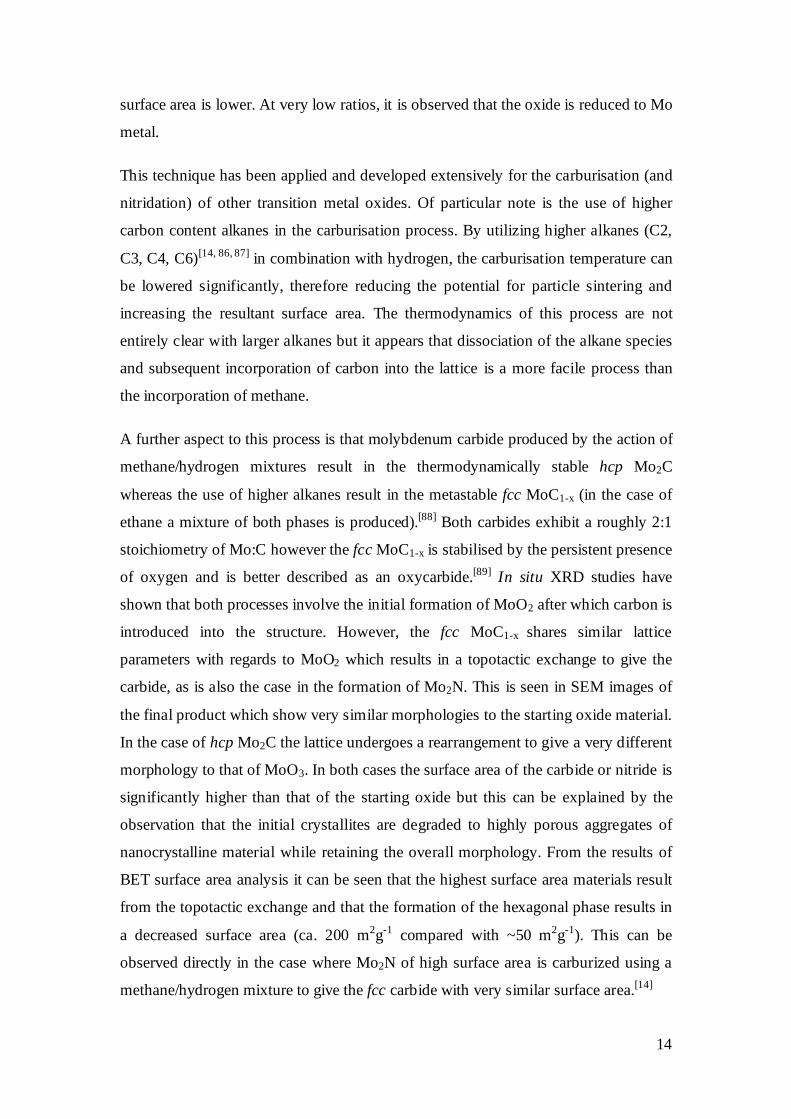
This technique has been applied and developed extensively for the carburisation (and
nitridation) of other transition metal oxides. Of particular note is the use of higher
carbon content alkanes in the carburisation process. By utilizing higher alkanes (C2,
C3, C4, C6)[14, 86, 87] in combination with hydrogen, the carburisation temperature can
be lowered significantly, therefore reducing the potential for particle sintering and
increasing the resultant surface area. The thermodynamics of this process are not
entirely clear with larger alkanes but it appears that dissociation of the alkane species
and subsequent incorporation of carbon into the lattice is a more facile process than
the incorporation of methane.
A further aspect to this process is that molybdenum carbide produced by the action of
methane/hydrogen mixtures result in the thermodynamically stable hcp Mo2C
whereas the use of higher alkanes result in the metastable fcc MoC1-x (in the case of
ethane a mixture of both phases is produced).[88] Both carbides exhibit a roughly 2:1
stoichiometry of Mo:C however the fcc MoC1-x is stabilised by the persistent presence
of oxygen and is better described as an oxycarbide.[89] In situ XRD studies have
shown that both processes involve the initial formation of MoO2 after which carbon is
introduced into the structure. However, the fcc MoC1-x shares similar lattice
parameters with regards to MoO2 which results in a topotactic exchange to give the
carbide, as is also the case in the formation of Mo2N. This is seen in SEM images of
the final product which show very similar morphologies to the starting oxide material.
In the case of hcp Mo2C the lattice undergoes a rearrangement to give a very different
morphology to that of MoO3. In both cases the surface area of the carbide or nitride is
significantly higher than that of the starting oxide but this can be explained by the
observation that the initial crystallites are degraded to highly porous aggregates of
nanocrystalline material while retaining the overall morphology. From the results of
BET surface area analysis it can be seen that the highest surface area materials result
from the topotactic exchange and that the formation of the hexagonal phase results in
a decreased surface area (ca. 200 m2g-1 compared with ~50 m2g-1). This can be
observed directly in the case where Mo2N of high surface area is carburized using a
methane/hydrogen mixture to give the fcc carbide with very similar surface area.[14]

15
The different catalytic activities/stabilities of these two phases have not been explored
thoroughly but the evidence that fcc MoC1-x is stabilized by oxygen inclusion and may
be more prone to forming oxycarbides helps to explain the observed phase instability
at high temperatures.[89] Furthermore it has been observed that the fcc carbide is more
effective for dehydrogenation whereas the hcp phase exhibits greater performance in
reforming reactions or oxidizing conditions.[90]
1.6.2 Stability
In recent papers by Li et al., the surface reactivity of Mo2C/Al2O3 with regards to
oxidation and subsequent reduction is probed by in situ FTIR spectroscopy.[91] In an
initial study, alumina supported Mo2C was synthesised by TPR method in a quartz
cell whilst monitored using FTIR spectroscopy. This allowed characterization of the
freshly synthesised Mo2C surface by monitoring the CO stretching frequency. As a
control, the experiment was repeated in a conventional fashion and the product was
passivated under a 1% O2/N2 mixture at RT and then activated under H2 at 873K. The
IR spectrum of each material was very different with respect to the CO stretching
frequency. The freshly prepared material had a steady, strong absorbance at 2054cm-1
indicating that the CO molecule was adsorbed linearly on a Mo surface site and that
the Mo was in a reduced state (Moδ+, 0 < δ <2). CO adsorbed on the passivated
sample had a much higher stretching frequency (2180 cm-1) indicating a more heavily
oxidized state. The spectra of the fresh sample also bore some resemblance to similar
studies of group VIII metals adding credence to the idea that early TMCs resemble
noble metals in their electronic structure and activity.
The effects of carburisation temperature and the time at which the final temperature is
held were also shown to have a strong influence on the adsorption of CO. XPS studies
of both the passivated and subsequently reduced catalyst material back up the FTIR
data, showing that even in the reduced form, the majority of the Mo sites are in a high
valence state (Mo+6 and Mo+4). This indicates that the surface layer is predominantly
oxycarbidic. Although it was accepted that activation at elevated temperatures (873K)
using H2 was effective in removing the surface oxide, it was demonstrated by TPR-
MS that the loss of interstitial carbon also occurs. Lower temperatures were
ineffective at entirely reducing the oxide layer. Hence, it was concluded that
passivation of Mo2C using molecular oxygen as the source was too severe and

16
resulted in a surface which could not be fully reduced without losing the original
surface. In a previous communication, Li et al. have established that the reactivity of a
similar nitride material is analogous.[91]
In a follow-up paper[34] Li et al. worked around the question of passivation and
compared three potential passivating systems for the alumina-supported Mo2C. It was
found that by replacing oxygen with water or carbon dioxide as the oxidant, it was
possible to produce a mild oxidic layer that could subsequently be reduced more
easily. FTIR studies of CO molecules over oxygen-passivated material and
CO2/water-passivated material show a significant difference in their ability to reattain
the low oxidation state in surface Mo atoms characteristic of freshly prepared
carbides.
These results are in agreement with the findings of Reimer et al., who in an extensive
article in 1987 have explored the syntheses of Mo2N, hcp Mo2C, and fcc MoC1-x.[67, 92]
In the article they prepare the nitride using the TPR method of Volpe and Boudart
(1985)[13, 93] and the carbides by the carburisation of Mo powder and Mo2N,
respectively. The question of removing surface oxygen and/or carbon is dealt with
and it is concluded that surface carbon may be removed by treatment with oxygen but
at the expense of the inclusion of oxygen atoms to the carbide lattice. Likewise the
removal oxygen, it is stated, cannot be effected without significant removal of carbide
carbon atoms from the lattice. However, it is considered to be possible to remove
oxygen from the near surface region by heat-treatment with a CH4/H2 mixture at
elevated temperatures.
1.7 Activation of light alkanes over molybdenum-based catalysts
1.7.1 Conversion of methane to synthesis gas
The conversion of methane to synthesis gas is catalysed over high surface area Mo
and W carbides. It is discussed as an attractive alternative to Ni-based catalysts, which
suffer from coke build up and eventual deactivation, and comparable in
activity/selectivity to some platinum-group metals whilst being cheap to produce.
The conversion of methane to synthesis gas over Mo and W carbides was
demonstrated by Green et al. using dry reforming (carbon dioxide), partial oxidation

17
(oxygen), and steam reforming.[72, 94-96] A stoichiometric feed ratio is used at elevated
pressure. The catalyst material was prepared by TPR of high surface area metal oxides
and the reactions are carried out in modified microreactor.
The activity of the catalysts in the dry reforming of methane is largely dependent on
the pressure and gas hourly space velocity (GHSV) of reactant mixture. At ambient
pressure the catalysts are deactivated after a short time due to oxide formation
(observed via in situ XRD analysis). At higher pressures (~8 bar), the system is stable
as observed over 60-70 hours. Mo2C was the more effective of the two carbides,
comparable in relative activity to Rh-based catalysts.
The carbides were also studied in the partial oxidation of methane to carbon
monoxide. In the presence of oxygen at elevated temperatures and ambient pressure
the catalyst materials deactivated. This was overcome by operating at an elevated
pressure and with an initial gas mixture of CH4/CO2 which was switched to a CH4/air
mixture over the course of an hour. Under these conditions, Mo2C, WC, and 5%
Mo2C/Al2O3 catalyst systems catalysed the partial oxidation of methane with high
selectivity and exhibited stability over the course of 12 hours.
Similarly in the steam and mixed reforming conditions, the catalysts performed ably,
showing high selectivities for the production of hydrogen and carbon monoxide. It
was found that elevated temperatures and optimised flow rates prevented any
detectable deterioration of the catalyst activity over the course of 72 hours.
It is seen throughout the study that the carbide catalysts are deactivated at ambient
temperature due to oxide formation, and that this mechanism is suppressed at elevated
pressures. The phenomenon can be explained by the relative rates of oxidation and
carburization.
Mo2C + 5CO2 = 2MoO2 + 6CO (rate = k1) — (1)
2MoO2 + 5CH4 = Mo2C + 4CO + 10H2 (rate = k2) — ( 2)
In Figure 1.4 it can be seen that the consumption of the feed gases CH4 and CO2 drops
dramatically with increasing GHSV. The lowest GHSV remains active for just over
1000 minutes before deactivating. The diamond points represent an increased GHSV

18
but with a diluted feed stock such that the molar quantity of reactants is identical to
the optimised conditions.
Figure 1.4: Effect of GHSV on the stability of the Mo2C catalyst at 1123K and 1 bar. Open
symbols = χχχχCO2; closed symbols = χχχχCH4. GHSV (h-1):○ — 1.91 x 10³; □ — 3.97 x 10³; ∆ —
6.36 x 10³; ◊ — (1.91 x 10³ + Ar = 8.79 x 10³). Reprinted from [72] with the permission of
Elsevier.
At higher pressure (8 bar) and operating at optimised GHSV, deactivation of the
catalyst material is not observed. From this graph and other experimental data it was
concluded that the reaction rate which governs the rate of carbide oxidation (1) is
faster than that of oxide carburisation (2). At lower GHSVs and higher pressures,
there is an increased contact time which allows the two reactions to reach equilibrium.
1.7.2 Dehydrogenation Reactions
Dehydrogenation is the rate determining step in the partial oxidation reaction of
propane to acrylic acid. This reaction is generally carried out over oxidic catalysts
such as the mixed metal oxide MoVTe system and it represents a fundamental
advance from the use of propene as a feed stock. A number of studies have
investigated carbides for their activity with respect to dehydrogenation reactions and
they appear to show some promise.
1.7.2.1 Molybdenum oxycarbides
MoO3 was reduced under a mixture of butane/H2 at 550°C and found to be active in
the dehydrogenation and simultaneous isomerisation of n-butane.[90] Under the n-

19
butane/H2 stream, the catalytic surface was unstable leading to total carburisation of
the surface layer and subsequent coke deposition. This surface remained active but the
selectivity was entirely towards hydrogenolysis to methane. The addition of steam to
the reactant mixture was found to stabilize the surface composition and prevent
coking, however, a reduction in the catalytic activity was also noted.
1.7.2.2 Supported molybdenum carbides
Solymosi et al. have carried out the dehydrogenation of propane over ZSM-5 and
SiO2 supported molybdenum carbide.[97, 98] In the case of the SiO2 supported material,
dehydrogenation was the dominant reaction and propylene selectivity approached
50% at a conversion of ca. 25%. The selectivity decreased with increasing
temperature which was attributed to deactivation of the catalyst through further
carburisation. The ZSM-5 supported carbide however, showed very low selectivity to
propylene and the principal reactions observed were aromatization and cracking. In
this case, much of the activity could be attributed to the support material ZSM-5
which is selective towards cracking and aromatization in the absence of Mo2C.
Although increased selectivity for aromatization was observed.
1.7.2.3 Vanadium Carbides and Nitrides
Thompson et al. have presented some relevant work on vanadium carbides and
nitrides in the dehydrogenation of butane.[99, 100] V2O5 is reduced using TPR under
CH4/H2 and likewise under NH3 to yield the corresponding carbide and nitride. The
carbide is sub-stoichiometric with the formula V8C7 and the nitride has the formula
VN. In a stream of n-butane/H2 (in He carrier gas), both catalysts displayed an
increased selectivity to the formation of olefins in comparison with Mo2C, which was
highly unselective. The bonding in the compounds was investigated using NEXAFS
and there was seen to be substantial charge transfer from the vanadium to the non-
metal atom. It was suggested that this ionicity, which is not seen in other TM
carbides, was in part responsible for the increased selectivity observed.
1.7.3 Isomerisation reactions
Isomerisation of short chain alkanes (C4–C7) is an important reaction in petroleum
chemistry to increase octane content and produce cleaner-burning fuels. One of the
challenges in this area of chemistry is the development of catalysts that can isomerise

20
n-heptane with high selectivity while minimising hydrogenolysis, or ‘cracking’.
Ledoux et al. have reported high selectivity in the isomerisation of n-heptane over a
Mo2C catalyst which was pretreated in air at elevated temperatures.[44] Prior to this
study, Ribeiro et al. reported the effect of surface oxygen on the selectivity of
tungsten carbide powders in isomerisation reactions.[101, 102] Isomerisation was not
observed on freshly prepared catalysts but it is observed with high selectivity over
oxygen modified carbides. It can be seen from these and other papers that the
reactivity is strongly dependant on the carbidic surface and that varying degrees of
oxidation will modify the selectivity substantially.
1.7.4 Interaction of light alkanes on supported Mo2C catalysts
Recent papers by Solymosi et al., have reported on the catalytic activity of TPR-
prepared β-Mo2C supported on SiO2 and ZSM-5, respectively.[75]
In the former case, the oxidative dehydrogenation of ethane is carried out over a silica
supported catalyst showing high selectivity (90-95%) for the formation of ethylene at
moderate conversion (8-30%). The oxygen source used was CO2 with the
predominant reaction being:
C2H6 + CO2 ↔ C2H4 + CO — (3)
The Mo2C catalyst was prepared according to the method of Boudart et al. and ethane
(12.5% in Ar) was passed over the material at temperatures between 550–690°C. The
partial pressure of CO2 was varied but the most reliable results were obtained for the
ratio C2H6:CO2 = 1:1. At 873K these conditions resulted in selectivity of 87% at 14%
conversion with a turnover rate for ethylene of 2.7 x 10⁻³. By contrast, the precursor to
the carbide material, MoO3 supported on SiO2, showed very little catalytic activity for
the reaction C2H6 + CO2. The conversion rate for similar temperatures was around 3%
with a selectivity of 25-30%. Increasing the flow rate or GHSV decreased the
selectivity to ethylene while increasing the rate of formation of undesirable products.
The more recent paper of relevance by Solymosi et al. details the reactions of propane
over three Mo2C catalyst systems: unsupported β-Mo2C, ZSM-5 supported Mo2C, and
SiO2 supported Mo2C.[97, 98] The interaction of propane and propylene on the surface
of the catalyst was probed using FTIR spectroscopy on a sample of Mo2C/SiO2 at

21
reduced pressures. The results show that propane was physisorbed on the surface at
lower temperatures (150-250K) but at higher temperatures, the spectrum more closely
resembles that of adsorbed propylene. This is supported by temperature programmed
desorption (TPD) measurements in which propane adsorbed onto supported Mo2C is
seen to be converted to propylene and ethylene at higher temperatures.
The catalytic reactivity of the three systems was compared over a range of
temperatures and flow rates. Additionally, the reactivity of the support materials was
tested to provide comparison.
Over bulk β-Mo2C at 600°C, the predominant reaction is dehydrogenation to
propylene. This occurs with ca. 44% selectivity, but with a low conversion (~7%)
which may in part be due to the low surface area of the unsupported material.
The silica-supported catalyst material was tested over the same temperature range and
it was found that initially, the predominant reaction was hydrogenolysis, resulting in
the production of methane and ethane. After some time on line, the dehydrogenation
reaction became more prevalent and propylene was produced with a selectivity of
50%. It is suggested that the hydrogenolysis reaction is inhibited by coke deposition
on the catalyst surface.
The reactions of propane over ZSM-5 and Mo2C/ZSM-5 were found to be quite
different. On untreated ZSM-5, from around 500°C, dehydrogenation and cracking
reactions predominate. Above 550°C, however, the production of benzene and toluene
by aromatization reactions is observed. At 700°C the selectivity is at a maximum of
34%. In the Mo2C/ZSM-5 system, however, selectivity of 46% is achieved at the
lower temperature of 600°C with only a slight decrease in conversion. The difference
in the reactivity is attributed to the β-Mo2C activity for dehydrogenation combined
with the ability of ZSM-5 to aromatize the intermediate propylidyne species.
1.7.5 Partial oxidation reactions
Highly relevant to the proposed experimental work is the oxidation of light alkanes
over early transition metal carbide surfaces. Very few studies have been carried out
regarding this reaction but some research of note was performed by Ledoux et al.,
examining the partial oxidation of butane to maleic anhydride over supported

22
vanadium carbide.[103, 104] The carbide was synthesised by depositing a volatile
metallic precursor (liquid V2O5) over a high surface area carbonaceous support. The
system is heated in the absence of oxygen to 1300°C, reducing the oxide to form a
carbon-supported VC catalyst. This surface is then passivated in air resulting in an
amorphous surface layer of vanadium oxycarbide as revealed by HRTEM.
Catalytic tests with butane reveal that the under varying conditions the material
showed some selectivity towards maleic anhydride. Passing an enriched mixture of
butane (O2/Bu = 1.1) over the catalyst resulted in total combustion but a leaner
mixture (O2/Bu = 6), produced maleic anhydride with ca. 30% selectivity at ca. 45%
butane conversion.

23
1.8 References
[1] S. Albonetti, F. Cavani, F. Trifiro, Catalysis Reviews-Science and Engineering 1996, 38, 413.
[2] A. M. El-Awad, E. A. Hassan, A. A. Said, K. M. Abd El-Salaam, Monatshefte für Chemie / Chemical Monthly 1989, 120, 199.
[3] F. Cavani, F. Trifiro, Catalysis Today 1999, 51, 561. [4] J. S. Lee, M. Boudart, Catalysis Letters 1993, 20, 97. [5] R. Schlögl, A. Knop-Gericke, M. Hävecker, U. Wild, D. Frickel, T. Ressler,
R. E. Jentoft, J. Wienold, G. Mestl, A. Blume, O. Timpe, Y. Uchida, Topics in Catalysis 2001, 15, 219.
[6] N. Ballarini, A. Battisti, F. Cavani, A. Cericola, C. Lucarelli, S. Racioppi, P. Arpentinier, Catalysis Today 2006, 116, 313.
[7] R. Horn, N. Degenstein, K. Williams, L. Schmidt, Catalysis Letters 2006, 110, 169.
[8] M. Y. Sinev, G. A. Vorobeva, V. N. Korchak, Kinetics and Catalysis 1986, 27, 1007.
[9] M. Y. Sinev, Z. T. Fattakhova, Y. P. Tulenin, P. S. Stennikov, V. P. Vislovskii, Catalysis Today 2003, 81, 107.
[10] B. Savova, D. Filkova, D. Crisan, M. Crisan, M. Raileanu, N. Dragan, L. Petrov, J. C. Védrine, Applied Catalysis A: General 2009, 359, 55.
[11] P. Botella, B. Solsona, A. Martinez-Arias, J. M. L. Nieto, Catalysis Letters 2001, 74, 149.
[12] P. Beato, A. Blume, E. Girgsdies, R. E. Jentoft, R. Schlogel, O. Timpe, A. Trunschke, G. Weinberg, Q. Basher, F. A. Hamid, S. B. A. Hamid, E. Omar, L. M. Salim, Applied Catalysis a-General 2006, 307, 137.
[13] J. S. Lee, L. Volpe, F. H. Ribeiro, M. Boudart, Journal of Catalysis 1988, 112, 44.
[14] C. Bouchy, S. B. D. A. Hamid, E. G. Derouane, Chemical Communications 2000, 125.
[15] K. Page, J. Li, R. Savinelli, H. N. Szumila, J. P. Zhang, J. K. Stalick, T. Proffen, S. L. Scott, R. Seshadri, Solid State Sciences 2008, 10, 1499.
[16] C. F. Cullis, Industrial and Engineering Chemistry 1967, 59, 18. [17] F. Cavani, F. Trifiro, Catalysis Today 1995, 24, 307. [18] R. Grabowski, Catalysis Reviews-Science and Engineering 2006, 48, 199. [19] A. T. L. Csepei, R. Schloegl private discussions 2011. [20] S. T. Oyama, J. W. Hightower, American Chemical Society National Meeting,
Catalytic selective oxidation, American Chemical Society, Washington, 1993. [21] S. T. Oyama, B. K. Warren, American Chemical Society National Meeting,
Heterogeneous hydrocarbon oxidation, American Chemical Society, Washington, 1996.
[22] R. K. Grasselli, Catalysis Today 1999, 49, 141. [23] P. Mars, D. W. van Krevelen, Chemical Engineering Science 1954, 3, 41. [24] R. K. Grasselli, D. J. Buttrey, J. D. Burrington, A. Andersson, J. Holmberg,
W. Ueda, J. Kubo, C. G. Lugmair, A. F. Volpe, Topics in Catalysis 2006, 38, 7.
[25] M. G. O'Brien, A. M. Beale, S. D. M. Jacques, T. Buslaps, V. Honkimaki, B. M. Weckhuysen, The Journal of Physical Chemistry C 2009, 113, 4890.
[26] U. Rodemerck, B. Kubias, H. W. Zanthoff, M. Baerns, Applied Catalysis a-General 1997, 153, 203.

24
[27] M. Abon, K. E. Bere, P. Delichere, Catalysis Today 1997, 33, 15. [28] X. Liu, B. Frank, W. Zhang, T. P. Cotter, R. Schlogl, D. S. Su, Angewandte
Chemie-International Edition 2011, 50, 3318. [29] B. Frank, R. Fortrie, C. Hess, R. Schlogl, R. Schomacker, Applied Catalysis a-
General 2009, 353, 288. [30] A. C. Sanfiz, T. W. Hansen, D. Teschner, P. Schnorch, F. Girgsdies, A.
Trunschke, R. Schlogl, M. H. Looi, S. B. A. Hamid, Journal of Physical Chemistry C 2010, 114, 1912.
[31] F. Ivars, B. Solsona, M. Soriano, J. López Nieto, Topics in Catalysis 2008, 50, 74.
[32] F. Naraschewski, A. Jentys, J. Lercher, Topics in Catalysis, 54, 639. [33] H. Oudghiri-Hassani, E. Zahidi, M. Siaj, J. Wang, P. H. McBreen, Applied
Surface Science 2003, 212, 4. [34] W. C. Wu, Z. L. Wu, C. H. Liang, P. L. Ying, Z. C. Feng, C. Li, Physical
Chemistry Chemical Physics 2004, 6, 5603. [35] K. J. Leary, J. N. Michaels, A. M. Stacy, Journal of Catalysis 1986, 101, 301. [36] K. J. Leary, J. N. Michaels, A. M. Stacy, Journal of Catalysis 1987, 107, 393. [37] J. S. Lee, K. H. Lee, J. Y. Lee, Journal of Physical Chemistry 1992, 96, 362. [38] V. V. Nemoshkalenko, V. P. Krivitskii, A. P. Nesenjuk, L. I. Nikolajev, A. P.
Shpak, Journal of Physics and Chemistry of Solids 1975, 36, 277. [39] B. Dhandapani, T. St Clair, S. T. Oyama, Applied Catalysis a-General 1998,
168, 219. [40] C. Bouchy, C. Pham-Huu, B. Heinrich, C. Chaumont, M. J. Ledoux, Journal
of Catalysis 2000, 190, 92. [41] J.-S. Choi, G. Bugli, G. Djéga-Mariadassou, Journal of Catalysis 2000, 193,
238. [42] D. C. LaMont, A. J. Gilligan, A. R. S. Darujati, A. S. Chellappa, W. J.
Thomson, Applied Catalysis a-General 2003, 255, 239. [43] S. Liu, R. Ohnishi, M. Ichikawa, Journal of Catalysis 2003, 220, 57. [44] E. A. Blekkan, P. H. Cuong, M. J. Ledoux, J. Guille, Industrial & Engineering
Chemistry Research 1994, 33, 1657. [45] A. Katrib, V. Logie, N. Saurel, P. Wehrer, L. Hilaire, G. Maire, Surface
Science 1997, 377, 754. [46] R. B. Levy, M. Boudart, Science 1973, 181, 547. [47] J. S. Lee, S. T. Oyama, M. Boudart, Journal of Catalysis 1987, 106, 125. [48] H. Preiss, B. Meyer, C. Olschewski, Journal of Materials Science 1998, 33,
713. [49] H. Preiss, D. Schultze, K. Szulzewsky, Journal of the European Ceramic
Society 1999, 19, 187. [50] A. M. Stux, C. Laberty-Robert, K. E. Swider-Lyons, Journal of Solid State
Chemistry 2008, 181, 2741. [51] C. C. Yu, S. Ramanathan, F. Sherif, S. T. Oyama, Journal of Physical
Chemistry 1994, 98, 13038. [52] E. Boellaard, A. M. vanderKraan, J. W. Geus, in Preparation of Catalysts Vi,
Vol. 91, 1995, pp. 931. [53] C. C. Yu, S. Ramanathan, B. Dhandapani, J. G. Chen, S. T. Oyama, J. Phys.
Chem. B 1997, 101, 512. [54] S. T. Oyama, C. C. Yu, S. Ramanathan, Journal of Catalysis 1999, 184, 535. [55] V. Schwartz, S. T. Oyama, J. G. G. Chen, Journal of Physical Chemistry B
2000, 104, 8800.
25
[56] S. Korlann, B. Diaz, M. E. Bussell, Chemistry of Materials 2002, 14, 4049. [57] S. Chouzier, P. Afanasiev, M. Vrinat, T. Cseri, M. Roy-Auberger, Journal of
Solid State Chemistry 2006, 179, 3314. [58] M. Nagai, I. Shishikura, S. Omi, Japanese Journal of Applied Physics Part 1-
Regular Papers Short Notes & Review Papers 2000, 39, 4528. [59] J. Lu, U. Jansson, Thin Solid Films 2001, 396, 53. [60] J. M. Giraudon, L. Leclercq, G. Leclercq, A. Lofberg, A. Frennet, Journal of
Materials Science 1993, 28, 2449. [61] I. P. P. A. J. C. M. M. Artur M. Nartowski, Advanced Materials 1998, 10, 805. [62] K. Y. Park, W. K. Seo, J. S. Lee, Catalysis Letters 1991, 11, 349. [63] P. Delporte, C. PhamHuu, M. J. Ledoux, Applied Catalysis a-General 1997,
149, 151. [64] J. C. Edwards, P. D. Ellis, Langmuir 1991, 7, 2117. [65] G. M. Dolce, P. E. Savage, L. T. Thompson, Energy & Fuels 1997, 11, 668. [66] J. G. Choi, J. R. Brenner, L. T. Thompson, Journal of Catalysis 1995, 154, 33. [67] G. S. Ranhotra, A. T. Bell, J. A. Reimer, Journal of Catalysis 1987, 108, 40. [68] S. T. Oyama, Catalysis Today 1992, 15, 179. [69] F. C. Meunier, A. Yasmeen, J. R. H. Ross, Catalysis Today 1997, 37, 33. [70] F. Solymosi, R. Nemeth, Catalysis Letters 1999, 62, 197. [71] C. Phamhuu, M. J. Ledoux, J. Guille, Journal of Catalysis 1993, 143, 249. [72] J. B. Claridge, A. P. E. York, A. J. Brungs, C. Marquez-Alvarez, J. Sloan, S.
C. Tsang, M. L. H. Green, Journal of Catalysis 1998, 180, 85. [73] K. Oshikawa, M. Nagai, S. Omi, J. Phys. Chem. B 2001, 105, 9124. [74] S. Naito, M. Tsuji, Y. Sakamoto, T. Miyao, Scientific Bases for the
Preparation of Heterogeneous Catalysts 2002, 143, 415. [75] F. Solymosi, J. Cserényi, A. Szöke, T. Bánsági, A. Oszkó, Journal of Catalysis
1997, 165, 150. [76] D. Wang, J. H. Lunsford, M. P. Rosynek, Journal of Catalysis 1997, 169, 347. [77] S. Liu, L. Wang, R. Ohnishi, M. Ichikawa, Journal of Catalysis 1999, 181,
175. [78] P. Liu, J. A. Rodriguez, The Journal of Physical Chemistry B 2006, 110,
19418. [79] D. J. Ham, Y. K. Kim, S. H. Han, J. S. Lee, Catalysis Today 2008, 132, 117. [80] J. A. Schaidle, A. C. Lausche, L. T. Thompson, Journal of Catalysis 2010,
272, 235. [81] S. Nagakura, S. Oketani, Transactions of the Iron and Steel Institute of Japan
1968, 8, 265. [82] P. Afanasiev, Inorg. Chem. 2002, 41, 5317. [83] H. M. Wang, X. H. Wang, M. H. Zhang, X. Y. Du, W. Li, K. Y. Tao,
Chemistry of Materials 2007, 19, 1801. [84] L. Aladko, V. Komarov, A. Manakov, A. Ancharov, Journal of Inclusion
Phenomena and Macrocyclic Chemistry 2007. [85] X.-H. Wang, M.-H. Zhang, W. Li, K.-Y. Tao, Catalysis Today 2008, 131, 111. [86] T. C. Xiao, A. P. E. York, V. C. Williams, H. Al-Megren, A. Hanif, X. Y.
Zhou, M. L. H. Green, Chemistry of Materials 2000, 12, 3896. [87] T. C. Xiao, H. T. Wang, J. W. Da, K. S. Coleman, M. L. H. Green, Journal of
Catalysis 2002, 211, 183. [88] T. Xiao, A. P. E. York, K. S. Coleman, J. B. Claridge, J. Sloan, J. Charnock,
M. L. H. Green, Journal of Materials Chemistry 2001, 11, 3094.
26
[89] A. Hanif, T. C. Xiao, A. P. E. York, J. Sloan, M. L. H. Green, Chemistry of Materials 2002, 14, 1009.
[90] M. K. Neylon, S. Choi, H. Kwon, K. E. Curry, L. T. Thompson, Applied Catalysis a-General 1999, 183, 253.
[91] W. C. Wu, Z. L. Wu, C. H. Liang, X. W. Chen, P. L. Ying, C. Li, Journal of Physical Chemistry B 2003, 107, 7088.
[92] G. S. Ranhotra, G. W. Haddix, A. T. Bell, J. A. Reimer, Journal of Catalysis 1987, 108, 24.
[93] L. Volpe, M. Boudart, Journal of Solid State Chemistry 1985, 59, 348. [94] A. P. E. York, J. B. Claridge, A. J. Brungs, S. C. Tsang, M. L. H. Green,
Chemical Communications 1997, 39. [95] T.-C. Xiao, H.-T. Wang, A. P. E. York, M. L. H. Green, Catalysis Letters
2002, 83, 241. [96] A. P. E. York, T.-c. Xiao, M. L. H. Green, J. B. Claridge, Catalysis Reviews
2007, 49, 511 [97] E. Solymosi, R. Nemeth, L. Ovari, L. Egri, Journal of Catalysis 2000, 195,
316. [98] F. Solymosi, R. Németh, A. Oszkó, J. J. S. E. Iglesia, T. H. Fleisch, in Studies
in Surface Science and Catalysis, Vol. Volume 136, Elsevier, 2001, pp. 339. [99] H. Kwon, S. Choi, L. T. Thompson, Journal of Catalysis 1999, 184, 236. [100] H. Kwon, L. T. Thompson, J. Eng, J. G. Chen, Journal of Catalysis 2000, 190,
60. [101] F. H. Ribeiro, M. Boudart, R. A. Dallabetta, E. Iglesia, Journal of Catalysis
1991, 130, 498. [102] E. Iglesia, F. H. Ribeiro, M. Boudart, J. E. Baumgartner, Catalysis Today
1992, 15, 455. [103] F. Meunier, P. Delporte, B. Heinrich, C. Bouchy, C. Crouzet, C. PhamHuu, P.
Panissod, J. J. Lerou, P. L. Mills, M. J. Ledoux, Journal of Catalysis 1997, 169, 33.
[104] M. J. Ledoux, F. Meunier, B. Heinrich, C. Pham-Huu, M. E. Harlin, A. O. I. Krause, Applied Catalysis a-General 1999, 181, 157.

27

28

29
Chapter 2: The synthesis of mixed Mo-V carbides
2.1 Abstract
A series of bimetallic carbides of the form (Mo1-xVx)2C (0 < x < 0.12) was synthesised
by carbothermal reduction of corresponding h-Mo1-xVxO3 mixed metal oxide (MMO)
precursors. The oxides were synthesised by precipitation and the subsequent carbide
phase development was monitored using in situ X-ray diffraction (XRD) and outgas
analysis of the temperature-programmed reduction-carburisation. The observed
structural evolution is combined with analysis of the solid state kinetic data and the
reduction mechanism is discussed.
Inclusion of vanadium is observed to retard the onset of reduction as well as strongly
influencing the kinetics of oxide reduction. The reduction is observed to proceed via a
complex mechanism involving initial formation of a monoclinic suboxide, MoO3-x.
Increasing the content of vanadium retards the onset of reduction as well as the onset
of carburisation in the step MoO2 → Mo2C.
The carbides exhibit a trend in the growth morphology with vanadium concentration,
from a particulate-agglomerate material to a packed, nano-fibrous morphology.
Transmission electron microscopy investigation of the fibrous material using selected
area electron diffraction (SAED) reveals that the high aspect-ratio crystallites exhibit
pseudomorphism, and in the case of the vanadium containing materials, it is observed
that there is some preferential orientation of crystal grains. Characterisation of the
materials by N2 adsorption reveals an increasing mesoporosity associated with the
fibrous morphology, as well as an exceptionally high surface area (80–110m2/g).
The synthesis was subsequently scaled up from the in situ XRD preparation using a
specially adapted rotary furnace to perform the temperature-programmed reduction-
carburisation. By adapting the heating rate, gas flow and pre-treatment conditions it
was possible to produce carbide materials with comparable physical properties to
those obtained from the small scale. As a result, it was possible to synthesise Mo2C
materials in multi-gram quantities (5–15 g) with BET surface areas ranging from 50–
100 m2/g, among the highest values reported in literature.
In addition to the development of the synthesis parameters, air-free techniques and
equipment were developed for the handling of freshly-reduced carbide materials.

30
These tools are readily adaptable for high-temperature syntheses and allow the user to
transfer material from the reactor directly to the glovebox without exposure to
atmosphere.
2.1.1 Introduction
Since it was observed that early transition metal carbides display noble metal-like
properties,[1, 2] there has been a renewed interest in these materials in the field of
catalysis, especially so in the case of group V and VI carbides. It is hoped that such
materials may be able to substitute scarcer and more expensive noble metals in a
growing field of applications, including fuel cells and energy-related catalysis. This
resurgence is largely due to the discovery of facile routes to highly dispersed bulk
carbides and supported carbides by which transition metal oxides are reduced using a
temperature-programmed reaction in the presence of a carbon containing gas.[3]
Depending on the conditions, this approach yields stoichiometric materials of high
purity with relatively high surface areas.
Molybdenum carbide exhibits interesting activity in a number of catalytic reactions
including isomerisation,[4] hydrogenation and hydrogenolysis,[5] methanol reforming[6]
and hydrotreating reactions.[7] It can also be formed under relatively mild conditions
making it an ideal material for the study of carbides in catalysis. In addition,
molybdenum participates in an extensive chemistry with oxygen providing various
potential approaches to mono- and polymetallic carbides via multi-metal oxide
(MMO) precursors. In this study, we explore an approach to a ternary carbide (Mo,V)
through the use of Mo/V mixed oxides.
Various approaches to polymetallic carbides are outlined in the literature for their
potential in hydrotreatment catalysis, including established variations of M6C-type
carbides (i.e. AxByC; x = 2, 3, 4; y = 6-x; A, B = Ti, V, Cr, Mn, Fe, Co, Ni, Nb, Mo,
W, Ta).[8, 9] Of more relevance to the present study is the preparation of carbide solid
solutions related to the simple hcp and fcc carbide phases.[10] In two studies by Oyama
et al., a series of bimetallic transition metal oxide precursors of the form M1M2Ox (M1
= Mo, W; M2 = V, Cr, Fe, Co, Ni, Nb, Mo, W) was prepared by the solid state fusion
of simple oxide components. The oxides were subsequently carburised as per the
literature method resulting in bimetallic oxycarbide materials.[11, 12] Also, recently,

31
Bastos et al. have synthesised mixed Mo/W carbides by varying the synthesis method
of the precursor compounds including co-precipitation of mixed metal oxides.[13]
In this study, a bimetallic modification of the hexagonal molybdate h-MoO3 was
chosen as a starting material with vanadium as the substituting dopant metal. In this
way it was expected to reduce potential segregation under the conditions of
carburisation. The variably substituted oxides, in the form (NH4)xMo1-xVxO3, were
prepared by coprecipitation[14] and the resulting precursors subsequently carburised in
an in situ XRD cell to give a series of samples of the form (Mo,V)Cx. From the
characterisation of the intermediate and resultant products it can be seen that the
composition and structure of the precursor oxide influences the mechanism of
reaction as well as the surface area, morphology and grain size of the product
carbides.
2.1.2 Motivation
As outlined in the introductory chapter, the primary motivation for this work is to
study the potential influence that a reduced metal oxide catalyst operating in a carbon-
rich environment may have on catalytic activity. The study has particular relevance to
the MoVTe M1 catalyst for the partial oxidation of propane to acrylic acid[15, 16] and to
Mo5O14-type catalysts used in the selective oxidation of acrolein to acrylic acid.[17]
The primary elements apart from oxygen in all of the aforementioned catalysts are
molybdenum and vanadium, which due to their reducibility and electronic flexibility
have been studied extensively in the catalytic literature, especially with respect to
oxidation chemistry. In general, the reducible nature of molybdenum oxide lends
itself to the formation of carbides due to the relatively low temperatures required to
substitute carbon in the lattice cf. other transition metals.[18-20]
The temperature-programmed reduction-carburisation of MoO3 to β-Mo2C under
H2/CH4 (as developed by Oyama et al.[3]) is carried out in two steps. The first
involves the reduction of MoO3 to MoO2 which is carried out by the action of
hydrogen alone. The second step is the reduction-carburisation of MoO2 to Mo2C
which is performed by the hydrogen and methane in concert. It is also possible to
carry out the carburisation with methane alone, however, it requires higher
temperatures to allow the decomposition of CH4 to release atomic hydrogen and

32
perform the requisite reduction steps.[3] Furthermore, higher hydrocarbons may be
used to effect the carburisation of MoOx. Each successive increase in chain length
decreases the required temperature to decompose the hydrocarbon and incorporate
carbon into the oxide matrix.[21-24] Additionally, it is possible to carburise MoOx using
carbon alone as the reducing-carburising agent.[25-27]
The stability of MoO3 to the initial reduction is a function of the (generally) low
surface area and the strength of the H-H bond, which must be activated to combine
with lattice oxygen. Therefore, the use of longer chain hydrocarbons, which
decompose over MoOx at temperatures < 400°C, are able to reduce the oxide at lower
temperatures than pure H2 by the generation of atomic hydrogen at the site of
decomposition. Depending upon the specific nature of this reduction-carburisation it
is possible to form either the fcc α-Mo2C or hcp β-Mo2C. Hence, the action of
propane upon molybdenum oxide is observed to result in a mixture of fcc and hcp
molybdenum carbide phases at between 500-600°C, ca. 100°C lower than that
observed for H2/CH4. This temperature range is certainly not beyond that which is
achieved in hotspots observed for selective oxidation catalysts.[28]
Thus, the need for a detailed and mechanistic picture of the reduction-carburisation
process lies at the heart of this study. The point of difference maintained here is that
the mechanism and kinetics of formation has not before been approached for
bimetallic/polymetallic systems that reflect the chemical nature of selective oxidation
catalysts.
2.1.3 Experimental goals and approach
As is stated in the motivation section, it is desired to produce a study that elucidates
the role and influence of vanadium in the carburisation process. To do this, it is
necessary to have a defined series of precursor oxides with which to carry out the
carburisation study. The conditions of the TPR-carburisation must be defined, and the
composition and structure of the starting materials and products should be well-
understood. Furthermore, to gain mechanistic insight, the reaction must be monitored
in situ to determine the extent of reaction and the nature of intermediate phases. To
satisify these requirements, an outline of the experimental approach is as follows:

33
• Prepare a well-defined series of oxide precursors based on the hexagonal
molybdate h-MoO3 with V progressively substituting Mo to give a mixed
Mo/V oxide precursor h-Mo1-xVxO3
• Characterise the oxide precursors using: XRD, N2-physisorption, SEM (&
SEM-EDX), TEM and TG-DSC
• Carburise the oxide precursors using CH4/H2 in a TPR-carburisation based on
the preparation by Oyama et al.[3]
• Monitor the evolution of of crystalline phases using in situ XRD during the
temperature-programmed reduction-carburisation
• Carry out kinetic studies on the oxide reduction-carburisation using different
heating rates with quantative analysis of the outgas
• Use solid-state kinetic modeling to gains insight into the mechanism of
reduction-carburisation by comparison with the in situ XRD data
• Characterise the carbide products using: XRD, N2-physisorption, CHN
analysis, SEM (& SEM-EDX), XPS, TEM and TG-DSC
• Develop a scaled-up synthesis method based on the understanding gained from
plug-flow experiments
In the study of molybdenum carbide, the preparation of well-defined material with
homogeneous surface properties is important because the reactive nature of the
surface makes it difficult to characterise exactly. Only limited information can be
inferred if the chemical nature of the surface is dynamic or unknown. On the basis of
these criteria we can generally define the ideal carbidic surface as being representative
of the bulk structure of the material, ie. an interstitial arrangement of only
molybdenum and carbon at which the surface is ideally terminated as a
crystallographic plane, and also importantly, free of adventitious carbon species such
that every surface site is accessible to reaction. Previous studies have shown that this
can be achieved through the judicious use of thermodynamic parameters derived from
an analysis of the Gibbs free energy equations for carbon formation and methane
reforming.[3]

34
2.2 Experimental
2.2.1 Synthesis
2.2.1.1 Synthesis of precursor oxides
The series of h-MoO3 precursors (of the form h-Mo1-xVxO3) was prepared in an
automated laboratory reactor (LABMAX, Mettler, Toledo) by the precipitation of a
0.032 M aqueous solution (total metals) of ammonium heptamolybdate
(NH4)6Mo7O24·4H2O (Merck, > 99%) and ammonium metavanadate (NH4)VO3
(Aldrich, > 99%) at constant pH and temperature. The precipitation pH of the mixed
AHM/AMT solutions was determined using a Mettler DL77 laboratory titrator at the
desired temperature (75°C) titrated with 1M HNO3. As can be seen in Figure 2.1 the
curves are not very sharp, but from the differential it was decided to choose pH = 0.5.
2 4 6 8 10 120
1
2
3
4
5
6
-2.0
-1.5
-1.0
-0.5
0.0
d(pH)/dV
pH
mL HNO3 added
V/(Mo+V) = 0.1 Mo
Figure 2.1: Titration curves for 1M (metals basis) AHM (blue) and AHM/AMT (red)
solutions at 75°C.
The metal-containing solution (1000mL) was automatically added stepwise to
aqueous HNO3 (ph = 1; 300mL) maintained at a temperature of 75°C throughout
addition. The pH was maintained at 0.5 by automated monitoring and via addition of
3M HNO3 from a reserve. The precipitate was aged for 2 hours at 75°C, collected by
filtration, washed with water (2 x 100mL) and washed once with EtOH (100mL)
before drying overnight at 80°C. It was observed that molybdenum was preferentially
precipitated from the reactant solution and therefore the applied and received Mo/V
ratios, and the physical properties of the oxides, are detailed in Table 2.2.
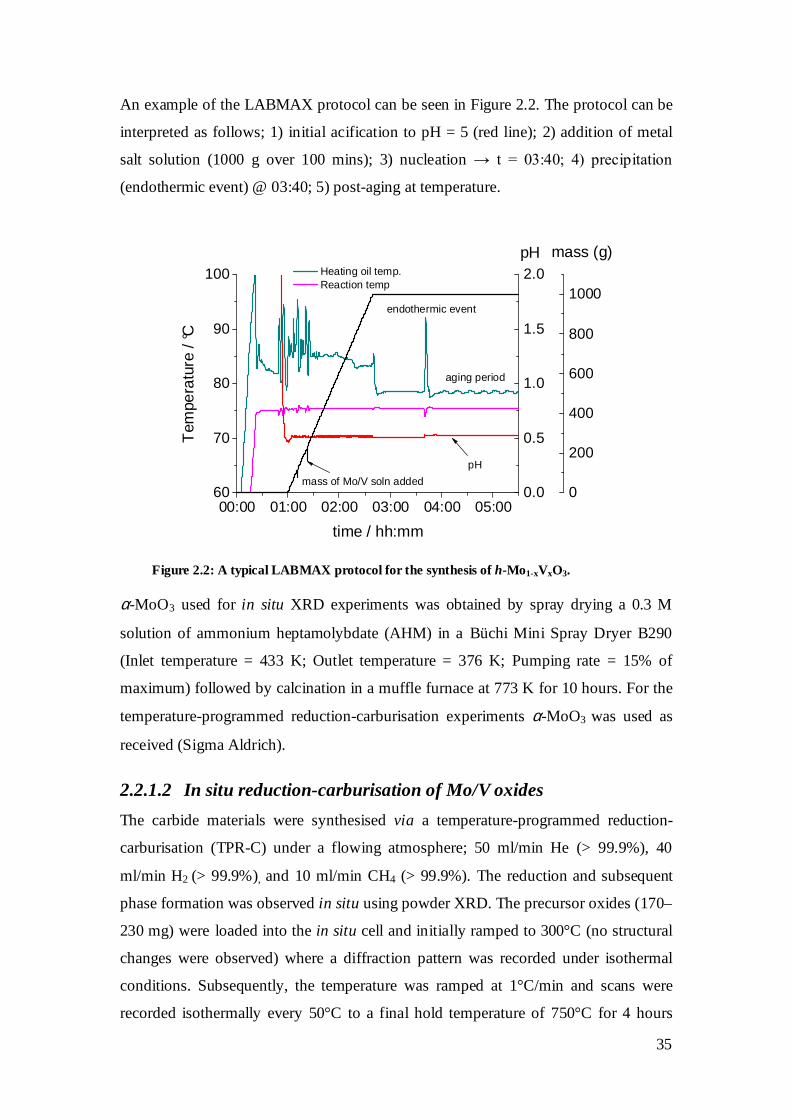
35
An example of the LABMAX protocol can be seen in Figure 2.2. The protocol can be
interpreted as follows; 1) initial acification to pH = 5 (red line); 2) addition of metal
salt solution (1000 g over 100 mins); 3) nucleation → t = 03:40; 4) precipitation
(endothermic event) @ 03:40; 5) post-aging at temperature.
00:00 01:00 02:00 03:00 04:00 05:0060
70
80
90
100
0.0
0.5
1.0
1.5
2.0
0
200
400
600
800
1000
Heating oil temp. Reaction temp
Tem
pera
ture
/ °C
time / hh:mm
pH
mass of Mo/V soln added
endothermic event
pH mass (g)
aging period
Figure 2.2: A typical LABMAX protocol for the synth esis of h-Mo1-xVxO3.
α-MoO3 used for in situ XRD experiments was obtained by spray drying a 0.3 M
solution of ammonium heptamolybdate (AHM) in a Büchi Mini Spray Dryer B290
(Inlet temperature = 433 K; Outlet temperature = 376 K; Pumping rate = 15% of
maximum) followed by calcination in a muffle furnace at 773 K for 10 hours. For the
temperature-programmed reduction-carburisation experiments α-MoO3 was used as
received (Sigma Aldrich).
2.2.1.2 In situ reduction-carburisation of Mo/V oxides
The carbide materials were synthesised via a temperature-programmed reduction-
carburisation (TPR-C) under a flowing atmosphere; 50 ml/min He (> 99.9%), 40
ml/min H2 (> 99.9%), and 10 ml/min CH4 (> 99.9%). The reduction and subsequent
phase formation was observed in situ using powder XRD. The precursor oxides (170–
230 mg) were loaded into the in situ cell and initially ramped to 300°C (no structural
changes were observed) where a diffraction pattern was recorded under isothermal
conditions. Subsequently, the temperature was ramped at 1°C/min and scans were
recorded isothermally every 50°C to a final hold temperature of 750°C for 4 hours

36
before cooling to room temperature at which point a final scan was recorded (see
Figure 2.3). The sample was passivated under 0.5 % O2 in He (total flow 100 ml/min)
for 2 hours before removing the sample. The conditions of the in situ experiment were
chosen in order to balance the temperature resolution and the overall heating rate
(0.56°C/min) with the apparatus limitations, as well as recording a functional 2θ
range for Rietveld analysis.
Figure 2.3: Temperature program for in situ XRD studies.
The in situ powder XRD studies were performed in a STOE Theta/Theta
diffractometer with reflection geometry (secondary graphite monochromator, Cu
Κα1+2 radiation (λ = 1.5419 Å), scintillation counter) equipped with an Anton Paar
XRK 900 in situ XRD cell. In situ scans were carried out in the range 22° < 2θ < 43°
for the temperature program and a longer scan (5° < 2θ < 60°) at room temperature
after passivation. The temperature program was combined with analysis of the outgas
stream using a Pfeiffer OmniStar quadrupole mass spectrometer.
2.2.1.3 Large scale preparation of (Mo1-xVx)2C
The goal of upscaling was to retain the high surface area of materials synthesised in
situ and to produce catalytically active carbides with low levels of adventitious carbon
for materials testing and use in future studies. The conditions were therefore modified
with respect to the in situ synthesis.
In this study we have utilised a custom-built rotary furnace produced by Xerion,
combined with a bespoke quartz reaction vessel which integrates by means of a
stainless steel flange with attached KF butterfly valves. The furnace and reactor

37
assembly is contained within a sealed stainless steel hood which is continuously
purged with N2 gas to provide an inert shield in case of rupture. A gas manifold
assembly allows for the purging of the reaction chamber and a flexible range of
gaseous atmospheres. The temperature of the furnace is moderated by a Eurotherm
2704 PID controller with a three zone furnace coupled with feedback from three
embedded thermopiles. The isothermal zone of the reactor is measured across the
central zone of the reactor (12–14cm) and is measured to be +/- 5°C with an offset of
-25°C from the PID displayed values.
The materials synthesis was scaled up to multi-gram (~10g) quantities using a custom
built rotary furnace with 3 heating zones (Xerion Advanced Heating GmbH),
equipped with mass flow controllers for Ar, O2, H2 and CH4 (Bronkhorst) and a PID
heating controller (Eurotherm 2704). In each case 10.0 g of h-Mo1-xVxO3 precursor
was introduced to the modified SiO2 tube reactor and subjected to a temperature
program under flowing CH4/H2 (1:4; 450 sccm) as follows: RT → 350°C @ 1°C/min;
350°C → 500°C @ 0.2°C/min; 500°C → 550°C @ 1°C/min; 550°C → 675°C @
0.2°C/min ; hold 4 hours → RT. Following the temperature program, the KF butterfly
valves on the flange ends were closed and the sealed reactor was introduced to the
glove box. A photograph of the furnace set-up as well as the air-free transfer device is
shown in Figure 2.4.
Figure 2.4: (left) ‘Hindenburg’ rotary furnace used for upscaled synthesis of
(Mo1-xVx)2C. (right) Custom-designed flanges for air-free reactor transfer.

38
2.2.1.4 Temperature programmed reduction-carburisation
Temperature-programmed reduction-carburisation experiments were carried out using
500mg of precursor oxide in a SiO2 U-tube reactor heated in the isothermal zone of a
tube furnace (Carbolite). The heating was controlled by a PID controller (Eurotherm
2416) and the temperature monitored by a thermocouple in the reactor bed. The gas
analysis was carried out with heated lines using an in-line IR COx detector (ABB) and
a mass spectrometer (Pfeiffer Omnistar) to monitor reaction products. The oxides
were carburised in a flowing atmosphere of 200 sccm Ar/H2/CH4 (5:4:1) under
temperature ramps of 1, 2 & 5 °C/min to a final hold temperature of 675°C for two
hours. Quantitative product analysis for H2O and COx was carried out by normalising
the MS signals to the calibrated COx detector and by summation of the total oxygen
content of the precursor oxides.
For solid state kinetic modeling of the reduction process, the TPR data was analysed
using ‘NETSCH — Thermokinetics’ software to give the conversion-dependent
activation energy using the technique of Ozawa-Flynn and Wall.[29] The derived
activation energies were subsequently used to generate reaction curves for
θ/θ0.5 vs. α for mechanism comparison using the masterplot method.
2.2.1.5 In situ and ex situ characterisation
The in situ powder XRD studies were performed in a STOE Theta/Theta
diffractometer with reflection geometry (secondary graphite monochromator, Cu
Κα1+2 radiation (λ = 1.5419 Å), scintillation counter) equipped with an Anton Paar
XRK 900 in situ XRD cell. In situ scans were carried out in the range 22° < 2θ < 43°
for the temperature program and a longer scan (5° < 2θ < 60°) at room temperature
after passivation. The temperature program was combined with analysis of the outgas
stream using a Pfeiffer OmniStar quadrupole mass spectrometer.
Ex situ powder XRD was carried out on the precursor oxides and for full scans on the
as-synthesised carbides using a STOE STADI P diffractometer in transmission
geometry (primary focusing Ge monochromator, Cu Kα1 radiation (λ = 1.5406 Å),
linear position sensitive detector). Full pattern analysis of the XRD data was
performed using TOPAS software.[30] The pattern fit for each material was carried out
using a Pawley refinement based on a hexagonal unit cell. The information on

39
crystallite sizes was subsequently obtained as LVol-IB values (volume-weighted
average column height based on integral breadth) according to the double-Voigt
approach.[31]
Differential scanning calorimetry (DSC) combined with thermo-gravimetric analysis
(TGA) was used to study the thermal decomposition of the precursor oxides. The
study was carried out on a Netsch Jupiter STA 449C calorimeter equipped with a
Pfeiffer OmniStar quadrupole mass spectrometer for analysis of out gases.
The carbon content of the carbide samples was measured by CHN analysis carried out
using a FlashEA 1112 Elemental Analyzer. In the case of V-containing materials pure
oxygen is used to effect total combustion of the samples.
All oxide and carbide samples were analysed by full N2-adsorption-desorption
isotherms using a Quantachrome Autosorb AS-6B measured after a pre-treatment in
vacuum at 200°C for 2 hours. The specific surface areas were determined applying
the Brunauer-Emmet-Teller (BET) method using 11 data points in the relative
pressure p/p0 range between 0.05 and 0.3. The pore size distributions were calculated
using the Barrett-Joiner-Halenda (BJH) method from the desorption branch of the N2
isotherm.
Analysis of the carbide morphologies was investigated on a HITACHI S 4000 FEG
scanning electron microscope (SEM). To determine elemental concentrations,
electron dispersive X-ray spectroscopy (EDX) was carried out using the EDAX DX-4
analysis system.
Transmission electron microscopy (TEM) investigation of the Mo/V carbide was
carried out with a Philips CM 200 FEG (Philips, Eindhoven, The Netherlands) TEM
operated at 200 kV and equipped with a Gatan Image Filter (Gatan, Warrendale, PA)
and a charge-coupled device (CCD) camera.
2.3 Results and discussion
2.3.1 Hexagonal precursor oxides
h-MoO3 is a metastable, complex molybdate defined by zigzag edge-sharing MoO6
octahedral chains which extend down the length of the c-axis and are edge connected

40
to form a superstructure in which hexagonal channels travel down the length of the c-
axis. The channels are partially occupied by monovalent cationic species (H3O+,
NH4+, K+, Rb+, Cs+ are reported) that are intrinsic to the stability of the structure and
presumably serve a templating role for the crystallization of the phase. The synthesis
was first described by Olenkova in 1981 and subsequently characterised in detail by
Caiger.[32-34] In contrast, K0.13Mo0.87V0.13O3, a mixed Mo/V analogue is described by
Darriet et al. [35] in 1973 (see Figure 2.5) and the phase stability of H0.13Mo0.87V0.13O3
is more recently demonstrated by Dupont.[36, 37] In this study we have used a synthetic
method resulting in NH4+-containing mixed Mo/V molybdates previously described
by Mougin et al.[14] The characterisation and description of this oxide series are
outlined in Table 2.2.
Figure 2.5: Crystal structure of K0.13Mo0.87V0.13O3 as decribed by Darriet and Galy.[35]
As can be seen from Figure 2.6(a), the result of V substitution is an increase of
stability of the structure to oxidative degradation (h-MoO3 → α-MoO3), which is
observed in the profiles of the TG-DTA analysis of the oxides 0Vox and 8Vox. The
increase in stability is observed to increase to a maximum at ca. 10% vanadium
substitution and is in accordance with a previous study.[14] The case for a statistical
distribution of V atoms throughout the Mo sublattice is further strengthened in Figure
2.6(b) which shows the divergence of the overlapping [120] and [101] diffraction
peaks at 2θ = 25.8° with increasing vanadium content.

41
100 200 300 400 500
94
96
98
100
8Vox
Temp °C
Wei
ght l
oss
(%)
Increasing V content
0Vox
-2.0
-1.5
-1.0
-0.5
0.0
0.5
1.0
1.5
2.0
DS
C (m
W/m
g)
(a)
25.2 25.6 26.0 26.4 26.80
2000
4000
6000
8000
11Vox
8Vox
5Vox
(b)
3Vox
101
Inte
nsity
(A
U)
2θ
120
0Vox
Figure 2.6: (a) TGA-DSC traces for the oxidative degradation (h-MoO3 → αααα-MoO3) of
precursor oxides 0Vox and 8Vox. (b) X-ray diffraction patterns of the precursor oxides
(0Vox-11Vox) between 25° < 2θ θ θ θ < < < < 27° illustrating the divergence of overlapping peaks with
increasing V content.
The series of Mo-V precursors based on h-MoO3 structure were comparatively
analysed using a Rietveld refinement carried out using TOPAS software. The
structural model used is that found by Galy et al. for the compound KxMo1-xVxO3.
The model has been modified to include NH4+ in place of K+ and the parameters
refined. It was observed that especially in the case of V-substituted oxides, the
structural model best approximated the pattern when a mixture of two identical phases
was taken into account. The inclusion of this minority phase (20-30%) helped to
account for various shoulder peaks and asymmetric peak shapes. The two phases are

42
labeled H1 (majority) and H2 (minority) for distinction (Table 2.1). From Figure 2.7a
we can se from the Rietveld fit for 8Vox that the fit is reasonable but in some cases
does not fully describe the peak shapes. The plots in Figure 2.7b & c help us to
understand this trend further: for the ‘c’ parameter the oxide series obeys Vegard’s
law[38] with regards to a linear relationship between the dopant concentration and the
lattice parameter and the trend is observed to be identical for both calculated phases.
In Figure 2.7b however we see a relation between the phases H1 and H2 with a
distinct maximum for 5Vox. In this case the ‘a’ parameter describes the a-b lattice
plane in which the octahedra are hexagonally arranged. This plane can be expected to
swell/shrink depending upon the occupation of the channels with H2O and NH4 and
we therefore see this variation which is explainable by increasing cation (NH4+)
density in the hexagonal channels with V content. This reaches a maxima and then
shrinks as the influence of vanadium’s smaller ionic diameter increasingly dominates.
2.1: Lattice parameters for the h-Mo(V)O3 series as determined by Rietveld fitting
Sample H1% H2% a (H1) c (H1) a (H2) c (H2)
0Vox (6600)
75 25 10.5750(2) 3.7271(1) 10.6107(4) 3.7281(3)
3Vox (6702)
73 27 10.5735(2) 3.7231(1) 10.6221(4) 3.7232(3)
5Vox (6271)
76 24 10.5861(2) 3.7201(1) 10.6324(4) 3.7193(3)
8Vox (6697)
78 22 10.5791(1) 3.7120(1) 10.6189(4) 3.7117(3)
11Vox (6601)
80 20 10.5838(1) 3.7091(1) 10.6143(5) 3.7095(3)
The observed difference in the cell parameter (~0.05Å) as well as the imperfect
Rietveld fit may be explained by a bicontinuous variation in the cell parameter
generated by slight inhomogeneieties in the crystalline structure. This is likely to due
inhomogeneieties which originate from the point of nucleation. We see however that
the ‘c’ parameter provides us a better measure of the statistical distribution of V
throughout the structure as the layer-layer distances in the c-axis exhibit the same
trends in variation.

43
10 15 20 25 30 35 40 45 50 55 60
0
1000
2000
3000
4000 Diffraction pattern - 8Vox Rietveld calculated diff.
(a)
0 2 4 6 8 10 1210.57
10.58
10.59
10.60
10.61
10.62
10.63
a (
Å)
V/(V+Mo)
a (H1) a (H2)
(b)
0 2 4 6 8 10 123.70
3.71
3.72
3.73
c (Å
)
V/(V+Mo)
c (H1) c (H2)
(c)
Figure 2.7: (a) Rietveld refinement for 8Vox; (b) ‘a’ parameter vs. V content as calculated
for the phases H1 and H2 (c) ‘c’ parameter vs. V content as calculated for the phases H1
and H2
As one would expect, the crystalline morphology of the hexagonal oxides, seen in
Figure 2.8 2.8, is hexagonal prismatic. Increasing vanadium content distorts the
crystal habit, tending towards flattened hexagonal crystallites of a more polydisperse
nature. The nucleation-precipitation-aging growth of the oxides results in spherical
polycrystallites ca. 100-150µm in diameter with flat terminations and an observed
decrease in packing density with increasing vanadium content.

44
Figure 2.8: Scanning electron micrographs of the hexagonal oxides 0Vox, 3Vox, 8Vox &
11Vox.
This is in accordance with the physical attributes of the oxides, varying from the
denser, white, crystalline h-MoO3 to a yellow-orange for the doped materials. The
surface areas (see Table 2.2), as calculated by the Brunauer-Emmet-Teller (BET)
isotherm from N2 adsorption, are uniformly low (< 1 m2/g) with the exception of the
highest loaded oxide 11Vox, which is slightly higher at 2 m2/g. This sample shows
evidence of vandadium saturation in the TG-DTA plots and the crystal morphology
exhibits some delamination and structural distortions from the hexagonal geometry
which may account for the higher surface area.
We can conclude that we have a well-defined series of mixed Mo/V oxide precursors.
These materials form the basis for this study on the structural and mechanistic aspects
of the reduction-carburisation of Mo/V oxides.

Table 2.2: Properties of the precursor oxides αααα-MoO3 (Rox) , h-MoO3 (0Vox), and h-Mo (1-x)VxO3 (3Vox–11Vox) a as determined by SEM-EDX
bas determined by Rietveld refinement
cas determined by thermo-gravimetric analysis
Precursor ID Phase Internal
ID
x applied V/(V+Mo)*
100
x recieveda V/(V+Mo)*
100
Lattice parametersb Oxidation temperaturec h->α (°C)
BET surface area (m2/g) a (Å) c (Å)
Rox α-MoO3 5201 - 0 - - - 1.6
0Vox h-MoO3 6600 0 0 10.5750(2) 3.7271(1) 403 <1
3Vox h-Mo(1-x)VxO3 6702 4 2.7±0.3 10.5735(2) 3.7231(1) 434 <1
5Vox h-Mo(1-x)VxO3 6271 10 4.6±0.3 10.5861(2) 3.7201(1) 452 1.1
8Vox h-Mo(1-x)VxO3 6697 15 8.4±1 10.5791(1) 3.7119(1) 479 <1
11Vox h-Mo(1-x)VxO3 6601 20 11±0.5 10.5838(1) 3.7091(1) 481 1.8
45
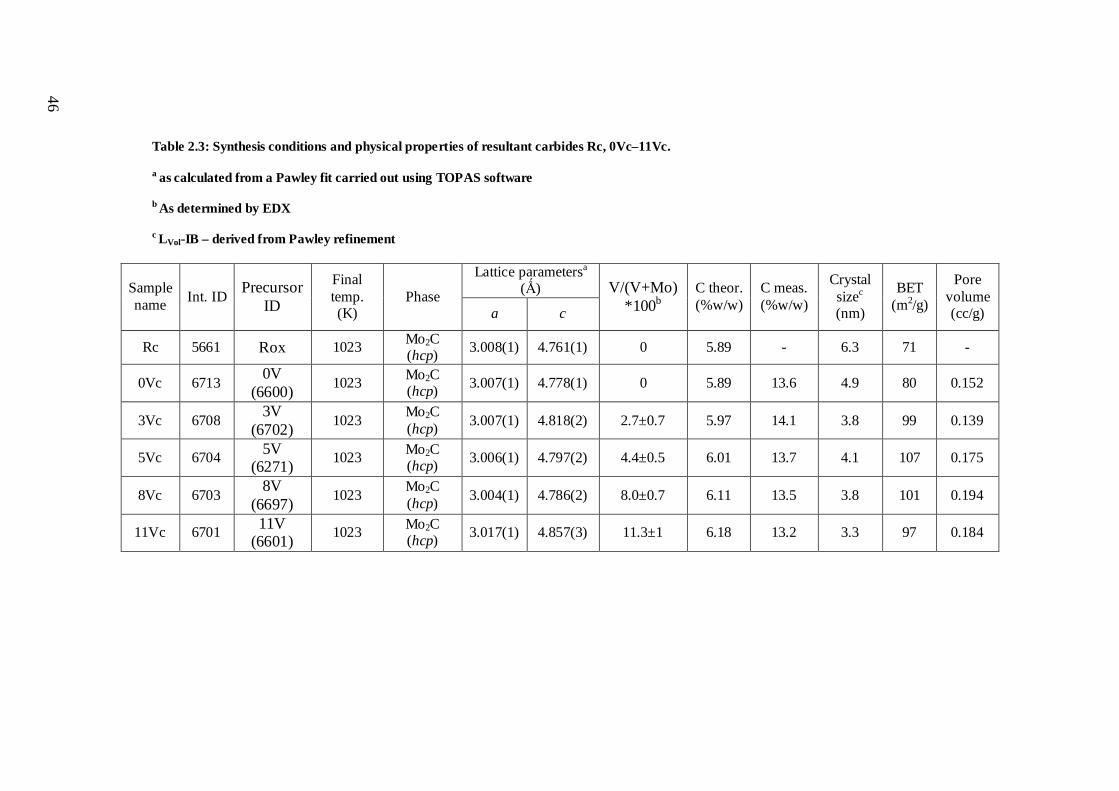
Table 2.3: Synthesis conditions and physical properties of resultant carbides Rc, 0Vc–11Vc.
a as calculated from a Pawley fit carried out using TOPAS software
b As determined by EDX
c LVol-IB – derived from Pawley refinement
Sample name Int. ID
Precursor ID
Final temp. (K)
Phase
Lattice parametersa (Ǻ) V/(V+Mo)
*100b C theor. (%w/w)
C meas. (%w/w)
Crystal sizec (nm)
BET (m2/g)
Pore volume (cc/g) a c
Rc 5661 Rox 1023 Mo2C (hcp) 3.008(1) 4.761(1) 0 5.89 - 6.3 71 -
0Vc 6713 0V
(6600) 1023 Mo2C
(hcp) 3.007(1) 4.778(1) 0 5.89 13.6 4.9 80 0.152
3Vc 6708 3V
(6702) 1023
Mo2C (hcp) 3.007(1) 4.818(2) 2.7±0.7 5.97 14.1 3.8 99 0.139
5Vc 6704 5V (6271)
1023 Mo2C (hcp) 3.006(1) 4.797(2) 4.4±0.5 6.01 13.7 4.1 107 0.175
8Vc 6703 8V
(6697) 1023
Mo2C (hcp) 3.004(1) 4.786(2) 8.0±0.7 6.11 13.5 3.8 101 0.194
11Vc 6701 11V (6601)
1023 Mo2C (hcp) 3.017(1) 4.857(3) 11.3±1 6.18 13.2 3.3 97 0.184
46

47
2.3.2 Carburisation of hexagonal Mo/V oxides
In the case of all of the precursor oxides (Rox, 0Vox—11Vox) it was observed that
hexagonal β-Mo2C is obtained as a result of temperature-programmed reduction-
carburisation under H2/CH4 (Figure 2.9). The resulting carbides, prepared in the in situ
cell of the X-ray diffractometer are referred to as; Rc, 0Vc, 3Vc, 5Vc, 8Vc, 11Vc and
the physical properties are outlined in Table 2.3.
20 40 60 80
8Vc
5Vc
3Vc
201
11Vc
0Vc
112
10311
0
102
101
002
Int.
(A.U
)
2θ
100
Rc
Figure 2.9: Normalised powder X-ray diffractograms of the product carbides Rc, 0Vc –
11Vc measured at T = 25°C.
In Figure 2.10, the phase evolution of the precursor reduction-carburisation is
illustrated by waterfall plots of the diffraction patterns recorded in situ at 50°C
intervals. The reduction proceeds from the precursor oxide structure (α-MoO3, h-
MoO3) consecutively reducing to MoO2 between 350–450°C and to the carbide
between 550–600 °C. From the plots it is observed that the temperature observed for
the initial reduction of the h-Mo(V)O3 precursors to Mo(V)O2 increases with
vanadium content.

48
Figure 2.10: Evolution of in situ XRD patterns during the temperature programmed
reaction under He-H2-CH4. (a) Rox → Rc; (b) 0Vox → 0Vc; (c) 3Vox → 3Vc; (d) 5Vox →
5Vc; (e) 8Vox → 8Vc; (f) 11Vox → 11Vc.
In Figure 2.11, the diffraction patterns of the precursor oxides are presented as a top-
down plot of 2θ vs. temperature with the normalised square root of the intensity to
enhance peak visibility. From this plot it is evident that the stability of the oxides to
reduction increases with vanadium loading. At this temperature resolution no
difference in the final carburisation temperature is observed, however, significant
25 30 35 40 45 50
25 30 35 40 45 502θ
25 30 35 40 45 502θ
25 30 35 40 45 5025 30 35 40 45 50
25 30 35 40 45 50
(a) (b)
(c) (d)
(e) (f)
50
750750750750
750
700650600550500450400350300°C
–R –0V
–3V –5V
–8V –11V

49
peak broadening is observed for the carburisation of α-MoO3 cf. h-MoO3 and
increasingly broad diffraction peaks are seen with dopant vanadium concentration.
Analysis of the products physical properties is presented in the next section.
Figure 2.11: Contrast plot of the normalized √Intensity vs. temperature over the phase
evolution of R, 1, 3 & 5 from MoO3 → (Mo4O11) → MoO2 → Mo2C. The outlined areas
emphasise the observed phase changes in the h-Mo(V)O3 reduction-carburisation.
In the top-down plot (Figure 2.11) for 0Vc there is observed an intermediate phase not
observed for the other precursors. To determine the nature of this intermediate phase
the in situ carburisation experiments were repeated with an offset temperature of 25°C
to interpolate the data and provide an effective increase in the time resolution. The
intermediate scan at T = 375°C is shown in Figure 2.12 and the unknown phase was
determined to be orthorhombic o-Mo4O11, which has also been observed by Choi et
al. as an intermediate in the reduction-carburisation of a structurally similar
ammonium molybdate.[39]

50
Figure 2.12: In situ XRD scan of h-MoO3 (0Vox) TPR-carburisation at 375°C showing
intermediate o-Mo4O11 phase.
Formation of the closely related monoclinic m-Mo4O11 can be observed in the
reduction of α-MoO3 → MoO2, the first step in the industrial production of
molybdenum metal. The role of m-Mo4O11 in this reaction was long believed to be as
an intermediate in the reduction of MoVI → MoIV which is thermodynamically
stabilised under certain conditions of temperature and H2 partial pressure.[40] More
recently this has been disputed and it is demonstrated in separate studies to be a result
of the comproportionation of α-MoO3 and MoO2 via an oxygen exchange
mechanism.[40-42] It was shown by Ressler et al. that the reaction:
3MoO3 + MoO2 → Mo4O11
occurs in reducing conditions at temperatures > 425°C depending on the partial
pressure of H2.[40] In the same study, an Arrhenius plot generated from a series of
isothermal reduction experiments gives two apparent activation energies for the
reduction depending on the temperature. At temperatures > 425°C, the reduction
MoO3 → MoO2 is observed to occur with apparent activation energy of 103kJ/mol.
Below 425°C the reduced activation energy of 34kJ/mol is observed. It was concluded
from this study that the activation energies corresponded to the kinetic regime with
22 24 26 28 30 32 34 36 38 40 420
20
40
60
80
Inte
nsity
(A
.U.)
2θ
MoO2
o-Mo4O
11
h-MoO3
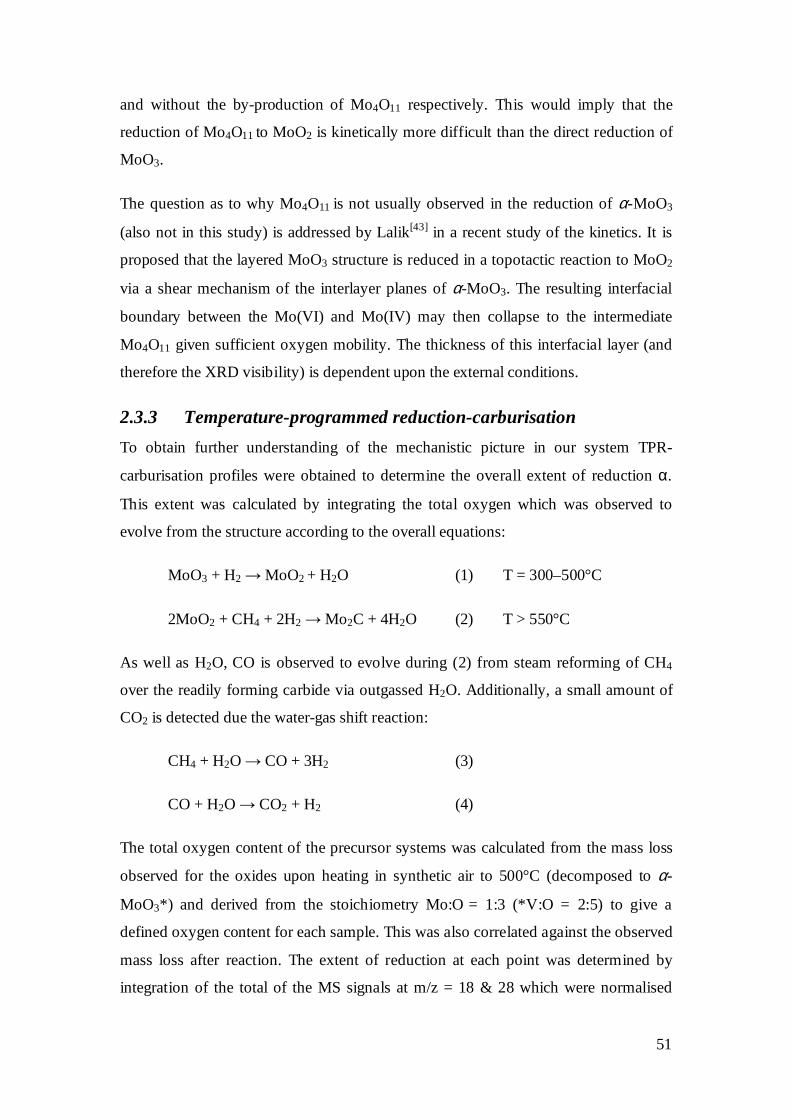
51
and without the by-production of Mo4O11 respectively. This would imply that the
reduction of Mo4O11 to MoO2 is kinetically more difficult than the direct reduction of
MoO3.
The question as to why Mo4O11 is not usually observed in the reduction of α-MoO3
(also not in this study) is addressed by Lalik[43] in a recent study of the kinetics. It is
proposed that the layered MoO3 structure is reduced in a topotactic reaction to MoO2
via a shear mechanism of the interlayer planes of α-MoO3. The resulting interfacial
boundary between the Mo(VI) and Mo(IV) may then collapse to the intermediate
Mo4O11 given sufficient oxygen mobility. The thickness of this interfacial layer (and
therefore the XRD visibility) is dependent upon the external conditions.
2.3.3 Temperature-programmed reduction-carburisation
To obtain further understanding of the mechanistic picture in our system TPR-
carburisation profiles were obtained to determine the overall extent of reduction α.
This extent was calculated by integrating the total oxygen which was observed to
evolve from the structure according to the overall equations:
MoO3 + H2 → MoO2 + H2O (1) T = 300–500°C
2MoO2 + CH4 + 2H2 → Mo2C + 4H2O (2) T > 550°C
As well as H2O, CO is observed to evolve during (2) from steam reforming of CH4
over the readily forming carbide via outgassed H2O. Additionally, a small amount of
CO2 is detected due the water-gas shift reaction:
CH4 + H2O → CO + 3H2 (3)
CO + H2O → CO2 + H2 (4)
The total oxygen content of the precursor systems was calculated from the mass loss
observed for the oxides upon heating in synthetic air to 500°C (decomposed to α-
MoO3*) and derived from the stoichiometry Mo:O = 1:3 (*V:O = 2:5) to give a
defined oxygen content for each sample. This was also correlated against the observed
mass loss after reaction. The extent of reduction at each point was determined by
integration of the total of the MS signals at m/z = 18 & 28 which were normalised

52
relative to the known CO concentration from the COx IR detector. For simplicity CO2
can be disregarded as it was found to contribute < 1% to the total oxygen evolved.
350 400 450 500 5500.0
0.2
0.4
0.6
0.8
1.0 0Vox 3Vox 5Vox 8Vox 11Vox
Mo4O
11
formation
m/z
= 1
8 (A
.U.)
Temperature (°C)
Increasing V
Figure 2.13: Temperature-programmed reduction-carburisation profiles of the normalized
H2O (m/z = 18) signal for h-Mo1-xVxO3.
Figure 2.13 shows the evolution of H2O (the only O-containing educt detected in the
initial reduction [1]) for the hexagonal oxide series. In agreement with the in situ
XRD study we observe an increase in the water peak to higher temperatures with
increasing V content. Additionally, it is apparent that at lower vanadium loadings
there are additional peaks which appear to be related to the observed ‘o-Mo4O11’
phase at 375–400°C. This peak disappears entirely for the 8Vox sample which also
presents the most uniform reduction peak. The 11Vox shows a slight shoulder at
higher temperatures (475-500°C) which may be related to the reduction of VOx
moieties.
In Figure 2.14 the reduction profiles vs. temperature at different heating rates are
contrasted for the α-MoO3, 0Vox and 8Vox samples. Comparison of each reduction
profile at 1°C/min shows most clearly the influence of the precursor structure on the
reduction kinetics. For the reduction of α-MoO3 (Figure 2.14a) an initial exponential
increase in reduction is observed between 375 – 425°C.
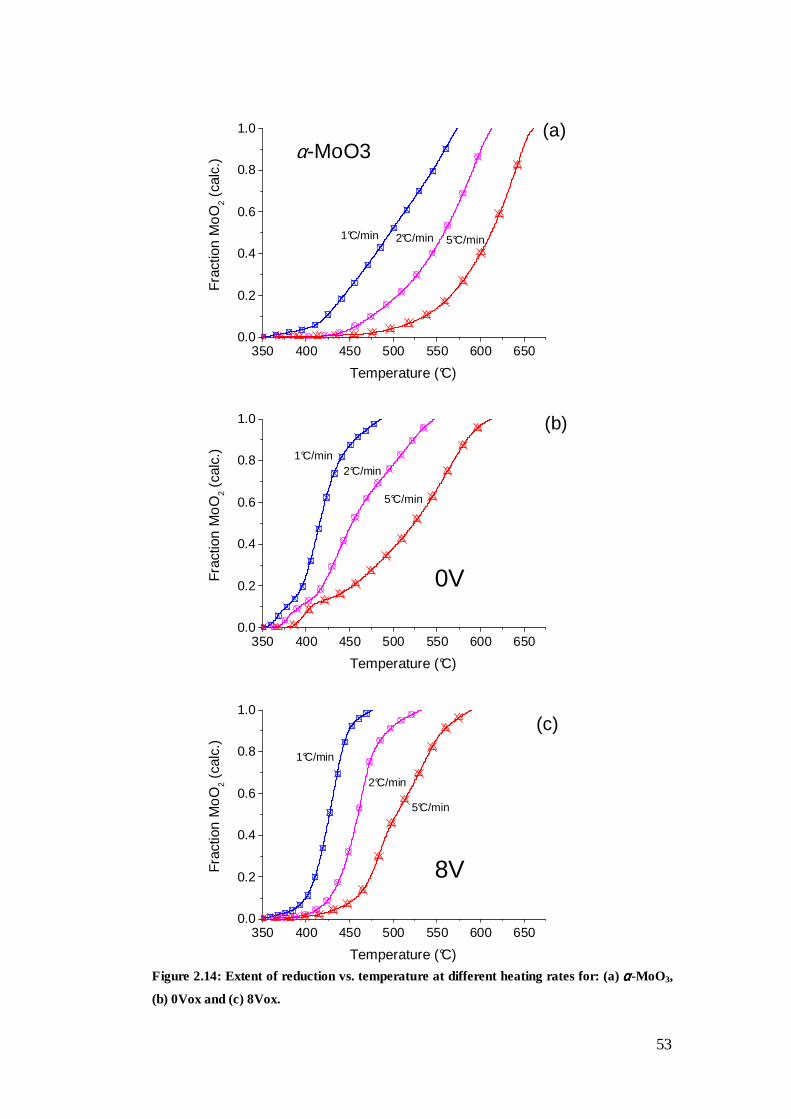
53
350 400 450 500 550 600 6500.0
0.2
0.4
0.6
0.8
1.0
5°C/min2°C/min
(a)
Fra
ctio
n M
oO
2 (c
alc.
)
Temperature (°C)
1°C/min
α-MoO3
350 400 450 500 550 600 6500.0
0.2
0.4
0.6
0.8
1.0 (b)
0V
1°C/min2°C/min
5°C/min
Fra
ctio
n M
oO
2 (c
alc.
)
Temperature (°C)
350 400 450 500 550 600 6500.0
0.2
0.4
0.6
0.8
1.0(c)
8V
1°C/min
2°C/min
5°C/min
Fra
ctio
n M
oO
2 (c
alc.
)
Temperature (°C) Figure 2.14: Extent of reduction vs. temperature at different heating rates for: (a) αααα-MoO3,
(b) 0Vox and (c) 8Vox.

54
This could be associated with an increase in reacting surface area, followed by an
almost linear reduction to MoO2. This is in contrast to the 0Vox sample (Figure 2.14b)
which exhibits an initial fast reduction to orthorhombic Mo4O11 between 350 – 400°C
followed by a relatively steep reduction curve to MoO2 which is almost complete by
425°C. The vanadium containing precursor 8Vox (Figure 2.14c) has a delayed onset
of reduction but is reduced smoothly to MoO2 between 400 – 450°C. Increasing the
temperature rate in the case of α-MoO3 and 0Vox has the effect of distorting the
reduction curve to an overall exponential shape which is most pronounced in the case
of α-MoO3 but also observed for the 5°C/min heating rate of 0Vox. The vanadium
containing precursor 8Vox shows a delayed onset of reduction but overall retains the
same curve shape with only slight distortion at the 5°C/min heating rate. The
distortion in the reduction curve for the highest temperature rate can thus be explained
as the delayed onset of oxygen mobility due to vanadium doping.
The second stage of reduction from MoO2 → Mo2C is illustrated in Figure 2.15 which
compares the extent of reduction of the precursor oxides vs. temperature at a ramping
rate of 1°C/min over the temperature range 475 – 675°C. Here we see that the
influence of vanadium is to retard the reduction-carburisation process. Disregarding
the case of α-MoO3 we can see from Figure 2.15b that the initial consumption of
methane (m/z = 15), indicating the onset of carbon incorporation, begins at
progressively higher temperatures ranging from 578°C for 0Vox to 595°C for 8Vox.
When we correlate these temperatures with the integrated reduction curve of Figure
2.15a it is apparent that the carburisation process does not begin at the completion of
the reduction MoO3 → MoO2. The average oxidation state of the Mo can be seen to be
~MoO1.33 which corresponds to Mo3O4 (or MoIVO2.2MoIIO; or 2MoIVO2.Mo0). This
can be seen from the X-ray diffractograms in Figures 2.10 and 2.11 that the crystalline
phase MoO2 persists until around this exact temperature range. Because there are no
other crystalline phases observed, the implications of this are that MoIV is coexisting
with a lower oxidation state of molybdenum such as metallic Mo0 or alternatively
‘Mo IIO’ — a cubic oxide phase which has been observed as micro-domains within
stabilising matrices.[44-46] Or alternatively, an intermediate oxidation state (MoIII)
exists, such as that reported by Davies et al.[47] To date there is very little support in
the literature for such an electronic state and it should be considered as merely
speculative without stronger evidence.

55
475 500 525 550 575 600 625 650 675
40
50
60
70
80
90
100
~ MoO1.33
Mo2C
α-MoO3
0V 3V 8V
O r
educ
tion
from
MoO
3(%
)
Temperature (°C)
(a)
MoO2
475 500 525 550 575 600 625 650 675
(b)
578°C
585°C
8Vox 3Vox 0Vox α-MoO
3
m/z
= 1
6 (A
.U.)
Temperature (°C)
595°C
475 500 525 550 575 600 625 650 675
0.0
0.1
0.2
0.3
0.4
0.5 α-MoO
3
0V 3V 8V
CO
sig
nal
(A
.U.)
Temperature (°C)
(c)
Figure 2.15: (a) TPR-carburisation profiles at 1°C/min showing the reduction MoO2 →
Mo2C. Extent of reduction is indicated on the y-axis (MoO3 = 0%; MoO2 = 33%; Mo2C =

56
100%). (b): Consumption of CH4 (m/z = 15) vs. temperature at 1°C/min. (c): Evolution of
CO (IR signal) vs. temperature at 1°C/min. Note – some data points are omitted for clarity.
MoIIO is discussed in the context of alkane isomerisation catalysis[48, 49] and is more
widely accepted as an intermediate oxidation state of Mo.[50, 51] However, from the
data at hand we cannot make further distinction as to the true nature of this oxidation
state apart from the fact that it lies directly between the disappearance of MoO2
crystalline phase and emergence of Mo2C.
What is happening in the case of α-MoO3 is less clear due to the complexity of its
reduction profile (Figure 2.16). α-MoO3 is known to incorporate hydrogen and form
bronzes as well as the so-called Magnéli phases which come about through a shear
mechanism of reduction. From Figure 2.15 it appears that incorporation of carbon in
α-MoO3 is at an earlier stage of reduction, however, from the in situ XRD
diffractograms we also observe the persistence of MoO2 phase until 575-600°C.
In parallel with the removal of oxygen in the form of water (eqn. 2) is the observation
of CO which is formed via a complex reforming process (eqn. 3) involving lattice
carbon substitution as demonstrated by Green.[52] Interestingly, as seen in Figure
2.15(c) formation of CO is observed at lower temperatures and is more pronounced
for the α-MoO3 cf. the hexagonal precursors. In all cases the peak is observed to
correlate with the completion of reduction (at which point the H2O reforming source
is depleted). The CO peak area related to the TPR-carburisation of α-MoO3 is
considerably larger than those observed for the hexagonal precursor oxides implying
that the reforming reaction is more effectively catalysed. The exact reasons for this
relative increase and for the inclusion of carbon at lower temperatures cf. h-MoO3 are
not speculated on here.
For all of the oxides in the step: MoO2 → Mo2C, there is an exponential increase in
reduction with temperature which is consistent with an increase in available reacting
surface area as reported by Green.[24] Additionally, it is seen that 0Vox and 3Vox are
reduced to carbides more easily than 8Vox and α-MoO3. These observations are in
accordance with the hypothesis that vanadium reduces the mobility of oxygen in the
structure and thus retards the removal of lattice oxygen and subsequently carbon
inclusion.

57
2.3.4 Solid state kinetic analysis of TPR curves
The solid state kinetic analysis was carried out using the following approaches:
• Integration and normalisation of the TPR-carburisation data to determine ‘α’
• Model-free analysis of the non-isothermal data using Friedmann and Ozawa-
Flynn-Wall methods to determine the conversion-dependent activation energy
• Derivation of the ‘generalised time’ using calculated activation energies to
give an approximation for: θ/θ0.5 = t/t0.5
• Use of master plot methods to elucidate the reaction mechanism by
comparison with the treated data
The reduction curves for α-MoO3, h-MoO3 (0Vox), h-Mo0.97V0.03O3 (3Vox) and h-
Mo0.92V0.08O3 (8Vox) can be seen in Figure 2.16 in which α = 1 corresponds to Mo2C.
In the ideal case therefore we can define α = 0.33 for the case of the reduction:
MoO3 → MoO2 — (1)
And the carburisation is observed for 0.33 < α < 1:
MoO2 → Mo2C — (2)
To picture these mechanistic steps we have carried out the model-free kinetic analysis
using a Friedmann analysis[53] which is a multi-point analysis determined by plotting
log(dα/dt) vs. 1/T at different iso-conversions for a range of heating rates (β). The
specific advantage of this analysis is that the plot does not require a constant rate of
temperature change; this is of relevance because the TPR measurements are carried
out using a temperature ramp followed by a plateau. In the case of data obtained at
1°C/min, the oxide is entirely reduced by the final temperature — 675°C, however, at
the highest heating rate of 5°C/min, the reduction-carburisation is not complete until
sometime after the plateau. For these reasons we must use the Friedmann analysis if
we are to consider the entire reduction MoO3 → Mo2C and observe trends. From
Figure 2.17 we can see that the reduction of the orthorhombic α-MoO3 differs from
that of the hexagonal h-MoO3-type oxides. The reduction of orthorhombic α-MoO3
has an initially low apparent activation energy which gradually increases to a value of
~100 kJ/mol just before α = 0.33.

58
Figure 2.16: (a) Normalised MS signals (CO, H2O) for the TPR-carburisation of oxide
precursors at 1°C/min. (b) Calculated extent of reduction (αααα) for above conditions.
This is followed by an inflection point which indicates the beginning of carburisation.
This analysis is consistent with previously reported studies such as those of Ressler et
al. and Lalik.[40-42] The Friedmann analysis of the hexagonal oxides shows a different
picture. Here we see that the initial apparent activation energy is high (> 100 kJ/mol)
and decreases rapidly at around α = 0.1. From this we can conclude that for the
hexagonal oxides that there are at least two mechanistic steps in the reduction MoO3
00:00 01:00 02:00 03:00 04:00 05:00 06:00 07:00350
400
450
500
550
600
650
700 temperature h-MoO
3 - 8650
h-Mo0.92
V0.03
O3 - 6702
h-Mo0.97
V0.08
O3 - 6697
α-MoO3 - 11741
Time / hh:mm
Te
mp
era
ture
/ °C
m/z =
28m
/z = 1
8
0
20
40
60
80
100
00:00 02:00 04:00 06:00350375400425450475500525550575600625650675700
α
O reduction / %T
emp /
°C
Time (hh:mm)
0.0
0.2
0.4
0.6
0.8
1.0
(a)
(b)
(1)
(2)
0Vox
3Vox
8Vox

59
→ MoO2 which is further evidenced by the observed o-Mo4O11 phase seen in the in
situ XRD.
Figure 2.17: Friedmann analysis of TPR-carburisation for αααα-MoO3, 0Vox, 3Vox & 8Vox
showing the two steps of reduction-carburisation — (1) & (2).
As the concentration of vanadium increases we can also see that the apparent
activation energy for the carburisation step (2) increases. In the case of h-MoO3 the
apparent activation energy of carburisation is ~100 kJ/mol — close to that observed
for the orthorhombic oxide precursor. For the 3V and 8V samples this is increased to
130 and 150 kJ/mol, respectively. It is also notable that the activation energies for
reduction (1) and carburisation (2) become increasingly well defined stepwise with
the addition of vanadium. In the case of the carburisation of 8V we can see that the
there are three clear mechanistic steps and that the carburisation is strongly separated
from the reduction.
Although these activation energies help to paint a mechanistic picture we can see that
there is a considerable degree of error and if we consider the calculated energies we
must conclude that they are in some cases unrealistic (Ea = 0 kJ/mol). To improve the
accuracy of these measurements an alternative model-free system called Ozawa-
0 0.2 0.4 0.6 0.8 Fractional Reaction
40
60
80
100
120
140
160E/(kJ/mol)
0 0.2 0.4 0.6 0.8 Fractional Reaction
0
20
40
60
80
100
E/(kJ/mol)
0 0.2 0.4 0.6 0.8 Fractional Reaction
0
20
40
60
80
100
120
140
E/(kJ/mol)
0 0.2 0.4 0.6 0.8 Fractional Reaction
0
20
40
60
80
100
120
140
160
E/(kJ/mol)
α-MoO3 h-MoO3 – 0Vox
h-Mo0.97V0.03O3 – 3Vox h-Mo0.92V0.08O3 – 8Vox
(1) (2)
(1) (2)
(1) (2) (1) (2)

60
Flynn-Wall analysis was applied.[29] Ozawa-Flynn-Wall technique is a Multi-point
analysis which is determined by plotting log(dT/dt) vs. 1/T at different iso-
conversions. This technique requires a constant temperature rate (dT/dt) and so we
redefine a new extent of reaction, α’, where α’ = 0.5 α. In this way we define
fractional conversions for which the temperature is changing in a constant manner.
Figure 2.18: Ozawa-Flynn-Wall analysis of the TPR-carburisation as in Figure 2.16. The
extent of reaction is redefined as αααα ’ = 0.5 α α α α which gives αααα’0.66 → MoO2
We see for the Ozawa-Flynn-Wall analyses in Figure 2.18 that we minimize the
related error and that the calculated activation energies lie within a realistic range of
values. The general trends are similar to the Friedmann analysis. We see a high
activation barrier for the reduction of the hexagonal oxide h-MoO3 (~180 kJ/mol)
which decreases with vanadium concentration. Importantly, from these calculated
values we can try to apply the data to a kinetic model.
0 0.2 0.4 0.6 0.8 1.0 Fractional Reaction
40
60
80
100
120
E/(kJ/mol)
0 0.2 0.4 0.6 0.8 1.0 Fractional Reaction
40
60
80
100
120
140
160
180
200
E/(kJ/mol)
0 0.2 0.4 0.6 0.8 1.0 Fractional Reaction
40
60
80
100
120
140
160
E/(kJ/mol)
0 0.2 0.4 0.6 0.8 1.0 Fractional Reaction
50
70
90
110
E/(kJ/mol)
α-MoO3 h-MoO3 — 0Vox
h-Mo0.97V0.03O3 — 3Vox h-Mo0.92V0.08O3 — 8Vox
(1) (2)
(1) (2)
(1) (2)
(1) (2)

Table 2.4: Solid-state rate and integral expressions for different reaction models.[54]
Model Differential form
f(α) Integral form
g(α) Notes
Pm — power law �� �� � �
� � = 2,3,4
Am — Avrami–Erofeev ��1 − ��[− ln�1 − ��] �� [− ln�1 − ��] �
� � = 2,3,4
R2 — contracting area 2�1 − ���� 1 − �1 − ���
�
R3 — contracting volume 3�1 − ���� 1 − �1 − ���
�
Fm — mth-order reaction �1 − ���
� = 0,1,2,3
D1 — one dimensional diffusion 1
2� ��
D2 — two dimensional diffusion − � 1ln�1 − ��� ��1 − �� ln�1 − ��� + �
D3 — three dimensional diffusion (Jander equation)
�3�1 − �����
�2�1 − �1 − ������
�1 − �1 − ������
D4 — three dimensional diffusion (Ginstlinge Brounshtein equation)
3�2��1 − ����
� − 1�� 1 − �2
3� � − �1 − ����
61

62
Table 2.4 is an overview of some of the mathematical expressions for the rate
parameters for different kinetic models of solid state reactions.[54] These equations are
derived from geometric models which approximate the change of reaction rate with
respect to α over time. The functions f(α) and g(α) denote the differential and integral
forms, respectively, of these rate equations. By plotting f(α)/f(α0.5) or g(α)/g(α0.5)
vs. α, the resulting curves all overlap at α = 0.5 and for the case of isothermal
experiments may be compared with measured kinetic data of the form: t/t0.5 vs. α,
where t = reaction time.
In the case of non-isothermal experiments we cannot use the time of reaction but we
must derive an equivalent — ‘generalized time’ = θ.[29] Simply put, generalised time
is derived using the Arrhenius equation and is equivalent to the time of reaction at
infinite temperature. To do this we define θ as:
� = � �!�"#
This gives us a new expression for the rate constant k0 independent of temperature:
$ = $% �!�
Having derived k0 we define a function f(α) for the reaction rate:
"�"� = $%&���
Further mathematical treatment leads to the equality:
��%.(
= ##%.(
Although we cannot calculate the value of θ directly, it can be approximately related
to the function p(x) as follows:
))*.+
= ,�-�,�-�*.+
where, .�/� = 012- 3�/� & / = 4/6!

63
Now, by using the apparent energies of activation calculated by model-free techniques
we compare the reaction data to a suite of kinetic models and make some hypotheses
with regards to the reaction mechanism.
0.0 0.2 0.4 0.6 0.8 1.00
2
4
6
8
10
12
θ/θ 0.
5
g(α)
/g(α
0.5)
α'
R2 R3 F1 A2 A3 D2 D3 D4
1Kpm #6697 - 8% V 1Kpm #6702 - 3% V 1Kpm #8650 - 0% V
Figure 2.19: Comparison of rate data calculated using ‘generalised time’ derived from
conversion-dependent activation energies derived from the Ozawa-Flynn and Wall analysis
for the reduction-carburisation of h-Mo(V)O3 oxide precursors.
In Figure 2.19 the calculated rate data are compared against a suite of reaction models
(see Table 2.4). Note that the midpoints of the curve all intersect at α = 0.5. From the
degree of mismatch we can see that our curve overlaps with more than one
mechanistic step. If we assume that the MoO3 is reduced via an intermediate MoO3-x,
we know the initial reduction MoO3 → MoO2 to be complete at α = 0.66, so we have
a defined endpoint for the mechanism. By differentiating the data above we can make
an accurate determination for the beginning of the mechanism which is shown in
Figure 2.20 as the point at which d(θ/θ0.5)/dα’ is > 1. For h-MoO3 this mechanism is
found to be α = 0.26 and for the vanadium containing oxides it was found to be α =
(1) (2)

64
0.32. Now we are free to redefine the extent of reaction so as to encompass only the
hypothesized mechanism: MoO3-x → MoO2.
Figure 2.20: Differentiated plot of Figure 2.19 showing the beginning of the mechanism
MoO3-x → MoO2.
For the reaction we can now rescale our extent of reaction, α’’:
α’’ = 0 → MoO3-x (x = 0.39 for h-MoO3; x = 0.48 for h-Mo(V)O3
α’’ = 1 → MoO2
The resulting master plots can be seen in Figure 2.21 for the oxide series 0V, 3V and
8V. For all of the reductions the most appropriate models are the diffusion models of
reaction. In the case of h-MoO3 and h-Mo0.97V0.03O3 the comparison to the diffusion
models is valid only for α’’ < 0.5. For conversions above α’’ = 0.5 it is observed that
the model is not compatible. However, for the oxide h-Mo0.92V0.08O3 (8Vox), the D3
model, or 3-dimensional diffusion model (Jander)[55] is a close match. It is therefore
observed that the reaction mechanism is singular across the full range of 0 < α’’ < 1.
These findings imply that for the h-MoO3 (0Vox) and h-Mo0.97V0.03O3 (3Vox) oxides,
the initial reduction step → MoO2 involves a more complex mechanism than we have
proposed. From the model-free analyses of activation energy we could postulate that
this is in regards to an early onset of carburisation or the formation less reducible
species which change the diffusional mechanism. This possibility is supported by the
TPR-carburisation spectra which shows a distortion in the sigmoidal reduction curves
for 0Vox at higher heating rates for β > 1°C/min (Figure 2.14).
0.10 0.15 0.20 0.25 0.30 0.35 0.40
0
1
2
3
d(θ/
θ 0.5)/
dα'
α'
8650 6702 6697
h-MoO3
α’ = 0.26 h-Mo(V)O3
α’ = 0.32

65
0.0 0.2 0.4 0.6 0.8 1.0
0
1
2
3
4
5 D4
F1
R3
R2
A2
A3
D2D3
θ/θ 0.
5
g(α)
/g(α
0.5)
α''
1Kpm 2Kpm 5Kpm
0.0 0.2 0.4 0.6 0.8 1.0
0
1
2
3
4
5 D4
F1
R3
R2
A2
A3
D2D3
θ/θ 0.
5
g(α)
/g(α
0.5)
α''
1Kpm 2Kpm 5Kpm
0.0 0.2 0.4 0.6 0.8 1.0
0
1
2
3
4
5 D4
F1
R3
R2
A2
A3
D2D3
θ/θ 0.
5
g(α)
/g(α
0.5)
α'
1Kpm 2Kpm 5Kpm
Figure 2.21: Master plot comparisons of the temperature-programmed reduction
(MoO3-x → MoO2) of h-Mo(V)O3 type oxides at various heating rates. (a) h-MoO3 (0Vox);
(b) h-Mo0.97V0.03O3 (3Vox); (c) h-Mo0.92V0.08O3 (8Vox).
(a)
(b)
(c)
h-MoO3
h-Mo0.97V0.03O3
h-Mo0.92V0.08O3

66
2.3.5 Analysis of X-ray diffraction patterns
The carbide derived from the h-MoO3 precursor, 0V, exhibits a broadening of the
carbide peaks cf. the orthorhombic derived material. In the case of the vanadium-
containing oxides h-Mo1-xVxO3, it is observed that the subsequent carbide diffraction
patterns are broadened significantly (Figure 2.9), implying that the carbide crystallites
are smaller. Software analysis of the ex situ XRD data shows a trend in the particle
sizes of the as-synthesised carbides. Based on the integral breadth, the volume-
weighted column heights vary from 6.3 nm for the reference carbide, R, to 3.3 nm for
the most highly substituted carbide, 5 (Table 2.3).
From software analysis of the final XRD patterns 1 – 5 (Figure 2.10) a close fit for α-
Mo2C is achieved with a hexagonal space group (P63/mmc) using a Pawley
refinement with the addition of Mo metal as a minority Rietveld phase. In the case of
the reference R, the Pawley indexed phase combined with a minority MoC1-x Rietveld
phase gives the most satisfactory fit. The assignment of minority phases in these
samples can be rationalised by considering that in the case of molybdenum carbide
synthesised from orthorhombic MoO3, pretreatment of the oxide under H2 leads to
bronze-like hydrogenation of the structure which is subsequently carburised to the
less stable cubic MoC1-x.[56] This preconditioning occurs to some extent during regular
carburisation of the orthorhombic oxide leading to a minority phase. In the case of the
hexagonal oxides this minority phase is not observed.
As the diffraction peaks of the carbides are extremely broad, the cell parameters
obtained from the diffraction patterns do not show a systematic trend as did the
oxides, but it can be seen that there is no evidence of crystalline VxOy or VC. Further
evidence for a homogenous solid solution is presented in a later section as
demonstrated by elemental mapping using energy filtered TEM.
2.3.6 Carbon determination
CHN analysis of the carbides shows an excess of carbon with respect to the
theoretical values calculated for stoichiometric M2C (Table 2.3). The excess carbon is
due to the synthetic conditions applied in the in situ XRD cell in which the materials
are formed. These applied conditions were derived by consideration of the ideal
synthesis conditions by Lee et al.[3] combined with consideration of the
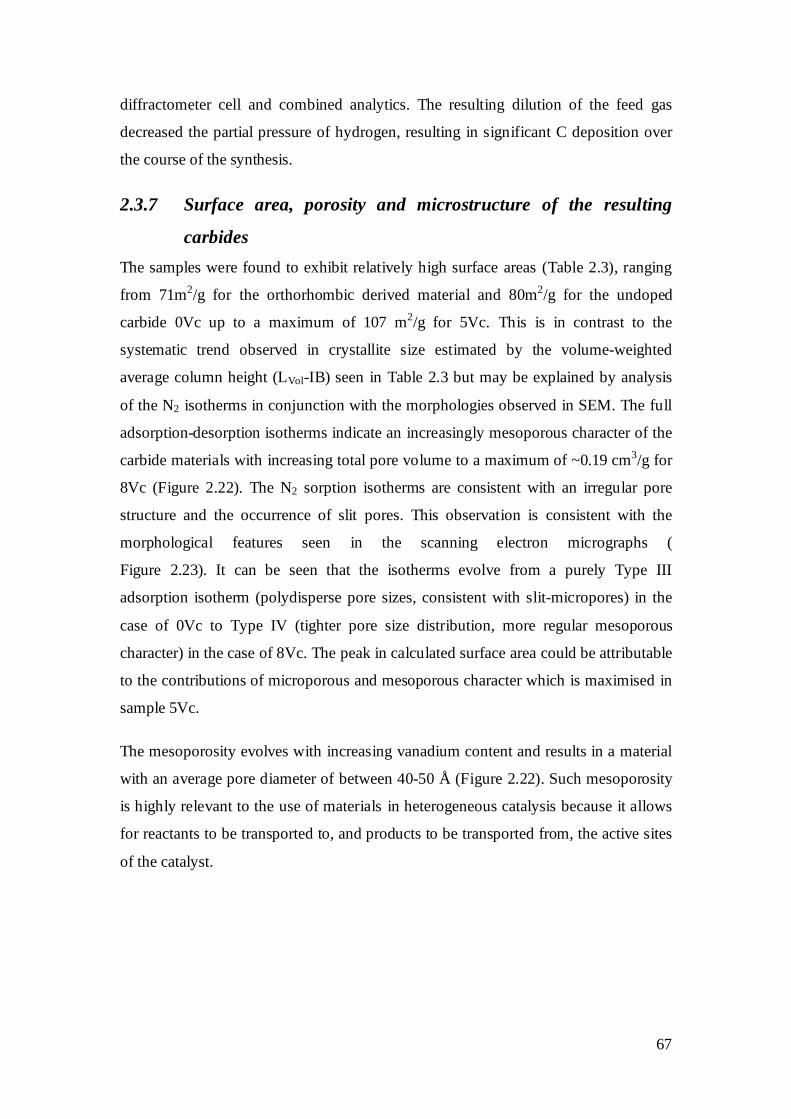
67
diffractometer cell and combined analytics. The resulting dilution of the feed gas
decreased the partial pressure of hydrogen, resulting in significant C deposition over
the course of the synthesis.
2.3.7 Surface area, porosity and microstructure of the resulting
carbides
The samples were found to exhibit relatively high surface areas (Table 2.3), ranging
from 71m2/g for the orthorhombic derived material and 80m2/g for the undoped
carbide 0Vc up to a maximum of 107 m2/g for 5Vc. This is in contrast to the
systematic trend observed in crystallite size estimated by the volume-weighted
average column height (LVol-IB) seen in Table 2.3 but may be explained by analysis
of the N2 isotherms in conjunction with the morphologies observed in SEM. The full
adsorption-desorption isotherms indicate an increasingly mesoporous character of the
carbide materials with increasing total pore volume to a maximum of ~0.19 cm3/g for
8Vc (Figure 2.22). The N2 sorption isotherms are consistent with an irregular pore
structure and the occurrence of slit pores. This observation is consistent with the
morphological features seen in the scanning electron micrographs (
Figure 2.23). It can be seen that the isotherms evolve from a purely Type III
adsorption isotherm (polydisperse pore sizes, consistent with slit-micropores) in the
case of 0Vc to Type IV (tighter pore size distribution, more regular mesoporous
character) in the case of 8Vc. The peak in calculated surface area could be attributable
to the contributions of microporous and mesoporous character which is maximised in
sample 5Vc.
The mesoporosity evolves with increasing vanadium content and results in a material
with an average pore diameter of between 40-50 Å (Figure 2.22). Such mesoporosity
is highly relevant to the use of materials in heterogeneous catalysis because it allows
for reactants to be transported to, and products to be transported from, the active sites
of the catalyst.

68
0.0 0.2 0.4 0.6 0.8 1.00
25
50
75
100
125
150
0Vc 3Vc 5Vc 8Vc 11Vc
V (
cc/g
)
p/p0
0 50 100 150 200
0.000
0.002
0.004
0.006
0.008
0.010 0Vc 3Vc 5Vc 8Vc 11Vc
cc/Å
/g
Å Figure 2.22: Above: comparison of N2 adsorption-desorption isotherms for samples 0Vc –
11Vc. Below: BJH (Barett-Joyner-Halenda) approximation of pore size distributions for
samples 0Vc – 11Vc.
The SEM images of the as-synthesised carbides show an interesting morphological
trend. With increasing vanadium content, it is observed that the morphology evolves

69
from that of an agglomerated-particulate material to a densely packed nano-fibrous
material with visible mesoporosity (Figure 2.2).
The apparent fibers propagate lengthwise along the c-axis relative to the original
parent oxide crystals. To this extent pseudomorphism is evident in the preservation of
the overall hexagonal prismatic structure observed in the parent oxide species.
Figure 2.23: SEM images of the carburised materials Rc, 0Vc–11Vc

70
With increasing V content, it is observed in the SEM imagery that the carbides
present an evolved mesoporosity, which originates from a smaller, more organised
morphology comprised of nanocrystalline carbide. The fiber-like nature becomes
increasingly dense with a trend towards a finer and more regular morphology. With
reference to the temperature-programmed reduction-carburisation profiles presented
in Figures 2.13–2.15, sample 8Vc, which exhibits the most uniform mesoporosity as
seen in the N2 physisorption isotherms, is characterised by the cleanest reduction
profile. The trend is observed towards increasing mesoporosity with decreasing
formation of intermediate o-Mo4O11. It is hypothesised that the kinetic ‘interference’
of Mo suboxide formation is linked to sintering and aggregation of particles in what is
otherwise described as the topotactic reduction of MoO3 → MoO2.[43] There are
conflicting reports of the topotactic/pseudomorphic nature of this reduction,[3, 57, 58]
however, these are not incommensurable with mechanisms discussed in the literature,
which are highly dependent on the applied conditions and mass transport
limitations.[40, 43, 59, 60]
Characterisation of the intermediately doped sample 8Vc by Transmission Electron
Microscopy is consistent with the morphology observed by SEM. Figure 2.24 shows a
HR-TEM image of the high-aspect ratio crystallites, which make up the fibrous
bundles observed in the SEM (Figure 2.23). The low-magnification image in Figure
2.25 is a micrograph of 8Vc taken in HAADF-STEM mode (high angle annular dark
field-scanning transmission electron microscopy) which shows a homogenous
distribution of the elements Mo, V and C throughout the observed sample. The
observed oxygen content is due to the passivation procedure.

71
Figure 2.24: TEM image of 8Vc with low magnification image (inset top right) and spot
diffraction pattern applied over a large area (inset bottom right).
Figure 2.25: STEM-HAADF image of 8Vc combined with EDX-elemental maps for V, Mo,
C and O showing a statistical distribution of elements within the sample.
Of particular interest in the TEM study was the observation that the spot diffraction
pattern of the parent polycrystallite exhibits a circular pattern of elongated spots,
indicating that the co-formed carbide particles have preserved crystallographic order
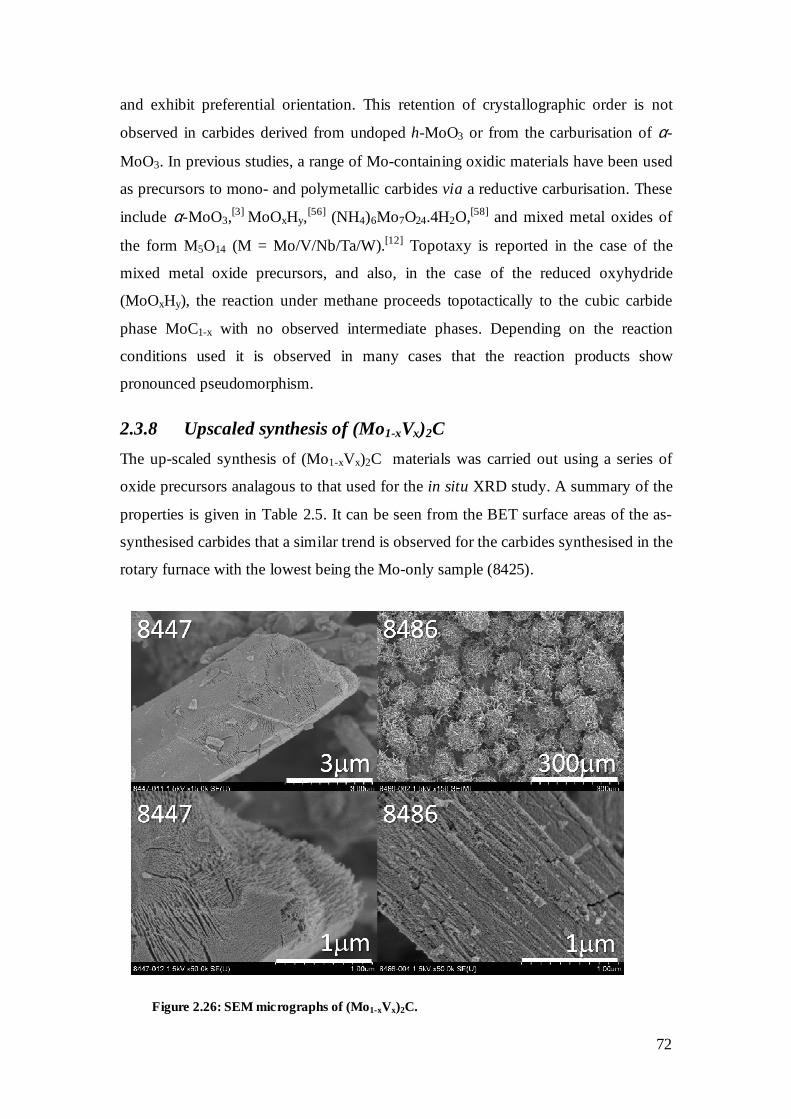
72
and exhibit preferential orientation. This retention of crystallographic order is not
observed in carbides derived from undoped h-MoO3 or from the carburisation of α-
MoO3. In previous studies, a range of Mo-containing oxidic materials have been used
as precursors to mono- and polymetallic carbides via a reductive carburisation. These
include α-MoO3,[3]
MoOxHy,[56] (NH4)6Mo7O24.4H2O,[58] and mixed metal oxides of
the form M5O14 (M = Mo/V/Nb/Ta/W).[12] Topotaxy is reported in the case of the
mixed metal oxide precursors, and also, in the case of the reduced oxyhydride
(MoOxHy), the reaction under methane proceeds topotactically to the cubic carbide
phase MoC1-x with no observed intermediate phases. Depending on the reaction
conditions used it is observed in many cases that the reaction products show
pronounced pseudomorphism.
2.3.8 Upscaled synthesis of (Mo1-xVx)2C
The up-scaled synthesis of (Mo1-xVx)2C materials was carried out using a series of
oxide precursors analagous to that used for the in situ XRD study. A summary of the
properties is given in Table 2.5. It can be seen from the BET surface areas of the as-
synthesised carbides that a similar trend is observed for the carbides synthesised in the
rotary furnace with the lowest being the Mo-only sample (8425).
Figure 2.26: SEM micrographs of (Mo1-xVx)2C.

73
Notably, the maximum temperature used for the synthesis is 75°C lower than that
used in the in situ XRD study. This was done to reduce carbon deposition during the
later stages of synthesis and by direct comparison with Table 2.3 it is demonstrated
that the carbides exhibit a stoichiometry much closer to Mo2C. The discrepancy
between the stoichiometric value and the measured value above likely originates from
the passivation procedure during which surface carbon is oxidised to COx.
Table 2.5: Physical properties of (Mo1-xVx)2C materials synthesised in the rotary furnace. aAs determined by SEM-EDX
bCalculated column height from X-ray diffractogram refinement
In the SEM images shown Figure 2.26 can be seen very similar features to those
observed for the in situ study. In the top right, the spherical aggregates reflects the
microstructure of the precipitated crystallite material of the precursor oxides. In the
case of the highest V loading (#8486), surface ridging can be seen for the image in
bottom right. In general the mesostructure as determined by N2 adsorption and SEM
reflect in every way the syntheses carried out in small scale in the in situ XRD.
TEM data from (Mo0.92V0.08)2C is shown in Figure 2.27. The SAED patterns are in
agreement with the powder XRD and there is also preferential orientation observed
with a visible fault observed along the (100) plane.
Sample Int. ID
Final temp. (°C)
Phase Precurso
r ID V/(V+Mo)
a C theor. (%w/w)
C meas. (%w/w)
Crystal sizeb (nm)
BET (m2/g)
1 8425 675 Mo2C (hcp)
6600 0.00 5.89 5.2 7.1 69
2 8478 675 Mo2C (hcp)
6702 0.03 5.97 5.2 6.4 110
3 8447 675 Mo2C (hcp)
7911 0.08 6.01 5.1 5.5 106
4 8486 675 Mo2C (hcp)
6601 0.11 6.11 5.3 - 97

74
Figure 2.27: (above) SAED of spot showing hcp Mo2C structure for (Mo 0.92V0.08)2C (8447);
(below) HR-TEM image showing individual crystallites with observed slip plane.
2.4 Discussion
In comparing and contrasting the carburisation of α-MoO3 and various h-Mo(V)O3
type oxides we observe a number of differences. With respect to the reduction-
carburisation of α-MoO3 the measured TPR curves along with the model-free kinetic
analysis support a complex mechanism whereby increasing the temperature of
reduction increases the apparent activation energy. It was shown by Ressler et al. that
the comproportionation reaction to monoclinic m-Mo4O11 is observed at these higher
temperatures.[40] This phenomenon may be explained as the oxygen becoming
mobilised in the oxide lattice above a critical temperature. Above this temperature the

75
lattice may assume locally more stable configurations through the formation of shear
structures. The layered α-MoO3 is initially reduced via facile transport of the oxygen
from the interlayer spacings of the oxide forming oxygen vacancies which lead to a
slipping of the planes and reoxidation of the vacancies by parallel terminal oxygen
groups.
Figure 2.28: View of αααα-MoO3 looking down the (100) plane at the interlayer spacings.
Increasing the temperature drives the fast reconstruction of the oxide to form a
monoclinic suboxide which, depending upon reaction conditions (mass-transport
limitations) may form a bulk crystalline phase, or alternatively is formed as a micro-
domain of corner-linked Mo octahedra at the reaction front. The calculated apparent
activation energies in Figure 2.17 & 2.18 reflect this; as the conversion increases the
mechanism is changing, which also accounts for a large degree of observed error.
The reduction-carburisation of h-Mo(V)O3-type oxides appears to mechanistically
different to that of the orthorhombic oxide. This is not surprising because in this case
the structure is 3-dimensional oxidic lattice in which all oxygen atoms are connected
to at least two molybdenum atoms (Figure 2.5). The initial reduction step is observed
to have the highest apparent activation energy (150–200 kJ/mol) which is because the
oxide lattice has no low-energy mechanism by which it may be reduced. Initial
removal of oxygen results in destabilisation of the crystal structure. The temperature

76
of reduction increases with increasing vanadium content which reflects the increased
intrinsic stability of the V-doped materials. Due to the presence of cations in the
hexagonal channels h-MoO3 is non-stoichiometric with respect to Mo in order to
compensate the charge in the crystal resulting in a more correct formula of:
(NH4)1-xMo5□MoO18-x-y·H5-2y-x.[34] By substituting Mo for V, the number of
crystallographic vacancies (metal) in the structure decreases, resulting in a more
stable material.
More interesting to note is the general trend in activation energies for the h-Mo(V)O3
series. The initial activation energy of reduction calculated for h-MoO3 is higher than
those calculated for the Mo/V precursors, while the activation energy for the
reduction step MoO3-x → MoO2 is lower (Figure 2.18). In the in situ XRD, an
intermediate phase (o-Mo4O11) is only observed for h-MoO3, however, we can see
from the TPR profiles that the Mo/V oxides also share a complex mechanism.
Without further evidence it is difficult to speculate on the reason for the differences in
initial activation energy.
A possible explanation for these observations is related to the oxygen mobility in the
oxide lattices. The effect which is then observed with the structural inclusion of
vanadium is to reduce the mobility of the oxygen in the sublattice thereby increasing
the energy required to reduce the oxide. The more oxophilic nature of the vanadium
serves to create strongly bound V=O moieties which kinetically hinder the reduction
process.
The carburisation step MoO2 → Mo2C is seen to increase in activation energy with
the inclusion of vanadium (Figure 2.17). This phenomenon can be explained in two
ways. The first is by similar argumentation as above: oxophilic vanadium moieties
reduce the mobility of oxygen out of the lattice, also resisting the ingress of carbon,
thereby kinetically hindering the carbide formation. Another explanation is that the
reduced Mo/V oxide lacks sufficient metallic character to decompose CH4 and
thereby incorporate carbon. It is well known that MoO2 is a metallic oxide which has
electron density at the Fermi edge. For a carbide to be formed the reacting species
must be metallic which is not common for transition metal oxides, even in a reduced
form.

77
In either case we observed that in the case of h-Mo0.92V0.08O3 the reduction step —
MoO3 → MoO2 — is completed entirely before the formation of the carbide. This is
most clearly seen in the comparison of masterplots (Figure 2.21) which show that the
reduction proceeds via a 3-dimensional diffusional mechanism. This case is also
supported by the TPR profiles (Figure 2.15) which show that in the V-free oxides,
CH4 is consumed at an earlier stage of the reaction.
2.5 Summary
Reductive carburisation of a mixed metal oxide based on hexagonal MoO3 resulted in
bimetallic carbides with a novel high aspect-ratio mesostructure and ordered
crystallographic nature. The Mo/V precursor oxide was synthesised by a simple
precipitation reaction and the carburisation reaction was observed using in situ
powder XRD technique. This was contrasted to the TPR-carburisation of α-MoO3 and
it was observed that all precursors were reduced via MoO2 as an intermediate phase.
The kinetics of reduction for the precursor oxides were investigated yielding insight
into the mechanism of reduction. The observed TPR profiles were in agreement with
the findings of Ressler and Lalik and suggest that the mobility of atomic oxygen in
the lattice is affected by the inclusion of vanadium as a dopant. It is unclear as to
whether it is as a structural inhibition to the comproportionation reaction:
3MoO3 + MoO2 → Mo4O11
or a more fundamental electronic effect which is the origin of this observation.
However, it was observed that vanadium inclusion resulted in a sharper, single
reduction peak that was correlated with a more uniform evolved mesoporosity in the
product carbide.
The use of multi-metal oxides as precursors for carbides is a largely unexplored area
of transition metal carbide chemistry. In particular it offers interesting possibilities to
produce tailored carbides with novel material properties, higher surface areas, and/or
improved catalytic selectivity and performance. These goals can be achieved by either
doping of bulk carbides with more active metals or by choosing precursor oxides with
structural properties that influence the carbide product. The relatively high surface
area of this material and the inclusion of vanadium atoms in the structure provide a
basis for the investigation of a number of industrially useful reactions.

78
In this chapter we also present a methodology for the synthesis and characterisation of
air-sensitive refractory materials produced by solid-state reaction in various gas
atmospheres at elevated temperatures. The scaled-up synthesis of high surface area
molybdenum carbide as characterised by XRD, CHN analysis, N2-sorption, SEM,
TEM, Raman spectroscopy (Chapter 4) and XPS (Chapter 4) is presented as an
example. This technique allows us to use the materials directly in catalytic reactions
without pre-treatment, providing the opportunity to characterise the materials
extensively prior to reaction. This contributes to our understanding of the surface-
structure-relations with catalytic activity.

79
2.6 References
[1] H. Bohm, Electrochimica Acta 1970, 15, 1273. [2] R. B. Levy, M. Boudart, Science 1973, 181, 547. [3] J. S. Lee, S. T. Oyama, M. Boudart, Journal of Catalysis 1987, 106, 125. [4] L. Leclercq, M. Provost, H. Pastor, G. Leclercq, Journal of Catalysis 1989,
117, 384. [5] G. S. Ranhotra, A. T. Bell, J. A. Reimer, Journal of Catalysis 1987, 108, 40. [6] A. P. E. York, J. B. Claridge, A. J. Brungs, S. C. Tsang, M. L. H. Green,
Chemical Communications 1997, 39. [7] G. M. Dolce, P. E. Savage, L. T. Thompson, Energy & Fuels 1997, 11, 668. [8] S. Alconchel, F. Sapina, E. Martinez, Dalton Transactions 2004, 2463. [9] X.-H. Wang, M.-H. Zhang, W. Li, K.-Y. Tao, Catalysis Today 2008, 131, 111. [10] S. T. Oyama, Journal of Solid State Chemistry 1992, 96, 442. [11] C. C. Yu, S. Ramanathan, B. Dhandapani, J. G. Chen, S. T. Oyama, J. Phys.
Chem. B 1997, 101, 512. [12] S. T. Oyama, C. C. Yu, S. Ramanathan, Journal of Catalysis 1999, 184, 535. [13] L. Bastos, W. Monteiro, M. Zacharias, G. da Cruz, J. Rodrigues, Catalysis
Letters 2008, 120, 48. [14] O. Mougin, J.-L. Dubois, F. Mathieu, A. Rousset, Journal of Solid State
Chemistry 2000, 152, 353. [15] K. O. T. Ushikubo, A. Kayo, T. Umezawa, K. Kiyona, I. Sawaki, European
Patent 1992, 529. [16] A. K. M. Hatano, European Patent 1988, 318. [17] S. Knobl, G. A. Zenkovets, G. N. Kryukova, O. Ovsitser, D. Niemeyer, R.
Schlögl, G. Mestl, Journal of Catalysis 2003, 215, 177. [18] S. T. Oyama, J. C. Schlatter, J. E. Metcalfe, J. M. Lambert, Industrial &
Engineering Chemistry Research 1988, 27, 1639. [19] A. I. Kharlamov, V. G. Aleshin, V. M. Prokopenko, N. V. Kirillova,
Theoretical and Experimental Chemistry 1981, 16, 515. [20] S. Nagakura, S. Oketani, Transactions of the Iron and Steel Institute of Japan
1968, 8, 265. [21] T. C. Xiao, A. P. E. York, V. C. Williams, H. Al-Megren, A. Hanif, X. Y.
Zhou, M. L. H. Green, Chemistry of Materials 2000, 12, 3896. [22] T. Xiao, A. P. E. York, K. S. Coleman, J. B. Claridge, J. Sloan, J. Charnock,
M. L. H. Green, Journal of Materials Chemistry 2001, 11, 3094. [23] T. C. Xiao, H. T. Wang, J. W. Da, K. S. Coleman, M. L. H. Green, Journal of
Catalysis 2002, 211, 183. [24] A. Hanif, T. C. Xiao, A. P. E. York, J. Sloan, M. L. H. Green, Chemistry of
Materials 2002, 14, 1009. [25] H. M. Wang, X. H. Wang, M. H. Zhang, X. Y. Du, W. Li, K. Y. Tao,
Chemistry of Materials 2007, 19, 1801. [26] X. Li, D. Ma, L. Chen, X. Bao, Catalysis Letters 2007, 116, 63. [27] Z. W. Yao, Journal of Alloys and Compounds 2009, 475, L38. [28] G. Centi, F. Cavani, F. Trifirò, Selective oxidation by heterogeneous catalysis,
Kluwer Academic/Plenum Publishers, New York, 2001. [29] T. Ozawa, Thermochimica Acta 1986, 100, 109. [30] BrukerAXS, DIFFRACplus TOPAS V3.0, ©1999, p. Profile and structure
analysis software.

80
[31] D. Balzar, in Defect and microstructure analysis by diffraction Vol. 10 (Ed.: H. J. B. R. L. Snyder, and J. Fiala), Oxford University Press, 1999.
[32] I. P. Olenkova, L. M. Plyasova, S. D. Kirik, Reaction Kinetics and Catalysis Letters 1981, 16, 81.
[33] L. M. Plyasova, S. D. Kirik, I. P. Olen'kova, Journal of Structural Chemistry 1983, 23, 590.
[34] N. A. Caiger, S. Crouch-Baker, P. G. Dickens, G. S. James, Journal of Solid State Chemistry 1987, 67, 369.
[35] B. Darriet, J. Galy, Journal of Solid State Chemistry 1973, 8, 189. [36] L. Dupont, D. Larcher, F. Portemer, M. Figlarz, Journal of Solid State
Chemistry 1996, 121, 339. [37] L. Dupont, D. Larcher, M. Touboul, Journal of Solid State Chemistry 1999,
143, 41. [38] A. R. Denton, N. W. Ashcroft, Physical Review A 1991, 43, 3161. [39] J.-S. Choi, G. Bugli, G. Djéga-Mariadassou, Journal of Catalysis 2000, 193,
238. [40] T. Ressler, R. E. Jentoft, J. Wienold, M. M. Gunter, O. Timpe, The Journal of
Physical Chemistry B 2000, 104, 6360. [41] E. Lalik, Catalysis Today 2010, In Press, Corrected Proof. [42] E. Lalik, W. I. F. David, P. Barnes, J. F. C. Turner, The Journal of Physical
Chemistry B 2001, 105, 9153. [43] E. Lalik, Catalysis Today 2011, 169, 85. [44] D. Wang, D. S. Su, R. Schlögl, Zeitschrift Fur Anorganische Und Allgemeine
Chemie 2004, 630, 1007. [45] E. Torres-García, G. Rodríguez-Gattorno, J. A. Ascencio, L. O. Alemá¡n-
Vá¡zquez, J. L. Cano-Domínguez, A. Martánez-Herná¡ndez, P. Santiago-Jacinto, The Journal of Physical Chemistry B 2005, 109, 17518.
[46] G. Rodriguez-Gattorno, A. Martinez-Hernandez, L. O. Aleman-Vazquez, E. Torres-Garcia, Applied Catalysis a-General 2007, 321, 117.
[47] G. W. Watt, D. D. Davies, Journal of the American Chemical Society 1948, 70, 3751.
[48] H. Sakagami, Y. Asano, T. Ohno, N. Takahashi, H. Itoh, T. Matsuda, Applied Catalysis A: General 2006, 297, 189.
[49] T. Ohno, Z. Li, N. Sakai, H. Sakagami, N. Takahashi, T. Matsuda, Applied Catalysis A: General 2010
In Press, Accepted Manuscript. [50] N. S. McIntyre, D. D. Johnston, L. L. Coatsworth, R. D. Davidson, J. R.
Brown, Surface and Interface Analysis 1990, 15, 265. [51] M. Yamada, J. Yasumaru, M. Houalla, D. M. Hercules, Journal of Physical
Chemistry 1991, 95, 7037. [52] J. B. Claridge, A. P. E. York, A. J. Brungs, C. Marquez-Alvarez, J. Sloan, S.
C. Tsang, M. L. H. Green, Journal of Catalysis 1998, 180, 85. [53] H. L. Friedman, Journal of Polymer Science Part C-Polymer Symposium
1964, 183. [54] A. Khawam, D. R. Flanagan, The Journal of Physical Chemistry B 2006, 110,
17315. [55] W. Jander, Zeitschrift Fur Anorganische Und Allgemeine Chemie 1927, 163,
1. [56] C. Bouchy, C. Pham-huu, M. J. Ledoux, Journal of Molecular Catalysis a-
Chemical 2000, 162, 317.

81
[57] C. Bouchy, C. Pham-Huu, B. Heinrich, C. Chaumont, M. J. Ledoux, Journal of Catalysis 2000, 190, 92.
[58] J. Patt, D. J. Moon, C. Phillips, L. Thompson, Catalysis Letters 2000, 65, 193. [59] T. Ressler, O. Timpe, T. Neisius, J. Find, G. Mestl, M. Dieterle, R. Schlögl,
Journal of Catalysis 2000, 191, 75. [60] T. Ressler, J. Wienold, R. E. Jentoft, Solid State Ionics 2001, 141-142, 243.

82

83
Chapter 3: Reactivity of propane over Mo/V carbides I:
Catalytic reactivity and temperature programmed studies
3.1 Abstract
In this chapter, mixed molybdenum-vanadium carbide catalysts are studied in the
activation of propane. The catalysts were tested in a plug flow reactor under reducing
conditions to maintain the phase composition, and the influence of temperature,
surface oxidation, vanadium content and surface carbon deposition are observed on
the reaction network.
In the presence of H2/C3H8, Mo/V carbides are shown to catalyse the dehydrogenation
of propane to propylene with a selectivity that approaches 50%, as well as carrying
out the hydrogenolysis of propane to CH4 and C2H6 on an apparently distinct catalytic
site. Addition of H2O or CO2 as an oxidant to the feed greatly increases the yield and
selectivity of the dehydrogenation reaction (S > 90%) and introduces products from
the dry/steam reforming of propane and reverse water-gas shift. Vanadium was
observed to reduce the stability of the carbide to oxidation; in the case of O2 to α-
MoO3, and in the case of H2O and CO2, to MoO2. In the activation of propane,
vanadium increases the apparent activation energy for dehydrogenation and for
hydrogenolysis.
In a separate study into the reverse water-gas shift reaction, Mo2C is found to be an
efficient catalyst for the hydrogenation of CO2 with high selectivity to CO (> 90%).
The reaction went to equilibrium conversion even at very high space velocities over a
range of temperatures (GHSV > 200000, 500°C < T < 700°C).
In the temperature-programmed reaction of h-Mo1-xVxO3 precursor oxide materials in
H2-C3H8, it was observed that the catalysts were reduced to the fcc α-MoC1-x carbide
with evidence of carbon inclusion at lower temperatures than observed for TPRC in
H2-CH4 mixtures. On reduction, the catalytic activity was observed to increase
dramatically and selectivity evolved with temperature mirroring the reduction state of
the oxide.

84
3.2 Introduction
Selective oxidation, or oxyfunctionalisation, of alkanes is an area that has long been
of interest in catalysis for reasons of energy efficiency and potential cost savings.[1] In
recent years this interest has gained momentum and a number of technologies are
applied industrially or are in development (Table 3.1).[2] There are a number of
motivating factors for this increased focus but it is primarily dependent on the price
and availability of raw materials. The increasing worldwide demand for consumer
goods, combined with dwindling oil reserves, necessitate a reduced focus on the use
of crude oil as a substrate material and increasing consideration of energy costs. These
factors, combined with the development of environmental policy and legislation, have
driven industry and academia to find innovative solutions for the chemical demands
of a growing populace.
Table 3.1: Technologies for the oxidative transformation of light alkanes (C1–C6)[3]
Raw material Product Stage of development
Methane Methanol Pilot plant Methane Syngas Pilot plant Methane Ethylene Pilot plant Ethane 1,2-Dichloroethane,vinyl chloride Pilot plant Ethane Acetaldehyde Research Ethane Acetic acid Research Ethane Ethylene Research Propane Acrolein, acrylic acid Research Propane Propyl alcohol Research Propane Acrylonitrile Demonstrative plant Propane Propylene Research n-Butane Acetic acid Industrial n-Butane Maleic anhydride Industrial n-Butane Butadiene Industrial, abandoned Isobutane Methacrylic acid Pilot plant Isobutane Isobutene Research Isobutane t-Butyl alcohol Research n-Pentane Phthalic anhydride Research Cyclohexane Cyclohexanol,cyclohexanone Industrial Cyclohexane Cyclohexanone Research
Transition metal oxide-based systems are a hugely important class of materials in
selective oxidation reactions due to their ability to undergo reduction oxidation cycles
required for the dynamic exchange of electrons, as well as perform hydrogen
abstraction and oxygen insertion. Molybdenum and vanadium form the basis for a
number of mixed metal oxide (MMO) catalysts, which is unsurprising when one
considers the electronic flexibility of the elements, with varying formal oxidation
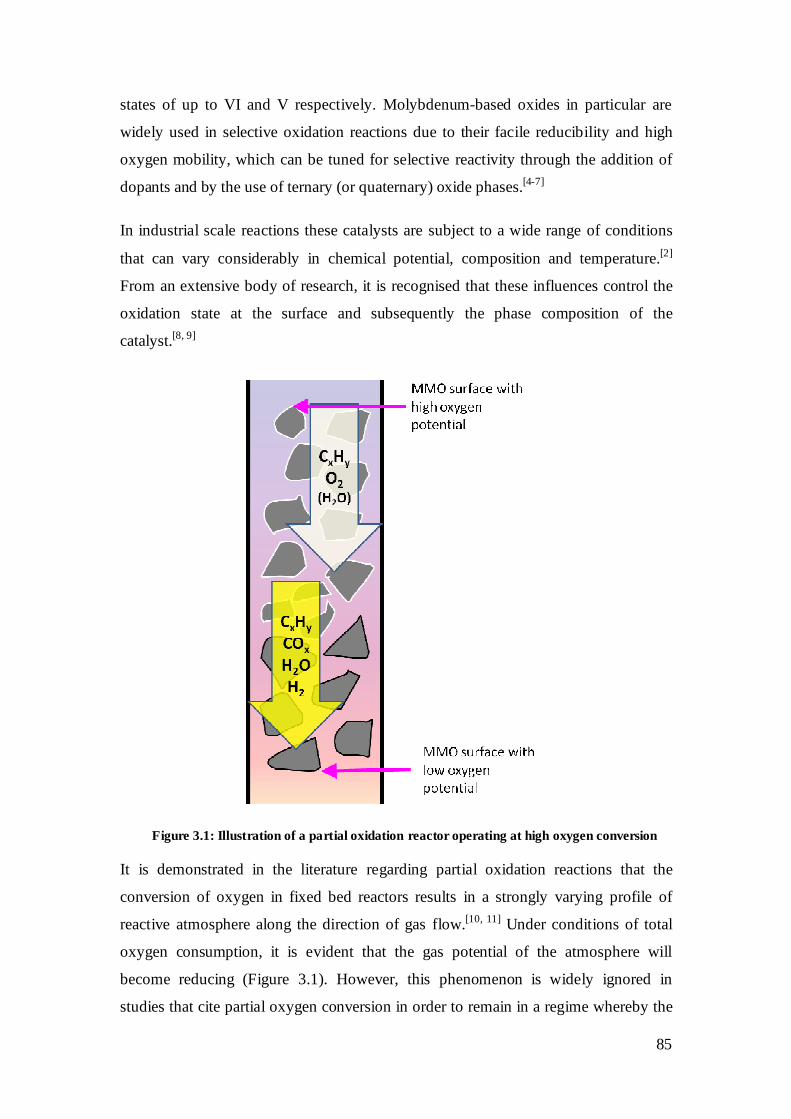
85
states of up to VI and V respectively. Molybdenum-based oxides in particular are
widely used in selective oxidation reactions due to their facile reducibility and high
oxygen mobility, which can be tuned for selective reactivity through the addition of
dopants and by the use of ternary (or quaternary) oxide phases.[4-7]
In industrial scale reactions these catalysts are subject to a wide range of conditions
that can vary considerably in chemical potential, composition and temperature.[2]
From an extensive body of research, it is recognised that these influences control the
oxidation state at the surface and subsequently the phase composition of the
catalyst.[8, 9]
Figure 3.1: Illustration of a partial oxidation reactor operating at high oxygen conversion
It is demonstrated in the literature regarding partial oxidation reactions that the
conversion of oxygen in fixed bed reactors results in a strongly varying profile of
reactive atmosphere along the direction of gas flow.[10, 11] Under conditions of total
oxygen consumption, it is evident that the gas potential of the atmosphere will
become reducing (Figure 3.1). However, this phenomenon is widely ignored in
studies that cite partial oxygen conversion in order to remain in a regime whereby the
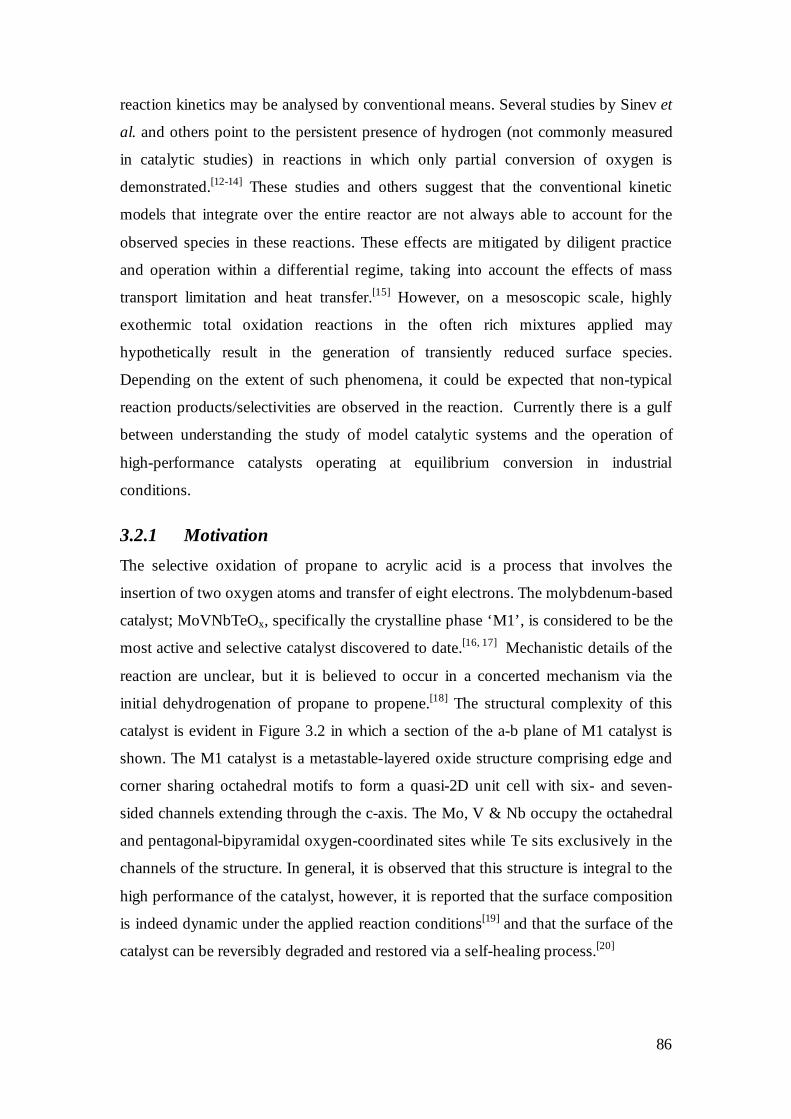
86
reaction kinetics may be analysed by conventional means. Several studies by Sinev et
al. and others point to the persistent presence of hydrogen (not commonly measured
in catalytic studies) in reactions in which only partial conversion of oxygen is
demonstrated.[12-14] These studies and others suggest that the conventional kinetic
models that integrate over the entire reactor are not always able to account for the
observed species in these reactions. These effects are mitigated by diligent practice
and operation within a differential regime, taking into account the effects of mass
transport limitation and heat transfer.[15] However, on a mesoscopic scale, highly
exothermic total oxidation reactions in the often rich mixtures applied may
hypothetically result in the generation of transiently reduced surface species.
Depending on the extent of such phenomena, it could be expected that non-typical
reaction products/selectivities are observed in the reaction. Currently there is a gulf
between understanding the study of model catalytic systems and the operation of
high-performance catalysts operating at equilibrium conversion in industrial
conditions.
3.2.1 Motivation
The selective oxidation of propane to acrylic acid is a process that involves the
insertion of two oxygen atoms and transfer of eight electrons. The molybdenum-based
catalyst; MoVNbTeOx, specifically the crystalline phase ‘M1’, is considered to be the
most active and selective catalyst discovered to date.[16, 17] Mechanistic details of the
reaction are unclear, but it is believed to occur in a concerted mechanism via the
initial dehydrogenation of propane to propene.[18] The structural complexity of this
catalyst is evident in Figure 3.2 in which a section of the a-b plane of M1 catalyst is
shown. The M1 catalyst is a metastable-layered oxide structure comprising edge and
corner sharing octahedral motifs to form a quasi-2D unit cell with six- and seven-
sided channels extending through the c-axis. The Mo, V & Nb occupy the octahedral
and pentagonal-bipyramidal oxygen-coordinated sites while Te sits exclusively in the
channels of the structure. In general, it is observed that this structure is integral to the
high performance of the catalyst, however, it is reported that the surface composition
is indeed dynamic under the applied reaction conditions[19] and that the surface of the
catalyst can be reversibly degraded and restored via a self-healing process.[20]

87
Figure 3.2: Detail of MoV(Nb)TeOx - M1 structure as viewed down the c-axis. Coloured
octahedrons represent non-equivalent metal positions. Nb preferentially occupies
pentagonal-bipyramidal sites; Te is preferentially bound asymmetrically in the hexagonal
channels (yellow).[21]
Many proposed kinetic models for the partial oxidation of propane to acrylic acid do
not fit the observed product selectivities and are inadequate to explain various features
such as the high ratio of CO:CO2 in the byproduct stream.[22] In the absence of
secondary phases, it can only be assumed that all active sites are generated within the
composition of the catalyst depending on the chemical potential at the surface.
Hydrothermally synthesized M1 catalyst is highly efficient and the exothermic
generation of acrylic acid, propene and carbon oxides at the catalytic surface results in
a cascade effect, with the rapid removal of molecular oxygen from the local vicinity
and the generation of heat.
Depending on the validity of the various proposed reaction schemes involving either
Langmuir-Hinshelwood, Eley-Rideal or Mars-van Krewelen-type mechanisms,[23] the
surface chemical potential may be reduced via direct abstraction of oxygen by carbon
or by the starvation of bulk oxygen replenishment. In this case, the oxygen diffusion
and reducibility of the surface will be dictated by the chemical and structural
composition of the oxide.

88
3.2.2 Experimental goals and approach
In Chapter 2, the complex molybdate h-Mo1-xVxO3 was presented as a precursor for
TPR-carburisation to bimetallic carbide. Here we present vanadium-substituted
molybdenum carbide, (Mo1-xVx)2C as a model for a highly-reduced MoVTe catalyst.
As can be seen in Figure 3.3 the structure of the precursor h-MoO3 bears a
resemblance to the M1 structure (Figure 3.2) in that they are both channeled oxide
structures with needle-like morphologies and flat, terminating a-b planes.
Molybdenum may be incrementally substituted in the structure by vanadium thereby
allowing for the comparison of variable chemical composition on the observed
reactivity. Furthermore, because the chemistry of Mo2C is now widely studied, there
exist a number of studies detailing the synthesis, structural characterization and
catalytic properties.[24-26]
Figure 3.3: Representation of h-MoO3 complex molybdate structure as viewed down the c-
axis. Channels are partially occupied by stabilising mono-cationic species from: Na+, K+,
Rb+, NH4+, H3O+.[27-29] Molybdenum may be substituted by vanadium up to 13% (metal
basis).[30-32]
The reaction conditions widely applied for the selective oxidation of propane over
Mo-based catalysts are a mixture of 2:1 oxygen-propane (ca. 10%) in ca. 40% steam
with the remaining 50% N2, carried out at temperatures between 350-420°C.[33]
However, to study the reactions of propane over a reduced oxide or carbide catalyst, it
is necessary to modify the conditions so as to maintain a stable phase composition.
Within this adapted regime, the roles of temperature, oxidant (O2/CO2/H2O) and

89
vanadium concentration are explored with respect to the observed reactivity and phase
stability.
The stated experimental goals are to:
• explore and understand the reactivity of propane on the Mo2C surface
• observe the influence of surface oxidation on the reactivity of C3H8
• contrast the reactivity of dry C3H8 over Mo2C with co-fed steam or CO2
• apply the bimetallic system (Mo1-xVx)2C with varying x to determine the
influence of vanadium on the reactivity
• determine the influence of dopant vanadium in a combined TPR-surface
carburisation in catalytically relevant conditions.
3.2.3 Previous studies on Mo2C
In the literature, the reactions of alkane substrates over Mo2C (hcp) and MoC1-x
catalysts can generally be grouped into 3 categories: methane activation (C1),
dehydrogenation (C3, C4) and isomerisation (C5 - C8).
3.2.3.1 Methane activation – C1
The reforming reactions of CH4 over Mo2C are highly relevant to the activation of
higher alkanes because they serve as a fundamental model for the surface interactions
of carbon containing gases as well as CO, CO2, H2 and H2O.
Partial oxidation of methane (POM):
CH4 + 1/2 O2 ↔ CO + 2H2 — ∆Hθ298 = -38 kJmol-1
Dry methane reforming (DMR):
CH4 + CO2 ↔ 2CO + 2H2 — ∆Hθ298 = 247 kJmol-1
Steam methane reforming (SMR):
CH4 + H2O ↔ CO + 3H2 — ∆Hθ298 = 206 kJmol-1
Mo2C was first demonstrated by Green et al. to effectively catalyse methane
reforming in POM, DMR and SMR conditions.[34-36] The activities observed were
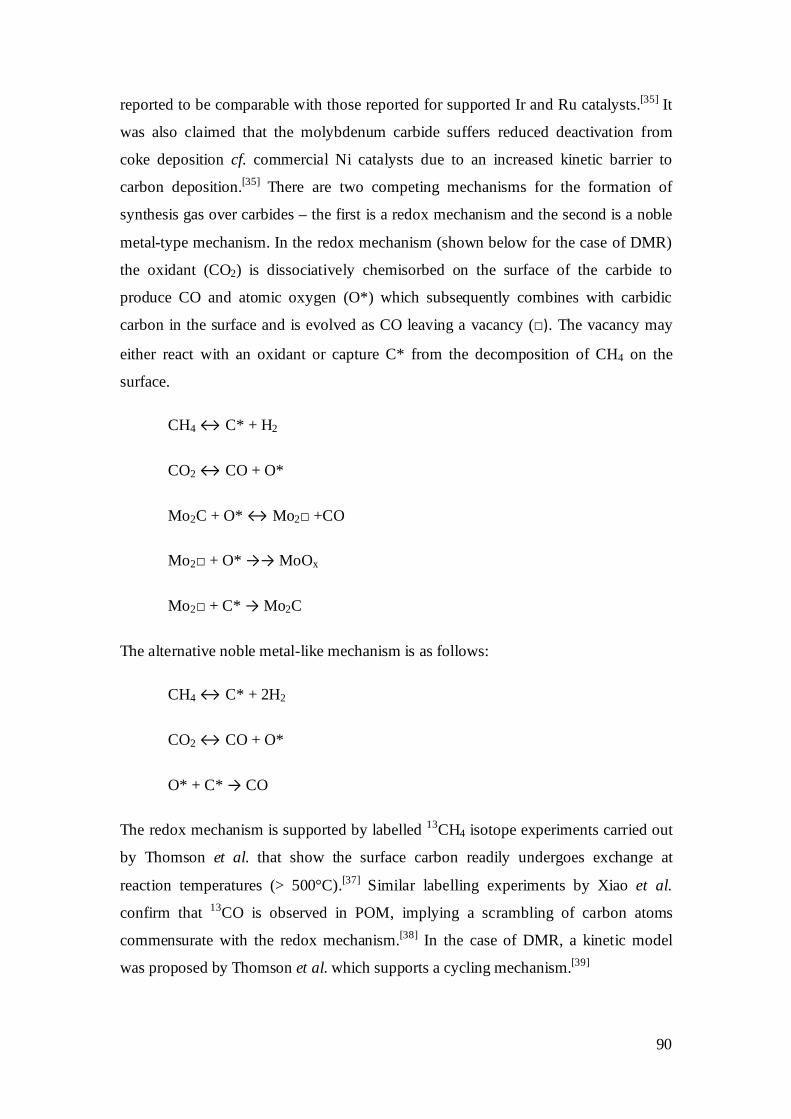
90
reported to be comparable with those reported for supported Ir and Ru catalysts.[35] It
was also claimed that the molybdenum carbide suffers reduced deactivation from
coke deposition cf. commercial Ni catalysts due to an increased kinetic barrier to
carbon deposition.[35] There are two competing mechanisms for the formation of
synthesis gas over carbides – the first is a redox mechanism and the second is a noble
metal-type mechanism. In the redox mechanism (shown below for the case of DMR)
the oxidant (CO2) is dissociatively chemisorbed on the surface of the carbide to
produce CO and atomic oxygen (O*) which subsequently combines with carbidic
carbon in the surface and is evolved as CO leaving a vacancy (□). The vacancy may
either react with an oxidant or capture C* from the decomposition of CH4 on the
surface.
CH4 ↔ C* + H2
CO2 ↔ CO + O*
Mo2C + O* ↔ Mo2□ +CO
Mo2□ + O* →→ MoOx
Mo2□ + C* → Mo2C
The alternative noble metal-like mechanism is as follows:
CH4 ↔ C* + 2H2
CO2 ↔ CO + O*
O* + C* → CO
The redox mechanism is supported by labelled 13CH4 isotope experiments carried out
by Thomson et al. that show the surface carbon readily undergoes exchange at
reaction temperatures (> 500°C).[37] Similar labelling experiments by Xiao et al.
confirm that 13CO is observed in POM, implying a scrambling of carbon atoms
commensurate with the redox mechanism.[38] In the case of DMR, a kinetic model
was proposed by Thomson et al. which supports a cycling mechanism.[39]

91
This mechanism depends on the dynamic equilibrium of the surface with the gas
phase; the oxycarbide interface is thermodynamically maintained with the exchange
of carbon and oxygen species. For the cases of DMR and SMR the overall equilibria
can be represented respectively as:[39]
Mo2C + 5CO2 ↔ 2MoO2 + 6CO
Mo2C + 5H2O ↔ 2MoO2 + CO + 5H2
Additionally, the non-reversible carburisation:
MoO2 + 5CH4 → Mo2C + 4CO + 10H2
A series of studies by LaMont et al. show that for the cases of SMR and DMR, bulk
Mo2C catalyst is stable in stoichiometric feeds at elevated pressures (> 8 bar)
following reductive sintering and pretreatment at 700°C. [37, 39-41]
The non-oxidative reactivity of CH4 on various molybdenum surfaces (Mo, MoO2,
MoO3, Mo2C (hcp), and MoC1-x (fcc)) in bulk and supported systems, was reported by
Solymosi et al.[42] Over a pre-reduced Mo2C catalyst it was observed that initial
conversion of CH4 at 700°C was between 6-8%, dropping significantly within
minutes on stream. The primary product observed was hydrogen and to a lesser extent
ethane is observed to evolve after time on stream. Similar results were obtained by
Oshikawa et al. over a series of carbide catalysts with varying structural features.[43]
Figure 3.4: Behaviour of methane with time on stream over Mo2C at 700°C — reprinted
from [42] with permission from Elsevier.

92
Dehydroaromatisation of various alkanes, primarily of CH4 to benzene, is reported
for MoCx species supported on the zeolite ZSM-5.[42, 44-53] The interaction of both
phases has been shown to be necessary for the formation of aromatics via the
dissociative adsorption of CH4 over MoCx clusters, followed by oligomerisation on
the Brønsted acid sites of the HZSM-5.[47]
Both the examples of methane decomposition and dehydroaromatisation provide
strong evidence that molybdenum carbides are suitable materials for reactions
involving C-H bond activation. In the case of CH4 decomposition, this results in
almost immediate deactivation via carbon deposition. However in the compound
system MoCx/ZSM-5, this rapid decomposition is harnessed to provide a feedstock of
carbon to the acidic zeolite catalyst, which completes the aromatisation. This example
of a dynamic system is relevant to the formation of transient reduced sites, which are
subsequently reoxidised resulting in a complex catalytic system.
3.2.3.2 Dehydrogenation reactions
The dehydrogenation of light alkanes over bulk and supported molybdenum carbide
and oxycarbide is reported for ethane,[54] propane[52, 55] and butane.[56-60] A relatively
low number of studies concerning this topic reflects the difficulty involved in these
reactions, which are characterised by deactivation, complex reaction networks, and
the the dynamic nature of the carbide surface.
Dehydrogenation of ethane in the presence of CO2 is presented by Solymosi et al.
over the temperature range 550-700°C using a Mo2C/SiO2 catalyst.[54] At conversions
of around 10%, the selectivity to ethylene is high (80-90%). With temperature, the
conversion increases exponentially with increasing selectivity to both the
hydrogenolysis and ethane reforming products. It is loosely hypothesised that the
dehydrogenation is carried out on an ‘oxycarbide’ site via ‘activated oxygen’ attack at
the ethane to form ethylene and water. There is no evidence provided.
In a series of more rigorous studies, Solymosi et al. present the dehydrogenation of
propane over bulk and supported Mo2C with and without the influence of CO2.[52, 55] It
is observed that in dry feed conditions over bulk Mo2C, the dominant reaction product
is propylene (S = 44% @ 600°C) with secondary products of methane and ethylene.
The supported catalyst Mo2C/SiO2 is reported to show higher selectivity to propylene
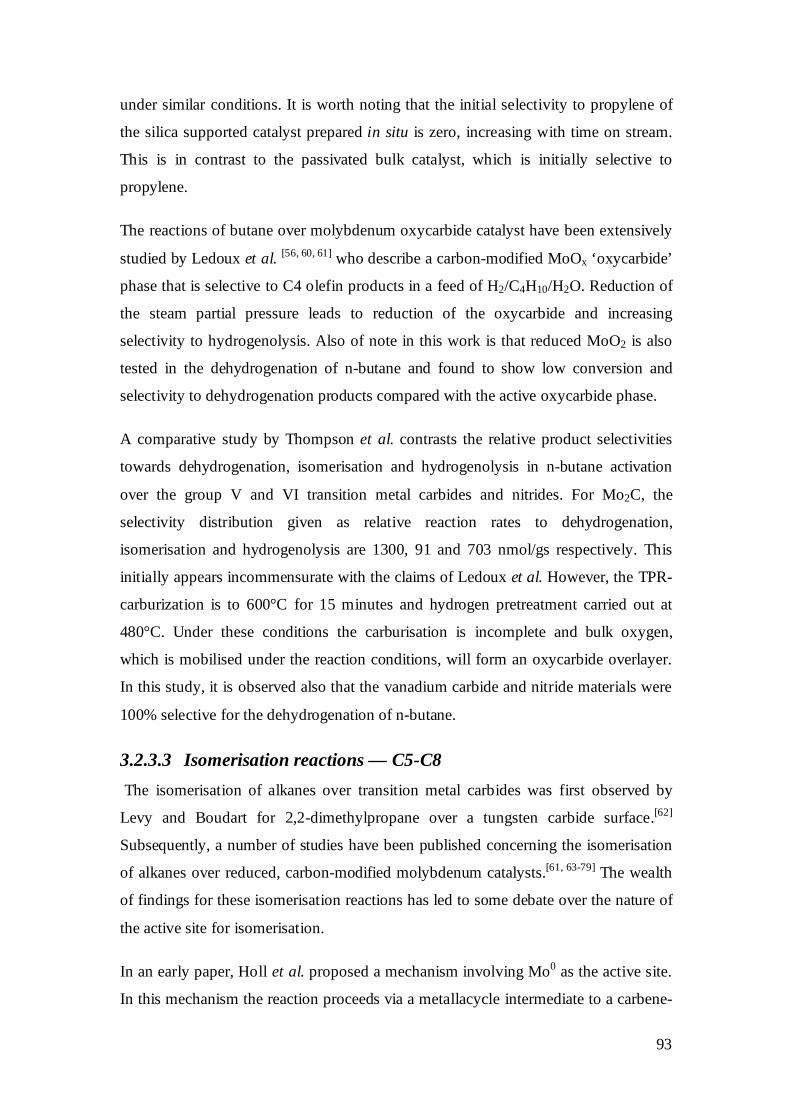
93
under similar conditions. It is worth noting that the initial selectivity to propylene of
the silica supported catalyst prepared in situ is zero, increasing with time on stream.
This is in contrast to the passivated bulk catalyst, which is initially selective to
propylene.
The reactions of butane over molybdenum oxycarbide catalyst have been extensively
studied by Ledoux et al. [56, 60, 61] who describe a carbon-modified MoOx ‘oxycarbide’
phase that is selective to C4 olefin products in a feed of H2/C4H10/H2O. Reduction of
the steam partial pressure leads to reduction of the oxycarbide and increasing
selectivity to hydrogenolysis. Also of note in this work is that reduced MoO2 is also
tested in the dehydrogenation of n-butane and found to show low conversion and
selectivity to dehydrogenation products compared with the active oxycarbide phase.
A comparative study by Thompson et al. contrasts the relative product selectivities
towards dehydrogenation, isomerisation and hydrogenolysis in n-butane activation
over the group V and VI transition metal carbides and nitrides. For Mo2C, the
selectivity distribution given as relative reaction rates to dehydrogenation,
isomerisation and hydrogenolysis are 1300, 91 and 703 nmol/gs respectively. This
initially appears incommensurate with the claims of Ledoux et al. However, the TPR-
carburization is to 600°C for 15 minutes and hydrogen pretreatment carried out at
480°C. Under these conditions the carburisation is incomplete and bulk oxygen,
which is mobilised under the reaction conditions, will form an oxycarbide overlayer.
In this study, it is observed also that the vanadium carbide and nitride materials were
100% selective for the dehydrogenation of n-butane.
3.2.3.3 Isomerisation reactions — C5-C8
The isomerisation of alkanes over transition metal carbides was first observed by
Levy and Boudart for 2,2-dimethylpropane over a tungsten carbide surface.[62]
Subsequently, a number of studies have been published concerning the isomerisation
of alkanes over reduced, carbon-modified molybdenum catalysts.[61, 63-79] The wealth
of findings for these isomerisation reactions has led to some debate over the nature of
the active site for isomerisation.
In an early paper, Holl et al. proposed a mechanism involving Mo0 as the active site.
In this mechanism the reaction proceeds via a metallacycle intermediate to a carbene-

94
olefin, resulting in bond shift migration.[80] This was contested as it required the metal
to present two active sites, one selective to hydrogenolysis and one selective to
isomerisation, which was not supported in the data.
Figure 3.5: Metallacyclobutane intermediate mechanism of heptane isomerisation —
reprinted from [69] with permission from the American Chemical Society.
Iglesia et al. present a cooperative mechanism in a study of oxygen-modified tungsten
carbide catalysts.[81-83] It is assumed that WCx sites activate C-C and C-H bonds and
WOx sites act as Brønsted acidic sites which catalyse the formation of carbenium-ions
for bond-shift reactions. These findings are justified by NH3 adsorption experiments
combined with the observation that a metallacyclobutane intermediate mechanism
(Figure 3.5) is inconsistent with the low selectivity for propylene metathesis reactions
on WC/O.
This assertion is contrasted by the findings in a series of studies by Ledoux et al. on
oxygen-modified Mo2C catalysts.[66, 68-70, 84] The authors reject Mo2C as unselective
and propose the existence of a crystallographically distinct oxycarbide phase selective
for isomerisation.[70] Contrary to Iglesia et al., the metallacyclobutane mechanism is
put forward, supported by an analysis of the product distribution.[69] In this theory, the
absence of cyclic products is cited as being due to the enhanced carbon deposition,
also a cause of deactivation. The presence of acidic sites is not discussed.
In an ongoing contribution to the discussion, Maire et al. present an electronic
argument for a bifunctional catalyst.[72, 73] It is claimed that the electron rich metal
centre MoIV is the active site for initial dehydrogenation and that M-Oδ+ fixates the
atomic hydrogen thus forming a Brønsted acidic site M-OH. However, MoIV as an

95
active species is generally refuted in the literature, even by Maire’s own co-authors it
would appear,[85] nonetheless the fundamental mechanism has merit.
In separate studies by Matsuda[75, 86, 87] and Torres-Garcia et al.[78, 79], a metallic MoO
species distinct from MoIV is proposed as the active site for isomerisation. Matsuda et
al. demonstrate the presence of Brønsted acidity in reduced MoOx catalysts and
suggest that the incorporation of H2 from reduction combines to form the M-OH sites
responsible for isomerisation, while broadly speculating on the presence of metallic
Mo or Mo suboxide for initial dehydrogenation. This is elaborated by Torres-Garcia
et al. in a study combining theoretical calculations and practice. It is claimed that a
stoichiometric MoO fcc phase, which is predicted by quantum chemical calculations,
can be observed in the XRD and TEM data. It is supposed that this stabilised phase is
formed in situ upon reduction and that it is the oxycarbide phase that is identified by
Ledoux et al. in previous studies.[74] The nature of the carbon species is further
discussed with reference to electron energy loss spectroscopy (EELS), Raman and
TPO data, and is concluded to be adventitious. The catalytic results are not discussed.
The conditions applied for alkane isomerisation (C4-C8) vary between 200-400°C
and at pressures from 1-20 bar in the presence of hydrogen.
3.2.3.4 Other reactions of note – metathesis and RWGS
As well as the reactions of alkanes over Mo2C/MoOxCy surfaces, it is worthwhile to
note in the literature some further studies relating to the proposed research.
McBreen et al. and Tysoe et al. discuss in separate studies the surface interactions of
light olefins over Mo2C[88-92] and reduced MoOx
[93-103] surfaces respectively.
McBreen et al. show the formation and stability of alkene metathesis sites on Mo2C
by dissociative adsorption of carbonyl species over Mo to form an oxo-alkylidene
surface complex (Figure 3.6). As well as the cyclopentylidene functionalised moeity
shown here, it is demonstrated that various carbonyl species dissociate to form a
highly stable (< 623°C) alkylidene functionalised surface that can undergo metathesis
cycles in propylene. The observed surface species and cycled reaction products are
consistent with the Chauvin mechanism.[104, 105] It is speculated by the authors, with
respect to the low temperature metathesis reaction, that the trace quantities of acetone

96
and acetaldehyde seen to evolve during the induction period of propene metathesis are
formed by a selective oxidation of the propene (presumably via MVK mechanism),
and these species subsequently generate the active site via the previously described
oxidative addition.[106]
Figure 3.6: (a) Illustration of carbonyl bond scission to form a surface oxo-alkylidene
complex on Mo2C. (b) Complementary organometallic mechanism for a tungsten complex.
Reprinted from [89] with permission from Elsevier.
Tysoe et al. provide a complementary vision of light alkanes on Mo metal and MoOx
(x < 3) surfaces that is more focused on the catalytic properties of the surface than the
exact mechanism of formation. By use of UV-photoelectron (UPS) and temperature-
programmed desorption (TPD) spectroscopies it is shown that ethylene adsorbs
dissociatively on an O-modified Mo(100) surface to form surface carbenes. These
carbenes can react with adsorbed hydrogen to form methyl species and subsequently
desorb as methane. It is shown that the rate-limiting step for this reaction is the
hydrogenation of the methyl group with apparent activation energy of 97 kJ/mol.
The interactions of the C2-4 olefins with variously modified Mo surfaces are studied
by TPDS of the adsorbed molecules from 80 – 800K. It is observed that at low
oxygen coverage, the surface is highly active to C-C bond scission and subsequent
CH4 formation (Figure 3.7) for 2-butene and propylene, but not for ethylene. With
increasing oxygen coverage the methane yield is seen to decrease for butylene, and
conversely increase for ethylene and propylene to a maximum at ca. 0.6ML. At 1ML
oxygen coverage the evolution of methane is not observed but instead the olefins are
observed to adsorb and desorb molecularly.

97
Figure 3.7: (left) methane yield from low temperature desorption experiments versus
oxygen coverage over Mo(100). (Right) - observed recombinative hydrocarbon formation
over oxygen modified Mo(100). Metathesis activity is defined as the rate of ethylene and
butene formation — reprinted from [97] with permission from the American Chemical
Society.
In their conclusions, the authors propose three pathways for the reactions of olefins on
oxygen-modified Mo: they react to form alkanes; thermally decompose to form
carbon and hydrogen; or dissociatively decompose to form carbene species. The
carbene species were said to react via two different mechanisms depending upon the
temperature: at low temperatures (> 377°C) via a Chauvin-type metathesis
mechanism with low activation energy; and at higher temperatures via the
recombination of carbene fragments at the surface (high apparent Ea). This has been
erroneously termed ‘high-temperature metathesis’ but is more closely related to
Fischer-Tropsch chemistry. As a more general description it will be refered to here as
recombinative hydrocarbon formation. To explain the variation in methane yield for
the different olefins, it is suggested that the C=C bond dissociation probability
increases in the order ethylene < propylene < 2-butene and that the observed CH4 is
the result of hydrogenation of the carbene fragments following the decomposition on
the surface.
An alternative explanation for these observations is put forward here: It is proposed in
a theoretical study by Zhou et al. that the dehydrogenation of CH4 over reduced Mo
catalysts to form a surface CH2 species is thermodynamically favoured over methyl

98
formation due to the formation of H2.[45] This would suggest that these species play a
key role in carbide formation and are strongly bound to the molybdenum atom. This is
shown by McBreen et al. in which carbene species persist on the surface of Mo2C to
temperatures ca. 900K. The dissociative formation mechanism of surface carbenes
from olefins is demonstrated for metallic molybenum in earlier papers from Tysoe,[100,
101] however, upon TPD of ethylene on Mo(100) there is no observation of CH4.
A schematic diagram representing an oxygen-modified Mo surface with ML = 0, 0.5,
and 1 is presented in Figure 3.8. The formation of surface alkylidenes over metallic
Mo (a) is proposed to result in strongly bound species explainable through back
donation of 4d electron density into the unoccupied p-states of the Fischer-type
carbene species. With increasing oxygen coverage (b) the density of states at the
Fermi edge is reduced and the carbene species is less strongly bound to the surface,
therefore able to recombine with H atoms abstracted from the surface decomposition
of olefins to carbonaceous residue. At higher coverage (c), the adsorption of olefins at
low temperatures is non-dissociative and results in no CH4 evolution (Figure 3.7).
Therefore the origin of methane in the absence of oxygen is only observed for
propylene and butene because they contain saturated alkyl groups that decompose on
the metallic surface and subsequently desorb as CH4. Over 0.5ML, the mechanism is a
combination of alkyl group decomposition and carbene recombination and therefore is
observed for ethylene as well. This increased mobility would also account for the
recombinative hydrocarbon formation mechanism observed.
A small number of studies have investigated the suitability of Mo2C for water-gas
shift reactions.[107-110] In a theoretical (DFT) study into WGS over various Mo2C
surfaces by Rodriguez et al.[109] it is concluded that carbon- and molybdenum-
terminated Mo2C are less reactive than Cu surface (in that order) and that O-Mo-
Mo2C is the worst catalyst. However, O-C-Mo terminated Mo2C is calculated to have
a higher relative rate than that for Cu(111). This is supported in the finding of
Thompson et al., who report stable activity (48h) for WGS over Mo2C which is
greater than that of a commercial Cu-Zn-Al catalyst.[108, 110] The preparation detailed
is also consistent with an oxygen-rich carbide phase.

99
Figure 3.8: A schematic diagram of olefin TPD over oxygen-modified Mo: (a) Dissociative
formation of M=CH 2 species over metallic Mo combined with C-C and C-H bond scission.
CH4 is formed from alkyl chains; (b) formation of less tightly bound M···:CH2 species with
surface recombination and CH4 formation — most active recombinative surface; (c) at low
temperatures over MoO surface, non-dissociative adsorption-desorption.
For the case of RWGS, there are surprisingly few studies that have concentrated on
this reaction alone. Only one DFT study by Nagai et al. discusses CO2 hydrogenation
over Mo2C using a cluster model of Mo4C2.[111] This study predicted the preferential
formation of CO and H2O over the cluster, and that the adsorbed CO2 was
preferentially hydrogenated to CO and OH species in the first step. The conclusions
referred to experimental corroboration which was not detailed.
Two catalytic studies by Suzuki et al. approach RWGS over Mo-based catalysts. In
the first paper MoO3/ZnO and NiO/ZnO catalysts are compared for RWGS in 1:1

100
CO2:H2 conditions as well as excess CO.[112] The MoOx in contrast to the NiO
supported catalyst shows 100% selectivity to CO and no detectable carbon formation
but lower overall conversion. Following a more rigorous pre-reduction it was
observed that the MoOx catalyst was also able to operate at equilibrium conversion
(GHSV = 3000 h-1). The second paper by Suzuki et al. presents a comparison of
supported MoS2 and WS2 with supported Fe, Co, and Ni.[113] The activity for selective
hydrogenation of CO2 to CO was not as high as those observed for the 3d transition
metals but with 100% selectivity to CO. It was observed that the sulfides had a
preferential affinity for H2 rather than CO2.
3.3 Experimental
The experimental setup design is based around a plug flow-type reactor which
consists of a gas delivery system connected to a quartz U-tube reactor whereby the
effluent gas is analysed by gas chromatography. The apparatus was designed to fulfill
a range of requirements and was constructed as a multi-purpose reactor for the
analysis of light hydrocarbon reactions over solid catalysts. Further experimental
constraints at times required the design of specific solutions which are discussed in
this section. The plug flow reactor system was designed as a multi-purpose reactor for
the partial oxidation of light hydrocarbons and can be seen in Figure 3.9.
Although the particular details of each experiment vary, some standard procedures
were followed for the preparation of samples and for the reaction conditions applied.
General experimental procedures are given later in this section. These reference the
loading of solid catalyst in the reactor, catalytic conditions and subsequent data
retrieval and analysis.
3.3.1 Experimental setup
3.3.1.1 U-tube catalytic reactor and furnace design
The U-tube catalytic reactor was custom designed and fabricated from two sections of
6mm OD SiO2 tubing by Glasbläserei Müller in Adlershof (
Figure 3.10). The reactor is fritless for cleaning purposes and the catalyst is
sandwiched between two SiC beds, the bottom of which is prevented from flow-
through by a plug of SiO2 wool sitting on the internal shoulder. The geometry of the
reactor is optimized for a top-down flow whereby the reactant gases are rapidly

101
purged in the narrow outlet (ID = 1 mm) to reduce the influence of gas phase
reactions. The ID of the reactor at the catalytic bed is 4mm and the experimentally
determined isothermal zone over the temperature range 200-700°C was determined to
be 30 mm (± 0.5°C), 40 mm (± 1°C) and > 50 mm (± 2°C). All experiments were
carried out within the smallest isothermal range (± 0.5°C) – see
Figure 3.10).
Figure 3.9: Graphical layout of the ‘Taniwha’ catalytic reactor system.
The heating furnace was adapted from a horizontal fixed tube furnace from Carbolite
with a temperature range < 900°C. The heating tube and surrounding insulation were
separated and mounted vertically on a crafted base with ceramic fibre stuffing used to
prevent downwards heat loss. The heating is controlled by a Eurotherm 2416 PID
controller via a solid-state relay and internal type-K thermocouple. The U-tube
reactor mentioned earlier was mounted in the furnace tube by way of a machined
ceramic sleeve, which also served to prevent heat flow within the tube.
The temperature at the catalyst bed was measured using a thermocouple introduced
via a custom made T-junction on the tube adaptor. Temperature data from this
thermocouple was recorded to the PC using a Picolog temperature logging system.

102
Figure 3.10: Schematic diagram of U-tube reactor (not to scale) with temperature profile
mapped over catalyst bed (yellow). Temperature — 400°C; 100 sccm He.
For some experiments it was required for the catalyst to be introduced to the reactor
without contact with the atmosphere or alternatively removed from the reactor to the
glovebox directly. To facilitate this, a bypass setup was fabricated using a 4-way
valve that allowed for the facile transfer of the reactor under inert conditions.
3.3.1.2 Gas delivery system
The basic layout of the gas delivery system is presented in Figure 3.9. Pressurised N2,
H2, O2 and He were obtained from a centralised gas supply (Westfalen; > 99.995%
purity). C3H8 (Westfalen; > 99.95%), CO2 (Westfalen; > 99.995%), and proofgas
(CH4/H2, Westfalen; > 99.995%), were obtained from bottles kept in a dedicated gas
storage cabinet. All gases, with the exception of water-steam, which was obtained by
vapour-liquid saturation, were moderated by the use of mass flow controllers (MFCs)
from Bronkhorst. The MFCs were operated via a PC interface and calibrated by 10-
point calibration using a bubble-film flow meter from Horiba.
All gas supply lines were 1/8” stainless steel and the gas mixing manifold was purged
preferentially with inert N2 to reduce dead volume. Water-steam was introduced to the
pre-mixed gas feed by introducing the feed to a glass saturator filled with bidistilled
water via a 4-way Valco valve. The volume of water-steam in the gas feed was
controlled by a thermostat (Haake) to raise or lower the water temperature and
therefore vapour pressure in the saturator. The exact temperature of the outlet vapour
4 0 0 4 0 1 4 0 2 4 0 3 4 0 4 4 0 5 4 060
1 0
2 0
3 0
4 0
5 0
6 0
Dis
tan
ce fr
om s
houl
der /
mm
T em p. / °C

103
is monitored by a thermocouple logging device from Picolog and in the range 20-
70°C was found to deviate < ±0.1°C.
The reactor is operated in an online/bypass mode through a 4-way Valco valve and
the gas connection to the SiO2 tubing using Ultratorr fittings from Swagelok. After the
reactor the outlet gas line is directed through the sampling loops connected to the GC.
To prevent water condensation in the gas stream, the reactor and bypass valves are
contained within a heating oven (Heraeus) and the gas lines from the saturator outlet
and outlet to the GC are heated.
3.3.1.3 Product analytics
The gas analytics are carried out by GC (Agilent 5890) using a method developed for
the (oxy) dehydrogenation of propane. The outlet gas is flowed continuously through
the sampling loops atop the GC and automatically sampled by a series of pneumatic
valves that divert the educt gas through the columns. The gas analysis is carried out
using both a flame ionisation detector (FID) and a thermal conductivity detector
(TCD) in parallel. The FID is used to detect flammable gases (hydrocarbons, organic
molecules) while the TCD detects permanent gases (CO2, O2, N2, CO, H2O).
3.3.2 Experimental procedure
The preparation of solid samples for catalytic testing was carried out with reference to
Chapter 9 of the Handbook of Heterogeneous Catalysis.[114] Materials to be subjected
to catalytic conditions were pressed and sieved to give fractions 250 < x < 355µm
before reaction. These values are deemed to be within the limit with respect to the
avoidance of tunneling or axial temperature/concentration gradients in the reactor
w.r.t. the ID. An exception was made for materials that were transferred directly from
the glovebox, which were tested as loose powders. All carbide materials used in this
study were obtained via TPR-carburisation in a rotary furnace as described in Chapter
2. In some cases, the materials were passivated after synthesis and for other cases the
materials were used directly with aid of air-free transfer devices and glovebox work.
An overview of the catalyst materials is given in Table 3.2.
Catalytic reactions over the carbides were carried out in all cases by ramping to the
operating temperature while flowing N2 (20 sccm) over the catalyst. At operating
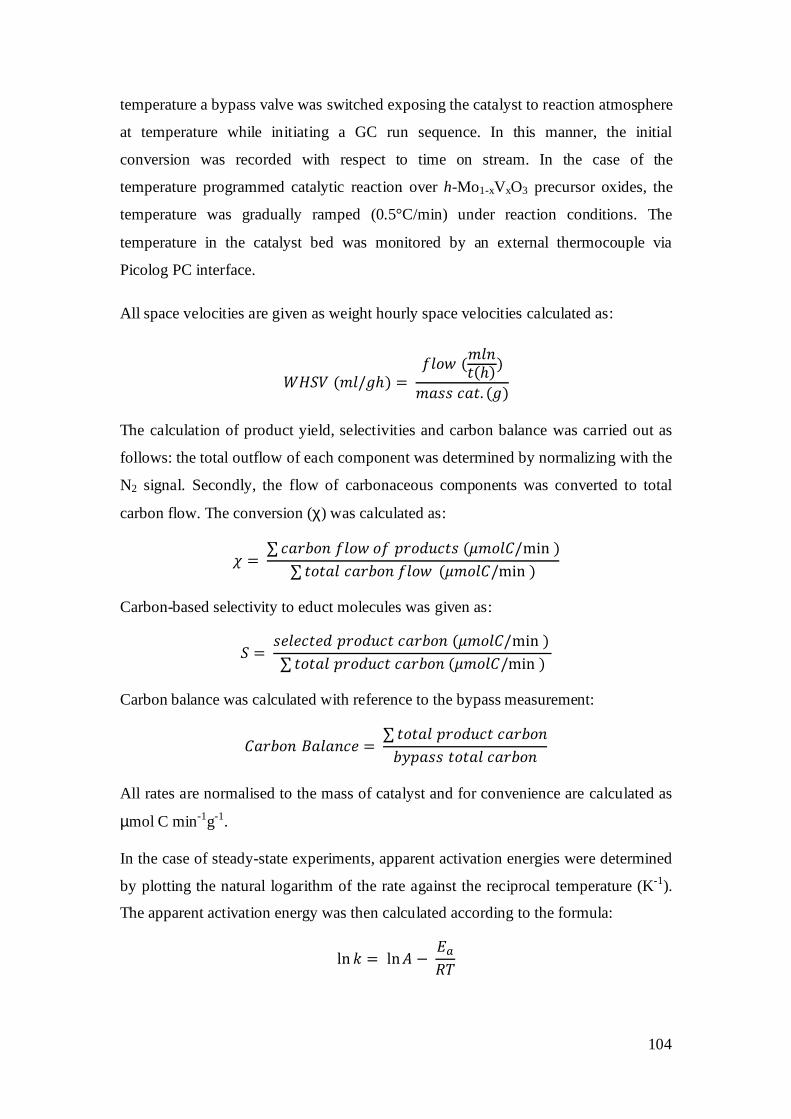
104
temperature a bypass valve was switched exposing the catalyst to reaction atmosphere
at temperature while initiating a GC run sequence. In this manner, the initial
conversion was recorded with respect to time on stream. In the case of the
temperature programmed catalytic reaction over h-Mo1-xVxO3 precursor oxides, the
temperature was gradually ramped (0.5°C/min) under reaction conditions. The
temperature in the catalyst bed was monitored by an external thermocouple via
Picolog PC interface.
All space velocities are given as weight hourly space velocities calculated as:
789: ��</ ℎ� = &<>? ��<@
#�ℎ���ABB CA#. � �
The calculation of product yield, selectivities and carbon balance was carried out as
follows: the total outflow of each component was determined by normalizing with the
N2 signal. Secondly, the flow of carbonaceous components was converted to total
carbon flow. The conversion (χ) was calculated as:
D = ∑ CAFG>@ &<>? >& .F>"HC#B �I�><J/min �∑ #>#A< CAFG>@ &<>? �I�><J/min �
Carbon-based selectivity to educt molecules was given as:
9 = BM<MC#M" .F>"HC# CAFG>@ �I�><J/min � ∑ #>#A< .F>"HC# CAFG>@ �I�><J/min �
Carbon balance was calculated with reference to the bypass measurement:
JAFG>@ NA<A@CM = ∑ #>#A< .F>"HC# CAFG>@GO.ABB #>#A< CAFG>@
All rates are normalised to the mass of catalyst and for convenience are calculated as
µmol C min-1g-1.
In the case of steady-state experiments, apparent activation energies were determined
by plotting the natural logarithm of the rate against the reciprocal temperature (K-1).
The apparent activation energy was then calculated according to the formula:
ln $ = ln P − 4Q6!
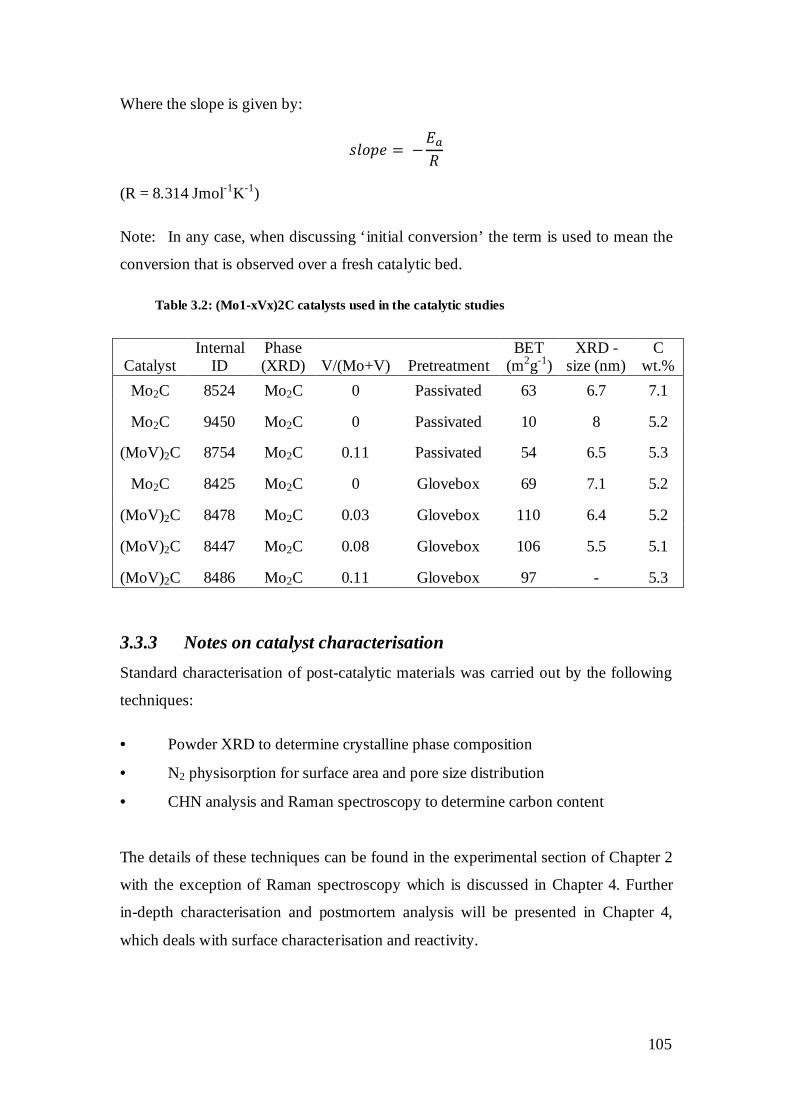
105
Where the slope is given by:
B<>.M = − 4Q6
(R = 8.314 Jmol-1K-1)
Note: In any case, when discussing ‘initial conversion’ the term is used to mean the
conversion that is observed over a fresh catalytic bed.
Table 3.2: (Mo1-xVx)2C catalysts used in the catalytic studies
3.3.3 Notes on catalyst characterisation
Standard characterisation of post-catalytic materials was carried out by the following
techniques:
• Powder XRD to determine crystalline phase composition
• N2 physisorption for surface area and pore size distribution
• CHN analysis and Raman spectroscopy to determine carbon content
The details of these techniques can be found in the experimental section of Chapter 2
with the exception of Raman spectroscopy which is discussed in Chapter 4. Further
in-depth characterisation and postmortem analysis will be presented in Chapter 4,
which deals with surface characterisation and reactivity.
Catalyst Internal
ID Phase (XRD) V/(Mo+V) Pretreatment
BET (m2g-1)
XRD - size (nm)
C wt.%
Mo2C 8524 Mo2C 0 Passivated 63 6.7 7.1
Mo2C 9450 Mo2C 0 Passivated 10 8 5.2
(MoV)2C 8754 Mo2C 0.11 Passivated 54 6.5 5.3
Mo2C 8425 Mo2C 0 Glovebox 69 7.1 5.2
(MoV)2C 8478 Mo2C 0.03 Glovebox 110 6.4 5.2
(MoV)2C 8447 Mo2C 0.08 Glovebox 106 5.5 5.1
(MoV)2C 8486 Mo2C 0.11 Glovebox 97 - 5.3

106
3.4 Results
3.4.1 Dehydrogenation vs. oxydehydrogenation vs. steam
dehydrogenation
Investigative reactions into dehydrogenation, oxydehydrogenation and steam-
dehydrogenation over Mo2C were carried out over bulk Mo2C synthesised by TPRC
method in the UTP II rotating furnace reactor described in Chapter 2 and detailed in
Table 3.2. All reactions were carried out over 295mg of Mo2C mixed 1:1 (wt.%) with
SiC (sieve fraction 250-355µm) with a total flow of 40 sccm giving a WHSV of 8250
mlg-1h-1. The concentration of C3H8 was kept constant at 10%. In the case of
dehydrogenation, the balance was N2 (90%). For steam dehydrogenation 10% water-
steam was added to the feed with N2 balance (80%). For oxydehydrogenation, 3.5%
oxygen was added to the feed with N2 balance (86.5%). Reactions conditions and
details are outlined Table 3.3 below.
For each set of conditions the reaction was repeated with 3 different pretreatments of
the passivated catalyst :
• No pre-treatment (passivated carbide)
• Reduction @500°C for 2 hours (20 sccm H2)
• Reduction @675°C for 2 hours (20 sccm H2)
Initial rates of propene formation observed for all conditions were subject to strong
deactivation over the first two hours (Figure 3.11). The corresponding conversion of
propane dropped to χ < 0.5% in the case of ODH and DH, however, it was observed
to approach a steady state of χ = 2% for the steam containing feed.
For the reaction of propane in inert atmosphere (Figure 3.11a), it was observed that
the initial rate of propene formation decreased with pre-reduction temperature and
deactivation was achieved more quickly. Post-analysis by XRD reveals that the β-
Mo2C phase is retained. Similar propene formation rates are observed in the case of
ODH. The initial conversion is relatively high (ca. 25% for passivated Mo2C) with
low selectivity to C3H6 and high selectivity to COx. After 3 hours on stream further
deactivation occurs and the conversion approaches zero.

107
00:00 02:00 04:00 06:000
10
20
20 40 60 800
50
100
150
200
2θ
Post DH reaction(Mo
2C - #8614)
(a)
rate
/ µm
ol C
3H6
min
-1g
-1
time / hh:mm
00:00 02:00 04:00 06:000
10
20
20 40 60 800
200
400
600
800
1000
2θ
Post DH reaction(MoO
3 - #8554)
rate
/ µm
ol C
H6
min
-1g-1
time / hh:mm
(b)
00:00 02:00 04:00 06:000
10
20
30
40
50
60
20 40 60 800
20
40
60
80
100
2θ
Post DH reaction(Mo
2C/MoO
2 - #8557)
rate
/ µm
ol C
3H6
min
-1g-1
time / hh:mm
(c)
Figure 3.11: Propylene formation rates for: □ = no pre-reduction, ∆ = 500°C pre-reduction,
○ = 675°C pre-reduction. Conditions, (a) inert conditions, (b) O2 addition, (c) steam addion.
Inset: post-mortem powder XRD of the catalyst (final patterns are the same for different
pre-treatments).
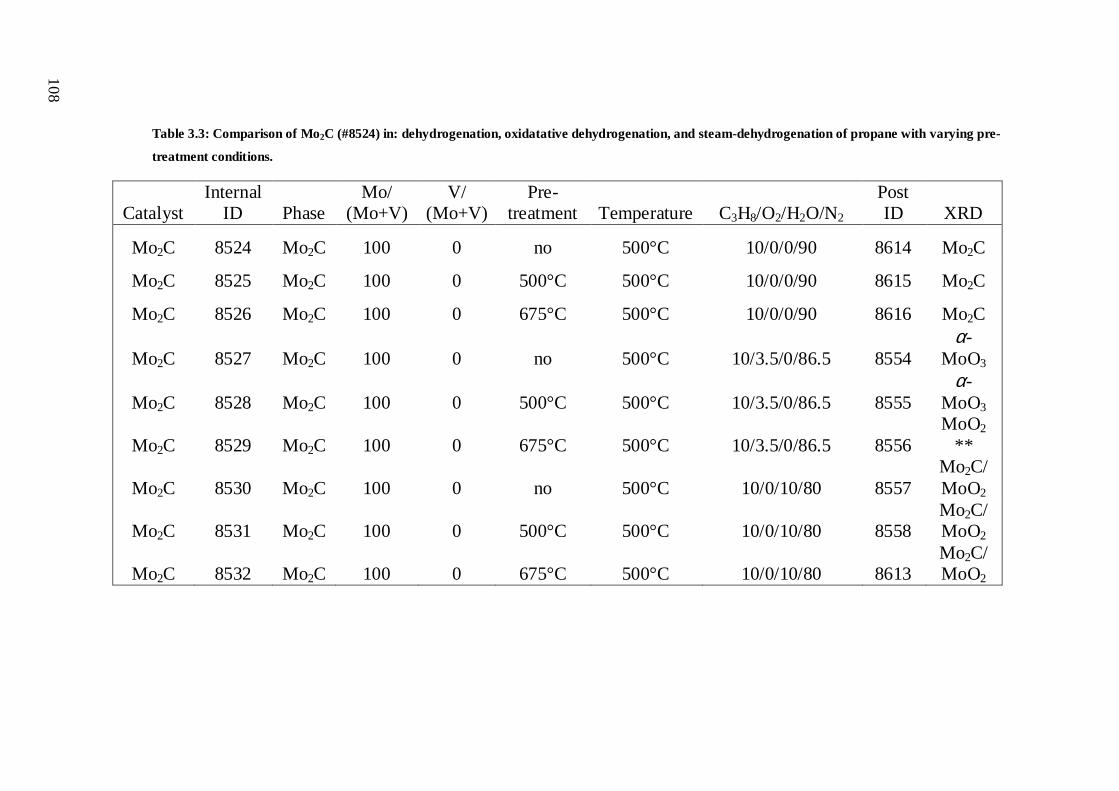
Table 3.3: Comparison of Mo2C (#8524) in: dehydrogenation, oxidatative dehydrogenation, and steam-dehydrogenation of propane with varying pre-
treatment conditions.
Catalyst Internal
ID Phase Mo/
(Mo+V) V/
(Mo+V) Pre-
treatment Temperature C3H8/O2/H2O/N2 Post ID XRD
Mo2C 8524 Mo2C 100 0 no 500°C 10/0/0/90 8614 Mo2C
Mo2C 8525 Mo2C 100 0 500°C 500°C 10/0/0/90 8615 Mo2C
Mo2C 8526 Mo2C 100 0 675°C 500°C 10/0/0/90 8616 Mo2C
Mo2C 8527 Mo2C 100 0 no 500°C 10/3.5/0/86.5 8554 α-
MoO3
Mo2C 8528 Mo2C 100 0 500°C 500°C 10/3.5/0/86.5 8555 α-
MoO3
Mo2C 8529 Mo2C 100 0 675°C 500°C 10/3.5/0/86.5 8556 MoO2
**
Mo2C 8530 Mo2C 100 0 no 500°C 10/0/10/80 8557 Mo2C/ MoO2
Mo2C 8531 Mo2C 100 0 500°C 500°C 10/0/10/80 8558 Mo2C/ MoO2
Mo2C 8532 Mo2C 100 0 675°C 500°C 10/0/10/80 8613 Mo2C/ MoO2
10
8

109
Analyses of post-reaction products reveal total oxidation of Mo2C to α-MoO3. It is
also observed that increasing the temperature of reduction leads to faster deactivation.
The steam-DH reactions show a much higher initial formation rate of propene cf.
ODH and DH. The lowest is observed for Mo2C pre-reduced at 675°C, however, all
formation rates approach a similar value after 4 hours on stream. Conversion of
propane approaches a steady state value of 2% after 5 hours on stream. XRD analyses
of the catalysts after reaction show that the Mo2C is partially transformed to MoO2
with time on stream.
3.4.2 Propane activation in H2
3.4.2.1 Comparison of passivated vs. freshly carburised materials
To determine the influence of surface oxygen passivation on the initial reactivity, two
catalysts were compared under the same conditions. Passivated Mo2C (#9450) and
freshly prepared Mo2C (#8425) were tested at WHSV = 5000 mlg-1h-1 under the
reaction conditions: C3H8 = 25%, H2 = 55%, N2 = 20% at T = 500°C for 24 hours.
The reaction of propane over molybdenum carbide in the absence of oxygen gives
primarily a mixture of C1-C3 products with C3H6 resulting as the principal product
over time. In Figure 4.11 the initial conversion and selectivities for passivated (#9450)
and unpassivated (#8425) Mo2C at T = 500°C are shown. For the most part, the C3H8
conversion, formation rates and selectivities are very similar. Initial conversion in
both cases is relatively high (> 40%), dropping exponentially over time to ca. 2.5%
for both reactions after 4 hours on stream. The rate of C3H6 formation sharply
increases in the first minutes on stream, but otherwise remains constant at 12-14
µmolg-1min-1. The change in conversion is due the initially high selectivity to
hydrogenolysis decreasing with time on stream. A ratio for S(C2H4)/S(CH4) ≈ 0.5 is
observed with time on stream, but in the case of the passivated carbide, it is initially
seen S(C2H6) > S(CH4). In this case, the selectivity to CH4 initially increases. Another
difference observed for the passivated Mo2C cf. unpassivated is the initial formation
of CO observed for the passivated material, which disappears after ca. 1 hour on
stream. It can be observed that the pattern of selectivity to CO in this time is mirrored
by S(CH4).

110
00:00 02:00 04:00 06:00 08:000
5
10
15
20
25
30
35
40
χ(C3H
8) - fresh Mo
2C (#8425)
χ(C3H
8) - passivated Mo
2C (#9450)
r(C3H
6) - fresh Mo
2C
r(C3H
6) - passivated Mo
2C
X Axis Title
Con
vers
ion
/ %
0
2
4
6
8
10
12
14
16
18
20r(C
3 H6 )
/ µmolg
-1min
-1
00:00 02:00 04:00 06:00 08:000
10
20
30
40
50
60
S(CO) S(C2H
4)
S(C2H
6)
S(CH4)
Sel
ectiv
ity /
%
time / hh:mm
Fresh Mo2C
Passivated Mo2C
S(C3H
6)
Figure 3.12: Activation of propane carried out at 500°C with WHSV = 5000 ml g-1h-1 over
fresh Mo2C (#8425, transferred from glovebox) and passivated Mo2C (#9450).
time / hh:mm

Table 3.4: Propane dehydrogenation (H2/C3H8/N2) over different (Mo1-xVx)2C catalysts — influence of vanadium content and temperature
Catalyst Internal
ID Phase Cinitial (%)
V/ (Mo+V) Pretreatment T / °C
WHSV (mlg-1h-1) C3H8/H2/N2 Post ID XRD
Cafter (%)
Mo2C 8425 Mo2C 5.2 0 Glovebox 500°C 5000 25/55/20 10935 Mo2C 8.8
Mo2C 8425 Mo2C 5.2 0 Glovebox 550°C 5000 25/55/20 11004 Mo2C 9.3
(MoV)2C 8478 Mo2C 5.2 3 Glovebox 500°C 5000 25/55/20 9751 Mo2C 8.4
(MoV)2C 8478 Mo2C 5.2 3 Glovebox 550°C 5000 25/55/20 11006 Mo2C 10.6
(MoV)2C 8447 Mo2C 5.1 8 Glovebox 500°C 5000 25/55/20 10980 Mo2C 7.4
(MoV)2C 8447 Mo2C 5.1 8 Glovebox 550°C 5000 25/55/20 10996 Mo2C 9.7
(MoV)2C 8486 Mo2C 5.3 11 Glovebox 500°C 5000 25/55/20 9752 Mo2C 5.9
(MoV)2C 8486 Mo2C 5.3 11 Glovebox 550°C 5000 25/55/20 11034 Mo2C 9.0
11
1

112
3.4.2.2 Influence of V content and temperature
The reactivity of a series of four Mo-V carbide catalysts was studied for the activation
of propane in a hydrogen-rich environment. To prevent contamination of surface
oxygen the materials were transferred under argon from the glovebox to the reactor.
The carbides were synthesised by temperature-programmed reduction-carburisation as
detailed in Chapter 3 and are detailed in Table 3.4. All reactions were carried out over
225mg of (Mo1-xVx)2C with a total flow of 19 sccm giving a WHSV of ca. 5000 mlg-
1h-1. The concentration of C3H8 was 25%, with H2 = 55% and the balance was N2
(20%). For each catalyst, the initial conversion was measured at T = 500°C, 550°C.
Additionally, after observing initial conversions at the highest temperature, a steady
state conversion was approached and the temperature was varied between 400°C and
600°C to determine the apparent activation energies of each reaction component.
The effect of vanadium substitution on the catalytic conversion of propane in H2/N2
atmosphere at 550°C is illustrated in Figure 3.13. In Figure 3.13(a), the initial χ(C3H8)
is shown to rise with increasing vanadium content. The rate of C3H6 formation is
initially higher for #8486 and #8447 (the two highest V loadings), but over time the
formation rates converge to ≈ 7 µmolg-1min-1. For sake of clarity, only S(CH4) and
S(C3H6)are shown in Figure 3.13(b). The samples with higher vanadium loadings
show higher S(CH4) cf. Mo2C. It is also shown that the increase in S(CH4) is at the
expense of S(C3H6).
Counter intuitively, increasing the temperature has the effect of decreasing the
conversion. In Figure 3.14, the initial exponential decrease in conversion is observed
for all conditions, but for T = 500°C; χt=0(C3H8) > 20% for both (Mo/V)2C and Mo2C,
whereas at T = 550°C; χt=0(C3H8) ≈ 10-15%. Due to experimental constraints, it is not
possible to measure the instantaneous conversion at precisely t = 0, and the nature of
the deactivation must be inferred from the data points available. Inset in Figure
3.14(a) shows the rate of C3H6 formation over time is higher at lower temperature and
does not exhibit the same ‘deactivation’ that is observed at 550°C.

113
00:00 02:00 04:00 06:00 08:00 10:000
5
10
15
20
25
0
10
20
χ(C3H
6)
r(C3H
6)
r(C3 H
6 ) / µmolg
-1min
-1C
onve
rsio
n / %
Time / hh:mm
Mo2C (#8425)
(Mo0.97
V0.03
)2C (#8478)
(Mo0.92
V0.08
)2C (#8447)
(Mo0.89
V0.11
)2C (#8486)
(a)
00:00 02:00 04:00 06:00 08:00 10:000
25
50
75
S(CH4)
Mo2C (#8425)
(Mo0.97
V0.03
)2C (#8478)
(Mo0.92
V0.08
)2C (#8447)
(Mo0.89
V0.11
)2C (#8486)
Sel
ectiv
ity /
%
Time / hh:mm
S(C3H
6)
(b)
Figure 3.13: (a) Effect of increasing vanadium content on the conversion and rate of
propene formation; T = 550°C under H2/C3H8/N2 at 5000 ml g-1 h-1. (b): Comparison of
S(C3H6) vs. S(CH4); conditions as above.

114
00:00 02:00 04:00 06:00 08:00 10:000
10
20
Mo2C
(Mo0.92
V0.08
)2C500°C
550°C
00:00 02:00 04:00 06:00 08:00 10:000
5
10
15
20
550°C
500°C
r(C
3H6)
/ µm
ol m
in-1g-1
χ(C
3H8) /
%
Time / hh:mm
(a)
00:00 02:00 04:00 06:00 08:00 10:000
25
50
75(b)
Mo2C
(Mo0.92
V0.08
)2C
550°C
500°C
S(C
3H6)
/ %
Time / hh:mm
00:00 02:00 04:00 06:00 08:00 10:000.0
0.2
0.4
0.6
0.8
1.0 (c)
550°C
S(C
2H6)/
S(C
H4)
Mo2C
(Mo0.92
V0.08
)2C
Time / hh:mm
500°C
Figure 3.14: (a) Total conversion of propane vs. time at T = 500 & 550°C over fresh Mo2C
(#8425) and (Mo0.92V0.08)2C (#8447). Inset: Propene formation rate at T = 500 & 550°C for
#8425. (b) S(C3H6) for #8425 & #8447 at T = 500, 550°C. (c): ratio of S(C2H6)/S(CH4) at
varying conditions.

115
0 2 4 6 8 10 1280
90
100
110
120(a)
Ap
pare
nt E
a (k
J/m
ol)
V/(Mo+V) / % metals
Ea[χ(C
3H
8)]
0 2 4 6 8 10 1275
80
85
90
95
100(b)
Ea[r(C
3H
6)]
App
aren
t Ea (k
J/m
ol)
V/(Mo+V) / % metals
0 2 4 6 8 10 12120
130
140
150
160
170
180
0.0011 0.0012 0.0013 0.0014-1
0
1
2
3
8425 8478 8447 8486
ln[r
(CH
4)]
1/T (K-1)
600°C - 500°C
(c)
Ea[r(CH
4)]
App
aren
t Ea (k
J/m
ol)
V/(Mo+V) / % metals basis
Figure 3.15: Apparent activation energies over 400 - 600°C derived from Arrhenius plots
for: (a) apparent rate of propane consumption; (b) propene formation; (c) methane
formation (500–600°C) — inset: non-linear behaviour observed for Ea[2].

116
With increasing temperature it is also observed that the ratio of the hydrogenolysis
products changes (Figure 3.14(c)). At 500°C S(C2H4)/S(CH4) ≈ 0.4-0.5 which
decreases to ≈ 0.15 at 550°C.
Comparison of the steady-state catalyst behaviour in Figure 3.15 shows some slight
trends. The apparent activation energies for the conversion of propane increase with
vanadium concentration from ca. 90 → 110 kJmol-1. This is reflected in the increasing
apparent activation energy observed for propene formation (80 → 90 kJmol-1). The
apparent activation energy for CH4 formation is relatively high (135-145 kJmol-1) but
does not appear to be correlated with the vanadium content of the catalyst. The
apparent Ea(CH4) is derived from the Arrhenius plots in the range 500-600°C. Below
500°C the plots deviate from linearity.
3.4.2.1 Variation of space velocity
In order to determine the dependence of the reaction products on space velocity,
comparative measurements were taken at steady-state conversion over Mo2C (450mg,
#9450, Table 3.3) at 500°C. The sample was recarburised in situ by ramping to 675°C
@5°C/min and holding for 1 hour before cooling to reaction temperature under N2.
Initial conversion was measured at a WHSV = 5000 mlg-1h-1 until it was determined
that the conversion was at steady-state. Catalytic measurements were recorded at
1250, 2500, and 5000 mlg-1h-1.
By varying the space velocity over the Mo2C catalyst at steady-state conditions
(Figure 3.19) it can be observed which reactions are interdependent. Increasing the
space velocity from 1250 to 5000 leads to a doubling of the rate of hydrogenolysis
(CH4 and C2H6), but only a marginal increase in the rate of dehydrogenation. This
implies that the production of C3H6 has an element of dependency upon the
hydrogenolysis reaction and is preferentially consumed with respect to C3H8.
The selectivity-conversion plot (Figure 3.16(b)) also provides important information
about the reaction mechanism. The extrapolated trend lines shown for the products
intersect the y-axis at conversion = 0 at various positions which sum to ca. 100%,
implying that these 4 products are representative of the total. It’s important to note
that the extrapolated trendline for S(C2H6) intersects the y-axis at close to the origin.

117
0
10
20
30
40
50
60
70
80
0 1 2 3
S(CH4)
S(C2H4)
S(C2H6)
S(C3H6)
Conversion (C3H8) / %
Sel
ectiv
ity (%
)
CH4 C2H4 C2H6 C3H60
5
10
15
20
25
30
rate
/ µm
ol C
min
-1g-1
5000 ml g-1h
-1
2500 ml g-1h-1
1250 ml g-1h-1
Figure 3.16: (a) Bar plot of formation rates for observed products in steady state
H2/C3H8/N2 over Mo2C (#9450). (b) Selectivity-conversion plot for observed products.
This is indicative of a secondary product for the reaction of propane on Mo2C. If we
consider the basic reaction network:
C3H8 → C3H6 + H2 — propane dehydrogenation (primary)
C3H8 → C2H4 + CH4 — partial hydrogenolysis (primary)
C2H4 + H2 → C2H6 — ethylene hydrogenation (secondary)
then this would appear to be consistent with the observed data. Unfortunately, the
conversion was only observed over a small range and further, in-depth analysis is not
possible with this data.
3.4.1 Propane activation in H2/H20
The influence of steam as an oxidant co-feed on the reactivity was determined by first
carrying out series of preliminary experiments which led to a range of stable
conditions for the Mo2C phase.
(a)
(b)

Table 3.5: Details of carbide samples treated in C3H8/H2/H2O
Table 3.6: Apparent activation energies calculated for steam-dehydrogenation of propane over Mo2C.
Catalyst Internal ID
Phase Cinitial (%)
V/ (Mo+V
) T / °C
WHSV (mlg-1h-1)
C3H8/H2/H2
O Post ID
XRD Cafter (%)
BET (m2/g)
Mo2C 9450 Mo2C 5.3 0 500°C 5000 25/55/20 9663 Mo2C 6.3 25 Mo2C 9450 Mo2C 5.3 0 550°C 5000 25/55/20 9476 Mo2C 7.6 30 Mo2C 9450 Mo2C 5.3 0 600°C 5000 25/55/20 9515 Mo2C 7.9 38
(MoV)2C 8754 Mo2C 5.1 0.10 500°C 5000 25/55/20 9420 Mo2C/MoO2 2.6 34 (MoV)2C 8754 Mo2C 5.1 0.10 550°C 5000 25/55/20 9327 Mo2C/MoO2 6.5 44 (MoV)2C 8754 Mo2C 5.1 0.10 600°C 5000 25/55/20 9368 Mo2C/MoO2 5.5 39 (MoV)2C 8754 Mo2C 5.1 0.10 650°C 5000 25/55/20 9388 Mo2C/MoO2 7.1 40
Product Apparent Ea (< 510°C)
kJ/mol Apparent Ea (> 510°C)
kJ/mol C3H8 (χ) 137 70
C3H6 120 54 C2H6 241 - C2H4 195 - CH4 185 - CO 272 66 CO2 216 -
11
8
119
The conditions applied in the study were; C3H8 = 25%, H2 = 55% and H2O = 20%
over a catalyst mass of 450mg (total flow 38 sccm) to give a WHSV = 5000 mlg-1h-1.
Initial conversions were observed at 500, 550 and 600°C under the previously
mentioned conditions for Mo2C (#9450) and for (Mo0.9V0.1)2C (#8754). The influence
of reductive pre-treatment was also determined for both catalysts.
For the case of Mo2C, the apparent activation energies of formation of the respective
products were determined at steady-state conversion after reaction at 600°C for 24
hours.
The catalytic conversion of propane in steam conditions is a considerably more
complex network of reactions. Beyond dehydrogenation and hydrogenolysis products,
steam-reforming products and water-gas shift are observed to play a role. In Figure
3.17(a), the conversion and rate of propene formation are contrasted at 500, 550 and
600°C. As observed in the previous ‘dry’ study, the conversion of propane decreases
more sharply with increasing temperature. At 500°C the conversion is steady at ca.
8% and the rate of propene formation is constant (ca. 25 µmolg-1min-1). The initial
conversion does not change significantly with increasing temperature, but exhibits an
initial increase to a peak yield (t = 6h for 550°C, t = 3h for 600°C) before declining
over time.
Analysis of the product selectivities (for T = 550°C – Figure 4.16b) shows a high
initial selectivity to CO, a product of steam reforming, as well as dehydrogenation and
hydrogenolysis products. This is followed at t = 5h by a peak in selectivity to CO2
which precedes the peak production of C3H6. Over time the selectivity to C3H6
approaches 90%.
An Arrhenius plot for the formation rates of observed products in the steam-H2
activation of propane shows a strong dependency on temperature (see
Figure 3.18). Below 510°C the behaviour is observed to be linear, but above 510°C
the apparent Ea of all the products decreases indicating a change in the underlying
material. This is reflected in the reactivity, which is observed to be steady state at T =
500°C but changes dramatically at higher temperatures. The apparent activation
energies observed for the products are reported in Table 3.6.

120
00:00 03:00 06:00 09:00 12:00 15:000
20
40
60
80
100
0
5
10
15
20
25
30
35
40
χ(C3H
8)
C balance
%
time / hh:mm
500°C550°C600°C r(C
3 H6 ) / µm
ol h-1g
-1
r(C3H
6)
00:00 03:00 06:00 09:00 12:00 15:000
20
40
60
80
100
0
5
10
15
20
25
30
35
40
S(CO2)
S(CO) S(CH
4)
S(C2H
4)
S(C2H
6)
S(C3H
6)
Sel
ectiv
ity %
time / hh:mm
CO2
r(C3 H
6 ) / µmol h
-1g-1
r(C3H
6)
CO
Figure 3.17: (a) Conversion and C3H6 rate plots over time for steam/H2 propane activation
over Mo2C (#9450) at 500, 550 & 600°C. (b) Selectivity evolution with time on stream at
550°C.

121
0.00124 0.00128 0.00132 0.00136
-2
-1
0
1
2
3
4540 530 520 510 500 490 480 470 460
ln[c(CO2)]
ln[c(CO)] ln[c(CH
4)]
ln[c(C2H
4)]
ln[r(C2H
6)]
ln[r(C3H
6)]
ln[χ(C3H
8)]
T (C°)
ln(r
ate)
1/T (K-1)
Figure 3.18: Arrhenius plot of ln(product formation rates) vs. 1/T for steam/H2 activation of
propane over Mo2C (#9450) at steady-state for 460°C < T < 540°C. Region of linearity is
shaded.
CO2 CO CH4 C2H4 C2H6 C3H60
5
10
15
20
25
30
rate
/ µm
ol C
min
-1g-1
5000 ml g-1h
-1
2500 ml g-1h-1
1250 ml g-1h-1
Figure 3.19: Variation of space velocity in steam/H2 propane activation over Mo2C (#9450)
— product formation rates.
As is seen in the case of the H2/C3H8 conditions, decreasing the space velocity from
5000 → 1250 affords only a slight increase in propene formation rate while the rates
of CO2, CO and CH4 formation increase by more than double (Figure 3.19). This
implies that the propene is preferentially consumed to form one or more of these
products.

122
00:00 03:00 06:00 09:00 12:00 15:000
20
40
60
80
100
0
5
10
15
20
25
30
35
40
χ(C3H
8)
C balance
%
time / hh:mm
(Mo0.89
V0.11
)2C - #8754
Mo2C - #9450
r(C3 H
6 ) / µmo
l h-1g
-1
r(C3H
6)
Figure 3.20: Conversion and rate of C3H6 formation for steam/H2 propane activation over
Mo2C (#9450) and (Mo0.89V0.11)2C at T = 550°C.
The influence of vanadium content differs to that observed for H2/C3H8. The
conversion of propane is not observed to change dramatically but the rate of propene
formation is increased with respect to Mo2C (Figure 3.20). However, the mixed Mo/V
carbide is unstable to oxidation by steam under these conditions, and at a range of
temperatures it can be seen in XRD powder diffraction that the catalyst is partially
oxidised to MoO2 (Figure 3.21).
10 20 30 40 50 60 70 800
100
200
300
400
500
600
700
(Mo0.89
V0.11
)2C (#9388) - 650°C
(Mo0.89
V0.11
)2C (#9368) - 600°C
(Mo0.89
V0.11
)2C (#9327) - 550°C
(Mo0.89
V0.11
)2C (#9420) - 500°C
Mo2C (#9515) - 600°C
Mo2C (#9476) - 550°C
Int.
/ A.U
.
2θ
Mo2C (#9663) - 500°C
Figure 3.21: Post-catalytic X-ray powder diffraction patterns for steam/H2 activation of
propane at different temperatures over Mo2C (#9450) and (Mo0.89V0.11)2C (#8754). Phase
composition: ♦ — Mo2C (hcp), ● — MoO2 (monoclinic).

123
It can be seen that at T = 500°C the post reaction product is largely MoO2, however
with increasing temperature, the stability of the carbide phase (Mo2C) increases and at
650°C there is only a trace of MoO2 visible. Mo2C was stable under all tested
conditions.
3.4.2 CO2 as an alternative oxidant source
To contrast the effects of CO2 and oxygen on the catalytic conversion of propane,
CO2 was added to the reaction mixture. The conditions applied in the study were;
C3H8 = 25%, H2 = 55% and CO2 = 20% over a catalyst mass of 450mg (total flow 38
sccm) to give a WHSV = 5000 mlg-1h-1.
Initial conversions were observed at 500°C and 550°C under the above conditions for
Mo2C (#9450) and a pattern of behaviour similar to that observed for steam/H2-DH
was apparent.
As can be seen in Figure 3.22, the ‘activation’ is characterised by an initial bump in
the rate of propylene formation as was seen for steam containing feeds (cf. Figure
3.17). For the same temperature (550°C), the rise in selectivity is more immediate in
the case of CO2. This implies that CO2 is a stronger oxidant than H2O.
04:00 08:00 12:00 16:00 20:000
20
40
60
80
100
120
0
10
20
30
S(CH4) S(C2H4) S(C2H6) S(C3H6) Conversion C balance
Sel
ectiv
ity %
time / hh:mm
r(C3 H
6 ) / µmol h
-1g-1
r(C3H
6)
Figure 3.22: Initial selectivity, conversion and propylene formation rate of CO2/C3H8/H2
over Mo2C (#9450) at 550°C. COx is excluded due to conflicting carbon-sources.

124
At steady-state conversion after reaction at 600°C for 24 hours, it was additionally
attempted to determine the apparent activation energies of product formation.
However, this proved to be unreliable due to the complication in extracting the data
with a strong background of RWGS observed for the reaction. Further experiments to
determine whether CO2 hydrogenation reaction had an influence on the CO2/H2-DHP
are detailed in the next section.
3.4.3 Reverse water-gas shift over Mo2C
In the C3H8/CO2/H2 reactions, significant RWGS was observed. To investigate this
reactivity, the reaction was carried out over freshly carburised Mo2C (#9450). The
conditions applied in this study were; N2 = 25%, H2 = 55% and CO2 = 20% over a
catalyst mass of 450mg (total flow 38 sccm) to give a WHSV = 5000 mlg-1h-1. No
induction period was observed for the reaction and no significant deactivation was
noted.
In Figure 3.23, the conversion of CO2 is close to the RWGS equilibrium conversion as
calculated for the reaction conditions. The ratio of selectivity for CO:CH4 at 500°C is
ca. 93:7.
300 350 400 450 5000
50
100
150
200
250
300
350
400
0
20
40
60
80
100
rate
(µm
ol g
cat-1
min
-1)
Temperature (°C)
r(CO) r(CH4) r(C2H6) r(C3H8)
Calculated equilibriumconversion RWGS
Carbon balance
χ(CO2) %
Figure 3.23: RWGS at WHSV = 5000 ml/gh over Mo2C (#9450) after carburisation in situ.

125
As it was observed that there was very little information on RWGS over carbides
some further preliminary experiments were made. By decreasing the catalyst mass to
20mg (#8425 – transferred from glovebox) with the same flow rate, a WHSV of
114000 (GHSV ≈ 220000) was achieved. Even at this high space velocity the reaction
was observed to go to equilibrium conversion. At the increased GHSV the selectivity
of CO:CH4 was observed to be ≈ 99:1 and the carbon balance was ca. 95%.
00:00 04:00 08:00 12:00 16:00 20:000
20
40
60
80
100
120
140
0
20
40
60
80
100
120
140
rate
(µm
ol g
cat-1
s-1)
r(CO) r(CH4) C balance CO2 conversion
time (hh:mm)
500°C
%
600°C
Figure 3.24: RWGS over Mo2C (#8425) at GHSV = 220000
No significant deactivation was observed over 24 hours and the XRD and CHN post-
mortem analysis indicated that there was no bulk phase change or deposition of
carbon.
3.4.4 Temperature-programmed reduction-carburisation reaction –
H2/C3H8 over h-Mo1-xVxO3
In the previous experiments, Mo2C and (Mo1-xVx)2C are presented as a model system
for the activation of propane on a strongly reduced catalyst. As a complementary
study to link carbide formation and propane reactivity, temperature-programmed
reduction was carried out under previous H2/C3H8 conditions for each of the oxide
precursors. The oxides were synthesised by co-precipitation as detailed in Chapter 2
and the reaction details are given in Table 3.7.

126
Table 3.7: Table of precursor oxides for TPR under H2/C3H8/N2
Precursor Internal
ID Mo/
(Mo+V) V/
(Mo+V) pre BET (m2/g)
WHSV (mlg-1h-1) C3H8/H2/N2
Post ID XRD
post-BET (m2/g)
h-MoO3 8650 100 0 <1 5000 25/55/20 11196 α-MoC1-x 74
h-Mo(V)O3 6702 97 3 <1 5000 25/55/20 11197 α-MoC1-x 77
h-Mo(V)O3 7911 92 8 <1 5000 25/55/20 11199 α-MoC1-x 98
h-Mo(V)O3 6601 89 11 1.6 5000 25/55/20 11211 α-MoC1-x 112
All reactions were carried out over 225mg of (Mo1-xVx)2C with a total flow of 19
sccm giving a WHSV of ca. 5000 mlg-1h-1. The concentration of C3H8 was 25%, with
H2 = 55% and the balance N2 (20%). The oxides were ramped at 5°C/min to 300°C
and at 0.5°C/min from 300°C to 600°C, held for 2 hours and then cooled at 5°C/min
to 500°C and held for 2 hours before cooling to RT. During the temperature program,
GC samples were taken every 20 minutes to give a temperature resolution of ca.
10°C. After reaction the samples were removed to the glovebox for handling and
post-analysis by BET, XRD, TEM and Raman spectroscopy (see Chapter 4).
00:00 02:00 04:00 06:00 08:00 10:00 12:000
1000
2000
3000
4000
5000
300
350
400
450
500
550
600
650
rate
(nm
olg-1
s-1)
time (hh:mm)
CO CH
4
C2H
4
C2H
6
C3H
6
Tem
perature (°C)
Figure 3.25: Product formation rates for temperature-programmed reaction of H2/C3H8
over h-MoO3.
As shown in Figure 3.25, the reaction product distribution of propane over h-MoO3
changes considerably with the extent of reduction. For the case of undoped h-MoO3

127
(#8650) the product evolution can be divided into three phases. The first is a sharp
increase in the formation of methane and ethane above 400°C. This is followed by an
increase in the C2 and C3 olefin products which coincides with the generation of CO
via RWGS between 450-550°C. The final phase is the decrease in all rates except for
that of methane. In the gas chromatograph the initial traces show that C1 and C2
species as well as C4 species are present in the outlet gas. In Figure 3.26 the gas
chromatographs are shown for the temperature range 400-560°C. It can be seen that
the formation of n- and iso-butane mirrors the formation of ethylene, while the
unsaturated butenes are observed at higher temperatures.
5.5 6.0 6.5 7.0 7.5 8.0 8.5 17.5 18.0 18.5 19.0 19.5 20.0
548524500475450425400
n-C4H
10
C2H
4
C2H
6
CH4
1-C4H
8
i-C4H
8
2-C4H
8
i-C4H
10
560 548 537 524 512 500 488 475 462 450 437 425 412 400
GC elution time (min)
Intenstity (A.U
.)
Tem
p (°C
)
(scale x 25)
Figure 3.26: Gas chromatographs of C1, C2 and C4 products at increasing temperatures.
The variations observed for the h-Mo(V)O3 oxide series can be seen in Figure 3.27.
From the overall conversion of C3H8 there are some similarities with the observed
TPRC profiles in Chapter 2. The oxides with lower vanadium content are reduced at
lower temperatures resulting in a faster onset of activity. Overall, it is observed that
the rate of methane formation for the undoped and 3% V doped oxides is significantly
higher than for that of the V-rich samples, especially at higher reduction temperatures.
With respect to the onset of CO formation via RWGS, the V-poor samples show a
small onset at ca. 450°C, but all the samples start properly at ca. 480°C indicating the
integration of C into the MoOx lattice. This temperature is much lower than is
observed for CH4 for reasons discussed in Chapter 1. It can be seen that the formation
of dehydrogenation products directly precedes the carburisation process and is
observed to peak just before the CO maximum. The formation rate of propylene is

128
remarkably similar for all the catalysts and does not appear to be correlated with the
catalyst surface area before or after reduction.
00:00 02:00 04:00 06:00 08:00 10:00 12:000
5
10
15
20
25
C3H
8 c
onve
rsio
n (%
)
time (hh:mm)
C3H
8 conversion
350
400
450
500
550
600
650
Tem
p (°C)
00:00 02:00 04:00 06:00 08:00 10:00 12:000
1000
2000
3000
350
400
450
500
550
600
650CO formation
CO
rat
e (n
mol
/gs)
time (hh:mm)
Tem
p (°C)
00:00 02:00 04:00 06:00 08:00 10:00 12:000
2000
4000
6000CH
4 formation
Tem
p (°C)
CH
4 rat
e (n
mol
/gs)
time (hh:mm)
350
400
450
500
550
600
650
00:00 02:00 04:00 06:00 08:00 10:00 12:000
100
200
300C
2H
4 formation
Tem
p (°C)
CO
rate
(nm
ol/g
s)
time (hh:mm)
350
400
450
500
550
600
650
00:00 02:00 04:00 06:00 08:00 10:00 12:000
1000
2000
3000C
2H
6 formation
Tem
p (°C)
CO
rate
(nm
ol/g
s)
time (hh:mm)
350
400
450
500
550
600
650
00:00 02:00 04:00 06:00 08:00 10:00 12:000
500
1000
1500
2000C
3H
6 formation
Temp (°C
)
C3H
6 rat
e (n
mol
/gs)
time (hh:mm)
350
400
450
500
550
600
650
Figure 3.27: Temperature-programmed reduction of h-Mo1-xVxO3 under H2/C3H8/N2
(55/25/20) at WHSV = 5000 ml/gh. ■ — h-MoO3 (#8650); ■ — h-Mo0.97V0.03O3 (#6702);
■ — h-Mo0.92V0.08O3 (#7911); ■ — h-Mo0.89V0.11O3 (#6601)
From the XRD patterns of the post-TPR samples below in Figure 3.28, it is apparent
that the oxides have been carburised to the fcc α-MoC1-x structure. It is well-known in
the literature that for the carburisation of MoOx by longer-chain hydrocarbons (> C2),

129
that the formation of cubic MoC1-x is favoured.[38, 115-117] Here we see by the evolution
of CO from the structure that the carburisation occurs over the temperature range 500-
600°C (Figure 3.27).
10 20 30 40 50 60 70 80 900
200
400
600
800
1000
311220
200
Inte
nsity
2θ
MoCx - 11196
Mo0.97
V0.03
Cx - 11197
Mo0.92
V0.08
Cx - 11199
Mo0.89
V0.11
Cx - 11211
111
Figure 3.28: Post-mortem XRD patterns of TPR oxides after H2/C3H8/N2 to 600°C
3.5 Discussion
The various approaches to the activation of propane over Mo2C and Mo/V carbides
with respect to the carbide stability are summarised in
Figure 3.29. From the results of preliminary experimentation it was observed that
oxidative dehydrogenation conditions resulted in the oxidation of the carbide to MoO3
and that under a less aggressive oxidant such as H2O/CO2 the carbide was partially
oxidised to MoO2. However, the addition of co-fed H2 to the reaction resulted in a
stable conversion of propane. Additionally, it was found that the dehydrogenation of
propane over Mo2C resulted in very fast deactivation due to carbon deposition. In this
case H2 was added to reduce carbon deposition.

130
Figure 3.29: Summary of propane reactions over Mo2C with respect to phase stability and
surface carbon.
Therefore, two separate approaches were made to study the activation of propane over
molybdenum carbide. The first was a non-oxidative route using a feed of C3H8/N2/H2
and the second was using alternatively H2O or CO2 as an oxidant source, which was
co-fed with H2 to stabilise the catalyst.
In the discussion of catalytic conversion of propane over molybdenum and mixed Mo-
V carbides we can outline a number of basic reactions that could contribute to the
formation of each product. For the case of H2/C3H8:
C3H8 ↔ C3H6 + H2 — dehydrogenation/ hydrogenation
C3H8 (+ H2) → C2H4/6 + CH4 — partial hydrogenolysis/cracking
C2H6 ↔ C2H4 + H2 — ethane dehydrogenation
CnH2n+2 + H2 ↔ nCH4 — total hydrogenolysis
CnH2n+2 ↔ nC + (n+1)H2 — coking
For the case of propane dehydrogenation in steam there are additional reactions to
take into account:
C3H6/8 + 3H2O ↔ 3CO +6/7H2 — steam reforming of propane/ene
C2H4/6 + 2H2O ↔ 2CO + 4/5H2 — steam reforming of ethane/ene
CH4 + H2O ↔ CO + 3H2 — steam reforming of methane

131
CO + H2O ↔ CO2 + H2 — water-gas shift reaction
2CO ↔ CO2 + C — Boudouard reaction
These reactions do not form an exhaustive list, nor are they intended to represent a
mechanistic picture. However, by simplifying the complexities of the system we can
begin to draw a picture of the reactivity over carbide/oxycarbide surfaces.
3.5.1 Reactions of propane/hydrogen over carbide surfaces
In the case of a fixed feed of C3H8/H2 over undoped Mo2C let us consider two
principal variables for the reaction:
• The initial surface oxidation state of the catalyst.
• The temperature of reaction.
In Figure 3.12 we can see the differences between two distinctly different surface
states of Mo2C. The passivated sample (#9450) and the freshly carburised sample
(#8425) show very similar activity with time on stream. This indicates that the surface
of the catalyst becomes equilibrated quickly. The key differences observed between
the oxidised and carbidic surface are in the relative selectivities of CH4 and CO.
During the equilibration process, the excess oxygen is extracted from the surface of
#9450 via a reforming reaction in which the broken down C3 is incorporated and
partially removed as CO and H2O from the surface. During this process, the
selectivity of CH4 increases to the equilibrium level. At a basic level we can represent
the formation of C1 and C2 products by a combination of the total and partial
hydrogenolysis reactions.
xC3 → yC1 + zC2 (y + 2z = 3x) — general hydrogenolysis eqn.
The influence of excess surface oxygen is then seen to favour partial hydrogenolysis
(y = z) with reduction pushing the balance towards total hydrogenolysis (y > z).
Throughout both reactions, the rate of propylene formation initially rises and is
roughly constant over 8 hours. The rate of hydrogenolysis products, however,
decreases exponentially. A possible explanation for this is that the active site for
dehydrogenation is distinct from the hydrogenolysis site.

132
If we then consider the time-dependent rate of C2H4 formation, we see that the
selectivity remains constant from early on (t = 1h) while the conversion decreases
(implying that the rate of formation is also decreasing). This is counter-intuitive if we
are to believe that the C2H4 originates only from the dehydrogenation of C2H6, as we
would expect the selectivity to mirror that of C2H6. Instead, the formation rate appears
to be a function of both the hydrogenolysis and dehydrogenation rates. This can be
understood by considering that the propylene is also consumed by the hydrogenolysis
process to give C2H4. Evidence for this pathway is seen in the steady-state variation of
GHSV over Mo2C shown in Figure 3.16. The variation in GHSV from 5000 → 1250
ml/gh is observed to double the rate of hydrogenolysis but only marginally increase
the rate of C3H6. In the selectivity-conversion plot the C3H6 is consumed by the
hydrogenolysis process with increasing conversion. The selectivity-conversion plot
also shows that the selectivity for C2H6 converges close to 0 at low conversions
implying that it is likely to be a secondary product.
A schematic explanation for these observations is presented in
Figure 3.30. It is stressed again that this schematic is merely a tool to provide
explanation and is not intended as a mechanistic model.
The strong hydrogenolysis sites in this case are defined as those that can activate
propane, whereas the weak sites are defined as those that can only activate propylene.
As seen in Figure 3.30 dehydrogenation is independent of other reactions while
methane can be formed by hydrogenolysis of propane or propylene and by the
methanation of deposited carbon. This creates a disparity between the selectivity to
ethylene and methane which can be seen in Figure 3.14(c). As the reaction progresses
at 500°C, the ‘strong’ hydrogenolysis sites are deactivated by carbon deposition and
the relative contribution of carbon methanation is increased.
By increasing the temperature of reaction, not only is the rate of equilibration
increased, but also the position of equilibrium. From comparison of (Mo1-xVx)2C at
500°C and 550°C in Figure 3.14 we see that the ultimate conversion is lower and that
the rate of formation of C3H6 decreases over time. This implies that the active sites for
dehydrogenation are consumed at this temperature.

133
Figure 3.30: Schematic for propane reactivity over deactivated Mo2C. Type 1 = alkyl-
recombinative site; Type 2 = dehydrogenation site; Type 3 = weak hydrogenolysis site;
Type 4 = strong hydrogenolysis site.
From the temperature-programmed reaction of h-Mo(V)O3 discussed earlier, we see
that the carburisation of the oxide under C3H8/H2 occurs between 500-600°C. At
500°C, the residual oxygen content of the carbide persists throughout the course of
the reaction, also at the surface whereas at 550°C the oxygen is stripped from the
surface, destroying dehydrogenation sites.
The temperature-programmed reaction experiments shown in Figure 3.25 – Figure
3.27 provide further information on the temperature dependence of product selectivity
for this reaction. Apart from the fact that we see carburisation occur between 500-
600°C (as evidenced by the evolution of CO), at lower temperatures (400-500°C) the
evolution of CH4, C2H6 and C4H10 are observed as products of recombinative
hydrocarbon formation as discussed by Tysoe et al.[93, 101, 102] Propylene is formed
even at low temperatures (< 400°C) but does not increase dramatically in rate until ca.
450°C, which coincides with the very beginning of CO evolution. The C3H6

134
formation rate peaks at ca. 520°C, just before the peak of CO evolution. At this time it
can be seen that the C2H4 formation rate, while meagre, mirrors the CO evolution with
the implication that the carbide is a likely hydrogenolysis site. As the reaction
temperature increases, the methane has a second peak which is observed at 550°C for
the V-rich oxides, and at 600°C for h-Mo0.97V0.03O3 & h-MoO3. This peak is
associated with the total hydrogenolysis of propane and it is observed to decay to a
steady-state value, presumably as the active sites are titrated by surface carbon.
The influence of vanadium in the activation of propane over the freshly prepared
carbide series (Mo1-xVx)2C is difficult to quantify. Most notably, an increase in
vanadium increases the initial conversion of propane and formation rate of methane
(Figure 3.13). With time on stream, the selectivity to hydrogenolysis of V-rich
samples is observed to be higher than that of Mo2C. At steady-state conditions there is
a trend observed for the apparent activation energy of propylene formation. With
increasing V content, the apparent Ea is observed to increase from 80 ± 5 kJ/mol to 95
± 5 kJ/mol in a roughly linear fashion (Figure 3.15). This is not reflected in the Ea
determined for methane formation, which would indicate that the most likely pathway
is independent of the surface – hydrogenation of surface carbon.
In the TPR experiment, we observe the inverse situation. Over the course of reaction
the conversion is higher for the V-poor h-Mo1-xVxO3 & h-MoO3 and especially so
with methane formation. As was discussed in Chapter 2, the V-substituted oxides are
more stable to reduction which is reflected by the delayed onset of activity (Figure
3.27). Most interestingly we observe that the area under the CO peak is larger for the
V-containing oxides. This is also contrary to observations for the TPR-carburisation
of Mo(V)Ox in CH4/H2.
It must be noted here that the resultant carbide is different in the case of TPRC under
C3H8/H2 (fcc MoC1-x) vs. CH4/H2 (hcp Mo2C). However, the relevance of these
observations is not insignificant and the relation between these two phases will be
discussed in more depth in the next chapter.

135
3.5.2 Reactions of propane/steam (or CO2)/hydrogen over carbide
surfaces
Much of the discussion relating to the reactivity of propane in the previous section is
applicable to the situation observed for steam.
The conversion of propane and selectivity to propylene is observed to be higher for
the case of steam/CO2 containing feeds. At 500°C, the conversion of propane is
roughly constant (8-10%) with a constant rate of propylene formation. For
temperatures > 500°C the initial conversion of propane is ca. 40% which is
principally due to formation of CO, CH4 and C2H6 (Figure 3.17). It seems that just
above 500°C lies a critical temperature which is hinted at in the previous experiments.
It can be seen quite clearly in the Arrhenius plots for various products (Figure 3.18)
that between 510-530°C, there is a disjoint in the nature of the catalytic surface. This
is particularly evident in the Arrhenius plot for CO formation, which gives an
apparent activation energy; Ea<510°C = 272 kJ/mol & Ea>510°C = 66 kJ/mol.
If we look at the initial conversion plot for the reaction at 550°C (Figure 3.17b) at t =
0, we note the predominant selectivities are to CO, CH4 and C2H6. With reference to
the observed alkyl-group recombination that was observed in the TPR of the oxides
we can tentatively propose that the initially passivated Mo2C surface catalyses the
reaction:
nC3H8 → xCH4 + yC2H6 + zC4H10 (3n = x + 2y + 4z)
— recombinative hydrocarbon formation
and that in the meanwhile;
C3H8 + 3H2O → 3CO + 7H2 — steam reforming of C3H8
is combined with the carburisation of MoOxCy to give:
MoOx + C3H8 → MoCx + CO + H2O — carburisation of MoOx
The CO peak is subsequently followed by a peak in the selectivity to CO2 which
possibly arises via the formation of an oxycarbide surface which is active for
WGS:[110]

136
CO + H2O ↔ CO2 + H2 — water-gas shift reaction
This last assumption is based on the fact that the rate of CO2 never exceeds CO
formation and that the decline in selectivity mirrors that observed for CO.
Finally, the rate of propylene formation is observed to peak soon after the WGS peak,
which is reported to be most active over oxycarbide surfaces.[109] Overall with
temperatures > 500°C the reaction strongly deactivates over time, most likely due to
carbon deposition (discussed in Chapter 4). This is also notable in the post-catalytic
CHN analyses, where the reaction carried out at 500°C has 6.3 wt.% carbon (5.92
wt.% is stoichiometric) after reaction whereas the reactions carried out at 550 &
600°C have 7.3 and 7.9 wt.% carbon, respectively.
Vanadium is observed to increase the selectivity of propylene but the conversion
does not change. This is contrary to the observations for the H2/C3H8 feed, however,
the mechanistic differences are significant and it is difficult to ascribe specific
reasoning except that in O-rich conditions VxOy is a better DH catalyst.
3.6 Summary
In this chapter we have observed that the activation of propane over molybdenum
carbide is strongly dependent upon the oxidation state of the surface of the catalyst. In
the direct dehydrogenation of propane we observe that freshly reduced material is
highly active but only moderately selective to propylene. With time on stream,
however, the hydrogenolysis products are observed to decrease while the rate of
dehydrogenation stays roughly constant. The addition of vanadium is observed to
increase the overall activity of the catalyst but it does not increase the selectivity to
propylene.
The activation of propane in soft-oxidising conditions (H2O/CO2) increases
productivity of the catalyst to propylene in all cases. In this case vanadium is seen to
be beneficial to the reactivity initially but the overall stability of the catalyst to
oxidation is reduced. In the case of H2O containing feeds, steam-reforming of propane
over the catalyst is observed. Additionally, a critical temperature for surface reduction
(~520°C) is noted for the catalyst, above which the chemical potential of the reactor
results in strong deactivation of the catalyst, most likely due to carbon formation. The

137
addition of CO2 has a similar effect on the productivity to propylene but in this case
there is also a strong contribution of reverse water-gas-shift.
In a separate study into the reverse water-gas shift reaction, Mo2C is found to be an
efficient catalyst for the hydrogenation of CO2 with high selectivity to CO (> 90%).
The reaction went to equilibrium conversion even at very high space velocities over a
range of temperatures (GHSV > 200000, 500°C < T < 700°C).
For the temperature-programmed reaction of h-Mo1-xVxO3 precursor oxide materials
in propane the catalytic activity was observed to increase dramatically as the oxide is
reduced and the selectivities evolved with temperature mirroring the reduction state of
the oxide. In all cases the phase resulting after reaction was observed to be the
metastable fcc MoC1-x.

138
3.7 References
[1] C. F. Cullis, Industrial and Engineering Chemistry 1967, 59, 18. [2] F. Cavani, F. Trifiro, Catalysis Today 1999, 51, 561. [3] F. Cavani, F. Trifiro, Catalysis Today 1995, 24, 307. [4] W. Ueda, Y.-S. Yoon, K.-H. Lee, Y. Moro-oka, Korean Journal of Chemical
Engineering 1997, 14, 474. [5] W. Ueda, N. F. Chen, K. Oshihara, Kinetics and Catalysis 1999, 40, 401. [6] T. G. Alkhazov, K. Y. Adzhamov, F. M. Poladov, Reaction Kinetics and
Catalysis Letters 1977, 7, 65. [7] T. V. Andrushkevich, L. M. Plyasova, G. G. Kuznetsova, V. M. Bondareva, T.
P. Gorshkova, I. P. Olenkova, N. I. Lebedeva, Reaction Kinetics and Catalysis Letters 1979, 12, 463.
[8] J. S. Lee, M. Boudart, Catalysis Letters 1993, 20, 97. [9] R. Schlögl, A. Knop-Gericke, M. Hävecker, U. Wild, D. Frickel, T. Ressler,
R. E. Jentoft, J. Wienold, G. Mestl, A. Blume, O. Timpe, Y. Uchida, Topics in Catalysis 2001, 15, 219.
[10] N. Ballarini, A. Battisti, F. Cavani, A. Cericola, C. Lucarelli, S. Racioppi, P. Arpentinier, Catalysis Today 2006, 116, 313.
[11] R. Horn, N. Degenstein, K. Williams, L. Schmidt, Catalysis Letters 2006, 110, 169.
[12] M. Y. Sinev, G. A. Vorobeva, V. N. Korchak, Kinetics and Catalysis 1986, 27, 1007.
[13] M. Y. Sinev, Z. T. Fattakhova, Y. P. Tulenin, P. S. Stennikov, V. P. Vislovskii, Catalysis Today 2003, 81, 107.
[14] B. Savova, D. Filkova, D. Crisan, M. Crisan, M. Raileanu, N. Dragan, L. Petrov, J. C. Védrine, Applied Catalysis A: General 2009, 359, 55.
[15] M. Baerns, Technische chemie, Wiley-VCH, Weinheim, 2006. [16] A. K. M. Hatano, European Patent 1988, 318. [17] K. O. T. Ushikubo, A. Kayo, T. Umezawa, K. Kiyona, I. Sawaki, European
Patent 1992, 529. [18] R. K. Grasselli, D. J. Buttrey, J. D. Burrington, A. Andersson, J. Holmberg,
W. Ueda, J. Kubo, C. G. Lugmair, A. F. Volpe, Topics in Catalysis 2006, 38, 7.
[19] A. C. Sanfiz, T. W. Hansen, D. Teschner, P. Schnorch, F. Girgsdies, A. Trunschke, R. Schlogl, M. H. Looi, S. B. A. Hamid, Journal of Physical Chemistry C 2010, 114, 1912.
[20] A. T. L. Csepei, R. Schloegl data to be published 2011. [21] P. Beato, A. Blume, F. Girgsdies, R. E. Jentoft, R. Schlogel, O. Timpe, A.
Trunschke, G. Weinberg, Q. Basher, F. A. Hamid, S. B. A. Hamid, E. Omar, L. M. Salim, Applied Catalysis a-General 2006, 307, 137.
[22] A. T. L. Csepei, R. Schloegl private discussions 2011. [23] P. Mars, D. W. van Krevelen, Chemical Engineering Science 1954, 3, 41. [24] J. S. Lee, L. Volpe, F. H. Ribeiro, M. Boudart, Journal of Catalysis 1988, 112,
44. [25] C. Bouchy, S. B. D. A. Hamid, E. G. Derouane, Chemical Communications
2000, 125. [26] K. Page, J. Li, R. Savinelli, H. N. Szumila, J. P. Zhang, J. K. Stalick, T.
Proffen, S. L. Scott, R. Seshadri, Solid State Sciences 2008, 10, 1499.

139
[27] I. P. Olenkova, L. M. Plyasova, S. D. Kirik, Reaction Kinetics and Catalysis Letters 1981, 16, 81.
[28] S. Crouch-Baker, P. G. Dickens, Solid State Ionics 1989, 32-33, 219. [29] J. Song, X. Ni, L. Gao, H. Zheng, Materials Chemistry and Physics 2007, 102,
245. [30] L. Dupont, D. Larcher, M. Touboul, Journal of Solid State Chemistry 1999,
143, 41. [31] T. G. Kuznetsova, G. K. Boreskov, T. V. Andrushkevich, Y. A. Grigorkina, N.
G. Maksimov, I. P. Olenkova, L. M. Plyasova, T. P. Gorshkova, Reaction Kinetics and Catalysis Letters 1982, 19, 405.
[32] B. Darriet, J. Galy, Journal of Solid State Chemistry 1973, 8, 189. [33] M. Baca, A. Pigamo, J. L. Dubois, J. M. M. Millet, Topics in Catalysis 2003,
23, 39. [34] A. P. E. York, J. B. Claridge, A. J. Brungs, S. C. Tsang, M. L. H. Green,
Chemical Communications 1997, 39. [35] J. B. Claridge, A. P. E. York, A. J. Brungs, C. Marquez-Alvarez, J. Sloan, S.
C. Tsang, M. L. H. Green, Journal of Catalysis 1998, 180, 85. [36] A. P. E. York, T.-c. Xiao, M. L. H. Green, J. B. Claridge, Catalysis Reviews
2007, 49, 511 [37] D. C. LaMont, A. J. Gilligan, A. R. S. Darujati, A. S. Chellappa, W. J.
Thomson, Applied Catalysis a-General 2003, 255, 239. [38] T. C. Xiao, A. P. E. York, V. C. Williams, H. Al-Megren, A. Hanif, X. Y.
Zhou, M. L. H. Green, Chemistry of Materials 2000, 12, 3896. [39] D. C. LaMont, W. J. Thomson, Chemical Engineering Science 2005, 60, 3553. [40] A. R. S. Darujati, D. C. LaMont, W. J. Thomson, Applied Catalysis a-General
2003, 253, 397. [41] D. C. LaMont, W. J. Thomson, Applied Catalysis A: General 2004, 274, 173. [42] F. Solymosi, J. Cserényi, A. Szöke, T. Bánsági, A. Oszkó, Journal of Catalysis
1997, 165, 150. [43] K. Oshikawa, M. Nagai, S. Omi, J. Phys. Chem. B 2001, 105, 9124. [44] S. Liu, L. Wang, R. Ohnishi, M. Ichikawa, Journal of Catalysis 1999, 181,
175. [45] T. J. Zhou, A. M. Liu, Y. R. Mo, H. B. Zhang, Journal of Physical Chemistry
A 2000, 104, 4505. [46] S. Yuan, S. B. Derouane-Abd Hamid, Y. Li, P. Ying, Q. Xin, E. G. Derouane,
C. Li, Journal of Molecular Catalysis A: Chemical 2002, 180, 245. [47] S. Liu, R. Ohnishi, M. Ichikawa, Journal of Catalysis 2003, 220, 57. [48] D. Mckay, J. S. J. Hargreaves, R. F. Howe, Catalysis Letters 2006, 112, 109. [49] M. Toosi, M. Peyrovi, R. Mondgarian, Reaction Kinetics and Catalysis Letters
2009, 98, 133. [50] D. Wang, J. H. Lunsford, M. P. Rosynek, Journal of Catalysis 1997, 169, 347. [51] R. K. Grasselli, Catalysis Today 1999, 49, 141. [52] E. Solymosi, R. Nemeth, L. Ovari, L. Egri, Journal of Catalysis 2000, 195,
316. [53] S. Xing, D. Zhou, L. Cao, X. Li, Chinese Journal of Catalysis 2010, 31, 415. [54] F. Solymosi, R. Nemeth, Catalysis Letters 1999, 62, 197. [55] F. Solymosi, R. Németh, A. Oszkó, J. J. S. E. Iglesia, T. H. Fleisch, in Studies
in Surface Science and Catalysis, Vol. Volume 136, Elsevier, 2001, pp. 339. [56] M. J. Ledoux, F. Meunier, B. Heinrich, C. Pham-Huu, M. E. Harlin, A. O. I.
Krause, Applied Catalysis a-General 1999, 181, 157.

140
[57] M. K. Neylon, S. Choi, H. Kwon, K. E. Curry, L. T. Thompson, Applied Catalysis a-General 1999, 183, 253.
[58] M. E. Harlin, A. O. I. Krause, B. Heinrich, C. Pharm-Huu, M. J. Ledoux, Applied Catalysis a-General 1999, 185, 311.
[59] H. Kwon, L. T. Thompson, J. Eng, J. G. Chen, Journal of Catalysis 2000, 190, 60.
[60] M. Volpe, G. Tonetto, H. de Lasa, Applied Catalysis a-General 2004, 272, 69. [61] C. Bouchy, C. Pham-Huu, B. Heinrich, E. G. Derouane, S. B. Derouane-Abd
Hamid, M. J. Ledoux, Applied Catalysis a-General 2001, 215, 175. [62] R. B. Levy, M. Boudart, Science 1973, 181, 547. [63] Y. Holl, R. Touroude, G. Maire, A. Muller, P. A. Engelhard, J. Grosmangin,
Journal of Catalysis 1987, 104, 202. [64] Y. Holl, F. Garin, G. Maire, A. Muller, P. A. Engelhard, J. Grosmangin,
Journal of Catalysis 1987, 104, 211. [65] M. Yamada, J. Yasumaru, M. Houalla, D. M. Hercules, Journal of Physical
Chemistry 1991, 95, 7037. [66] M. J. Ledoux, P. H. Cuong, J. Guille, H. Dunlop, Journal of Catalysis 1992,
134, 383. [67] S. T. Oyama, Catalysis Today 1992, 15, 179. [68] M. J. Ledoux, C. Phamhuu, H. Dunlop, J. Guille, L. Portela, E. Iglesia, J. W.
Geus, G. Maire, J. C. Volta, Z. Paal, G. Leclercq, Studies in Surface Science and Catalysis 1993, 75, 955.
[69] E. A. Blekkan, P. H. Cuong, M. J. Ledoux, J. Guille, Industrial & Engineering Chemistry Research 1994, 33, 1657.
[70] P. Delporte, C. PhamHuu, M. J. Ledoux, Applied Catalysis a-General 1997, 149, 151.
[71] P. DelGallo, F. Meunier, C. PhamHuu, C. Crouzet, M. J. Ledoux, Industrial & Engineering Chemistry Research 1997, 36, 4166.
[72] A. Katrib, V. Logie, M. Peter, P. Wehrer, L. Hilaire, G. Maire, Journal De Chimie Physique Et De Physico-Chimie Biologique 1997, 94, 1923.
[73] A. Katrib, V. Logie, N. Saurel, P. Wehrer, L. Hilaire, G. Maire, Surface Science 1997, 377, 754.
[74] C. Bouchy, C. Pham-Huu, B. Heinrich, C. Chaumont, M. J. Ledoux, Journal of Catalysis 2000, 190, 92.
[75] T. Matsuda, Y. Hirata, S. Suga, H. Sakagami, N. Takahashi, Applied Catalysis a-General 2000, 193, 185.
[76] P. Wehrer, L. Hilaire, G. Maire, Applied Catalysis a-General 2001, 208, 259. [77] T. C. Xiao, H. T. Wang, J. W. Da, K. S. Coleman, M. L. H. Green, Journal of
Catalysis 2002, 211, 183. [78] E. Torres-GarcÃ-a, G. RodrÃ-guez-Gattorno, J. A. Ascencio, L. O. Alemán-
Vázquez, J. L. Cano-DomÃ-nguez, A. MartÃ-nez-Hernández, P. Santiago-Jacinto, The Journal of Physical Chemistry B 2005, 109, 17518.
[79] G. Rodriguez-Gattorno, A. Martinez-Hernandez, L. O. Aleman-Vazquez, E. Torres-Garcia, Applied Catalysis a-General 2007, 321, 117.
[80] Y. Holl, F. Garin, G. Maire, Journal of Catalysis 1988, 113, 569. [81] F. H. Ribeiro, M. Boudart, R. A. Dallabetta, E. Iglesia, Journal of Catalysis
1991, 130, 498. [82] E. Iglesia, F. H. Ribeiro, M. Boudart, J. E. Baumgartner, Catalysis Today
1992, 15, 455.

141
[83] E. Iglesia, F. H. Ribeiro, M. Boudart, J. E. Baumgartner, Catalysis Today 1992, 15, 307.
[84] C. Phamhuu, M. J. Ledoux, J. Guille, Journal of Catalysis 1993, 143, 249. [85] P. Wehrer, C. Bigey, L. Hilaire, Applied Catalysis a-General 2003, 243, 109. [86] H. Sakagami, Y. Asano, T. Ohno, N. Takahashi, H. Itoh, T. Matsuda, Applied
Catalysis A: General 2006, 297, 189. [87] T. Ohno, Z. Li, N. Sakai, H. Sakagami, N. Takahashi, T. Matsuda, Applied
Catalysis A: General 2010 In Press, Accepted Manuscript. [88] M. Siaj, N. Dubuc, P. H. McBreen, The Journal of Physical Chemistry C
2009. [89] M. Siaj, I. Temprano, N. Dubuc, P. H. McBreen, Journal of Organometallic
Chemistry 2006, 691, 5497. [90] M. Siaj, C. Maltais, E. M. Zahidi, H. Oudghiri-Hassani, J. Q. Wang, F. Rosei,
P. H. McBreen, Journal of Physical Chemistry B 2005, 109, 15376. [91] H. Oudghiri-Hassani, E. Zahidi, M. Siaj, J. Wang, P. H. McBreen, Applied
Surface Science 2003, 212, 4. [92] J. Wang, M. Castonguay, J. Deng, P. H. McBreen, Surface Science 1997, 374,
197. [93] G. F. Wu, W. T. Tysoe, Abstracts of Papers of the American Chemical Society
1999, 217, U608. [94] B. Bartlett, M. M. Hossain, W. T. Tysoe, Journal of Catalysis 1998, 176, 439. [95] G. F. Wu, B. Bartlett, W. T. Tysoe, Journal of Molecular Catalysis a-Chemical
1998, 131, 91. [96] G. F. Wu, W. T. Tysoe, Surface Science 1998, 397, 197. [97] G. F. Wu, B. Bartlett, W. T. Tysoe, Langmuir 1998, 14, 1435. [98] G. Wu, B. Bartlett, W. T. Tysoe, Journal of Catalysis 1998, 173, 172. [99] B. F. Bartlett, W. T. Tysoe, Catalysis Letters 1997, 46, 101. [100] W. T. Tysoe, Langmuir 1996, 12, 78. [101] B. Bartlett, V. Shneerson, W. T. Tysoe, Catalysis Letters 1995, 32, 1. [102] B. Bartlett, C. Soto, R. Wu, W. T. Tysoe, Catalysis Letters 1993, 21, 1. [103] L. P. Wang, C. Soto, W. T. Tysoe, Journal of Catalysis 1993, 143, 92. [104] Y. Chauvin, Angewandte Chemie-International Edition 2006, 45, 3740. [105] J. L. Herisson, Y. Chauvin, Makromolekulare Chemie 1971, 141, 161. [106] M. Siaj, C. Reed, S. T. Oyama, S. L. Scott, P. H. McBreen, Journal of the
American Chemical Society 2004, 126, 9514. [107] M. Nagai, A. M. Zahidul, Y. Kunisaki, Y. Aoki, Applied Catalysis A: General
2010, 383, 58. [108] J. A. Schaidle, A. C. Lausche, L. T. Thompson, Journal of Catalysis 2010,
272, 235. [109] P. Liu, J. A. Rodriguez, The Journal of Physical Chemistry B 2006, 110,
19418. [110] J. Patt, D. J. Moon, C. Phillips, L. Thompson, Catalysis Letters 2000, 65, 193. [111] H. Tominaga, M. Nagai, Applied Catalysis A: General 2005, 282, 5. [112] T. Suzuki, H. I. Iwanami, T. Yoshizawa, H. Yamazaki, Y. Yoshida,
International Journal of Hydrogen Energy 1995, 20, 823. [113] T. Osaki, N. Narita, T. Horiuchi, T. Sugiyama, H. Masuda, K. Suzuki, Journal
of Molecular Catalysis A: Chemical 1997, 125, 63. [114] G. Ertl, H. Knözinger, F. Schüth, J. Weitkamp, Handbook of heterogeneous
catalysis, Second, completely rev. and enl. ed., VCH, Weinheim, 2008.

142
[115] N. Ji, T. Zhang, M. Zheng, A. Wang, H. Wang, X. Wang, Y. Shu, A. L. Stottlemyer, J. G. Chen, Catalysis Today 2009, 147, 77.
[116] A. Hanif, T. C. Xiao, A. P. E. York, J. Sloan, M. L. H. Green, Chemistry of Materials 2002, 14, 1009.
[117] T. Xiao, A. P. E. York, K. S. Coleman, J. B. Claridge, J. Sloan, J. Charnock, M. L. H. Green, Journal of Materials Chemistry 2001, 11, 3094.

143

144
145
Chapter 4: Reactivity of propane over Mo/V carbide II:
Surface reactivity studies and post-catalytic characterisation
4.1 Abstract
In this section we address the chemical nature of the catalyst surface in relation to the
observed catalytic activity. Using in situ Raman spectroscopy and ex- and in situ X-
ray photoelectron spectroscopy (XPS), it was possible to gain insight into the nature
of the active material and observe the progression of the surface chemistry under
reaction conditions. Finally, in conjunction with transmission electron microscopy
(TEM) techniques, we were able to characterise the samples after reaction to give a
‘post-mortem’ analysis of the catalysts.
Using Raman microscopy, adventitious carbon was observed to form on the surface of
the catalyst, selectively blocking sites that were active for the
hydrogenolysis/cracking of propane to lighter molecules. The nature of the carbon
species was dependent on the reaction conditions and was found to evoke a higher sp2
character (less amorphous) with a co-oxidant feed (H2O, CO2).
The oxy-carbidic nature of the surface layer is apparent from ex situ XPS of the
freshly prepared carbides. It is also observed for the V-containing materials that the
surface layer is enriched with vanadium in the form of V=O. Results of in situ XPS
experimentation reveal a strong dependency of the catalytic activity with the surface
oxidation state of the carbide. Dehydrogenation of propane was observed to increase
with the oxidation state, whereas formation of C2 and C4 products is favoured by an
increased electron density at the Fermi edge. No formation of adventitious carbon was
observed.
The comparison of pre- and post-mortem carbide catalysts shows a considerable
surface rearrangement as well as carbon deposition. Selected area electron diffraction
(SAED) of the freshly prepared carbides is indicative of hcp β-Mo2C with
agglomerated crystallite morphology. After reaction the catalysts are observed to be
quite heterogeneous with regards to carbon deposition and structural rearrangement.
The SAED reveals a mixture of hcp β-Mo2C as well as the presence of fcc α-MoC1-x
however, the powder XRD shows only β-Mo2C.

146
Post-mortem analysis of the oxide precursors after TPR in H2/C3H8 shows primarily
fcc α-MoC1-x with extensive carbon deposition as both graphitic overlayers and
carbon-rich carbidic phases.
4.2 Introduction
The comprehensive surface characterisation of molybdenum carbides is a complex
area of research and one that hinders efforts to develop mechanistic insights into their
reactivity. Due to their dark nature, many light-based spectroscopic techniques are
ineffective for the characterisation of surface species or adsorbates. The difficulties of
exact characterisation are compounded by the reactive nature of molybdenum carbide
and the tendency to incorporate oxygen into the structure of the carbide. Freshly
reduced Mo2C is pyrophoric and burns on contact with bulk oxygen. It is therefore
necessary to passivate the surface layers under a low partial pressure of oxygen in
order to handle the material in atmosphere. This surface modification by oxygen leads
to significant changes in the reactivity and hence it is common in catalytic studies for
the carbide to be formed in situ prior to the catalytic reaction in question.
As well as surface contamination by oxygen, the process of carburisation leads to the
deposition of adventitious carbon on the surface of Mo2C. As is discussed in Chapter
1, this is a function of the chemical potentials of carbon and hydrogen in the gas phase
during the synthesis, and may be reduced by considering the thermodynamics
situation. However, the necessary crossover of the maximum temperature of the
thermodynamic coking limit and the minimum temperature required to remove
oxygen from the system, means that there is generally some aliphatic carbon formed
during the synthesis. In the literature, a pretreatment under H2 is regularly applied to
remove surface carbon. Specific methanation of the surface carbon may be achieved
under ideal (i.e. single crystal) conditions but in most cases it is applied as a rule of
thumb and has been shown to result in an overly metallic character of the final surface
depending upon conditions.[1] Just as the production of high-quality materials presents
a challenge to the synthetic chemist, determining the nature of the surface with respect
to observed catalytic activity is challenging and is aided by the use of an array of
techniques including; TPD/R/O, TEM, physisorption and chemisorptions
experiments, Raman microscopy, X-ray absorption spectroscopy (XAS) and XPS.

147
4.2.1 Motivation and experimental goals
The goal of this study is to shed light on the nature of the carbide surface in the
activation of propane under varying conditions. It also examines the mechanistic
influence of vanadium as a dopant atom in the Mo2C lattice under conditions of high
reducing potential in hydrocarbon reactions.
As has been discussed in the previous chapter, the operation of metal oxide catalysts
for selective oxidation reactions in industrial conditions is rigorous and demanding on
materials and engineering. At equilibrium conversions over large scale reactors, the
chemical potential varies greatly over the range of the catalytic bed and can therefore
influence the degree of reduction/ carburisation which in turn can influence the
product distribution.
For these reasons, it is interesting to examine the reactivity of oxide surfaces with
respect to their oxidation state, structure and carbon coverage. As the surface
composition of a catalyst is a function of the chemical potential in the gas phase, it is
necessary to employ the use of in situ techniques such as XPS and Raman, and also
by the post-mortem characterisation of catalyst samples.
Specifically the goals of this study are to:
• compare and contrast the formation of surface carbon species using Raman
spectroscopy
• to conduct transmission electron microscopy studies comparing pre- and
post-mortem samples of Mo2C and (Mo1-xVx)2C following treatment under
propane by way of local chemical and structural analysis
• to correlate the specific catalytic activity with the surface chemical
composition and oxidation state by use of in situ XPS technique.
4.2.2 Previous studies and literature review
An exhaustive review on the surface characterisation of molybdenum catalysts is not
practical within the scope of this work. However, it is important to outline some key
studies that relate to the techniques applied in this thesis. Also presented are studies
that contribute to the mechanistic understanding of reactivity on molybdenum
carbide/oxycarbide surfaces.

148
4.2.2.1 Mo2C single crystal studies
There are relatively few papers in the literature that deal with surface studies of Mo2C
single crystals. Considerable contributions to the field have been made by Otani et al.
with a series of papers studying the surface structure and oxygen adsorption on α-
(0001)-Mo2C.[2-5] The principal techniques used in these studies were LEED (low-
energy electron diffraction), XPS and TPD.
In a paper with Oyama, Otani et al. discuss the surface composition and structure of
Mo2C. It is observed with the use of LEED and angle-resolved photoelectron
spectroscopy (ARPES), that at lower temperatures (< 823°C) the surface is
characterised by Mo termination. At higher temperatures (> 1023°C) the surface is
found to be predominantly C-terminated.[2] This distinction of metallic/carbidic
character is important when considering the adsorption of hydrocarbons on the
surface.
In a review of transition metal surface chemistry, Chen et al. discuss the interaction of
ethylene on metal and carbide terminated surfaces using TPD and HREEL
spectroscopies.[6] On clean Mo(110), ethylene is found to decompose to C and H, with
the latter desorbed as H2 at ca. 120°C. Similar behaviour was observed for the carbon
modified surface, however, with the presence of 0.25 ML of surface oxygen, the
reactivity is almost entirely suppressed. The high resolution electron energy loss
spectra (HREELS) indicate that the reaction pathway for the metal and carbide is
different. The adsorption of C2H4 on the pure metal surface is observed to decompose
the C-H bonds at very low temperatures (< 80K) leading to the formation of an
acetylene-like adsorbate, which decomposes at 75°C. The carbide surface is observed
to adsorb the ethylene in a di-sigma-bound mode before forming a MoCx-CCH3
ethylidyne-like species, comparable to an organometallic moiety. In a subsequent
study by Grossman et al.[7] this change in behaviour is suggested to arise from C(sp)-
Mo(4d) hybridisation observed for molybdenum carbides, which modifies the density
of states (DOS).
These differences are outlined in a paper by Kelly et al. which considers the reactivity
of butane over C-modified Mo(100) surfaces.[8] The TD spectra are compared for a
series of surfaces and it observed that at a surface carbon coverage of ca. θc = 0.6, the
H2 peak associated with decomposition is decreased and the desorption of butene is

149
observed to increase. The above studies indicate that the reactivity of the carbide is
specifically altered cf. Mo0 surface, however it is still active for the dissociation of
hydrocarbon molecules. It is also noted that the reactivity may be strongly moderated
by the introduction of surface oxygen.
The effect of surface oxygen on the reactivity is again addressed by Otani et al.[4] who
find that the Mo2C(0001) surface is active to O2 adsorption with a very high sticking
probability, and that the adsorbed O atoms interact with both Mo and C atoms to form
an ‘oxycarbide’ at temperatures < 523°C. Above 523°C, the oxygen is observed to
bind only to Mo atoms. Interestingly, the metallic character of the carbide is observed
to persist with oxygen exposure (10 ML) at temperatures < 823°C. The observed
density of states at the Fermi edge is enhanced by exposure to oxygen by the
formation of an oxygen-induced state at EF, the origin of which is later hypothesised
to be due to increased Coulomb interaction between the Mo 4p and 4d electrons.[5]
This behaviour is attributed to the fact that, in contrast to group IV/V transition metal
carbides, the highest occupied state is mostly composed of Mo4d orbitals rather than
the C2p orbitals. Hence, the attacking oxygen preferentially bonds with Mo in the
second layer rather than attacking C and desorbing as CO.
4.2.2.2 Mo2C polycrystalline studies in ‘metathesis’ reactions
The complex interactions of Mo2C with hydrocarbon molecules are explored by
McBreen et al. in a series of studies using reflectance-absorbance infrared
spectroscopy measurements, combined with XPS to probe the interactions of
aldehydes and alkenes with Mo2C.[9, 10] Using a polycrystalline foil, the dissociation
of a cyclic aldehyde is observed to result in the formation of Mo=O oxo species as
well as surface alkylidene species. Subsequent treatment of the surface in propene
results in the evolution of metathesis products of the cyclic alkylidene, as well as
regenerating the alkylidene active sites in the form of methylidene and propylidene
species (see Figure 4.1). The persistence of metathesis with temperature is observed to
extend from ca. 100°C– 275°C which is at the upper end of the range reported for
metathesis activity over Mo-based catalysts. The results presented are commensurate
with the operation of a Chauvin-type mechanism of metathesis.[11, 12]

150
Figure 4.1: The Chauvin mechanism for metathesis shown for propylene attack over a
cyclopentylidene functionalised carbene site — reprinted from [9] with the permission of
Elsevier.
Tysoe et al. observed the metathesis-like behaviour (recombinative hydrocarbon
formation) of ethylene and propylene over various Mo surfaces at considerably higher
temperatures (323–623°C) than normally applied.[13] In the reaction of ethane over
Mo foil, a distribution of products from C1–C6 is observed, which fits a Schulz-Flory
distribution. The apparent activation energy for this reaction is observed to be ca. 230
kJ/mol, much higher than the reported 30-40 kJ/mol for low temperature metathesis.
The mechanism proposed involves the decomposition of incident alkenes to carbene
species followed by the recombination of these species to give a range of products in
a similar manner to that proposed for Fischer-Tropsch product formation. In the case
of propylene, it is shown that the principle products are; C1, C2 C3 and C4 products.
The product distribution could be modeled by a modified Shultz-Flory equation and is
commensurate with the recombination of surface methyl carbene species with
hydrogen (carbene destruction), another methylidene, ethylidene or propylidene
species respectively.
The addition of oxygen to the surface of Mo is observed to have a significant impact
on the reactivity. In a further study, MoO2 is shown to catalyse both low temperature
metathesis and recombinative formation of alkenes quite effectively.[14] For
temperatures > 375°C, the mechanism is observed to change from a Chauvin
metallacyclobutane mechanism to a carbene-polymerisation mechanism, which gives
decreasing selectivity to metathesis products with increasing temperature (Figure 4.2).

151
Figure 4.2: Plot illustrating propylene metathesis over MoO2; two different mechanisms of
ethylene/butylene formation depending on temperature — reprinted from [14] with the
permission of The American Chemical Society.
4.2.2.3 Bulk spectroscopic Mo2C studies in alkane transformation
reactions
Solymosi et al. report the adsorption of propane and propylene on Mo2C/SiO2
observed by FTIR spectroscopy.[15] At low temperatures (< RT) propane is observed
to bind weakly and reversibly. After treatment at temperatures between 100–300°C
the formation σ & π-bonded propylene is observed, and at the highest temperature
there is evidence for formation of propylidene moieties. These species are also
observed to persist in this temperature range with the co-adsorption of CO2.[16]
Furthermore, it is observed by FTIR and TDS that CO2 adsorbs irreversibly,
dissociating to CO and O on the surface at T > 500°C, which subsequently desorbs at
ca. 550°C. Bulk oxidation of the surface is observed to take place slowly at T >
600°C.
In several studies by Rodriguez-Gattorno et al. the isomerisation of n-heptane over
carbon modified MoOx surfaces is discussed with reference the development of a
surface carbon layer as observed by Raman spectroscopy and TPO.[17, 18] In this study,
pre-reduced MoO3 is treated at 370°C under n-heptane with increasing conversion
observed concomitantly with the evolution of the D and G bands of carbon in the

152
Raman spectra. It is claimed that the evolution of an active Mo-O phase is stabilised
by the deposition of more ordered carbon species, which present a higher temperature
TPO peak.
4.2.2.4 Transmission electron microscopy studies on Mo2C and
oxycarbide materials
A long-standing discussion related to the interpretation of TEM and XRD data for the
characterisation of the ‘oxycarbide’ phase exists in the literature. First reported by
Ledoux et al,[19] it is posited to be the active phase in alkane isomerisation. The
formation of this phase occurs via an initial low temperature (350–400°C) reduction
of MoO3 under H2 to partially reduce the structure, which introduces shear planes into
the orthorhombic lattice by selectively forming interlayer vacancies (Figure 4.3). This
is followed by treatment in flowing hydrocarbon to introduce carbon and stabilise an
intermediate MoOxCy phase with fcc symmetry and lattice parameters of 4.1 ± 0.1
Å.[19-24] This hypothesised structure was later supported by theoretical calculations for
a structure of the oxycarbide fitting observed SAED patterns.[24] The cell parameters
of the oxycarbide compare closely to those observed for the fcc carbide α-MoC1-x
(4.24 Å), however it is claimed that the decreased cell parameter is due to the high
ratio of oxygen to carbon, which leads to an inversion in the intensities of the
principal reflections ((111) & (200)). Moreover, the phase was considered to have
superior catalytic properties due to improved geometric constraints and
chemopotential that promoted the operation of a metallacyclobutane-type one step
mechanism.
In the previously discussed paper by Rodriguez-Gattorno et al., the oxycarbide
argument is refuted in favour of a cubic Mo-O active phase.[17] In micrographs
obtained from a spent isomerisation catalyst, it is observed that multiple MoOx phases
are present and that fcc phase is present and found embedded as small aggregates
within the oxide matrix. Based on these TEM observations as well as theoretical
calculations, it is postulated that the cubic Mo-O phase is metallic in nature with cell
parameter 4.07 Å. In the proposed mechanism, it acts as a centre for the
dehydrogenation-hydrogenation, while the isomerisation is carried out via a
conventional bifunctional mechanism with the carbocation stabilised by acid MoOx
sites. A similar argument is presented by Matsuda et al.[25-27] which is based on the

153
titration of acid sites on MoOx. The measurements were determined by ammonia-TPD
and 1-propanol dehydration.
Figure 4.3: Proposed mechanism of formation of a shear plane in αααα-MoO3 via: (a)
reorganization of the oxygen vacancies in the (010) plane; (b) reorganization of layers in the
(100) plane — adapted from [19] with the permission of Elsevier.
In two studies by Schlögl et al. the phenomenon of beam-induced transformation is
addressed with respect to the MoOx system.[28, 29] MoO3 is observed to reductively
decompose to an fcc MoO structure by a radiolysis enhanced diffusion of oxygen
along the layer planes of MoO3 (Figure 4.4), facilitating the formation of shear
structure in an epitaxial process. Energy loss near edge structure (ELNES)
spectroscopy supports a one-to-one Mo:O stoichiometry which pre-supposes the Mo-
O rock salt-like structure put forward by Rodriguez-Gattorno et al. It is also
hypothesised that the lack of bulk-structure evidence points to its presence as nano-
domains embedded in a larger oxide matrix.
(a)
(b)

154
In an interesting study by Green et al., the deactivation of Mo2C and WC in methane
reforming reactions is discussed with specific reference to TEM data attained from
post-mortem samples.[30] It was observed in the partial oxidation/steam and dry
reforming of methane that the deactivation rate reflected the strength of oxidant: O2 >
H2O ≈ CO2. The initially nanoporous carbides are highly disordered with multiple
stacking faults. After reaction, they exhibit an increased structural order with regular
crystallites and terraces on which oxygen decorates the step edges. It is claimed that
this structural rearrangement is the cause of deactivation via the formation of a
kinetically more hindered system..
Figure 4.4: 'MoO' cubic phase formed by radiolytic mechanism under electron beam.
Reprinted from [29] with the permission of John Wiley and Sons.
4.2.2.5 XPS studies on Mo2C and reduced Mo systems
There is a great deal of literature relating to photoelectron studies of Mo-based
systems. This review aims to narrow the scope to catalytic studies of particular
relevance and to studies which present findings pertinent to the accurate assignment
and interpretation of peaks in our analyses.

155
Mo presents a difficult system for analysis by XPS due the large number of potential
oxidation states, coupled with a number of more complex physical nuances in the
electronic structure found in the intermediate oxidation states. Molybdenum carbide
in this sense is a special case and is often referred to as a metalloid having mixed
covalent and metallic character. Nemoshkalenko et al. determine that the valence
band of Mo2C is made up of two sub-bands of states that participate in metallic
bonding and covalent bonding; the latter being exclusive to p-electrons, while the
metallic character is made up of contributions from the d-electron states with some
metallic bonding coming from the p-electrons.[31]
In the discussion pertaining to Mo metal, it is largely accepted that a reasonable value
for the 3d5/2 binding energy on a clean metal surface is ca. 227.8 ± 0.1 eV.[32-35]
Hüfner et al. determine the singularity index (relating to the peak asymmetry) for the
Mo core lines to be α = 0.12[36]
and Minni et al. determine the FWHM of the metal to
be ca. 0.8.[33]
Minni, Stair, McIntyre and others have approached the analysis of intermediate
oxidation states of molybdenum with varying results (see Table 4.1).[33-35, 37-42] It can
be seen from the overview that the metallic peak assignment is largely agreed upon,
as is the assignment for Mo(VI). However, further assignment is less obvious. From
the literature pertaining to Mo2C in particular, the binding energy assignment of 228.2
eV is consistent,[43] and by analogy it can also be considered to be consistent with the
Stair model for shifts in the metallic binding energy with increasing oxygen coverage.
Table 4.1: Assignments for Mo3d doublet peaks found in the literature
aMo(IV) is defined in these cases as the unscreened doublet resulting from final state effects
Mo(0) Mo(II) Mo(III) MoO2 Mo(IV)a Mo(V) MoO3
Minni 227.8
228.7
232.8 Stair 227.7 228.0
229.3
McIntyre 227.8 228.2
229.2 230.1 231.2 232.7 Olefjord 227.9
229.5 231.1
232.7
Freund 227.7
229.3 230.9
For the remaining possible oxidation states, the argument can be made that
assignment of various peaks must have some physical meaning. From a chemical

156
consideration, it can be expected that there are only Mo(0), Mo(IV) and Mo(VI). If
this is the case, then one must consider the final state effects related to MoO2 which
induce such a complex peak structure. Minni et al. ascribe this effect of multiplet peak
splitting to the number of unpaired electrons. In MoO2, the Mo ions have a formal 4d2
configuration that favours the 3d-hole-4d-electron interaction which manifests as an
observed line-broadening relative to Mo(0). The asymmetry of the Mo(0) and MoO2
peaks is a direct result of the density of states (DOS) at the Fermi edge, which is high
for the conducting oxide. This unusual conduction phenomenon is the result of a
characteristic metal-metal dimerisation resulting from a Peierls-type instability.[44-46]
The edge-sharing chains of Mo octahedra that make up the structure become distorted
by the formation of Mo-Mo pairs (Figure 4.5).[45, 46]
Figure 4.5: (a) Schematic representation of the rutile structure showing the Peierls
distortion allowing metallic bonding in MoO2. (b) origin of orbital overlaps for σ, πσ, πσ, πσ, π &
δ δ δ δ states. (c) schematic energy level diagrams for MoO2 without and with π−ππ−ππ−ππ−π interactions
— reprinted from [45] with the permission of The Royal Chemical Society.

157
This reduction in symmetry results in non-bonding Mo-4d π states that are free to
contribute to the Fermi edge. According to Scanlon et al., the resulting spectrum of
MoO2 (Figure 4.6) consists of a pair of doublet peaks at ca. 229.3 and 231 eV. The so
called ‘screened’ peaks at lower binding energies are a result of well-screened final
states in which the core hole is filled by an itinerant conduction electron. This is in
contrast to the unscreened peaks in which the localised level remains empty. It is
proposed that the energy separation between the screened and unscreened 3d5/2 peaks
(1.63 eV) is approximately equal to the plasmon energy loss ,which is measured for
MoO2 by EELS.[45] This interpretation therefore attributes the unscreened peaks to
unusually strong plasmon satellite features of MoO2. The large observed FWHM for
this unscreened state is attributed to lifetime broadening characteristic to the final
state screening process.
Figure 4.6: MoO2 multiplet splitting — reprinted from [47] with the permission of the
American Chemical Society.
The interpretation of these Mo3d spectra appears to be intrinsically different to that
given in much of the catalysis literature. It is noteworthy then to recall the binding
energy value given by Minni et al. for single crystal MoO2 – 228.8 eV (Figure 4.7).[33]
Here we see that there is a distinct reduction in the unscreened states, which can
perhaps be considered an indicator of a highly metallic ordered MoO2. Hence we see
that the assignment of XPS peaks for Mo species is highly variable and dependent on
the atomic uniformity of the sample. Mo(IV) may be a chemically valid oxidation
state but the observed electronic and physical properties are extremely structure
dependent. A structurally well-ordered MoO2 (or MoOx for that matter) can give rise

158
to Peierls-type distortions in the lattice, which results in the freeing up of conduction
band electrons. These electrons can subsequently screen the electron hole pair
resulting in a large overall decrease in binding energy relative to the oxidation state
(∆Mo(0)-Mo(IV) = 1.5 eV cf. ∆Mo(0)-Mo(VI) = 5 eV).
Figure 4.7: Mo3d peak structures — reprinted from [33] with the permission of the Insitute
of Physics.
The reason for the subsequent broadening observed for the unscreened peaks is of
course very difficult to quantify without good reference spectra or theoretical
calculations, but for our purposes may be modeled as a broad doublet, which is
acknowledged to contain information on the disordered Mo(IV) species that may or
may not be attributed to ‘Mo(V)’-type species.
Finally, it should be noted that an important indicator can be obtained from valence
band spectra with regards to the observed intensity of Mo(IV) unscreened peaks. An
increase in DOS at the Fermi edge indicates a high degree of metallicity of MoO2 and
therefore an increase in the ratio of screened to unscreened peak areas.
4.2.2.6 Notes on Raman fitting for carbon peaks
A recent paper by Sadezky et al. outlines a method for the spectral analysis of Raman
spectra obtained from carbon samples,[48] particularly pertaining to soot and related
carbonaceous materials. The method proposes the decomposition of the spectral
features known in spectra of graphite-like materials as ‘D’ and ‘G’ bands. It is
proposed that the known ‘G’ band at ca. 1580cm-1 , corresponding to the ideal
graphitic lattice vibration with E2g symmetry is accompanied by 4 ‘D’ (defect) bands,

159
which represent varying structural disorder and compositional variation from the ideal
lattice. The principal D band is assigned to D1 and appears at 1360cm-1 corresponding
to a graphitic lattice vibration with A1g symmetry. This peak was supposed to arise
from the grapheme layer vibrations in the vicinity of lattice terminations or
heteroatom inclusions. A second peak, D2, related to the graphitic lattice vibration
modes is found at 1620cm-1 as a shoulder on the G band relating to a mode with E2g
symmetry and is related to the vibrations of surface graphene layers. The D3 band is
assigned to a broad peak at ca. 1500cm-1 and is proposed to originate from the
amorphous carbon fraction of soot by means of mixed vibrations from organic
molecules, fragments and functional groups. The final band, D4, relates to a shoulder
commonly found on the D1 peak at ca. 1180cm-1 and is attributed to the sp2-sp3
stretching vibrations of polyene-like structures. Figure 4.8 is taken from the paper by
Sadezky et al. and illustrates the band assignments given for the Raman spectra of a
diesel soot sample.[48]
Although it is clear that such decomposition of Raman spectra is overly simplistic
model for the complexity of carbon materials, it can provide a useful comparative tool
for carbonaceous species that have a significant amorphous fraction. For these reasons
I have included interpretations of spectra obtained from post-mortem samples to
complement data obtained from CHN analyses and EELS-EDX spectra obtained for
the catalysts before and after treatment.
Figure 4.8: The decomposition of Raman D and G bands — reprinted from [48] with the
permission of Elsevier.

160
4.3 Experimental
4.3.1 Raman studies
Raman spectra were obtained for the pre- and post-mortem catalysts with the use of a
Horiba Jobin LABRAM microscope. Samples were prepared as pressed wafers
(13mm; 1.5T, 2min) or alternatively by flattening a powder sample between two glass
slides. All spectra unless otherwise stated were recorded for 60s with the average of 3
accumulations at a magnification of 100X using an MPlan Olympus objective with an
aperture value of 0.9. The light sources was a 20mW He-Ne laser with λ = 632.8nm
and an observed power density of 3mW at the sample. Calibration of the spectra was
carried out by standard comparison with the phonon excitation at 521cm-1 observed
for Si (111). Spectra were recorded between the ranges of 200 – 1000cm-1 (Mo and V
oxide peaks) and 1100 – 1800cm-1 (carbon D and G band excitations) using a
diffraction grating with 1800mm-1. The principal laser line was excluded by the use of
a holographic notch filter (± 150cm-1) from Kaiser Optical Systems.
Spectra of carbonaceous species were treated using a peak fitting method for the D
and G bands developed by Sadezky et al.[48] Integrated peak areas are given only for
comparison between samples and for discussion purposes.
Quasi in situ Raman spectra were obtained by the use of a custom designed SiO2 cell
which is illustrated in Figure 4.9. For the measurements a pressed wafer (200mg, 3T,
10min) was used which was supported by SiO2 wool. The design of the cell allowed
for the sample to be heated in a tube furnace under reaction conditions (gas flow,
temperature, educt analysis by GC) and periodically removed to record Raman spectra
through a SiO2 window (2mm).
Figure 4.9: In situ Raman cell design for the dehydrogenation of propane.

161
4.3.2 XPS
In situ and ex situ X-ray photoelectron spectra were recorded at the ISISS (Innovative
Station for In Situ Spectroscopy) beamline at the BESSY (Berliner
Elektronspeicherring-Gesellschaft für Synchrotronstrahlung) synchrotron facility in
Berlin using the high brilliance X-ray source of the undulator U49/2. All samples
were prepared in the glovebox at FHI-AC as pressed powders and mounted on to
sapphire sample holders. These were then transferred to the sample chamber without
contact to atmosphere using a vacuum transfer apparatus. The sample was mounted
ca. 2mm in front of a differentially pumped electrostatic lens system mounted at 55°
relative to the incident X-ray beam. The electron lens directed the photoelectron
stream to a commercial hemispherical electron analyser (PHOIBOS 150, Spec-
GmbH).
For in situ measurements, the sample chamber may be maintained at a constant
pressure < 5 mbar under flow conditions by the use of leak valves and mass flow
controllers. The gas phase composition is monitored by a quadrupole mass
spectrometer (Pfeiffer 300) and a Micro-GC from Varian. The sample is heated by a
laser, which is incident on the stainless steel backing plate of the sample holder, and
the temperature is measured by a type-K thermocouple mounted across the sample
surface.
Ex situ spectra were recorded for each of the four fresh (Mo1-xVx)2C (8425, 8478,
8447, 8486; x = 0, 0.03, 0.08, 0.11) samples at two positions on each sample. Survey
spectra at excitation energies of 1000 and 1010 eV and a step value of 1 eV were
acquired to correlate the Auger peaks. To gain depth information, scans were carried
out with different excitation energies to collect photons of specific kinetic energies, in
this case 150 eV and 600 eV. For each energy range, 10 scans were acquired for the C
1s edge, the O 1s edge, the Mo3d edge and the V 2p edge at a step value of 0.05 eV.
The Fermi edge was measured at each energy to correct for charging phenomena.
Spectra were treated using SpecsLab™ software for energy adjustment and scaling
before exporting to account for variations in peak positions and variable photon flux.
Background subtraction (Shirley) and peak fitting was carried out using CasaXPS™
software, and the peak assignments and parameters were made with careful
consideration of the literature (to be discussed). Relative surface compositions were

162
determined by normalising the integrated peak areas with a factor derived from
physically measured parameters:
PFMA�ST�QUVW0X = PFMAJ9 × �1 + PZ × 0.5065� × ]<H/
Where CS is the energy dependent cross-section of the element, AP is the asymmetry
parameter, and the Flux is the measured energy-dependent photon flux.
In situ XPS measurements were carried out over Mo2C (#10000) with the use of a
reference material, MoO2 (Aldrich). The Mo2C pre-pressed wafer (50mg, 8mm; 1.5T,
5min) was initially measured at the Mo L edge, C K edge and O K edge under UHV
conditions for survey purposes. Following this, the sample was reduced in H2
(0.3mbar, 5sccm) by ramping the temperature at 10°C/min to 600°C and holding for
10 minutes before cooling to a working temperature of 500°C. After reduction,
spectra were acquired under flowing H2 at the Mo L edge, C K edge and O K edge at
constant kinetic energies of 200eV and 600eV. Fermi edge spectra were acquired to
account for energy shifts. After reduction, the sample was exposed to a flowing
reaction atmosphere of C3H8/CO2/H2 (0.3 mbar, 1.25/1.25/2.5 sccm) at 500°C and
spectra were continuously acquired at 3 x KE = 200 eV (Mo L edge, C K edge, O K
edge, FE Mo & FE O edges) and 1 x KE = 600 eV (Mo L edge, C K edge, O K edge,
FE Mo & FE O edges).
The experiment was repeated with a fresh sample under the same conditions of pre-
treatment in a C-rich, oxidant-free atmosphere. The conditions applied were under
flowing C3H8/He/H2 (0.3 mbar, 2.5/1.25/1.25 sccm) at 500°C. Spectra were recorded
continuously as in the previous experiment.
4.3.3 TEM
TEM characterisation was carried out for selected samples of the precursor oxides
(6600 – h-MoO3, 6697 – h-Mo0.92V0.08O3) as well as the freshly prepared (Mo1-xVx)2C
carbide series (7484 – Mo2C, 8447 – (Mo0.92V0.08)2C). Post-mortem analysis was
carried out for samples that had been treated under C3H8/H2 (11004, 11006, 10996)
and for samples from the oxide series that were subjected to temperature-programmed
reaction under H2/C3H8 (11196, 11197, 11211).

163
Using a combination of selected area electron diffraction (SAED), energy dispersive
X-ray (EDX) and electron energy loss (EEL) spectroscopies, as well as high angle
annular dark field-scanning transmission electron microscopy (HAADF-STEM) and
high resolution (HR) microscopy techniques we were able to investigate the local
crystal structure, the elemental composition in the bulk, and near surface regions of
the material.
Transmission electron microscopy (TEM) investigation was carried out with a
Philips CM 200 FEG (Philips, Eindhoven, The Netherlands) TEM-operated at 200 kV
and equipped with a Gatan Image Filter (Gatan, Warrendale, PA) and a charge-
coupled device (CCD) camera. HAADF-STEM and HRTEM investigations were
carried out on a TITAN 80-300 (FEI) equipped with a Cs-corrector.
4.4 Results and discussion
4.4.1 Raman studies of fresh and used catalysts
Raman spectra of the passivated carbide series are shown for the range 1100 – 1800
cm-1 (Figure 4.10). The spectra are baseline corrected but show no evidence of bulk C
deposition.
1100 1200 1300 1400 1500 1600 1700 1800
0
100
200
300
400
#8486 (Mo0.89
V0.11
)2C
#8447 (Mo0.92
V0.08
)2C
#8478 (Mo0.97
V0.03
)2C
Inte
nsity
/ A
.U.
Raman shift / cm-1
#8425 Mo2C
Figure 4.10: Raman spectra of freshly prepared carbides

164
For Raman spectra recorded in the range 200 – 1100cm-1 , it is observed with all
carbide samples that there is no initial peak structure and with time under the laser
light, broad signals begin to evolve at ca. 800cm-1 indicative of Mo=O. However, it is
concluded that these peaks are due to the local oxidation of the sample and not due to
an oxycarbide overlayer.
Table 4.2: Mo(V)2C samples treated under C3/H2.
Catalyst Starting material
Phase (XRD) V/(Mo+V) Treatment
Temp (°C)
C before (wt.%)
C after wt.%
Mo2C 8425 Mo2C 0 H2/C3H8 550 5.2 9.2
Mo2C 8478 Mo2C 0.03 H2/C3H8 550 5.2 10.7
(MoV)2C 8447 Mo2C 0.08 H2/C3H8 550 5.1 9.7
Mo2C 8486 Mo2C 0.11 H2/C3H8 550 5.3 9.2
Figure 4.11 shows the normalised Raman spectra of the D and G bands for (Mo1-
xVx)2C samples post-catalytic treatment at 550°C (H2/C3H8 – see Chapter 3). For all
samples there appears to be a carbonaceous overlayer, which is reasonably amorphous
by consideration of the very broad D and G band overlap. This overlap can be
attributed to the contribution of a broad D3 peak which arises due to the combined
vibrational intensities of amorphous carbon material. It is possible to determine slight
differences throughout the series of (Mo1-xVx)2C, however it is not practical to carry
out comparative analysis due to the uncertainty involved in background subtraction.
A comparison between post-mortem samples was carried out for Mo2C (9540) that
has been treated in H2/C3H8 (DH), H2/C3H8/H2O (H2O-DH), H2/C3H8/CO2 (CO2-DH)
and H2/CO2 (RWGS). The spectra show that the samples treated under propane have
gained an overlayer of carbon as seen in Figure 4.12. The samples show an increasing
level of amorphous character in the order: 9965 < 9990 < 9886. The samples treated
under CO2 and H2O (9965 & 9990) show a significant increase in graphitic character
cf. 9886, which was treated under C3H8 only (Figures 4.12 & 4.13)

165
Figure 4.11: Raman spectra of Mo2C after treatment in C3H8/H2 at 550°C.
1200 1400 1600 1800
2000
4000
6000
8000
10000
9965 - CO2DH
9990 - H2ODH
9886 - DH 9999 - RWGS 9450 - Mo
2C
Inte
nsity
/ A
.U.
Raman shift / cm-1
Figure 4.12: Raman spectra of Mo2C after treatment under various atmospheres at 550°C.
We can speculate that the formation of carbonaceous species on each surface is either
the result of differing formation mechanisms or the increase in graphiticity is due the
preferential destruction of more reactive disordered carbon under the influence of
steam or CO2. It is interesting to note that the carbide treated under the influence of
CO2 exhibits a higher degree of graphitic character than the sample treated under H2O
despite the similarity in oxidising potential of CO2 vs. H2O.[49, 50] From the spectra it
would appear that the sample treated under RWGS conditions (9999) shows no
1200 1400 1600 18000.0
0.5
1.0
1.5
2.0
2.5
#11004
#11006
#10996
D2GD3D1
Inte
nsity
/ A
.U.
Raman shift / cm-1
D4
#11034
Increasing Vcontent

166
deposition of carbon, with the exception of what may be a peak at ca. 1180cm-1. CHN
analysis confirms that there is minimal carbon deposition over the course of reaction
(Table 4.2)
Figure 4.13: Raman spectra showing D and G band peak fitting for Mo 2C treated under:
(a) C3H8/H2/CO2, (b) C3H8/H2/N2 at 550°C.
1200 1400 1600 18000
1000
2000
3000
4000
5000
D2G
D3
D1
Inte
nsity
/ A
.U.
Raman shift / cm-1
#9965 - Post CO2-DH
D4
1200 1400 1600 18000
1000
2000
3000
D3 D2G
D1
D4
#9886 - Post DH
Inte
nsity
/ A
.U.
Raman shift / cm-1
(a)
(b)

167
Table 4.3: Carbon deposition over Mo2C in various atmospheres at 550°C.
4.4.2 In situ Raman
In situ Raman spectroscopy was used to evaluate the real-time deposition of carbon
on the surface of Mo2C during reaction under H2/C3H8 and H2/CO2/C3H8. In both
cases it was observed that the deposition of surface carbon correlated with a strong
deactivation of the hydrogenolysis reaction pathway. In Figure 4.14(a) it can be seen
that the relative formation rates of C2H4 and C3H6 remain constant over 20h reaction
time, whereas the formation rate of CH4 and C2H6 decays exponentially over time to
less than 25% of initial activity within 4h. Simultaneously, it can be observed in the
Raman spectra (Figure 4.14b) that the D and G bands associated with carbon
deposition are already formed within two hours of beginning the reaction.
It is reasonable to assume that the hydrogenolysis reactions are correlated with the
mechanism of carbon deposition on the surface of the catalyst, and that the initially
high activity is reduced by blocking of the hydrogenolysis sites by carbon. In contrast,
it is observed that the dehydrogenation of C3H8 → C3H6 remains relatively constant
implying that the catalytic sites active for dehydrogenation are not those sites that
facilitate hydrogenolysis.
9965 9990 9886 9999
Precursor 9450 9450 9450 9450 Phase Mo2C Mo2C Mo2C Mo2C
Pretreatment H2/CO2/C3H8 H2/H2O/C3H8 H2/C3H8 H2/CO2 Temp. (°C) 550 550 550 550
C content (%) 7.7 8.2 8.5 5.7 D1 position 1336 1339 1346 -
D1 Area 70 71 70 - D1 FWHM 128 145 195 - D2 position 1613 1616 1612 -
D2 Area 8 8 11 - D2 FWHM 29 33 52 - D3 position 1534 1538 1531 -
D3 Area 5 6 12 - D3 FWHM 101 99 141 - D4 position 1159 1171 1170 -
D4 Area 2 2 1 - D4 FWHM 63 49 41 - G position 1590 1593 1578 -
G Area 15 13 6 - G FWHM 46 48 55 -

168
00:00 04:00 08:00 12:00 16:00 20:00
0.00
0.25
0.50
0.75
1.00
Rel
ativ
e ra
te o
f for
mat
ion
Time / hh:mm
CH4
C2H
4
C2H
6
C3H
6
(a)
1200 1400 1600 1800
0
50
100
150 (b)
19h
17h
14.5h
11h
8.5h
6.5h
4h
2h
Inte
nsity
A.U
.
Raman shift (cm-1)
0h
Figure 4.14: In situ Raman experiment. Figure (a): relative product formation rates over
time; (b) Raman spectra showing evolution of D and G bands from carbon deposition. T =
500°C, C3H8/H2/N2 = 20/55/25, total flow = 20 sccm.

169
4.4.3 XPS studies
4.4.3.1 Ex situ XPS of MoV carbide catalysts
Ex situ analysis of a series of 4 catalysts of the form (Mo1-xVx)2C was carried out at
the ISISS beamline at BESSY. The freshly carburised samples were transferred to the
sample chamber without contact to atmosphere to examine the surface of the carbide
materials without pre-treatment. In Figure 4.15, the Mo 3d edge is shown at two
different kinetic energies – 150 eV and 600 eV – corresponding to an information
depth of approximately 1nm and 2nm respectively (according to the ‘universal curve’
– Figure 4.16).[51] The peaks were assigned following careful consideration of the
literature for Mo2C and Mo metal and MoO2.
For the freshly carburised samples, there is no observation of metallic Mo (227.8 eV)
under the conditions applied. Instead, a doublet is observed with 3d5/2 peak centred at
228.2 eV, which is assigned to Mo2C and is found to be self-consistent throughout all
the analyses. In the absence of any literature or reference materials, these peaks are
modeled with mixed Gaussian-Lorentzian (30:70) functions and are found to have a
reasonable FWHM (0.4 - 0.8). The next doublet has 3d5/2 peak centred at BE = 228.8
eV and is fitted with asymmetric peak function comprised of a Doniach-Sunjic/GL
convolution. This peak is assigned tentatively to a molybdenum oxycarbide species,
which is supported by the findings of Otani et al.[4] It is observed in a single crystal
study of Mo2C(0001) that the partially oxidized surface exhibits an enhanced DOS at
the Fermi edge that persists at temperatures < 523°C. This metallic MoOC doublet
peak is accompanied by a broad doublet with 3d5/2 centred at ca. 231 eV, which is
assigned to the unscreened MoOC peak, a catch-all state which accounts for shake-up
and final state effects. The final doublet (in the case of KE = 150 eV) has a 3d5/2
centred at 232.7 eV and is assigned to the Mo(VI) oxidation state.

170
238 236 234 232 230 228 2260
1000
2000
3000
CPS Mo(II) - Mo
2C
MoOC screened MoOC unscreened Mo(VI) Envelope
CP
S
B.E. / eV
K.E. = 150 eV (a)
238 236 234 232 230 228 2260
1000
2000
3000
4000
5000
6000 K.E. = 600 eV (b) CPS Mo(II) - Mo
2C
MoOC screened MoOC unscreened Envelope
CP
S
B.E. / eV
Figure 4.15: Mo3d XP spectra of as prepared Mo2C (#8425) at: (a) 200 eV kinetic energy;
(b) 600eV kinetic energy.

171
Figure 4.16: The ‘Universal Curve’ for determining the inelastic mean free path of
electrons through a solid — reprinted from [51] with the permission of John Wiley and Sons.
Figure 4.15 illustrates the Mo3d peak fitting comparison for the freshly prepared
Mo2C sample (#8425). It can be seen from the observed fits that the surface of the
carbide is rich in oxygen but remains in an overall reduction state below MoO2. The
spectra taken at higher kinetic energy indicate that the subsurface is mostly carbidic.
C1s spectra of the carbides series shown in Figure 4.17 show two distinct maxima at
ca. B.E. = 285 eV and B.E. = 283.3 ± 0.1 eV,which relate to surface carbon (C-C, C-
H) and carbidic carbon (Mo-C), respectively. The spectra recorded with K.E. 150 and
600 eV indicate that the surface is dominated by adventitious carbon with respect to
the lower surface, and that with increasing V-content there is a larger contribution
from free carbon species at the surface and in the subsurface. It is also observed that
the carbidic component of the C1s spectra is shifted by ca. 0.3-0.4 eV, which could be
attributed to a contribution of VC (B.E. = 282.2 eV), however, the shift is within a
margin of error.

172
290 288 286 284 282
0
2000
4000
6000
0.11
0.08
0.03
CP
S
B.E. / eV
K.E. = 150 eV
(Mo1-x
Vx)2C - C1s edge
x = 0
(a)
290 288 286 284 282
0
500
1000
1500
0.11
0.08
0.03
0
K.E. = 600 eV
CP
S
B.E. / eV
(b)
Figure 4.17: C1s spectra of (Mo1-xVx)2C at (a) 150 eV (b) 600 eV.
Quantification of the surface composition with respect to the observed Mo content
(Figure 4.18) shows an increasing surface fraction of oxygen and carbon species with
increasing bulk vanadium content. In Figure 4.18a, it appears that the immediate
surface layer is highly enriched in V as well (V/Mo ≈ 0.5 for #8486-11Vc). At higher
energies (K.E. 600 eV) the concentration of vanadium is more reflective of the
measured bulk value, however, an increase in subsurface carbon is observed in
comparison to the undoped Mo2C. These observations suggest that the formation of
the carbide has either resulted in mobilisation of the V atoms towards the surface or

173
that the initial growth of dislocation defects proceed preferentially along V-rich seams
in the precursor lattice.
0.00 0.02 0.04 0.06 0.08 0.100
1
2
3
4
5
6
7
Mo V C O
Rel
ativ
e a
tom
ic fr
actio
n (M
o =
1)
Bulk vanadium content (V/Mo+V)
150 eV K.E. (a)
0.00 0.02 0.04 0.06 0.08 0.100.0
0.2
0.4
0.6
0.8
1.0
1.2
1.4 (b)
Mo V C O
Re
lativ
e at
omic
fra
ctio
n (
Mo
= 1
)
Bulk vanadium content (V/Mo+V)
600 eV K.E.
Figure 4.18: Variation of surface composition of freshly prepared carbide with respect to
vanadium content.
The quality of the V2p spectra obtained (Figure 4.19) are not sufficient for a detailed
fitting procedure, but a qualitative analysis of the general features indicates that the
primary structure consists of a broad doublet centred at 3d5/2 ≈ 515.8 eV. Comparison
with energies reported in the literature suggests that the V atom is in a reduced
oxidation state such as found in V2O3.[52] However, inspection of the peak edge at
lower binding energies suggests the contribution of a more reduced phase, such as a

174
carbide/nitride as well. By comparison with a study carried out by Freund et al.[53] the
vanadium peak can tentatively be assigned to a V=O –like compound. The presence
of vanadium as vanadyl species in the structure is also seen in EEL spectra obtained
in the following TEM study. This is not unexpected when one considers the high
temperatures (ca. 900°C) required to form VC by TPR-carburisation.[54]
525 520 515 510 5050.0
0.2
0.4
0.6
#8478
#8447
A.U
.
B.E. / eV
#8486150 eV K.E.
Figure 4.19: V2p edge of (Mo1-xVx)2C catalysts.
4.4.3.2 In situ XPS
In situ XPS analysis was carried out at the ISISS beamline at BESSY. The sample
investigated was pressed to form wafers and subsequently recarburised before
mounting in sapphire sample holders.
For the first experiment, the spectra recorded before and after H2 pre-treatment can be
seen in Figure 4.20. The main observed difference is in the C1s spectra where it can
be seen that the peak at 285 eV relating to aliphatic carbon is vanishing. This loss of
surface carbon could account for the decrease in intensity for the O1s edge around
531 eV from C=O species. The peak at B.E. = 283.3 eV can be assigned to the
carbidic species. As a result of the double-carburisation, the Mo3d edge of the initial
sample shows little change after H2 treatment at 600°C.
- 11V
- 8V
- 3V
516 eV

175
536 534 532 530 528 526
Before
After H2
O1s
290 288 286 284 282
Before
After H2
C1s
238 236 234 232 230 228 226
After H2
Mo3d
B.E. / eV
Before
Figure 4.20: In situ XPS of Mo2C before and after H2 treatment recorded at KE = 200eV.
Product formation was observed during the course of reaction under C3H8/CO2/H2.
This was in keeping with the observed reactivity from plug flow experiments outlined
in Chapter 3. Due to the nature of the analytics, not all reaction products could be seen
by GC. For instance, it was observed that the H2 concentration strongly distorted
some peaks such as C3H6 preventing their accurate detection. However, it was
possible to measure peaks for CO, CO2 and C2H4, which correlates strongly to the
evolution of C3H6 as a dehydrogenation product. Thus, it is observed in Figure 4.21(a)
that the initial rate of formation of C2H4 decreases inversely to the rate of CO
formation via reverse water-gas-shift. The initial increase in r(CO) coincides with a
decrease in the O1s peak (Figure 4.21(b); red → green). The next spectrum at t =

176
14:12 (green → blue) decreases slightly as the r(CO) appears to level off. After some
time, the rate of CO formation has decreased and the O1s peak has regained its
original intensity. The Mo3d and C1s peaks are characteristic of the reduced Mo2C
throughout.
534 531 528 525
0
2500
5000
7500
13:00 14:00 15:00 16:000.4
0.6
0.8
1.0
12:54 13:34 14:12 15:47C
PS
(sc
aled
)
B.E. / eV
O1s edge(b)
Nor
mal
ised
rat
e
Time / hh:mm
C2H
4
CO2
CO
(a)
Figure 4.21: In situ XPS of Mo2C (#10000) — (a) normalised product formation rate over
time on stream under H2/C3H8/CO2 (2:1:1); (b) evolution of O1s peak with time on stream.
Due to the relatively high partial pressure of H2 the carbide remains in a reduced form
despite the oxidising CO2. This observation supports the theory that an oxygen-
moderated carbide phase is more active for the dehydrogenation of alkanes. It is also
interesting to note that there is no observed bulk change during the RWGS. It is
expected in this case that the overall degree of reduction influences the rate of CO
formation via the dissociative adsorption of CO2 on the oxygen-starved surface.
The second experiment was carried out under a flowing atmosphere of C3H8/He/H2
(2:1:1) after a H2 pre-treatment as described earlier. The original design of the

177
experiment aimed to study the effect of a rich hydrocarbon stream over the catalyst to
observe carbon deposition and propane activation in the absence of oxidising feed.
However, during the course of reaction it was observed that the surface of the carbide
became progressively oxidised (Figure 4.22). It was finally determined that the
oxidation of the sample was not due to external influences (i.e. leak) but came about
from the mobilisation of residual oxygen in carbide migrating to the surface. This was
observed for this reaction and not for the previous reaction, because the relative
concentration of hydrogen was half of that used previously and below the critical
concentration required to maintain a reduced surface. The resulting slow oxidation
coupled with the observed product distributions over time illustrates a picture of
surface reactivity with respect to surface oxidation. In Figure 4.22 a selection of the
Mo3d spectra recorded in situ at K.E. = 200 eV are shown. The peak assignments and
positions are outlined in Table 4.4. As has been discussed in the literature review, the
reliable and accurate assignment of peaks in such a multiplet structure is very
difficult. The complex electronic nature of molybdenum suboxides prevents their
exact determination and instead attempts have been made to present a self consistent
pattern of fitting for the data that may be gauged against the observed reactivity as
monitored by MS and GC.
As is consistent with the literature, metallic (Mo0) and carbidic (MoII) peaks have
been assigned to 3d5/2 ≈ 227.8 and 228.3 eV respectively. MoIV is divided into two
separate species; the metallic, screened peak at 3d5/2 ≈ 229.3 eV and a contribution
from the unscreened states which accounts which is observed as a very broad doublet
with 3d5/2 ≈ 231 eV. Finally, a small contribution of intensity observed to at Mo3d5/2
= 232.7 is attributed to MoVI but it should be noted that this may also coincide with a
shake-up peak of Mo0 (227.8 + 5.1 eV).[55]

178
238 236 234 232 230 228 2260
1x10⁴
2x10⁴
3x10⁴
4x10⁴
5x10⁴
6x10⁴
signal Mo Mo2C MoO2 - metallic MoO2-unscreened MoO3 ENV
CP
S
B.E. / eV
K.E. = 200 eV (a)
238 236 234 232 230 228 2260
1x10⁴
2x10⁴
3x10⁴
4x10⁴
5x10⁴
signal Mo Mo2C MoO2 - metallic MoO2-unscreened MoO3 ENV
CP
S
B.E. / eV
K.E. = 200 eV (b)
238 236 234 232 230 228 2260
1x10⁴
2x10⁴
3x10⁴
4x10⁴
5x10⁴
signal Mo Mo2C MoO2 - metallic MoO2-unscreened MoO3 ENV
CP
S
B.E. / eV
K.E. = 200 eV (c)
238 236 234 232 230 228 2260
1x10⁴
2x10⁴
3x10⁴
4x10⁴
signal Mo Mo2C MoO2 - metallic MoO2-unscreened MoO3 ENV
CP
S
B.E. / eV
K.E. = 200 eV (d)
238 236 234 232 230 228 2260
1x10⁴
2x10⁴
3x10⁴
signal Mo Mo2C MoO2 - metallic MoO2-unscreened MoO3 ENV
CP
S
B.E. / eV
K.E. = 200 eV (e)
238 236 234 232 230 228 2260
1x10⁴
2x10⁴
3x10⁴
signal Mo Mo2C MoO2 - metallic MoO2-unscreened MoO3 ENV
CP
S
B.E. / eV
K.E. = 200 eV (f)
Figure 4.22: In situ XPS of Mo2C - evolution of Mo3d multiplet peak with time on stream
under C3H8/H2/He (2:1:1). (a) t = 00:50, (b) t = 01:57, (c) t = 03:21, (d) t = 04:45, (e) t =
05:52, (f) t = 10:41.

179
Table 4.4: Evolution of Mo3d peak positions (KE = 200eV) over time during in situ XPS in
C3H8/H2/He.
The observed changes in surface oxidation are represented by the peak integrals
plotted over time (Figure 4.23a). It is observed that the metallic and carbidic character
of the surface is slowly oxidised over the first four hours with a steadily growing
contribution from MoIV (screened). At around four hours the oxidative conversion is
rapid and results in a large increase in the unscreened MoIV doublet. The
corresponding picture of the surface reactivity is represented in Figure 4.23b. The
initial rate of C3H6 formation is high and drops as the formation rates of C2H4 and
C4H8 increase rapidly between t = 0 and t = 2h. These recombinative hydrocarbon
formation products (C2H4 and C4H8) are observed to decrease again at t = 5h and t =
4h respectively. From this we can deduce that the oxidation of the surface is
detrimental for this mechanism of reaction (alkylidene recombination). Also, because
the C2H4 deactivates at a later time than the C4H8, it is likely that the mechanism of
product formation is slightly different for each educt.
If we consider the valence band (VB) spectra recorded during the in situ run we can
gain some more insight into the mechanism of reaction. In Figure 4.24a the VB
spectra are shown for the course of reaction with the final spectra displayed at the
front.
Run # Time (hh:mm) Mo0 MoII MoIV(S) MoIV(U) MoVI*
1 0:50 227.77 228.31 229.40 231.20 232.60
2 1:24 227.78 228.28 229.35 230.90 232.60
3 1:57 227.78 228.28 229.31 230.90 232.60
4 2:48 227.78 228.26 229.27 230.94 232.60
5 3:21 227.80 228.31 229.37 230.98 232.60
6 3:54 227.80 228.29 229.35 231.20 232.60
7 4:45 227.81 228.29 229.30 230.95 232.60
8 5:19 227.83 228.29 229.30 231.02 232.87
9 5:52 227.86 228.35 229.31 230.97 232.79
10 6:43 227.84 228.21 229.28 230.94 232.74
11 10:41 228.00 228.39 229.29 230.98 232.78
12 11:12 228.00 228.31 229.25 230.95 232.74
Std dev.
0.08 0.04 0.04 0.10 0.10

180
00:00 02:00 04:00 06:00 08:00 10:00 12:000
10
20
30
40
50
60
Mo0
MoII
MoIV (S) MoIV (U) MoVI
Rel
ativ
e pe
ak a
rea
/ %
time / hh:mm
(a)
0.0
0.2
0.4
0.6
0.8
1.0
00:00 02:00 04:00 06:00 08:00 10:00 12:000
20
40
60
80
100
Relative form
ation rate / A.U
.
C4H
8
C2H
4
C3H
6
Rel
ativ
e pe
ak a
rea
/ %
time / hh:mm
Mo0
MoII
MoIV (S) MoIV (U)
MoVI
C2H
6
(b)
Figure 4.23: In situ XPS — (a) Mo species over time as determined by Mo3d peak areas. (b)
Stacked area plot of oxidation states overlaid with selected relative product distributions.
It can be seen that throughout the reaction there is a non-zero DOS at the Fermi edge,
implying that the system remains metallic in character. However, the VB spectra
show a decreasing electronic density at states close to the Fermi edge, and in the final
spectra it can be seen that the overlap between the Mo4d and O2p bands is strongly
decreased to the point that the bands are almost discrete.

181
12 10 8 6 4 2 0 -2
00:59 01:33 02:06 02:57 03:30 04:04 04:54 05:28 06:01 06:52 10:50 11:21
B.E. / eV
(a)
00:00 02:00 04:00 06:00 08:00 10:00 12:00
500
1000
1500
2000
2500
3000
0.0
0.2
0.4
0.6
0.8
1.0
normalised form
ation rate
2.5 eV 1.5 eV 0.5 eV
CP
S
time / hh:mm
C2H
4
C4H
8
(b)
Figure 4.24: In situ XPS — (a) valence band spectra of #10000 over time on stream. (b) Plot
of cross sections taken from 0.5, 1.5 & 2.5 eV from the Fermi edge compared with
normalised rates of C2H4 and C4H8.
In Figure 4.24b, a cross-section is taken through the VB spectra at B.E. = 0.5, 1.5 &
2.5 eV to give a picture of electron density at the Fermi edge, the Mo4d state, and at
the overlapping region between the 4d and O2p states.

182
The result is that while the DOS at the Fermi edge (0.5 eV) remains unchanged, the
electron density in the Mo4d VB decreases strongly from t = 05:00-06:00 in concert
with the observed C2H4 formation. Moreover, the separation between the Mo4d and
O2p states occurring from t = 04:00, is observed to coincide with the decrease in C4H8
formation rate.
4.4.4 TEM study of Mo/V materials after reaction in H2/C3H8
TEM characterisation of the precursor oxides and the prepared carbides is presented
in Chapter 2 of this thesis and will only be referenced briefly in this section. The post-
mortem studies refer to the (Mo1-xVx)2C materials after H2/C3H8 treatment and also to
the h-Mo1-xVxO3 after temperature-programmed reaction in H2/C3H8.
4.4.4.1 (Mo1-xVx)2C after C3H8/H2
The post-mortem analyses of (Mo1-xVx)2C materials using HRTEM after reaction
reveal significant changes in both the surface and structural features of the catalysts
after reaction. From the HRTEM images, we can observe a variety of morphologies
including densely-packed particles as well as porous agglomerates with particle
domain sizes 5–15 nm (Figure 4.25). It can be seen by the contrast that in the
immediate surface of the particles is a layer of loosely ordered carbon covering the
particles. The overall morphology is not significantly different from that observed for
the as-prepared carbide, but there appears to mesoporous aspect to the agglomerate
structure.
Structurally the changes are more profound. By powder XRD, only hcp β-Mo2C is
evident in the diffraction pattern, however, it is observed in the SAED of individual
domains that there is also α-MoC1-x present in the sample (Figure 4.26). These cubic
sub-domains appear to be integrated within the matrix of the bulk carbide and
potentially come about via a high temperature recrystallisation of the surface
oxycarbide layer, which was seen to prevail in the XPE spectra of the freshly prepared
carbides. This surface restructuring also appears to be more prevalent in the V-
containing samples which have a higher concentration of surface oxygen.

183
Figure 4.25: TEM images of 11004 — post mortem sample of Mo2C after H2/C3H8
treatment.

184
Figure 4.26: SAED of 11004 showing αααα-MoC1-x phase reconstruction.
Analysis of the local elemental composition by energy-dispersive X-ray (EDX)
spectroscopy was carried out for the Mo(V)2C samples in the microscope. In this case,
exact determination of the element ratios was complicated by the fact that a low
energy Mo M edge interferes strongly with the carbon K edge which is necessary for
quantification. It is observed that the Mo M edge is only sometimes present, which
may be due to orientational effects.
Overall, semi-quantitative information can be obtained using sophisticated
background subtraction techniques (see above), but the determination of carbon tends

185
to be under-represented. The carbide samples after reaction, as seen in Figure 4.25
and Figure 4.27, exhibit visible heterogeneity, which is apparent from the EDX
spectra. Figure 4.28 shows considerable deviation in the EDX quantification collected
at three spots with respect to carbon content. In spot 1, the sample appears to be
carbon poor while in spot 3, we can see that the structure is carbon rich. This induced
structural and compositional heterogeneity appears to be linked with areas of fcc
MoC1-x tending to exhibit higher carbon contents. However, it was not deemed
worthwhile to collect statistical data given the apparent inhomogenous nature of the
material and the difficulty in quantifying spectra.
Electron energy loss spectra (EELS) were obtained for the samples to give
information about the chemical states of the elements present in the matrix. As can be
seen in Figure 4.29, the Mo M edge is rather broad and has a small feature (M 4,5) at
ca. 227 eV and further features visible at 393 and 410 eV (M3 ,M2). A large peak was
observed for the C K-edge, which is indicative of the presence of sp2-bonded carbon
that is in agreement with Raman spectra discussed previously. The final feature of
note is the doublet peak observed at ca. 515 eV for the V L-edge. As was observed for
the ex situ XPS the energy range of the 3d5/2 peak suggests that the vanadium is in a
intermediate oxidation state reminiscent of V=O.
Figure 4.27: TEM micrograph of EDX area for (Mo0.92V0.08)2C (#10996).
200nm
Spot 1
Spot 2
Spot 3

186
Spot 269.45%
3.28%2.46%
24.8% C(K) O(K) V(K) Mo(K)
Spot 154.58%
3.76%
3.65%
38.01%
Spot 3
42.79%3.35%2.54%
51.32%
(Mo1-x
Vx)
2C
61.33%
5.33%0%
33.33%
Figure 4.28: Graphic representation of EDX spectra as received for Figure 4.27 with
reference.
Figure 4.29: EELS spectra of (Mo0.92V0.08)2C (#10996). The major energy edges are assigned
to Mo-Medge, C K-edge and V L-edge.

187
4.4.4.2 h-Mo1-xVxO3 after C3H8/H2
In contrast to the post-mortem carbides discussed above, the Mo/V oxides were
carburised under reaction conditions with propane rather than methane and form
preferentially the fcc α-MoC1-x carbide phase. As is discussed in the introduction and
in Chapter 1, fcc α-MoC1-x is a metastable carbide phase and exhibits variable
occupancy with respect to C and O. The lattice parameter of a = 4.23 Å is very close
to the values between 4.0 – 4.2 Å, which are assigned variously in the literature to the
‘MoOxCy’ and ‘MoO’ oxycarbide and cubic oxide phases to which it bears
remarkable similarity. Overall, the parent morphology of the post-reaction oxides is
retained in a pseudomorphic fashion as is observed for the carburisation process. Due
to the reported topotactic nature of the transformation MoO3 → α-MoC1-x ,the
received crystallite domains are very small (typically < 5 nm) and form a mesoporous
agglomerated material as seen for sample #11211 in
Figure 4.30. Although it is observed that the sample largely consists of fcc α-MoC1-x,
it is evident from SAED that there is also hcp β-Mo2C present as well as MoO2.
Figure 4.30: Post-TPR h-Mo0.89V0.11O3 (#11211) showing pseudomorphism.

188
Figure 4.31: SAED of h-Mo0.97V0.03O3 (11197) post TPR under H2/C3H8 showing hcp carbide
phase.
Figure 4.32: SAED of h-Mo0.89V0.11O3 (11211) post TPR under H2/C3H8 showing fcc carbide
phase.

189
Figure 4.33: SAED of h-Mo0.89V0.11O3 (11197) post TPR under H2/C3H8 showing MoO2
phase.
Figures 4.32–4.34 show SAED patterns indicative of Mo2C, MoC1-x and MoO2
structures, exhibiting the dynamic reconstruction of the precursor oxide under
rigorous reaction conditions to give various phases. The structural dependency on the
reactive hydrocarbon is discussed in Chapter 1 and is clearly illustrated here. Due to
the meta-stable nature of the fcc α-MoC1-x, the hcp carbide may be formed due to
excess local heating or is formed concurrently with the cubic phase in local regions
due to mass transport limitation of the initial reduction.
It was noted in Chapter 2 that the carburisation of Mo/V precursor oxides resulted in
formation of ribbon or fibre-like morphologies in the resultant carbides. This
phenomenon is also noted in the case of the TPR of precursor oxides. As can be seen
in Figure 4.34, a high aspect-ratio crystallite sits on the edge of the holey carbon film
and distinctive ribbon-like features surround a solid core. As was observed for the
TPR-carburisation samples in Chapter 2, the fibres run along the length of the
(presumable) c-axis from the parent oxide.

190
Figure 4.34: (left) STEM-HAADF image of post-TPR h-Mo0.89V0.11O3 (#11211) showing
fibrous structure. (Right): TEM image of same.
The carbon content of the TPR samples as determined by EDX spectroscopy is
observed to be quite high in comparison to the stoichiometric carbide. Due to the
highly dislocated nature of the fcc structure and higher relative surface area (see
Chapter 1 and 3), the post-reaction oxides appear to support higher levels of carbon
deposition cf. the post-treated Mo2C samples. In Figure 4.35, EDX spectra taken
across a larger particle surrounded by smaller particles shows the smaller particles to
be saturated with carbon (70-80 at.%) and it also shows strong variations in the
vanadium content. To confirm a suspicion that the variations in vanadium content in
this sample (h-Mo0.97V0.03O3) originate from the poor statistics/background
subtraction for vanadium, the same particle was inspected using STEM-HAADF with
element-specific filtering to give an elemental map (Figure 4.36).
As can be seen the elemental distribution across the particle is quite homogenous and
as seen in EDX, the particle appears to be saturated with carbon. EELS spectra of the
post-TPR oxides (Figure 4.37) show a doublet for the V L-edge with 3p3/2 centred
around ca. 516 eV. Inset in the figure is a reference spectra for V=O which shows a
similar excitation energy. This assignment is also in line with the observed oxidation
state of vanadium in the prepared and post-reaction Mo/V carbide series.

191
Figure 4.35: EDX spectra of a selected area of post-TPR h-Mo0.97V0.03O3 (#11197)
Figure 4.36: STEM-HAADF micrograph of particle in Figure 4.35 (upside down) showing
elemental distribution.

192
Figure 4.37: Vanadium EELS spectra of post-TPR h-Mo0.97V0.03O3 (#11197). Reference
EEL spectra in lower right reprinted with the permission of Willinger.[56]
4.5 Discussion
4.5.1 Raman microscopy studies
The use of Raman microscopy for observing freshly carbided surfaces is of limited
value due to the absence of spectroscopic information. It was observed in the region
200-1000cm-1 that bands began to evolve around 800cm-1 with irradiation time, and it
is concluded that even at low power, Mo2C as prepared is beam sensitive.
The principle use of Raman microscopy in this study is to monitor and characterise
the deposition of surface carbon following the catalyst’s exposure to the reactant
atmosphere. In this case, we observe two distinct modes of deposition. In the first
instance, the reaction of propane in H2 over the surface of Mo2C results in a relatively
amorphous carbon with a strong and broad underlying D3 peak at ca. 1500cm-1. As
was determined in the previous chapter, this carbon is the result of overactive total
hydrogenolysis resulting in the deactivation of the surface by bulk carbon build up.
In contrast, the carbon formed by the treatment of Mo2C in H2/C3H8/H2O or
H2/C3H8/CO2 is formed under an oxidative environment and total hydrogenolysis of

193
the propane is not observed. In this case, the carbon is considerably more graphitic in
nature. However, more information is required to make an analysis of this
mechanism.
4.5.2 XPS studies
It was hoped to gain insight into the coking process by XPS studies. However,
throughout all the attempted experiments, there was no observed carbon deposition,
likely due to the reduced pressure of the in situ XPS at ISISS. Despite the lack of
coking, or possibly because of it, we are able to draw a clearer picture of the reactivity
of propane over molybdenum carbide/oxycarbide surfaces.
Ex situ XPS results for the as-prepared Mo(V)2C catalysts show the surface of the
carbides to be a relatively disordered array of Mo, C and O (see Figure 4.38). On H2
activation, the surface carbon is largely removed but resulted in a partially metallic
surface.
Figure 4.38: Mo2C surface model.
The inclusion of vanadium is seen to increase the level of surface C and O
significantly (Figure 4.18) and it was observed that the surface was enriched in

194
vanadium relative to the bulk. The increasingly oxy-carbidic nature of the (Mo1-
xVx)2C surfaces can be attributable to the increased oxo-philicity of V relative to Mo
which serves to decrease oxygen mobility in the solid. This is observed in the ex situ
XPS as V=O species.
In the in situ XPS experiments, the surface of the active carbide under the reaction is
observed to be supplied with residual oxygen from the bulk, which is subsequently
trapped and forms an oxidic layer. The evolving surface catalyses the transformation
of propane with an initially high relative rate, which is observed to drop after a short
time on stream as the formation rate of C2H4 and butanes increase (Figure 4.39)
00:00 01:00 02:00 03:00 04:000
10000
20000
30000
40000 C2H4 C3H6 C4
Pea
k ar
ea (
A.U
.)
time / hh:mm
Figure 4.39: detail from in situ XPS experiment of C3/H2/He over Mo2C (Figure 4.23).
This observation is consistent with the notion of a recombinative hydrocarbon
formation mechanism as put forward by Tysoe et al.[13] The initial surface under these
conditions is observed to catalyse the dehydrogenation of propane to propylene. As
the surface slightly increases in oxygen concentration it becomes more active for the
dissociative adsorption of propylene. During this time (t = 00:30 → 01:00),
propylene titrates the catalyst surface forming bound methylidene and ethylidene
species, which recombine with each other and with surface bound atomic H to form
C1, C2, C3, and C4 species. As seen in Figure 4.24, the formation of C2H4 and C4
species do not precisely mirror each other. The formation of C2H4 is partly due to
hydrogenolysis and partly due to the recombinative hydrocarbon formation
mechanism. As can be seen in the valence band spectra, the strong mixing between

195
the Mo4d and O2p states begins to decline at ca. t = 04:00. At this point the activity
for recombinative hydrocarbon formation begins to decrease.
4.5.3 TEM studies
From the TEM studies of pre- and post-mortem catalysts, it is clear that surface-
restructuring and to a certain extent bulk-restructuring occurs upon heating in reaction
conditions. It is well known that fcc MoC1-x is a metastable phase that may be
transformed on heating to Mo2C.[57] However, in the case of Mo(V)2C, we see that the
reverse is also true in this case and that the action of propane on the carbide induces a
structural rearrangement to form MoC1-x sub-domains.
From the TEM imagery of the carbide materials there is evidence of carbon
deposition and carbon rich areas, but there is no suggestion of large-scale elemental
segregation between Mo and V. The post-catalytic materials are distinctly more
heterogeneous compared with the freshly prepared carbides and the microstructure is
observed in some cases to be densely packed, while in other areas there is visible
mesoporosity. The local distribution of carbon is also observed to be non-uniform but
is difficult to quantify exactly due to signal interference.
In the case of the post-TPR oxides the materials are even less ordered. Due to the use
of propane as a carburising agent, the structure is irregularly bloated with carbon-rich
areas and the material exhibits an array of microstructural characteristics.
4.6 Conclusions
Using Raman microscopy, adventitious carbon was observed to form on the surface of
the catalyst which selectively blocked sites that were active for the
hydrogenolysis/cracking of propane to lighter molecules. The nature of the carbon
species was dependent on the reaction conditions and was found to evoke a higher sp2
character (less amorphous) with a co-oxidant feed (H2O, CO2).
From ex situ XPS of the freshly prepared carbides the oxy-carbidic nature of the
surface layer is apparent and it is also observed for the V-containing materials that the
surface layer is enriched with vanadium in the form of V=O. Results of in situ XPS
experimentation reveal a strong dependency of the catalytic activity with the surface
oxidation state of the carbide. Dehydrogenation of propane was observed to increase

196
with an increasing oxidation state, whereas formation of C2 and C4 products is
favoured by an increased electron density at the Fermi edge. No formation of
adventitious carbon was observed.
The comparison of pre- and post-mortem carbide catalysts shows considerable surface
rearrangement and carbon deposition. Selected area electron diffraction (SAED) of
the freshly prepared carbides is indicative of hcp β-Mo2C with agglomerated
crystallite morphology. After reaction, the catalysts are observed to be quite
heterogeneous with regards to carbon deposition and structural rearrangement. The
SAED reveals a mixture of hcp β-Mo2C as well as the presence of fcc α-MoC1-x
however, the powder XRD shows only β-Mo2C.
Post-mortem analysis of the oxide precursors after TPR in H2/C3H8 shows primarily
fcc α-MoC1-x with extensive carbon deposition as both graphitic overlayers and
carbon-rich carbidic phases.

197
4.7 References
[1] W. C. Wu, Z. L. Wu, C. H. Liang, P. L. Ying, Z. C. Feng, C. Li, Physical Chemistry Chemical Physics 2004, 6, 5603.
[2] T. P. St. Clair, S. T. Oyama, D. F. Cox, S. Otani, Y. Ishizawa, R.-L. Lo, K.-i. Fukui, Y. Iwasawa, Surface Science 1999, 426, 187.
[3] M. Sugihara, K. Ozawa, K. Edamoto, S. Otani, Solid State Communications 2001, 121, 1.
[4] K. Edamoto, M. Sugihara, K. Ozawa, S. Otani, Surface Science 2004, 561, 101.
[5] M. Kato, T. Sato, K. Ozawa, K. Edamoto, Y. Nakadai, S. Otani, Surface Science 2007, 601, 201.
[6] J. G. Chen, Chem. Rev. 1996, 96, 1477. [7] J. C. Grossman, A. Mizel, M. Cote, M. L. Cohen, S. G. Louie, Physical
Review B 1999, 60, 6343. [8] D. G. Kelly, M. Salmeron, G. A. Somorjai, Surface Science 1986, 175, 465. [9] M. Siaj, I. Temprano, N. Dubuc, P. H. McBreen, Journal of Organometallic
Chemistry 2006, 691, 5497. [10] M. Siaj, N. Dubuc, P. H. McBreen, The Journal of Physical Chemistry C
2009. [11] Y. Chauvin, Angewandte Chemie-International Edition 2006, 45, 3740. [12] J. L. Herisson, Y. Chauvin, Makromolekulare Chemie 1971, 141, 161. [13] B. Bartlett, V. Shneerson, W. T. Tysoe, Catalysis Letters 1995, 32, 1. [14] W. T. Tysoe, Langmuir 1996, 12, 78. [15] E. Solymosi, R. Nemeth, L. Ovari, L. Egri, Journal of Catalysis 2000, 195,
316. [16] F. Solymosi, R. Németh, A. Oszkó, J. J. S. E. Iglesia, T. H. Fleisch, in Studies
in Surface Science and Catalysis, Vol. Volume 136, Elsevier, 2001, pp. 339. [17] E. Torres-GarcÃ-a, G. RodrÃ-guez-Gattorno, J. A. Ascencio, L. O. Alemán-
Vázquez, J. L. Cano-DomÃ-nguez, A. MartÃ-nez-Hernández, P. Santiago-Jacinto, The Journal of Physical Chemistry B 2005, 109, 17518.
[18] G. Rodriguez-Gattorno, A. Martinez-Hernandez, L. O. Aleman-Vazquez, E. Torres-Garcia, Applied Catalysis a-General 2007, 321, 117.
[19] P. Delporte, F. Meunier, C. Phamhuu, P. Vennegues, M. J. Ledoux, J. Guille, Catalysis Today 1995, 23, 251.
[20] P. Delporte, C. PhamHuu, M. J. Ledoux, Applied Catalysis a-General 1997, 149, 151.
[21] P. DelGallo, F. Meunier, C. PhamHuu, C. Crouzet, M. J. Ledoux, Industrial & Engineering Chemistry Research 1997, 36, 4166.
[22] M. J. Ledoux, F. Meunier, B. Heinrich, C. Pham-Huu, M. E. Harlin, A. O. I. Krause, Applied Catalysis a-General 1999, 181, 157.
[23] M. E. Harlin, A. O. I. Krause, B. Heinrich, C. Pharm-Huu, M. J. Ledoux, Applied Catalysis a-General 1999, 185, 311.
[24] C. Bouchy, C. Pham-Huu, B. Heinrich, C. Chaumont, M. J. Ledoux, Journal of Catalysis 2000, 190, 92.
[25] F. Uchijima, T. Takagi, H. Itoh, T. Matsuda, N. Takahashi, Physical Chemistry Chemical Physics 2000, 2, 1077.
[26] T. Matsuda, Y. Hirata, S. Suga, H. Sakagami, N. Takahashi, Applied Catalysis a-General 2000, 193, 185.

198
[27] T. Ohno, Z. Li, N. Sakai, H. Sakagami, N. Takahashi, T. Matsuda, Applied Catalysis A: General 2010
In Press, Accepted Manuscript. [28] R. Schlögl, A. Knop-Gericke, M. Hävecker, U. Wild, D. Frickel, T. Ressler,
R. E. Jentoft, J. Wienold, G. Mestl, A. Blume, O. Timpe, Y. Uchida, Topics in Catalysis 2001, 15, 219.
[29] D. Wang, D. S. Su, R. Schlögl, Zeitschrift Fur Anorganische Und Allgemeine Chemie 2004, 630, 1007.
[30] J. B. Claridge, A. P. E. York, A. J. Brungs, C. Marquez-Alvarez, J. Sloan, S. C. Tsang, M. L. H. Green, Journal of Catalysis 1998, 180, 85.
[31] V. V. Nemoshkalenko, V. P. Krivitskii, A. P. Nesenjuk, L. I. Nikolajev, A. P. Shpak, Journal of Physics and Chemistry of Solids 1975, 36, 277.
[32] P. Mikušík, R. Nyholm, N. Mårtensson, Czechoslovak Journal of Physics 1981, 31, 1165.
[33] F. Werfel, E. Minni, Journal of Physics C-Solid State Physics 1983, 16, 6091. [34] E. Minni, F. Werfel, Surface and Interface Analysis 1988, 12, 385. [35] G. H. Smudde, P. C. Stair, Surface Science 1994, 317, 65. [36] H. Höchst, P. Steiner, G. Reiter, S. Hüfner, Zeitschrift für Physik B
Condensed Matter 1981, 42, 199. [37] M. Shimoda, T. Hirata, K. Yagisawa, M. Okochi, A. Yoshikawa, Journal of
Materials Science Letters 1989, 8, 1089. [38] K. Oshikawa, M. Nagai, S. Omi, J. Phys. Chem. B 2001, 105, 9124. [39] P. C. Stair, Langmuir 1991, 7, 2508. [40] N. S. McIntyre, D. D. Johnston, L. L. Coatsworth, R. D. Davidson, J. R.
Brown, Surface and Interface Analysis 1990, 15, 265. [41] P. A. Spevack, N. S. Mcintyre, Journal of Physical Chemistry 1992, 96, 9029. [42] P. A. Spevack, N. S. McIntyre, The Journal of Physical Chemistry 1993, 97,
11020. [43] M. Xiang, D. Li, J. Zou, W. Li, Y. Sun, X. She, Journal of Natural Gas
Chemistry 2010, 19, 151. [44] V. Eyert, et al., Journal of Physics: Condensed Matter 2000, 12, 4923. [45] A. Gulino, S. Parker, F. H. Jones, R. G. Egdell, Journal of the Chemical
Society-Faraday Transactions 1996, 92, 2137. [46] T. Schroeder, J. Zegenhagen, N. Magg, B. Immaraporn, H. J. Freund, Surface
Science 2004, 552, 85. [47] D. O. Scanlon, G. W. Watson, D. J. Payne, G. R. Atkinson, R. G. Egdell, D. S.
L. Law, The Journal of Physical Chemistry C 2010, 114, 4636. [48] A. Sadezky, H. Muckenhuber, H. Grothe, R. Niessner, U. Pöschl, Carbon
2005, 43, 1731. [49] D. C. LaMont, A. J. Gilligan, A. R. S. Darujati, A. S. Chellappa, W. J.
Thomson, Applied Catalysis a-General 2003, 255, 239. [50] A. R. S. Darujati, D. C. LaMont, W. J. Thomson, Applied Catalysis a-General
2003, 253, 397. [51] M. P. Seah, D. Briggs, Practical surface analysis by Auger and X-ray
photoelectron spectroscopy, Wiley, Chichester, 1983. [52] J. Chastain, J. F. Moulder, Handbook of X-ray photoelectron spectroscopy a
reference book of standard spectra for identification and interpretation of XPS data, Physical Electronics, Eden Prairie, Minn., 1995.

199
[53] M. A. Haija, S. Guimond, Y. Romanyshyn, A. Uhl, H. Kuhlenbeck, T. K. Todorova, M. V. Ganduglia-Pirovano, J. Döbler, J. Sauer, H. J. Freund, Surface Science 2006, 600, 1497.
[54] R. Kapoor, S. T. Oyama, Journal of Solid State Chemistry 1995, 120, 320. [55] G. M. Bancroft, B. D. Boyd, D. K. Creber, Inorganic Chemistry 1978, 17,
1008. [56] M. Willinger, Diploma Thesis 2002. [57] T. Xiao, A. P. E. York, K. S. Coleman, J. B. Claridge, J. Sloan, J. Charnock,
M. L. H. Green, Journal of Materials Chemistry 2001, 11, 3094.

200
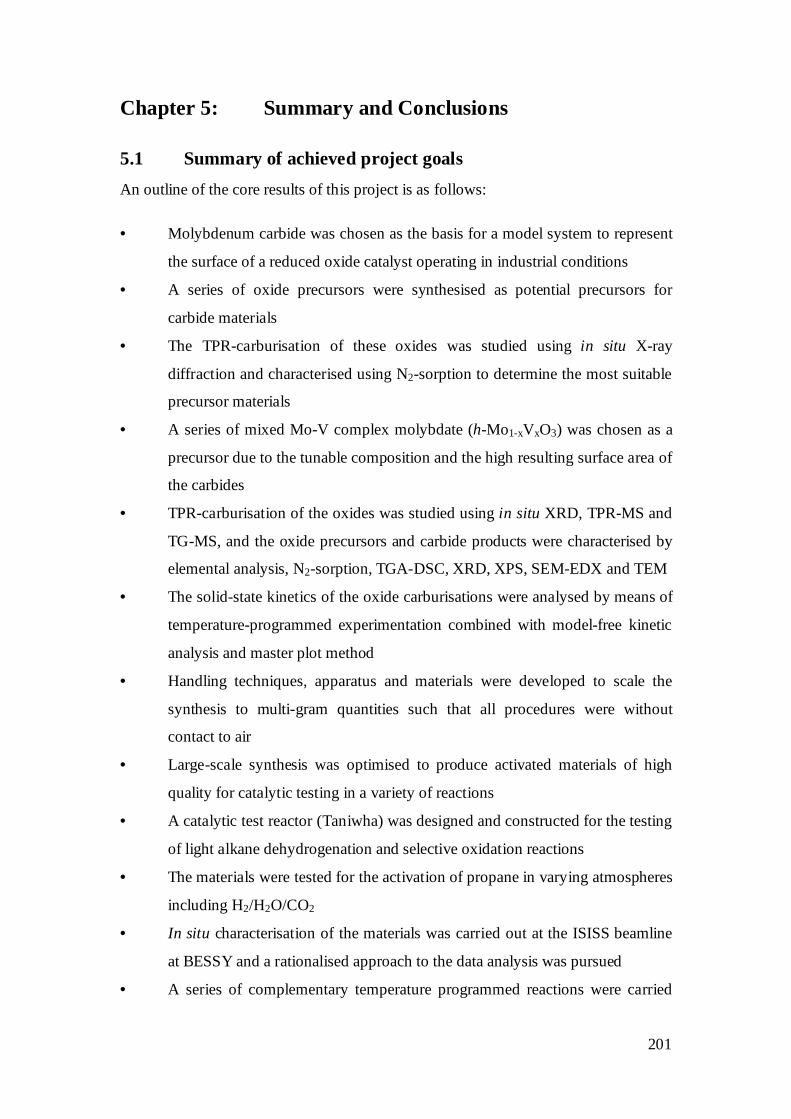
201
Chapter 5: Summary and Conclusions
5.1 Summary of achieved project goals
An outline of the core results of this project is as follows:
• Molybdenum carbide was chosen as the basis for a model system to represent
the surface of a reduced oxide catalyst operating in industrial conditions
• A series of oxide precursors were synthesised as potential precursors for
carbide materials
• The TPR-carburisation of these oxides was studied using in situ X-ray
diffraction and characterised using N2-sorption to determine the most suitable
precursor materials
• A series of mixed Mo-V complex molybdate (h-Mo1-xVxO3) was chosen as a
precursor due to the tunable composition and the high resulting surface area of
the carbides
• TPR-carburisation of the oxides was studied using in situ XRD, TPR-MS and
TG-MS, and the oxide precursors and carbide products were characterised by
elemental analysis, N2-sorption, TGA-DSC, XRD, XPS, SEM-EDX and TEM
• The solid-state kinetics of the oxide carburisations were analysed by means of
temperature-programmed experimentation combined with model-free kinetic
analysis and master plot method
• Handling techniques, apparatus and materials were developed to scale the
synthesis to multi-gram quantities such that all procedures were without
contact to air
• Large-scale synthesis was optimised to produce activated materials of high
quality for catalytic testing in a variety of reactions
• A catalytic test reactor (Taniwha) was designed and constructed for the testing
of light alkane dehydrogenation and selective oxidation reactions
• The materials were tested for the activation of propane in varying atmospheres
including H2/H2O/CO2
• In situ characterisation of the materials was carried out at the ISISS beamline
at BESSY and a rationalised approach to the data analysis was pursued
• A series of complementary temperature programmed reactions were carried
202
out to provide context to both the catalytic and in situ XPS experimentation
and compare the influence of oxidation state on reactivity
• A systematic characterisation study of the post catalytic materials was
performed in order to better understand the process of reduction/carburisation
in systems of high carbon potential
5.2 The synthesis of Mo/V carbides
A series of bimetallic Mo/V carbides was synthesised by carbothermal reduction of
corresponding h-(MoV)O3 mixed metal oxide precursors. The oxides were
synthesised by precipitation and the subsequent carbide phase development was
monitored using in situ XRD and outgas analysis of the TPR-carburisation. The
observed structural evolution is combined with analysis of the solid state kinetic data
and the reduction mechanism is discussed.
Inclusion of vanadium is observed to retard the onset of reduction as well as strongly
influencing the kinetics of oxide reduction. The reduction proceeds via a complex
mechanism involving initial formation of a suboxide MoO3-x which is subsequently
reduced to MoO2. Increasing the content of vanadium content retards the onset of the
overall reduction as well as the onset of carburisation in the step MoO2 → Mo2C.
Importantly it was noted that the carburisation of the oxide materials did not initiate at
the stoichiometric point MoO2 but rather at MoO~1.33. This is a clear indication of
either the existence of atomically reduced Mo0 or alternatively a suboxide of Mo such
as MoII or MoIII . However, by XRD no crystallographic phases are observed which
reflect species other than MoO2 and Mo2C. The formation of the substoichiometric
oxide lies clearly at the boundary point between the two and is best described as XRD
amorphous.
The carbides exhibit a trend in morphological growth with vanadium concentration
from a particulate-agglomerate material towards a densely packed, nano-fibrous
morphology.Transmission electron microscopy investigation of the fibrous material
using selected area electron diffraction (SAED) reveals that the high aspect-ratio
crystallites exhibit pseudomorphism, and in the case of the vanadium containing
materials, it is observed that there is some preferential orientation of crystal grains.
Characterisation of the materials by N2 adsorption reveals an increasing mesoporosity

203
associated with the fibrous morphology, as well as an exceptionally high surface area
(80–110m2/g).
The synthesis was subsequently scaled up from the in situ XRD preparation using a
specially adapted rotary furnace to perform the temperature-programmed reduction-
carburisation. By adapting the heating rate, gas flow and pre-treatment conditions it
was possible to produce carbide materials with comparable physical properties to
those obtained from the small scale. As a result, it was possible to synthesise Mo2C
materials in multi-gram quantities (5–15 g) with BET surface areas ranging from 50–
100 m2/g, among the highest values reported in literature.
The kinetics of reduction for the precursor oxides were investigated yielding insight
into the differences in mechanism between the oxide series. The observed TPR
profiles were in agreement with the findings of Ressler and Lalik and suggested that
the mobility of atomic oxygen in the lattice is affected by the back-exchange of
oxygen between MoVI and MoIV and that increasing the temperature of reduction
counter-intuitively leads to an increase in the apparent activation energy. The
inclusion of vanadium as a dopant was observed to modify this mechanism
considerably and it was noted that the onset of oxygen mobility, or reducibility, was
retarded significantly. Furthermore the competitive back-exchange of oxygen was
reduced resulting in a singular reduction mechanism which conformed to the Jander
model of 3-dimensional diffusion for oxygen in the lattice. Finally the onset of
reduction-carburisation for Mo(V)Ox → Mo(V)2C is seen to be delayed. It is unclear
if this is the result of structural inhibition or whether it is because of a more subtle
electronic effect. However, it was observed that vanadium inclusion was correlated
with a more uniform, evolved mesoporosity in the product carbide.
5.3 The reactivity of Mo/V carbides
In this chapter, mixed molybdenum-vanadium carbide catalysts are studied in the
activation of propane. The catalysts are tested in a plug flow reactor under reducing
conditions in order to maintain the phase composition and the influence of
temperature, surface oxidation, vanadium content and surface carbon deposition are
observed on the reaction network.
204
In the presence of H2/C3H8, Mo/V carbides are shown to catalyse the dehydrogenation
of propane to propylene with a selectivity which approaches 50%, as well as carrying
out the hydrogenolysis of propane to CH4 and C2H6 on apparently distinct catalytic
sites. Addition of H2O or CO2 as an oxidant to the feed greatly increases the yield and
selectivity of the dehydrogenation reaction (S > 90%), as well as introducing products
from the dry/steam reforming of propane and reverse water-gas shift. A strongly
favoured initial reaction pathway is via a hydrogenolysis-like mechanism. Upon
closer inspection, this mechanism is observed to comprise two aspects, one of
preferential methane formation and the other a surface recombination of alkyl
fragments resulting in the formation of Fischer-Tropsch-like products (C2–C4).
Depending upon the reaction temperature and surface oxidation state of the catalyst
the recombinative mechanism played a role in product formation. Vanadium was
observed to reduce the stability of the carbide to oxidation; in the case of O2 to α-
MoO3, and in the case of H2O and CO2, to MoO2. In the activation of propane,
vanadium increases the apparent activation energy for dehydrogenation and for
hydrogenolysis.
In a separate study into the reverse water-gas shift reaction, Mo2C is found to be an
efficient catalyst for the hydrogenation of CO2 with high selectivity to CO (> 90%).
The reaction went to equilibrium conversion even at very high space velocities over a
range of temperatures (GHSV > 200000, 500°C < T < 700°C).
In the temperature programmed reaction of h-Mo1-xVxO3 materials in H2-C3H8 it was
observed that the oxides were reduced to the fcc α-MoC1-x carbide with evidence of
carburisation occuring at much lower temperatures than observed for methane-
hydrogen mixtures. In these cases, the effect of vanadium was similarly seen to retard
the onset of reduction-carburisation but to a much lesser extent. Upon reduction the
catalytic activity was observed to increase dramatically and the selectivity evolved
with temperature mirroring the reduction state of the oxide.
Importantly from the results of this section we can see that the freshly prepared
carbide surface is not selective for dehydrogenation reactions at high temperatures.
However, with the addition of a small amount of oxygen derived from the reactant
gases, or residual in the structure, the passivated surface is quite selective to propane
dehydrogenation. The strongly oxophilic nature of the fresh carbide surface is

205
illustrated by the extremely fast rate observed for reverse water-gas-shift in which the
oxygen of CO2 is abstracted by the carbide surface and subsequently reduced to H2O.
As seen in the steam-moderated dehydrogenation of propane, the temperature at
which the chemisorbed oxygen is reduced to form the carbide is a function of the
temperature and chemical potential of the gas atmosphere. Below this critical point,
oxygen is irreversibly chemisorbed to the carbide altering the surface potential.
5.4 Characterisation of Mo/V carbides
Using Raman microscopy, adventious carbon was observed to form on the surface of
the catalyst which selectively blocked sites which were active for the
hydrogenolysis/cracking of propane to lighter molecules. The nature of the carbon
species was dependent upon the reaction conditions and was found to evoke a higher
sp2 character (less amorphous) with a co-oxidant feed (H2O, CO2).
From ex situ XPS of the freshly prepared carbides the oxy-carbidic nature of the
surface layer is apparent and it is also observed for the V-containing materials that the
surface layer is enriched with vanadium in the form of V=O. Results of in situ XPS
experimentation reveal a strong dependency of the catalytic activity with the surface
oxidation state of the carbide. Dehydrogenation of propane was observed to increase
with an increasing oxidation state whereas formation of C2 and C4 products is
favoured by an increased electron density at the Fermi edge. No formation of
adventitious carbon was observed.
The comparison of carbide catalysts before and after reaction shows evidence of
considerable surface rearrangement and carbon deposition. Selected area electron
diffraction (SAED) of the freshly prepared carbides is indicative of hcp β-Mo2C with
agglomerated crystallite morphology. After reaction the catalysts are observed to be
quite heterogeneous with regards to carbon deposition and structural rearrangement.
The SAED reveals a mixture of hcp β-Mo2C as well as the presence of fcc α-MoC1-x
however, the powder XRD shows only β-Mo2C.
Post-mortem analysis of the oxide precursors after TPR in H2/C3H8 using XRD and
TEM shows primarily fcc α-MoC1-x structured Mo/V carbide with extensive carbon
deposition as both graphitic overlayers and carbon-rich carbidic phases. The carbide
crystallites are in many cases elongated needle-like structures and show preferred

206
orientation, similar to that seen in the case of methane-carburisation. The dispersed
nature of the crystallites within a matrix of graphitic carbon suggests interplay of
carbon deposition and carburisation during the formation leading to a distinctive
structure which is mesoporous in appearance. The observed voids in this structure are
mosy likely carbon rich spaces which maintain the pore structure and prevent
sintering of the particles.
5.5 Conclusions
From a variety of different methods and experiments I have tried to draw together a
picture of reactivity for a broadly defined system of molybdenum-based oxides and
carbides in reductive, carbonaceous atmospheres.
From the temperature programmed reduction-carburisation study it is clear that
vanadium plays an important role in such oxide structures even in very low
concentrations. The doped carbides were seen to have an exceptional morphology and
surface area with the addition of only 3% V (metals basis). These qualitative findings
are backed up the solid-state kinetic analysis which shows a strong influence of the
vanadium dopant via modification of oxygen mobility in the lattice. This ‘oxygen
mobility’ is evidenced by the higher observed activation energy of reduction-
carburisation and is also observed in the V EEL spectra which shows that the
vanadium is primarily present as a V=O like species. It can also be interpreted on an
electronic basis; the conduction mechanism of MoO2 relies upon a Peierls distortion
of co-planar MoO2 units. This mechanism not exceptional but it certainly seems likely
that the presence of vanadium could inhibit such a regular distortion, reducing the free
electron density. This reduced density of free electrons would prevent the early
decomposition of CH4, resulting in more distinct stepwise reduction and then
carburisation.
These hypotheses are supported with respect to the temperature-programmed reaction
of the oxide precursors in propane. It is observed that the V-containing materials are
delayed in their reduction and subsequently are not as active for the hydrogenolysis of
propane to CH4. At this point we must admit that the understanding of the system is
not complete because with respect to the catalytic dehydrogenation of propane, it was
observed that vanadium doping increased the initial conversion of propane but

207
decreased selectivity to propylene. It was observed in this case that the precarburised
Mo/V materials were more active to hydrogenolysis with increasing V content.
In soft-oxidative feeds (CO2, H2O) the carbide surface is oxidised, promoting the
dehydrogenation reaction. Notably, Mo2C is an excellent catalyst for the
hydrogenation of CO2 via reverse water-gas shift reaction. In situ XPS experiments
correlate propane dehydrogenation activity with an oxycarbide surface modification
and recombinative hydrocarbon formation products are observed in concert with clear
changes in the valence band spectra. Post-mortem analyses of the catalysts by
transmission electron microscopy reveal significant surface and bulk restructuring as
well as the recrystallisation of metastable phases and inhomogeneous bloating of the
structure by carbonaceous material.
Vanadium is proposed to exert a stabilising influence due to its strongly oxophilic
nature, resulting in the formation of V=O moieties which kinetically hinder the
mobility of oxygen and carbon through the oxide/carbide lattice. The resulting higher
initial activity for propane activation is attributed to the increased activity of sites
selective to hydrogenolysis. Hexagonal (Mo/V)2C is proposed to be a reasonable
model for bronze-like multi-metal oxide catalysts in propane activation. This is
because the dynamic recrystallisation of hcp Mo2C to metastable fcc MoC1-x under
reaction conditions, and the interchangeability of the reactivities of these materials,
renders an equivalence by which the surface structure is controlled principally by the
chemical potential of the reaction atmosphere.
With respect to the multi-metallic oxide MoVTe system for the selective oxidation of
propane to acrylic acid the following statements can be made:
1. The carburisation of Mo/V oxides under the influence of methane/hydrogen
proceeds at a considerably higher temperature (570–600°C) than the operating
temperature for selective oxidation (350–400°C).
2. However, when propane is used as a carbon source, the beginning of
carburisation, as indicated by the observation of reformate CO, is at the
considerably lower temperature of ~450°C. This temperature, although higher
than the operational temperature of MoVTe, is not unimaginable in an
exothermic reaction at high conversion.

208
3. The bulk is observed to persist under the conditions of steam or CO2 and the
reactivity observed is consistent with that observed over an oxycarbidic
surface.
4. The high activity of carbide/oxycarbide surfaces towards steam reforming and
reverse water-gas shift result in a high selectivity of CO with respect to CO2.
This pattern of reactivity is also observed in the MoVTeOx system and these
processes provide a possible explanation for this preferential selectivity which
is not easily explained by the current models.
5. In the selective oxidation of propane over MoVTeOx catalysts it is observed
that the secondary oxygenate product is acetic acid, a C-2 compound. In
addition to this, under some conditions maleic anhydride is observed in the
reaction outlet. The formation of these C-2 and C-4 oxygenates is not
discussed in the literature and it is difficult to understand their presence in the
framework of the current understanding. In the reduced carbide/oxycarbide
system, a similar distribution of C-2 and C-4 hydrocarbons is observed due to
recombinative formation from alkyl/alkylidene fragments on the surface of the
catalyst.
6. If we consider catalysis to be predominantly a surface phenomenon the
implication is that only the uppermost layer of atoms participates in the
reaction. As we go from methane → propane → propylene → acrylic acid the
potential of carbon in the system increases greatly and considering a number
other factors such as the surface adsorption it is conceivable that the formation
of a surface carbide may take place at considerably lower temperatures than
would otherwise be predicted.
The above considerations alone do not implicate carbidic or oxycarbidic species as
contributing to the reactivity in selective oxidation catalysis but they do present an
alternative mechanistic pathway whereby such byproducts can be rationalised.
Although a great deal of work has been done to bring selective oxidation catalysis to
the point at which it is at today there is still a large gap of understanding in our way to
the rational design of catalysts for such processes.

209

210

211
Appendix A: Acknowledgements for permission to reprint
published material
• Figure 1.2 is reprinted from Journal of Catalysis, Vol. 180, J.B. Claridge,
A.P.E. York, A.J. Brungs, C. Marquez-Alvarez, J. Sloan, S.C. Tsang, and
M.L.H. Green, New catalysts for the conversion of methane to synthesis gas:
Molybdenum and tungsten carbide, pp. 92, Copyright (1998), with permission
from Elsevier
• Figure 3.4 is reprinted from Journal of Catalysis, Vol. 165, F. Solymosi, J.
Cserényi, A. Szöke, T. Bánsági, A. Oszkó, Aromatization of Methane over
Supported and Unsupported Mo-Based Catalysts, pp. 155, Copyright (1997),
with permission from Elsevier
• Figure 3.5 is reprinted from Industrial & Engineering Chemistry Research,
Vol. 33, E. A. Blekkan, P. H. Cuong, M. J. Ledoux, J. Guille, Isomerization of n-
Heptane on an Oxygen-Modified MolybdenumCarbide Catalyst, pp. 1663,
Copyright (1994), with permission from the American Chemical Society
• Figures 3.6 & 4.1 are reprinted from Journal of Organometallic Chemistry,
Vol. 691, M. Siaj, I. Temprano, N. Dubuc, P. H. McBreen, Preparation and
olefin-metathesis activity of cyclopentylidene-oxo initiator sites on a
molybdenum carbide surface, pp. 5501, Copyright (2006), with permission from
Elsevier
• Figure 3.7 is reprinted from Langmuir, Vol. 14, G. F. Wu, B. Bartlett, W. T.
Tysoe, Surface and Catalytic Chemistry of Small Hydrocarbons on Oxidized
Molybdenum, pp. 1441, Copyright (1998), with permission from the American
Chemical Society
• Figure 4.2 is reprinted from Langmuir, Vol. 14, G. F. Wu, B. Bartlett, W. T.
Tysoe, Surface and Catalytic Chemistry of Small Hydrocarbons on Oxidized
Molybdenum, pp. 1437, Copyright (1998), with permission from the American
Chemical Society
• Figure 4.3 is reprinted from Catalysis Today, Vol. 23, P. Delporte, F. Meunier,
C. Phamhuu, P. Vennegues, M. J. Ledoux, J. Guille, Physical Characterization
of Molybdenum Oxycarbide Catalyst - TEM, XRD and XPS, pp. 261–262,
Copyright (1995), with permission from Elsevier

212
• Figure 4.4 is reprinted from Zeitschrift für Anorganische und Allgemeine
Chemie, Vol. 630, D. Wang, D. S. Su, R. Schlögl, Electron Beam Induced
Transformation of MoO3 to MoO2 and a New Phase MoO, pp. 1009, Copyright
(2004), with permission from John Wiley and Sons
• Figure 4.5 is reprinted from Dalton Transactions, Vol. 92, A. Gulino, S.
Parker, F. H. Jones, R. G. Egdell, Influence of metal-metal bonds on electron
spectra of MoO2 and WO2, pp. 2139, Copyright (1996), with permission from the
Royal Society of Chemistry
• Figure 4.6 is reprinted from The Journal of Physical Chemistry C, Vol. 114, D.
O. Scanlon, G. W. Watson, D. J. Payne, G. R. Atkinson, R. G. Egdell, D. S. L.
Law, Theoretical and Experimental Study of the Electronic Structures of MoO3
and MoO2, pp. 4641, Copyright (2010), with permission from the American
Chemical Society
• Figure 4.7 is reprinted from Journal of Physics C — Solid State Physics, Vol.
16, F. Werfel, E. Minni, Photoemission-Study of the Electronic-Structure of Mo
and Mo Oxides, pp. 6093, Copyright (1983), with permission from the Institute
of Physics
• Figure 4.8 is reprinted from Carbon, Vol. 43, A. Sadezky, H. Muckenhuber, H.
Grothe, R. Niessner, U. Pöschl, Raman microspectroscopy of soot and related
carbonaceous materials: Spectral analysis and structural information, pp. 1737,
Copyright (2005), with permission from Elsevier
• Figure 4.16 is reprinted from Practical Surface Analysis by Auger and X-ray
Electron Spectroscopy, ISBN 0-471-26279-x, M. P. Seah, D. Briggs, Figure 5.5,
Copyright (1983), with permission from John Wiley and Sons

213

214

215
List of Figures
Chapter 1
Figure 1.1: Schematic diagram of a partial oxidation reactor at high conversion. ........ 3
Figure 1.2: crystallographic views of the structures of; (left) orthorhombic α-Mo2C
and (right) fcc α-MoC1-x. Note that α-MoC1-x displays a Mo:C stoichiometry of 1:1
and represents all possible positions for interstitial carbon in the structure. ................ 12
Figure 1.3: From left, crystallographic representations of: α-MoO3, MoO2, and β-
Mo2C. ................................................................................................................................ 13
Figure 1.4: Effect of GHSV on the stability of the Mo2C catalyst at 1123K and 1 bar.
Open symbols = χCO2; closed symbols = χCH4. GHSV (h-1):○ — 1.91 x 10³; □ — 3.97
x 103; ∆ — 6.36 x 10³; ◊ — (1.91 x 10³ + Ar = 8.79 x 10³). Reprinted from [72] with
the permission of Elsevier................................................................................................ 18
Chapter 2
Figure 2.1: Titration curves for 1M (metals basis) AHM (blue) and AHM/AMT (red)
solutions at 75°C. ............................................................................................................. 34
Figure 2.2: A typical LABMAX protocol for the synthesis of h-Mo1-xVxO3. .............. 35
Figure 2.3: Temperature program for in situ XRD studies. ........................................... 36
Figure 2.4: (left) ‘Hindenburg’ rotary furnace used for upscaled synthesis of (Mo1-
xVx)2C. (right) Custom-designed flanges for air-free reactor transfer. ......................... 37
Figure 2.5: Crystal structure of K0.13Mo0.87V0.13O3 as decribed by Darriet and Galy.[35]
........................................................................................................................................... 40
Figure 2.6: (a) TGA-DSC traces for the oxidative degradation (h-MoO3 → α-MoO3)
of precursor oxides 0Vox and 8Vox. (b) X-ray diffraction patterns of the precursor
oxides (0Vox-11Vox) between 25° < 2θ < 27° illustrating the divergence of
overlapping peaks with increasing V content. ................................................................ 41
Figure 2.7: (a) Rietveld refinement for 8Vox; (b) ‘a’ parameter vs. V content as
calculated for the phases H1 and H2 (c) ‘c’ parameter vs. V content as calculated for
the phases H1 and H2 ....................................................................................................... 43

216
Figure 2.8: Scanning electron micrographs of the hexagonal oxides 0Vox, 3Vox,
8Vox & 11Vox. ................................................................................................................ 44
Figure 2.9: Normalised powder X-ray diffractograms of the product carbides Rc, 0Vc
– 11Vc measured at T = 25°C. ........................................................................................ 47
Figure 2.10: Evolution of in situ XRD patterns during the temperature programmed
reaction under He-H2-CH4. (a) Rox → Rc; (b) 0Vox → 0Vc; (c) 3Vox → 3Vc; (d)
5Vox → 5Vc; (e) 8Vox → 8Vc; (f) 11Vox → 11Vc. ................................................... 48
Figure 2.11: Contrast plot of the normalized √Intensity vs. temperature over the
phase evolution of R, 1, 3 & 5 from MoO3 → (Mo4O11) → MoO2 → Mo2C. The
outlined areas emphasise the observed phase changes in the h-Mo(V)O3 reduction-
carburisation. .................................................................................................................... 49
Figure 2.12: In situ XRD scan of h-MoO3 (0Vox) TPR-carburisation at 375°C
showing intermediate o-Mo4O11 phase. .......................................................................... 50
Figure 2.13: Temperature-programmed reduction-carburisation profiles of the
normalized H2O (m/z = 18) signal for h-Mo1-xVxO3...................................................... 52
Figure 2.14: Extent of reduction vs. temperature at different heating rates for: (a) α-
MoO3, (b) 0Vox and (c) 8Vox. ........................................................................................ 53
Figure 2.15: (a) TPR-carburisation profiles at 1°C/min showing the reduction MoO2
→ Mo2C. Extent of reduction is indicated on the y-axis (MoO3 = 0%; MoO2 = 33%;
Mo2C = 100%). (b): Consumption of CH4 (m/z = 15) vs. temperature at 1°C/min. (c):
Evolution of CO (IR signal) vs. temperature at 1°C/min. Note – some data points are
omitted for clarity. ............................................................................................................ 55
Figure 2.16: (a) Normalised MS signals (CO, H2O) for the TPR-carburisation of oxide
precursors at 1°C/min. (b) Calculated extent of reduction (α) for above conditions... 58
Figure 2.17: Friedmann analysis of TPR-carburisation for α-MoO3, 0Vox, 3Vox &
8Vox showing the two steps of reduction-carburisation — (1) & (2). ......................... 59
Figure 2.18: Ozawa-Flynn-Wall analysis of the TPR-carburisation as in Figure 2.16.
The extent of reaction is redefined as α’ = 0.5 α which gives α’ 0.66 → MoO2............ 60
Figure 2.19: Comparison of rate data calculated using ‘generalised time’ derived from
conversion-dependent activation energies derived from the Ozawa-Flynn and Wall
analysis for the reduction-carburisation of h-Mo(V)O3 oxide precursors. ................... 63
Figure 2.20: Differentiated plot of Figure 2.19 showing the beginning of the
mechanism MoO3-x → MoO2. ......................................................................................... 64

217
Figure 2.21: Master plot comparisons of the temperature-programmed reduction
(MoO3-x → MoO2) of h-Mo(V)O3 type oxides at various heating rates. (a) h-MoO3
(0Vox); (b) h-Mo0.97V0.03O3 (3Vox); (c) h-Mo0.92V0.08O3 (8Vox)................................. 65
Figure 2.22: Above: comparison of N2 adsorption-desorption isotherms for samples
0Vc – 11Vc. Below: BJH (Barett-Joyner-Halenda) approximation of pore size
distributions for samples 0Vc – 11Vc. ............................................................................ 68
Figure 2.23: SEM images of the carburised materials Rc, 0Vc–11Vc ......................... 69
Figure 2.24: TEM image of 8Vc with low magnification image (inset top right) and
spot diffraction pattern applied over a large area (inset bottom right).......................... 71
Figure 2.25: STEM-HAADF image of 8Vc combined with EDX-elemental maps for
V, Mo, C and O showing a statistical distribution of elements within the sample. ..... 71
Figure 2.26: SEM micrographs of (Mo1-xVx)2C. ............................................................ 72
Figure 2.27: (above) SAED of spot showing hcp Mo2C structure for (Mo0.92V0.08)2C
(8447); (below) HR-TEM image showing individual crystallites with observed slip
plane. ................................................................................................................................. 74
Figure 2.28: View of α-MoO3 looking down the (100) plane at the interlayer spacings.
........................................................................................................................................... 75
Chapter 3
Figure 3.1: Illustration of a partial oxidation reactor operating at high oxygen
conversion ......................................................................................................................... 85
Figure 3.2: Detail of MoV(Nb)TeOx - M1 structure as viewed down the c-axis.
Coloured octahedrons represent non-equivalent metal positions. Nb preferentially
occupies pentagonal-bipyramidal sites; Te is preferentially bound asymmetrically in
the hexagonal channels (yellow).[21]................................................................................ 87
Figure 3.3: Representation of h-MoO3 complex molybdate structure as viewed down
the c-axis. Channels are partially occupied by stabilising mono-cationic species from:
Na+, K+, Rb+, NH4+, H3O
+.[27-29] Molybdenum may be substituted by vanadium up to
13% (metal basis).[30-32] .................................................................................................... 88
Figure 3.4: Behaviour of methane with time on stream over Mo2C at 700°C —
reprinted from [42] with permission from Elsevier. ......................................................... 91

218
Figure 3.5: Metallacyclobutane intermediate mechanism of heptane isomerisation —
reprinted from [69] with permission from the American Chemical Society. ................. 94
Figure 3.6: (a) Illustration of carbonyl bond scission to form a surface oxo-alkylidene
complex on Mo2C. (b) Complementary organometallic mechanism for a tungsten
complex. Reprinted from [89] with permission from Elsevier. ....................................... 96
Figure 3.7: (left) methane yield from low temperature desorption experiments versus
oxygen coverage over Mo(100). (Right) - observed recombinative hydrocarbon
formation over oxygen modified Mo(100). Metathesis activity is defined as the rate of
ethylene and butene formation — reprinted from [97] with permission from the
American Chemical Society. ........................................................................................... 97
Figure 3.8: A schematic diagram of olefin TPD over oxygen-modified Mo: (a)
Dissociative formation of M=CH2 species over metallic Mo combined with C-C and
C-H bond scission. CH4 is formed from alkyl chains; (b) formation of less tightly
bound M···:CH2 species with surface recombination and CH4 formation — most
active recombinative surface; (c) at low temperatures over MoO surface, non-
dissociative adsorption-desorption. ................................................................................. 99
Figure 3.9: Graphical layout of the ‘Taniwha’ catalytic reactor system.....................101
Figure 3.10: Schematic diagram of U-tube reactor (not to scale) with temperature
profile mapped over catalyst bed (yellow). Temperature — 400°C; 100 sccm He. ..102
Figure 3.11: Propylene formation rates for: □ = no pre-reduction, ∆ = 500°C pre-
reduction, ○ = 675°C pre-reduction. Conditions, (a) inert conditions, (b) O2 addition,
(c) steam addion. Inset: post-mortem powder XRD of the catalyst (final patterns are
the same for different pre-treatments). ..........................................................................107
Figure 3.12: Activation of propane carried out at 500°C with WHSV = 5000 ml g-1h-1
over fresh Mo2C (#8425, transferred from glovebox) and passivated Mo2C (#9450).
.........................................................................................................................................110
Figure 3.13: (a) Effect of increasing vanadium content on the conversion and rate of
propene formation; T = 550°C under H2/C3H8/N2 at 5000 ml g-1 h-1. (b): Comparison
of S(C3H6) vs. S(CH4); conditions as above. ................................................................113
Figure 3.14: (a) Total conversion of propane vs. time at T = 500 & 550°C over fresh
Mo2C (#8425) and (Mo0.92V0.08)2C (#8447). Inset: Propene formation rate at T = 500
& 550°C for #8425. (b) S(C3H6) for #8425 & #8447 at T = 500, 550°C. (c): ratio of
S(C2H6)/S(CH4) at varying conditions. .........................................................................114

219
Figure 3.15: Apparent activation energies over 400 - 600°C derived from Arrhenius
plots for: (a) apparent rate of propane consumption; (b) propene formation; (c)
methane formation (500–600°C) — inset: non-linear behaviour observed for Ea[2]..115
Figure 3.16: (a) Bar plot of formation rates for observed products in steady state
H2/C3H8/N2 over Mo2C (#9450). (b) Selectivity-conversion plot for observed
products. ..........................................................................................................................117
Figure 3.17: (a) Conversion and C3H6 rate plots over time for steam/H2 propane
activation over Mo2C (#9450) at 500, 550 & 600°C. (b) Selectivity evolution with
time on stream at 550°C.................................................................................................120
Figure 3.18: Arrhenius plot of ln(product formation rates) vs. 1/T for steam/H2
activation of propane over Mo2C (#9450) at steady-state for 460°C < T < 540°C.
Region of linearity is shaded. ........................................................................................121
Figure 3.19: Variation of space velocity in steam/H2 propane activation over Mo2C
(#9450) — product formation rates...............................................................................121
Figure 3.20: Conversion and rate of C3H6 formation for steam/H2 propane activation
over Mo2C (#9450) and (Mo0.89V0.11)2C at T = 550°C. ...............................................122
Figure 3.21: Post-catalytic X-ray powder diffraction patterns for steam/H2 activation
of propane at different temperatures over Mo2C (#9450) and (Mo0.89V0.11)2C (#8754).
Phase composition: ♦ — Mo2C (hcp), ● — MoO2 (monoclinic). ...............................122
Figure 3.22: Initial selectivity, conversion and propylene formation rate of
CO2/C3H8/H2 over Mo2C (#9450) at 550°C. COx is excluded due to conflicting
carbon-sources. ...............................................................................................................123
Figure 3.23: RWGS at WHSV = 5000 ml/gh over Mo2C (#9450) after carburisation in
situ. ..................................................................................................................................124
Figure 3.24: RWGS over Mo2C (#8425) at GHSV = 220000 .....................................125
Figure 3.25: Product formation rates for temperature-programmed reaction of
H2/C3H8 over h-MoO3. ...................................................................................................126
Figure 3.26: Gas chromatographs of C1, C2 and C4 products at increasing
temperatures. ...................................................................................................................127
Figure 3.27: Temperature-programmed reduction of h-Mo1-xVxO3 under H2/C3H8/N2
(55/25/20) at WHSV = 5000 ml/gh. ■ — h-MoO3 (#8650); ■ — h-Mo0.97V0.03O3
(#6702); ■ — h-Mo0.92V0.08O3 (#7911); ■ — h-Mo0.89V0.11O3 (#6601) ....................128
Figure 3.28: Post-mortem XRD patterns of TPR oxides after H2/C3H8/N2 to 600°C 129

220
Figure 3.29: Summary of propane reactions over Mo2C with respect to phase stability
and surface carbon. .........................................................................................................130
Figure 3.30: Schematic for propane reactivity over deactivated Mo2C. Type 1 = alkyl-
recombinative site; Type 2 = dehydrogenation site; Type 3 = weak hydrogenolysis
site; Type 4 = strong hydrogenolysis site. ....................................................................133
Chapter 4
Figure 4.1: The Chauvin mechanism for metathesis shown for propylene attack over a
cyclopentylidene functionalised carbene site — reprinted from [9] with the permission
of Elsevier. ......................................................................................................................150
Figure 4.2: Plot illustrating propylene metathesis over MoO2; two different
mechanisms of ethylene/butylene formation depending on temperature — reprinted
from [14] with the permission of The American Chemical Society. ............................151
Figure 4.3: Proposed mechanism of formation of a shear plane in α-MoO3 via: (a)
reorganization of the oxygen vacancies in the (010) plane; (b) reorganization of layers
in the (100) plane — adapted from [19] with the permission of Elsevier.....................153
Figure 4.4: 'MoO' cubic phase formed by radiolytic mechanism under electron beam.
Reprinted from [29] with the permission of John Wiley and Sons. ..............................154
Figure 4.5: (a) Schematic representation of the rutile structure showing the Peierls
distortion allowing metallic bonding in MoO2. (b) origin of orbital overlaps for σ, π
& δ states. (c) schematic energy level diagrams for MoO2 without and with π−π
interactions — reprinted from [45] with the permission of The Royal Chemical Society.
.........................................................................................................................................156
Figure 4.6: MoO2 multiplet splitting — reprinted from [47] with the permission of the
American Chemical Society. .........................................................................................157
Figure 4.7: Mo3d peak structures — reprinted from [33] with the permission of the
Insitute of Physics. .........................................................................................................158
Figure 4.8: The decomposition of Raman D and G bands — reprinted from [48] with
the permission of Elsevier..............................................................................................159
Figure 4.9: In situ Raman cell design for the dehydrogenation of propane. ..............160
Figure 4.10: Raman spectra of freshly prepared carbides............................................163
Figure 4.11: Raman spectra of Mo2C after treatment in C3H8/H2 at 550°C. ..............165

221
Figure 4.12: Raman spectra of Mo2C after treatment under various atmospheres at
550°C...............................................................................................................................165
Figure 4.13: Raman spectra showing D and G band peak fitting for Mo2C treated
under: (a) C3H8/H2/CO2, (b) C3H8/H2/N2 at 550°C. .....................................................166
Figure 4.14: In situ Raman experiment. Figure (a): relative product formation rates
over time; (b) Raman spectra showing evolution of D and G bands from carbon
deposition. T = 500°C, C3H8/H2/N2 = 20/55/25, total flow = 20 sccm. ......................168
Figure 4.15: Mo3d XP spectra of as prepared Mo2C (#8425) at: (a) 200 eV kinetic
energy; (b) 600eV kinetic energy. .................................................................................170
Figure 4.16: The ‘Universal Curve’ for determining the inelastic mean free path of
electrons through a solid — reprinted from [51] with the permission of John Wiley and
Sons. ................................................................................................................................171
Figure 4.17: C1s spectra of (Mo1-xVx)2C at (a) 150 eV (b) 600 eV. ...........................172
Figure 4.18: Variation of surface composition of freshly prepared carbide with respect
to vanadium content. ......................................................................................................173
Figure 4.19: V2p edge of (Mo1-xVx)2C catalysts. .........................................................174
Figure 4.20: In situ XPS of Mo2C before and after H2 treatment recorded at KE =
200eV. .............................................................................................................................175
Figure 4.21: In situ XPS of Mo2C (#10000) — (a) normalised product formation rate
over time on stream under H2/C3H8/CO2 (2:1:1); (b) evolution of O1s peak with time
on stream. ........................................................................................................................176
Figure 4.22: In situ XPS of Mo2C - evolution of Mo3d multiplet peak with time on
stream under C3H8/H2/He (2:1:1). (a) t = 00:50, (b) t = 01:57, (c) t = 03:21, (d) t =
04:45, (e) t = 05:52, (f) t = 10:41. .................................................................................178
Figure 4.23: In situ XPS — (a) Mo species over time as determined by Mo3d peak
areas. (b) Stacked area plot of oxidation states overlaid with selected relative product
distributions. ...................................................................................................................180
Figure 4.24: In situ XPS — (a) valence band spectra of #10000 over time on stream.
(b) Plot of cross sections taken from 0.5, 1.5 & 2.5 eV from the Fermi edge compared
with normalised rates of C2H4 and C4H8.......................................................................181
Figure 4.25: TEM images of 11004 — post mortem sample of Mo2C after H2/C3H8
treatment. ........................................................................................................................183
Figure 4.26: SAED of 11004 showing α-MoC1-x phase reconstruction. ....................184

222
Figure 4.27: TEM micrograph of EDX area for (Mo0.92V0.08)2C (#10996). ...............185
Figure 4.28: Graphic representation of EDX spectra as received for Figure 4.27 with
reference. .........................................................................................................................186
Figure 4.29: EELS spectra of (Mo0.92V0.08)2C (#10996). The major energy edges are
assigned to Mo-Medge, C K-edge and V L-edge.........................................................186
Figure 4.30: Post-TPR h-Mo0.89V0.11O3 (#11211) showing pseudomorphism. ..........187
Figure 4.31: SAED of h-Mo0.97V0.03O3 (11197) post TPR under H2/C3H8 showing hcp
carbide phase. .................................................................................................................188
Figure 4.32: SAED of h-Mo0.89V0.11O3 (11211) post TPR under H2/C3H8 showing fcc
carbide phase. .................................................................................................................188
Figure 4.33: SAED of h-Mo0.89V0.11O3 (11197) post TPR under H2/C3H8 showing
MoO2 phase. ...................................................................................................................189
Figure 4.34: (left) STEM-HAADF image of post-TPR h-Mo0.89V0.11O3 (#11211)
showing fibrous structure. (Right): TEM image of same. ...........................................190
Figure 4.35: EDX spectra of a selected area of post-TPR h-Mo0.97V0.03O3 (#11197)191
Figure 4.36: STEM-HAADF micrograph of particle in Figure 4.35 (upside down)
showing elemental distribution......................................................................................191
Figure 4.37: Vanadium EELS spectra of post-TPR h-Mo0.97V0.03O3 (#11197).
Reference EEL spectra in lower right reprinted with the permission of Willinger.[56]
.........................................................................................................................................192
Figure 4.38: Mo2C surface model. ................................................................................193
Figure 4.39: detail from in situ XPS experiment of C3/H2/He over Mo2C (Figure
4.23).................................................................................................................................194