The prenatal expression of mRNA and protein of the prion protein ...
146
Institut für Tierwissenschaften, Abt. Tierzucht und Tierhaltung der Rheinischen Friedrich – Wilhelms – Universität Bonn The prenatal expression of mRNA and protein of the prion protein gene, PRNP, in sheep I n a u g u r a l – D i s s e r t a t i o n zur Erlangung des Grades Doktor der Agrarwissenschaft (Dr. agr.) der Hohen Landwirtschaftlichen Fakultät der Rheinischen Friedrich – Wilhelms – Universität zu Bonn vorgelegt am 23. November 2006 von Patama Thumdee aus Nakhon Ratchasima, Thailand
-
Upload
khangminh22 -
Category
Documents
-
view
3 -
download
0
Transcript of The prenatal expression of mRNA and protein of the prion protein ...

Institut für Tierwissenschaften, Abt. Tierzucht und Tierhaltung
der Rheinischen Friedrich – Wilhelms – Universität Bonn
The prenatal expression of mRNA and protein of the prion protein gene, PRNP,
in sheep
I n a u g u r a l – D i s s e r t a t i o n
zur Erlangung des Grades
Doktor der Agrarwissenschaft
(Dr. agr.)
der
Hohen Landwirtschaftlichen Fakultät
der
Rheinischen Friedrich – Wilhelms – Universität
zu Bonn
vorgelegt am 23. November 2006
von
Patama Thumdee
aus
Nakhon Ratchasima, Thailand

Diese Dissertation ist auf dem Hochschulschriftenserver der ULB Bonn
http://hss.ulb.uni-bonn.de/diss_online elektronisch publiziert
E-mail: [email protected]
© Universitäts- und Landesbibliothek Bonn
Landwirtschaftliche Fakultät - Jahrgang 2007
D 98
Referent: Prof. Dr. K. Schellander
Korreferent: Prof. Dr. B. Schmitz
Tag der mündlichen Prüfung: 23 Februar 2007

Dedicated to my beloved parents and all members of my family


Die pränatale Expression der mRNA und des Protein vom Prion-Proteingen PRNP
beim Schaf
Die Expression des Prion-Protein (PRNP) Gens wurde auf den Ebenen mRNA und
Protein in den Geschlechtsorganen des weiblichen Schafs sowie verschiedenen
Geweben von Schafsföten unterschiedlicher Trächtigkeitsstadien untersucht.
Reproduktive Organe wie Ovar, Eileiter, Endometrium, Myometrium und Karunkel
wurden während dem ersten, dritten und fünften Trächtigkeitsmonat beprobt. Im ersten
Monat der Entwicklung wurde der gesamte Fötus beprobt, beim zweimonatigen Fötus
wurden Proben von Gehirn, Kotyledonen, Herz, Darm, Niere, Leber, Lunge und Muskel
entnommen. Bei den drei und fünf Monate alten Föten wurden zusätzlich Proben von
Rückenmark und Gehirn entnommen. Die Schafe wurden anhand ihrer PRNP
Genotypen in die Kategorien resistent gegen (R1) oder anfällig für (R5) Scrapie
eingestuft. In beiden Genotypgruppen konnten die Gentranskripte in allen Stadien und
allen untersuchten Geweben mit einer RT-PCR nachgewiesen werden. Das Profil der
Genexpression der R1 und R5 Gruppen war ähnlich. Der Vergleich der reproduktiven
Organe zeigte das höchste Expressionslevel im Karunkelgewebe der Mutterschafe,
während das Level im Gehirn hoch und in der Leber der Feten niedrig war. Zusätzlich
wurde eine Real-Time RT-PCR in unreifen Oozyten, reifen Oozyten, in vivo
Embryonen zum Morulastadium und in einmonatigen Föten durchgeführt. Die
Ergebnisse zeigten, dass das relative Expressionslevel der PRNP mRNA in reifen
Oozyten und Embryonen im Morulastadium signifikant niedriger war als in unreifen
Oozyten und einmonatigen Föten (p≤0,05). Fluoreszenz in situ Hybridisierung von
adulten Ovarien und einmonatigen Föten wies die Gentranskripte in Oozyten,
Granulosazellen, Thekazellen, Ovarrinde, Ovarmark und Gelbkörpern der Ovarien und
im Gehirn, Wirbelsäule, Dermatom, Herz, Leber und Niere der Feten beider Gruppen
nach. Eine Westernblot-Analyse zeigte die zu PrPC korrespondierenden immunreaktiven
Banden in allen weiblichen Reproduktionsgeweben ebenso wie in den einmonatigen
Föten. Das PrPC wurde ebenfalls in allen Geweben des zweimonatigen Fötus gefunden.
Zusätzlich implizierte die immunohistochemische Färbung die Lokalisation des PrPC in
Gehirn, Herz und Niere des einmonatigen Fötus. Das PrPC wurde in dieser
Untersuchung ebenfalls in beiden Gruppen in der Rinde und im Mark des Ovars jedoch
nicht in Oozyten, Granulosazellen, Thekazellen und Gelbkörpern nachgewiesen.

The prenatal expression of mRNA and protein of the prion protein gene, PRNP,
in sheep
The expression of the prion protein gene both on mRNA and protein levels were
investigated in ovine female reproductive organs and in various tissues of their foetuses
during the prenatal stage. Reproductive organs such as ovary, oviduct, endometrium,
myometrium and caruncle were collected at the 1st, 3rd and 5th month of pregnancy.
Foetal tissues were the whole foetuses at 1 month of age, brain, cotyledon, heart,
intestine, kidney, liver, lung and muscle of 2-month-old foetuses. At 3 and 5 months of
age the spinal cord and spleen were added. Sheep were categorized as resistant (R1) or
high susceptible (R5) to scrapie according to their PRNP genotype. In both genotype
groups, the gene transcript was detectable in all stages and all tissues examined by RT-
PCR. The gene expression profiles of R1 and R5 groups were similar. Comparisons
between reproductive organs demonstrated the highest expression level in caruncle
tissue of ewes, whereas the level was high in brain and low in liver of their foetuses. In
addition, real-time RT-PCR was performed in immature oocytes, mature oocytes, in
vivo embryos at morula stage and in 1-month-old foetuses. The results showed that the
relative expression levels of PRNP mRNA in mature oocytes and morula-stage embryos
were significantly lower than those in immature oocytes and 1-month-old foetuses
(p≤0.05). Fluorescent in situ hybridisation in adult ovaries and 1-month-old foetuses
demonstrated the presence of the gene transcript in oocytes, granulosa cells, theca cells,
ovarian cortex, ovarian medulla and corpus lutuem of the ovaries, and in brain, vertebral
column, dermatome, heart, liver and kidney of the foetuses of both groups. Western blot
analyses revealed the immunoreactive bands corresponding to PrPC in all female
reproductive tissues as well as their foetuses collected at the 1st month gestation. The
PrPC was also detected in all tissues of 2-month-old foetuses. In addition,
immunohistochemical staining implicated localisation of PrPC in brain, heart and kidney
of 1-month-old foetuses. The PrPC was also found in ovarian cortex and ovarian
medulla of the two groups however, it was undetectable in oocytes, granulosa cells,
theca cells and corpus luteum, in this study.

VII
Contents Page
Abstract V
List of abbreviations XI
List of tables XIII
List of figures XIV
List of appendix XVI
1 Introduction 1
2 Literature review 3
2.1 Prion diseases 3
2.2 Incubation time and transmission of prion diseases 7
2.2.1 Transmission of human prion diseases 7
2.2.2 Transmission of BSE and scrapie 7
2.2.3 Maternal –vertical transmission 8
2.3 Prion protein 10
2.3.1 Structure of prion protein 11
2.3.2 Biochemical and biophysical differences between PrPC and
PrPSc
11
2.3.3 Conversion of PrPC into PrPSc 12
2.3.4 Function of PrPC 14
2.3.5 Role of PrPC in prion diseases 15
2.3.6 Expression of PrPC 15
2.3.7 Accumulation of PrPSc 16
2.4 The prion protein gene 17
2.4.1 Gene structure 17
2.4.2 Polymorphisms of human, cattle and mouse PRNP 18
2.4.3 Polymorphisms of ovine PRNP and association to scrapie
susceptibility
20
2.4.4 Ovine PRNP genotypes and risk groups 22
2.4.5 Expression of PRNP mRNA 23

VIII
3 Material and methods 24
3.1 Material 24
3.1.1 Animals and sampling 24
3.1.2 Laboratory equipment 25
3.1.3 Biological materials, reagents, kits and buffers 26
3.1.3.1 Biological materials 26
3.1.3.2 Kits 27
3.1.3.3 Buffers and reagents 28
3.1.4 Sources of software and Internet facilities 36
3.2 Methods 38
3.2.1 Primers design 38
3.2.2 PRNP genotyping 38
3.2.2.1 Blood sampling 38
3.2.2.2 DNA extraction from blood samples 38
3.2.2.3 PCR amplification 39
3.2.2.4 Sequencing 40
3.2.3 Oocytes and in vivo embryo collection 40
3.2.4 RNA isolation and cDNA synthesis 41
3.2.4.1 Oocytes and preimplantation embryos 41
3.2.4.2 Tissue samples 42
3.2.5 Semiquantitative PCR 43
3.2.6 Plasmid DNA preparation 44
3.2.6.1 PCR amplification 44
3.2.6.2 PCR product extraction 44
3.2.6.3 Ligation 45
3.2.6.4 Competent cell preparation 45
3.2.6.5 Transformation 45
3.2.6.6 Clonning 46
3.2.6.7 Sequencing 46
3.2.6.8 Plasmid DNA isolation 47
3.2.6.9 Plasmid serial dilutions 47
3.2.7 Real time PCR 48

IX
3.2.8 Statistical analysis 48
3.2.9 PRNP mRNA localisation by fluorescent in situ hybridisation 49
3.2.9.1 Generation of RNA probes 49
3.2.9.2 Tissue sectioning and fixation 51
3.2.9.3 Pretreatment of sections 51
3.2.9.4 Hybridisation of probe to the target RNA 52
3.2.9.5 Posthybridisation washes 52
3.2.9.6 Immunological detection 53
3.2.10 Detection of PrPC expression by western blotting 54
3.2.10.1 Protein extraction 54
3.2.10.2 SDS-PAGE gel preparation 55
3.2.10.3 SDS-PAGE gel electrophoresis 55
3.2.10.4 Transferring proteins to the membrane 56
3.2.10.5 Antibody incubation 56
3.2.10.6 Protein visualisation 57
3.2.11 Protein localisation by immunohistochemistry 57
4 Results 59
4.1 PRNP genotyping 59
4.2 Expression of PRNP mRNA 62
4.2.1 Expression of PRNP transcripts in ovine preimplantation
embryos
62
4.2.2 Expression of PRNP transcripts in ovine prenatal foetuses 63
4.2.3 Expression of PRNP transcripts in reproductive organs of
ewes
69
4.3 Localisation of PRNP mRNA 71
4.3.1 Localisation of PRNP mRNA in 1-month-old foetuses 72
4.3.2 Localisation of PRNP mRNA in adult ovaries 72
4.4 Expression of PrPC 75
4.4.1 Expression of PrPC in ovine prenatal foetuses 75
4.4.2 Expression of PrPC in reproductive organs of ewes 75
4.5 Localisation of PrPC 77

X
4.5.1 Localisation of PrPC in 1-month-old foetuses 78
4.5.2 Localisation of PrPC in adult ovaries 80
5 Discussion 81
5.1 Genotype and allele frequencies of the PRNP 81
5.2 PRNP mRNA and PrPC expression in preimplantation
embryos
86
5.3 PRNP mRNA and PrPC expression in prenatal foetuses 87
5.4 In situ analysis of PRNP mRNA and PrPC expression in
1-month-old foetuses
90
5.5 PRNP mRNA and PrPC expression in reproductive tissues
of ewes
92
6 Summary 97
7 Zusammenfassung 101
8 References 105
9 Appendix 125

XI
List of abbreviations
AEC : 3-amino-9-ethylcarbazole
BLAST : Basic local alignment search tool
bp : Base pair
°C : Degree Celsius
cDNA : Complementary deoxy ribonucleic acid
DEPC : Dimethyl pyrocarbonate
DIG : Digoxigenin
DMF : Dimethylformamide
DMSO : Dimethyl sulfoxide
DNA : Deoxyribonucleic acid
DNase : Deoxyribonuclease
dNTP : Deoxynucleotide triphosphate
DTT : 1, 4, Dithio theritol
E. coli : Escherichia coli
EDTA : Ethylenediaminetetra acetic acid
Fab : Fragment antigen binding
g : Earth's gravity (9.8 m/sec2)
HCl : Hydrochloric acid
IPTG : Isopropyl ß-D-thiogalactopyranoside
ISH : In situ hybridisation
kDa : Kilodaton
M : Molar
mg : Miligram
min : Minute
ml : Mililitre
mM : Milimolar
MAb : Monoclonal antibody
MOPS : 3-Morpholinopropanesulfonic acid
mRNA : Messenger RNA
NaCl : Sodium chloride
NaOH : Sodium hydroxide
XII
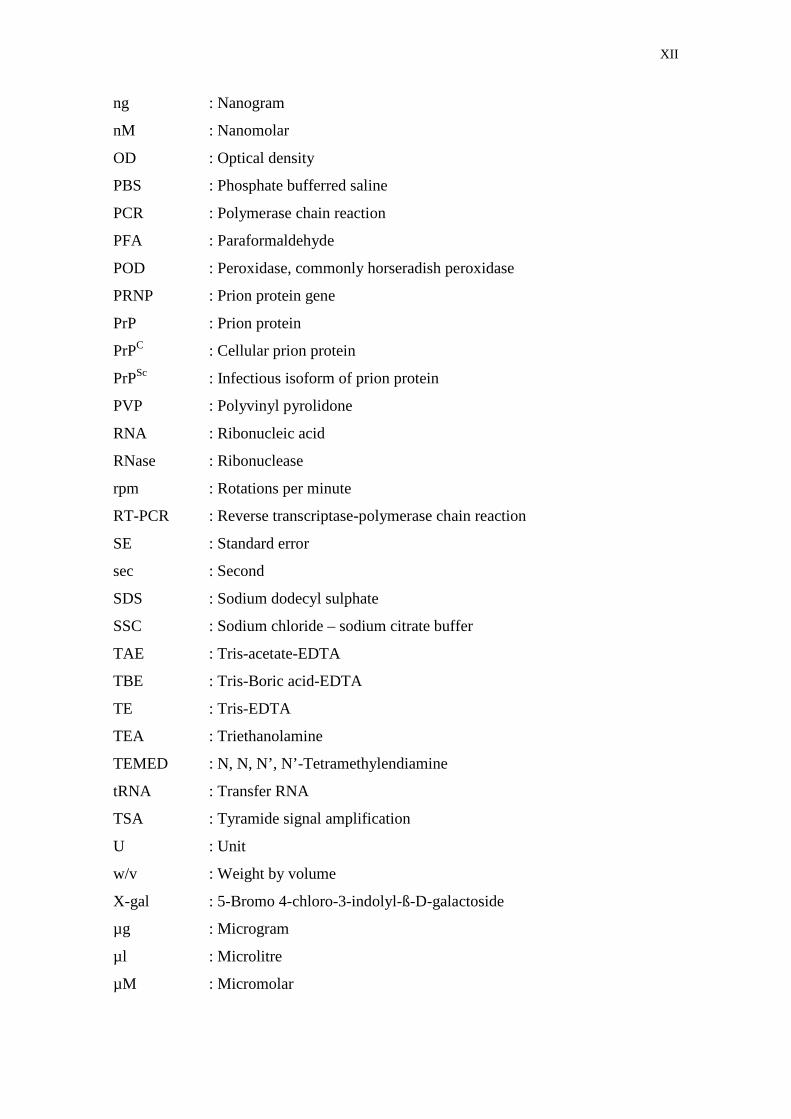
ng : Nanogram
nM : Nanomolar
OD : Optical density
PBS : Phosphate bufferred saline
PCR : Polymerase chain reaction
PFA : Paraformaldehyde
POD : Peroxidase, commonly horseradish peroxidase
PRNP : Prion protein gene
PrP : Prion protein
PrPC : Cellular prion protein
PrPSc : Infectious isoform of prion protein
PVP : Polyvinyl pyrolidone
RNA : Ribonucleic acid
RNase : Ribonuclease
rpm : Rotations per minute
RT-PCR : Reverse transcriptase-polymerase chain reaction
SE : Standard error
sec : Second
SDS : Sodium dodecyl sulphate
SSC : Sodium chloride – sodium citrate buffer
TAE : Tris-acetate-EDTA
TBE : Tris-Boric acid-EDTA
TE : Tris-EDTA
TEA : Triethanolamine
TEMED : N, N, N’, N’-Tetramethylendiamine
tRNA : Transfer RNA
TSA : Tyramide signal amplification
U : Unit
w/v : Weight by volume
X-gal : 5-Bromo 4-chloro-3-indolyl-ß-D-galactoside
µg : Microgram
µl : Microlitre
µM : Micromolar

XIII
List of tables Page
Table 1: Transmissible spongiform encephalopathies 4-5
Table 2: Size (base pairs) of exons, introns and CDS of human, cattle,
sheep and mouse PRNP
17
Table 3: Polymorphisms in the coding region of ovine PRNP 21
Table 4: Ovine PRNP genotypes and risk groups according to the
polymorphisms at codons 136, 154 and 171
22
Table 5: Details of primers used for amplification and sequencing 37
Table 6: Ovine PRNP primers for generating templates required for the
probe synthesis
50
Table 7: The PRNP genotype distribution in sheep of the present study 59
Table 8: Allelic frequencies of PRNP based on the polymorphisms at
codon 136, 154 and 171 within exon 3
60
Table 9: Breed and PRNP genotypes of sheep used in this study 61
Table 10: Relative abundance of PRNP mRNA (x 10-6) in foetal
cerebrum, medulla oblongata, heart, liver and spleen of each
individual at the 3rd and 5th month of pregnancy
67
Table 11: Frequencies of PRNP genotypes in sheep of the present study
and in Icelandic, Norwegian, Italian, Mongolian and Spanish
sheep
82
Table 12: Frequencies of PRNP alleles in sheep of the present study and
in Icelandic, Norwegian, Italian, Mongolian and Spanish sheep
83
Table 13: The PRNP genotypes and risk groups in accordance with the
NSP classification system used in the United Kingdom
84
Table 14: PRNP genotypes frequencies in the examined group of sheep in
accordance with the NSP classification system used in the
United Kingdom
85
Table 15: PRNP mRNA and PrPC expression in 1- 2- and 3-month-old
foetuses
97

XIV
List of figures Page
Figure 1: Amino acid sequence alignment of bovine and ovine prion protein 6
Figure 2: Amino acid sequence alignment of human and mouse prion
protein
6
Figure 3: Model of the C-terminus of human prion protein (A). Structure
model of PrPC and PrPSc (B)
11
Figure 4: Hypothetical scheme for the conformational conversion of
PrPC into PrPSc. The template-directed model (A), the template-
assistance model (B) and the nucleation-polymerization
model (C)
13
Figure 5: Diagram illustrating the genomic architecture of the bovine PRNP 19
Figure 6: Hybrid detection system including tyramide signal amplification 53
Figure 7: Diagram of transferring system 56
Figure 8: Relative expression levels of PRNP mRNA in in vivo ovine
immature oocytes (IMO), mature oocytes (MO), morula-stage
embryos and 1-month-old foetuses
63
Figure 9: RT-PCR analysis of PRNP and 18S mRNA in various tissues of
2-month-old R1 and R5 foetuses
64
Figure 10: RT-PCR analysis of PRNP and 18S mRNA in various tissues of
3- (B) and 5-month-old (C) R1 foetuses
65
Figure 11: RT-PCR analysis of PRNP and 18S mRNA in various tissues of
3- (B) and 5-month-old (C) R5 foetuses
66
Figure 12: Relative expression levels of PRNP mRNA (x10-6) in foetal
tissues of scrapie resistant (R1) and susceptible (R5) groups at the
3rd and 5th month of pregnancy
68
Figure 13: RT-PCR analysis of PRNP and 18S mRNA in reproductive
tissues of scrapie resistant ewes at the 1st (A), 3rd (B) and 5th (C)
month of pregnancy
70
Figure 14: RT-PCR analysis of PRNP and 18S mRNA in reproductive
tissues of high susceptible scrapie ewes at the 1st (A), 3rd (B)
and 5th (C) month of pregnancy
70

XV
Figure 15: Relative expression levels of PRNP mRNA (x10-6) in
endometrium and caruncle of resistant and susceptible ewes
71
Figure 16: Fluorescent in situ hybridisation of PRNP mRNA with DIG
labelled RNA antisense and sense probes in 1-month-old R1
and R5 ovine foetuses
73
Figure 17: Fluorescent in situ hybridisation of PRNP mRNA with DIG
labelled RNA antisense and sense probes in R1 and R5 ovaries,
collected at the 1st month of pregnancy
74
Figure 18: Representative western blot analysis of PrPC in ovine foetal
tissues
76
Figure 19: Representative western blot analysis of PrPC in ovine
reproductive tissues of resistant (R1) and high susceptible
(R5) ewes
76
Figure 20: Immunohistochemistry of the prion protein with PrP MAb
12F10 in adult brain of sheep
77
Figure 21: Immunohistochemistry of the prion protein with PrP MAb
12F10 in ovine 1-month-old R1 and R5 foetuses using
HRP-AEC substrate
78
Figure 22: Immunohistochemical localisation of PrPC in ovine ovaries 79
Figure 23: Western blot analysis, revealing the immuno reactive bands of
PrPC in foetal cotyledon of scrapie-resistant (R1) and high
susceptibility (R5) groups at the 2nd, 3rd and 5th month of
pregnancy
90

XVI
List of appendix Page
Appendix 1: Codon-amino acid abbreviations 125-127

Introduction 1
1 Introduction
Transmissible spongiform encephalopathies (TSEs) are fatal neurodegenerative
disorders of the central nervous system (CNS) caused by prions. Prion diseases include
bovine spongiform encephalopathy (BSE) in cattle, scrapie in sheep and goats,
Creutzfeldt Jakob Disease, Gerstmann Sträussler syndrome, fatal familial insomnia,
Kuru and Alpers syndrome in humans. The primary cause of these diseases is a post-
translational conformation change in a host-encoded cellular prion protein (PrPC) to
a proteinase-resistant form (PrPSc) (Prusiner 1991). Various studies showed that mice
devoid of functional PRNP gene are resistant to scrapie and do not allow propagation of
the infectious agent (Brandner et al. 1996, Bueler et al. 1993, Sailer et al. 1994,
Sakaguchi et al. 1996, 1995). Moreover, it has been suggested that the absence of PrPC
expression is not the cause of neuronal dysfunction, animals devoid of PrPC are not
damaged by exogenous PrPSc, and the amount of PrPC is a rate-limiting step in the
development of the prion disease (DeArmond and Prusiner 1996).
PRNP has been shown to be expressed at high levels in CNS but also in many non-
neuronal tissues such as heart, skeletal muscle, lung, intestinal tract, spleen, testis,
ovary, lymphocytes, lymph nodes and some other organs in rodents and ruminants
(Bendheim et al. 1992, Mabbott et al. 1997, McBride et al. 1992, Pammer et al. 1998).
PrPC is a normal protein located on the exterior cell surface and is attached to the
plasma membrane via a glycosylphosphatidylinositol (GPI) anchor (Stahl et al. 1990).
This protein is believed to be involved in several functions in the cell such as protection
against antioxidant activity by regulating copper ion concentration (Brown et al. 2001,
2002, Klamt et al. 2001) transduction of neuroprotective signals or even prevention of
apoptosis in retinal cells (Chiarini et al. 2002). Although, it’s precise function(s)
remains unclear.
Susceptibility to scrapie in sheep is influenced by polymorphisms at codons 136, 154
and 171 of the PRNP gene (Tranulis 2002). The ovine PRNP genotypes were classified
into 5 risk groups according to the susceptibility to the disease; R1 genotype being the
resistant and R5 genotypes being high susceptible to the disease (Erhardt et al. 2002).
Tuo et al. (2002) reported that accumulation of PrPSc in uterine-placental epithelial cells
in the placentome was influenced by the foetal PRNP genotype and the pregnancy status
of scrapie-infected ewes.

Introduction 2
In natural TSE infections the gastrointestinal tract is considered to be the major route of
the infection (Andreoletti et al. 2000, Hadlow et al. 1982, Pattison et al. 1972), and the
scrapie infectious prions diffused to sheep and goat are hypothesized to originate from
placenta of infected ewes (Andreoletti et al. 2000, Pattison et al. 1972, Tuo et al. 2001).
Oral and parental inoculation of PrPSc resulted in 100% infection of the prion disease in
mice (Manolakou et al. 2001, Narang 1996, Narang 2001). Epidemiology shows that
maternal vertical transmission of TSE is not of importance; however, embryo transfer
experiments performed in sheep provide contradictory results about the possibility of
this mode of infection including those providing support for maternal vertical infection
(Foster et al. 1996) or those showing prevention of vertical infection by embryo transfer
(Foote et al. 1993, Wang et al. 2002, 2001).
Since the expression of PRNP is a prerequisite for the infection, studies on the temporo-
spatial expression of PRNP in foetal and maternal tissue during gestation can provide
further clues on the impact of maternal vertical transmission of TSE. Moreover, these
expression profiles contribute to the elucidation of the physiological function of the
protein. Therefore, the aims of this study were:
1) Quantitative expression profiling of the PRNP gene in R1 and R5 ovine immature
oocytes, mature oocytes and in vivo preimplantation embryos using real-time PCR.
2) Semi-quantitative expression profiling of the PRNP gene during prenatal stages in R1
and R5 ovine foetal and maternal tissues using RT-PCR technology.
3) Detection of PrPC in R1 and R5 female reproductive tissues of ewes and whole
foetuses at the 1st month of pregnancy as well as various tissues of 2-month-old foetuses
by western blot.
4) Detection and localisation of PRNP mRNA and PrPC in adult ovaries and 1-month-
old foetuses of both groups.

Literature review 3
2 Literature review
2.1 Prion diseases
Prion diseases or transmissible spongiform encephalopathies (TSEs) are fatal
neurodegenerative disorders of the central nervous system that occur in a number of
species. The clinical signs of these diseases are variable but include progressive
dementia, cerebellar ataxia and behavioural disturbances. Gross neuropathology can
include reduced brain weight, cortical atrophy and enlargement of the ventricles
(reviewed in Moore and Melton 1997). Histophatological changes of the brain comprise
a fine vacuolation termed spongiosis, reactive changes of astrocytes called gliosis, and
variable loss of neurons (reviewed in Brandner et al. 2000). Widespread apoptosis has
been described in the brain of infected sheep, mice and human and may be a major
mode of cell death (Fraser 1976).
Prion diseases are found in both animals and human including bovine spongiform
encephalopathy (BSE) or mad cow disease in cattle, chronic wasting disease (CWD) in
elk and deer, transmissible mink encephalopathy (TME) in mink, feline spongiform
encephalopathy (FSE) in cat, puma, cheetah, ocelot and tiger, and ovine spongiform
encephalopathy (OSE) or scrapie in sheep and goat. The prion diseases in human are
Alpers syndrome, Kuru, fatal familial insomnia (FFI), Gerstmann–Sträussler–Scheinker
syndrome (GSS), Creutzfeldt–Jakob disease (CJD) and a new variety of Creutzfeldt–
Jakob disease (nv CJD) which is caused by the transmission of BSE via dietary
exposure (Moore and Melton 1997, Will et al. 1996) (Table 1). The possibility that the
infectious agent of prion disease consists of viral particles can be ruled out, since no
nucleic acid has been detected. The protein-only hypothesis has been formulated firstly
by Griffith (1967), and supported by additional data of Prusiner (1982) who coined the
term prions, composed from “proteinaceous infectious particle” to identify the agents
that cause a novel type of fatal brain diseases. The hypothesis states that the infectious
prion protein is devoid of nucleic acid, and the primary cause of these diseases is a post-
translational conformation change in a host-encoded cellular prion protein (PrPC) to the
disease-causing isoform (PrPSc) (Prusiner 1991, 2004).

Table 1: Transmissible spongiform encephalopathies (Adapted from Moore and Melton 1997, Prusiner 1994, 2004)
Species Disease Description Distribution
Sheep Scrapie Field scrapie; infection in genetically susceptible sheep. Experimentally transmitted
to sheep, goats, mice, hamsters and cattle (Gibbs et al. 1990, Okamoto et al. 2003).
Worldwide
(1936)
Goat Scrapie Natural cases rare
Mink Transmissible mink
encephalopathy
Infection in farmed mink; source of infection probably scrapie infected offal.
Experimentally transmitted to hamsters.
North America;
Europe
Mule
Deer
Chronic wasting
disease
Infection of farmed deer probably from scrapie contaminated feed.
Experimentally transmitted to other deer.
North America
Elk Chronic wasting
disease
Infection in farmed elk, probably derived from scrapie infected feed.
Cattle Bovine spongiform
encephalopathy
UK BSE epidemic mostly in Holstein Friesian dairy cattle; scrapie contamination of
feed. Experimentally transmitted to mice (Fraser et al. 1992), pigs (Ryder et al.
2000), monkeys (Lasmezas et al. 2005, 1996) and mink (Robinson et al. 1994).
UK; Republic
of Ireland;
Europe
Domestic
cat
Infection with prion-contaminated bovine tissues or MBM in domestic cats.
Transmitted to mice (Fraser et al. 1994)
UK; Norway
Cheetah Infection in a zoo specimen UK
Puma Infection in a zoo specimen UK
MBM: meat and bone meal
Lite
ratu
re review
4

Table 1: Transmissible spongiform encephalopathies (Continued, adapted from Moore and Melton 1997, and Prusiner 1994, 2004)
Species Disease Description Distribution
Human Sporadic CJD Sporadic: 1:106 incidence; not associated with prion protein (PrP) mutations.
Experimentally transmitted to chimpanzees, monkeys, cats and mice
Worldwide
Iatrogenic CJD Iatrogenic: transmission following neurosurgery, corneal transplant and dura mater graft Worldwide
Familial CJD Familial: linked to mutations in prion protein; autosomal dominant, some have variable
penetrance
Worldwide
New variant CJD Unusual CJD variant in UK (10 cases) and France (1 case) with early onset
(<42 years), unusual clinical presentation and neuropathology.
Infection from bovine prions. Transmissibility to rodents not yet demonstrated.
UK; France
Gerstmann-
Scheinker-
Sträussler Syndrom
Familial disorder tightly linked to mutations in the prion protein Worldwide
Fatal familial
insomia
Familial disorder linked to germline mutation in prion protein in association with a
common PrP polymorphism
Worldwide
Kuru Infection: Sporadic CJD spread and maintained by cannibalism; endemic to a remote
highland region of Papua New Guinea. Experimentally transmitted to goats, primates and
rodents
Papua New
Guinea
(1950)
Lite
ratu
re review
5

Fig
ure
1:
Am
ino
acid
seq
uenc
e al
ignm
ent o
f bov
ine
and
ovi
ne p
rion
prot
ein
Fig
ure
2:
Am
ino
acid
seq
uenc
e al
ignm
ent o
f hum
an a
nd
mou
se p
rion
prot
ein
Literature review 6

Literature review 7
2.2 Incubation time and transmission of prion diseases
When the titre of infectious prion reaches a critical threshold, animals develop signs of
neurologic dysfunction. The time interval from inoculation to clear signs of the disease
is referred to as the incubation period. The length of incubation period can be modified
by the dose of the infectious agent, the route of inoculation, the level of PrPC and
polymorphism in the sequence of PrPC (Prusiner et al. 2004). Since the mean incubation
time for BSE is ~4-5 years, most cattle do not manifest the disease because they are
slaughtered between 2-3 years of age (Spongiform Encephalopathy Advisory
Committee 1995). For the scrapie in sheep, the incubation period range from 3.5 – 23
months after intracerebral injection with a source of scrapie known as SSBP/1
(Dickinson 1976).
2.2.1 Transmission of human prion diseases
The infection route of Kuru is composed of a combination of consumption, ocular
exposure and skin exposure to the infected, uncooked and cooked tissues of dead
patients at mortuary rituals of the Fore people in Papua New Guinea (Spongiform
Encephalopathy Advisory Committee 1995). For the CJD, it seems unlikely that the
disease is spread among humans by infection except in the cases of accidental
inoculations. Most of CJD cases are sporadic and are the result of a somatic mutation,
the spontaneous conversion of PrPC to PrPSc, or reduced clearance of low levels of PrPSc
that are normally present (Prusiner et al. 2004).
2.2.2 Transmission of BSE and scrapie
BSE in cattle appears to be transmitted through concentrate feeds containing ruminant-
derived meat and bone meal (MBM). The MBM is prepared from the offal of sheep,
cattle, pigs and chicken as a high-protein nutritional supplement. The hydrocarbon-
solvent extraction method is used in the rendering of offal results in MBM with much
higher fat content. This process allowed scrapie prions from sheep to survive rendering
and subsequently to be passed into cattle (Prusiner et al. 2004, Spongiform
Encephalopathy Advisory Committee 1995). However, an ability of the bovine
Literature review 8
gastrointestinal microbiota to degrade the infectious prions during digestion was
observed. Scherbel et al. (2006) demonstrated that after incubation of the microbial
consortia collected from rumen and colon with brain homogenates of scrapie infected
hamsters for 20 hours, PrPSc was digested up to immunochemically undetectable levels.
Especially polymyxin resistant (mainly gram-positive) bacteria expressed PrPSc
degrading activity.
In sheep and goat, the natural route by which infectious agents are transmitted among
these species is unknown. However, in natural scrapie, the gastrointestinal tract is
considered to be the major route of infection (Hadlow et al. 1982). Some investigations
have suggested that horizontal transmission occurs orally, and the scrapie infectious
prions diffused to sheep and goat are hypothesized to originate from placenta of infected
ewes (Andreoletti et al. 2000, Pattison et al. 1972, Tuo et al. 2001). Nevertheless, there
is no evidence for vertical transmission or for transmission through semen and embryos
(Wrathall 1997).
For experimentally transmission, scrapie and BSE can be transmitted through multiple
routes (Wrathall 1997). The disease was first transmitted by intraocular inoculation
(Cuille and Chelle 1939, reviewed in Prusiner 2004) and later by intracerebral
(Dickinson 1976, Renwick and Zlotnik 1965), oral (Prusiner et al. 1985), subcutaneous
(Buyukmihci et al. 1985), intravenous (Kimberlin and Walker 1989) and intragastrical,
intracardiac and intramuscular (Zhang et al. 2004) injections. However, many of the
inoculated animals often failed to develop the disease (Dickinson and Stamp 1969,
Hadlow et al. 1980, 1982). Moreover, many studies showed that different PRNP
genotypes of sheep influenced the incubation time and susceptibility to scrapie prions
inoculated, suggesting that the genetic background influence host permissiveness
(Bulgin et al. 2006, Goldmann et al. 1991a, Maciulis et al. 1992, O'Rourke et al. 1997).
2.2.3 Maternal –vertical transmission
Epidemiology shows that maternal vertical transmission of TSE is not of importance;
however, embryo transfer experiments performed in sheep provide contradictory results
about the possibility of this mode of infection including those providing support for
maternal vertical infection (Foster et al. 1996) or those showing prevention of vertical
infection by embryo transfer (Foote et al. 1993, Wang et al. 2002, 2001).

Literature review 9
Foster et al. (1996) examined the effect of washing the embryos and the viability of
highly susceptible offspring derived from scrapie-affected and uninfected donors. The
results showed that scrapie occurred in both washed and unwashed embryos from both
groups of donor ewes. This is in contrast to the study of Foote et al. (1993), who
measured scrapie transmission via the embryo by using offspring from embryos of
scrapie-inoculated donors and scrapie-free recipients, and via the uterus by using
offspring from embryos of scrapie-free donors and scrapie-inoculated recipients taken
by cesarean section. The results showed that none of the scrapie-free donor/recipients,
including those gestating embryos from scrapie-inoculated donors, and the offspring
from reciprocal cross, via embryo, or via the uterus developed scrapie. These
investigations were supported by the studies in cattle (Wrathall et al. 2002) and sheep
(Wang et al. 2002, 2001). The results reported that embryos collected from donors with
a high incidence of clinical or natural prion disease did not develop the diseases even
many embryos had the high risk genotype. In a study of experimental BSE of Foster
et al. (2004), Cheviot ewes challenged orally with BSE cattle brain produced lambs of
various PRNP genotypes. Of 72 surviving to >30 months of age, 29 are of the most
susceptible PRNP genotype (A136Q171/A136Q171, the underscript numbers present the
order of amino acid) and born to mothers that were challenged with BSE. However,
none of the progeny have shown any signs of BSE disease. From these studies it could
be concluded that prion diseases were not neither transmitted to offspring via the
embryo nor was the infective agent transmitted to recipient animals during embryo
transfer procedures even when the offspring have the high risk genotype. In addition,
since PrPSc was detected in placenta from scrapie-infected ewes (Race et al. 1998) and
oral inoculation is a major route of scrapie infection, by which lambs may be exposed to
scrapie by ingesting the transmissible agent during contact with contaminated wool and
mammary gland of the dam (Tuo et al. 2001).
Literature review 10
2.3 Prion protein
2.3.1 Structure of prion protein
The mammalian PRNP encodes a protein of ~250 amino acids (aa) that contains several
distinct domains, including an amino-terminal signal peptide, a series of five peptide
repeats, a central hydrophobic segment and a carboxy-terminal hydrophobic region that
is a signal for addition of a glycosyl phosphatidyl inositol (GPI) anchor (Harris et al.
2004). The amino acid sequences of prion protein (PrP) in human, cattle, sheep and
mouse with long and short incubation period for prion disease are shown in Figure 1
and Figure 2. Codon and amino acid abbreviations are shown in appendix 1.
The human prion protein contains 253 aa (AAG21693) while cattle and sheep prion
proteins contain 264 (CAA39368) and 256 (CAA04236) aa, respectively. Mouse PrP
with long and short incubation time have the same number of 254 aa (AAD41440 and
AAC02804, respectively). The amino acid sequences of prion protein in these four
species are quite similar especially when comparing between human and mouse (Figure
2), and cattle and sheep (Figure 1). Differences in the sequence of prion protein in
mouse with long and short incubation time are a substitution of leucine (L) to
phenylalanine (F) at codon 109, and threonine (T) to valine (V) at codon 190. Between
human and mouse, the differentiation in prion protein sequences consist of 26 aa was
observed, in which a deletion at codon 56, and an insertion of two amino acids between
codons 226 and 227 in mouse PrP sequence (residual number refer to the number of
human PrP). Comparison between bovine and ovine prion protein sequences shows an
insertion of eight amino acids in bovine PrP at codons 92-99, and substitution of serine
(S) -> threonine (T), serine (S) -> glycine (G), asparagine (N) -> serine (S), tyrosine (Y)
-> histidine (H), and isoleucine (I) -> methionine (M) at codons 106, 108, 154, 166 and
216, respectively (residual number refer to the number of bovine PrP).
The characteristic secondary structure elements of prion protein are three alpha helices,
with two small beta-sheets. From the human PrP structure shown in Figure 3A, three
helices are shown as HA, HB and HC while two beta-sheets are shown as S1 and S2,
and two N-linked polysaccharides are shown at top left and center. HA is a short helix,
spanning residues 144-154, HB is a regular helix spanning 173-194, and HC is longer.
The two glycosylation sites are asparagine 181 on the HB, and asparagine 197 between

Literature review 11
HB and HC (human sequence). One disulfide bond is present in the protein connecting
the second and third helices via cysteine179-cysteine 214 (Govaerts et al. 2004).
(A) (B)
.
Figure 3: Model of the C-terminus of human prion protein (A). Structure model of
PrPC and PrPSc (B)
2.3.2 Biochemical and biophysical differences between PrPC and PrPSc
PrPC is a normal cellular host-encoded glycoprotein found in neuron system of
mammals. It is located on the exterior cell surface and is attached to the plasma
membrane via a GPI anchor (Stahl et al. 1990). PrPSc is a modified isoform of PrPC
originated by a conformation change of PrPC during a posttranslational process. This
modification is non genomic protein and causes TSEs in humans and animals (Prusiner
1982).
Since both of PrPC and PrPSc have the same primary amino acid sequence and similar
N-linked carbohydrate side chain and GPI anchors, chemical differences between PrPC
and PrPSc are not found (Stahl et al. 1993). However, biochemical and biophysical
differences between PrPC and PrPSc have been identified. PrPC is a non-infectious agent,
soluble in soft detergent and sensitive to proteinase K digestion. In contrast, PrPSc is an
infectious agent associated with prion diseases infectivity, insoluble in soft detergents
and resistant against digestion of proteinase K. Moreover, infrared spectroscopy
PrPc PrPscPrPc PrPsc

Literature review 12
indicated that the secondary structure of PrPC contains approximately 42% alpha-helix
and 3% beta-sheet, whereas PrPSc contains 30% alpha-helix and 43% beta-sheet (Figure
3B, Pan et al. 1993). In addition, while a tertiary structure of PrPC included a long
flexible N-terminal tail, three alpha-helix and two small anti-parallel
ß-strands that flank the first alpha-helix, a tertiary structure of PrPSc has not yet been
obtained (Harris 1999).
2.3.3 Conversion of PrPC into PrPSc
The mechanism of the conversion of PrPC to PrPSc is not well understood. However,
cell-free conversion studies indicate that PrPSc aggregates are able to convert PrPC into
a protease-resistant PrP isoform (Bessen et al. 1995, Kocisko et al. 1996). In order to
explain the mechanism by which an infectious form of PrP could induce the refolding of
native PrP molecules into the abnormal conformation, three distinct models have been
postulated: (i) the template-directed model (ii) the template-assisted model and (iii) the
nucleation-polymerisation model (Figure 4). The first and second models postulate an
interaction between exogenously introduced PrPSc and endogenous PrPC, and
a prevention of spontaneous conversion of PrPC and PrPSc by high energy barrier. The
first model (Figure 4A) suggests that PrPSc forms a heterodimer with PrPC and causes
PrPC to undergo an induced conformational change to yield PrPSc (Prusiner 1991). The
template-assisted model (Figure 4B) states that in an uninfected cell, PrPC with wild
type sequence is likely to exist in equilibrium with its monomeric alpha-helical,
protease-sensitive state or bound to some other proteins, such as protein X. The
conformation of PrPC that is bound to protein X is denoted PrP*. This PrP*-protein X
complex will bind PrPSc, thereby creating a replication-competent assembly. When PrP*
is transformed into a nascent molecule of PrPSc, protein X is released and a dimer of
PrPSc remains. In this model, a fraction of infectious PrPSc dimers dissociates into
uninfectious monomers as the replication cycle proceed, while a majority of the dimers
accumulate in accord with the increase in prion titer that occurs during the incubation
period (Prusiner 2004). The nucleation model (Figure 4C) proposes that PrPC and PrPSc
are in equilibrium, strongly favouring PrPC. The PrPSc is only stabilized when it adds
onto a crystal-like seed or aggregate of PrPSc. If a stable aggregate needs to consist
minimally of a substantial number of PrPSc molecules, then its spontaneous formation

Literature review 13
would be a very rare event. However, once a seed is present, monomer addition could
ensue at a rapid rate. Fragmentation of PrPSc increases the number of nuclei which can
recruit further PrPSc and results in apparent replication of the agent (reviewed in
Weissmann 1999).
Figure 4: Hypothetical scheme for the conformational conversion of PrPC into
PrPSc. The template-directed model (A), the template-assistance model (B) and the
nucleation-polymerisation model (C)

Literature review 14
2.3.4 Function of PrPC
The precise function(s) of PrPC remains unclear, but the localisation of PrPC on the cell
surface would be consistent with roles in cell adhesion and recognition, ligand uptake,
or transmembrane signalling. Defining the physiological role of PrPC may be relevant to
understanding the disease state, since the protein may fail to perform its normal function
when it is converted to the PrPSc isoform (Harris 1999). It has been shown that mice
homozygous for disrupted PRNP (PRNP-/-) developed and behaved normally for at least
7 months, and no immunological defects were apparent (Bueler et al. 1992). On the
other hand, some studies presented that PRNP-/- mice revealed an alteration in circadian
activity rhythms and sleep patterns (Tobler et al. 1997, 1996), abnormalities of synaptic
neurophysiology in the hippocampus (Colling et al. 1996, Whittington et al. 1995), loss
of Purkinje cells in the vast majority of cerebellar folia (Sakaguchi et al. 1996) and
a disturbance in latent learning and long-term memory retention (Nishida et al. 1997).
However, other investigators did not observe certain of these features (Herms et al.
1995, Lledo et al. 1996)
PrPC has been suggested to be involved in several functions in the cell, such as copper
metabolism, since PRNP-null mice display a reduction in the copper content of
membrane-enriched brain extracts and synaptosomal fractions, and a reduced activity of
copper/zinc superoxide dismutase (Brown et al. 1997). Additional possible functions of
the PrPC are protection against oxidative stress by regulating copper ion concentration
(Brown et al. 2001, 2002, Klamt et al. 2001), transduction of neuroprotective signals
and prevention of apoptosis function in retinal cells (Chiarini et al. 2002). An additional
study on antiapoptotic function of PrPC was done by Liang et al. (2006), who introduced
either the PrPC or two pairs of RNAi into the gastric cancer cell line. The results showed
that PrPC slowed down apoptosis in transfected cells. In addition, the apoptosis-related
protein Bcl-2 was upregulated, whereas Bax was downregulated in the PrPC-transfected
cells. These contrast the results in RNAi-transfected cells that showed the
downregulated Bcl-2 and upregulated Bax. These results suggested that PrPC might play
a role as an effective antiapoptotic protein through Bcl-2-dependent apoptotic pathways
in gastric cancer cells.

Literature review 15
2.3.5 Role of PrPC in prion diseases
According to the protein only hypothesis, PrPC is a substrate for the infection of prion
diseases to start by the conversion of PrPC into PrPSc. An important corollary to this
hypothesis is that an organism lacking PrPC should be resistant to prion disease and
unable to propagate the infectious agent. To this end, many groups generated mice with
a targeted disruption of the PRNP gene. The results showed that after challenged with
infectious prions, PRNP knockout mice were completely protected against scrapie
disease and did not allow propagation of the infectious agent (Bueler et al. 1993, Sailer
et al. 1994, Sakaguchi et al. 1996, 1995). Moreover, after grafting neural tissue with
PRNP over expression into the brain of PRNP-deficient mice followed by intracerebral
inoculation with scrapie prions, the grafts accumulated high levels of PrPSc and
infectivity, and developed the severe histopathological changes characteristic of scrapie,
whereas no pathological changes were seen in PRNP-deficient tissue, not even in the
immediate vicinity of the grafts (Brander et al. 1996). In addition, heterozygous mice
with only one disrupted allele (PRNP+/0) showed partial resistance to scrapie infection
as manifested by prolonged incubation times of ~290 days compared to ~160 days in
Prnp+/+ mice (Bueler et al. 1994). It has been showed that when a Syrian hamster (SHa)
PrP transgene was introduced into PRNP0/0 mice by crossing them with transgenic
(SHaPrP) mice, the transgenic (SHaPrP) mice became susceptible to SHa prions but not
to mouse prions (DeArmond and Prusiner 1996). These suggest that the absence of PrPC
expression is not the cause of neuronal dysfunction, animals devoid of PrPC are not
damaged by exogenous PrPSc, and the amount of PrPC is a rate-limiting step in the
development of the prion disease.
2.3.6 Expression of PrPC
PrPC has been observed at high level in central nervous system (CNS) and could be
detected in several non-neuronal tissues such as squamous epithelia of the skin and
upper gastrointestinal tract of human (Pammer et al. 1998), leukocytes, heart, skeletal
muscle, lung, intestinal tract, spleen, testis, ovary, lymph nodes, Peyer's patches,
thymus, and pancreas of mice and cows (Bendheim et al. 1992, McBride et al. 1992), as
well as on the surface of lymphocytes in humans and mice (Mabbott et al. 1997).

Literature review 16
A prion protein isoform truncated at the C terminus has been detected in ram (Ecroyd et
al. 2004), human and cattle mature sperm cells (Shaked et al. 1999), which retain only
the minimal components required for their unique function. Horiuchi et al. (1995)
demonstrated the distribution of PrPC in sheep organs and showed that PrPC can be
detected in several tissues besides the brain such as spleen, lymph node, lung, heart,
kidney, skeletal muscle, uterus, adrenal gland, parotid gland, intestine, proventriculus,
abomasum and mammary gland.
In brain, immunohistochemical studies have described a somatic expression of PrPC in
neurons with no or only a minor signal in the neuropil, which is a network of
unmyelinated neuronal processes (axonal and dendritic) within the gray matter of the
CNS. By electron microscopy, PrPC labelling in the neuropil was found on the plasma
membrane of dendrites, including spines, as well as dendritic transport vesicles,
endosomes, axolemma, axonal transport vesicles and myelin sheaths. In both neuronal
and glial cells, PrPC was detected in the endoplasmic reticulum, Golgi complex,
endosomes, uncoated transport vesicles and the plasma membrane, which are important
parts of the biosynthetic and endocytic pathway (reviewed in Harris et al. 2004).
2.3.7 Accumulation of PrPSc
In natural scrapie, the gastrointestinal tract is believed to be the major route of infection.
The earliest accumulations of PrPSc are found in ileal Peyer’s patch, tonsil,
retropharyngeal lymph nodes, mesenteric-portal lymph nodes, and intestine.
Accumulation of PrPSc in the enteric nervous tissue has been reported to appear later but
still in an early phase of the disease (Andreoletti et al. 2000, Hadlow et al. 1982,
Maignien et al. 1999). PrPSc also aggregates in other tissues such as tingible body
macrophages (TBMs), follicular dendritic cells (FDCs), distal jejunal lymph node,
medial retropharyngeal lymph node (RPLN), spleen and placenta in sheep with both
clinical and nonclinical disease (Ersdal et al. 2003, Jeffrey et al. 2000, Race et al. 1998,
Schreuder et al. 1998, van Keulen et al. 1996). The earliest traces of PrPSc in the brain
have been found in the autonomic myenteric nervous plexus and in the nucleus
parasympathicus nervi X of the brain stem when naturally infected lambs are 9 months
old (Andreoletti et al. 2000). The scrapie prions seem to reach the spinal cord at the
same time since the PrPSc was detected in the dorsal motor nucleus of the vagus and the

Literature review 17
intermediolateral column of the thoracic segments T8-T10 in naturally infected lambs at
the age of 10 months (van Keulen et al. 2000).
The presence of PrPSc in placentas from clinically scrapie-affected goats and ewes was
demonstrated by mouse bioassays. PrPSc accumulation was detected in foetal chorion
from pregnant scrapie-incubating ewes. Interestingly, the placenta from a scrapie-
incubating ewe can be found as PrPSc-positive in its first gestation and negative in the
following gestation (Andreoletti et al. 2002). Moreover, Tuo et al. (2002) indicated that
accumulation of PrPSc is eliminated or reduced to undetectable levels in reproductive
and placental tissues if infected ewes are not pregnant or conceive conceptuses with
a resistant PRNP genotype.
2.4 The prion protein gene
2.4.1 Gene structure
The prion protein gene is located on the short arm of chromosome 20 in human, the
syntenic region chromosome 2 in mouse (Prusiner 2004), and chromosome 13 in cattle
and sheep (Castiglioni et al. 1998, Schlapfer et al. 1998). The gene structures of all
species are similar. All of them contain three exons, which are separated by two large
introns, and the coding regions (CDS) of all are located on exon 3. The length of the
exons, introns and CDS of human, cattle, sheep and mouse PRNP are shown in Table 2
Table 2: Size (base pairs) of exons, introns and CDS of human, cattle, sheep and
mouse PRNP
Species Exon 1 Exon 2 Exon 3 CDS Intron 1 Intron 2
Human1 134 99 2,354 762 2,622 9,975
Cattle2 53 98 4,091 795 2,436 13,552
Sheep3 52 98 4,028 771 2,421 14,031
Mouse
- long incubation time4
- short incubation time5
47
47
98
98
2,009
2,153
765
765
2,190
2,190
11,127
17,733
Reference number 1/ U29185, 2/ AJ298878, 3/U67922, 4/ U29187, 5/ U29186

Literature review 18
2.4.2 Polymorphisms of human, cattle and mouse PRNP
In the human prion protein gene, a polymorphism at codon 129 encoding either
methionine (M) or valine appears to influence human prion disease expression in the
Caucasian population, not only in the inherited forms but also in the iatrogenic and
sporadic forms. Genotype frequencies for the codon 129 polymorphisms in Caucasians
are 12% V/V, 37% M/M and 51% M/V. In sixteen patients (fifteen white and one black)
from United Kingdom, United States and France with iatrogenic CJD, eight (50%) were
V/V, five (31%) were M/M, and three (19%) were M/V. Thus, a disproportionate
number of patients with iatrogenic CJD were homozygous for valine at human PrP
codon 129. This contrasts to the frequency of the V allele in the Japanese population
which is much lower and heterozygosity at codon 129 is more frequent in Japanease
CJD patients (18%) than in the general population where the polymorphisms are 0%
V/V, 92% M/M and 8% M/V (reviewed in Prusiner 1996). Wadsworth et al. (2004) also
reported that the generation of variant CJD in transgenic mice required expression of
human prion protein with methionine 129; expression of human PrP with valine 129
resulted in a distinct phenotype and persistence of a barrier to transmission of BSE-
derived prions on subpassage. In addition, the homozygosity for methionine at codon
129 of the human PrP appears to influence the onset of neurological and hepatic
symptoms in patients with the copper storage disorder Wilson disease as well (Merle
et al. 2006).
An insert of 144 bp containing six octarepeats at codon 53 (5 octarepeats are normally
present) was described in patients with CJD from four families residing in southern
England. It has been demonstrated that inserts of 2, 4, 5, 6, 7, 8 or 9 octarepeats in
addition to the normal five are found in individual with inherited CJD. Moreover,
a polymorphism resulting in substitution of glutamate (E) -> lysine (K) at codon 219
has been reported in the Japanese (Shibuya et al. 1998) and Korean populations (Jeong
et al. 2005). The lysine at codon 219 seems likely act dominant and protects against
CJD over the glutamine in both populations. In addition, it seems that PrPC is not
converted to PrPSc in the people carrying K/K genotype (reviewed in Prusiner 2004).
Many polymorphisms of bovine PRNP have been reported as shown in Figure 5 (Sander
et al. 2004). The positions of 60 polymorphisms detected in German cattle are indicated
with respect to the PRNP reference sequence AJ298878. The nucleotide sequence

Literature review 19
variants detected in the coding region of the bovine PRNP are a variation in the number
of octapeptide repeats and the substitution of base G -> A, C -> T and C->T at position
numbers 234, 339 and 576 of the coding region, respectively. For the octapeptide
repeats polymorphism, most cattle have five repeats, but some have six repeats
(Goldmann et al. 1991b, Hunter et al. 1994) and even seven repeats in Swiss brown
cattle (Schlapfer et al. 1999). The amino acid sequences of the octapeptide repeats are
Pro-His-Gly-Gly-Gly-Try-Gly-Gln or its longer variants Pro-Gln/His-Gly-Gly-Gly-Gly-
Try-Gly-Gln (see amino acid abbreviations in Appendix 1). In contrast to human and
sheep, no bovine PRNP polymorphism associated to the prion disease has been
reported. An analysis of 370 cattle in Scotland revealed no difference between the
frequencies of the PRNP octapeptide repeats genotypes (6/6, 6/5 and 5/5 repeats) in
healthy cattle and cattle with BSE (Hunter et al. 1994). Eventhough significant
differences in allele frequencies for the 23 bp insertion/deletion (indel) and 12 bp indel
polymorphisms (Figure 5) were observed in comparison between healthy and BSE
infected German cattle (Sander et al. 2004), these differences were not found in
Holstein cattle in Japan (Nakamitsu et al.2006).
Figure 5: Diagram illustrating the genomic architecture of the bovine PRNP.
(a) The positions of 60 polymorphisms detected in German cattle. (b) The three PRNP
exons are presented by black boxes; the protein coding region is shown as a hatched box
In mouse, classical genetic analysis of the control of ME7 scrapie agent incubation
period identified the presence of a single gene encoding two alleles; s7 for the one
which shortens the incubation time (180-200 days) and p7 for the one which prolongs
the incubation time (300 days or more) (DeArmond and Prusiner 1996, Dickinson et al.

Literature review 20
1968). It has been shown that these two alleles have an association to the
polymorphisms at codons 108 [leucine (L) -> phenylalanine (F)] and 189 [threonine (T)
-> valine] of the murine PRNP. Threonine at codon 189 is retained in mouse strains
carrying allele s7 but is absent in mice carrying p7. At codon 108, mice with short
incubation time encode leucine while mice with long incubation time encode
phenylalanine. The association between these two polymorphisms and incubation
period of prion disease in mice was supported by Barron et al. (2005) which presented
that both codons 108 and 189 control TSE incubation time and that each polymorphism
plays a distinct role in the disease process.
2.4.3 Polymorphisms of ovine PRNP and association to scrapie susceptibility
In sheep, within the PRNP coding sequence, several polymorphisms have been
identified up to date as described in Table 3 (DeSilva et al. 2003, Lan et al. 2006,
Seabury and Derr 2003, Tranulis 2002). The polymorphisms at codons 136 [alanine (A)
or valine(V)], 154 [histidine (H) or arginine (R)] and 171 [glutamine (Q), arginine or
histidine] of the ovine PRNP have been found to be linked with phenotypic expression
differences of scrapie including incubation period, clinical signs and pathology. On the
other hand, further polymorphisms are rare, and no association between these
polymorphisms and any disease phenotype has been reported (Tranulis 2002). The
presence of valine at codon 136 was detected mostly in natural scrapie-infected sheep
and is believed to be associated with high susceptibility to scrapie and short survival
times. Whereas alanine at codon 136, which was found mostly in healthy sheep of the
same flocks, is believed to be linked to resistance or incubation times that span beyond
the lifetime of sheep (Hunter et al. 1996, 1993, 1994, Laplanche et al. 1993, Tranulis
et al. 1999). The polymorphism at this position appears, in addition, to be associated to
control the disease incidence and to modulate the incubation period even in
experimentally induced scrapie sheep (Goldmann et al. 1991a, Maciulis et al. 1992).
Clouscard et al. (1995) and Tranulis et al. (1999) demonstrated that the major genetic
factor controlling the susceptibility to natural scrapie in sheep is also represented by
glutamine at codon 171 of the PRNP. Even the PRNP allele encoding valine at codon
136 confers a high risk of scrapie in many sheep breeds, in some breeds i.e. Suffolk
breed, this allele is vanishingly rare. Hunter et al. (1997) showed that in a single closed

Literature review 21
flock of Suffolk sheep in Scotland, scrapie occurred primarily in animals which were
homozygous for glutamine at codon 171, a genotype which is significantly less frequent
in healthy flocks. Moreover, O'Rourke et al. (1997) presented that after being inoculated
orally with a scrapie agent into a Suffolk flock, all sheep developing scrapie during the
observation period were homozygous for the glutamine at codon 171, whereas all
homozygous for arginine and heterozygous remained free of scrapie. There was only
one homozygous for arginine at codon 171 diagnosed with scrapie in Japan reported by
Ikeda et al. (1995).
The association between susceptibility to scrapie and the polymorphism at codon 154 is
unclear; however, there was evidence suggesting that a histidine substitution at codon
154 enhances the resistance to scrapie (Elsen et al. 1999, Thorgeirsdottir et al. 1999,
Tranulis et al. 1999).
Table 3: Polymorphisms in the coding region of ovine PRNP
Codon number Amino acid variant Codon number Amino acid variant
851 G <-> R 1461 N <-> S
1011 Q <-> R 1512 R <-> C
1122 M <-> T 1542 R <-> H
1163 A <-> P 1674 R <-> S
1272 G <-> S 1712 Q <-> K
1362 A <-> T 1712 Q <-> R or H
1362 A <-> V 1762 N <-> K
1372 S <-> A 1804 H <-> Y
1382 M <-> T 1891 Q <->L
1384 S <-> R 1954 T <-> S
1412 L <-> F 1964 T <-> S
1432 H <-> R 2112 R <-> Q 1 Lan et al. (2006), 2 Tranulis (2002), 3 Seabury and Derr (2003), 4 DeSilva et al. (2003)

Literature review 22
2.4.4 Ovine PRNP genotypes and risk groups
From the three polymorphisms of ovine PRNP described above, twelve alleles are
possible derivable, but only five alleles are commonly seen. They are A136R154R171,
A136R154Q171, A136R154H171, A136H154Q171 and V136R154Q171. The underscript numbers
present the order of amino acid, here after ARR, ARQ, ARH, AHQ and VRQ,
respectively (Belt et al. 1995, Tranulis 2002). In natural scrapie flocks, the VRQ allele
was detected with high frequency in scrapie affected sheep, whereas the ARR variant
was almost exclusively present in the healthy sheep of the flock-mates and believed to
be associated with resistance to developing the clinical signs of scrapie (Belt et al. 1995,
Goldmann et al. 1994, O'Doherty et al. 2002, Thorgeirsdottir et al. 1999). A study of
Bossers et al. (1996) demonstrated that sheep with at least one AR allele (polymorphic
amino acids at codons 136 and 171 are indicated) did not develop scrapie.
For the rest of the alleles, ARH allele is likely to be neutral, while the AHQ allele
decreased the risk of developing scrapie. The AHQ allele was not found in scrapie-
affected animals in Icelandic sheep (Thorgeirsdottir et al. 1999, 2002, Tranulis 2002).
However, VRQ and ARR alleles act dominant over the ARQ and ARH alleles. The
mechanisms by which the different PRNP alleles contribute to differences in scrapie
susceptibility and incubation time are not clear.
Table 4: Ovine PRNP genotypes and risk groups according to the polymorphisms
at codons 136, 154 and 171
Risk group Genotype
R1 ARR/ARR
R2 ARR/AHQ, AHQ/AHQ
R3 ARR/ARQ, ARR/ARH, ARQ/AHQ,
ARH/AHQ
R4 ARH/ARH, ARQ/ARH, ARQ/ARQ,
VRQ/ARR, VRQ/AHQ
R5 VRQ/ARQ, VRQ/ARH, VRQ/VRQ

Literature review 23
Based upon the common five alleles, fifteen genotypes have been investigated (Table
4). These genotypes have been divided into five risk groups according to the
susceptibility to scrapie. The ARR/ARR genotype (risk group 1, R1) is classified as
resistant to scrapie group, while the VRQ/ARQ, VRQ/ARH and VRQ/VRQ genotypes
(risk group 5, R5) are classified into the high susceptible group (Erhardt et al. 2002).
2.4.5 Expression of PRNP mRNA
PRNP mRNA is predominantly expressed in many regions of the central nervous
system (CNS) of humans and animals (Han et al. 2006, Harris et al. 1993, Kubosaki et
al. 2000, Manson et al. 1992, McLennan et al. 2001, Tichopad et al. 2003). In the brain,
the mRNA was predominantly localised within pyramidal cells of the hippocampus,
large neurons of the thalamus and neocortex, and Purkinje cells of the cerebellum (Tanji
et al. 1995). In the septum, the levels of PRNP transcripts and choline acetyltransferase
were found to increase in parallel during development (reviewed in Prusiner 2004).
In non-neuron tissues, PRNP mRNA was observed in spleen, lymph nodes, thymus,
muscle, liver, kidney and lung of sheep and cattle (Han et al. 2006, Tichopad et al.
2003), but unable to be detected in kidney and liver of mice (Miele et al. 2003). The
gene transcript was also found in reproductive tissues such as caruncle, myometrium,
stratum longitudinale tunicae muscles and circular layers of muscular tunics of ewes
(Kubosaki et al. 2000), and in spermatogenic cells of mice (Fujisawa et al. 2004).
During embryogenesis, PRNP transcripts were found in developing brain and spinal
cord of embryonic day 13.5 as well as in ganglia and nerves of the central and
peripheral nervous system of embryonic day 16.5 in mice. The gene transcript was also
detected in extra-embryonic tissues from day 6.5 and in specific non-neuronal cell
populations such as intestine, dental lamina, tooth bud and kidney of the 13.5 and 16.5
day embryos. However, no PRNP transcript could be detected by days 6.5 and 9.5 of
mouse embryogenesis (Manson et al. 1992). This is in contrast to the later study of
Miele et al. (2003), who represented the expression of PRNP mRNA in developing
neurons of mice since days 8.5 to 9.5. In chicken, mRNA for a chicken PrP was
detected in the brain and spinal cord as early as day 6 (the earliest stage studied) and
was also found in dorsal root ganglia, retina, intestine and heart of day 11 embryos
(Harris et al. 1993).

Material and methods 24
3 Material and methods
This study was started with the PRNP genotyping in sheep of various breeds according
to the reported polymorphisms at codons 136, 154 and 171 (Tranulis 2002). The sheep
were then classified into 5 risk groups as described in Erhardt et al. (2002). A number of
resistant (R1) and high susceptible to scrapie (R5) ewes were selected and mated to ram
of the same risk group. PRNP mRNA expression analysis was performed in
preimplantation embryos by real time RT-PCR, in various reproductive tissues of
pregnant ewes and various tissues of their conceptuses during prenatal stage using
semiquantitative RT-PCR. Moreover, normal cellular prion protein (PrPC) was detected
in reproductive tissues of pregnant ewes, 1-month-old foetuses and various tissues of
2-month-old foetuses using western blotting. Localisation of the gene transcript and the
protein was performed in adult ovaries and 1-month-old foetuses by in situ
hybridisation and immunohistochemistry, respectively.
3.1 Material
3.1.1 Animals and sampling
Sheep of various breeds were used for PRNP genotyping. However, after grouping and
selection, Black head and Bentheimer breed were used for gene and protein expression
analyses. All of the Bentheimer sheep were R5 genotypes, whereas most of the Black
head sheep were R1 genotype. Immature oocytes, mature oocytes and in vivo embryos
at morula stage were collected from specifically selected ewes using standard
techniques and subjected to RNA isolation as mentioned in 3.2.4.1. In addition, foetuses
and female reproductive organs such as ovary, oviduct, endometrium, myometrium and
caruncle were collected from R1 and R5 ewes at the 1st, 2nd, 3rd and 5th month of
pregnancy (n = 2 from each group). The foetuses at the 2nd, 3rd and 5th month were
separated into single organs of brain, cotyledon, spinal cord, heart, intestine, liver, lung,
muscle and spleen. The samples were snap frozen in liquid nitrogen and kept at -80°C
until used for RNA isolation (in 3.2.4.2), fluorescence in situ hybridisation (in 3.2.9),
western blotting (in 3.2.10) and immunohistochemistry (in 3.2.11).

Material and methods 25
3.1.2 Laboratory equipment
Amersham Biosciences (Buckinghamshire, UK):
Ultraspec 2100 pro spectrophotometer
Applied Biosystems (Foster City, CA, USA):
ABI Prism Sequence Detection System Instrument
BioRad (Munich, Germany):
Electrophoresis, Power Supply PAC 3000, Power Supply Mini-Protran,
Trans-Blot SD Semi-Dry Transfer Cell
Carl-Roth (Karlsruhe, Germany):
Hellendahl jars, Rotilabo®-Probenröhrchen
Heraeus (Hanau, Germany):
Incubator (BB16)
Hermle (Wehingen, Germany):
Centrifuge
Leica (Nussloch, Germany):
Cryostat CM 3050 S
Li-cor Biotechnology (Lincoln, USA)
Li-cor autonated DNA sequencer (model 4200)
MJ Research (USA):
PCR thermal cycler (PTC 100)
Menzel-Gläser (Braunschweig, Germany):
SuperFrost Plus slide
Schleicher & Schuell BioScience (Dassel, Germany):
Nitrocellulose transfer membrane (Protran, pore size 0.45 µm)

Material and methods 26
3.1.3 Biological materials, reagents, kits and buffers
3.1.3.1 Biological materials
Applichem (Darmstadt, Germany):
50x Denhardt’s solution
Biomol (Hamburg, Germany):
Lambda DNA Eco91I (BstE II), Lambda DNA HindIII, Phenol
Biozym Diagnostik (Hessisch-Oldendorf, Germany):
Sequagel XR sequencing gel, Sequagel complete buffer reagent
Fermentas (St. Leon-Rot, Germany):
PageRuler™ Unstained Protein Ladder, Ribonuclease A, Ribonuclease T1
Invitrogen (Karlsruhe, Germany):
Dynal beads Oligo (dT)25
Kodak (Japan):
Autoradiography film (Kodak Biomax XAR film)
Merck Eurolab GmbH (Darmstadt, Germany)
Kaiser’s glycerol gelatine, Hematoxylin
MWG Biotech (Eberberg, Germany):
Oligonucleotide primers
Promega (Mannheim, Germany):
Random primer, RQ1 RNase-free Dnase and 10x RNase-free buffer,
RNasin® Ribonuclease inhibitor inhibitor, DTT 0.5 M
Roche (Mannheim, Germany)
Fish sperm DNA, Horseradish peroxidase anti-digoxigenin antibody
Roth (Karlsruhe, Germany):
Acetic acid, Agar-Agar, Ampicillin, Ammonium peroxydisulfate, Boric
acid, 5-bromo-4-chloro-3-indolyl-β-D-galactopyra-noside (X-gal),
Bromophenol blue, Chloroform, DEPC, Dimethyl sulfoxide (DMSO), Di-
sodium hydrogen phosphate dihydrate (Na2HPO4*2H2O), dNTPs set,
Ethanol, Ethylenediamine tetra acetic acid di sodium salt, Ethidium
bromide, 37% Formaldehyde, Formamide, Glycerine, Hydrochloric acid,

Material and methods 27
Hydrogen peroxide (30%), Isopropyl β-D-thiogalactoside (IPTG),
Korsolin FF, Methanol, Mop, N,N´-dimethylformamide, Pepton,
Proteinase K, Sodium acetate, Sodium chloride, Sodium di-hydrogen
phosphate, Sodium dodecyl sulfate (SDS), Sodium hydroxide, TEMED,
Tris, Tri-sodium-citrate*2H2O, Xylene cyanol, Yeast extract
SERVA Electrophoresis GmbH (Heidelberg, Germany):
Acrylamide, Bisacrylamide
Sigma-Aldrich Chemie GmbH (Taufkirchen, Germany):
Acetic anhydrid, Acetone, Agarose, 3-amino-9-ethylcarbazole (AEC), 6-
aminohexanoic acid, Blue dextran, Dextran sulphate,
Dimethylformamide, Glycine, Guanidine hydrochloride, Igepal,
Isopropanol, Lithium chloride, 2-Mercaptoethanol, Paraformaldehyde,
Polyvinyl pyrolidone (PVP), Ponceau S, Protease inhibitor cocktail, Tag
DNA polymerase and 10x Buffer, Triethanolamine, Tri Reagent, Tween®
20, Yeast tRNA
Stratagene (Amsterdam, NL):
5α DH Escherichia coli competent cells
3.1.3.2 Kits
Amersham Biosciences (Buckinghamshire, UK):
ECL Plus Western Blotting Detection
Biozym Diagnostik (Hessisch-Oldendorf):
SequiTherm ExcelTMII DNA sequencing kit
Invitrogen (Karlsruhe, Germany):
SuperscriptTM II RNase H- Reverse Transcriptase
PerKin Elmer (Rodgau Juegesheim, Germany)
TSATM-Plus Fluorescein System
Promega (Mannheim, Germany):
pGEM-T vector
Qiagen (Hilden, Germany):
RNeasy Mini Kit

Material and methods 28
Roche (Mannheim, Germany):
DIG RNA labelling kit
Santa Cruz Biotechnology (Heidelberg, Germany)
Mouse ABC Staining System
Sigma (Steinheim, Germany):
GenEluteTM Plasmid Miniprep Kit
SYBR Green JumpStartTM Tag ReadyMixTM
3.1.3.3 Buffers and reagents
All solutions were prepared with deionised and demineralised millipore water and pH
was adjusted with sodium hydroxide (NaOH) or hydrochloric acid (HCl).
General reagents
DEPC-treated water: DEPC 1.00 ml
Water added to 1,000.00 ml
Incubate overnight at 37°C and heat inactivate by
autoclaving
dd H2O: Deionised millipore water
Autoclave (for in situ hybridisation)
10x PBS: NaCl 87.67 g
Na2HPO4.2H2O 15.00 g
NaH2PO4 2.04 g
Water added to 1,000.00 ml
For in situ hybridisation, treat with 1 ml DEPC, incubate
overnight at 37°C and heat inactivate by autoclaving

Material and methods 29
1x PBS: 10x PBS 100.00 ml
Water added to 1,000.00 ml
For in situ hybridisation, treat with 1 ml DEPC, incubate
overnight at 37°C and heat inactivate by autoclaving
1x PBS-Tween (PBST): 1x PBS 999.50 ml
Tween®20
0.50 ml
Tris-HCl (1 M): Tris 121.14 g
Water added to 1,000.00 ml
Adjust pH to the required pH
EDTA (0.5 M, pH 8.0):
Ethylendiamin tetra acetic acid
disodium salt
186.12
g
Water added to
1,000.00 ml
EDTA (5 mM, pH 8.0) EDTA (0.5 M, pH 8.0) 10.00 ml
Water added to
1,000.00 ml
DNA isolation
Digestion buffer: 9% NaCl 6.50 ml
Tris (1 M, pH 7.5) 5.00 ml
EDTA (0.5 M, pH 8.0) 0.20 ml
SDS (10%) 1.00 ml
Mercaptoethanol
2.00 ml
Proteinase K 10 mg/ml
Phenol-Chloroform 1/1 (v/v)

Material and methods 30
1x TE buffer: Tris-HCl (1 M, pH 8.0) 0.50 ml
EDTA (0.5 M, pH 8.0) 0.10 ml
Water added to
50.00 ml
RNA isolation
Binding buffer: Tris-HCl (1 M, pH 7.5) 1.00 ml
Lithium chloride (5 M) 10.00 ml
EDTA (5 mM, pH 8.0) 20.00 ml
Water added to
50.00 ml
Washing buffer: Tris-HCl (1 M, pH 7.5) 0.50 ml
Lithium chloride (5 M) 1.50 ml
EDTA (5 mM, pH 8.0) 1.00 ml
Water added to
50.00 ml
Protein isolation
Guanidine Guanidine hydrochloride 1.43 g
hydrochloride (0.3 M): 95% Ethanol added to
50.00 ml
4x Sample loading Tris (1 M, pH 6.8) 13.00 ml
buffer: SDS 6.00 g
2-Mercaptoethanol 10.00 ml
Glycerine 20.00 ml
Bromophenol blue 10.00 mg
Water added to
50.00 ml
DNA electrophoresis
50x TAE: Tris 242.00 g
Acetic acid 57.10 ml
EDTA (0.5 M, pH 8.0) 100.00 ml
Material and methods 31
Water added to
1.000.00 ml
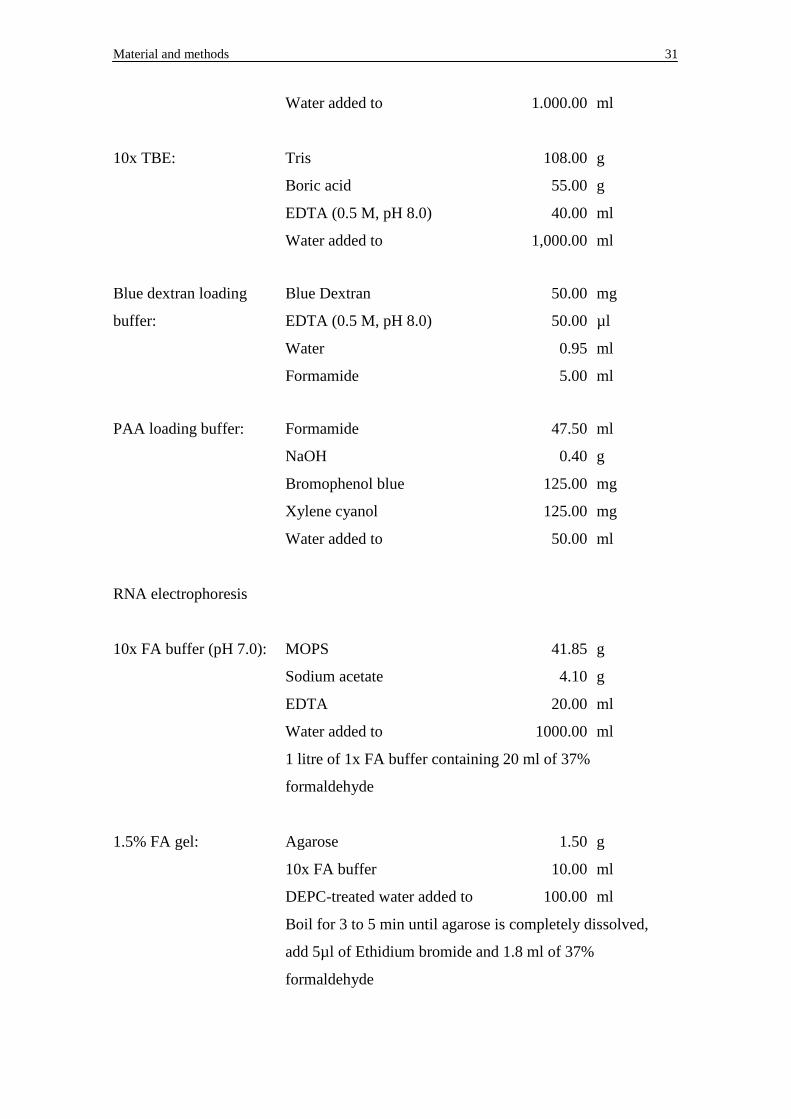
10x TBE: Tris 108.00 g
Boric acid 55.00 g
EDTA (0.5 M, pH 8.0) 40.00 ml
Water added to
1,000.00 ml
Blue dextran loading Blue Dextran 50.00 mg
buffer: EDTA (0.5 M, pH 8.0) 50.00 µl
Water 0.95 ml
Formamide
5.00 ml
PAA loading buffer: Formamide 47.50 ml
NaOH 0.40 g
Bromophenol blue 125.00 mg
Xylene cyanol 125.00 mg
Water added to
50.00 ml
RNA electrophoresis
10x FA buffer (pH 7.0): MOPS 41.85 g
Sodium acetate 4.10 g
EDTA 20.00 ml
Water added to 1000.00 ml
1 litre of 1x FA buffer containing 20 ml of 37%
formaldehyde
1.5% FA gel: Agarose 1.50 g
10x FA buffer 10.00 ml
DEPC-treated water added to 100.00 ml
Boil for 3 to 5 min until agarose is completely dissolved,
add 5µl of Ethidium bromide and 1.8 ml of 37%
formaldehyde

Material and methods 32
Protein electrophoresis
Anode buffer I: Tris-HCl (1 M, pH 10.4) 150.00 ml
Methanol 50.00 ml
Water added to
500.00 ml
Anode buffer II: Tris-HCl (1 M, pH 10.4) 12.50 ml
Methanol 50.00 ml
Water added to
500.00 ml
Cathode buffer: Tris-HCl (1 M, pH 9.4) 12.50 ml
Methanol 50.00 ml
6-aminohexanoic acid 3.94 g
Water added to
500.00 ml
Seperation gel (15%):
Acrylamide/Bis-acrylamide
[30%/0.8% (w/w)]
7.50 ml
Tris-HCl (1 M, pH 8.8) 5.60 ml
SDS (10%) 0.15 ml
Water 1.75 ml
Temed 10.00 µl
APS (20%)
30.00 µl
Stacking gel: Acrylamide/Bis-acrylamide
[30%/0.8% (w/w)]
1.50 ml
Tris-HCl (1 M, pH 6.8) 1.30 ml
SDS (10%) 0.15 µl
Water 7.05 ml
Temed 10.00 µl
APS (20%)
30.00 µl

Material and methods 33
10x Running buffer: Tris 30.30 g
Glycine 144.00 g
SDS 10.00 g
Water added to
1,000.00 ml
0.2% Porceau S: Ponceau S 1.00 g
Acetic acid 50.00 ml
Water added to
500.00 ml
Cloning
Amplicillin: Amplicillin 10.00 mg
Sterilized water
1.00 ml
IPTG solution (0.5 M): IPTG 1.20 g
Water added to 10.00 ml
Filter-sterilize and store at -20°C
LB-agar plate: NaCl 8.00 g
Peptone 8.00 g
Yeast extract 4.00 g
Agar-agar 12.00 g
NaOH (1 N) 0.48 ml
Water added to 800.00 ml
Autoclave-sterilize
LB-broth: NaCl 8.00 g
Peptone 8.00 g
Yeast extract 4.00 g
NaOH (1 N) 0.48 ml
Water added to 800.00 ml
Autoclave-sterilize

Material and methods 34
X-Gal working solution: X-Gal 50.00 mg
N, N´-dimethyl-formamide 1.00 ml
Store at -20°C.
In situ hybridisation
50% Dextran sulphate: Dextran sulphate 2.00 g
DEPC-treated H2O 2.50 ml
Leave to dissolve overnight. Adjust to 4.0 ml with DEPC-
treated H2O. Prepare always fresh in 25.0 ml measuring
cylinder one day prior to preparation of hybridisation
buffer
70% DMF: Dimethylformamide (DMF) 3.50 ml
DEPC-treated H2O 1.50 ml
Prepare fresh
Hybridisation buffer: 50% Dextran sulphate 4.00 ml
NaCl (2.5 M) 1.20 ml
Formamide, deionised 10.00 ml
20x SSC 2.00 ml
Yeast tRNA (10 mg/ml) 0.40 ml
50x Denhardt's solution 0.40 ml
Fish sperm DNA (10 mg/ml) 2.00 ml
Mix thoroughly, wait until air bubbles have disappeared,
and store 1 ml aliquots at -20°C
NaCl (2.5 M): NaCl 14.61 g
Water added to 100.00 ml
Treat with 0.1% (100 µl) DEPC, incubate overnight at
37°C and heat inactivate by autoclaving

Material and methods 35
4% PFA (pH 7.3): Paraformaldehyde 10.00 g
1 x PBS added to 250.00 ml
Bring to 65°C under ventilation hood, add 5 µl of 5 M
NaOH for solution to become clear, store protected from
light and use within 2 weeks
20x SSC (pH 7.0): NaCl 87.66 g
Tri-Na-citrate*2 H2O 44.12 g
Water added to 500.0 ml
Treat with 1% (500 µl) DEPC. Incubate overnight at 37°C
and heat inactivate by autoclaving
2x SSC: 20x SSC 100.00 ml
DEPC-treated water
900.00 ml
0.1 M TEA buffer Triethanolamine 13.20 ml
(pH 8.0): DEPC-treated water added to 1,000.00 ml
Autoclave. Store at RT protected from light
TNB blocking buffer: Blocking reagent 0.50 g
TN buffer 100.00 ml
Add blocking reagent slowly in small increments to TN
buffer while stirring, if necessary heat to 60°C to dissolve
completely. Store aliquots at -20°C
TN buffer (pH 7.5): Tris 12.11 g
NaCl 8.77 g
Water added to
1,000.00 ml
TNT wash buffer: TN buffer 995.00 ml
10% Tween 20
5.00 ml

Material and methods 36
10% Tween 20: DEPC-treated H2O 45.00 ml
Tween®20
5.00 ml
Yeast tRNA (10 mg/ml): Yeast tRNA 25.00 mg
DEPC-treated H2O 2.50 ml
Dissolve by incubating on ice for at least 1 h.
Store aliquots at -20°C.
Immunohistochemistry
AEC stock solution: AEC 100.00 mg
DMF 10.00 ml
Store at 4°C and protect from light
AEC substrate (10 ml): AEC stock solution 0.50 ml
Sodium acetate (50 mM, pH 5.0) 9.50 ml
Sodium hydroxide (30%)
5.00 µl
Sodium acetate Sodium acetate 4.10 g
(50 mM, pH 5.0): Water added to 1000.00 ml
3.1.4 Sources of software and Internet facilities
ABI Prism Sequence Detection System
Software
Applied Biosystems (Foster City, USA)
BLAST program http://www.ncbi.nlm.nih.gov/blast/
Image analysis program (version 4.10) Li-cor Biotechnology (Lincoln, USA)
Multiple sequence alignment http://prodes.toulouse.inra.fr/multalin/
multalin.html
Primer Express Software version 2.0 Applied Biosystems (Foster City, USA)
SAS version 8.0 SAS Institute Inc. (Cary, NC)
Weight to Molar Quantity (for nucleotide) http://www.molbiol.ru/eng/scripts/
01_07.html

Table 5: Details of primers used for amplification and sequencing
Genes Primer sequence (5´-3´) Position within
ref sequence
Product
size (bp)
Annealing
temperature (°C)
Accession
number
Ovine PRNP
(external) a
TCAGTGGAACAAGCCCAGTAAGC
GGTGGTGACTGTGTGTTGC
22577
22859 283
Touch down
64-58 U67922
Ovine PRNP
(internal) b
AGCTGGAGCAGTGGTAGG
GTGATGTTGACACAGTCATGC
22637
22814 198 60 U67922
Ovine PRNP c, d CCAAGCTGAAGCATCTGTCTTCC
TCACTCCACATGGCCACAAAG
89
219 131 58 NM_001009481
Ovine H2a d CACCTCAAATCTAGGACGACTAGCC
CGATGCATTTCCTGCCAATTC
210
326 117 60 AY074805
18S-rRNA c, d GCGCGCAAATTACCCAC
GCTGGAATTACCGCGGCT
89
247 159 54 AF176811
a The primer used for DNA amplification in genotyping procedure, b The primer used for PRNP sequencing, c The primer used for RT-PCR, d The primer used for real time PCR
Ma
teria
l and
me
thod
s
37

Material and methods 38
3.2 Methods
3.2.1 Primers design
All of the primers used in this study were designed for PCR amplification and in vitro
transcription using Primer Express® Software v2.0 (Applied Biosystems, Foster City,
CA, USA). Primer sequences, size of amplified products, annealing temperature and the
GenBank accession number are shown in Table 5.
3.2.2 PRNP genotyping
3.2.2.1 Blood sampling
To identify the PRNP genotype of ewes and rams, 10 ml of blood was taken from the
jugular vein of the animal, kept in a tube containing 500 µl of 0.5 M EDTA as an
anticoagulant and chilled immediately on ice. After centrifugation of blood samples at
1,100 rpm for 30 min, the blood was separated into: 1) a lower red blood cell phase,
2) a middle phase of white blood cells, and 3) a colourless upper aqueous phase of
plasma. The middle layer was transferred to a new sterile 15 ml tube. Nine ml of
deionised and demineralised water was added to the sample and the mixture was then
mixed by inversion for 20 sec followed immediately by adding 1 ml of 9% NaOH. The
mixture was centrifuged at 1,100 rpm for another 15 min. Supernatant was discarded
and the pellet was used for DNA isolation.
3.2.2.2 DNA extraction from blood samples
Genomic DNA from blood samples of sheep was isolated using standard
phenol/chloroform extraction method. All centrifugation steps were conducted at 12,000
x g. To the white blood cell pellet from previous step 0.7 ml of digestion buffer and
20 µl of proteinase K were added. The mixture was incubated at 50°C overnight at 100
rpm in a shaking incubator. Complete pellet digestion resulted in a viscous
homogeneous solution. An equal volume of phenol-chloroform was added and mixed
by several inversions. The sample was then centrifuged for 10 min at room temperature.
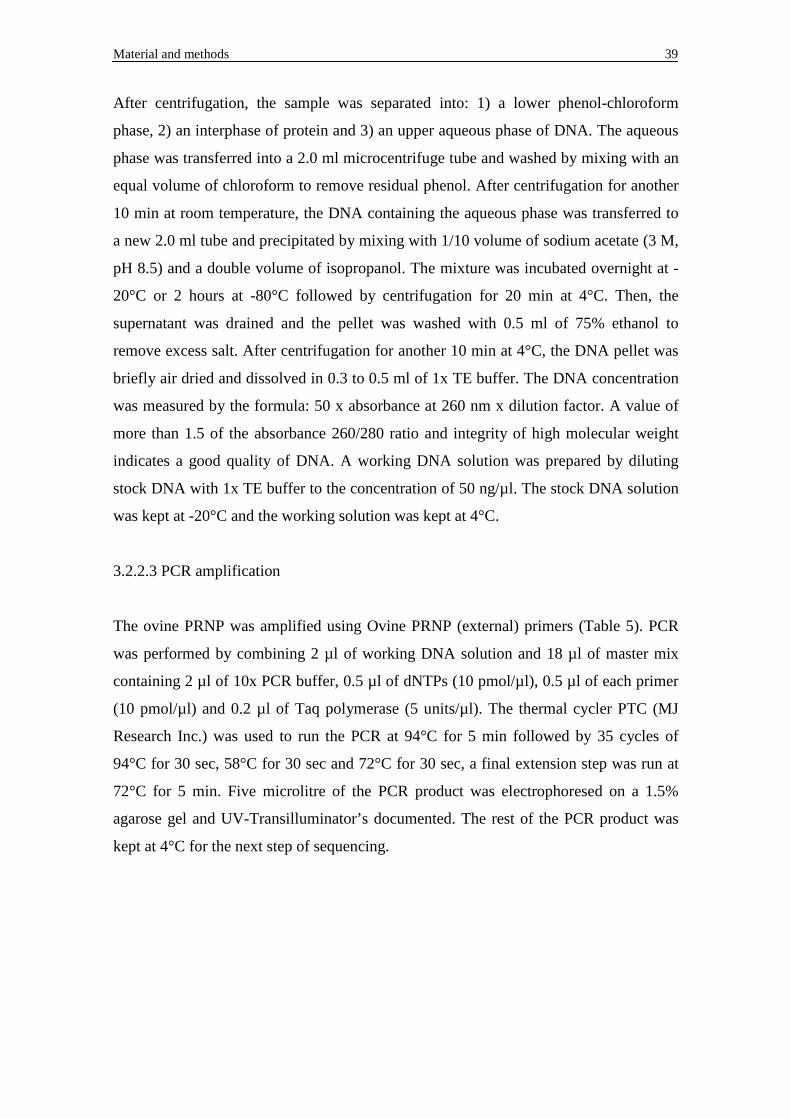
Material and methods 39
After centrifugation, the sample was separated into: 1) a lower phenol-chloroform
phase, 2) an interphase of protein and 3) an upper aqueous phase of DNA. The aqueous
phase was transferred into a 2.0 ml microcentrifuge tube and washed by mixing with an
equal volume of chloroform to remove residual phenol. After centrifugation for another
10 min at room temperature, the DNA containing the aqueous phase was transferred to
a new 2.0 ml tube and precipitated by mixing with 1/10 volume of sodium acetate (3 M,
pH 8.5) and a double volume of isopropanol. The mixture was incubated overnight at -
20°C or 2 hours at -80°C followed by centrifugation for 20 min at 4°C. Then, the
supernatant was drained and the pellet was washed with 0.5 ml of 75% ethanol to
remove excess salt. After centrifugation for another 10 min at 4°C, the DNA pellet was
briefly air dried and dissolved in 0.3 to 0.5 ml of 1x TE buffer. The DNA concentration
was measured by the formula: 50 x absorbance at 260 nm x dilution factor. A value of
more than 1.5 of the absorbance 260/280 ratio and integrity of high molecular weight
indicates a good quality of DNA. A working DNA solution was prepared by diluting
stock DNA with 1x TE buffer to the concentration of 50 ng/µl. The stock DNA solution
was kept at -20°C and the working solution was kept at 4°C.
3.2.2.3 PCR amplification
The ovine PRNP was amplified using Ovine PRNP (external) primers (Table 5). PCR
was performed by combining 2 µl of working DNA solution and 18 µl of master mix
containing 2 µl of 10x PCR buffer, 0.5 µl of dNTPs (10 pmol/µl), 0.5 µl of each primer
(10 pmol/µl) and 0.2 µl of Taq polymerase (5 units/µl). The thermal cycler PTC (MJ
Research Inc.) was used to run the PCR at 94°C for 5 min followed by 35 cycles of
94°C for 30 sec, 58°C for 30 sec and 72°C for 30 sec, a final extension step was run at
72°C for 5 min. Five microlitre of the PCR product was electrophoresed on a 1.5%
agarose gel and UV-Transilluminator’s documented. The rest of the PCR product was
kept at 4°C for the next step of sequencing.

Material and methods 40
3.2.2.4 Sequencing
Direct DNA sequencing was employed to genotype the PRNP polymorphisms as
previously described by using the SequiTherm EXCELTM II DNA Sequencing Kit
(Biozym Diagnostik, Germany) and LI-COR automated DNA sequencer (LI-COR
Biotechnology, USA). The sequencing was performed by dye the termination method.
The primers used were fluorescent labelled primers [Ovine PRNP (internal) primers,
Table 5] which can be read by laser of the sequencer. For each sample, four reactions
were performed; each reaction had one dideoxy nucleotide termination mix (ddATP,
ddTTP, ddCTP and ddGTP) which would terminate the elongation reaction once the
nucleotide binds to the elongating strand. Each reaction consists of 1 µl of termination
mix and 2 µl of premix solution [3.6 µl of 3.5x Excel II sequencing buffer, 0.25 µl of
forward primer (10 pmol/µl), 0.25 µl of reverse primer (10 pmol/µl), 0.5 µl of Taq
polymerase (5 units/µl) and 3.9 µl of PCR product from step 3.2.2.3]. The reaction was
run on a thermocycler at 94°C for 5 min followed by 20 cycles of 94°C for 20 sec, 60°C
for 20 sec and 68°C for 20 sec. Immediately after PCR, 1.5 µl of stop buffer was added
and the product was stored at –20oC till loading. The sequencing reactions were
denatured at 90°C for 5 min and immediately loaded onto the 41 cm 6% Sequagel-XR
(Biozyme Diagnostik, Germany). Electrophoresis was performed on a LI-COR model
4200 automated DNA sequencer in 1x TBE buffer at 50°C, 50 W and 1500 V.
Sequence data was analysed by using the Image Analysis program, version 4.10 (LI-
COR Biotechnology).
3.2.3 Oocytes and in vivo embryo collection
Ovaries and uteri were taken from specifically mated ewes at a specific time range. The
ovaries were removed and kept in 35°C warm 0.9% physiological salt solution
supplemented with 0.5 ml Streptocombine® per litre. Before aspiration of cumulus
oocyte complexes (COCs), the ovaries were washed once in 70% ethanol followed by
two times of washing in 0.9% salt solution. The COCs were aspirated from follicles
using 5 ml syringe attached with 18G needle. The follicle fluid was allowed to
precipitate for 15 min and the competent COCs were picked out using a glass pipet. For
the morula stage embryo collection, ewes were slaughtered and the uteri were dissected

Material and methods 41
at the uterotubal junction and the cervix. Both uterine horns were divided at the
bifurcation and flushed with 40 to 50 ml of Phosphate buffer saline (PBS, 39°C) each.
After precipitation, the embryos were picked using a glass pipet. A total of 3 to 5
oocytes and single embryos were washed two times with PBS and treated with acidic
Tyrode pH 2.5 to 3 to dissolve the zona pellucida. The zona free oocytes and embryos
were snap frozen in cryotubes containing 1.5 µl of lysis buffer [0.8% Igepal, 1 U/µl
RNasin, 5 mM DTT], before storage at –80°C for the further work of RNA isolation.
3.2.4 RNA isolation and cDNA synthesis
3.2.4.1 Oocytes and preimplantation embryos
RNA isolation
Three independent pools of each containing 15 to 20 immature oocytes or 3 embryos
were used for mRNA isolation using oligo (dT)25 attached magnetic beads following
the manufacturer’s instruction. Briefly, samples in lysis buffer were mixed with the total
volume of 40 to 60 µl of binding buffer and incubated for 5 min at 70°C to obtain
complete lysis of the sample. Twenty microlitres of oligo(dT) magnetic bead suspension
was washed twice with double volume of binding buffer and resuspensed in 4 µl of
binding buffer before added to the samples. The mixture was then incubated for 30 min
at room temperature and chilled on ice after this step until finish. The hybridised mRNA
and oligo(dT) magnetic beads were washed three times with 100 µl of washing buffer.
Finally, mRNA samples were eluted in 11 µl of DEPC-treated water and heated at 90°C
for 4 min.
cDNA synthesis
The mRNA samples were reverse transcribed in 20 µl reaction volume containing 1 µl
of oligo dT(12)N primer (where N = G, A or C), 1 µl of random primer (500 ng/µl),
4 µl of 5x first strand buffer, 2.5 µl of 0.1 M DTT, 1 µl of each dNTPs (40 pmol/µl) and
RNase inhibitor, and 0.5 µl of SuperScript II reverse transcriptase (200 unit/µl). In
terms of the order of adding the reaction components, mRNA, random primer and

Material and methods 42
oligo(dT) primer were mixed and heated for 5 min at 70°C. The mix was placed on ice
until the addition of the remaining reaction components and then incubated for 90 min
at 42°C. The reaction was terminated by heat inactivation for 15 min at 70°C. The
cDNA solution was kept at -20°C until used for gene expression analyses using real
time PCR technique.
3.2.4.2 Tissue samples
RNA isolation
Total RNA was isolated from tissue samples using TRIZOLE Reagent following the
manufacturer’s instruction. The tissue samples stored at –80°C were taken out just
before isolation. About 30 to 40 mg of tissue was ground by using mortal and pestle,
and incubated with 1 ml of TRIZOL for 5 minutes at room temperature to permit
complete dissociation of nucleoprotein complexes. The clear homogenate was then
mixed with 0.2 ml of chloroform and vigorously shaken by hand for 15 sec. After
centrifugation at 12,000 x g for 15 min at 4oC, the mixture was separated into:
1) a lower red phenol-chloroform phase, 2) a white interphase and 3) a colorless upper
aqueous phase containing RNA. The aqueous phase was transferred to a fresh 2.0 ml
tube and the RNA was precipitated by adding 0.5 ml of isopropanol. The sample was
then incubated at room temperature for 10 min and centrifuged at 12,000 x g for 10 min
at 4oC. After centrifugation, the RNA precipitate becomes visible as white pellet at the
bottom of the tube. The supernatant was drained off and the pellet was washed once
with 1 ml of 75% ethanol before being centrifuged at 12,000 x g for 5 min at 4°C. The
ethanol supernatant was removed and the RNA pellet was briefly air dried for 5 to 10
min and dissolved with 22 µl of DEPC-treated H2O. The quality of RNA was checked
by running 2 µl of total RNA in 1.5% FA gel.
DNase digestion and RNA purification
All good quality RNA samples were subjected to DNase digestion to avoid the residual
DNA by mixing 20 µl of RNA extract with the premix of 7.5 µl of deoxyribonuclease I
(RQ1 DNase), 4 µl of 10x RQ1 buffer, 1 µl of RNase inhibitor and 7.5 µl of DEPC

Material and methods 43
treated water. The mixture was incubated for 1 hour at 37°C. The digested RNA was
purified using RNeasy mini kit (Qiagen, Germany) following the manufacturer’s
instruction. The quality of the RNA was checked by running 2 µl of total RNA in 1.5%
FA gel. The OD spectrometer value was taken to estimate the concentration of total
RNA by the formula: 40 x absorbance at 260 nm x dilution factor. A working RNA
solution was prepared by diluting stock RNA with DEPC-treated H2O to the
concentration of 200 ng/µl. Both of stock and working RNA solution was kept at -80°C
for further use.
cDNA synthesis
One microgram of total RNA was reverse transcribed using reverse transcriptase to
synthesize cDNA. Five microlitre of total RNA working solution and 1 µl of each oligo
dT(12)N (100 pmol/µl) and random primers (500 ng/µl) were added in a 0.2 ml PCR
tube. The mixture was incubated for 5 minutes at 70°C and then immediately chilled on
ice. Thirteen microlitre of the premix containing 4 µl of 5x first strand buffer, 2.5 µl of
0.1 M DTT, 5 µl of dNTPs (10 pmol/µl) and 1 µl of each RNase inhibitor and
SuperScriptIITM reverse transcriptase (200 unit/µl) was mixed and incubated for 90
minutes at 42oC followed by heat inactivation for 15 min at 70°C. The synthesized
cDNA was diluted with 150 µl of DEPC-treated H2O and stored at –20oC for further
use.
3.2.5 Semiquantitative PCR
Polymerase chain reaction was used to quantify the amount of gene transcript in sample
tissues. In this study the levels of 18S-rRNA transcript were used as an internal
standard. The appropriate cycle number of PCR was pre-optimised. Each cDNA source
was done in duplicate to control the reproducibility of results. Ovine PRNP PCR was
performed using Ovine PRNP primers, and 18S-rRNA PCR was done using the 18S-
rRNA primers (Table 5). The thermo cycle condition of ovine PRNP PCR was
programmed at 94°C for 5 min followed by 28 cycles of 94°C for 30 sec, 58°C for 30
sec, 72°C for 30 sec and a final extension step of 72°C for 5 min. The 18S-rRNA PCR
Material and methods 44
was performed using cycles of 94°C for 5 min, 15 cycles of 94°C for 30 sec, 54°C for
30 sec and 72°C for 30 sec followed by a final extension step of 72°C for 5 min.
3.2.6 Plasmid DNA preparation
3.2.6.1 PCR amplification
The ovine PRNP, histone H2a and 18S-rRNA PCR for plasmid DNA preparation were
amplified by using Ovine PRNP, Ovine H2a and 18S-rRNA primers, respectively, as
shown in Table 5. cDNA from adult brain was used as template for every reaction. The
PCR reaction was combined as described in step 3.2.2.3 and the thermo cycler was
programmed at 95°C for 5 min followed by 35 cycles of denaturing at 94°C for 30 sec,
annealing at temperatures as indicated in Table 5 for 30 sec and extension at 72°C for
30 sec. Following the last cycle, a 5 min elongation step at 72°C was performed.
3.2.6.2 PCR product extraction
The PCR product was extracted from agrose gel using basic method base on phenol-
chloroform extraction. All the centrifugation steps were carried out at 12,000 x g at 4°C.
Briefly, the PCR fragment was electrophoresed and sliced out from the 1.0% agarose
gel. The gel slice was frozen in a 1.5 ml microcentrifuge tube for 30 min at -20°C and
chopped into small pieces. The gel was then homogenized with 0.5 ml of 1x TE buffer
by repeatedly forcing through a syringe and needle. The extraction was carried out by
vigorously vortexing the gel solution with 0.6 ml of phenol-chloroform. By
centrifugation for 15 min, the mixture was separated into a lower phenol-chloroform
phase, an interphase of precipitated protein, and an upper aqueous phase containing the
PCR product. The aqueous phase was taken to a fresh tube, shaken with an equal
volume of chloroform to remove possibly carried over phenol, and recentrifuged for
another 10 min. The clear aqueous phase was precipitated by gentle mixing with 50 µl
(or 1/10 volume) of sodium acetate solution (3 M, pH 5.3) and 1.5 ml of 100% ethanol
(or 2.5 volume). Precipitation was maximized by placing at -20°C for 2 hour. The
precipitated PCR product was pelleted at 12,000 x g for 30 min at 4°C. The supernatant
was then removed and the pellet was washed with 1.0 ml of 70% ethanol to remove
Material and methods 45
excess salt. The mixture was recentrifuged to remove the supernatant and then the pellet
was air dried briefly. Finally, the pellet was gently dissolved in 7 µl of ddH2O.
3.2.6.3 Ligation
The pGEM®-T Vector System I ligation kit was used. The ligation was performed by
mixing 2.5 µl of 2x ligation buffer, 1.5 µl of gel purified PCR product, 0.5 µl of pGEM
vector (50 ng) and 0.5 µl of T4 DNA ligase (3 units/µl), and by an incubation for
2 hours at 20°C or overnight incubation at 4°C.
3.2.6.4 Competent cell preparation
Competent cells were prepared from stock bacteria E. coli strain DH5α (Clontech).
Stock solution of bacteria was streaked on LB plate without ampicillin and incubated
overnight at 37°C. A single colony was picked and inoculated in 50 ml of LB broth
(without ampicillin). Inoculums were shaken gently at 37°C approximately 6 hours,
during this OD was periodically measured to keep the OD no more than 0.3. Then, the
cell culture was centrifuged at 5,000 x g for 10 min at 4°C. The pellet was resuspended
in 25 ml of cold sterile 0.1 M CaCl and incubated on ice for 20 min. The cells were
recentrifuged at 5,000 x g for 5 min at 4°C and then resuspended in 5 ml of 0.1 M CaCl
containing 20% glycerol. The cell suspension was aliquoted into 1.5 ml microcentrifuge
tubes and stored at -80°C.
3.2.6.5 Transformation
Transformation was performed by combining 60 µl of competent E. coli cells DH5α and
5 µl of ligation reaction in a 15 ml falcon tube and incubating on ice for 30 min. After
incubation, heat-shock was performed by placing the tube for 90 sec in water bath at
exactly 42°C and immediately returning to ice bath for 2 min. Then, 0.7 ml of LB broth
was added to the reaction and the mixture was shaken 110 rpm for 90 min at 37 °C.

Material and methods 46
3.2.6.6 Clonning
Two LB-ampicillin plates were used for each ligation solution. The plates were
prepared 30 min prior to use by spreading 20 µl of 0.5 M IPTG and 20 µl of 50 mg/ml
X-Gal over the surface of LB-ampicillin plates with a glass spreader. The bacteria
culture was then plated onto duplicate LB-ampicillin plates and incubated overnight
(~16 hours) at 37°C until colonies are visible. Successful cloning of an insert in the
pGEM-T vectors interrupts the coding sequence of β-galactosidase, hence the vectors
with insert produce white colour colonies in plate having X-gal medium against blue
colony producing vectors which doesn’t have inserts. Two white colonies and a blue
colony (negative control) were picked from each plate in 30 µl of 1x PCR buffer.
During that time, 5 ml of LB-broth prepared with amplcillin (5 µl/ml) in a 15 ml tube
was inoculated with each clone separately, which was later used as a resource for
plasmid DNA isolation. The bacteria in 1x PCR buffer were lysed by heating for 15 min
at 95oC. The colonies were screened for the insert by performing a PCR with primers
designed in the M13 promoter region of the vector. Twenty microlitre of reaction
volume containing 10 µl of lysate, 1 µl of 10x buffer, 0.8 µl of dNTPs (10 pmol/µl),
0.4 µl of each primers (forward: 5´-ttgtaaaacgacggccagt-3´, reverse: 5´-caggaaacagctatg
acc-3´, concentration 10 pmol/µl) and 0.1 µl of Taq polymerase (5 units/µl) were
amplified in the PTC-100 thermal cycler for 35 cycles of 95°C for 30 sec, 65°C for 30
sec and 70°C for 30sec followed by another 5 minutes of final extension at 70°C. The
products were electrophoresed in a 2% agarose gel. Clones were size fractionated on an
agarose gel. Clones with an insert have higher molecular weight fragments than the blue
clones.
3.2.6.7 Sequencing
The identity of inserts was confirmed by sequencing. Only colonies with right insert
sequences were used in the next step. The protocol of this step was similar as described
in 3.2.2.4. The sequencing was done using fluorescent labelled primers with the help of
the SquiTherm EXCEL TM II DNA Sequencing Kit and LI-COR automated DNA
sequencer. However, the primers used in this step were designed from SP6 (5’-
taaatccatgtgtatcttatg-3’) and T7 (5’-attatgctgctgagtgatatatcccgct-3’) promoter regions of

Material and methods 47
the pGEM-T vector and the templates were M13 PCR products from the previous step
of cloning.
3.2.6.8 Plasmid DNA isolation
Plasmid DNA was isolated from the cultured E. coli cells using GenEluteTM Plasmid
mini kit (Sigma, Germany). Five mililitre of bacterial culture was centrifuged at 12,000
x g for 1 min and the supernatant was discarded. Cells were resuspended in 200 µl of
resuspension solution. Two hundred mililitre of lysis solution was added to lyse the
cells. The sample was then gently inverted for 8 to 10 times to mix them, until the
mixture became clear and viscous. The mixture was incubated at room temperature for
exactly 2 min. Precipitation of cell debris was done by adding 350 µl of neutralisation
binding buffer into lysed cells, and mixed by inversion. The solution became cloudy and
developed a flocculent white precipitant. The tubes were centrifuged for 10 min at
≥12,000 x g. The clear supernatant was transferred to GenElute miniprep binding
column and centrifuged at ≥12,000 x g for 1 min. The flow-through was carefully
poured off from the tube and 750 µl of wash solution was added to the column, and then
centrifuged at ≥12,000 x g for another 1 min. The flow-through was discarded and
recentrifuged for 2 min without any additional washing buffer to remove excess ethanol.
The column was transferred to a fresh collection tube, 50 µl of elution solution was
added to the column followed by centrifugation at ≥12,000 x g for 1 min. Size and
quality of plasmid DNA were checked by agarose gel electrophoresis. Quantity and
quality were determined by spectrophotometer. The concentration of plasmid DNA was
measured by the formula: 50 x absorbance at 260 nm x dilution factor.
3.2.6.9 Plasmid serial dilutions
The copy number per microlitre of plasmid DNA was calculated based on the size and
concentration. Serial dilutions were then prepared from the concentration of 101 to 109
copies/µl. The isolated plasmid DNA and serial dilutions were stored at -20°C. These
DNA serial dilutions were used as template to generate the standard curve during real
time PCR analysis.

Material and methods 48
3.2.7 Real time PCR
The quantification of PRNP mRNA in oocytes, preimplantation embryos, 1-month-old
foetuses as well as tissue samples with varying expression levels during semi-
quantitative PCR was done by real time quantitative PCR. PCR was conducted in an
ABI Prism 7000 SDS instrument using SYBR® Green as a double-strand DNA-specific
fluorescent dye. Quantitative analyses of cDNA from oocytes, embryos and 1-month-
old foetuses were performed in comparison to histone H2a (endogenous control)
(Robert et al. 2002), and were run in separate wells whereas that of sample tissues were
compared to 18S-rRNA. Standard curves were generated using serial dilutions of
plasmid DNA (101 to 109 copies/µl). The PCR was performed in 20 µl reaction volume
containing 2 µl of cDNA, 10 µl of 2x SYBR®Green JumpStartTM Taq ReadyMixTM with
internal reference dye for quantitative PCR (Sigma), and optimal levels of forward and
reverse primers. During each PCR reaction, samples from the same cDNA source were
run in duplicate to control the reproducibility of results. Thermal cycle parameter were
programmed at 95°C for 10 min followed by 45 cycles of denaturation at 95°C for 15
sec and 60°C for 60 sec. After the end of the last cycle, a dissociation curve was
generated by starting the fluorescence acquisition at 60°C and taking measurements
every 7 sec interval until the temperature reached 95°C. Final quantitative analysis was
done using the relative standard curve method as used in Tesfaye et al. (2004) and
results were reported as the relative expression level compared to the calibrator cDNA
after normalization of the transcript amount to the endogenous control.
3.2.8 Statistical analysis
PRNP mRNA expression by real time PCR was analysed based on the relative standard
curve method. The relative expression data were analysed using the Statistical Analysis
System (SAS) version 8.0 software package. Differences in mean values between
developmental stages were tested using ANOVA followed by a multiple pair wise
comparisons using t-test. Differences of p≤0.05 were considered to be significant.

Material and methods 49
3.2.9 PRNP mRNA localisation by fluorescent in situ hybridisation
To localise the PRNP mRNA in ovaries and 1-month-old foetuses fluorescent in situ
hybridisation was performed on 7 to 10 µm cryostat sections of snap frozen tissues.
A non-radioactive probe with a reporter molecule digoxigenin (DIG) detected by the
indirect method with the help of tyramide signal amplification (TSA) was applied in this
experiment including six main steps of (I) generation of DIG-RNA probe, (II) tissue
sectioning and fixation, (III) pre-treatment, (IV) hybridisation of probe to the target
RNA, (V) posthybridisation washes and (VI) immunological detection of hybrids and
visualisation.
3.2.9.1 Generation of RNA probes
The RNA probes used for in situ hybridisation (ISH) were generated and
simultaneously labelled with DIG by in vitro transcription from cDNA template. The
cDNA template required for the probe synthesis consisted of purified RT-PCR products
from ovine brain RNA. Two different templates were required allowing the separate
synthesis of antisense (as) and sense (s) probes. This was achieved by extending one of
the two PRNP primers at its 5'-end by the sequence of the T7- or SP6-RNA-Polymerase
promoter as shown in Table 6. The PCR with the oPRNP_for and SP6+oPRNP_rev
primers led to the template for the antisense probe, and with T7+oPRNP_for and
oPRNP_rev primers led to the template for the sense probe. Both antisense and sense
PCRs were programmed at 94°C for 5 min, 40 cycles of 94°c for 30 sec, 60°C for 30
sec, 72°C for 1 min followed by a final extension step at 72°C for 5 min. PCR products
were assessed on a 2% agarose gel for quality measurement. The subsequent
purification of the obtained PCR products provided optimal conditions for the
transcription reaction by removing contaminations of primers, buffers and enzymes,
using the QIAquick PCR purification kit (Qiagen) according to the manufacturer's
protocol. The concentration was measured by the formula: 50 x absorbance at 260 nm x
dilution factor. Finally, the PCR product was diluted to 100 ng/µl.
The in vitro transcription of the DNA template to a single-stranded RNA probe in the
presence of Dig labelled UTPs by the T7 and SP6 RNA polymerase was carried out
according to the manufacturer's instructions of the DIG RNA labelling kit (Roche,

Material and methods 50
Germany). Ten microlitre of DNA template and 3 µl of DEPC-treated H2O were added
in a 0.2 ml PCR tube and left at room temperature until the addition of the Master Mix.
This Master mix was prepared at room temperature with 2 µl of 10x Dig NTP labelling
mixture, 2 µl of 10x transcription buffer, 1 µl of RNase inhibitor and 2 µl of T7 or SP6
RNA polymerase according to the promoter presented on the template. After gentle
mixing and brief centrifugation, the mixture was incubated for 2 hours at 37°C. The
reaction was stopped by adding 2 µl of 0.2 M EDTA (pH 8.0). The probe was purified
to remove undesirable components of the transcription reaction by precipitation in 2 µl
(0.1 volume) of 4 M LiCl and 50 µl (2.5 volume) of 100% ice cold ethanol for
a minimum of 1 hour at -20°C. After centrifugation at ≥ 12,000 x g for 15 min at 4°C,
the pellet was washed in 200 µl of 70% ice cold ethanol and centrifuged for another 10
min. The pellet was finally air dried and dissolved in 20 µl of DEPC-treated H2O. The
quality of RNA probes was checked by running 2 µl of RNA plus 2 µl of PAA loading
buffer in a 1.5% FA gel. OD spectrometer values were taken to estimate the
concentration of the probe by the formula: 40 x absorbance at 260 nm x dilution factor.
A stock RNA probe was diluted in DEPC-treated H2O to a working concentration of 50
ng/µl. Stock and working RNA probes were stored at -20°C.
Table 6: Ovine PRNP primers for generating templates required for the probe
synthesis. Forward primer (for) extended by the T7 promoter sequence and the standard
reverse primer (rev) was used to generate a DNA template for ISH sense probe
synthesis. While normal forward primer and reverse primer extended by SP6 promoter
sequence were used to amplify DNA template for antisense probe synthesis.
Primer sequence Position within
ref. sequence
Accession
number
oPRNP_for
SP6+oPRNP_rev
5’-accaagctgaagcatctgtcttc-3’
5’-gatttaggtgacactatagaatggc
ttactgggcttgttcc-3’
88
-
NM_001009481
T7+oPRNP_for
oPRNP_rev
5’-gtaatacgactcactatagggacca
agctgaagcatctgtcttc-3’
5’-tggcttactgggcttgttcc-3’
-
484
NM_001009481

Material and methods 51
3.2.9.2 Tissue sectioning and fixation
The tissue samples stored at -80°C were transferred into the cryomicrotome for a
minimum of 3 hours to allow the sample to warm to the chamber temperature of
approximately -20°C. The specimen temperature (-20°C to -25°C) and speed of
sectioning were pre-optimised for each kind of tissue. Sections of a thickness of 7 to 10
µm were prepared at the optimal specimen temperature and a cutting angle of 2 to 3°,
and were placed on room temperature warm SuperFrost® Plus slides (Menzel-Glaeser,
Germany). The slides were then immediately placed on the quick freeze shelf (-45°C)
for the section to refreeze and then kept in a precooled Hellendahl glass jar (Roth,
Germany) within the cryomicrotome until fixation. All steps of in situ hybridisation
were carried out in Hellendahl glass jars at room temperature unless noted otherwise.
The sections were firstly fixed in 4% paraformaldehyde (PFA) for 15 min to inhibit
cellular metabolism, deactivate lytic enzymes and endogenous RNases, and to conserve
cellular morphology and nucleic acid integrity (Morel and Cavalier 2000). The sections
were then washed twice with 1x PBS for 5 min each, and left in PBS until the next step
of pretreatment. Once the sections were immersed in the fixation solution it was
important to ensure that the sections never dried out during any subsequent steps until
the staining was completed.
3.2.9.3 Pretreatment of sections
The main aim of the pretreatments is to make the target nucleic acid accessible to
a probe. This may include modifying or destroying membrane and histone proteins,
improving signal/background ratio as well as denaturing the target nucleic acid and the
probe (Morel and Cavalier 2000). In this study, after tissue fixation, the sections were
incubated in an ascending alcohol series of 50%, 70%, 90% and 100% ethanol for 5 min
each (prepared fresh in DEPC-treated H2O), respectively. These steps were followed by
a descending alcohol series of 90%, 70%, 50% ethanol for 5 min each, respectively
(reused the solutions from the ascending series). The sections were washed in 1x PBS
for 5 min, blocked in 0.6% H2O2 diluted in 1x PBS for 1 hour to quench an endogenous
peroxidase activity and then washed twice with 1x PBS for 5 min each.

Material and methods 52
The acetylation reaction was performed to reduce background by transforming the
reactive amine group (NH3+) of proteins into a substituted amine group (-NH-CO-CH3)
(Morel and Cavalier 2000). For this purpose the sections were incubated in 0.1 M TEA
buffer plus 0.25% acetic anhydride for 10 min. This solution was prepared just prior to
usage due to the instability of acetic anhydride. Finally, the samples were equilibrated in
2x SSC for 10 min.
3.2.9.4 Hybridisation of probe to the target RNA
The successful hybridisation is characterised by the formation of a stable and specific
anti-sense probe complimentary to the target nucleic acid. Factors for a successful
hybridisation are hybridisation buffer, hybridisation temperature, Na+ concentration,
type and length of probe. The composition of the hybridisation buffer was based on the
protocol of Thielen (2006). In this experiment, the sense probe served as negative
control, since its sequence is identical to the target mRNA and does not attach to the
target mRNA. A section hybridised with the sense probe was always prepared in
parallel to each section hybridised with the antisense probe. In addition, different levels
of probe amounts were used to optimise the hybridisation procedure. The probe was
applied to the section as follows: after thawing the probe on ice, the RNA probes (sense
or antisense) were added to the hybridisation buffer to yield a total volume of 100
µl/section and the concentration of 500 ng/ml. This solution was mixed gently, exposed
for 5 min at 80°C to denature the RNA probe and then immediately placed in ice to
preserve the denatured structure. Following the final step of pretreatment, the section
was placed horizontally in a humid chamber filled with DEPC-treated H2O, carefully
overlaid with 100 µl of the hybridisation mixture and covered with a glass cover slip (24
mm x 24 mm) before being incubated overnight at 52°C.
3.2.9.5 Posthybridisation washes
The aim of this step is to reduce background by removing unbounded and unspecifically
bounded probe. This purpose can be achieved by controlling temperature, salinity of
washing buffer, and RNase treatment. After the hybridisation step, the slips were rinsed
off by flushing 2x SSC between slip and slide. The slides were washed twice in 2x SSC

Material and methods 53
at 45°C for 10 min each, twice in a mixture between formamide and 2x SSC (ratio 1:1)
at 45°C for 10 and 20 min, respectively, and finally washed twice in 0.2x SSC on an
orbital shaker at speed 100 rpm for 10 min at room temperature. The sections were then
subjected to RNase digestion. Two different types of enzymes, RNase A and RNase T1
were used. The sections were incubated for 30 min at 37°C in the combination of 5 µg
of RNase A and 50 U of RNase T1 per ml of 2x SSC (Thielen 2006) followed by three
times washing in 2x SSC on an orbital shaker at speed 100 rpm for 10 min at room
temperature.
3.2.9.6 Immunological detection
TSA or tyramide signal amplification (fluorophore system) was integrated into the
protocol. Tyramide is a phenolic compound that precipitates after oxidation. This
technology uses HRP to catalyze the deposition of a fluorophore-labelled tyramide
amplification reagent onto tissue sections surfaces. The reaction results in the deposition
of numerous fluorophore labels immediately adjacent to the immobilised HRP enzyme
(Figure 6).
Figure 6: Hybrid detection system including tyramide signal amplification
F T
F
precipitate
T P
DIG
mRNA target mRNA
POD labelled anti-DIG antibody
DIG labelled RNA probe

Material and methods 54
The TSA fluorophore system was carried out according to the manufacturer's
instruction. Briefly, after posthybridisation washes (see 3.2.9.5) the sections were
incubated in Tris-sodium (TN) buffer in a Hellendahl glass jar for 5 min. The slides
were placed horizontal in a humidity chamber and incubated with TN blocking buffer
(TNB) for 30 min. Next, the sections were incubated in peroxidase conjugated anti-DIG
diluted 1:100 in TNB buffer (200 µl/section) for 1 hour and washed with three changes
of TN buffer plus 0.05% Tween 20 (TNT) on an orbital shaker at speed 100 rpm for
5 min each. Then, the fluorescent solution was added to the sections. The developing
time was pre-optimised for each kind of tissue, 5 min for the brain, and 10 min for
ovary and foetus. After another three times of washing in TNT buffer, the samples were
finally counterstained in 0.5 µg/ml of propidiumiodide (diluted in TN buffer, 200
µl/section) for 15 min followed by three times washing in TNT buffer on an orbital
shaker at speed 100 rpm for 5 min each. A drop of Vecta shield mounting media was
applied on the section; a glass cover slip was then placed over and fixed with nail
polish. The staining of the sections was assessed by light microscopy (Microscope DM
LB, Leica).
3.2.10 Detection of PrPC expression by western blotting
3.2.10.1 Protein extraction
Protein was extracted using TRIZOLE reagent following the manufacturer's instruction.
The tissue samples were taken out from storage at -80oC just before isolation. All
centrifugation steps were performed at 4°C. Twenty miligramm of tissue was ground by
using mortal and pestle and incubated with 0.5 ml of TRIZOL for 5 minutes at room
temperature in a microcentrifuge tube. The clear homogenate was then mixed with 0.1
ml of chloroform, vigorously shaked by hand for 15 sec and centrifuged at 12,000 x g
for 15 min. A colourless upper aqueous phase was moved out and the DNA from the
interphase and organic phase was precipitated by adding 150 µl of 100% ethanol. The
mixture was mixed by inversion, allowed to stand for 2 to 3 min at room temperature
and centrifuged at 2,000 x g for 5 min. The supernatant was transferred to a new 2.0 ml
tube, 750 µl of isopropanal was then added and allowed to stand at room temperature
for 10 min followed by centrifugation at 12,000 x g for 10 min. The protein pellet was

Material and methods 55
washed three times in 1 ml of 0.3 M guanidine hydrochloride/95% ethanol solution.
During each wash, the sample was stored in wash buffer for 20 min at room temperature
and centrifuged at 7,500 x g for 5 min. After the three washes, 1 ml of 100% ethanol
was added and the mixture was allowed to stand for 20 min and then centrifuged at
7,500 x g for another 5 min. Finally, the protein was dried under a vacuum for 5 min
and dissolved in 200 µl of sample buffer containing 1% protease inhibitor cocktail
followed by boiling for 5 min at 95°C and storing at -20°C.
3.2.10.2 SDS-PAGE gel preparation
SDS is an anionic detergent which denatures proteins by wrapping around the
polypeptide backbone and confers a negative charge to the polypeptide in proportion to
its length. An appropriate concentrated SDS-PAGE gel was used for the protein of
interest. For the prion protein of ~ 30 kDa, a 15% acrylamide gel was prepared. Glass
plates were cleaned thoroughly using normal detergent and distilled water. The
sandwich glass plates were introduced into the support piece. It was confirmed that the
lower border of the glass plates were well aligned and fixed on the rubber piece.
The separation gel and stacking gel were prepared. The separation gel is used to
separate proteins into their respective sizes allowing sharp bands to be seen, whereas the
stacking gel organizes proteins before they enter the separating gel. First, the separating
gel was prepared, quickly mixed and poured in 3/4 volume of each sandwich plates and
the remaining space (1/4 volume) was filled with isopropanol to ensure that no air
bubbles would be formed at the surface of the gel during gel polymerization. The
isopropanol was poured off after polymerization; the stacking gel was filled in the
remaining space of the sandwich plates and, finally, a 10 well comb was inserted on the
top of the staking gel.
3.2.10.3 SDS-PAGE gel electrophoresis
One lit of 1x running buffer was prepared. After the gel was already polymerized, the
comb was removed; two support pieces of the gel sandwiches were mounted with the
U-shape rubber piece and then put into a chamber. The upper reservoir was filled with

Material and methods 56
running buffer and then 10 µl of each protein extract was added in the prepared well.
The gel electrophoresis was run at 10 mA per one gel for 1.5 hours.
3.2.10.4 Transferring proteins to the membrane
Proteins were transferred into nitrocellulose transfer membrane using the Trans-Blot
Semi-Dry transfer Cell. For each gel, one piece of transfer membrane and nine pieces of
filter paper with the same size as the gel were prepared. Each of three pieces of the filter
paper were wetting in anode buffer I, anode buffer II and cathode buffer, while the
transfer membrane was soaked in distilled water. After the electrophoresis, the whole
setup was dismounted, the stacking gel was discarded and the separation gel was moved
and placed on the transfer membrane. Filter papers soaked in anode buffer I were placed
on the anode plate of the blotter first followed by those paper soaked in anode buffer II.
The transfer membrane and gel were removed from water and placed on top of filter
paper stack followed by the paper in cathode buffer (Figure 7). The cathode plate of the
blotter was placed on top of transfer stack. The time of transfer was 1 hour using 100
mA per each gel (1.75mA/cm2/h). After the transfer was completed, the blot membrane
was washed with distilled water for 30 sec and subsequently stained with 0.2% ponceau
S to evaluate the transfer quality. The membrane was then washed twice in PBST
(10 min/time) on an orbital shaker.
Figure 7: Diagram of transferring system
3.2.10.5 Antibody incubation
To block non-specific sites, the membrane was incubated in PBST containing 1%
polyvinylpyrolidone (PVP, Sigma) for 1 hour at room temperature. The primary
antibody was prepared by diluting PrP monoclonal antibody 12F10 in 0.1% PVP
Gel
Cathode
Transfer membrane Anode buffer II Anode buffer I
Cathode buffer
Anode

Material and methods 57
(dilution 1:250, Spibio, Montigny le Bretonneux, France). The membrane was
incubated with the primary antibody overnight at 4°C or for 1 hour at room temperature
followed by washing with six changes of PBST (10 min/time) at room temperature.
Horseradish peroxidase goat anti-mouse (Jackson ImmunoResearch Laboratories, USA)
diluted 1:15,000 in 0.1% PVP in PBST was then added to the membrane and incubated
at room temperature for 1 hour. After incubation, the membrane was washed with six
changes of PBST (10 min/time). All incubations, blockings and washing steps were
done on an orbital shaker.
3.2.10.6 Protein visualisation
Immune complexes were detected using the ECL plus Western Blotting Detection
System and visualized using Kodak BioMax XAR film. Briefly, the detection reagents
were removed from storage at 2 to 8°C and allowed to equilibrate to room temperature.
Solution A and B were mixed in a ratio 40:1. The final volume of detection reagent
required was 2 ml per membrane. The membrane was taken out from the wash buffer
and placed protein side up on a clean surface. The mixed detection reagent was applied
on the membrane and incubated for 5 min at room temperature. For chemiluminescent
detection, the membrane was placed on a fresh piece of saran wrap placed in an
x-ray film cassette, wrapped up to gently remove any air bubbles. In the dark room,
a sheet of autoradiography film was placed on top of the membrane and exposed for the
appropriate time period of 1 to 5 min.
3.2.11 Protein localisation by immunohistochemistry
The cellular prion protein was localised in ovaries and 1-month-old foetuses using the
immunohistochemical technique with the help of avidine-biotin complex to increase the
signal of the staining. Primary and secondary antibodies used in this experiment were
the same as used in western blot analysis. Immunohistochemical staining was
performed on 5 to 7 µm cryostat sections of snap frozen tissues. Sample sections were
placed on SuperFrost® plus slides and fixed in methanol and acetone for 10 and 1 min,
respectively, at -20°C. The sections were air-dried for 15 min and washed with three
changes of PBST. To quench an endogenous peroxidase activity, sections were

Material and methods 58
incubated in 0.3% H2O2 in methanol for 30 min, washed twice with PBS and then
incubated in 1.5% goat normal serum in PBS for 1 hour. Endogenous biotin activity was
blocked by incubating the sections in egg white (diluted 1:1 with ddH2O) for 15 min
followed by washing with three changes of PBS. The PrP antibody 12F10 diluted 1:200
in PBS was then applied on the sections and incubated for 1 hour at room temperature
in an humidity chamber followed by three times washing with PBST. To detect the PrP
antibody, sections were incubated in biotinylated goat anti-mouse IgG (dilution 1:100)
for 30 min and washed with three changes of PBST. Avidine-biotinylated horseradish
peroxidase was prepared 30 min prior to use following the manufacturer's instruction.
This solution was added on the sections and allowed to stand for 30 min in the humidity
chamber. The immune complexes were then visualised by incubating the samples with
AEC (3-amino-9-ethylcarbazole) substrate for 30 min or until a desirable signal was
obtained. The samples were counterstained with hematoxylin for 5 sec and immediately
washed with several changes of deionised H2O. Finally, the samples were mounted
using glycerol gelatine and covered with a cover glass slip and the staining was
observed by light microscopy.

Results 59
4 Results
4.1 PRNP genotyping
So far, many polymorphisms have been identified in the ovine PRNP gene. Correlations
between those polymorphisms and the susceptibility to scrapie have been analysed
resulting that the polymorphisms at codon 136, 154 and 171 within exon 3 of the PRNP
gene are strongly linked to the variation in the phenotypic expression of scrapie. Based
on the three polymorphisms twelve alleles can be derived; however, only five alleles
and fifteen genotypes, which can be divided into five risk groups according to scrapie
susceptibility, are commonly seen (Table 7 and 8).
Table 7: The PRNP genotype distribution in sheep of the present study
Risk group Genotype Number Genotype
frequency (%)
Risk group
frequency (%)
R1 ARR/ARR 74 22.84 22.84
ARR/AHQ 4 1.23 R2
AHQ/AHQ 1 0.31 1.54
ARR/ARQ 75 23.15
ARR/ARH 1 0.31
ARQ/AHQ 20 6.17 R3
ARH/AHQ 0 0.00
29.63
ARH/ARH 0 0.00
ARQ/ARH 8 2.47
ARQ/ARQ 74 22.84
VRQ/ARR 19 5.86
R4
VRQ/AHQ 7 2.16
33.33
VRQ/ARQ 34 10.49
VRQ/ARH 2 0.62 R5
VRQ/VRQ 3 0.93
12.04
Unknown ARQ/ARK 2 0.62 0.62
Total 324 100.0 100.0

Results 60
Table 8: Allele frequencies of PRNP based on the polymorphisms at codons 136,
154 and 171 within exon 3
Allele Number Allele frequency (%)
ARR 247 38.12
ARQ 287 44.29
ARH 11 1.70
AHQ 33 5.09
VRQ 68 10.49
ARK 2 0.31
The objectives of this study were to investigate PRNP expression during prenatal stages
and to compare the expression of the gene between scrapie resistant animals and scrapie
susceptible animals. So, this study was started at PRNP genotyping in sheep from some
commercial farms and the Frankenforst experimental station of the University of Bonn.
DNA from blood samples of 324 sheep of various breeds were sequenced using direct
sequencing PCR. The results presented that the percentage of R1, R2, R3, R4 and R5
sheep in this population were 22.8, 1.5, 29.6, 33.3 and 12.0%, respectively. The
frequency of ARR/ARQ, ARR/ARR and ARQ/ARQ genotypes were 23.2%, 22.9% and
22.9%, respectively, followed by VRQ/ARQ (10.5%), ARQ/AHQ (6.2%), VRQ/ARR
(5.9%), ARQ/ARH (2.5%) and VRQ/AHQ (2.2%). The number of animals other
genotypes was less than 1.5% per group. ARH/AHQ and ARH/ARH genotypes were
not found in this population. Moreover, of all 324 animals, 2 animals could not be
identified with their PRNP genotype (Table 7).
Allele frequencies were calculated from the identified sheep showing that the frequency
of ARR, ARQ, ARH, AHQ, VRQ and ARK alleles were 38.1, 44.3, 1.7, 5.1, 10.5 and
3.1%, respectively, as shown in Table 8.
After genotyping, R1 and R5 ewes were selected for further studies. The final number
of ewes used in this experiment was 17; n=9 for R1 group and n=8 for R5 group. All the
R1 ewes were the Black head breed, whereas seven ewes in R5 group were from the
Bentheimer breed and one of them was from the Black head breed. PRNP sequencing
was performed to confirm the genotypes in the selected ewes and their foetuses. Breeds

Results 61
and PRNP genotypes of the sheep used in this experiment are shown in Table 9. The
results showed that all the R1 ewes and foetuses used in this experiment were
ARR/ARR genotype. Two PRNP genotypes of ARQ/VRQ and VRQ/VRQ genotypes
were observed in the R5 group. All R5 ewes were ARQ/VRQ genotype whereas five R5
foetuses carried the ARQ/VRQ and three foetuses carried the VRQ/VRQ genotype. The
R1 ram used in this study was the Black head breed, which carried the ARR/ARR
genotype, and the R5 ram was from the Bentheimer breed and carried the VRQ/VRQ
genotype (data not shown).
Table 9: Breed and PRNP genotypes of sheep used in this study
Ewes Foetuses Month of
pregnancy Breeds
Genotype Group Genotype Group
Black head ARR/ARR R1 ARR/ARR R1
Black head ARR/ARR R1 ARR/ARR R1
Black head ARR/ARR R1 ARR/ARR R1
Bentheimer ARQ/VRQ R5 ARQ/VRQ R5
1st
Bentheimer ARQ/VRQ R5 ARQ/VRQ R5
Black head ARR/ARR R1 ARR/ARR R1
Black head ARR/ARR R1 ARR/ARR R1
Bentheimer ARQ/VRQ R5 VRQ/VRQ R5
2nd
Bentheimer ARQ/VRQ R5 ARQ/VRQ R5
Black head ARR/ARR R1 ARR/ARR R1
Black head ARR/ARR R1 ARR/ARR R1
Bentheimer ARQ/VRQ R5 ARQ/VRQ R5
3rd
Black head ARQ/VRQ R5 ARQ/VRQ R5
Black head ARR/ARR R1 ARR/ARR R1
Black head ARR/ARR R1 ARR/ARR R1
Bentheimer ARQ/VRQ R5 VRQ/VRQ R5
5th
Bentheimer ARQ/VRQ R5 VRQ/VRQ R5

Results 62
4.2 Expression of PRNP mRNA
4.2.1 Expression of PRNP transcripts in ovine preimplantation embryos
The gene expression between the two groups was detected and compared using
quantitative real time PCR. This analysis was done in immature oocytes (n=2 per
group), mature oocytes (n=3 per group), in vivo embryos at the morula stage (n=1 for
R1 group and n=3 for R5 group) and in 1-month-old foetuses (n=2 per group). The
results demonstrated that PRNP mRNA was detected in all stages.
After adjusting the relative expression level using the level of R1 morula as the
calibrator, the relative abundance of R1 immature oocytes, mature oocytes, morula-
stage embryos and 1-month-old foetuses were found to be 90.7, 5.9, 1.0 and 122.3,
respectively. PRNP mRNA level in R1 mature oocyte was significantly lower than the
levels in R1 immature oocyte and 1-month-old R1 foetuses (p≤0.05), whereas the
expression levels of the gene compared between immature oocytes and 1-month-old
stages were not significantly different (p>0.05).
In the R5 group, the relative mRNA abundance was highest in 1-month-old foetuses,
followed by immature oocytes, morula stage embryos and mature oocytes, respectively.
The relative abundance levels of PRNP mRNA were 52.6, 1.1, 13.3 and 91.0 for R5
immature ooytes, mature oocytes, morula-stage embryos and 1-month-old foetuses,
respectively. The level of transcript abundance in R5 1-month-old foetuses was
significantly higher than in the other stages (p≤0.05) of the same group. The transcript
abundance in immature oocytes was also significantly higher than that of in vivo
embryos and mature oocytes (p≤0.05); however, no significant difference between
morula embryos and mature oocytes was observed (p>0.05).
Compared within each stage between R1 and R5 groups, the results showed that the
target gene expression in R1 group was higher than in the R5 group at immature oocytes
and 1-month-old stages (p≤0.05), but no difference between these two groups was
observed at mature oocytes stage (p>0.05, Figure 8).

Results 63
0
20
40
60
80
100
120
140
160
IMO MO Morula 1-month
Stage
Rel
ativ
e ex
pres
sion
leve
l of o
vine
PR
NP
mR
NA
R1R5
A
B
A
b
c
c
a
*
*
Figure 8: Relative expression levels of PRNP mRNA in in vivo ovine immature oocytes
(IMO), mature oocytes (MO), morula-stage embryos and 1-month-old foetuses. The
relative abundance of mRNA levels represents the amount of mRNA compared to the
calibrator (R1 morula stage embryo) which is set to 1. Individual bars show the mean ±
standard error (SE). Values with different superscripts (A and B for R1 group, and a, b
and c for R5 group) are significantly different within each group (p≤0.05), whereas *
shows a significant difference between two groups at the same stage (p≤0.05).
4.2.2 Expression of PRNP transcripts in ovine prenatal foetuses
A semi-quantitative expression analysis of PRNP mRNA in various tissues of 2-, 3- and
5-month-old foetuses of R1 and R5 groups showed that the PRNP mRNA was observed
at all stages and in all tissues of both groups examined including brain, cotyledon, heart,
intestine, kidney, liver, lung and muscle of 2-month-old foetuses (Figure 9), and
cerebrum, cerebellum, medulla oblongata, cotyledon, spinal cord, heart, intestine, liver,
lung, muscle and spleen of 3- and 5-month-old foetuses (Figure 10 and 11). In this
study, 18S rRNA expression level was used as internal standard.
The PRNP mRNA expression of each sample was identified as relative expression level
compared to the level of 18S rRNA from the same cDNA source. The gene expression
level was identified from the intensity of the PCR product band presented on agarose

Results 64
gel under the UV light. The results showed that amplification of the 18S rRNA by RT-
PCR produces similar quantities of product for all tissues investigated.
Figure 9: RT-PCR analysis of PRNP and 18S mRNA in various tissues of
2-month-old R1 and R5 foetuses. The negative control reactions were done with no
template DNA
In 2-month-old foetuses, PRNP bands were strongest in brain tissue of both R1 and R5
foetuses, resulting that PRNP mRNA abundance was highest in the brain tissue of the
foetuses. The PRNP levels were moderate in heart, intestine and lung, and were low in
kidney and liver of the two groups. Variation of the gene transcripts in cotyledons and
muscle, when compared between two independent samples of each group, were
observed. In both R1 and R5 groups, one cotyledon sample showed similar expression
level as those of the brain (high level), whereas the other one showed similar level as
kidney and liver (low level). In muscle tissue, one sample represent similar expression
level as the levels in heart, intestine and lung (moderate level) while the other one
presented low expression level as kidney and liver (Figure 9).
PRNP transcripts were observed in all R1 and R5 foetal tissues studied at the 3rd and 5th
month after insemination as well. The results of RT-PCR are presented in Figure 10 and
Figure 11. Comparison between various tissues at the 3rd month (B) of R1 foetuses
shows that the gene expression levels were high in cerebrum, cerebellum, medulla
oblongata, cotyledon and spinal cord. The level(s) were moderate in intestine, lung,
muscle and spleen, and was low in liver. A low expression level of this transcript was
also found in the heart of an individual R1 foetus at this stage, while the level of the
other foetus was moderate. At the 5th month after insemination (C), the levels of the
gene transcripts could be divided into two groups. High expression levels were found in

Results 65
cerebrum, cerebellum, medulla oblongata, cotyledon and spinal cord, while the
moderate expression levels were detected in the rest of the tissues. Comparing within
each tissue between these stages, the gene abundance levels in liver and spleen at the 5th
month were higher than those levels at the 3rd month. Whereas it seems to be unchanged
through the prenatal stage in the rest of the tissues (Figure 10)
Figure 10: RT-PCR analysis of PRNP and 18S mRNA in 1-month-old R1 foetuses
(A) and in various tissues of 3- (B) and 5-month-old (C) R1 foetuses. The negative
control reactions were done with no template DNA
In 3-month-old R5 foetuses, the gene expression levels of various tissues can be
catagorised into 3 groups; high expression levels were found in cerebrum, cerebellum,
medulla oblongata, cotyledon and spinal cord, while the levels in heart, intestine, lung
and muscle were moderate, and in liver and spleen were low. At the 5th month, the
results showed the same trend as those at the 3rd month. However, comparison within
each tissue between two stages of foetuses demonstrates that PRNP expression levels in
cerebrum at the 5th month were lower than that of the 3rd month, whereas the level in the
medulla oblongata at the 5th month was higher than the level at the 3rd month (Figure
11)
Comparisons within each tissue and each stage between the two groups indicates that
the PRNP mRNA levels in the heart of R1 foetuses were lower than that of R5 foetuses
at the 3rd month while the levels at the 5th month were higher in R1 cerebrum and liver,

Results 66
and lower in R1 medulla oblongata as compared with those in R5 foetuses (Figure 10
and Figure 11)
Figure 11: RT-PCR analysis of PRNP and 18S mRNA in 1-month-old R5 foetuses
(A) and in various tissues of 3- (B) and 5-month-old (C) R5 foetuses. The negative
control reactions were done without template DNA
Following to the results of RT-PCR that showed differences of the gene abundance in
heart, liver and spleen of R1 foetuses, and in cerebrum, medulla oblongata, and spleen
of R5 foetuses, quantitative real time RT-PCR was performed to define the amount of
gene transcripts in cerebrum, medulla oblongata, heart, liver and spleen of both groups
using the level of 18S rRNA as an internal standard. The relative levels of PRNP
mRNA of each independent sample are shown in Table 10, while mean and standard
error of each group are shown in Figure 12.
In 3-month-old R1 foetuses, the relative abundance of the gene transcript was highest in
cerebrum followed by medulla oblongata, spleen, heart and liver, respectively. The
levels were 47.9, 41.4, 4.3, 2.2 and 5.5 for 3-month-old R1 cerebrum, medulla
oblongata, heart, liver and spleen samples, respectively. In 5-month-old R1 foetuses, the
levels of PRNP transcript in the tissues mentioned above were 35.1, 50.1, 7.0, 8.0 and
9.4, respectively. The levels in cerebrum and medulla oblongata at this stage were also
higher than those of the rest of the tissues.

Results 67
Table 10: Relative abundance of PRNP mRNA (x10-6) in foetal cerebrum, medulla
oblongata, heart, liver, and spleen of each individual at the 3rd and 5th month of
pregnancy
Relative abundance of PRNP mRNA Tissue Stage Group
Animal 1 Animal 2
R1 57.33 38.54 3 month
R5 41.54 25.58
R1 39.00 31.18 Cerebrum
5 month R5 20.88 28.32
R1 48.27 34.45 3 month
R5 22.28 41.87
R1 81.46 18.77
Medulla
oblongata 5 month
R5 78.48 56.04
R1 3.00 5.59 3 month
R5 6.05 8.45
R1 8.40 5.53
Heart
5 month
R5 5.79 9.17
R1 2.08 2.22 3 month
R5 2.24 2.45
R1 4.66 11.30 Liver
5 month R5 3.38 1.67
R1 6.40 4.62 3 month
R5 3.20 5.37
R1 10.33 8.55
Spleen
5 month
R5 10.41 4.98

Results 68
0
10
20
30
40
50
60
70
80
90
Cerebrum Medullaoblongata
Heart Liver Spleen
Tissue
Rel
ativ
e ex
pres
sion
leve
l of P
RN
P m
RN
A 3-month-old R1 foetus5-month-old R1 foetus3-month-old R5 foetus5-month-old R5 foetus
Figure 12: Relative expression levels of PRNP mRNA (x10-6) in foetal tissues of
scrapie resistant (R1) and susceptible (R5) groups at the 3rd and 5th month of pregnancy.
Individual bars show the mean ± SE (n=2 per group).
In R5 foetuses, the relative abundance of the PRNP gene was similar to those of the R1
foetuses. The gene expression levels in medulla oblongata and cerebrum were higher
than those in heart, liver and spleen. At the 3rd month of pregnancy, the levels of PRNP
transcript in the tissues mentioned above were 33.6, 32.1, 7.3, 2.4 and 4.3, respectively.
At the 5th month, the levels in R5 cerebrum, medulla oblongata, heart, liver and spleen
were found to be 24.6, 67.3, 7.5, 2.5 and 7.7, respectively.
Comparing between R1 and R5 groups within each tissue of each stage, real time RT-
PCR analyses resulted in higher expression level of PRNP gene in R1 cerebrum and R1
spleen at both stages of 3 and 5 months of age compared to R5 cerebrum and R5 spleen,
respectively. The levels in the heart of R1 foetuses were lower than those of R5 foetuses
at both stages. In medulla oblongata, the expression level of R1 foetuses at the 3rd
month was higher than the level of R5 foetuses, but at the 5th month, the level of R1
foetuses was lower than the level of R5 foetuses. These results are opposite to the
results in liver that showed lower expression level of the gene in R1 foetuses at the 3rd
month and higher expression level at the 5th month compared to the levels of R5
foetuses.

Results 69
Comparison between the different stages within the same group demonstrated that the
relative expression levels of PRNP mRNA in cerebrum at the 3rd month of both R1 and
R5 groups were higher than those at the 5th month. The levels in the rest of the tissues
were lower at the 3rd month compared to levels at the 5th month.
4.2.3 Expression of PRNP transcripts in reproductive organs of ewes
The results of semi-quantitative RT-PCR in ovine reproductive tissues revealed the
presence of the gene transcript in ovary, oviduct, endometrium, myometrium and
caruncle of R1 and R5 ewes at all stages (Figure 13 and Figure 14). In this experiment,
the expression patterns of the two groups were likely similar. Compared within each
group, the highest expression level was found in caruncle tissue at all stages
investigated, whereas the relative expression levels of PRNP mRNA in ovary, oviduct,
endometrium and myometrium were lower and not different from each other. However,
the levels of the gene mRNA abundance in R1 caruncle seems to be unchanged
throughout the pregnancy period while it was increased from the 1st month to the 3rd
month, and decreased from the 3rd to the 5th month in R5 caruncle. When compared
between R1 and R5 groups, the results showed that the expression level of PRNP
transcript in caruncle tissue of R1 ewes was higher than that of R5 ewes at the 1st month
of pregnancy, while it was lower at the 3rd month. Moreover, at the 1st month, one of the
sheep in R1 group showed higher expression level in endometrium compared to the R5
group, while the other one was similar to the levels of the R5 group. The relative
abundance of the gene transcript in other tissues was not different compared between
R1 and R5 group.

Results 70
Figure 13: RT-PCR analysis of PRNP and 18S mRNA in reproductive tissues of
scrapie resistant ewes at the 1st (A) , 3rd (B) and 5th (C) month of pregnancy. The
negative control reactions were done with no template DNA
Figure 14: RT-PCR analysis of PRNP and 18S mRNA in reproductive tissues of
high susceptible ewes at the 1st (A), 3rd (B) and 5th (C) month of pregnancy. The
negative control reactions were done with no template DNA
Real time PCR was carried out to quantify the amount of PRNP transcripts in
endometrium of ewes at the 1st month of pregnancy, and in caruncle at the 1st, 3rd and 5th
month of pregnancy with three replications using 18S rRNA as an internal standard.
The results of real time PCR supported the results obtained by RT-PCR as shown in
Figure 15. Relative PRNP expression levels were 25.5 and 5.4 for R1 endometrium, and
10.2 and 13.3 for R5 endometrium. The levels of R1 caruncle at the 1st, 3rd and 5th
month were 28.5 and 67.7, 35.8 and 48.1, and 24.0 and 28.6, respectively. While the
levels of R5 caruncle were 16.7 and 17.8, 47.4 and 42.3, and 16.3 and 41.1 at the 1st, 3rd
and 5th month of pregnancy, respectively. Mean and standard error of the relative
abundance of PRNP transcript in R1 and R5 endometrium at the 1st month of pregnancy
were 15.5 ± 10.0 and 11.8 ± 1.5, respectively. The levels in caruncle tissue of R1 and
R5 ewes were 48.1 ± 19.6 and 17.2 ± 0.6, 42.0 ± 6.1 and 44.9 ± 2.6, 26.3 ± 2.3 and 28.7
± 12.4 at the 1st, 3rd and 5th month, respectively.

Results 71
0
10
20
30
40
50
60
70
80
1 month 1 month 3 month 5 month
Endometrium Caruncle
Rel
ativ
e ex
pres
sion
leve
l of P
RN
P m
RN
AR1R5
Figure 15: Relative expression levels of PRNP mRNA (x10-6) in endometrium and
caruncle of resistant (R1) and high susceptible (R5) ewes (n=2 per group).
4.3 Localisation of PRNP mRNA
The results of PRNP mRNA expression analyses showed the presence of the gene
transcripts in the total RNA extracted from the whole foetuses at 1 month of age and the
ovaries of ewes. However, ovaries comprise of many types of cells which are involved
in folliculogenesis such as follicular cells, granulosa cells, theca interna, theca externa,
cortical stroma or corpus luteum. So, in this study, fluorescent in situ hybridisation was
used as a tool for localisation of the gene mRNA in ovary tissue and in 1-month-old
foetuses of R1 and R5 groups. RNA probes used in this study were digoxigenin
labelled. After hybridisation, the hybrids were detected by anti-digoxigenin-POD
followed by the fluorescein TSA reagent. The nucleus of the cell was labelled with
propidiumiodide. Under the fluorescent microscope the fluorescein signals were shown
in green while propidiumiodide was shown in red.

Results 72
4.3.1 Localisation of PRNP mRNA in 1-month-old foetuses
PRNP transcripts were detected in various organs of 1-month-old R1 and R5 foetuses of
sheep. The fluorescent signals of PRNP mRNA hybrids were detected in the brain
(Figure 16A and B), vertebral column (Figure 16D and E), heart (Figure 16G and H),
liver (Figure 16J and K) and kidney (Figure 16M and N) of R1 and R5 foetuses,
respectively. Signals were not found in the negative control sections of heart (Figure
16I), liver (Figure 16L) and kidney (Figure 16O), which were hybridised with the sense
probe. Weak signals were detected in the control sections of the brain (Figure 16C) and
vertebral column (Figure 16F); however, the samples hybridised with antisense probe
displayed a higher signal above these background.
4.3.2 Localisation of PRNP mRNA in adult ovaries
In situ hybridisation of the PRNP mRNA was also detectable in the ovary of both R1
and R5 groups. Signals were detected in granulosa cells and theca cells (Figure 17A, E),
ovarian cortex (Figure 17B, F), ovarian medulla (Figure 17C, G) and corpus lutuem
(Figure 17D, H) of R1 and R5 ovaries, respectively. Signals were not found in the
control sections hybridised with sense probe as shown in Figure 17I, J, K and M.

Results 73
Figure 16: Fluorescent in situ hybridisation of PRNP mRNA with DIG labelled
RNA antisense (left and middle column) and sense (right column) probes in 1-month-
old R1 (A, D, G, J and M) and R5 (B, E, H, K and N) ovine foetuses. PRNP transcripts,
which are shown in green or point with blue arrow, were detected in brain (A and B),
vertebral column (D and E), heart (G and H), liver (J and K) and kidney (M and N) of
the foetuses compared to the control sections of each organ which are shown in the
same line
E
Dermatome 200 µm
F
200 µm
D
50 µm
H
200 µm
G
50 µm
I
200 µm
N Mesonephric glomeruli
50 µm
K
100 µm
L
50 µm
J
50 µm
O
Mesonephric glomeruli
Mesonephric duct
100 µm
M Mesonephric glomeruli
Mesonephric duct 50 µm
B
100 µm
A
50 µm
C
100 µm

Figure 17: Fluorescent in situ hybridisation of PRNP mRNA with DIG labelled RNA antisense (A-H) and sense (I-L) probes in R1 (A-D)
and R5 (E-H) ovaries collected at the 1st month of pregnancy. PRNP transcripts, which are shown in green, were found in oocyte, granulosa
cells and theca cells (A and E) as well as in ovarian cortex (B and F), ovarian medulla (C and G) and corpus luteum (D and H) compared to
the control sections of each which are shown in the same column
E
A
F
B
G
C
H
D
I J K L
Re
sults
74
A
E
I
A
Granulosa cells
Theca cells
Oocyte
Granulosa cells 50 µm
B
50 µm
C
50 µm
D
50 µm
50 µm 50 µm
H
Corpus luteum 50 µm
50 µm 50 µm 50 µm 50 µm
Theca cells
Granulosa cells
100 µm

Results 75
4.4 Expression of PrPC, western blot analysis
In order to study the PrPC expression in reproductive tissues of ewes and various tissues
of their foetuses, western blot analysis was performed to detect PrPC in the samples and
to compare the expression level of the protein between samples. According to the
results of mRNA expression analyses, female reproductive tissues obtained from ewes
at the 1st month of pregnancy, the whole foetuses at the 1st month and the foetal tissues
at the 2nd month of embryogenesis were used to identify the location of the PrPC in each
tissue, and to compare the protein expression between the two groups.
4.4.1 Expression of PrPC in ovine prenatal foetuses
To study the expression of PrPC in the ovine prenatal foetuses, western blot analysis was
performed. The proteins extracted from whole prenatal foetuses at 1 month of age and
from separated single organs of the foetuses at 2 months of age were used to detect and
compare the expression level of the protein between R1 and R5 groups. The results
showed that the immunoreactive bands corresponding to the PrPC were detected in all
samples examined. The expression patterns were not different between the two groups.
The intensity of the PrPC band at the expected molecular weight of ~33 kDa was
strongest in liver compared to the other tissues. The level of the protein in brain was
high when compared to the levels in heart, intestine, kidney, lung and muscle. The
protein expression levels in heart, intestine, lung and muscle were quiet similar. In this
study, PrPC levels detected in cotyledon samples of both groups were very low, even
when a double volume of protein extract from this tissue was loaded (Figure 18).
4.4.2 Expression of PrPC in reproductive organs of ewes
PrPC of ~33 kDa could be detected in all female reproductive organs investigated
including ovary, oviduct, endometrium, myometrium and caruncle. The prion protein
expression patterns of the two risk groups were similar. The intensity of the PrPC bands
in endometrium, myometrium and caruncle tissue was higher compared to those of
ovary and oviduct tissue. Moreover, the protein levels in ovary, endometrium,
myometrium and caruncle tissue were not different when compared in each tissue

Results 76
between R1 and R5 ewes, but it was higher in R5 oviduct than that of R1 oviduct
(Figure 19).
Figure 18: Representative western blot analysis of PrPC in ovine foetal tissues
showed the immunoreactive band corresponding to the PrPC in 1-month-old foetuses
and various tissues of 2-month-old foetuses of both R1 and R5 groups. Negative control
membrane was devoid of the PrP MAb incubation
Figure 19: Representative western blot analysis of PrPC in ovine reproductive
tissues showed the immunoreactive band corresponding to PrPC in ovary, oviduct,
endometrium, myometrium and caruncle of resistant (R1) and high susceptible (R5)
ewes

Results 77
4.5 Localisation of PrPC
As it has been done for PRNP mRNA localisation immunohistochemistry was done to
localise PrPC in ovary tissue and in 1-month-old foetuses of both groups. The technique
was optimised firstly using various regions of the brain including cerebrum, cerebellum
and medulla oblongata, which served as positive control. In this study, the antigen-
antibody binding was visualised using HRP-AEC substrate and the sample was
counterstained using haematoxylin. HRP-AEC substrate produced red-rose colour
during the enzymatic reaction while haematoxylin produced blue colour on the nucleus
of the cell. As a result, PrPC was detected in every region of the brain examined (Figure
20) with intense staining in the interface between the white and grey matter of cerebrum
and cerebellum of R1 (Figure 20 A, D) and R5 (Figure 20 B, E) groups. After
optimisation, immunohistochemistry was performed in adult ovaries and 1-month-old
foetuses, while adult brain was stained in parallel as positive controls.
Figure 20: Immunohistochemistry of the prion protein with PrP MAb 12F10 in
adult brain of sheep using HRP-AEC substrate which produces the red-rose colour
during the emzymatic reaction as a chromogen. PrPC (shown in red) was detected in the
gray matter of cerebrum, interface between the white matter and the gray matter of
cerebellum and also in the medulla oblongata. Control sections were devoid of specific
staining with the PrP MAb (data not shown)
A
R1 Cerebrum
Neuron cell body
Gray matter
50 µm
C
R1 Medulla oblongata
Neuron cell body
50 µm
F
R5 Medulla oblongata
Neuron cell body
Glial cells
50 µm
B
R1 Cerebellum
Purkinje cells
Gray matter
White matter
Granulosa cells layer
Molecula layer
100 µm
E
R5 Cerebellum
Pia matter
White Matter
Granulosa cells layer
Molecula layer
Purkinje cells
Gray matter 100 µm
D
R5 Cerebrum
Pyrimidal cells
Gray matter
50 µm

Results 78
Figure 21: Immunohistochemistry of the prion protein with PrP MAb 12F10 in
ovine 1-month-old R1 (A, B and C) and R5 (D, E and F) foetuses using HRP-AEC
substrate which produces the red-rose colour during the emzymatic reaction as
a chromogen. PrPC (shown in red) was detected in brain (A and D), heart (B and E) and
kidney (C and F). Immunostaining of the PrPC was not found in liver and dermatome
(E). Control sections were devoid of specific staining with the PrP MAb (G, H and I)
4.5.1 Localisation of PrPC in 1-month-old foetuses
Immunohistochemistry was done in snap-frozen sections of 1-month-old R1 and R5
foetuses. The results presented PrPC in brain (Figure 21A, D), heart (Figure 21B, E) and
kidney (Figure 21C, F) of R1 and R5 foetuses, respectively, compared to the control
sections that were devoid of specific staining with the PrP MAb of brain (Figure 21G),
heart (Figure 21H) and kidney (Figure 21I). Under the light microscope, the staining
was detected around the nucleus of the cells. In this experiment, the intensity of the
Ventricular space
25 µm
100 µm
Ventricular space
50 µm
Granulosa cells
50 µm Ventricle (heart)
Ventricle (heart)
Liver
Dermatome
200 µm
100 µm
Liver
Mesonephric glomeru li
Mesonephric duct
Mesonephric glomeruli
Mesonephric duct
200 µm
100 µm Ventricle (heart)
Mesonephric duct
Mesonephric glomeruli 100 µm
A B C
D E F
G H I

Results 79
PrPC staining was not different between R1 and R5 foetuses. The staining was found to
be more intense in the heart of the foetuses than in kidney and even in the brain. In
addition, PrPC was not detectable in the other organs of the foetuses such as eye (data
not shown), liver or dermatome (Figure 21E).
Figure 22: Immunohistochemical localisation of PrPC in ovine ovaries (black
arrow). Strong staining was found in ovarien cortex (A and D) and ovarian medulla (B
and E) of R1 and R5 ewes, respectively. PrPC was not detected in the oocyte, granulosa
cells and theca cells of R5 animal (G) and in corpus luteum (C and F) of R1 and R5
ewes, respectively. Ovine brain was stained in parallel as positive control for PrPC
immunostaining (H). Control sections were devoid of specific staining with the PrP
MAb (I)
100 µm
I
200 µm
E
200 µm
B
20 µm
H
50 µm
D
20 µm
Resul ts 7 2
A
200 µm
Corpus luteum
F
100 µm
Corpus luteum C
G
50 µm
Oocyte
Granulosa cells
Theca cells

Results 80
4.5.2 Localisation of PrPC in adult ovaries
Immunohistochemical localisation was performed in the ovary of both R1 and R5
groups. The results in R1 and R5 ovaries were not different; immunostaining of PrPC
which is shown in red under the light microscope was detectable in cortex (Figure 22A,
D) and medulla (Figure 22B, E) of R1 and R5 ovaries, respectively. The staining was
not seen in corpus luteum (Figure 22C, F) of both groups, neither in oocyte, granulosa
and theca cells (Figure 22G) of R5 ovary in this study. Comparison of the expression
level of the protein between ovarian cortex and ovarian medulla demonstrates the higher
immune complexes signal in ovarian medulla than that in cortex.

Discussion 81
5 Discussion
At the present, the precise molecular function of prion protein gene is unclear. This
study was carried on the basis that the timing and distribution of prion protein mRNA
and the protein expression knowledge may lead to better understanding of its function.
Semi-quantitative RT-PCR, quantitative real-time PCR and fluorescent in situ
hybridisation were used to characterise prion protein gene (PRNP) expression and
location, while immunohistochemistry was used to investigate the location of the
protein in organs. According to previous studies showing that polymorphisms at codons
136, 154 and 171 of the ovine PRNP associate to the prion disease susceptibility.
Animals carrying resistant (R1) or high susceptible (R5) genotypes were used.
5.1 Genotype and allele frequencies of the PRNP
The results of this study showed the genotype and allele frequencies for different amino
acids at positions of 136, 154 and 171 of the PRNP in various breeds of sheep. At codon
136 alanine (A) and valine (V) were observed, at codon 154 arginine (R) and histidine
(H) were observed, and at codon 171 glutamine (Q), arginine and histidine were
commonly detected; two animals from a commercial flock carried lysine (K) at the
codon 171. The genotype of these two animals was ARQ/ARK which is rare;
a classification in one of the risk groups is not possible. As it has been the case for the
other sheep breeds, not all possible allelic and genotypic variants were observed. In this
study, six allelic variants and thirteen genotypes were shown. Similar to Acutis et al.
(2004) and Gombojav et al. (2003), the allelic variant ARK was observed besides the
other five common alleles of ARR, ARQ, ARH, AHQ and VRQ in Italian Biellese
breed rams and Mongolian sheep; twenty-one and eleven genotypes were found in those
studies, respectively. From the previous studies of Acin et al. (2004) and Tranulis et al.
(1999), five common allelic variants were seen in native healthy Spanish and
Norwegian sheep; nevertheless, only the ARQ, AHQ and VRQ alleles and six
genotypes were shown in Icelandic sheep (Thorgeirsdottir et al. 1999) (Table 11 and
Table 12.)

Discussion 82
Table 11: Frequencies of PRNP genotypes in sheep of the present study and in
Icelandic, Norwegian, Italian, Mongolian and Spanish sheep
Risk
group
PRNP
genotype
Present
study
Icelandic
sheep1
Norwegian
sheep2
Italian
ram3
Mongolian
sheep4
Spanish
sheep5
R1 ARR/ARR 22.84 0.0 12.5 1.4 1.8 2.4
ARR/AHQ 1.2 0.0 6.3 0.7 0.4 1.4 R2
AHQ/AHQ 0.3 0.2 0.8 0.2 0.0 0.0
ARR/ARQ 23.2 0.0 31.7 11.4 18.8 23.2
ARR/ARH 0.3 0.0 2.1 0.5 0.0 3.1
ARQ/AHQ 6.2 6.6 10.4 5.5 0.4 3.7 R3
ARH/AHQ 0.0 0.0 0.0 0.4 0.4 0.0
ARH/ARH 0.0 0.0 0.0 0.2 1.8 0.4
ARQ/ARH 2.5 0.0 3.8 5.7 8.1 6.6
ARQ/ARQ 22.8 75.9 16.7 56.3 66.4 50.4
VRQ/ARR 5.9 0.0 4.6 1.2 0.4 1.5
R4
VRQ/AHQ 2.2 0.7 1.3 0.3 0.0 0.2
VRQ/ARQ 10.5 16.0 8.3 9.9 1.1 5.7
VRQ/ARH 0.6 0.0 0.0 0.7 0.0 1.0 R5
VRQ/VRQ 0.9 0.7 1.7 0.7 0.0 0.5
ARQ/ARK 0.6 0.0 0.0 3.8 0.0 0.0
ARR/ARK 0.0 0.0 0.0 0.1 0.0 0.0
ARH/ARK 0.0 0.0 0.0 0.3 0.0 0.0
AHQ/ARK 0.0 0.0 0.0 0.3 0.0 0.0
VRQ/ARK 0.0 0.0 0.0 0.2 0.0 0.0
NC
ARK/ARK 0.0 0.0 0.0 0.2 0.4 0.0
Total 100.0 100.0 100.0 100.0 100.0 100.0
Adapted from: 1/ Thorgeirsdottir et al. (1999), 2/ Tranulis et al. (1999), 3/ Acutis et al.
(2004), 4/ Gombojav et al. (2003), 5/ Acin et al. (2004)
NC: Not classified

Discussion 83
Table 12: Frequencies of PRNP alleles in sheep of the present study and in
Icelandic, Norwegian, Italian, Mongolian and Spanish sheep
PRNP allele Present
study
Icelandic
sheep1
Norwegian
sheep2
Italian
ram3
Mongolian
sheep4
Spanish
sheep5
ARR 38.1 0.0 34.8 8.3 11.6 17.1
ARQ 44.3 87.2 43.8 74.4 80.6 69.6
ARH 1.7 0.0 2.9 3.8 6.1 5.6
AHQ 5.1 3.8 9.8 4.1 0.6 3.6
VRQ 10.5 9.0 8.8 6.8 0.7 4.2
ARK 0.3 0.0 0.0 2.5 0.4 0.0
Total 100.0 100.0 100.0 100.0 100.0 100.0
Adapted from: 1/ Thorgeirsdottir et al. (1999), 2/ Tranulis et al. (1999), 3/ Acutis et al.
(2004), 4/ Gombojav et al. (2003), 5/ Acin et al. (2004)
The most frequent combination of the three codons in this experiment was ARQ
(44.0%), and the high frequent genotypes of more than 20% were ARR/ARQ,
ARQ/ARQ and ARR/ARR (23.2, 22.9 and 22.9%, respectively). The animals with
ARR/ARQ or ARQ/ARQ are moderately susceptible to scrapie, while the animals with
ARR/ARR seem to be resistant to scrapie, as was shown by many studies with naturally
or experimentally infected sheep (Belt et al. 1995, Goldmann et al. 1994, O'Doherty
et al. 2002, O'Rourke et al. 1997, Thorgeirsdottir et al. 1999). Fortunately, while the
allelic variant ARR, which is associated to resistance to scrapie, was represented at
a frequency of 38.0%, the frequency of the allelic variant VRQ, which is known to carry
a high susceptibility, was represented at 11.0% in the examined group of sheep. These
results are in agreement with several investigations, which showed the highest
frequency in ARQ allele followed by the ARR allele in Icelandic (Thorgeirsdottir et al.
1999), Norwegian (Tranulis et al. 1999), Italian (Acutis et al. 2004), Mongolian
(Gombojav et al. 2003) and Spanish sheep (Acin et al. 2004). The frequency of ARQ
allele ranges from 43.8 to 87.2%, and that of ARR, ARH, AHQ and VRQ alleles range
from 0.0 to 38.1, 0.0 to 6.1, 0.6 to 9.8 and 0.7 to 10.5%, respectively (Table 12).
The PRNP genotype frequencies in this study were also in agreement with observations
made in four healthy major breeds of sheep in Norway that showed the highest

Discussion 84
frequency in ARR/ARQ genotype followed by ARQ/ARQ genotype. In contrast, the
ARQ/ARQ genotype was more frequent than the ARR/ARQ genotype in Icelandic
sheep (scrapie-free regions and scrapie regions), Italian Biellese ram, healthy Spanish
and Mongolian sheep (Acin et al. 2004, Acutis et al. 2004, Gombojav et al. 2003,
Thorgeirsdottir et al. 1999, Tranulis et al. 1999) (Table 11).
The genetic data on the PRNP polymorphisms offer the possibility of controlling natural
scrapie in sheep populations by selecting genotypes carrying scrapie resistant alleles or
either by eliminating the PRNP genotypes carrying high susceptible alleles in breeding
animals. Breeding programmes for animals carrying genotypes that determine resistance
and the elimination of animals with the VRQ allele are already underway in many
European (EU) countries. An increase in ARR/ARR genotype frequency was shown in
ovine animals from European Commission member states (without United Kingdom,
UK) during the period of 2002 to 2005. ARR/ARR genotype frequencies in 2002, 2004
and 2005 were 14.0, 18.0 and 21.0%, respectively (European Commission 2003, 2005,
2006).
In this experiment, sheep were grouped based on the classification system mentioned in
Erhardt et al. (2002). This classification system is different from the NSP system used in
the UK as shown in Table 13 (European Commission 2004).
Table 13: The PRNP genotypes and risk groups in accordance with the NSP
classification system used in the United Kingdom
Risk group Genotype
NSP1 ARR/ARR
NSP2 ARR/ARQ, ARR/ARH, ARR/AHQ
NSP3 (ARQ/ARQ) ARQ/ARQ
NSP3 (others) AHQ/AHQ, ARH/ARH, ARQ/ARH, ARQ/AHQ, ARH/AHQ
NSP4 ARR/VRQ
NSP5 VRQ/ARQ, VRQ/ARH, VRQ/AHQ, VRQ/VRQ

Discussion 85
Table 14: PRNP genotypes frequencies in the examined group of sheep in
accordance with the NSP classification system used in the United Kingdom
Risk group Genotype Number of
animals
Genotype
frequency (%) Risk group (%)
NSP1 ARR/ARR 74 22.84 22.84
ARR/ARQ 75 23.15
ARR/ARH 1 0.31 NSP2
ARR/AHQ 4 1.23
24.69
NSP3 (ARQ/ARQ) ARQ/ARQ 74 22.84 22.84
AHQ/AHQ 1 0.31
ARH/ARH 0 0.00
ARQ/ARH 8 2.47
ARH/AHQ 0 0.00
NSP3 others
ARQ/AHQ 20 6.17
8.95
NSP4 VRQ/ARR 19 5.86 5.86
VRQ/ARQ 34 10.49
VRQ/ARH 2 0.62
VRQ/AHQ 7 2.16 NSP5
VRQ/VRQ 3 0.93
14.20
Unknown ARQ/ARK 2 0.62 0.62
Total 324 100.00 100.00
The European Commission (2006) reported that, in 2005, the frequencies of NSP1,
NSP2, NSP3 (ARQ/ARQ), NSP3 (others), NSP4 and NSP5 risk groups in 190,577
sheep from EU member states were 21.0, 37.0, 26.0, 9.0, 2.0 and 4.0%, respectively.
After reclassification of PRNP genotypes in the examined sheep according to the NSP
system, the results showed that the frequencies in our population were 22.8, 24.7, 22.8,
9.0, 5.9 and 14.2% for the NSP1, NSP2, NSP3 (ARQ/ARQ), NSP3 (others), NSP4 and
NSP5, respectively (Table 14). The NSP4 and NSP5 groups in the population of this
study were more frequent compared to those reported by European Commission (2006).

Discussion 86
The lower genotype frequency of NSP1 and higher frequency of NSP5 in our sheep
population as compared to the recently reported average in EU member states is due to
the requirement of sheep with high susceptibility genotypes of this study. The blood
samples were collected not randomly, but focused on the breed which is known to carry
the high risk genotypes. After classification and selection, the sheep used in this
experiment were Blackhead and Bentheimer breeds. All of the Bentheimer sheep used
in this study were R5 genotypes, whereas most of the Blackhead sheep carried the R1
genotype. The European Commission (2004) reported that the ARR allele frequency of
the Blackhead breed is 70 to 79% and that of the Bentheimer breed is 0 to 9%.
According to these findings Blackheads are regarded as a scrapie resistant breed and the
Bentheimer are regarded as a scrapie-susceptible breed.
5.2 PRNP mRNA expression in preimplantation embryos
This study is the first report of PRNP mRNA expression in ovine preimplantation
embryos. The quantitative gene expression levels in R1 and R5 groups were in the same
trend showing that relative expression levels were significantly lower at mature oocyte
and morula stages compared to the levels at immature oocytes and 1-month-old stages.
However, comparison between R1 and R5 groups demonstrates that PRNP mRNA
expression levels of R1 immature oocytes and 1-month-old foetuses were more
abundant than those of R5 group. The present results in ovine embryos showed the same
trend as the gene levels in bovine embryos; bovine PRNP transcript abundance
increased at zygote, was decreased along embryonic development and was elevated at
early foetal stage again (own unpublished data). The increasing of PRNP transcript at
zygote stage could be due to sperm activity after fertilisation, since PRNP mRNA was
found in spermatogenic cells of mice (Fujisawa et al. 2004). Moreover, a C-terminally
truncated isoform of PrPC was shown in bovine (Shaked et al. 1999) and ovine (Ecroyd
et al. 2004) mature sperm by western immunoblotting. Thus, sperm could be the source
of PRNP after fertilisation.
Maternal-zygotic transition (MZT) is a complex phenomenon characterised by the
initiation of transcription in the embryo and the replacement of maternal mRNA with
embryonic mRNA (Vigneault et al. 2004). MZT comprises a period of minor gene
activation in one-cell embryos, followed by a period of major gene activation in two-

Discussion 87
cell embryos in mice (Schultz 1993), occurs at the 4000- to 8000-cell stage in Xenopus
(Etkin and Balcells 1985) and at the four- to eight-cell stage in humans (reviewed in
Telford et al. 1990). The bovine MZT occurs at the 8- to 16-cell stage, and is
characterized by a major onset of transcription, while minor transcription is observed as
early as the one-cell embryo (Memili and First 1999). A switch from maternal to
embryonic genome control appears to occur at the 8- to 16-cell stage in sheep embryos.
As in the cow embryo, a relatively constant pattern of protein synthesis is observed
during the first three cell cycles (one-, two-, or four-cell embryos), but a distinctly
different pattern is observed in 16-cell embryos and at later stages (reviewed in Telford
et al. 1990). Similar to those studies, it seems likely that the minor embryonic
transcription of the PRNP occurs at zygote stage followed by the major transcription
after blastocyst stage in cattle and sheep. This implies that PRNP might have role in
normal embryo development.
5.3 PRNP mRNA and PrPC expression in prenatal foetuses
In order to investigate the expression profile of PRNP transcripts, prenatal stage whole
foetuses at the 1st month of pregnancy and various tissues of 3- and 5-month-old
foetuses were used. In addition and for scale up the number of tissues examined, various
tissues of 2-month-old foetuses (R1 and R5 groups) including brain, cotyledon, heart,
intestine, kidney, liver, lung and muscle were added into the experiment to identify the
activation of PRNP mRNA and protein in single organs during this stage. The results
showed that PRNP mRNA was found in all tissues of 2-month-old foetuses examined.
At the 3rd and 5th month of pregnancy, the expression patterns of ovine PRNP mRNA
showed a similar trend in R1 and R5 groups. Comparison of the levels in each tissue
between the 3rd and 5th month stages shows similar expression in the R5 group. These
results showed high expression levels of the PRNP mRNA in cerebrum, cerebellum,
medulla oblongata, cotyledon and spinal cord, while moderate levels were detected in
lung, heart, intestine and muscle, and low expression levels were detected in liver and
spleen. This pattern was also similar to the pattern of R1 foetuses at the 5th month of
pregnancy; nevertheless, it was different from the pattern at the 3rd month which showed
the same level of the transcript abundance in liver and spleen as in lung, heart, intestine
and muscle. The higher expression levels in neuron nerval compared to those of the

Discussion 88
other tissues were in agreement with previous studies (Han et al. 2006, Harris et al.
1993, Manson et al. 1992, Kubosaki et al. 2000, McLennan et al. 2001, Tichopad et al.
2003). On the other hand, in non-nerval tissues, the results in this study were not in
agreement with Han et al. (2006) and Ning et al. (2005) that showed similar expression
level of the ovine and murine PRNP transcripts in liver as in heart, lung and spleen.
Moreover, Tichopad et al. (2003) showed a higher abundance of bovine PRNP in liver
of adult cattle than in lung.
The ovine PRNP expression levels were stable throughout the prenatal stage in most of
the foetal tissues investigated. However, the gene abundance levels were decreased in
cerebrum, and were increased from 3 to 5 months of age in medulla oblongata, heart,
liver and spleen of both groups. Quantitative real-time PCR was performed to quantify
the amount of the gene transcripts in these tissues. The results by real time PCR
supported those results obtained by RT-PCR.
For the PrPC expression, Amselgruber et al. (2005) presented that PrPC was detected in
pancreas of bovine prenatal embryos ranging from 7 to 86 cm in crown-rump length.
The present study demonstrated, for the first time, that the PrPC is expressed in brain,
cotyledon, heart, intestine, kidney, liver, lung and muscle of ovine prenatal embryos
since the 2nd month of embryogenesis. Since PrPC expression levels in various tissues of
R1 and R5 foetuses were in the same trend, and comparison within each tissue shows
similar level between the two groups, it could be concluded that there is no relationship
between PRNP genotype and the tissue expression of the PrPC in prenatal foetuses at
this developing period.
PrPC is a glycoprotein present at high level in the brain. It is also found in the heart,
kidney and lung at intermediate levels, but is not detectable in the liver (Bendheim et al.
1992, Horiuchi et al. 1995). Moudjou et al. (2001) have revealed the presence of PrPC in
skeletal muscle, uterus, thymus, tongue and liver other than in brain, heart and lung of
ewes. By a two-size enzyme immunometric assay of that study, the lowest concentration
of PrPC was shown in the liver. PrPC in brain was found to be between 564-16,000 fold
more abundant than in liver, and between 20-50 fold more abundant than in the rest of
tissues mentioned (Moudjou et al. 2001). This present study supports previous studies
that PrPC was detectable at moderate level in heart, intestine, kidney, lung and muscle;
however, the level of PrPC detected in liver was as high as in brain in our study. Ikeda et
al. (1998) demonstrated that PrPC expression was negligible in normal liver tissue, but

Discussion 89
was found to increase dramatically in diseased livers associated with stellate cell
activation. It is reported that activated stellate cells undergo metabolic alterations which
influence the production of nerve-related proteins such as N-CAM (Knittel et al. 1996)
or GFAP (Niki et al. 1996), respectively, in rats. Moreover, Manson et al. (1992) have
suggested that PrPC may function as a neural cell receptor and directing and/or
maintaining the architecture of the nervous system. Therefore, the demonstration of
high PrPC levels in brain and liver by western blot is consistent with these views.
Prion protein is a cell surface glycosylated protein with two N-glycosylation sites;
therefore, forms of mature PrPC or glycoforms are found with different degrees of
glycosylation. The glycoform signature of PrPC in the brain, as obtained with most anti-
PrP antibodies described in the literature, is in general characterised by the presence of
three bands with decreasing intensity, representing the bi-, mono- and unglycosylated
isoform of PrP of ~33, 30 and 28 kDa, respectively (Moudjou et al. 2001). In this study,
PrPC could be detected by loading protein extracts from only 1 mg of tissue per lane of
almost all tissues except cotyledon. The PrPC reactive bands detected in cotyledon tissue
of both groups were very weak and unclear. Due to these results, western blot analysis
was done in addition in double concentration of protein extracted from cotyledon of 2-,
3- and 5-month-old foetuses (R1 and R5 groups). The results clearly revealed the
existence of PrPC with the molecular weight of ~ 30 kDa in cotyledon of 3- and 5-
month-old R1 and R5 foetuses, and assured the presence of PrPC in the 2-month-old
foetuses (Figure 23). Interestingly, most of foetal tissues examined produced mainly the
biglycosylated isoform, and minimally the monoglycosylated isoform of PrPC.
Nevertheless, the cotyledon of both R1 and R5 foetuses produced only the
monoglycosylated isoform. These suggest that the PrPC in foetal cotyledon is
differentially glycosylated from other foetal tissues, and could be involved in different
physiological functions of the protein.
The study of PrPC expression in prenatal foetuses established that the levels of PrPC in
some tissues were not related to the levels of the gene transcript. At 2 months of age,
PRNP mRNA level(s) were high in brain and cotyledon, and low in liver. On the other
hand, the PrPC was highly expressed in brain and liver, and was very low in cotyledon.
Liver is an organ which plays a major role in detoxification, blood protein formation
and several metabolism functions. In the foetus, blood leaving the placenta via the
umbilical vein passes through the ductus venosus and other veins of the foetal liver

Discussion 90
(Valadian and Porter 1977). Since PrPC was found on peripheral blood mononuclear
cells (Halliday et al. 2005), the accumulation of PrPC in foetal liver might have resulted
from the circulation of PrPC from its maternal placenta. Our finding suggested more that
organs, for which infectivity has been demonstrated (brain and intestine), contain more
PrPC than tissues shown not to support infection (cotyledon, heart, lung and muscle)
(Hadlow et al. 1982).
Figure 23: Western blot analysis, revealing the immuno reactive bands of PrPC in
foetal cotyledon of scrapie-resistant (R1) and high susceptibility (R5) groups at 2, 3 and
5 months of pregnancy. Protein extracts from 2 mg of each sample were loaded per
lane. The foetal brains were used as positive control
5.4 In situ analysis of PRNP mRNA and PrPC expression in 1-month-old foetuses
Localisation of the mRNA and protein in tissues is an important tool to understand the
function of target genes at the cellular level. In the present study, fluorescent in situ
hybridisation and immunohistochemistry were used as a tool for localisation of the
PRNP transcript and the PrPC, respectively, in 1-month-old foetuses and ovaries.
The results presented here demonstrate for the first time that the ovine PRNP mRNA is
distributed not only in neural cells, but was also detected in many non-neural organs
such as dermatome, vertebral column, heart, liver and kidney of sheep foetuses since the
1 month of age. The in situ hybridisation signals were detected in the brain and liver of
control sections which were hybridised with sense RNA probe as well; however, the
signals in the sections with antisense probe were intensely labelled above the control
one. At this time of age, PrPC was localised in developing brain, heart and kidney.
These results correlate well with several studies demonstrating a distribution of PRNP
mRNA in mouse and chicken foetuses during embryonic development. PRNP
transcripts were found in developing brain and spinal cord of embryonic day 13.5 as

Discussion 91
well as in ganglia and nerves of the central and peripheral nervous system of embryonic
day 16.5 in mice. The gene transcripts were also detected in specific non-neuronal cell
populations such as intestine, dental lamina, tooth bud and kidney of the 13.5 and 16.5
day embryos, and in extra-embryonic tissues from day 6.5. No PRNP transcript could be
detected in 6.5- or 9.5-day-old mouse embryos (Manson et al. 1992). In contrast to the
study of Manson and co-workers, Miele et al. (2003) presented the activation of PRNP
transcription since the day 8.5 and 9.5 of mouse embryogenesis. Eventhough the gene
transcript was not found at day 8.5, it was widespread throughout all regions of the
developing brain such as telencephalic, mesencephalic and metencephalic vesicles, and
the developing neural tube at day 9.5. During chicken embryogenesis, the mRNA for
a chicken PRNP was found in the brain and spinal cord as early as embryonic day 6 (the
earliest stage examined). This transcript was also detectable in dorsal root ganglia,
retina, aorta, gizzard, intestine and heart of embryonic day 11 (Harris et al. 1993). The
expression levels of PRNP mRNA increased 8-fold between days 1 to 42 of postnatal
development in mouse brains. The PrPC level has also increased over this period, most
significant from days 1 to 10 (Miele et al. 2003). PRNP mRNA and protein continue to
be expressed at high level in the central nervous system of adult animal (Bendheim et al.
1992, Han et al. 2006, Harris et al. 1993, Kubosaki et al. 2000, Manson et al. 1992,
McBride et al. 1992, McLennan et al. 2001, Tichopad et al. 2003). The mRNA was
predominantly localised in the brain within pyramidal cells of the hippocampus, large
neurons of the thalamus and neocortex and Purkinje cells of the cerebellum (Tanji et al.
1995). Furthermore, the regulation of PRNP mRNA expression by nerve growth factor
(NGF) has been shown in a clonal cell line, PC12 cells, (Wion et al. 1988) and many
regions of postnatal mouse brain (Mobley et al. 1988). The expression of PRNP mRNA
and PrPC in developing brain and neural tube started at the early stage of foetal
development and its continued expression in adult brain demonstrate that PRNP might
be critical to neuronal differentiation or survival during the development of the central
and peripheral nervous system.

Discussion 92
5.5 PRNP mRNA and PrPC expression in reproductive tissues of ewes
The expression patterns of PRNP transcript in reproductive organs of R1 and R5 ewes
were not different at all stages studied. Comparison among tissues within each group
displays the similar expression level of PRNP transcript in ovary, oviduct, endometrium
and myometrium, whereas the highest level, as high as in brain (data not shown), was
found in caruncle of both groups. Between R1 and R5 ewes within each stage, the
expression level of PRNP mRNA in ovary, oviduct, endometrium and myometrium
were not different, while the levels in R1 caruncle were higher than that in R5 caruncle
at the 1st month of pregnancy. However, western blot analysis revealed a similar
abundance of PrPC in R1 and R5 caruncle, but higher abundant when compared to the
level in other tissues. Moreover, lower expression levels of PrPC were detected in
oviduct as compared to ovary, endometrium and myometrium of both groups. The
ruminant placenta is classified as synepitheliochorial (Wooding and Flint 1994) and has
a cotyledonary organization in which both foetal and maternal villi are discernible as
discrete structures (placentome) on the uterine epithelium. Intimate contact between
maternal and foetal tissue occurs only in the placentome (comprising the foetal
cotyledon and maternal caruncle), which is the most highly vascularized portion of the
placenta. This study also found that the ovine PRNP mRNA and PrPC levels were
highest in caruncle compared to other tissues investigated. Moreover, the PrPC was
abundant at low level in the cotyledon of 2-month-old foetuses, while the levels were
high at the 3rd and 5th month of pregnancy. These results were in agreement with
Kubosaki et al. (2000) who showed the stronger signals of PRNP mRNA in sheep
caruncle than the signals in myometrium by in situ hybridisation. Similarly, Tuo et al.
(2001) showed higher expression level of PrPC in caruncular endometrium than in
intercaruncular endometrium, myometrium, oviduct and ovary by western blot analysis.
The results from this study suggest that the sheep placenta, caruncle especially, may be
an important organ for the conversion of PrPC to PrPSc, and also substantiate the
probability that placenta plays an important role in natural transmission of scrapie. Even
Onodera et al. (1993) displayed the undetectable level of PrPSc in the placenta of
Corriedale and Suffolk sheep at the 3rd and 5th month of pregnancy, respectively,
a significant amount of scrapie agent has been isolated from the placenta of pregnant
ewes by Race et al. (1998).

Discussion 93
The present study has demonstrated for the first time that the PRNP transcript was
localised in oocytes, granulosa cells, theca cells, ovarian cortex, ovarian medulla and
corpus luteum. Interestingly, the PrPC was detectable only in ovarian cortex and ovarian
medulla, but not in the oocyte, granulosa and theca cells. In sheep, the ovum is released
from the ovary at estrus and reaches the uterus through the oviduct within 3 to 4 days.
The embryo will not hatch from the zona pellucida until it is in the uterus. Tuo et al.
(2001) and Hadlow et al. (1979) demonstrated that PrPC, but not the PrPSc, was present
in the ovary and oviduct. These findings prove the recent observations on the prevention
of TSE transmission (maternal-vertical) in bovine and ovine preimplantation embryos
and foetuses using embryo transfer (Foote et al. 1993, Foster et al. 2004, Wang et al.
2002, 2001, Wrathall et al. 2002). The prevention of the TSE transmission by embryo
transfer procedures, which are neither transmitted to offspring via the embryo nor to
recipient animals, even when the embryos are collected from the TSE-infected donors,
might have resulted from the lack of PrPC in oocytes, the protection of zona pellucida
and the lack of PrPSc in ovary and oviduct. In addition, the fact that PrPC was not
expressed in oocyte, granulosa and theca cells is meaningful for the use of reproduction
biotechnologies, which aim at the application of these cells (embryo transfer, in-vitro-
fertilisation/production). In the uterus of non-pregnant ewes, PrPC was shown in
caruncular endometrium and myometrium. The level of this protein was increased in the
pregnant caruncular endometrium as compared to non-pregnant one (Tuo et al. 2001).
Throughout the pregnancy period, PRNP mRNA expression level was increased in the
caruncle. Moreover, both RT-PCR and western blot analysis revealed the higher
expression levels of the mRNA and protein in the caruncle than those of other tissues
studied. Since PrPSc was detected only in caruncular endometrium and cotyledonary
chorioallantoic of the placentome from pregnant infected ewes (Tuo et al. 2001), it
appears that PrPSc is present in tissue known to express high level of PrPC. In addition,
PrPC was not detectable in the amnion during pregnancy period (Tuo et al. 2001);
therefore, the foetus might be separated from the PrPSc-rich placental tissues by the
PrPC-free amnion.
The tissue distribution of PrPC in sheep was first studied by Horiushi et al. (1995). In
2001, Mohammed et al. displayed the presence of PrPC in some additional tissues from
sheep with each ARR/ARQ, ARR/AHQ or ARQ/VRQ genotypes. Unfortunately, due to
the low number of sheep tested, the relationship between animal genotype for the PRNP

Discussion 94
locus and tissue expression of PrPC could not be determined. However, studies with
permissive cells expressing two different PRNP variants (ARR and VRQ) indicated that
cell biological properties of ovine PRNP can vary with natural polymorphisms and raise
the possibility that differential interactions of PRNP variants with the cellular
machinery may contribute to permissiveness or resistance to prion multiplication
(Sabuncu et al. 2005). Moreover, several studies demonstrated that the accumulation of
PrPSc in placenta of ewes is determined by the foetal PRNP genotype and the pregnancy
status of scrapie-infected ewes. The PrPSc was detected in placentomes of ewes with
171QQ conceptuses, but not in those with 171QR conceptuses or in non-pregnant uterus
of infected ewes (Andreoletti et al. 2002, Tuo et al. 2002). While the accumulation level
of PrPSc in the uterus was decreased throughout the pregnancy period, it was increased
in the caruncle (Tuo et al. 2002). PrPC is a primary substrate for the conformation
change of the PrPC into PrPSc. The amount of PrPC is a rate-limiting step in the
development of the prion disease. This present study showed an effect the PRNP
variants on the gene expression level in caruncle during the gestation period; PRNP
mRNA levels were increased in R5 caruncle, while it seems to be stable in R1 caruncle.
Nevertheless, no relationship between the gene variants, and the normal protein
distribution was observed in the present study. Interestingly, all female reproductive
organs examined in this study showed only bands of the biglycosylated isoform. This
contrasts to previous studies that PrPC reactive bands of either bi- or hyperglycosylated
isoformes were mostly found (Ikada et al. 1998, Mohammed et al. 2001, Pammer et al.
1998, Tuo et al. 2001).
In conclusion, knowledge about the switch-on period of the prion protein gene both on
mRNA and protein levels during prenatal stage of mammalian embryos was not
available so far. In order to understand the mechanism and function of PrPC in
embryogenesis, this information is of a great importance. This study is the first to report
the expression of PRNP mRNA and PrPC during prenatal stages of sheep. The relative
abundances of PRNP mRNA and protein have been documented in various tissues of
prenatal embryos as well as reproductive tissues of ewes. The mRNA and protein were
found in many tissues of preimplantation stages foetuses as early as 1 month of age, and
was detected in all tissues studied at the 2nd month; however, the levels of those
activities were different between tissues. In 1-month-old foetuses, PRNP mRNA was
expressed in developing brain, heart, kidney, liver, vertebral column and dermatome,

Discussion 95
while the PrPC was detectable only in the brain, heart and kidney. Both mRNA and
protein were detected in all foetal tissues examined including brain, cotyledon, heart,
intestine, kidney, liver, lung, muscle and spleen since at the 2nd month (Table 15). With
the exception of the foetal cotyledon and liver, the levels of PrPC correlate well with the
relative mRNA expression levels in sheep tissues. This study displayed that the mRNA
was high in cotyledon, but was low in liver of the foetuses. In contrast, PrPC were found
at high level in liver but low level in cotyledon. These might be involved in the function
of PRNP gene. In female reproductive organs of pregnant ewes, both PRNP mRNA and
PrPC were found at similar level when compared between ovary, oviduct, endometrium
and myometrium. The mRNA and the protein were highest and increased throughout
the gestation period in R5 caruncle. In addtion, the studies in R1 and R5 genotypes
sheep showed no relationship between PRNP genotypes and the mRNA and protein
expression levels in the prenatal foetuses. Since the levels of PRNP mRNA in R5
caruncle were higher than that of R1 caruncle, the PRNP genotype (according to the
polymorphisms at codons 136, 154 and 171) may have an effect on the gene expression
level in caruncle tissue of ewes.
In the present study, the expressions of PRNP transcripts were observed as early as at
the preimplantation developmental stage. The level was increased immediately after
fertilisation compared to the oocyte stage in cattle (own unpublished data). These
suggest that the minor transcription activity of prion protein occur at zygote stage, and
the PrPC might have role in normal embryo development. The increase of the gene
transcript at zygote stage might have resulted from sperm activity, since a C-terminally
truncated PrPC isoform was found in bovine (Shaked et al. 1999) and ovine (Ecroyd et
al. 2004) mature sperm by the western immunoblotting; thus, sperm could be one source
of PRNP in the zygote. The PRNP mRNA expression profiling should be performed in
some additional stages of ovine preimplantation embryos to clarify the minor and major
embryonic activation of this gene. The protein expression profiling in those
preimplantation embryos, and, moreover, silencing the gene at zygote stage might give
us the clues to its physiological role. In addition, PRNP expression both at mRNA and
protein levels could be investigated in the earlier stages of before 1 month of age in
vitro in order to define the exact timing and localisation of PRNP transcriptional and
translational activations during the prenatal stage.

Table 15: PRNP mRNA and PrPC expression in 1- 2- and 3-month-old foetuses
Month of age Brain Cotyledon Spinal
cord Heart Intestine Kidney Liver Lung Muscle Spleen
Vertebral
column Eyes
Ovine PRNP
-1 month
-2 months
-3 months
+
+
+
nd
+
+
nd
nd
+
+
+
+
nd
+
+
+
+
nd
+
+
+
nd
+
+
nd
+
+
nd
nd
+
+
nd
nd
+
nd
nd
Ovine PrPC
-1 month
-2 months
+
+
nd
+
nd
nd
+
+
nd
+
+
+
-
+
nd
+
nd
+
nd
nd
-
nd
-
nd
+ present
- absent
ns = not done
Discu
ssion
9
6

Summary 97
6 Summary
This study was carried out with the main objectives (i) to determine whether the
polymorphisms at codons 136, 154 and 171 of PRNP locus affect the gene expression,
(ii) to observe the exact timing of PRNP transcript and protein activation, and (iii) to
investigate the expression profile of the PRNP in preimplantation embryos, reproductive
organs of ewes and various tissues of their foetuses during prenatal stage. To full fill
these objectives, sheep with scrapie resistance genotype (R1 group; ARR/ARR) and
high susceptible to scrapie genotypes (R5 group; VRQ/ARQ, VRQ/ARH, VRQ/VRQ)
were used as an animal model. The samples were immature and mature oocytes, morula
stage embryos, 1-month-old foetuses, various tissues such as brain, cotyledon, spinal
cord, heart, intestine, liver, lung, muscle and spleen from 3- and 5-month-old foetuses
as well as ovary, oviduct, endometrium, myometrium and caruncle from 1, 3 and 5
months pregnant ewes.
For experiments using real time PCR, mRNA has been isolated using oligo (dT)25
attached magnetic beads from three independent pools containing 15 to 20 immature
oocytes, or three members of each mature oocytes or embryos. mRNA was reverse
transcribed to cDNA with oligo dT(12)N primer. Real time RT-PCR was done using
those samples and 1-month-old foetuses (n=2). The results displayed expression of the
gene in all samples examined. The relative abundance of the gene transcript as
compared to the level of the ovine Histone H2a was higher in immature oocytes and
1-month-old foetuses and lower in mature oocytes and morula stage embryos of both
groups (p≤0.05). Significant effects of the PRNP genotype on the mRNA level were
shown in immature oocytes and 1-month-old stages as indicated by the higher levels in
R1 samples than those of R5 samples.
To identify the gene transcript and to compare the expression level among tissues,
stages and risk groups (n=2 for each), semi-quantitative RT-PCR was performed by
using 18S-rRNA as an internal standard. Total RNA was isolated from samples using
TRIZOLE reagent and then subjected to DNase digestion. Finally, 1 µg of total RNA
was reverse transcribed to cDNA with oligo dT(12)N and random primers. The results
revealed that PRNP mRNA was detectable in all maternal and foetal tissues throughout
the gestation. The gene mRNA level was highest in caruncle, whereas the levels, which
seem to be equal and stable during the gestation, were low in ovary, oviduct,

Summary 98
endometrium and myometrium. Interestingly, while the mRNA level in R1 caruncle was
stable through the pregnancy period, the level increased from the 1st to 3rd months, and
decreased at the 5th month in R5 caruncle. To confirm these changes, real time PCR was
performed. The quantitative expression levels in R1 and R5 caruncle support the results
by RT-PCR. Mean and standard error in R1 caruncle at the 1st, 3rd and 5th months of
pregnancy were 48.1 ± 19.6, 42.0 ± 6.1 and 26.3 ± 2.3, respectively, and that of R5
caruncle were 17.2 ± 0.6, 44.9 ± 2.6 and 28.7 ± 12.4, respectively.
In both R1 and R5 prenatal foetuses, PRNP transcript levels were high in spinal cord,
cotyledon and all regions of the brain such as cerebrum, cerebellum and medulla
oblongata. Moderate levels were found in heart, intestine, lung and muscle, and low
levels were observed in liver and spleen. The level of the gene transcript from 3 to 5
months of age was increased in spinal cord, but stable in cerebellum, intestine, lung and
muscle of both groups. Interestingly, while the level was stable in R1 cerebrum and R1
medulla oblongata, it was changed through the gestation in those of R5 foetuses.
Moreover, a differentiation in the gene expression pattern between R1 and R5 foetuses
was observed in the heart, liver and spleen. Therefore, real time PCR was used to
quantify these differences. The results showed that PRNP levels relative to the levels of
18S-rRNA in R1 cerebrum, medulla oblongata, heart, liver and spleen were 47.9, 41.4,
4.3, 2.2 and 5.5, respectively, at the 3rd month of pregnancy, while 35.1, 50.1, 7.0, 8.0
and 9.4, respectively, at the 5th month. From real time PCR analysis results, it seems
likely that PRNP expression level was decreased through the pregnancy period in R1
foetal cerebrum, while it was increased in the rest of tissues. Similar to R5 foetuses, at
the 3rd month of pregnancy, PRNP mRNA relative abundance levels in cerebrum and
medulla oblongata were higher than those in heart, liver and spleen. The levels at this
stage were 32.1, 33.6, 7.3, 2.4 and 4.3, respectively. At the 5th month, the level in R5
medulla oblongata (67.3) was also higher than those of cerebrum (24.6), heart (7.5),
liver (2.5) and spleen (7.7).
Since the gene transcript was detected in all tissues of 3-month-old foetuses, RT-PCR
was carried out in brain, cotyledon, heart, intestine, kidney, liver, lung and muscle of 2-
month-old foetuses of both groups. Results revealed the presence of the gene transcripts
in all tissues investigated. The gene expression patterns were in the same trend as that of
3- and 5-month-old foetuses as indicated by the high expression level in brain and

Summary 99
cotyledon, moderate level in heart, intestine, kidney, lung and muscle, and low level in
liver.
Western blot was performed in reproductive tissues of 1-month pregnant ewes and those
tissues from 2-month-old foetuses to define whether the prion protein (PrPC) is activated
at this stage. The results displayed the immuno reactive bands corresponding to the PrPC
in all tissues investigated of both groups. Interestingly, while the PrPC level in most
tissues correlated well with the level of PRNP transcript, the level of PrPC in foetal
cotyledon was very low and the level in foetal liver was as high as that in brain.
As PRNP transcript and protein were detected in 1-month-old foetuses and ovaries,
fluorescent in situ hybridisation (FISH) and immunohistochemistry (IHC) were
performed to localise the gene mRNA and protein, respectively, on these samples.
FISH was carried out on 7 to 10 µm cryostat sections of snap frozen tissues. A non-
radioactive probe with a reporter molecule digoxigenin (DIG) detected by indirect
method with the help of tyramide signal amplification (TSA, fluorophore system) was
applied in this experiment. The control sections hybridised with sense RNA probe were
done in parallel. On the other hand, IHC was performed on 5 to 7 µm cryostat sections
with the help of avidin-biotin complex (ABC). The immuno-complexes were visualised
using 3-amino-9-ethylcarbazole (AEC) substrate. Sections devoid of specific staining
with the PrP antibody were used as control for the IHC. Staining intensity is a function
of the enzyme activity and improved sensitivity can be achieved by increasing the
number of enzyme molecules bound to the tissue. The precipitation of the tyramide
(a phenolic compound) after oxidation and the multiple binding sites between the
tetravalent avidin and biotinylated antibodies (bound to the antigen) are ideal for
achieving this amplification. Both of FISH and IHC were pre-optimised in adult brains
which were done in parallel as positive control through out the experiment. The results
showed that both of PRNP mRNA and PrPC were localised in developing brain, heart
and kidney of 1-month-old foetuses of both groups, whereas only the mRNA, but not
the PrPC, was found in liver, vertebral column and dermatome. The gene transcript was
also localised in oocytes, granulosa and theca cells, and dispersed in ovarian cortex,
medulla and corpus luteum. However, the PrPC was detected only in the ovarian cortex
and medulla of 1-month pregnant ovaries of both groups.
In conclusion, this study is the first report of PRNP mRNA and PrPC expression in
ovine preimplantation embryos and prenatal foetuses. The levels of PRNP transcript in

Summary 100
immature oocytes and 1-month-old foetuses were significantly higher (p≤0.05) than
those in mature oocytes and morula stage embryos. The PRNP mRNA is activated in
brain, vertebral column, dermatome, heart, liver and kidney as early as the 1st month of
embryogenesis. At this time, PrPC is produced in the brain, heart and kidney.
Furthermore, the protein activation in cotyledon, intestine, liver, lung and muscle occur
in between the 1st and 2nd months of foetal development. Throughout the prenatal
stages, the mRNA levels were high in spinal cord, cotyledon and all regions of brain of
the foetuses. Moderate levels were shown in intestine, lung and muscle, and low levels
were detected in liver and spleen. In reproductive organs of ewes, high expression level
of the gene transcript was found in caruncle of ewes, while the level in ovary, oviduct,
endometrium and myometrium were moderate. With the exception in foetal cotyledon
and liver, the level of PrPC correlates well with the relative mRNA expression level in
sheep tissues. The results of this study revealed a correlation between the reported
PRNP polymorphisms and the gene mRNA level in immature oocytes and 1-month-old
stages. Moreover, it seems likely that these polymorphisms have an effect on the gene
expression level in caruncle of ewes.

Zusammenfassung 101
7 Zusammenfassung
Diese Untersuchung wurde mit den folgenden Hauptgesichtspunkten durchgeführt (i)
zur Feststellung der Beeinflussung der Genexpression der Polymorphismen an Codon
136, 154 und 171 des PRNP Genortes, (ii) zur Untersuchung der zeitlichen Regulierung
der PRNP Transkripte und der Proteinaktivierung und (iii) zur Untersuchung des
Expressionsprofils des PRNP in präimplantativen Embryos, reproduktiven Geweben
von Mutterschafen und verschiedenen Geweben ihrer Föten während der pränatalen
Stadien. Zur Untersuchung wurden Schafe mit Scrapie resistenten Genotypen (R1
Gruppe; ARR/ARR) und für Scrapie hoch anfällige Genotypen (R5 Gruppe;
VRQ/ARQ, VRQ/ARH, VRQ/VRQ) als Tiermodell verwendet. Als Proben wurden
unreife und reife Oozyten, Embryonen im Morulastadium, einmonatige Föten,
verschiedene Gewebe wie Gehirn, Kotyledonen, Rückenmark, Herz, Darm, Leber,
Lunge, Muskel und Milz von drei- und fünfmonatigen Föten ebenso wie Ovar, Eileiter,
Endometrium, Myometrium und Karunkel von Mutterschaften im ersten, dritten und
fünften Trächtigkeitsmonat verwendet.
Für die Experimente unter Verwendung der Real Time PCR wurde mRNA mit Oligo
(dT)25 angehefteten magnetischen Beads aus drei unabhängigen Pools mit 15 bis 20
unreifen Oozyten, oder aus drei Teilen von jeder reifen Oozyte oder jedem Embryo,
isoliert. Die mRNA wurde entgegengesetzt mit Oligo dT(12)N Primern zu cDNA
transkribiert. Die Real-Time RT-PCR wurde mit diesen Proben und den einmonatigen
Föten (n=2) durchgeführt. Die Ergebnisse zeigten eine Expression der Gene in allen
untersuchten Proben. Die relative Anwesenheit der Gentranskripte war verglichen zum
Level des ovinen Histone H2a in unreifen Oozyten und einmonatigen Föten höher und
in reifen Oozyten und Embryonen im Morulastadium beider Gruppen niedriger
(p≤0,05). Signifikante Effekte des PRNP Genotyps auf dem mRNA Level konnten, wie
durch das höhere Level in R1 Proben verglichen mit den R5 Proben bereits angedeutet,
in den unreifen Oozyten und im Ein-Monats-Stadium gezeigt werden. Zur Identifikation
der Gentranskripte und zum Vergleich der Expressionslevel zwischen Geweben, Stadien
und Risikogruppen (jeweils n=2), wurde eine semi-quantitative RT-PCR, unter
Verwendung von 18S-rRNA als internem Standard, durchgeführt. Die gesamt-RNA
wurde mit TRIZOL Reagenz aus den Proben isoliert und ein DNase Verdau
durchgeführt. Schließlich wurde 1 µg der gesamten RNA entgegengesetzt mit Oligo

Zusammenfassung 102
dT(12)N und Random-Primern zu cDNA transkribiert. Das Ergebnis zeigte, dass die
PRNP mRNA in allen maternalen und fötalen Geweben während der Trächtigkeit
detektierbar ist. Das mRNA Level des Gens war am höchsten im Karunkel, während das
Level, welches scheinbar gleichbleibend und stabil während der Trächtigkeit war, im
Eierstock, Eileiter, Endometrium und Myometrium niedrig war. Während das mRNA
Level im R1 Karunkel während der Trächtigkeit stabil war, erhöhte sich das Level
interessanterweise vom ersten bis zum dritten Monat und verringerte sich im fünften
Monat im R5 Karunkel. Zur Bestätigung dieser Veränderungen wurde eine Real-Time
PCR durchgeführt. Die quantitativen Expressionslevel in R1 und R5 Karunkeln
sicherten die Ergebnisse der RT-PCR ab. Die Durchschnitte und Standardfehler in R1
Karunkeln im ersten, dritten und fünften Trächtigkeitsmonat waren jeweils 48,1 ± 19,6;
42,0 ± 6,1 und 26,3 ± 2,3 und in R5 Karunkeln jeweils 17,2 ± 0,6; 44,9 ± 2,6 und 28,7 ±
12,4.
In den beiden R1 und R5 pränatalen Föten waren die PRNP Transkript-Level höher im
Rückenmark, Kotyledonen und allen Regionen des Gehirns wie Cerebrum, Cerebellum
und Medulla oblongata. Mittlere Level wurden im Herz, Darm, Lunge und Muskel
gefunden, niedrige Level wurden in Leber und Milz festgestellt. Die Levels der
Gentranskripte im Rückenmark stiegen während des Alters von drei zu fünf Monaten,
blieben jedoch in Cerebellum, Darm, Lunge und Muskel beider Gruppen stabil.
Während das Level im R1 Cerebrum und R1 Medulla oblongata stabil war, veränderte
es sich während der Gestation der R5 Föten. Weiterhin wurde eine Differenzierung der
Muster der Genexpression zwischen den R1 und R5 Föten in Herz, Leber und Milz
gefunden. Daher wurde eine Real-Time PCR zur Quantifizierung dieser Unterschiede
durchgeführt. Die Ergebnisse zeigten, dass die PRNP Level relativ zu den Leveln der
18S-rRNA im R1 Cerebrum, Medulla oblongata, Herz, Leber und Milz im dritten
Monat der Trächtigkeit jeweils 47,9; 41,4; 4,3; 2,2 und 5,5 waren, während sie während
dem fünften Monat der Trächtigkeit jeweils 35,1; 50,1; 7,0; 8,0 und 9,4 waren. Aus den
Ergebnissen der Real-Time PCR Analyse schien es, dass das PRNP Expressionslevel
während der Trächtigkeitsperiode im R1 fötalen Cerebrum verringert war, während es
im restlichen Gewebe erhöht war. Ähnlich der R5 Föten während des dritten Monats der
Trächtigkeit waren die Level der relativen Mengen der PRNP mRNA in Cerebrum und
Medulla oblongata höher als die in Herz, Leber und Milz. Die Level dieser Stadien
waren jeweils 32,1; 33,6; 7,3; 2,4 und 4,3. Im fünften Monat war das Level in R5

Zusammenfassung 103
Medulla oblongata (67,3) ebenfalls höher als das von Cerebrum (24,6), Herz (7,5),
Leber (2,5) und Milz (7,7).
Da das Gentranskript in allen Geweben des dreimonatigen Fötus detektiert wurde,
wurde eine RT-PCR im Gehirn, Kotyledonen, Herz, Darm, Niere, Leber, Lunge und
Muskel von zweimonatigen Föten beider Gruppen durchgeführt. Die Ergebnisse zeigten
die Präsenz der Gentranskripte in allen untersuchten Geweben. Die Muster der
Genexpression waren im gleichen Trend wie die der drei- und fünfmonatigen Föten, wie
gezeigt durch höhere Expressionslevel in Gehirn und Kotyledonen, mittlere Level in
Herz, Darm, Niere, Lunge und Muskel sowie niedrige Level in der Leber.
Ein Westernblot wurde in den reproduktiven Geweben der im ersten Monat trächtigen
Mutterschafe und der Gewebe der zweimonatigen Föten zur Feststellung, ob das Prion-
Protein (PrPC) in diesen Stadien aktiviert ist, durchgeführt. Die Ergebnisse stellten die
zu dem PrPC korrespondierenden immunoreaktiven Banden in allen untersuchten
Stadien in beiden Gruppen dar. Während das PrPC Level in den meisten Geweben gut
mit dem Level der PRNP Transkripte korrelierte, war das Level des PrPC im fötalen
Kotyledon sehr niedrig und das Level in der fötalen Leber war ebenso hoch wie das im
Gehirn.
Aufgrund der Detektion von PRNP Transkript und Protein in einmonatigen Föten und
in Ovarien, wurden fluoreszenz in situ Hybridisierung (FISH) und Immunohistochemie
(ICH) zur Lokalisation der mRNA und des Proteins des Gens in diesen Proben
durchgeführt. FISH wurde in 7 bis 10 µm Cryostat Schnitten von gefrorenem Gewebe
durchgeführt. Eine nicht-radioaktive Probe mit dem Reportermolekül Digoxigenin
(DIG), detektiert durch eine indirekte Methode mit Hilfe von Tyramide-Signal
Amplifikation (TSA), wurde in diesem Experiment angewandt. Die Kontrollschnitte
wurden mit sense RNA Proben parallel hybridisiert. Auf der anderen Seite wurde eine
ICH auf 5 bis 7 µm Cryostat-Schnitten mit Hilfe von Avidin-Biotin Komplexen (ABC)
durchgeführt. Die Immuno-Komplexe wurden mit 3-Amino-9-Ethylcarbazole (AEC)
Substraten visualisiert. Die Schnitte ohne spezifische Färbung mit PrP Antikörpern
wurden als Kontrolle für die ICH verwendet. Die Intensität der Färbung ist eine
Funktion der Enzymaktivität und eine verbesserte Sensibilität kann durch eine
Erhöhung der Anzahl von Enzymmolekülen, welche an das Gewebe binden, erreicht
werden. Die Ausfällung der Tyramide (phenolische Komponenten) nach der Oxidation
und die multiplen Bindestellen zwischen den tetravalenten Avidin und biotinylierten

Zusammenfassung 104
Antikörpern (binden zu dem Antigen) sind ideal für das Erreichen dieser Amplifikation.
Beide, FISH und ICH, wurden in adulten Gehirnen parallel prä-optimiert und als
positive Kontrolle während des Experiments verwendet. Die Ergebnisse zeigten, dass
beide PRNP mRNA und PrPC im sich entwickelnden Gehirn, Herz und Niere der
einmonatigen Föten beider Gruppen lokalisiert sind, während nur die mRNA jedoch
nicht das PrPC in Leber, Wirbelsäule und Dermatom gefunden wurde. Das
Gentranskript war ebenfalls in Oozyten, Granulosa und Thekazellen lokalisiert sowie in
der Ovarrinde, im Ovarmark und im Gelbkörper zu finden. Das PrPC wurde jedoch nur
der Ovarrinde und Mark in den Ovarien der Tiere im ersten Trächtigkeitsmonat in
beiden Gruppen festgestellt.
Zusammenfassend kann man sagen, dass diese Untersuchung zum ersten Mal die PRNP
mRNA und PrPC Expression in ovinen Präimplantations-Embryonen und pränatalen
Föten zeigt. Die Level der PRNP Transkripte in unreifen Oozyten und einmonatigen
Föten waren signifikant höher (p≤0,05) als die in reifen Oozyten und Embryonen im
Morulastadium. Die PRNP mRNA ist im Gehirn, Wirbelsäule, Dermatom, Herz, Leber,
Lunge und Niere bereits während des ersten Monats der Embryogenese aktiv. Zu dieser
Zeit wird PrPC im Gehirn, Herz und Niere produziert. Darüberhinaus erfolgt die
Proteinaktivierung in Kotyledonen, Darm, Leber, Lunge und Muskel während dem
ersten und zweiten Monats der fötalen Entwicklung. Während der pränatalen Stadien
sind die mRNA Level im Rückenmark, Kotyledonen und allen Regionen des Gehirns
der Föten hoch. Mittlere Level wurden im Darm, Lunge und Muskel nachgewiesen und
niedrige Level wurden in Leber und Milz detektiert. In den Reproduktionsorganen der
Mutterschafe wurden hohe Expressionslevel im Karunkel der Mutterschafe gefunden,
während die Level in Eierstock, Eileiter, Endometrium und Myometrium mittel waren.
Mit Ausnahme des fötalen Kotyledon und der Leber korrelierten die Level des PrPC gut
mit dem relativen mRNA Expressionslevel im Gewebe des Schafs. Die Ergebnisse
dieser Untersuchung ergaben eine Korrelation zwischen den gezeigten PRNP
Polymorphismen und dem mRNA Level des Gens in unreifen Oozyten und
einmonatigen Stadien. Darüberhinaus, scheint es gut möglich, dass diese
Polymorphismen einen Effekt auf das Level der Genexpression im Karunkel der
Mutterschafe haben.

References 105
8 References
Acin C, Martin-Burriel I, Goldmann W, Lyahyai J, Monzon M, Bolea R, Smith A,
Rodellar C, Badiola JJ, Zaragoza P (2004): Prion protein gene polymorphisms in
healthy and scrapie-affected Spanish sheep. J Gen Virol 85, 2103-2110
Acutis PL, Sbaiz L, Verburg F, Riina MV, Ru G, Moda G, Caramelli M, Bossers A
(2004): Low frequency of the scrapie resistance-associated allele and presence of
lysine-171 allele of the prion protein gene in Italian Biellese ovine breed. J Gen Virol
85, 3165-3172
Amselgruber WM, Buttner M, Schlegel T, Schweiger M, Pfaff E (2005): The normal
cellular prion protein (PrP(c)) is strongly expressed in bovine endocrine pancreas.
Histochem Cell Biol 125, 441-448
Andreoletti O, Berthon P, Marc D, Sarradin P, Grosclaude J, van Keulen L, Schelcher
F, Elsen J-M, Lantier F (2000): Early accumulation of PrPSc in gut-associated
lymphoid and nervous tissues of susceptible sheep from a Romanov flock with natural
scrapie. J Gen Virol 81, 3115-3126
Andreoletti O, Lacroux C, Chabert A, Monnereau L, Tabouret G, Lantier F, Berthon P,
Eychenne F, Lafond-Benestad S, Elsen JM, Schelcher F (2002): PrP(Sc) accumulation
in placentas of ewes exposed to natural scrapie: influence of foetal PrP genotype and
effect on ewe-to-lamb transmission. J Gen Virol 83, 2607-2616
Barron RM, Baybutt H, Tuzi NL, McCormack J, King D, Moore RC, Melton DW,
Manson JC (2005): Polymorphisms at codons 108 and 189 in murine PrP play distinct
roles in the control of scrapie incubation time. J Gen Virol 86, 859-868
Belt PB, Muileman IH, Schreuder BE, Bos-de Ruijter J, Gielkens AL, Smits MA
(1995): Identification of five allelic variants of the sheep PrP gene and their association
with natural scrapie. J Gen Virol 76, 509-517

References 106
Bendheim PE, Brown HR, Rudelli RD, Scala LJ, Goller NL, Wen GY, Kascsak RJ,
Cashman NR, Bolton DC (1992): Nearly ubiquitous tissue distribution of the scrapie
agent precursor protein. Neurology 42, 149-156
Bessen RA, Kocisko DA, Raymond GJ, Nandan S, Lansbury PT, Caughey B (1995):
Non-genetic propagation of strain-specific properties of scrapie prion protein. Nature
375, 698-700
Bossers A, Schreuder BE, Muileman IH, Belt PB, Smits MA (1996): PrP genotype
contributes to determining survival times of sheep with natural scrapie. J Gen Virol 77,
2669-2673
Brandner S, Isenmann S, Raeber A, Fischer M, Sailer A, Kobayashi Y, Marinao S,
Weissmann C, Aguzzi A (1996): Normal host prion protein necessary for scrapie-
induced neurotoxicity. Nature 379, 339-343
Brandner S, Klein MA, Frigg R, Pekarik V, Parizek P, Raeber A, Glatzel M, Schwarz P,
Rulicke T, Weissmann C, Aguzzi A (2000): Neuroinvasion of prions: insights from
mouse models. Exp Physiol 85, 705-712
Brown DR, Clive C, Haswell SJ (2001): Antioxidant activity related to copper binding
of native prion protein. J. Neurochem 76, 69-76
Brown DR, Nicholas RS, Canevari L (2002): Lack of prion protein results in a neuronal
phenotype sensitive to stress. J Neurosci Res 67, 211-224
Brown DR, Qin K, Herms JW, Madlung A, Manson J, Strome R, Fraser PE, Kruck T,
von Bohlen A, Schulz-Schaeffer W, Giese A, Westaway D, Kretzschmar H (1997): The
cellular prion protein binds copper in vivo. Nature 390, 684-687
Bueler H, Aguzzi A, Sailer A, Greiner RA, Autenried P, Aguet M, Weissmann C
(1993): Mice devoid of PrP are resistant to scrapie. Cell 73, 1339-1347

References 107
Bueler H, Fischer M, Lang Y, Fluethmann H, Lipp H-P, DeArmond SJ, Prusiner SB,
Aguet M, Weissmann C (1992): Normal development and behavior of mice lacking the
neuronal cell-surface PrP protein. Nature 356, 577–582
Bueler H, Raeber A, Sailer A, Fischer M, Aguzzi A, Weissmann C (1994): High prion
and PrPSc levels but delayed onset of disease in scrapie-inoculated mice heterozygous
for a disrupted PrP gene. Mol Med 1, 19-30
Bulgin MS, Sorensen SJ, Matlock ME (2006): Association between incubation time and
genotype in sheep experimentally inoculated with scrapie-positive brain homogenate.
Am J Vet Res 67, 498-504
Buyukmihci N, Goehring-Harmon F, Marsh RF (1985): Retinal degeneration in
experimental scrapie after intraperitoneal or subcutaneous inoculation of hamsters. Exp
Neurol 88, 461-466
Castiglioni B, Comincini S, Drisaldi B, Motta T, Ferretti L (1998): Comparative
mapping of the prion gene (PRNP) locus in cattle, sheep and human with PCR-
generated probes. Mamm Genome 9, 853–855
Chiarini LB, Freitas AR, Zanata SM, Brentani RR, Martins VR, Linden R (2002):
Cellular prion protein transduces neuroprotective signals. EMBO J 21, 3317-3326
Clouscard C, Beaudry P, Elsen JM, Milan D, Dussaucy M, Bounneau C, Schelcher F,
Chatelain J, Launay JM, Laplanche JL (1995): Different allelic effects of the codons
136 and 171 of the prion protein gene in sheep with natural scrapie. J Gen Virol 76,
2097-2101
Colling SB, Collinge J, Jefferys JGR (1996): Hippocampal slices from prion protein
null mice: disrupted Ca(2+)-activated K+ currents. Neurosci Lett 209, 49–52
Cuille J, Chelle PL (1939): Experimental transmission of trembling to the goat. C R
Seances Acad Sci 1208, 1058-1060

References 108
DeArmond SJ, Prusiner SB (1996): Transgenetics and neuropathology of prion
diseases. In: Prusiner SB (ed.). Prions Prions Prions. Springer-Verlag Berlin Heidleberg,
Germany, 125-146
DeSilva U, Guo X, Kupfer DM, Fernando SC, Pillai AT, Najar FZ, So S, Fitch GQ, Roe
BA (2003): Allelic variants of ovine prion protein gene (PRNP) in Oklahoma sheep.
Cytogenet Genome Res 102. 89-94
Dickinson AG (1976): Scrapie in sheep and goats. Front Biol 44, 209-241
Dickinson AG, Meikle VM, Fraser H (1968): Identification of a gene which controls the
incubation period of some strains of scrapie agent in mice. J Comp Pathol 78, 293-299
Dickinson AG, Stamp JT (1969): Experimental scrapie in Cheviot and Suffolk sheep.
J Comp Pathol 79, 23-26
Ecroyd H, Sarradin P, Dacheux JL, Gatti JL (2004): Compartmentalization of prion
isoforms within the reproductive tract of the ram. Biol Reprod 71, 993-1001
Elsen JM, Amigues Y, Schelcher F, Ducrocq V, Andreoletti O, Eychenne F, Khang JV,
Poivey JP, Lantier F, Laplanche JL (1999): Genetic susceptibility and transmission
factors in scrapie: detailed analysis of an epidemic in a closed flock of Romanov. Arch
Virol 144, 431-445
Erhardt G, Brandt H, Breyhahn R, Fürst zu Solms-Hohensolms-Lich P R, Groneveld E,
Groschup M, Thiel, H-J, Weiss E (2002): Voraussetzungen und Möglichkeiten für die
Genotypisierung von Schafen auf Scrapie-Resistenz im Rahmen von Zuchtprogrammen.
Züchtungskunde 74, 6-31
Ersdal C, Ulvund MJ, Benestad SL, Tranulis MA (2003): Accumulation of pathogenic
prion protein (PrPSc) in nervous and lymphoid tissues of sheep with subclinical scrapie.
Vet Pathol 40, 164-174

References 109
Etkin LD, Balcells S (1985): Transformed Xenopus embryos as a transient expression
system to analyze gene expression at the midblastula transition. Dev Biol 108, 173-178
European Commission (2003): Report on the monitoring and testing of ruminants for
the presence of transmissible spongiform encephalopathy (TSE) in 2002.
(http://europa.eu.int/comm/food/food/biosafety/bse/annual_report_2002_en.pdf)
European Commission (2004): Report on the monitoring and testing of ruminants for
the presence of Transmissible Spongiform Encephalopathy (TSE) in the EU in 2003,
including the results of the survey of prion protein genotypes in sheep breeds.
(http://ec.europa.eu/food/food/biosafety/bse/annual_report_tse2003_en.pdf)
European Commission (2005): Report on the monitoring and testing of ruminants for
the presence of transmissible spongiform encephalopathy (TSE) in the EU in 2004.
(http://ec.europa.eu/food/food/biosafety/bse/annual_report_tse2004_en.pdf)
European Commission (2006): Report on the monitoring and testing of ruminants for
the presence of Transmissible Spongiform Encephalopathy (TSE) in the EU in 2005.
(http://ec.europa.eu/food/food/biosafety/bse/annual_report_tse2005_en.pdf)
Foote WC, Clark W, Maciulis A, Call JW, Hourrigan J, Evans RC, Marshall MR, de
Camp M (1993): Prevention of scrapie transmission in sheep, using embryo transfer.
Am J Vet Res 54, 1863-1868
Foster JD, Goldmann W, McKenzie C, Smith A, Parnham DW, Hunter N (2004):
Maternal transmission studies of BSE in sheep. J Gen Virol 85, 3159-3163
Foster JD, Hunter N, Williams A, Mylne MJ, McKelvey WA, Hope J, Fraser J, Bostock
C (1996): Observations on the transmission of scrapie in experiments using embryo
transfer. Vet Rec 138, 559-562

References 110
Fraser H (1976): The pathology of a natural and experimental scrapie. In: Kimberlin RH
(ed.). Slow Virus Diseases of Animals and Man. Amsterdam North Holland Publishing
Company, Amsterdam, The Netherlands, 267-305
Fraser H, Bruce ME, Chree A, McConnell I, Wells GA (1992): Transmission of bovine
spongiform encephalopathy and scrapie to mice. J Gen Virol 73, 1891-1897
Fraser H, Pearson GR, McConnell I, Bruce ME, Wyatt JM, Gruffydd-Jones TJ (1994):
Transmission of feline spongiform encephalopathy to mice. Vet Rec 134, 449
Fujisawa M, Kanai Y, Nam SY, Maeda S, Nakamuta N, Kano K, Kurohmaru M,
Hayashi Y (2004): Expression of Prnp mRNA (prion protein gene) in mouse
spermatogenic cells. J Reprod Dev 50, 565-570
Gibbs CJ Jr, Safar J, Ceroni M, Di Martino A, Clark WW, Hourrigan JL (1990):
Experimental transmission of scrapie to cattle. Lancet 335, 1275
Goldmann W, Hunter N, Benson G, Foster JD, Hope J (1991a): Different scrapie-
associated fibril proteins (PrP) are encoded by lines of sheep selected for different
alleles of the Sip gene. J Gen Virol 72, 2411-2417
Goldmann W, Hunter N, Martin T, Dawson M, Hope J (1991b): Different forms of the
bovine PrP gene have five or six copies of a short, G-C-rich element within the protein-
coding exon. J Gen Virol 72, 201-204
Goldmann W, Hunter N, Smith G, Foster J, Hope J (1994): PrP genotype and agent
effects in scrapie: change in allelic interaction with different isolates of agent in sheep, a
natural host of scrapie. J Gen Virol 75, 989-995
Gombojav A, Ishiguro N, Horiuchi M, Serjmyadag D, Byambaa B, Shinagawa M
(2003): Amino acid polymorphisms of PrP gene in Mongolian sheep. J Vet Med Sci 65,
75-81

References 111
Govaerts C, Wille H, Prusiner SB, Cohen FE (2004): Structure studies of prion proteins.
In: Prusiner SB (ed.). Prion biology and diseases. 2nd edition. Cold Spring Harbor
Laboratory Press, USA, 243-282
Griffith JS (1967): Self-replication and scrapie. Nature 215, 1043-1044
Hadlow WJ, Kennedy RC, Race RE (1982): Natural infection of Suffolk sheep with
scrapie virus. J Infect Dis 146, 657-664
Hadlow WJ, Kennedy RC, Race RE, Eklund CM (1980): Virologic and neurohistologic
findings in dairy goats affected with natural scrapie. Vet Pathol 17, 187-199
Hadlow WJ, Race RE, Kennedy RC, Eklund CM (1979): Natural infection of sheep
with scrapie virus. In: Prusiner SB and Hadlow WJ (eds.). Slow transmissible diseases
of the nervous system, vol 2. Academic Press, New York, 3–12
Halliday S, Houston F, Hunter N (2005): Expression of PrPC on cellular components of
sheep blood. J Gen Virol 86, 1571-1579
Han CX, Liu HX, Zhao DM (2006): The quantification of prion gene expression in
sheep using real-time RT-PCR. Virus Genes 33, 359-364
Harris DA (1999): Cellular biology of prion diseases. Clin Microbiol Rev 12, 429-444
Harris DA, Lele P, Snider WD (1993): Localization of the mRNA for a chicken prion
protein by in situ hybridization. Proc Natl Acad Sci U S A 90, 4309-4313
Harris DA, Peters PJ, Taraboulos A, Lingappa V, DeArmond SJ, Prusiner SB (2004):
Cell biology of Prions. In: Prusiner SB (ed.). Prion biology and Diseases. 2nd edition.
Cold Spring Harbor Laboratory Press, USA, 483-544

References 112
Herms JW, Kretzschmar HA, Titz S, Keller BU (1995): Patch-clamp analysis of
synaptic transmission to cerebellar Purkinje cells of prion protein knockout mice. Eur
J Neurosci 7, 2508–2512
Horiuchi M, Yamazaki N, Ikeda T, Ishiguro N, Shinagawa M (1995): A cellular form of
prion protein (PrPC) exists in many non-neuronal tissues of sheep. J Gen Virol 76,
2583-2587
Hunter N, Foster JD, Goldmann W, Stear MJ, Hope J, Bostock C (1996): Natural
scrapie in a closed flock of Cheviot sheep occurs only in specific PrP genotypes. Arch
Virol 141, 809-824
Hunter N, Goldmann W, Benson G, Foster JD, Hope J (1993): Swaledale sheep affected
by natural scrapie differ significantly in PrP genotype frequencies from healthy sheep
and those selected for reduced incidence of scrapie. J Gen Virol 74, 1025-1031
Hunter N, Goldmann W, Smith G, Hope J (1994): The association of a codon 136 PrP
gene variant with the occurrence of natural scrapie. Arch Virol 137, 171-177
Hunter N, Moore L, Hosie BD, Dingwall WS, Greig A (1997): Association between
natural scrapie and PrP genotype in a flock of Suffolk sheep in Scotland. Vet Rec 140,
59-63
Ikeda T, Horiuchi M, Ishiguro N, Muramatsu Y, Kai-Uwe GD, Shinagawa M (1995):
Amino acid polymorphisms of PrP with reference to onset of scrapie in Suffolk and
Corriedale sheep in Japan. J Gen Virol 76, 2577-2581
Ikeda K, Kawada N, Wang YQ, Kadoya H, Nakatani K, Sato M, Kaneda K (1998):
Expression of cellular prion protein in activated hepatic stellate cells. Am J Pathos 153,
1695-1700

References 113
Jeffrey M, McGovern G, Martin S, Goodsir CM, Brown KL (2000): Cellular and sub-
cellular localisation of PrP in the lymphoreticular system of mice and sheep. Arch Virol
Suppl, 23-38
Jeong BH, Lee KH, Kim NH, Jin JK, Kim JI, Carp RI, Kim YS (2005): Association of
sporadic Creutzfeldt-Jakob disease with homozygous genotypes at PRNP codons 129
and 219 in the Korean population. Neurogenetics 6, 229-232
Kimberlin RH, Walker CA (1989): The role of the spleen in the neuroinvasion of
scrapie in mice. Virus Res 12, 201-211
Klamt F, Dal-Pizzol F, Conte da Frota MLJR, Walz R, Andrades ME, da Silva EG,
Brentani RR, Izquierdo I, Fonseca Moreira JC (2001): Imbalance of antioxidant defense
in mice lacking cellular prion protein. Free Radic Biol Med 30, 1137-1144
Knittel T, Aurisch S, Neubauer K, Eichhorst S, Ramadori G (1996): Cell-type-specific
expression of neural cell adhesion molecule (N-CAM) in Ito cells of rat liver: up-
regulation during in vitro activation and in hepatic tissue repair. Am J Pathol 149, 449-
462
Kocisko DA, Lansbury PT, Caughey B (1996): Partial unfolding and refolding of
scrapie-associated prion protein: evidence for a critical 16-kDa C-terminal domain.
Biochemistry 35, 13434-13442
Kubosaki A, Ueno A, Matsumoto Y, Doi K, Saeki K, Onodera T (2000): Analysis of
prion protein mRNA by in situ hybridization in brain and placenta of sheep. Biochem
Biophys Res Commun 273, 890-893
Lan Z, Wang ZL, Liu Y, Zhang X (2006): Prion protein gene (PRNP) polymorphisms in
Xinjiang local sheep breeds in China. Arch Virol 151, 2095-2101

References 114
Laplanche JL, Chatelain J, Westaway D, Thomas S, Dussaucy M, Brugere-Picoux J,
Launay JM (1993): PrP polymorphisms associated with natural scrapie discovered by
denaturing gradient gel electrophoresis. Genomics 15, 30-37
Lasmezas CI, Comoy E, Hawkins S, Herzog C, Mouthon F, Konold T, Auvre F, Correia
E, Lescoutra-Etchegaray N, Sales N, Wells G, Brown P, Deslys JP (2005): Risk of oral
infection with bovine spongiform encephalopathy agent in primates. Lancet 365, 781-
783
Lasmezas CI, Deslys JP, Demaimay R, Adjou KT, Lamoury F, Dormont D, Robain O,
Ironside J, Hauw JJ (1996): BSE transmission to macaques. Nature 381, 743-744
Liang J, Pan YL, Ning XX, Sun LJ, Lan M, Hong L, Du JP, Liu N, Liu CJ, Qiao TD,
Fan DM (2006): Overexpression of PrPC and its antiapoptosis function in gastric
cancer. Tumour Biol 27, 84-91
Lledo PM, Tremblay P, Dearmond SJ, Prusiner SB, Nicoll RA (1996): Mice deficient
for prion protein exhibit normal neuronal excitability and synaptic transmission in the
hippocampus. Proc Natl Acad Sci U S A 93, 2403–2407
Mabbott NA, Brown KL, Manson J, Bruce ME (1997): T-lymphocyte activation and the
cellular form of the prion protein. Immunology 92, 161-165
Maciulis A, Hunter N, Wang S, Goldmann W, Hope J, Foote WC (1992):
Polymorphisms of a scrapie-associated fibril protein (PrP) gene and their association
with susceptibility to experimentally induced scrapie in Cheviot sheep in the United
States. Am J Vet Res 53, 1957-1960
Maignien T, Lasmezas CI, Beringue V, Dormont D, Deslys JP (1999): Pathogenesis of
the oral route of infection of mice with scrapie and bovine spongiform encephalopathy
agents. J Gen Virol 80, 3035-3042

References 115
Manolakou K, Beaton J, McConnell I, Farquar C, Manson J, Hastie ND, Bruce M,
Jackson IJ (2001): Genetic and environmental factors modify bovine spongiform
encephalopathy incubation period in mice. Proc Natl Acad Sci U S A 98, 7402-7407
Manson J, West JD, Thomson V, McBride P, Kaufman MH, Hope J (1992): The prion
protein gene: a role in mouse embryogenesis? Development 115, 117-122
McBride PA, Eikelenboom P, Kraal G, Fraser H, Bruce ME (1992): PrP protein is
associated with follicular dendritic cells of spleens and lymph nodes in uninfected and
scrapie-infected mice. J Pathol 168, 413-418
McLennan NF, Rennison KA, Bell JE, Ironside JW (2001): In situ hybridization
analysis of PrP mRNA in human CNS tissues. Neuropathol Appl Neurobiol 27, 373-383
Memili E, First NL (1999): Control of gene expression at the onset of bovine embryonic
development. Biol Reprod 61, 1198-1207
Merle U, Stremmel W, Gessner R (2006): Influence of homozygosity for methionine at
codon 129 of the human prion gene on the onset of neurological and hepatic symptoms
in Wilson disease. Arch Neurol 63, 982-985
Miele G, Alejo Blanco AR, Baybutt H, Horvat S, Manson J, Clinton M (2003):
Embryonic activation and developmental expression of the murine prion protein gene.
Gene Expr 11, 1-12
Mobley WC, Neve RL, Prusiner SB, McKinley MP (1988): Nerve growth factor
increases mRNA levels for the prion protein and the beta-amyloid protein precursor in
developing hamster brain. Proc Natl Acad Sci U S A 85, 9811-9815
Mohamed OA, Bustin M, Clarke HJ (2001): High-mobility group proteins 14 and 17
maintain the timing of early embryonic development in the mouse. Dev Biol 229, 237-
249

References 116
Moore RC, Melton DW (1997): Transgenic analysis of prion diseases. Mol Hum
Reprod 3, 529-544
Morel G, Cavalier A (2000): In situ hybridization in light microscopy. CRC Press, Boca
Raton, USA
Moudjou M, Frobert Y, Grassi J, La Bonnardiere C (2001): Cellular prion protein status
in sheep: tissue-specific biochemical signatures. J Gen Virol 82, 2017-2024
Nakamitsu S, Miyazawa T, Horiuchi M, Onoe S, Ohoba Y, Kitagawa H, Ishiguro N
(2006): Sequence variation of bovine prion protein gene in Japanese cattle (Holstein and
Japanese Black). J Vet Med Sci 68, 27-33
Narang H (1996): The nature of the scrapie agent: the virus theory. Proc Soc Exp Biol
Med 212, 208-224
Narang HK (2001): Lingering doubts about spongiform enceophalopathy and
Creutzfeld-Jakob disease. Exp Biol Med 226, 640-652
Niki T, de Bleser PJ, Xu G, von den Berg K, Wisse E, Geerts A (1996): Comparison of
glial fibrillary acidic protein and desmin staining in normal and CCl4-induced fibrotic
rat livers. Hepatology 23, 1538-1545
Ning ZY, Zhao DM, Yang JM, Cui YL, Meng LP, Wu CD, Liu HX (2005):
Quantification of prion gene expression in brain and peripheral organs of golden
hamster by real-time RT-PCR. Anim Biotechnol 16, 55-65
Nishida N, Katamine S, Shigematsu K, Nakatani A, Sakamoto N, Hasegawa S,
Nakaoke R, Atarashi R, Kataoka Y, Miyamoto T (1997): Prion protein is necessary for
latent learning and long-term memory retention. Cell Mol Neurobiol 17, 537-545

References 117
O'Doherty E, Healy A, Aherne M, Hanrahan JP, Weavers E, Doherty M, Roche JF,
Gunn M, Sweeney T (2002): Prion protein (PrP) gene polymorphisms associated with
natural scrapie cases and their flock-mates in Ireland. Res Vet Sci 73, 243-250
Okamoto M, Furuoka H, Horiuchi M, Noguchi T, Hagiwara K, Muramatsu Y,
Tomonaga K, Tsuji M, Ishihara C, Ikuta K, Taniyama H (2003): Experimental
transmission of abnormal prion protein (PrPsc) in the small intestinal epithelial cells of
neonatal mice. Vet Pathol 40, 723-727
Onodera T, Ikeda T, Muramatsu Y, Shinagawa M (1993): Isolation of scrapie agent
from the placenta of sheep with natural scrapie in Japan. Microbiol Immunol 37, 311-
316
O'Rourke KI, Holyoak GR, Clark WW, Mickelson JR, Wang S, Melco RP, Besser TE,
Foote WC (1997): PrP genotypes and experimental scrapie in orally inoculated Suffolk
sheep in the United States. J Gen Virol 78, 975-978
Pammer J, Weninger W, Tschachler E (1998): Human keratinocytes express cellular
prion-related protein in vitro and during inflammatory skin diseases. Am J Pathol 153,
1353-1358
Pan KM, Baldwin M, Nguyen J, Gasset M, Serban A, Groth D, Mehlhorn I, Huang Z,
Fletterick RJ, Cohen FE, Prusiner SB (1993): Conversion of alpha-helices into beta-
sheets features in the formation of the scrapie prion proteins. Proc Natl Acad Sci U S A
90, 10962-10966
Pattison IH, Hoare MN, Jebbett JN, Watson WA (1972): Spread of scrapie to sheep and
goats by oral dosing with foetal membranes from scrapie-affected sheep. Vet Rec 90,
465-468
Prusiner SB (1982): Novel proteinaceous infectious particles cause scrapie. Science
216, 136-144

References 118
Prusiner SB (1991): Molecular biology of prion diseases. Science 252, 1515-1522
Prusiner SB (1994): Biology and genetics of prion diseases. Annu Rev Microbiol 48,
655-686
Prusiner SB (1996): Human prion diseases and neurodegeneration. In: Prusiner SB
(ed.). Prions Prions Prions. Springer-Verlag Berlin Heidleberg, Germany, 1-17
Prusiner SB (2004): An introduction to prion biology and diseases. In: Prusiner SB
(ed.). Prion biology and diseases. 2nd edition. Cold Spring Harbor Laboratory Press,
USA, 1-88
Prusiner SB, Cochran SP, Alpers MP (1985): Transmission of scrapie in hamsters.
J Infect Dis 152, 971-978
Prusiner SB, Scott MR, DeArmond SJ, Carlson G (2004): Transmission and replication
of prions. In: Prusiner SB (ed.). Prion biology and diseases. 2nd edition. Cold Spring
Harbor Laboratory Press, USA, 187-242
Race R, Jenny A, Sutton D (1998): Scrapie infectivity and proteinase K-resistant prion
protein in sheep placenta, brain, spleen, and lymph node: implications for transmission
and antemortem diagnosis. J Infect Dis 178, 949-953
Renwick CC, Zlotnik I (1965): The transmission of scrapie to mice by intracerebral
inoculations of brain from an apparently normal lamb. Vet Rec 77, 984-985
Robert C, McGraw S, Massicotte L, Pravetoni M, Gandolfi F, Sirard MA (2002):
Quantification of housekeeping transcript levels during the development of bovine
preimplantation embryo. Bio Reprod 67, 1465-1472
Robinson MM, Hadlow WJ, Huff TP, Wells GA, Dawson M, Marsh RF, Gorham JR
(1994): Experimental infection of mink with bovine spongiform encephalopathy. J Gen
Virol 75, 2151-2155

References 119
Ryder SJ, Hawkins SA, Dawson M, Wells GA (2000): The neuropathology of
experimental bovine spongiform encephalopathy in the pig. J Comp Pathol 122, 131-
143
Sabuncu E, Paquet S, Chapuis J, Moudjou M, Lai TL, Grassi J, Baron U, Laude H,
Vilette D (2005): Prion proteins from susceptible and resistant sheep exhibit some
distinct cell biological features. Biochem Biophys Res Commun 337, 791-798
Sailer A, Bueler H, Fischer M, Aguzzi A, Weissmann C (1994): No propagation of
prions in mice devoid of PrP. Cell 77, 967-968
Sakaguchi S, Katamine S, Nishida N, Moriuchi R, Shigematsu K, Sugimoto T, Nakatani
A, Kataoka Y, Houtani T, Shirabe S, Okada H, Hasegawa S, Miyamoto T, Noda T
(1996): Loss of cerebellar Purkinje cells in aged mice homozygous for a disrupted PrP
gene. Nature 380, 528-531
Sakaguchi S, Katamine S, Shigematsu K, Nakatani A, Moriuchi R, Nishida N,
Kurokawa K, Nakaoke R, Sato H, Jishage K, Kuno J, Noda T, Miyamoto T (1995):
Accumulation of proteinase K-resistant prion protein (PrP) is restricted by the
expression level of normal PrP in mice inoculated with a mouse-adapted strain of the
Creutzfeldt-Jakob disease agent. J Virol 69, 7586-7592
Sander P, Hamann H, Pfeiffer I, Wemheuer W, Brenig B, Groschup MH, Ziegler U,
Distl O, Leeb T (2004): Analysis of sequence variability of the bovine prion protein
gene (PRNP) in German cattle breeds. Neurogenetics 5, 19-25
Scherbel C, Pichner R, Groschup MH, Mueller-Hellwig S, Scherer S, Dietrich R,
Maertlbauer E, Gareis M (2006): Degradation of scrapie associated prion protein
(PrP(Sc)) by the gastrointestinal microbiota of cattle.Vet Res 37, 695-703
Schlapfer J, Gallagher DS Jr, Burzlaff JD, Womack JE, Stelly DM, Taylor JF, Davis SK
(1998): Comparative mapping of bovine chromosome 13 by fluorescence in situ
hybridization. Anim Genet 29, 265-272

References 120
Schlapfer I, Saitbekova N, Gaillard C, Dolf G (1999): A new allelic variant in the
bovine prion protein gene (PRNP) coding region. Anim Genet 30, 386-387
Schreuder BE, van Keulen LJM, Vromans ME, Langeveld JPM, Smits MA (1998):
Tonsillar biopsy and PrPSc detection in the preclinical diagnosis of scrapie. Vet Rec
142, 564-568
Schultz RM (1993): Regulation of zygotic gene activation in the mouse. Bioessays 15,
531-538
Seabury CM, Derr JN (2003): Identification of a novel ovine PrP polymorphism and
scrapie-resistant genotypes for St. Croix White and a related composite breed.
Cytogenet Genome Res 102, 85-88
Shaked Y, Rosenmann H, Talmor G, Gabizon R (1999): A C-terminal-truncated PrP
isoform is present in mature sperm. J Biol Chem 274, 32153-32158
Shibuya S, Higuchi J, Shin RW, Tateishi J, Kitamoto T (1998): Codon 219 Lys allele of
PRNP is not found in sporadic Creutzfeldt-Jakob disease. Ann Neurol 43, 826-828
Spongiform Encephalopathy Advisory Committee (1995): Transmissible spongiform
encephalopathies: A Summary of Present Knowledge and Research. HMSO, London.
Stahl N, Borchelt DR, Prusiner SB (1990): Differential release of cellular and scrapie
prion proteins from cellular membranes by phosphatidylinositol-specific phospholipase
C. Biochemistry 29, 5405-5412
Stahl N, Baldwin MA, Teplow DB, Hood L, Gibson BW, Burlingame AL, Prusiner SB
(1993): Structural studies of the scrapie prion protein using mass spectrometry and
amino acid sequencing. Biochemistry 32, 1991-2002

References 121
Tanji K, Saeki K, Matsumoto Y, Takeda M, Hirasawa K, Doi K, Matsumoto Y,
Onodera T (1995): Analysis of PrPc mRNA by in situ hybridization in brain, placenta,
uterus and testis of rats. Intervirology 38, 309-315
Telford NA, Watson AJ, Schultz GA (1990): Transition from maternal to embryonic
control in early mammalian development: a comparison of several species. Mol Reprod
26, 90-100
Tesfaye D, Ponsuksili S, Wimmers K, Gilles M, Schellander K (2004): A comparative
expression analysis of gene transcripts in post-fertilization developmental stages of
bovine embryos produced in vitro or in vivo. Reprod Domest Anim 39, 396-404
Thielen M (2006): mRNA expression of the acute phase protein haptoglobin in blood
and milk somatic cells and cellular localisation within the mammary gland of dairy
cows. Dissertation, Institut für Tierwissenschaften, Universität Bonn
Thorgeirsdottir S, Georgsson G, Reynisson E, Sigurdarson S, Palsdottir A (2002):
Search for healthy carriers of scrapie: an assessment of subclinical infection of sheep in
an Icelandic scrapie flock by three diagnostic methods and correlation with PrP
genotypes. Arch Virol 147, 709-722
Thorgeirsdottir S, Sigurdarson S, Thorisson HM, Georgsson G, Palsdottir A (1999): PrP
gene polymorphism and natural scrapie in Icelandic sheep. J Gen Virol 80, 2527-2534
Tichopad A, Pfaffl MW, Didier A (2003): Tissue-specific expression pattern of bovine
prion gene: quantification using real-time RT-PCR. Mol Cell Probes 17, 5-10
Tobler I, Deboer T, Fischer M (1997): Sleep and sleep regulation in normal and prion
protein-deficient mice. J Neurosci 17, 1869-1879
Tobler I, Gaus SE, Deboer T, Achermann P, Fischer M, Rulicke T, Moser M, Oesch B,
McBride PA, Manson JC (1996): Altered circadian activity rhythms and sleep in mice
devoid of prion protein. Nature 380, 639–642

References 122
Tranulis MA (2002): Influence of the prion protein gene, Prnp, on scrapie susceptibility
in sheep. APMIS 110, 33-43
Tranulis MA, Osland A, Bratberg B, Ulvund MJ (1999): Prion protein gene
polymorphisms in sheep with natural scrapie and healthy controls in Norway. J Gen
Virol 80, 1073-1077
Tuo W, O'Rourke KI, Zhuang D, Cheevers WP, Spraker TR, Knowles DP (2002):
Pregnancy status and fetal prion genetics determine PrPSc accumulation in placentomes
of scrapie-infected sheep. Proc Natl Acad Sci U S A 99, 6310-6315
Tuo W, Zhuang D, Knowles DP, Cheevers WP, Sy MS, O'Rourke KI (2001): Prp-c and
Prp-Sc at the fetal-maternal interface. J Biol Chem 276, 18229-18234
Valadian I, Porter D (1977): Physical growth and development from conception to
maturity. 1st edition. Little, Brown and Company, Boston
van Keulen LJM, Schreuder BEC, Meloen RH, Mooij-Harkes G, Vromans MEW,
Langeveld JPM (1996): Immunohistochemical detection of prion protein in lymphoid
tissues of sheep with natural scrapie. J Clin Microbiol 34, 1228-1231
van Keulen LJM, Schreuder BEC, Vromans MEW, Langeveld JPM, Smits MA (2000):
Pathogenesis of natural scrapie in sheep. Arch Virol Suppl 16, 57-71
Vigneault C, McGraw S, Massicotte L, Sirard MA (2004): Transcription factor
expression patterns in bovine in vitro-derived embryos prior to maternal-zygotic
transition. Biol Reprod 70, 1701-1709
Wadsworth JD, Asante EA, Desbruslais M, Linehan JM, Joiner S, Gowland I, Welch J,
Stone L, Lloyd SE, Hill AF, Brandner S, Collinge J (2004): Human prion protein with
valine 129 prevents expression of variant CJD phenotype. Science 306, 1793-1796

References 123
Wang S, Cockett NE, Miller JM, Shay TL, Maciulis A, Sutton DL, Foote WC, Holyoak
GR, Evans RC, Bunc TD, Beever JE, Call JW, Taylor WD, Marshall MR (2002):
Polymorphic distribution of the ovine prion protein (PrP) gene in scrapie-infected sheep
flocks in which embryo transfer was used to circumvent the transmissions of scrapie.
Theriogenology 57, 1865-1875
Wang S, Foote WC, Suffon DL, Maciulis A, Miller JM, Evans RC, Holyak GR, Call
JW, Bunch TD, Taylor WD, Marshall MR (2001): Preventing experimental vertical
transmission of scrapie by embryo transfer. Theriogenology 56, 315-327
Weissmann C (1999): Molecular genetics of transmissible spongiform
encephalopathies. J Biol Chem 274, 3-6
Whittington MA, Sidle KC, Gowland I, Meads J, Hill AF, Palmer MS, Jefferys JG,
Collinge J (1995): Rescue of neurophysiological phenotype seen in PrP null mice by
transgene encoding human prion protein. Nat Genet 9, 197–201
Will RG, Ironside JW, Zeidler M, Cousens SN, Estibeiro K, Alperovitch A, Poser S,
Pocchiari M, Hofman A, Smith PG (1996): A new variant of Creutzfeldt-Jakob disease
in the UK. Lancet 347, 921-925
Wion D, Le Bert M, Brachet P (1988): Messenger RNAs of beta-amyloid precursor
protein and prion protein are regulated by nerve growth factor in PC12 cells. Int J Dev
Neurosci 6, 387-393
Wooding FBP, Flint APF (1994): Placentation. In: Lamming GE (ed.). Marshall's
physiology of reproduction, Volume III Part I. Chapman & Hall, London. 233-460
Wrathall AE (1997): Risks of transmitting scrapie and bovine spongiform
encephalopathy by semen and embryos. Rev Sci Tech 16, 240-264

References 124
Wrathall AE, Brown KF, Sayers AR, Wells GA, Simmons MM, Farrelly SS, Bellerby
P, Squirrell J, Spencer YI, Wells M, Stack MJ, Bastiman B, Pullar D, Scatcherd J,
Heasman L, Parker J, Hannam DA, Helliwell DW, Chree A, Fraser H (2002): Studies of
embryo transfer from cattle clinically affected by bovine spongiform encephalopathy
(BSE). Vet Rec 150, 365-378
Zhang J, Chen L, Zhang BY, Han J, Xiao XL, Tian HY, Li BL, Gao C, Gao JM, Zhou
XB, Ma GP, Liu Y, Xu CM, Dong XP (2004): Comparison study on clinical and
neuropathological characteristics of hamsters inoculated with scrapie strain 263K in
different challenging pathways. Biomed Environ Sci 17, 65-78

Appendix 125
9 Appendix
Appendix 1: Codon-amino acid abbreviations
Codon Full Name Abbreviation
(3 Letter)
Abbreviation
(1 Letter)
TTT Phenylalanine Phe F
TTC Phenylalanine Phe F
TTA Leucine Leu L
TTG Leucine Leu L
TCT Serine Ser S
TCC Serine Ser S
TCA Serine Ser S
TCG Serine Ser S
TAT Tyrosine Tyr Y
TAC Tyrosine Tyr Y
TAA Termination (ochre) Ter X
TAG Termination (amber) Ter X
TGT Cysteine Cys C
TGC Cysteine Cys C
TGA Termination (opal or umber) Ter X
TGG Tryptophan Trp W
CTT Leucine Leu L
CTC Leucine Leu L
CTA Leucine Leu L
CTG Leucine Leu L
CCT Proline Pro P
CCC Proline Pro P
CCA Proline Pro P
CCG Proline Pro P
CAT Histidine His H
CAC Histidine His H

Appendix 126
Appendix 1: Codon-amino acid abbreviations (continued)
Codon Full Name Abbreviation
(3 Letter)
Abbreviation
(1 Letter)
CAA Glutamine Gln Q
CAG Glutamine Gln Q
CGT Arginine Arg R
CGC Arginine Arg R
CGA Arginine Arg R
CGG Arginine Arg R
ATT Isoleucine Ile I
ATC Isoleucine Ile I
ATA Isoleucine Ile I
ATG Methionine Met M
ACT Threonine Thr T
ACC Threonine Thr T
ACA Threonine Thr T
ACG Threonine Thr T
AAT Asparagine Asn N
AAC Asparagine Asn N
AAA Lysine Lys K
AAG Lysine Lys K
AGT Serine Ser S
AGC Serine Ser S
AGA Arginine Arg R
AGG Arginine Arg R
GTT Valine Val V
GTC Valine Val V
GTA Valine Val V
GTG Valine Val V
GCT Alanine Ala A
GCC Alanine Ala A

Appendix 127
Appendix 1: Codon-amino acid abbreviations (continued)
Codon Full Name Abbreviation
(3 Letter)
Abbreviation
(1 Letter)
GCA Alanine Ala A
GCG Alanine Ala A
GAT Aspartate Asp D
GAC Aspartate Asp D
GAA Glutamate Glu E
GAG Glutamate Glu E
GGT Glycine Gly G
GGC Glycine Gly G
GGA Glycine Gly G
GGG Glycine Gly G
n/a Aspartate or Asparagine n/a B
n/a Glutamate or Glutamine n/a Z

Acknowledgements
During my PhD study, a lot of people have helped and encouraged me to finish my
course in various ways, which I would like to gratefully acknowledge.
My first and most earnest acknowledgment goes to my supervisor, Prof. Dr. Karl
Schellander, director of the Institute of Animal Science, Animal Breeding and
Husbandry group, University of Bonn. It was a great pleasure to me to conduct this
thesis under his supervision. I am very much grateful for his valuable advice, guidance
and endless encouragement during the past four years.
I am also thankful to my co-supervisor in Thailand, Prof. Dr. Therdchai Vearasilp,
Department of Animal Science, Faculty of Agriculture, Chiang Mai University,
Thailand, for his contribution for the realisation of this doctoral work.
My sincere gratitude goes to Prof. Dr. rer. nat. Brigitte Schmitz, Institute of Animal
Science, Biochemistry group, University of Bonn, for her willingness to be a co-
supervisor of this study and for her support of all stuffs used in western blot analysis.
I gratefully acknowledge also all members of her research group for their friendship,
especially Mr. Bernhard Gehrig for his valuable advices on the western blot analysis.
I am extremely thankful to PD. Dr. Klaus Wimmers and PD. Dr. Siriluck Wimmers
Ponsuksiri, for their unlimited help, sustainable advice and encouragement to realise
this doctoral work.
I am grateful to Dr. Dawit Tesfaye for his helpful guidance and assistance during my
study as well as linguistic aid and proof reading throughout the manuscript.
My special thanks go to Dr. Josef Griese, Mr. Markus Gilles, Dr. Michael Hölker, Miss
Franca Rings and all staffs at the Frankenforst experimental station of the University of
Bonn, for rearing and managing all animals used in my study.

Best regards to all members of Prof. Dr. Dr. agr. Helga Sauerwein, Institute of Animal
Science, Physiology and Hygiene group, University of Bonn. I would like to give my
special thanks to Dr. Maria Thielen and Dr. Dr. rer. nat. Manfred Mielenz for their
excellent advice and protocols of the in situ hybridisation analysis.
I’m very much thankful to Dr. Siriwadee Chomdej, Dr. Nares Trakooljul, Dr. Eduard
Murani and Mrs. Maria Muraniova for their scientific and technical advices in the
molecular genetics, which were essential for the completion of my work, and also all
Thai students and my fellow doctoral colleagues at the Institute of Animal Science, Dr.
Nguyen Thi Kim Khang, Dr. Elisabeth Jonas, Mr. Chirawath Phatsara, Dr. Korakot
Nganvongpanit, Dr. Nguyen Trong Ngu, Dr. Ganesh Kumar, Dr. Ali Kadanga and Dr.
Ashraf El-Sayed who made a good atmosphere with a lot of friendship and helpful
during my PhD study.
My special thanks go to the following people who read draft versions of the thesis: PD.
Dr. Klaus Wimmers, Dr. Dawit Tesfaye, Dr. Nguyen Trong Ngu and Mr. Melkaye
Gebreselassie, and to Dr. Elisabeth Jonas for her providing the German version of this
manuscript.
My deepest and genuine gratitude is extended to my parents and all members of my
family for their encouragement and inspiration in all times of my study.
Finally, I would like to express my gratitude to all those who gave me the possibility to
complete this thesis in one way or the other but are not mentioned here.

Curriculum vitae
Personal information:
Name: Patama Thumdee
Date of birth: July 31, 1973
Place of birth: Nakhon ratchasima, Thailand
Nationality: Thai
Contact information:
Address: The Faculty of Agriculture
43 Muh 6, Bangphra, Sriracha,
Chonburi, 20210 Thailand
Tel.: (+66) 0-3835-8137
Fax: (+66) 0-3834-1808-9
E-mail: [email protected]
Education:
June 1990 - May 1994 B.Sc. in Agriculture (Animal Science)
Department of Animal Science, Faculty of Agriculture,
Chiang Mai University, Thailand
June 1994 – May 2000 M.Sc. in Agriculture (Animal Science)
Department of Animal Science, Faculty of Agriculture,
Chiang Mai University, Thailand
March 2003 – 2007 Ph.D student at the Institute of Animal Science,
Animal Breeding and Husbandry Group,
University of Bonn, Germany
Work experience:
January 2001 - July 2001 Animal development Office, Chiang Mai, Thailand
August 2001 - Present Position: Lecturer
Department of Animal Science, Faculty of Agriculture,
Rajamangala University of Technology, Chonburi,
Thailand