
THE POTENTIAL IMPACT OF URBANISATION ON CLIMATE CHANGE: BRUNEI DARUSSALAM CASE STUDY
13
THE POTENTIAL IMPACT OF URBANISATION ON CLIMATE CHANGE: BRUNEI DARUSSALAM CASE STUDY Dr. Jose Edgardo L. Aban*, Dr. William Duane* and Mr. Gabriel Yit Vui Yong** *Senior Lecturer, Environmental Studies and Geography & Development Faculty of Arts and Social Sciences, Universiti Brunei Darussalam ** Lecturer, Environmental Studies and Geography & Development Faculty of Arts and Social Sciences, Universiti Brunei Darussalam Abstract Urbanisation and development over the past 3-4 decades have reduced the amount of pristine rainforest cover in Brunei Darussalam to less than 50% of the country’s land area. Low-density urban sprawl is most pronounced in the Brunei-Muara District, where commercial shop blocks, housing estates and infrastructure are built at rapid rates. By-products of this process include increasing number of decaying, dilapidated urban spots and bare areas (exposed rock and soil) created by abandoned or stalled projects, which quickly become bad lands. The drastic change in land cover is expected to have a significant impact on the local climatic regime as the heat and water absorption and distribution capacities of rainforest differ significantly from that of bare ground, landscaped green spaces, built features, and even secondary forest. While carbon dioxide emission has dominated the discourse on climate change, land cover/land use change is increasing being recognised as a major contributor to global climate change. This is particularly pronounced in developing regions, where the original land cover in the recent past was pristine natural vegetation. This paper aims to assess the potential impact of urbanisation in Brunei Darussalam on climate change by measuring the change in relative heat distribution pattern (as exemplified by urban heat islands) and vegetation indices, using multi-year satellite imagery, in particular, Landsat thermal and near-infrared bands. The remote sensing study is augmented by ground measurements of ambient heat profiles in selected land cover types, particularly in different categories of green spaces. It is hoped that the study will be beneficial to land use and urban planning and its management, particularly in the refinement and enforcement of green space requirements. 1. Introduction The urban heat island (UHI) refers to the phenomenon of higher atmospheric and surface temperatures occurring in urban areas than in the surrounding rural (highly vegetated or forested) areas due to urbanisation (Voogt & Oke, 2003). It is exemplified by a large expanse of non- evaporating impervious materials covering a majority of urban areas with a consequent increase in sensible heat flux at the expense of latent heat flux (Oke, 1982; Owen et al., 1998). UHIs develop when a large fraction of the natural land-cover in an area are replaced by built surfaces that trap incoming solar radiation during the day and then re-radiate it at night (Oke, 1982; Quattrochi et al., 2000). UHI effects are exacerbated by the anthropogenic heat generated by traffic, industry and domestic buildings, impacting the local climate through a city's compact mass of buildings that affect exchange of energy and levels of conductivity. The higher temperatures in urban heat islands increase air conditioning demands, raise pollution levels, and may modify precipitation patterns. In addition, increased electricity generation by power plants leads to higher emissions of sulfur dioxide, carbon monoxide, nitrous oxide and suspended particulates, as well as carbon dioxide, a greenhouse gas (GHG) known to contribute to global warming and climate change. As a result,
-
Upload
independent -
Category
Documents
-
view
3 -
download
0
Transcript of THE POTENTIAL IMPACT OF URBANISATION ON CLIMATE CHANGE: BRUNEI DARUSSALAM CASE STUDY

THE POTENTIAL IMPACT OF URBANISATION ON CLIMATE CHANGE:
BRUNEI DARUSSALAM CASE STUDY
Dr. Jose Edgardo L. Aban*, Dr. William Duane* and Mr. Gabriel Yit Vui Yong**
*Senior Lecturer, Environmental Studies and Geography & Development
Faculty of Arts and Social Sciences, Universiti Brunei Darussalam
** Lecturer, Environmental Studies and Geography & Development
Faculty of Arts and Social Sciences, Universiti Brunei Darussalam
Abstract
Urbanisation and development over the past 3-4 decades have reduced the amount of pristine
rainforest cover in Brunei Darussalam to less than 50% of the country’s land area. Low-density
urban sprawl is most pronounced in the Brunei-Muara District, where commercial shop blocks,
housing estates and infrastructure are built at rapid rates. By-products of this process include
increasing number of decaying, dilapidated urban spots and bare areas (exposed rock and soil)
created by abandoned or stalled projects, which quickly become bad lands. The drastic change in
land cover is expected to have a significant impact on the local climatic regime as the heat and
water absorption and distribution capacities of rainforest differ significantly from that of bare
ground, landscaped green spaces, built features, and even secondary forest. While carbon dioxide
emission has dominated the discourse on climate change, land cover/land use change is increasing
being recognised as a major contributor to global climate change. This is particularly pronounced
in developing regions, where the original land cover in the recent past was pristine natural
vegetation. This paper aims to assess the potential impact of urbanisation in Brunei Darussalam
on climate change by measuring the change in relative heat distribution pattern (as exemplified by
urban heat islands) and vegetation indices, using multi-year satellite imagery, in particular,
Landsat thermal and near-infrared bands. The remote sensing study is augmented by ground
measurements of ambient heat profiles in selected land cover types, particularly in different
categories of green spaces. It is hoped that the study will be beneficial to land use and urban
planning and its management, particularly in the refinement and enforcement of green space
requirements.
1. Introduction
The urban heat island (UHI) refers to the phenomenon of higher atmospheric and surface
temperatures occurring in urban areas than in the surrounding rural (highly vegetated or forested)
areas due to urbanisation (Voogt & Oke, 2003). It is exemplified by a large expanse of non-
evaporating impervious materials covering a majority of urban areas with a consequent increase
in sensible heat flux at the expense of latent heat flux (Oke, 1982; Owen et al., 1998). UHIs
develop when a large fraction of the natural land-cover in an area are replaced by built surfaces
that trap incoming solar radiation during the day and then re-radiate it at night (Oke, 1982;
Quattrochi et al., 2000).
UHI effects are exacerbated by the anthropogenic heat generated by traffic, industry and domestic
buildings, impacting the local climate through a city's compact mass of buildings that affect
exchange of energy and levels of conductivity. The higher temperatures in urban heat islands
increase air conditioning demands, raise pollution levels, and may modify precipitation patterns.
In addition, increased electricity generation by power plants leads to higher emissions of sulfur
dioxide, carbon monoxide, nitrous oxide and suspended particulates, as well as carbon dioxide, a
greenhouse gas (GHG) known to contribute to global warming and climate change. As a result,

the magnitude and pattern of UHI effects have been major concerns of many urban climatology
studies.
Heat islands can be characterized for different layers of the urban atmosphere and for various
surfaces and divided into three categories: canopy layer heat island (CLHI), boundary layer heat
island (BLHI), and surface urban heat island (SUHI). The urban canopy layer extends
upwards from the surface to approximately mean building height, whereas the urban boundary
layer is located above the canopy layer (Voogt & Oke, 2003). The CLHI and the BLHI are
atmospheric heat islands since they denote a warming of the urban atmosphere, whereas the
SUHI refers to the relative warmth of urban surfaces compared to surrounding rural areas. It is
known that atmospheric UHIs are larger at night while surface UHIs are larger during the day
(Roth et al, 1989). Surface UHI is typically characterized as land surface temperature (LST)
through the use of airborne or satellite thermal infrared remote sensing, which provides a
synoptic and uniform means of studying SUHI effects at regional scales. Satellite-measured
LST has been utilized in various heat-balance, climate modeling, and global-change studies
since it is determined by the effective radiating temperature of the Earth's surface, which
controls surface heat and water exchange with the atmosphere. Voogt and Oke (2003) suggested
three major applications of thermal remote sensing to the study of urban climates. Two of them
focus on examining relations either between spatial structure of urban thermal patterns and urban
surface characteristics or between atmospheric and surface heat islands; the third is centered
on studying urban surface energy balances by coupling urban climate models with remotely
sensed data. This study addresses the first application area.
A number of thermal remote sensing studies have utilized the normalized difference vegetation
index (NDVI) as the major indicator of urban climate. For example, Gallo et al. (1993) assessed
the influence of the urban environment on observed minimum air temperatures by analyzing
urban–rural differences for NDVI and surface temperatures. Lo et al. (1997) studied changes in
the thermal responses of urban land cover types between day and night and examined the relation
between land cover radiance and vegetation amount using NDVI derived from Advanced Thermal
and Land Applications Sensor (ATLAS) data. Gallo and Owen (1999) evaluated seasonal trends
in temperature and NDVI and found that differences in NDVI and satellite-based surface
temperature accounted for 40% of the variation in urban–rural temperature differences. The
NDVI–temperature relationship had also been utilized in various studies to derive or evaluate
two variables — fractional vegetation cover and surface soil water content for climate
modeling (Carlson et al., 1995a; Gillies & Carlson, 1995; Gillies et al., 1997; Goward et al.,
2002).
Higher NDVI values typically indicate a larger fraction of vegetation in a satellite pixel. The
amount of vegetation determines LST by the latent heat flux from the surface to atmosphere via
evapotranspiration. Lower LSTs usually are found in areas with high NDVI. This negative
correlation between NDVI and LST is valuable for urban climate studies.
The current study comes in no better time, when Brunei-Muara is in a dynamic phase of
urbanisation, characterized by conversion of once pristine forest lands into residential, industrial
and shopping complexes.
2. Methods
2.1. Study area
Brunei-Muara is the northern-most district (daerah in Malay) in Brunei; it is the smallest of
Brunei's four districts in term of area but by far the most populous, with over half the country's
population. It is the most important and bustling district because the capital, Bandar Seri Begawan
which is also the state capital is the seat of the government ministries and departmental

headquarters as well as the center of business activities. Other major town in the Brunei-Muara
district include Muara town. The Brunei-Muara district contains the largest and deepest port in
Brunei, the Muara Port.
The Brunei-Muara district is located in the north-east, bordering the South China Sea to the north,
Brunei Bay to the east, Limbang, Sarawak (Malaysia) to the south and the Bruneian district of
Tutong to the west. The diversity of land cover types and uses, combined with the growing
urbanization makes it an ideal area to analyze SUHI effects.
2.2. Image pre-processing
Landsat data from four different seasons were obtained. One Landsat-5 Thematic Mapper (TM)
images, acquired on 2 October 1999, and two Landsat-7 Enhanced Thematic Mapper Plus
(ETM+) images, acquired on 19 May 2002 and 28 August 2007 were analyzed using ERDAS
Imagine and Multispec softwares.
The Landsat images were acquired already orthorectified to the UTM projection system (ellipsoid
WGS 84, zone 50). The original digital numbers (DN) of the TM and ETM+ images were
converted to exo-atmposhperic reflectance based on the methods provided by Chander and
Markham (2003) and the Landsat 7 Science Data Users Handbook (2006).
Table 1. Ground sensor-based records of temperature observations compared with Landsat ETM+ measured LST
(degrees Celsius).
LATITUDE LONGITUDE
AVERAGED
FIELD GROUND
& AIR
TEMPERATURES
(degrees Celsius)
SATELLITE-
DERIVED LST
(degrees Celsius)
DIFFERENCE
(FIELD
MINUS
SATELLITE)
4 58 08.61 N 114 53 16.56 E 29.77 26.4780 -3.2951
4 58 37.70 N 114 53 46.65 E 29.21 28.7500 -0.4615
4 57 40.05 N 114 54 39.59 E 29.58 30.0000 0.4205
4 45 46.10 N 114 48 42.9 E 30.70 25.0000 -5.6983
4 58 02.34 N 114 52 24.81 E 27.50 25.9100 -1.5898
4 57 06.05 N 114 53 49.90 E 26.09 25.6250 -0.4651
4 57 07.22 N 114 53 48.48 E 27.09 27.6060 0.5126
4 55 28.32 N
114 55 40.28 E 29.94 33.6450 3.7038
4 55 28.32 N
114 55 41.25 E 29.80 31.4810 1.6794
4 55 28.30 N
114 55 35.41 E 29.80 29.2810 -0.5183
4 55 16.61 N
114 55 43.24 E 29.24 28.7250 -0.5100
4 55 26.39 N
114 55 49.05 E 29.74 31.4810 1.7365
4 55 35.17 N
114 55 48.05 E 29.71 29.8340 0.1228

Figure 1. LST derived from LANDSAT ETM+ for three different dates.
02 October 1999
19 May 2002
28 August 2007

2.3. Calculation of LST and NDVI
The Landsat TM and ETM+ thermal infrared band (10.4–12.5 μm) data were utilized to derive
the LST. The Landsat Program is a series of Earth-observing satellite missions jointly managed
by National Aeronautics and Space Administration (NASA) and the U.S. Geological Survey.
Since 1972, Landsat satellites have collected information about Earth from space.
At satellite temperature can be determined for TM thermal data in a two-step process (Markham
and Barker, 1987). The spectral radiance, Lw, of each digital number (DN) value is calculated
using Equation (1).
The following equation was used to convert the digital numbers (DN) to space reaching radiance
or top-of-atmospheric (TOA) radiance measured by the instrument (Chander & Markham, 2003):
Where:
QCAL = Calibrated and scaled radiance in DN units
LMINw = Spectral radiance at QCAL = 0
LMAXw = Spectral radiance at QCAL = QCALMAX
QCALMAX = Range of rescaled radiance in DN
LW = Spectral radiance
QCAL, LMINW, LMAXW and QCALMAX are obtained directly from the header information for
each of the satellite scenes for each LANDSAT vehicle mission.
2.4. Effective at-satellite Temperature
The Effective at-satellite temperature, T, are calculated using Equation (2)
Where
T = Effective at-satellite temperature in Kelvin, oK
K2 = Calibration constant 2 in oK
K1 = Calibration constant 1 in m W cm -2
Um-1
LW = Spectral radiance in mWcm-2
ster-1 from Equation (2)
K2 and K1 are obtained directly from the header file for each Landsat vehicle mission.
Satellite-derived surface temperatures may possess errors of 2o Kelvin because of systematic
error in sensor gain. Because this study is interested only in the relative temperature differences
between trees/forests and MUHIs, this error was not corrected.
Once calibrated, surface temperatures can be determined at any Landsat pixel location.
Temperatures were grouped into appropriate ranges and color-coded to generate a thermal pattern
distribution map of Brunei-Muara (Fig. 3).

Figure 2. NDVI derived from LANDSAT ETM+ for three different dates.
02 October 1999
19 May 2002
28 August 2007

2.4 Normalized difference vegetation index (NDVI)
Normalized difference vegetation index maps were derived for all the four images as follows:
NDVI = R NIR - Rred
__________ (3)
R NIR + Rred
Where R NIR and Rred are the spectral reflectances in the TM and ETM+ red and near-infrared
bands. This NDVI equation produces values in the range of -1 to 1, where positive values
indicate vegetated areas and negative values signify non-vegetated surface features such as water,
barren soils and clouds.
3. Results and discussions
3.1 LST and NDVI patterns and statistics
The digital remote sensing method provides not only a measure if the magnitude of surface
temperatures of the entire Brunei-Muara area, but also the spatial extent of the surface heat
island effects (Fig. 1).
There are a number of noticeable hotspots (34-35 oC) in the 2007 image (Fig.3 and 4). Of
particular interest is the prominent hotspot areas and structure in the Brunei International
Airport complex. A closer look at these hotspots reveal built up structures which are,
intrinsically highly impervious (to water) such as the aircraft hangars, asphalt airport runway
and parking lots and roads. Other relatively hotter areas in the 2007 images are mostly in large
newly developed (or under development) residential complexes such as in Perumahan Rimba to
the left of the airport, newly-opened and bare residential lots in the Meragang area in the north,
as well, as in the conglomeration of concrete buildings in the government complex, Gadong
shopping complex, and the warehouse districts in the port of Muara. Conversely the
abovementioned impervious areas, correspond to areas of low NDVI values in the image.
Traditionally forested (and high in NDVI values) areas such as the Berakas Forest reserve,
Kampong Subok and and Kampong Kiangge remain to be consistently cool areas in all three
satellite images.
A detailed 3-dimensional LST image study is shown in Fig. 4, for two important economic posts
in Brunei-Muara district, which are the Brunei International Airport and the Muara Port.
3. 2 LST relationships to NDVI
Sample image scatter plots between LST and NDVI, and devoid of water pixels and clouds were
chosen in the three Landsat images, representing the years 1999, 2002 and 2007. In order to
facilitate the comparison and in order to avoid data outliers that come from image pixels which
were intrinsically devoid of vegetation (and thus low in NDVI values).
In the urbanized areas of the images, LST measurements typically represent the radiometric
temperatures of vegetated and non-vegetated surfaces, mainly impervious surfaces. Given the
pixel size 60 meters in Landsat +ETM and thermal imagery, the resultant temperatures depend
on the relative proportions of these surfaces. The variations in the pixel temperatures may be

Figure 3. Sample color-coded LST Map (2007) of Brunei-Muara

mostly related to vegetation surface amounts and characteristics, since non-vegetated (low
NDVI) surfaces vary more in temperature than sunlit vegetated surfaces.
This explains the linear pattern between LST and NDVI in the scatter plots shown in Fig. 5 . In
all three satellite acquisition dates, the inverse linear relationship between NDVI and LST is
very apparent and highly significant and correlated (r2 ~ 0.7++).
Air and ground temperature data from sensors deployed in different parts of Banda Seri Begawan
were compared to satellite LST estimates (Table 1). For this study, 13 climatologic
observations were made for the period between 7-30 September 2011. The satellite-based
LST are generally higher than the air temperatures, which is reasonable since daytime surface
temperatures of dry ground are generally warmer than that of air temperature. It is also known
that precise equivalence between LST and the near ground air temperature is difficult to obtain
and to estimate the surface energy fluxes over complex terrain is beyond satellite thermal sensing
data’s capability as the surface energy budget is too complicated (Carlson et al., 1995b). To
correct the differences between satellite measured LST and the near-ground air temperature, not
only concurrent in-situ ground data such as surface and soil temperatures, but also accurate
models that relate the surface and air temperatures are required. Hence, further research along this
line is being recommended to be pursued in the future.
4. Adaptation measures
The study, based on the findings, is proposing some design strategies for the mitigation of
effects of urban heat i sland phenomenon in Brunei-Muara . Among which is the use of light-
colored materials for roofing of downtown locations as well as improving the reflectivity of
pavement within the urban centers will hope to reduce UHI effects.

Figure 4. Hotspot areas (in red) identified in this 28 August 2007 Landsat 3D-rendered thermal image (left), and
compared with true color real image (right) from Google Earth, showing conglomeration of impervious structures (i.e.
runway, hangar) in the Brunei International airport (top) and Muara port (warehouse district, bottom).
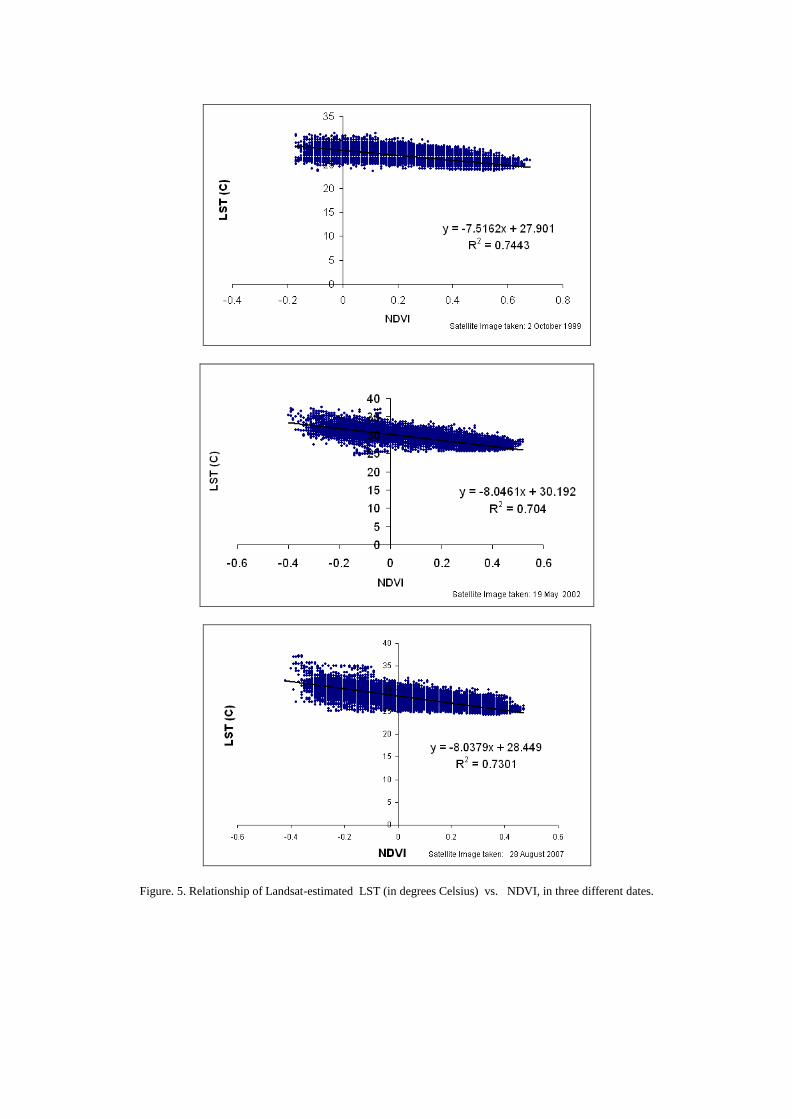
Figure. 5. Relationship of Landsat-estimated LST (in degrees Celsius) vs. NDVI, in three different dates.

5. Conclusions
The methodology in this paper demonstrates the usefulness of Landsat data for mapping urban
heat islands (UHIs) in Brunei-Muara district. For this study, UHIs are radiative in nature, with
the highest LSTs on impervious structures mostly in commercial and conglomeration of such
structures, followed by residential areas and cooled outwards toward tree canopy and forest
zones. These imply that urban development contributes to the overall increase in LST by
replacing the natural environment, particularly forests with non-evaporating, non-transpiring
surfaces.
The study also investigated the relationships between the LST, and NDVI in the Brunei-Muara
district. Results indicate that NDVI is an accurate indicator of SUHI effects with strong linear
relationships between LST and NDVI for all the three images (years). The linear relationship
model between the LST and vegetated (NDVI) areas accounts for the variation in land surface
temperature dynamics. This implies that NDVI can be used as a complementary metric for
analyzing LST quantitatively for surface urban heat island studies.
This study further demonstrates that temperature and land use information can be directly
derived from remotely sensed data, which provides a powerful way to monitor urban
environment and human activities. This can effectively replace the traditional analogue
system of urban studies particularly as the study relate to the physical aspects of a city
environment. This information enhances understanding of urban environment and can be further
used to improve environmental quality and urban planning.
Acknowledgments
The authors wish to thank the technical assistance of the following individuals: Nursadrina Binti
Haji Mahadi, Amnijah Binti Haji Salleh, Safwanah Binti Haji Abu Hassan, Sia Ai Ling, Nor
Abidah Binti Duraman, Siti Nur Afifah Baidzura Binti Haji Mat Yassin, A'in Rasyidatul Akmal
Binti Haji Kassim.
References
Carlson, T. N., Gillies, R. R., & Schmugge, T. J. (1995a). An interpretation of methodologies
for indirect measurement of soil water content and fractional vegetation cover.
Agricultural and Forest Meteorology, 77, 191−205.
Chander, G., & Markham, B. (2003). Revised Landsat-5 TM radiometric calibration procedures
and postcalibration dynamic ranges. IEEE Transactions on Geoscience and Remote Sensing,
41(11), 2674−2677.
Gallo, K. P., McNab, A. L., Karl, T. R., Brown, J. F., Hood, J. J., & Tarpley, J. D. (1993). The use
of NOAA AVHRR data for assessment of the urban heat island effect. Journal of Applied
Meteorology, 32(5), 899−908.
Gallo, K. P., & Owen, T. W. (1999). Satellite based adjustments for the urban heat island
temperature bias. Journal of Applied Meteorology, 38, 806−813.
Gillies, R. R., & Carlson, T. N. (1995). Thermal remote sensing of surface soil water content
with partial vegetation cover for incorporation into climate models. Journal of Applied
Meteorology, 34, 745−756.

Goward, S. N., Xue, Y., & Czajkowski, K. P. (2002). Evaluating land surface moisture conditions
from the remotely sensed temperature/vegetation index measurements: an exploration with the
simplified simple biosphere model. Remote Sensing of Environment, 79, 225−242.
Landsat 7 Science Data Users Handbook, 2006. URL: http://ltpwww.gsfc.nasa.
gov/IAS/handbook/handbook_toc.html, National Aeronautics and Space Administration
(last date accessed 10 August 2006).
Lo, C. P., Quattrochi, D. A., & Luvall, J. C. (1997). Application of high- resolution thermal
infrared remote sensing and GIS to assess the urban heat island effect. International Journal of
Remote Sensing, 18, 287−304.
Markham, B. L., and Barker, J.L., 1987, Landsat MSS and TM post-calibration dynamic ranges,
exoatmospheric reflectances and at-satellite temperatures: Lab. Terrestrial Physics,
NASA/Goddard Space Flight Center, Greenbelt, Maryland. 5p.
Oke, T. R. (1982). The energetic basis of the urban heat island. Quarterly Journal of the
Royal Meteorological Society, 108, 1−24.
Owen, T. W., Carlson, T. N., & Gillies, R. R. (1998). An assessment of satellite remotely-sensed
land cover parameters in quantitatively describing the climatic effect of urbanization. International
Journal of Remote Sensing, 19, 1663−1681.
Quattrochi D, Rickman D, Estes M, Caymon C, Howell B, Luvall J (2000). A Decision
Support information System for Urban Landscape Management Using Thermal Infrared data.
Photogrammetric Engineering and Remote sensing. 66(10): 1195 – 1207.
Roth, M., Oke, T. R., & Emery, W. J. (1989). Satellite-derived urban heat islands from
three coastal cities and the utilization of such data in urban climatology. International
Journal of Remote Sensing, 10, 1699−1720.
Voogt, J. A., & Oke, T. R. (2003). Thermal remote sensing of urban areas. Remote Sensing
of Environment, 86, 370−384.