The Potential and Limitations of a Clustering Approach for the Improved Efficiency of Multiple...
14
This article has been accepted for inclusion in a future issue of this journal. Content is final as presented, with the exception of pagination. IEEE TRANSACTIONS ON GEOSCIENCE AND REMOTE SENSING 1 The Potential and Limitations of a Clustering Approach for the Improved Efficiency of Multiple Endmember Spectral Mixture Analysis in Plant Production System Monitoring Laurent Tits, Ben Somers, and Pol Coppin Abstract—Due to the subpixel contribution of background soils and shadows, hyperspectral image interpretation in agricultural management is often constrained. In this paper, the potential of multiple endmember spectral mixture analysis (MESMA) to si- multaneously extract the subpixel cover fraction and pure spectral signature of the crop component from a mixed hyperspectral signal is evaluated. Radiative transfer models are used to build lookup tables (LUTs) for both the crop and the soil component, but the extensiveness of the LUTs will decrease the efficiency and operational implementation of MESMA. A clustering procedure is therefore presented, allowing a more efficient use of the LUTs in the MESMA model. The performance of MESMA, using clustered and nonclustered LUTs, to extract the cover fraction and the spec- tral signature of plant canopies was evaluated using 200 simulated mixtures generated from in situ measured hyperspectral data of soil and citrus canopies. Clustering of the LUT resulted in a more efficient and accurate estimation of the pure subpixel vegetation signal (rmse =0.097 stabilizing at 40 iterations) compared to a nonclustered LUT (rmse =0.11 stabilizing at 200 iterations). The subpixel cover fraction estimations, on the other hand, stabi- lize for both methods around 100 iterations, with an rmse of 0.15 for both approaches. The clustering of the LUT will thus increase both the efficiency and the accuracy of MESMA for estimating the spectral signature of crops while, on average, maintaining the accuracy for the cover fraction estimates. This will enable a more accurate extraction of plant production parameters, which opens up new opportunities regarding precision farming. Index Terms—Clustering, hyperspectral, lookup tables (LUTs), spectral mixture analysis (SMA). ACRONYMS AU Area unmixing. EMs Endmembers. FWHM Full-width at half-maximum. LAI Leaf area index. Manuscript received April 26, 2011; revised August 26, 2011; accepted October 9, 2011. This work was supported by the Institute for the Promotion of Innovation through Science and Technology in Flanders (IWT-Vlaanderen). The work of B. Somers was supported by the Belgian Science Policy Office in the frame of the Stereo II programme—Project VEGEMIX (SR/67/146). L. Tits and P. Coppin are with the Division Measure, Model and Manage Bio-responses, Department of Biosystems, Katholieke Universiteit Leuven, 3001 Leuven, Belgium (e-mail: [email protected]; pol.coppin@ biw.kuleuven.be). B. Somers is with the Centre for Remote Sensing and Earth Observation Processes (TAP), Flemish Institute for Technological Research (VITO), 2400 Mol, Belgium (e-mail: [email protected]). Digital Object Identifier 10.1109/TGRS.2011.2173696 LS Least squares. LSMA Linear spectral mixture analysis. LUT Lookup table. MCRM Markov-chain canopy reflectance model. MESMA Multiple endmember spectral mixture analysis. NIR Near infrared region of the spectrum. rmse Root-mean-square error. rrmse Relative rmse. RTM Radiative transfer model. SAM Spectral angle mapper. SMA Spectral mixture analysis. SMC Soil moisture content. SSE Sum of squared error. SU Signal unmixing. SWIR Short wave infrared region of the spectrum. VIS Visible region of the spectrum. I. I NTRODUCTION I N CAPITAL intensive plant production systems, the continuous monitoring of the production processes is essential. The production is influenced by a number of biotic and abiotic factors, and detailed information on the plant status can target amounts of fertilizer, water, and chemicals to optimize crop production in an environmentally and economically friendly way [1]. Three important parameters widely used to evaluate the plant status are LAI, leaf chlorophyll, and water content (e.g., see [2] and [3]). The in situ measurements of these three parameters are relatively time consuming and often require destructive meth- ods [4]. Therefore, only a sample-based approach is possible, with a limited number of repetitions. An alternative for the site- specific monitoring of crop status is remote sensing. The high spatial and temporal resolution of satellite imagery allows for the temporal global monitoring of a crop’s health status and thus creates opportunities for precision farming [2]. Since biotic and abiotic stresses cause changes in the struc- ture and biochemical composition of the vegetation, the spec- tral signal changes accordingly. The spectral information is however rarely directly used to measure the response to bio- physical and biochemical variables. Many data manipulations have been proposed to enhance subtle spectral features and to reduce undesired effects caused by variations in sun and 0196-2892/$26.00 © 2011 IEEE
Transcript of The Potential and Limitations of a Clustering Approach for the Improved Efficiency of Multiple...
This article has been accepted for inclusion in a future issue of this journal. Content is final as presented, with the exception of pagination.
IEEE TRANSACTIONS ON GEOSCIENCE AND REMOTE SENSING 1
The Potential and Limitations of a ClusteringApproach for the Improved Efficiency of Multiple
Endmember Spectral Mixture Analysis inPlant Production System Monitoring
Laurent Tits, Ben Somers, and Pol Coppin
Abstract—Due to the subpixel contribution of background soilsand shadows, hyperspectral image interpretation in agriculturalmanagement is often constrained. In this paper, the potential ofmultiple endmember spectral mixture analysis (MESMA) to si-multaneously extract the subpixel cover fraction and pure spectralsignature of the crop component from a mixed hyperspectralsignal is evaluated. Radiative transfer models are used to buildlookup tables (LUTs) for both the crop and the soil component,but the extensiveness of the LUTs will decrease the efficiency andoperational implementation of MESMA. A clustering procedure istherefore presented, allowing a more efficient use of the LUTs inthe MESMA model. The performance of MESMA, using clusteredand nonclustered LUTs, to extract the cover fraction and the spec-tral signature of plant canopies was evaluated using 200 simulatedmixtures generated from in situ measured hyperspectral data ofsoil and citrus canopies. Clustering of the LUT resulted in a moreefficient and accurate estimation of the pure subpixel vegetationsignal (rmse = 0.097 stabilizing at 40 iterations) compared toa nonclustered LUT (rmse = 0.11 stabilizing at 200 iterations).The subpixel cover fraction estimations, on the other hand, stabi-lize for both methods around 100 iterations, with an rmse of 0.15for both approaches. The clustering of the LUT will thus increaseboth the efficiency and the accuracy of MESMA for estimatingthe spectral signature of crops while, on average, maintaining theaccuracy for the cover fraction estimates. This will enable a moreaccurate extraction of plant production parameters, which opensup new opportunities regarding precision farming.
Index Terms—Clustering, hyperspectral, lookup tables (LUTs),spectral mixture analysis (SMA).
ACRONYMS
AU Area unmixing.EMs Endmembers.FWHM Full-width at half-maximum.LAI Leaf area index.
Manuscript received April 26, 2011; revised August 26, 2011; acceptedOctober 9, 2011. This work was supported by the Institute for the Promotionof Innovation through Science and Technology in Flanders (IWT-Vlaanderen).The work of B. Somers was supported by the Belgian Science Policy Office inthe frame of the Stereo II programme—Project VEGEMIX (SR/67/146).
L. Tits and P. Coppin are with the Division Measure, Model and ManageBio-responses, Department of Biosystems, Katholieke Universiteit Leuven,3001 Leuven, Belgium (e-mail: [email protected]; [email protected]).
B. Somers is with the Centre for Remote Sensing and Earth ObservationProcesses (TAP), Flemish Institute for Technological Research (VITO), 2400Mol, Belgium (e-mail: [email protected]).
Digital Object Identifier 10.1109/TGRS.2011.2173696
LS Least squares.LSMA Linear spectral mixture analysis.LUT Lookup table.MCRM Markov-chain canopy reflectance model.MESMA Multiple endmember spectral mixture analysis.NIR Near infrared region of the spectrum.rmse Root-mean-square error.rrmse Relative rmse.RTM Radiative transfer model.SAM Spectral angle mapper.SMA Spectral mixture analysis.SMC Soil moisture content.SSE Sum of squared error.SU Signal unmixing.SWIR Short wave infrared region of the spectrum.VIS Visible region of the spectrum.
I. INTRODUCTION
IN CAPITAL intensive plant production systems, thecontinuous monitoring of the production processes is
essential. The production is influenced by a number of bioticand abiotic factors, and detailed information on the plantstatus can target amounts of fertilizer, water, and chemicalsto optimize crop production in an environmentally andeconomically friendly way [1].
Three important parameters widely used to evaluate the plantstatus are LAI, leaf chlorophyll, and water content (e.g., see [2]and [3]). The in situ measurements of these three parameters arerelatively time consuming and often require destructive meth-ods [4]. Therefore, only a sample-based approach is possible,with a limited number of repetitions. An alternative for the site-specific monitoring of crop status is remote sensing. The highspatial and temporal resolution of satellite imagery allows forthe temporal global monitoring of a crop’s health status andthus creates opportunities for precision farming [2].
Since biotic and abiotic stresses cause changes in the struc-ture and biochemical composition of the vegetation, the spec-tral signal changes accordingly. The spectral information ishowever rarely directly used to measure the response to bio-physical and biochemical variables. Many data manipulationshave been proposed to enhance subtle spectral features andto reduce undesired effects caused by variations in sun and
0196-2892/$26.00 © 2011 IEEE
This article has been accepted for inclusion in a future issue of this journal. Content is final as presented, with the exception of pagination.
2 IEEE TRANSACTIONS ON GEOSCIENCE AND REMOTE SENSING
view geometry, atmospheric composition, and other leaf orcanopy properties [1]. Standard manipulations, often used inimaging spectroscopy, involve normalization [5], logarithmictransformation [6], continuum removal [7], [8], the calcula-tion of first- or second-order derivatives [9], and vegetationindexes (VIs) [1], [2]. Although the uses of these techniques incrop production management have been amply demonstrated,their accuracy is significantly reduced by the admixture ofbackground signals originating from soil, weeds, and shadows.The relatively coarse spatial resolution of satellite imageryinterferes with the accurate monitoring of crop characteristics,particularly for perennial production systems, where, most of-ten, no full canopy closure is established. The spatial resolution(i.e., pixel size) exceeds, in most cases, the size of the object ofinterest (i.e., crop), resulting in the occurrence of heterogeneouspixels with a spectral signature which is a mixed result of thespectral components within the pixel [10], [11]. This problemhas been referred to as the mixture problem [10].
The mixture problem can be addressed in two ways. Mostcommonly, information on the subpixel cover fractions of thevegetation is extracted from the mixed signal and correlatedwith a range of individual crown condition attributes like LAI,biomass, and chlorophyll content [11], [12]. This techniqueis referred to as AU [13]. Several authors have successfullyused AU to monitor specific crop characteristics [14], [15].However, compared to, for example, VIs extracted from purevegetation spectra, their potential is rather limited [10]. Hence,to optimize information extraction from aerial and satelliteimagery, it is essential to completely eliminate the subpixelspectral contribution of background components such as baresoils and shadows. The extraction of the pure vegetation signalfrom the spectral mixture makes the upscaling of VIs feasible.This technique is referred to as SU [13].
A number of image analysis techniques accommodating mix-ing problems have been proposed (e.g., [16]–[18]), with SMA[19] being one of the most common techniques for AU and SU.SMA is based on the assumption that the reflectance spectrumderived from an air- or spaceborne sensor can be deconvolvedinto a linear mixture of the spectra of ground components,frequently called spectral EMs. One of the major constraintsof SMA is the inability to account for considerable variation inspectral response throughout a scene as one spectral signatureper component present in the scene is used by the traditionalSMA model. The success of spectral unmixing depends onthe accuracy of the selection of the EM spectral signatures[20]. LSMA uses fixed EM spectra, and consequently, thetemporal and spatial variability of the ground entities are notaccounted for. Simulation studies and theoretical predictionshave illustrated that the accuracy of subpixel fraction estimates,as provided by LS spectral unmixing, is a function of boththe variability within (i.e., within-class variability) and thevariability among EM classes (i.e., between-class variability)[21]. The accuracy decreases linearly with the amplitude ofthe within-class variability. Simultaneously, similarity betweenEMs leads to a high correlation between EMs, which, in turn,leads to a dramatic drop in estimate accuracy [21], [22].
Solutions to overcome this fixed-EM problem have beenpresented in recent literature, and an overview is given in [23].
The most commonly used method is MESMA, a modifiedSMA approach in which many mixture models are iterativelycalculated for each pixel in an image [24]. It accounts for EMvariability on a per-pixel basis by randomly selecting differentEM combinations from a spectral library and iteratively calcu-lating the rmse or LS as each pixel is decomposed. The modelwith the best fit (i.e., lowest rmse or LS) is assigned to the pixel.As such, MESMA addresses the fixed-EM problem by allowingEMs to vary on a per-pixel basis.
MESMA has been used extensively in a wide range of AUapplications to account for EM variability, but the usage of themethod in an agricultural setting is limited. Only two studieshave been found on the usage of MESMA in an agriculturalsetting. In [12], MESMA is used to account for the variabilityin shadow spectra in order to increase the relationship betweencover fraction estimates and chlorophyll a concentration. In[25], MESMA is used to discriminate between a field of healthycotton and an adjacent field of mite-damaged cotton, with thehealthy and the mite-damaged cotton being two different EMsin the unmixing. Although Fitzgerald et al. [25] provide afirst step in the usage of MESMA to differentiate between astressed and a nonstressed crop, no attempts have been foundin the literature to use MESMA as a tool to extract the spectralsignature of the crop from a mixed pixel (i.e., SU). The potentialof MESMA has thus not been fully explored in an agriculturalcontext.
Despite the potential benefits of MESMA, there are a num-ber of methodological and practical application problems thatoften impede the operational use of MESMA. The accuracyof MESMA is determined by the adequacy of the availablespectral library. Roberts et al. [26] observed a decrease inaccuracy due to shortcomings in the spectral library, includinga lack of species diversity and scale problems, in which fieldspectra measured for the library were not representative at thescale of the satellite imagery. It is thus crucial that the spectrallibrary used for the unmixing of the image is representative forall EMs present. This implies that a wide variety of possiblespectral signatures for each component, covering the spectralvariation that may be present in the image, must be incorporatedin the spectral library. Once the spectral library is established,MESMA will evaluate each possible EM combination, select-ing the combination which best represents the mixed pixelsignal. However, if adequate libraries with a sufficient numberof EM signatures are used, the total number of possible EMcombinations will restrict the computational efficiency. This isparticularly true for hyperspectral data cubes [27]. Most appli-cations will therefore reduce the computation time by eitherof the following: 1) restricting the size of the libraries [25];2) stop evaluating when the rmse between the modeled andthe mixed signal is smaller then a predefined threshold [24]; or3) only evaluating a predetermined fixed number of iterations[28]. When looking for subtle differences in the spectral signa-ture of the canopy, none of these methods might be satisfactory,as the best spectral representation of the canopy might not beselected because the full spectral variation will not be covered.
A broad variation in EMs may further lead to more thanone possible combination of the pure spectra resulting in thesame mixture spectrum, a problem commonly referred to as
This article has been accepted for inclusion in a future issue of this journal. Content is final as presented, with the exception of pagination.
TITS et al.: POTENTIAL AND LIMITATION OF CLUSTERING APPROACH FOR IMPROVED EFFICIENCY OF MESMA 3
ill-posedness [29]. This may also result in a large number ofpossible abundance images of different EMs, which increasesthe complexity of the analysis and may produce an undesiredoverstratification of the scene [27], [30].
The main objective of this study is to evaluate the potential ofMESMA for plant production system monitoring. The potentialof MESMA to simultaneously extract the cover fraction (AU)and the pure hyperspectral signature of the canopy (SU) frommixed spectra is assessed. MESMA is traditionally used for AUbut its iterative character, systematically exploring numerousEM combinations, opens opportunities for the retrieval of thespectral signature of crops (SU) and, thus, for crop status moni-toring. An alternative approach is presented, enabling MESMAto use extensive hyperspectral EM libraries (i.e., LUTs) whileretaining both the computational efficiency of the algorithm andwithout compromising the accuracy of the unmixing model asthe previously described methods do. The key elements of theapproach are as follows:
1) a radiative transfer modeling approach to establish spec-tral libraries covering the complete variation in re-flectance that can occur in a specific agricultural setting.In this paper, citrus was chosen as pilot crop;
2) a spectral segmentation protocol to reduce the size ofspectral libraries or LUTs without loss of information;
3) a data clustering technique to improve the efficiency ofthe iterative mixture cycles.
The ambition of this study is a proof of concept ratherthan to provide a fully operational approach. The potentialof LUTs, segmentation, and clustering techniques to improvethe efficiency of MESMA is evaluated based on simulatedimagery composed of in situ measured reflectance spectra ofbare soil and citrus tree canopies collected in commercial citrusplantations in the Western Cape province of South Africa.For most of the growing season, weeds are not present in theconsidered plantations such that only mixtures of soil and treecanopies were considered.
II. THEORETICAL BACKGROUND
A. LSMA
SMA is a common technique to determine the composition ofmixed pixels. LSMA, the most widely used SMA approach, isbased on the premise that a given mixture can be modeled usinga set of linearly independent EM spectra [19]. The multiplescattering of photons between different surface componentsviolates the linearity assumption [31], and several nonlinearunmixing models have been proposed to take this multiplescattering into account [31]–[33]. Nevertheless, the majorityof vegetation monitoring studies neglect the effect of multiplescattering, and LSMA is applied given the simplicity and therelative accuracy of the linear models [24]. To deconvolvea spectrum into fractional abundances of its constituent EMspectra, the following equation in vector form can be solved:
r = Mf + ε withm∑j=1
fj = 1 and 0 ≤ fj ≤ 1. (1)
r is the observed spectrum, M is a matrix of which eachcolumn corresponds to the spectral signal of a specific groundcover class or EM, and f is a column vector [f1, . . . , fm]T
that denotes the subpixel cover fractions occupied by each ofthe m EMs [19]. The part of the spectrum that cannot bemodeled is expressed as a residual term ε which follows amultivariate normal distribution (MVN) with mean vector 0and variance–covariance matrix Σ [i.e., MVN (0, Σ)] [21].The coefficients in (1) are constrained by the following: 1) tosum to one and 2) to be positive in order to obtain physicallyinterpretable cover fraction estimates [12], [24]. Model fit canbe assessed using approaches such as the Gramm–Schmidtorthogonalization [34], maximum likelihood [21], or LS regres-sion analysis using the model residuals (ε) [22]. This latterapproach is used in this study. Subpixel EM fractions for thecorresponding fraction vector f are obtained by minimizing thefollowing equation:
n∑i=1
ε2i =
n∑i=1
m∑j=1
(Mi,jfj)− ri
2
(2)
where n is the number of available spectral bands [22].
B. MESMA
The success of spectral unmixing depends on the accuracy ofthe selection of the EM spectral signatures [20]. One of the mostwidely used techniques to negate the “fixed EM” restrictionand to improve the selection of the EMs is MESMA [24]. TheMESMA algorithm is based on an iterative process by which alarge number of EM combinations are randomly selected fromthe spectral library and tested in a mixture model. Depending onthe size of the library and the required CPU efficiency, either allpossible EM combinations or only a fixed number of iterationsare evaluated. Model fit can be assessed either by SSE, asdescribed in (2), or by the rmse (5) [10], [27]. The combinationof signatures which results in the lowest SSE or rmse is selectedas the best representation of the EMs present within the pixel.As such, MESMA addresses the fixed-EM problem by allowingboth the number of EMs and the spectral signature of the EMsto vary on a per-pixel basis [24].
C. EM Libraries
Traditional MESMA requires an extensive library of EMspectra, where each plausible ground component is representedat least once. EM spectra can either be extracted from theimagery itself (e.g., [35]–[37]) or derived from spectral librariesbuilt from field or laboratory measurements (e.g., see [11]and [24]). Spectra from field and laboratory measurementscan be controlled well and measured accurately, yet they maynot match those in the image due to differences in sensors,atmospheric effects, and illumination conditions [20]. ImageEMs, on the other hand, are often obtained from the pure EMpixels in the image to be unmixed. This is ideal as the EMsselected for the unmixing are actually present in the area. Thedownside of this method, however, is the requirement of theavailability of pixels comprised purely of each dominant cover
This article has been accepted for inclusion in a future issue of this journal. Content is final as presented, with the exception of pagination.
4 IEEE TRANSACTIONS ON GEOSCIENCE AND REMOTE SENSING
type [20]. Image EM extraction techniques therefore oftenfail to account for the spectral variability present within thedifferent ground cover or EM classes. This is particularly truein an agricultural setting where mixed pixels prevail. Althoughthis problem is less pronounced by using spectral librariesbuilt from field measurements [11], [24], establishing a librarybased on field measurements can be very time consuming andintensive. This is particularly true if the variation in both timeand space is considered. The reflectance of the canopies willnot only vary due to differences in, for example, crop manage-ment, soil texture, and planting distance but also vary due tophenological changes that occur during a growing season. Inan agricultural setting, both the image extracting technique andthe field/laboratory measurements may not be adequate for theinclusion of sufficient variation within the spectral library. Thiscan be solved to a large extent by the use of LUTs or data sets ofsimulated spectra consisting of the full range and combinationof expected field conditions [38], [39].
D. LUTs
LUTs are a common tool in hyperspectral data analysis andare often used to derive biophysical parameters from hyperspec-tral data using spectral matching techniques [38]–[40]. A LUTis commonly established using an RTM [41]. For example, Voh-land et al. [42] used the PROSAIL canopy reflectance model toconstruct a LUT of summer barley, while Walthall et al. [40]used the MCRM to model the spectral signals of soybeanand corn.
For a LUT to be adequate, it is important that the RTMinputs encompass the full range and combination of expectedfield conditions [40]. The number of spectral signatures ina LUT can as such become very large. For example, for theretrieval of crop characteristics or stand variables, Richter andTimmermans [39] and Vohland et al. [42] both used a LUTcomprising 105 entries. It must be noted that the density bywhich the input parameter values of the RTM are sampledaffects the accuracy of the LUT approach. Increasing the sizeof the LUT can result in more accurate retrievals, but it alsoconsumes greater computer resources (i.e., longer computationtime). In general, therefore, it is important to construct a LUTthat is sufficiently dense to provide accurate retrievals yetsufficiently sparse to allow quick calculation.
E. Clustering
Clustering of hyperspectral data has been used in a varietyof applications, but most importantly for image classificationand for the extraction of spectral EMs (e.g., [43] and [44]). Ataxonomy and survey of clustering techniques can be found in[45]. Two principal groups of clustering methods can be distin-guished: hierarchical and partitional approaches. Hierarchicalclustering algorithms produce a nested series of partitions basedon a criterion for merging or splitting clusters based on similar-ity. Partitional clustering algorithms identify the partition thatoptimizes (usually locally) a clustering criterion [46]. Whilea hierarchical algorithm yields a dendrogram representing thenested grouping of patterns and similarity levels at whichgroupings change, a partitional clustering algorithm obtains a
single partition of the data. This makes partitional methodsmore suitable in applications involving large data sets suchas hyperspectral data cubes for which the construction of adendrogram is computationally prohibitive.
Therefore, the commonly used partitional clustering algo-rithm k-means, as defined in [47], is used. This approachcomprises several well-defined steps.
1) Take the first k data units in the data set as clusters of onemember each.
2) Assign each of the remaining m− k data units to theclusters with the nearest centroid (i.e., average linkage).After each assignment, recompute the centroid of thegaining cluster.
3) After all the data have been assigned in step 2), take theexisting cluster centroids as fixed seed points, and makeanother pass through the data set assigning each data unitto the nearest seed point.
4) Repeat the allocation of step 3) until the cluster centroidsconverge.
An important issue in cluster analysis is to establish thenumber of clusters present in a data set. Many solutions havebeen presented to determine the number of clusters. Thesemethods can be based on the intrinsic complexity present inthe data set [48], using statistical approaches [49], [50], or, forhyperspectral data, based on the number of different compo-nents that are present in the image [44]. The latter approach isnot feasible in this study as the clustering will be performedon spectral libraries consisting of only one specific component,i.e., soil or vegetation, and a statistical method is in place here.
Five common approaches to estimate the number of clustersare cross-validation [51], penalized likelihood estimation [52],permutation tests [53], resampling [54], and finding the kneeof an error curve [48]. The majority of these methods may notwork very well in practice. Model-based methods such as cross-validation and penalized likelihood estimation are computa-tionally expensive and often require the clustering algorithmto be run several times. Permutation tests and resampling areextremely inefficient since they require the entire clusteringalgorithm to be rerun hundreds or even thousands of times[48]. Methods that locate the knee of an error curve statisticallyevaluate each point in the error curve and use the point thateither minimizes or maximizes some function as the number ofclusters to return. In this paper, finding the knee of a curve isused as a method to determine the optimal number of clustersand will be explained further in the following paragraph.
The information required to determine an appropriate num-ber of clusters is contained in an evaluation graph. The eval-uation graph is a 2-D plot where the x-axis is the number ofclusters and the y-axis is a measure of the quality or error of aclustering consisting of x clusters. The procedure of identifyingthe best clustering scheme using an evaluation metric graphinvolves the following parts [55].
1) Select a proper cluster validity index. The y-axis valuescan be any evaluation metric such as distance, similarity,error, or quality [48]. Most existing evaluation metricsare designed to best fit the shape of the clusters presentin the data set. For example, the Chameleon algorithm
This article has been accepted for inclusion in a future issue of this journal. Content is final as presented, with the exception of pagination.
TITS et al.: POTENTIAL AND LIMITATION OF CLUSTERING APPROACH FOR IMPROVED EFFICIENCY OF MESMA 5
uses a similarity function that can produce complex non-spherical clusters [56]. In this paper, however, the aimof the clustering of the spectral libraries is not to findwell-separated clusters in an n-dimensional space, withn being the number of wavebands, but to find well-separated clusters in the 2-D waveband-reflectance space.This makes most existing techniques not suitable for ourpurpose. Therefore, a new evaluation metric is used. Thenumber of clusters will be evaluated against the totalnumber of overlap between all x clusters. Two clusters aand b are considered to have an overlap Oi for a specificwaveband i if the difference between the means µ issmaller than the sum of the standard deviations σ of thetwo clusters. If there is no overlap between two clustersfor a waveband i, Oi will be negative. Oi will be closeto zero if the overlap is small and converge to one withincreasing overlap
Oi = 1− |µa,i − µb,i|σa,i + σb,i
∀Oi > 0 : O =n∑
i=1
Oi. (3)
2) Repeat a clustering algorithm successively for a numberof clusters, from a predefined minimum to a predefinedmaximum (i.e., from two to sixteen).
3) Plot the “number of clusters versus evaluation metric”graph, and select the optimal number of clusters at whichthe partition appears to be the best when the evaluationmetric is optimized. In the graph, a clear knee point (orjump point) is often used to detect the number of clusters.The knee of a curve is loosely defined as the point ofmaximum curvature.
III. EXPERIMENTAL METHODOLOGY
AND SIMULATED DATA
A. Hyperspectral Data Sets
In situ measured spectral data were collected in a citrus or-chard near Wellington, South Africa (33◦35′00′′S; 18◦55′30′′E).On the study site, nine-year-old “Midknight Valencia” orange(Citrus sinensis L.) trees grow, bud grafted onto “Carrizo”citrange rootstocks. Measurements of 30 selected trees weretaken on a monthly basis during a two-year period, thus in-corporating the seasonal changes in phenology like new shootgrowth, blossoming, fruit formation, harvest, and pruning. Ascitrus is an evergreen, measurements were taken all year round.The soils encountered were Albic Luvisols, soils with a sandytexture and organic carbon of 0.53% [57].
Spectral measurements were performed within 1 h of lo-cal solar noon on clear sky days using a full-range (350–2500 nm) spectroradiometer (ASD, Boulder, CO) with a 25◦
fore optic. The spectroradiometer has a spectral resolution of3 nm (FWHM) and a 1.4-nm sampling interval across the350–1050-nm spectral range. The FWHM and the samplinginterval for the 1051–2500-nm spectral range are 20 and 2 nm,respectively. Resulting data were interpolated during collectionby the ASD software to produce values at each nanometer
interval. The reflectance data were calibrated using a whitespectralon panel with nearly 100% reflectance at all wave-lengths (Labsphere Inc., North Sutton, NH). Soil measurementswere taken from nadir at a height of 1 m above the surface,while tree canopy spectra were measured at 2 m above thetree top using a scaffold. Five measurements were taken pertree canopy and per soil patch, using the average signal forfurther analysis. The major water absorption regions, sensitiveto changing atmospheric water vapor content, were excluded.
From this extensive data set, signatures were randomlyselected for each component to generate simulated spectralmixtures. Simulated or synthetic imagery is frequently used toperform a preliminary evaluation of analysis techniques [10],[22], [27], [35], [58]. They provide a useful source of data forimproving our understanding of information extraction fromremotely sensed data and allow evaluating the information ex-traction technique without taking the nonlinear interactions ofphotons among EMs into account. This simplifies the problemand allows for a better understanding of the impact of EMvariability on SMA [58], [59]. An additional advantage ofsimulated data is that the exact EM fractions and spectra areknown since they are used to generate the mixed spectrum ofeach pixel. As such, a direct and accurate comparison withestimated EM fractions and EM signatures becomes feasiblewhich results in an objective and error-free interpretation ofunmixing accuracy [27]. If not, cover fractions and signaturesneed to be estimated using ground-truth measurements or needto be extracted from alternative remotely sensed information(e.g., digital cameras for cover fraction estimates) [11]. The re-sulting validation data inherently contain errors which hampersan objective interpretation of the MESMA performance.
Mixed spectra were calculated according to (1). Normallydistributed noise was added to the mixed signal to account forambient or instrumental errors. The noise was considered tohave a mean of zero and a standard deviation ranging from 0%to 15% of the mixed signal [10], [60]. Two hundred signatureswere selected for the soil and tree components from the fieldmeasurement data set, resulting in 200 mixed spectra. Coverfractions ranged between 0 and 1 and were restricted to sum toone. As it concerns a preliminary test, shadowing and shadingeffects were not accounted for.
B. LUTs
1) Tree Canopy Spectra: A LUT for “Midknight Valencia”orange tree canopy spectra was created based on simulationswith rowMCRM [61]. This RTM is specifically designed tomodel row-structured open canopy crops. Leaf radiative trans-fer simulations, based on the PROSPECT model [62], are usedas input of the canopy reflectance model. PROSPECT is drivenby quantitative inputs of leaf biochemical and biophysicalconstituents (pigmentation, water, leaf structure, etc.) whilethe upscaling to canopy reflectance requires additional modelparameters related to the canopy structure. The model input pa-rameters were calibrated for “Midknight Valencia” orange treecanopy based on a set of in situ measured canopy reflectance,dendrometric, and leaf biochemical measurements [63].
Simulations for all possible combinations of leaf chloro-phyll, leaf water content, and LAI values are included.
This article has been accepted for inclusion in a future issue of this journal. Content is final as presented, with the exception of pagination.
6 IEEE TRANSACTIONS ON GEOSCIENCE AND REMOTE SENSING
From the literature [63] and from leaf analysis and in situLAI measurements [64], realistic boundaries could be de-fined. Leaf chlorophyll content values ranged between 10 and80 µg/cm2, leaf water content values ranged between 0.0001-and 0.04-cm leaf water equivalent thicknesses, and LAI valuesvaried from 2 to 10.3. This resulted in a total of 41 250simulations. Other model input parameters, such as leaf proteincontent, leaf angle distribution parameters, crown diameter,view zenith, and azimuth angles, were kept constant. Althoughnot all possible variations were included, a realistic LUT wascreated covering the variation in the three most importantparameters also used in crop production management. Althoughit is a simplification, the variation in the three parameters wasconsidered to be independent, allowing for a wider range ofspectra in the LUT.
2) Soil Spectra: The soil consists of different componentslike minerals, organic matter, water, and air, with each com-ponent having its own way to interact with the incident lightand thus influencing the resulting soil spectra [65]. Since thesecomponents are heterogeneous throughout an orchard, the spec-trum of the soil will change accordingly. The two key factorsdetermining the reflectance of a soil are the texture (soil type)and the SMC [10], [65]–[67]. It is well acknowledged that soilreflectance can be modeled using an exponential relationshipwith SMC
Rwet,λ = (Rdry,λ −Rsat,λ)× e−cλ×θwt +Rsat,λ. (4)
Rwet,λ is the modeled reflectance of the soil at wavelength λwith a relative soil moisture condition of θwt. Rdry,λ and Rsat,λ
are the reflectance of the corresponding dry and saturated soilat wavelength λ, respectively, and c describes the rate of changecaused by soil moisture.
The soil model developed by Somers et al. [68] was used inthis study, as it is calibrated and validated for the same study sitefor a total of four soil types (i.e., Haplic Arenosol, Cambisol,Albic Leptic Luvisol, and Haplic Acrisols). The soils used tosimulate the mixed pixels (as described in Section IV-A) wereAlbic Leptic Luvisols, but the four soil types were incorporatedinto the spectral library to account for the full variability thatmay be present in the study site, as only point samples weretaken and other soil types may occur. The SMC was variedbetween 0% and 30%, the range in which the SMC varies inthe field. The resulting library consists of 330 signals.
3) Spectral Segmentation: When building a comprehensiveLUT covering the full range of spectral variation, duplicateinformation will most likely be present. This is particularly truefor vegetation EMs.
Variations in LAI will result in reflectance changes in theNIR region of the spectrum (700–1350 nm) only, while nosignificant change in reflectance can be detected in the VIS(400–700 nm) and SWIR (1350–2500 nm) regions of thespectrum. The same effect can be seen in the VIS region forvariations in the pigment concentrations of the leaves. Only theVIS domain will be influenced by these changes while the otherdomains are not. This makes that, when taking, for example,ten different chlorophyll concentrations and ten different LAIvalues, a total of 100 signals is needed to cover this variationin parameters. When segmenting the spectral library into three
separate libraries, one for each region of the spectrum (VIS,NIR, and SWIR, respectively), the total number of signals inthe library can be reduced to 21 (i.e., ten in the VIS, ten in theNIR, and one signal in the SWIR). Even when the variationincludes parameters that influence the reflectance in more thanone region, like the canopy water content, segmentation willstill reduce the total number of signals in a library. For exam-ple, variations in the canopy water content will influence thereflectance in the NIR and SWIR regions of the spectrum [1]. Ifwe add a variation of ten different water canopy contents to thevariations in the previous example, the library before segmen-tation will consist of a total of 10× 10× 10 = 1000 signals.After segmentation, both the VIS and SWIR will consist of tensignals, while the NIR library will consist of 100 signals (i.e.,10× variation in water and 10× variation in LAI). This willgive three libraries with a total of 120 signals, compared to the1000 signals of the original library.
The segmentation approach has the additional benefit ofreducing the uneven contribution to the LSMA output of thedifferences in reflectance between the three spectral regions[69]. The number of radiation reflected by the vegetation ishigher in the NIR compared to the VIS, and depending onthe water content of the canopy, it is also higher than that inthe SWIR region. The LSMA algorithm uses an LS estimatebetween the measured mixed spectrum and the modeled signal(2). This value is consequently dominantly determined by theNIR [69]. In particular, in the VIS, subtle differences will belost during the unmixing due to this dominance of the NIR. Byapplying the MESMA algorithm on the three region separately,it is expected that a more suitable EM signal is selected,resulting in an increased accuracy of the unmixing model. Thisdifference in reflectance will also have an influence on theclustering. When no segmentation is done prior to clustering,the clusters will be determined primarily by the reflectancein the NIR, which will result in poorly separated clusters inthe VIS and SWIR. Therefore, prior to clustering the spectrallibraries, they were segmented into the three different regions.Not only will this reduce the total size of the libraries andthe computation time, but it is also expected to increase theefficiency of the clustering and the accuracy of the unmixing.The procedure can be summarized as follows.
1) Signals from the original library were added one by onein a new empty library (i.e., reduced library). For eachnew signal in the reduced library, the LS was calculatedwith all the signals already in the reduced library.
2) If the LS between the new signal (S1) and a signal presentin the reduced library (S2) equaled zero or was close tozero (i.e., smaller than 0.0001), the average of the twosignals was added to the library, replacing S2. Therefore,a new signal was only added to the reduced library ifLS > 0.0001.
3) This procedure was repeated until all signals from theoriginal library were evaluated.
4) Previous steps were repeated until no similar signals werepresent in the library.
This segmentation approach has additional benefits for build-ing libraries from field measurements. When building a library
This article has been accepted for inclusion in a future issue of this journal. Content is final as presented, with the exception of pagination.
TITS et al.: POTENTIAL AND LIMITATION OF CLUSTERING APPROACH FOR IMPROVED EFFICIENCY OF MESMA 7
from field measurements, practical limitations might make itdifficult to measure an adequate data set large enough to cover asufficient number of variations. Segmentation of the measuredsignals will enable the user to cover more variation. For ex-ample, if ten signals were measured in the field, each with aunique signature in the three regions of the spectrum, a totalof 1000 combinations can be made, significantly increasing thetotal variation covered by the library.
4) Clustered MESMA: The main challenge of implementingMESMA in plant production system monitoring is thus toimprove the efficiency of the iterative mixture cycles and there-fore reduce the computation time without compromising theaccuracy of estimating ground cover estimates (AU) and purevegetation signals (SU). We propose to optimize the numberof necessary iterations in MESMA by implementing a spectralclustering technique. The available LUTs, one for each EMand segmented in the three spectral regions, were classified ina predefined number of clusters based on spectral similaritymeasures, as described in Section II-E. Instead of using allthe possible EM signature combinations, using only a fixednumber of iterations per pixel, reducing the library, or putting athreshold on the rmse, as is commonly done, only the meanspectral signatures of each cluster were considered in a firstiterative mixture cycle. In a second iterative cycle, a Bayesianselection criterion [59], [70] was used to weigh each clustercombination depending on the rmse between the mixed signaland the signal modeled using a cluster average combination(i.e., cluster average for both the tree and the soil EM) in thefirst cycle. Those weights were used to reallocate the remainingiterations over the most appropriate cluster combinations. Us-ing this method, signals were selected from clusters that gaverelatively good unmixing results, enabling MESMA to searchthe library more efficiently.
Three different scenarios were evaluated in order to test theperformance of the models. In the first scenario, no a prioriinformation was known about the soil, and the full soil librarycontaining four soil types as described in Section III-B2 wasused (scenario I). In scenario II, the soil type was known, thusincluding only the correct soil type in the library. If not only thesoil type was known but also the SMC, the spectral signatureof the soil EM could be modeled, and no library was needed inthe unmixing model for the soil EM (scenario III) [10]. Thesescenarios will enable us to test the performance of the clusteredMESMA in more detail, taking effects like ill-posedness intoaccount.
C. SMA and Evaluation Criteria
The performance of MESMA for AU and SU was eval-uated using the simulated hyperspectral data described inSection III-A and the LUTs described in Section III-B. Twodifferent methodologies were evaluated: 1) the traditionalMESMA method, where a fixed number of iterations are used,and 2) MESMA with the spectral libraries both segmented andgrouped into a k number of distinct clusters. Model perfor-mance was evaluated using four evaluation criteria.
1) Ability to model the mixed signal—MESMA selects themodeled signal with the smallest rmse between the mixed
and the modeled signal. The lower the rmse, the better themodel fit and the unmixing performance [24]
rmse =
√√√√n∑
i=1
(refi − esti)2
n. (5)
2) Cover fraction estimate accuracy—The accuracy of theAU was evaluated using the coefficient of determination(R2) (6), the slope and intercept of the estimated versusthe reference cover fractions in a scatterogram, and thermse (5) [58]
R2 = 1−∑n
i=1(refi − esti)2
∑ni=1(refi − est)2
. (6)
3) Accuracy of extracting the pure tree spectra—The SU ac-curacy was evaluated using the rrmse (7) per waveband be-tween the extracted and reference vegetation signals [10]
rrmse =
√√√√n∑
i=1
(refi − esti)2
n× 1
ref. (7)
4) Computational efficiency—In general, it can be assumedthat the more the iterations, the better the model fit, butthe higher the required computation time. In order topresent a fair comparison between the different MESMAapproaches, the number of iterations ranged between 1and 200. In this way, not only the accuracy was assessedfor each method but also the number of iterations or thecomputational efficiency needed to reach this accuracy.
In (5)–(7), refi is the ith actual or reference value; esti isthe ith estimated or predicted value, n is the total number ofavailable measurements, and ref is the average of the referencevalues.
IV. RESULTS
A. Segmentation and Clustering
The first step in the proposed MESMA approach is the seg-mentation of the spectral libraries of both the soil and the treecanopy spectra. Given the variation in LAI, leaf chlorophyll,and water content, the tree library consists of 41 250 spectralsignatures. By segmenting the library into the three spectraldomains and removing the similar signals (see Section III-B3), the number of signals is drastically reduced from 41 250to 176, 405, and 455 signals for the VIS, NIR, and SWIRdomains, respectively, resulting in a total of 1036 signals forthe tree EM. For the soil EM, the reduction in library size isless pronounced in the NIR and the SWIR region (i.e., from330 to 301 and 323 signals, respectively) but is still significantin the VIS region (from 330 to 106 signals). This results in atotal library size of 730 signals for the soil EM.
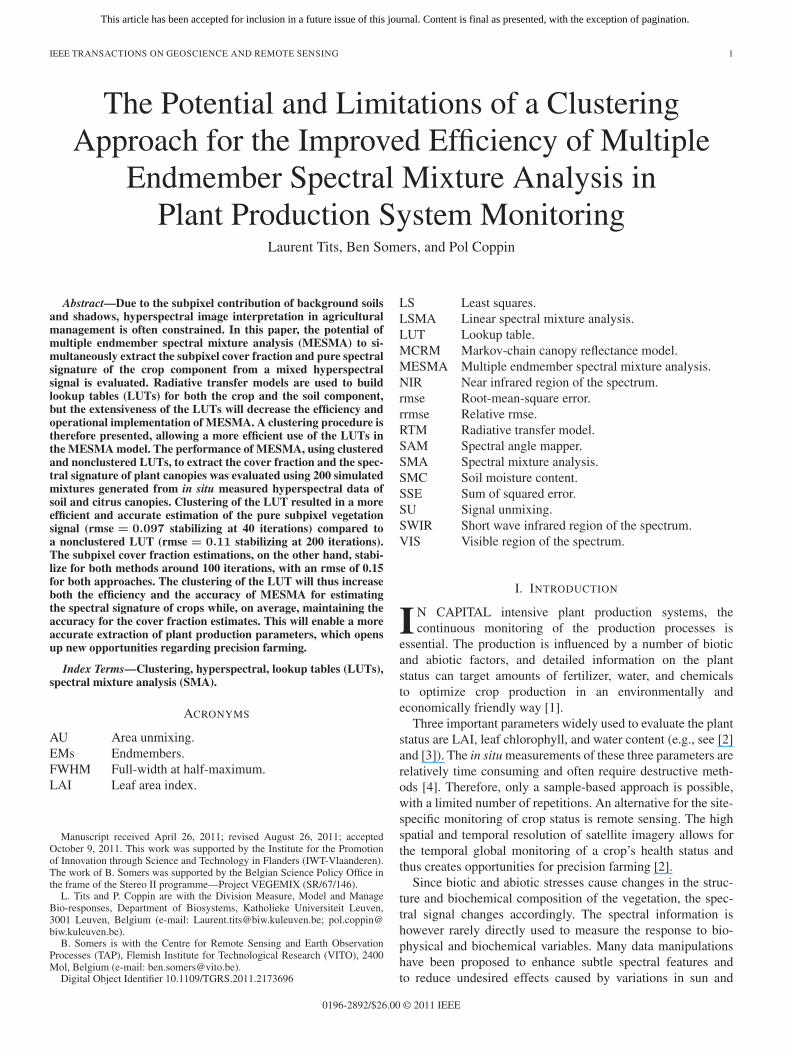
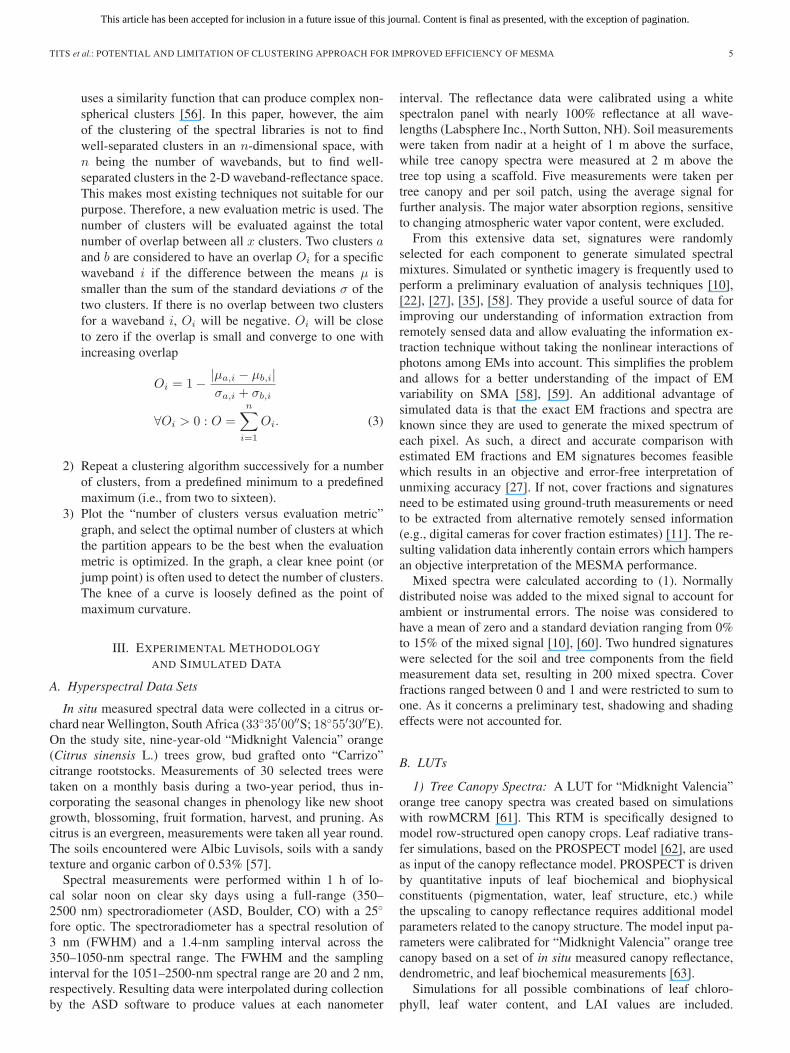
Each of these libraries is clustered according the approachdescribed in Section II-E. The number of clusters is determinedby the “number of clusters versus minimum overlap” graph (seeSection II-E). In Fig. 1, these evaluation graphs are given forboth the tree and soil libraries. The locations of the knees ofthe different curves are marked with a vertical line. For the tree
This article has been accepted for inclusion in a future issue of this journal. Content is final as presented, with the exception of pagination.
8 IEEE TRANSACTIONS ON GEOSCIENCE AND REMOTE SENSING
Fig. 1. Evaluation graphs for the determination of the number of clusters in the segmented libraries. The locations of the knees of each curve are marked with avertical line. (a) VIS. (b) NIR. (c) SWIR.
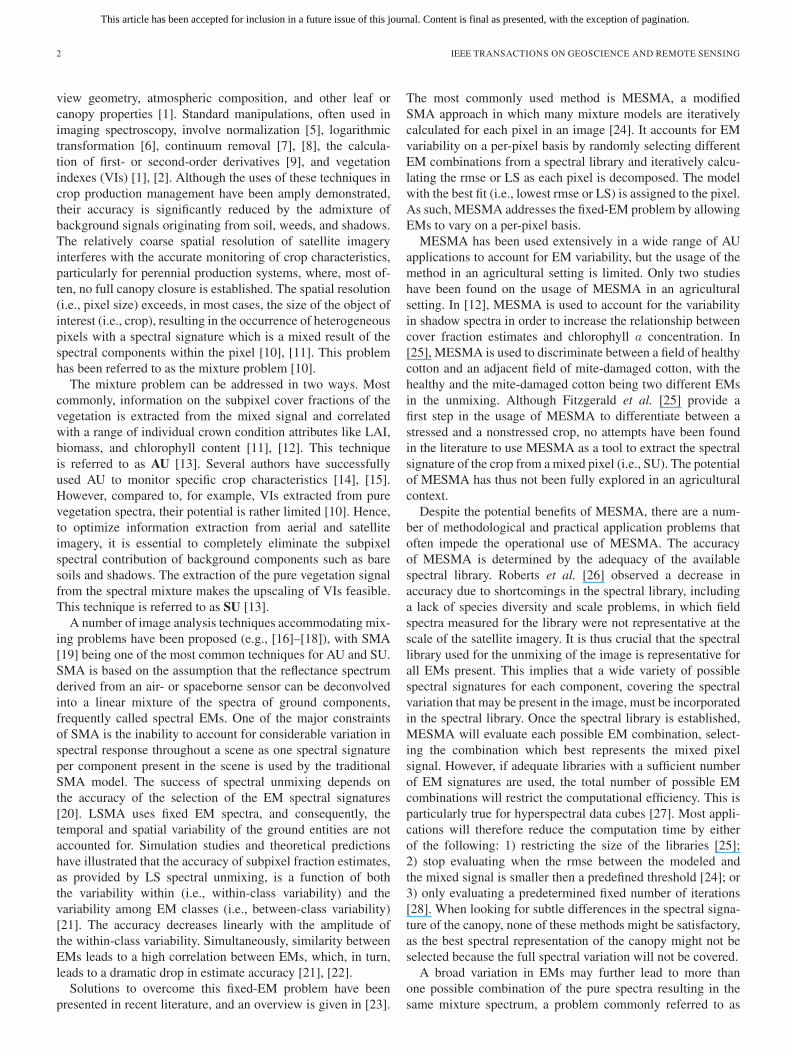
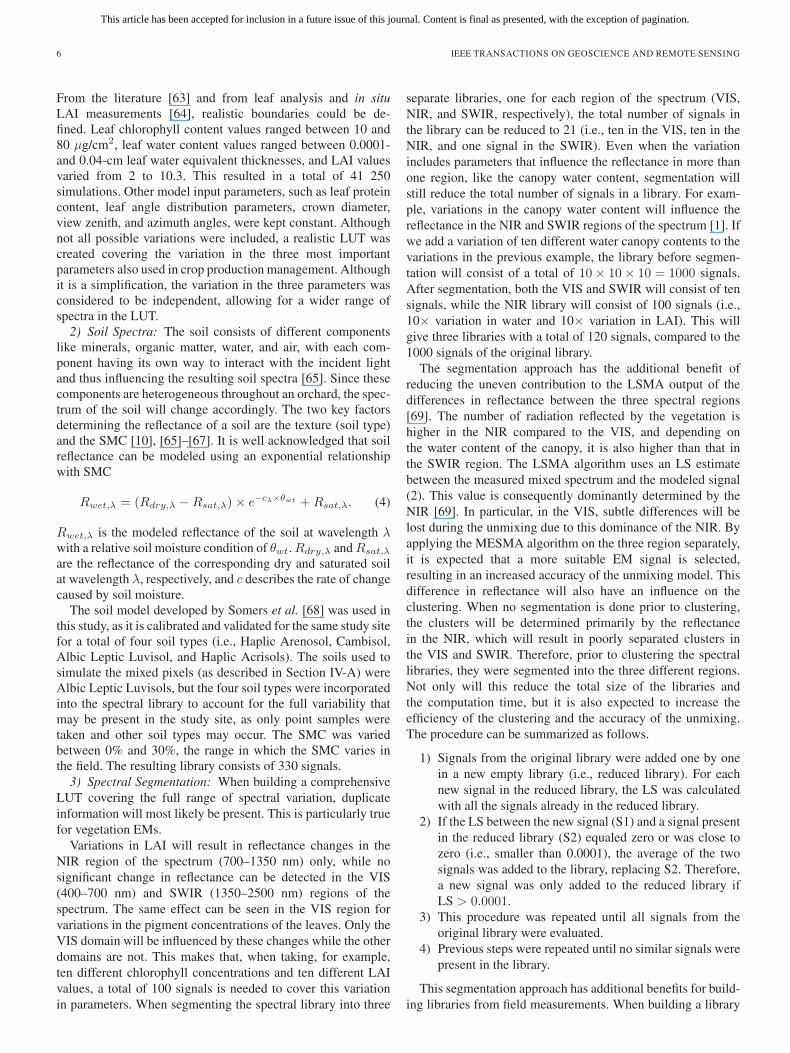
Fig. 2. RMSE between the mixed and the modeled signal, in function of the number of iterations, for both the traditional MESMA approach (MESMA) and theproposed clustered MESMA approach (Clustered). Standard deviations are given as well. In (a) scenario I, little information is known about the soil EM, while in(b) scenario II, the soil type is known, and in (c) scenario III, the exact soil signature is known.
libraries, the number of clusters is set to five, three, and fourclusters for the VIS, NIR, and SWIR domains, respectively. Forthe soil libraries, the number of clusters is set to seven for theVIS domain and nine for the NIR and the SWIR domain.
In the next paragraphs, three aspects of the unmixing modelswill be evaluated: model fit, cover fraction estimate accuracy(AU), and the accuracy of the extracted spectral signature ofthe tree EM (SU). For each of these aspects, the computationalefficiency is assessed by comparing the results for iterationsranging from 1 to 200. A comparison is made between thetraditional MESMA, where each component has an extensivespectral library, and the proposed MESMA approach, usingthe segmented and clustered libraries as described earlier. Inthe following results, the traditional MESMA will be referredto as MESMA, while the new approach will be referred to asclustered MESMA. As described in Section III-C, three differ-ent scenarios will be evaluated. Depending on the informationknown of the soil EM, the library of the soil EM will includeeither four soil types (scenario I), only the correct soil type(scenario II), or only the correct soil signal (scenario III).
B. Model Fit
In Fig. 2, the rmse between the mixed and the modeledsignal is shown for iterations ranging between 1 and 200,for both MESMA and clustered MESMA, evaluating theirperformance for the three scenarios. After 200 iterations, the
mixed signal was better modeled by MESMA compared toclustered MESMA for both scenarios I and II (rmseMESMA =0.019 versus rmseclustered MESMA = 0.031 and rmseMESMA =0.017 versus rmseclustered MESMA = 0.027, respectively). Theopposite is true when the spectral signal of the soil EMis known (rmseMESMA = 0.02 versus rmseclustered MESMA =0.018). As expected, the rmse decreased with increasing it-erations for MESMA. However, for clustered MESMA, noadditional decrease in rmse occurred after 100 iterations forscenarios I and II and after 60 iterations for scenario III.
C. AU
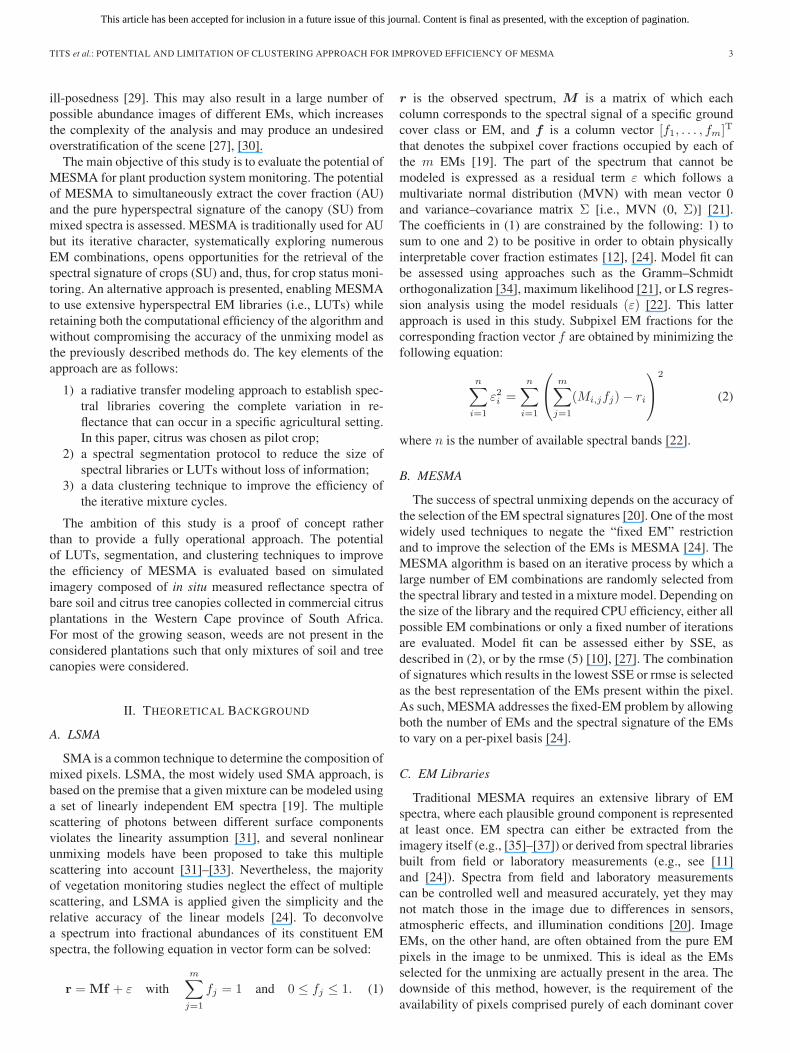
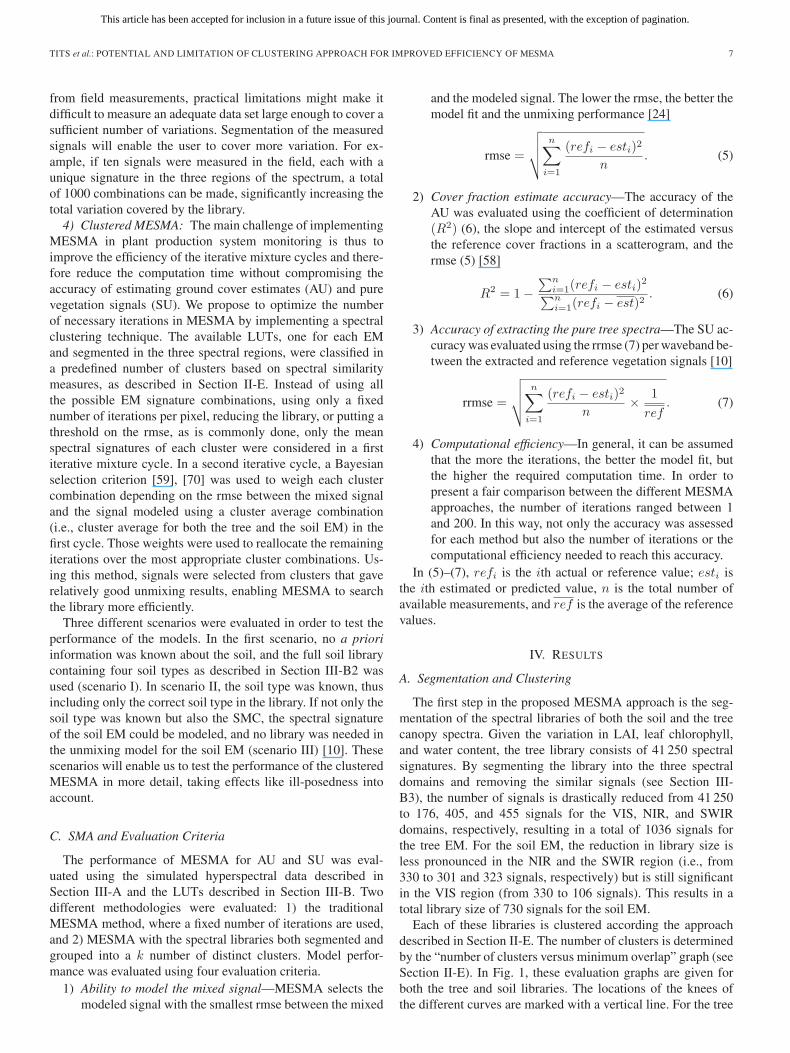
In Fig. 3, the rmse of the estimated cover fractions is givenfor MESMA and clustered MESMA, and for the three sce-narios, with iterations ranging from 1 to 200. The graphs forthe R2, the intercept, and the slope gave similar results, andtherefore, only the trend in the rmse is shown. In Table I,the R2, intercept, and slope are given for each method andscenario after 200 iterations. The best cover fraction estimateswere obtained when the soil signature was known. An rmse of0.042 for clustered MESMA was achieved after ten iterations,while MESMA showed an rmse of 0.062 after 150 iterations.Clustered MESMA also gave a more stable result comparedwith MESMA, as shown from the error bars in Fig. 3.
However, when the soil type is known (scenario II), the AUaccuracy of both MESMA and clustered MESMA decreased
This article has been accepted for inclusion in a future issue of this journal. Content is final as presented, with the exception of pagination.
TITS et al.: POTENTIAL AND LIMITATION OF CLUSTERING APPROACH FOR IMPROVED EFFICIENCY OF MESMA 9
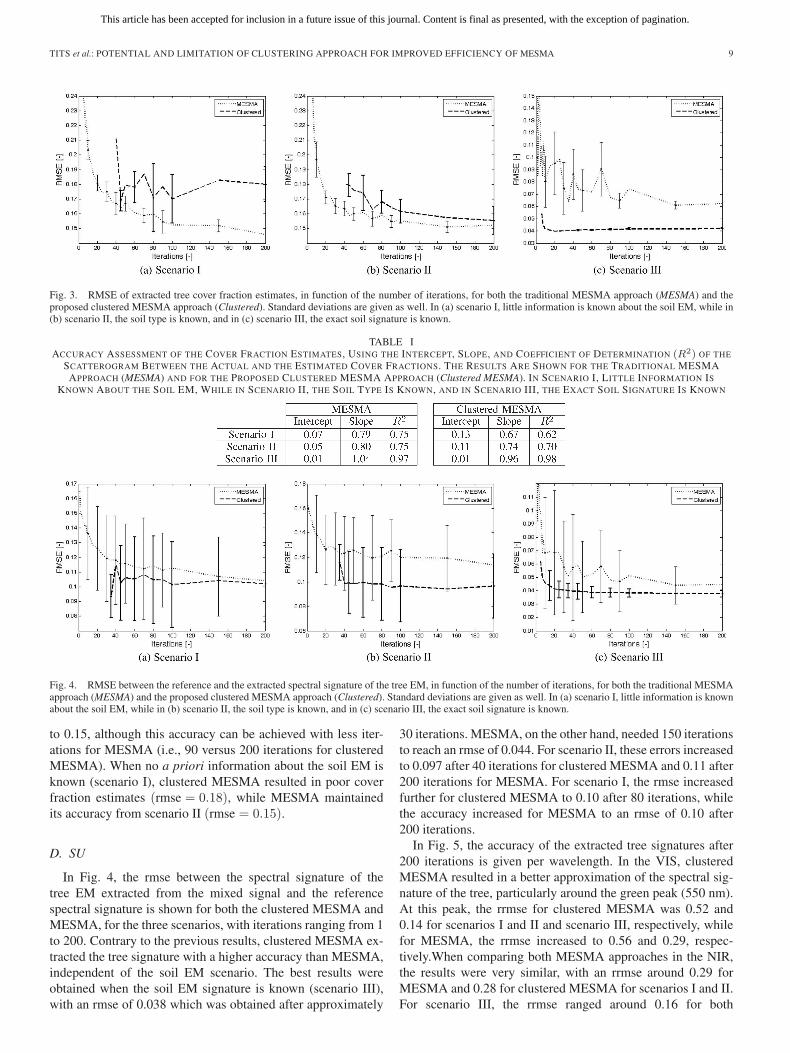
Fig. 3. RMSE of extracted tree cover fraction estimates, in function of the number of iterations, for both the traditional MESMA approach (MESMA) and theproposed clustered MESMA approach (Clustered). Standard deviations are given as well. In (a) scenario I, little information is known about the soil EM, while in(b) scenario II, the soil type is known, and in (c) scenario III, the exact soil signature is known.
TABLE IACCURACY ASSESSMENT OF THE COVER FRACTION ESTIMATES, USING THE INTERCEPT, SLOPE, AND COEFFICIENT OF DETERMINATION (R2) OF THE
SCATTEROGRAM BETWEEN THE ACTUAL AND THE ESTIMATED COVER FRACTIONS. THE RESULTS ARE SHOWN FOR THE TRADITIONAL MESMAAPPROACH (MESMA) AND FOR THE PROPOSED CLUSTERED MESMA APPROACH (Clustered MESMA). IN SCENARIO I, LITTLE INFORMATION IS
KNOWN ABOUT THE SOIL EM, WHILE IN SCENARIO II, THE SOIL TYPE IS KNOWN, AND IN SCENARIO III, THE EXACT SOIL SIGNATURE IS KNOWN
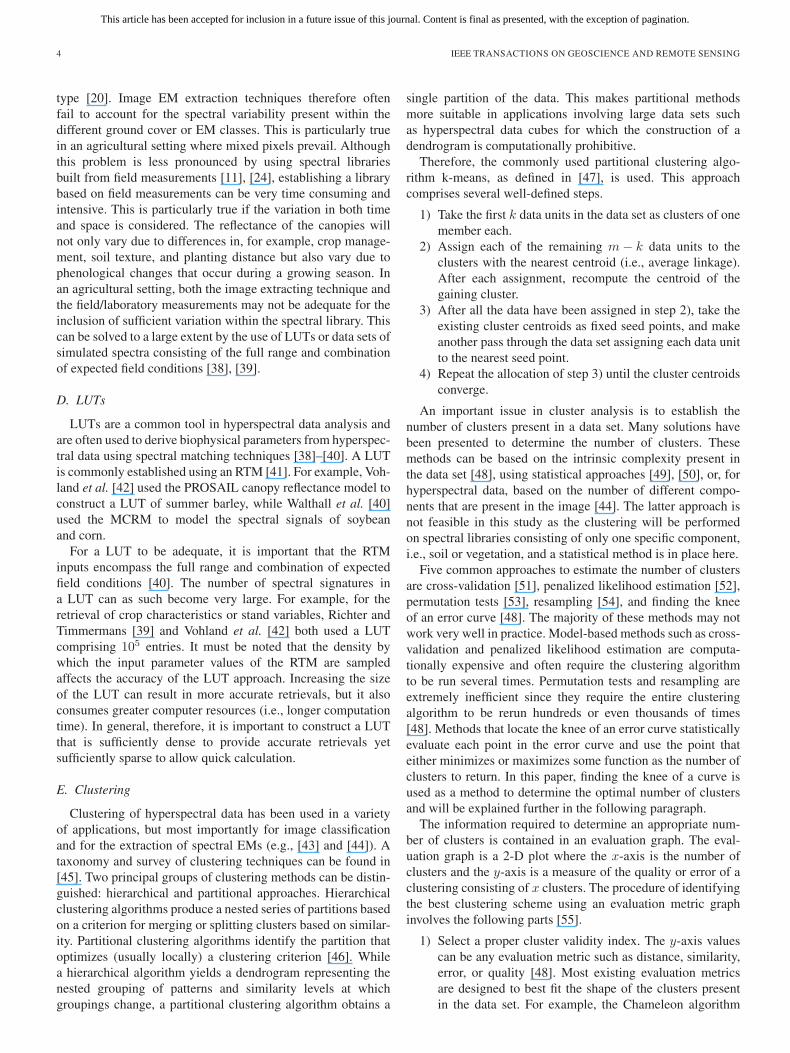
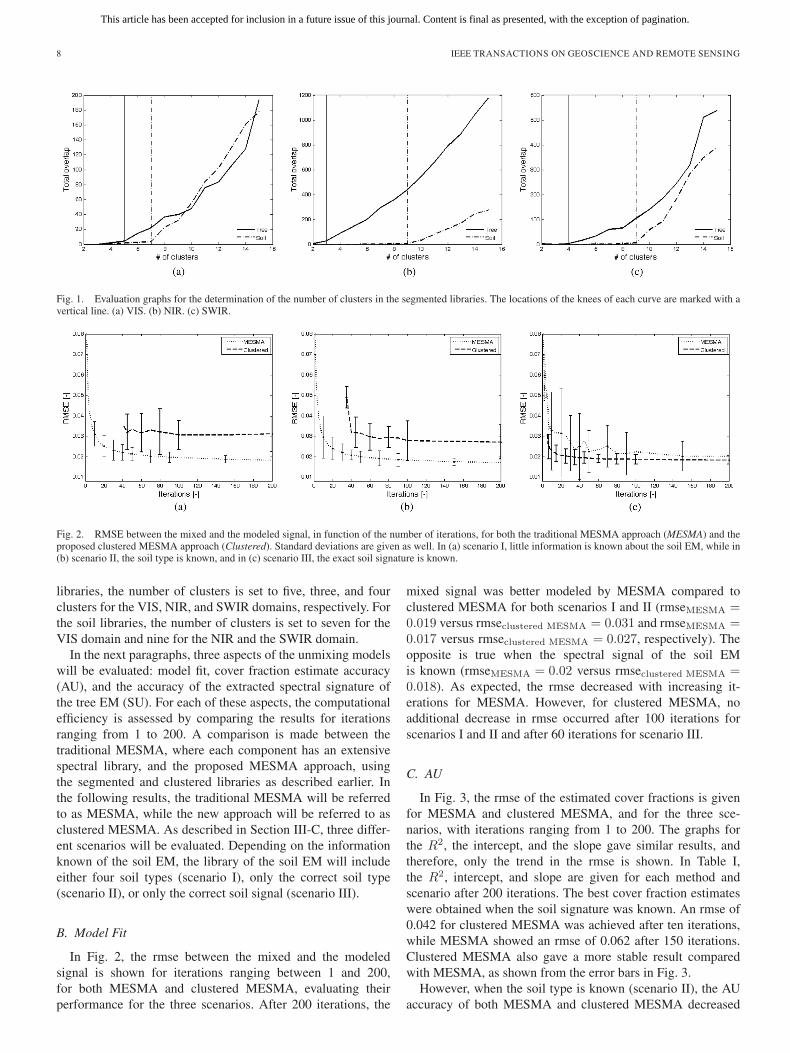
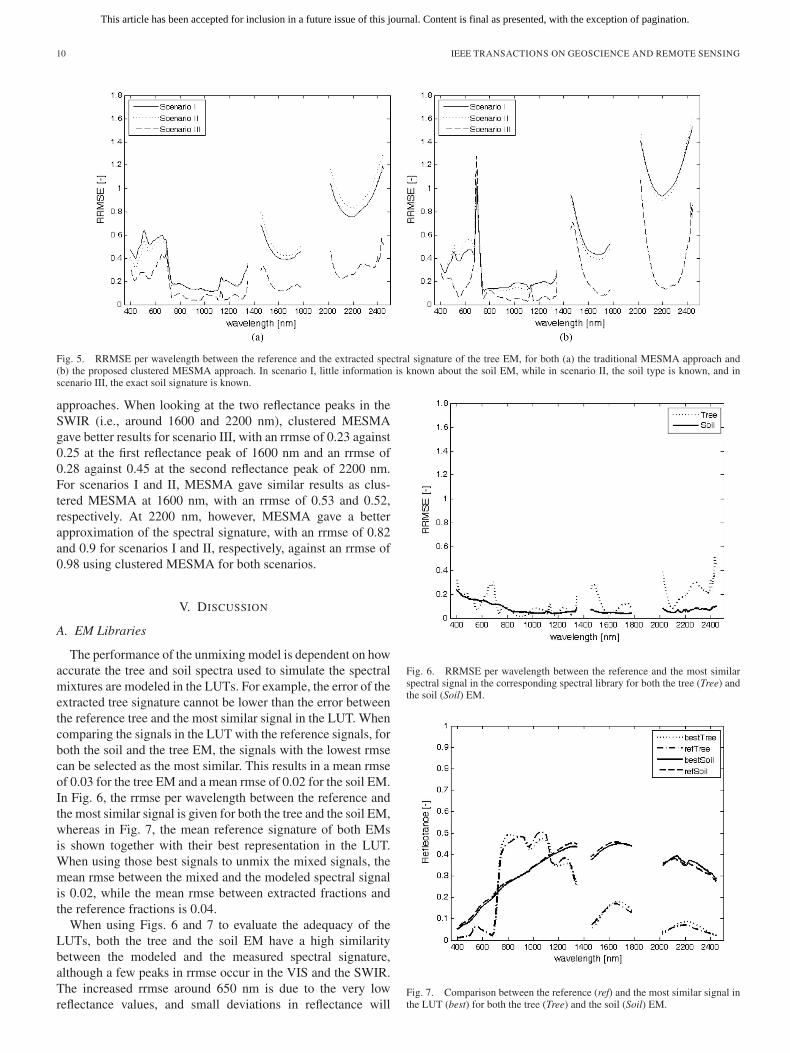
Fig. 4. RMSE between the reference and the extracted spectral signature of the tree EM, in function of the number of iterations, for both the traditional MESMAapproach (MESMA) and the proposed clustered MESMA approach (Clustered). Standard deviations are given as well. In (a) scenario I, little information is knownabout the soil EM, while in (b) scenario II, the soil type is known, and in (c) scenario III, the exact soil signature is known.
to 0.15, although this accuracy can be achieved with less iter-ations for MESMA (i.e., 90 versus 200 iterations for clusteredMESMA). When no a priori information about the soil EM isknown (scenario I), clustered MESMA resulted in poor coverfraction estimates (rmse = 0.18), while MESMA maintainedits accuracy from scenario II (rmse = 0.15).
D. SU
In Fig. 4, the rmse between the spectral signature of thetree EM extracted from the mixed signal and the referencespectral signature is shown for both the clustered MESMA andMESMA, for the three scenarios, with iterations ranging from 1to 200. Contrary to the previous results, clustered MESMA ex-tracted the tree signature with a higher accuracy than MESMA,independent of the soil EM scenario. The best results wereobtained when the soil EM signature is known (scenario III),with an rmse of 0.038 which was obtained after approximately
30 iterations. MESMA, on the other hand, needed 150 iterationsto reach an rmse of 0.044. For scenario II, these errors increasedto 0.097 after 40 iterations for clustered MESMA and 0.11 after200 iterations for MESMA. For scenario I, the rmse increasedfurther for clustered MESMA to 0.10 after 80 iterations, whilethe accuracy increased for MESMA to an rmse of 0.10 after200 iterations.
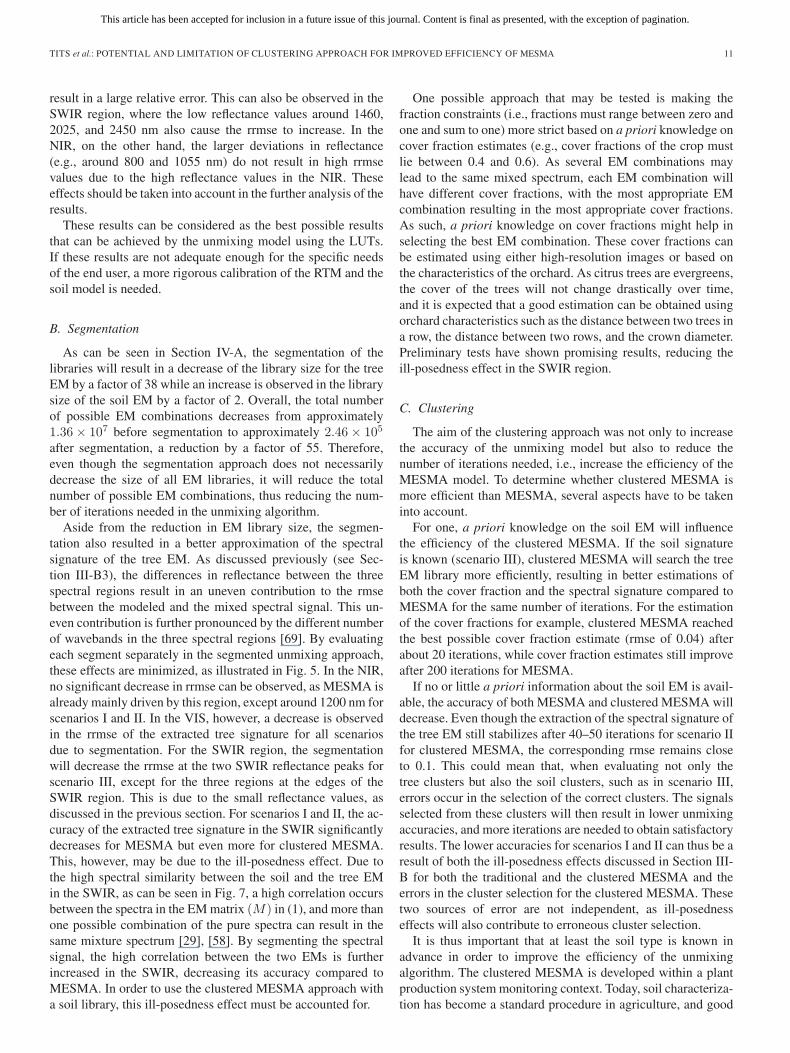
In Fig. 5, the accuracy of the extracted tree signatures after200 iterations is given per wavelength. In the VIS, clusteredMESMA resulted in a better approximation of the spectral sig-nature of the tree, particularly around the green peak (550 nm).At this peak, the rrmse for clustered MESMA was 0.52 and0.14 for scenarios I and II and scenario III, respectively, whilefor MESMA, the rrmse increased to 0.56 and 0.29, respec-tively.When comparing both MESMA approaches in the NIR,the results were very similar, with an rrmse around 0.29 forMESMA and 0.28 for clustered MESMA for scenarios I and II.For scenario III, the rrmse ranged around 0.16 for both
This article has been accepted for inclusion in a future issue of this journal. Content is final as presented, with the exception of pagination.
10 IEEE TRANSACTIONS ON GEOSCIENCE AND REMOTE SENSING
Fig. 5. RRMSE per wavelength between the reference and the extracted spectral signature of the tree EM, for both (a) the traditional MESMA approach and(b) the proposed clustered MESMA approach. In scenario I, little information is known about the soil EM, while in scenario II, the soil type is known, and inscenario III, the exact soil signature is known.
approaches. When looking at the two reflectance peaks in theSWIR (i.e., around 1600 and 2200 nm), clustered MESMAgave better results for scenario III, with an rrmse of 0.23 against0.25 at the first reflectance peak of 1600 nm and an rrmse of0.28 against 0.45 at the second reflectance peak of 2200 nm.For scenarios I and II, MESMA gave similar results as clus-tered MESMA at 1600 nm, with an rrmse of 0.53 and 0.52,respectively. At 2200 nm, however, MESMA gave a betterapproximation of the spectral signature, with an rrmse of 0.82and 0.9 for scenarios I and II, respectively, against an rrmse of0.98 using clustered MESMA for both scenarios.
V. DISCUSSION
A. EM Libraries
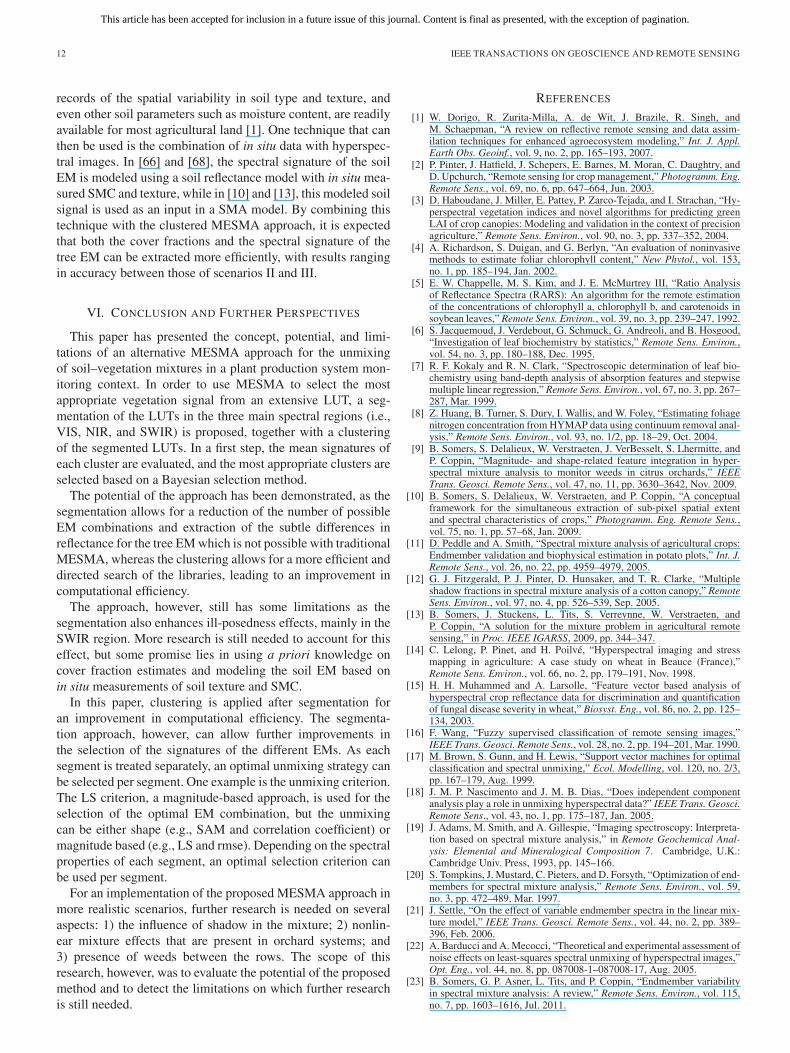
The performance of the unmixing model is dependent on howaccurate the tree and soil spectra used to simulate the spectralmixtures are modeled in the LUTs. For example, the error of theextracted tree signature cannot be lower than the error betweenthe reference tree and the most similar signal in the LUT. Whencomparing the signals in the LUT with the reference signals, forboth the soil and the tree EM, the signals with the lowest rmsecan be selected as the most similar. This results in a mean rmseof 0.03 for the tree EM and a mean rmse of 0.02 for the soil EM.In Fig. 6, the rrmse per wavelength between the reference andthe most similar signal is given for both the tree and the soil EM,whereas in Fig. 7, the mean reference signature of both EMsis shown together with their best representation in the LUT.When using those best signals to unmix the mixed signals, themean rmse between the mixed and the modeled spectral signalis 0.02, while the mean rmse between extracted fractions andthe reference fractions is 0.04.
When using Figs. 6 and 7 to evaluate the adequacy of theLUTs, both the tree and the soil EM have a high similaritybetween the modeled and the measured spectral signature,although a few peaks in rrmse occur in the VIS and the SWIR.The increased rrmse around 650 nm is due to the very lowreflectance values, and small deviations in reflectance will
Fig. 6. RRMSE per wavelength between the reference and the most similarspectral signal in the corresponding spectral library for both the tree (Tree) andthe soil (Soil) EM.
Fig. 7. Comparison between the reference (ref) and the most similar signal inthe LUT (best) for both the tree (Tree) and the soil (Soil) EM.
This article has been accepted for inclusion in a future issue of this journal. Content is final as presented, with the exception of pagination.
TITS et al.: POTENTIAL AND LIMITATION OF CLUSTERING APPROACH FOR IMPROVED EFFICIENCY OF MESMA 11
result in a large relative error. This can also be observed in theSWIR region, where the low reflectance values around 1460,2025, and 2450 nm also cause the rrmse to increase. In theNIR, on the other hand, the larger deviations in reflectance(e.g., around 800 and 1055 nm) do not result in high rrmsevalues due to the high reflectance values in the NIR. Theseeffects should be taken into account in the further analysis of theresults.
These results can be considered as the best possible resultsthat can be achieved by the unmixing model using the LUTs.If these results are not adequate enough for the specific needsof the end user, a more rigorous calibration of the RTM and thesoil model is needed.
B. Segmentation
As can be seen in Section IV-A, the segmentation of thelibraries will result in a decrease of the library size for the treeEM by a factor of 38 while an increase is observed in the librarysize of the soil EM by a factor of 2. Overall, the total numberof possible EM combinations decreases from approximately1.36× 107 before segmentation to approximately 2.46× 10⁵
after segmentation, a reduction by a factor of 55. Therefore,even though the segmentation approach does not necessarilydecrease the size of all EM libraries, it will reduce the totalnumber of possible EM combinations, thus reducing the num-ber of iterations needed in the unmixing algorithm.
Aside from the reduction in EM library size, the segmen-tation also resulted in a better approximation of the spectralsignature of the tree EM. As discussed previously (see Sec-tion III-B3), the differences in reflectance between the threespectral regions result in an uneven contribution to the rmsebetween the modeled and the mixed spectral signal. This un-even contribution is further pronounced by the different numberof wavebands in the three spectral regions [69]. By evaluatingeach segment separately in the segmented unmixing approach,these effects are minimized, as illustrated in Fig. 5. In the NIR,no significant decrease in rrmse can be observed, as MESMA isalready mainly driven by this region, except around 1200 nm forscenarios I and II. In the VIS, however, a decrease is observedin the rrmse of the extracted tree signature for all scenariosdue to segmentation. For the SWIR region, the segmentationwill decrease the rrmse at the two SWIR reflectance peaks forscenario III, except for the three regions at the edges of theSWIR region. This is due to the small reflectance values, asdiscussed in the previous section. For scenarios I and II, the ac-curacy of the extracted tree signature in the SWIR significantlydecreases for MESMA but even more for clustered MESMA.This, however, may be due to the ill-posedness effect. Due tothe high spectral similarity between the soil and the tree EMin the SWIR, as can be seen in Fig. 7, a high correlation occursbetween the spectra in the EM matrix (M) in (1), and more thanone possible combination of the pure spectra can result in thesame mixture spectrum [29], [58]. By segmenting the spectralsignal, the high correlation between the two EMs is furtherincreased in the SWIR, decreasing its accuracy compared toMESMA. In order to use the clustered MESMA approach witha soil library, this ill-posedness effect must be accounted for.
One possible approach that may be tested is making thefraction constraints (i.e., fractions must range between zero andone and sum to one) more strict based on a priori knowledge oncover fraction estimates (e.g., cover fractions of the crop mustlie between 0.4 and 0.6). As several EM combinations maylead to the same mixed spectrum, each EM combination willhave different cover fractions, with the most appropriate EMcombination resulting in the most appropriate cover fractions.As such, a priori knowledge on cover fractions might help inselecting the best EM combination. These cover fractions canbe estimated using either high-resolution images or based onthe characteristics of the orchard. As citrus trees are evergreens,the cover of the trees will not change drastically over time,and it is expected that a good estimation can be obtained usingorchard characteristics such as the distance between two trees ina row, the distance between two rows, and the crown diameter.Preliminary tests have shown promising results, reducing theill-posedness effect in the SWIR region.
C. Clustering
The aim of the clustering approach was not only to increasethe accuracy of the unmixing model but also to reduce thenumber of iterations needed, i.e., increase the efficiency of theMESMA model. To determine whether clustered MESMA ismore efficient than MESMA, several aspects have to be takeninto account.
For one, a priori knowledge on the soil EM will influencethe efficiency of the clustered MESMA. If the soil signatureis known (scenario III), clustered MESMA will search the treeEM library more efficiently, resulting in better estimations ofboth the cover fraction and the spectral signature compared toMESMA for the same number of iterations. For the estimationof the cover fractions for example, clustered MESMA reachedthe best possible cover fraction estimate (rmse of 0.04) afterabout 20 iterations, while cover fraction estimates still improveafter 200 iterations for MESMA.
If no or little a priori information about the soil EM is avail-able, the accuracy of both MESMA and clustered MESMA willdecrease. Even though the extraction of the spectral signature ofthe tree EM still stabilizes after 40–50 iterations for scenario IIfor clustered MESMA, the corresponding rmse remains closeto 0.1. This could mean that, when evaluating not only thetree clusters but also the soil clusters, such as in scenario III,errors occur in the selection of the correct clusters. The signalsselected from these clusters will then result in lower unmixingaccuracies, and more iterations are needed to obtain satisfactoryresults. The lower accuracies for scenarios I and II can thus be aresult of both the ill-posedness effects discussed in Section III-B for both the traditional and the clustered MESMA and theerrors in the cluster selection for the clustered MESMA. Thesetwo sources of error are not independent, as ill-posednesseffects will also contribute to erroneous cluster selection.
It is thus important that at least the soil type is known inadvance in order to improve the efficiency of the unmixingalgorithm. The clustered MESMA is developed within a plantproduction system monitoring context. Today, soil characteriza-tion has become a standard procedure in agriculture, and good
This article has been accepted for inclusion in a future issue of this journal. Content is final as presented, with the exception of pagination.
12 IEEE TRANSACTIONS ON GEOSCIENCE AND REMOTE SENSING
records of the spatial variability in soil type and texture, andeven other soil parameters such as moisture content, are readilyavailable for most agricultural land [1]. One technique that canthen be used is the combination of in situ data with hyperspec-tral images. In [66] and [68], the spectral signature of the soilEM is modeled using a soil reflectance model with in situ mea-sured SMC and texture, while in [10] and [13], this modeled soilsignal is used as an input in a SMA model. By combining thistechnique with the clustered MESMA approach, it is expectedthat both the cover fractions and the spectral signature of thetree EM can be extracted more efficiently, with results rangingin accuracy between those of scenarios II and III.
VI. CONCLUSION AND FURTHER PERSPECTIVES
This paper has presented the concept, potential, and limi-tations of an alternative MESMA approach for the unmixingof soil–vegetation mixtures in a plant production system mon-itoring context. In order to use MESMA to select the mostappropriate vegetation signal from an extensive LUT, a seg-mentation of the LUTs in the three main spectral regions (i.e.,VIS, NIR, and SWIR) is proposed, together with a clusteringof the segmented LUTs. In a first step, the mean signatures ofeach cluster are evaluated, and the most appropriate clusters areselected based on a Bayesian selection method.
The potential of the approach has been demonstrated, as thesegmentation allows for a reduction of the number of possibleEM combinations and extraction of the subtle differences inreflectance for the tree EM which is not possible with traditionalMESMA, whereas the clustering allows for a more efficient anddirected search of the libraries, leading to an improvement incomputational efficiency.
The approach, however, still has some limitations as thesegmentation also enhances ill-posedness effects, mainly in theSWIR region. More research is still needed to account for thiseffect, but some promise lies in using a priori knowledge oncover fraction estimates and modeling the soil EM based onin situ measurements of soil texture and SMC.
In this paper, clustering is applied after segmentation foran improvement in computational efficiency. The segmenta-tion approach, however, can allow further improvements inthe selection of the signatures of the different EMs. As eachsegment is treated separately, an optimal unmixing strategy canbe selected per segment. One example is the unmixing criterion.The LS criterion, a magnitude-based approach, is used for theselection of the optimal EM combination, but the unmixingcan be either shape (e.g., SAM and correlation coefficient) ormagnitude based (e.g., LS and rmse). Depending on the spectralproperties of each segment, an optimal selection criterion canbe used per segment.
For an implementation of the proposed MESMA approach inmore realistic scenarios, further research is needed on severalaspects: 1) the influence of shadow in the mixture; 2) nonlin-ear mixture effects that are present in orchard systems; and3) presence of weeds between the rows. The scope of thisresearch, however, was to evaluate the potential of the proposedmethod and to detect the limitations on which further researchis still needed.
REFERENCES
[1] W. Dorigo, R. Zurita-Milla, A. de Wit, J. Brazile, R. Singh, andM. Schaepman, “A review on reflective remote sensing and data assim-ilation techniques for enhanced agroecosystem modeling,” Int. J. Appl.Earth Obs. Geoinf., vol. 9, no. 2, pp. 165–193, 2007.
[2] P. Pinter, J. Hatfield, J. Schepers, E. Barnes, M. Moran, C. Daughtry, andD. Upchurch, “Remote sensing for crop management,” Photogramm. Eng.Remote Sens., vol. 69, no. 6, pp. 647–664, Jun. 2003.
[3] D. Haboudane, J. Miller, E. Pattey, P. Zarco-Tejada, and I. Strachan, “Hy-perspectral vegetation indices and novel algorithms for predicting greenLAI of crop canopies: Modeling and validation in the context of precisionagriculture,” Remote Sens. Environ., vol. 90, no. 3, pp. 337–352, 2004.
[4] A. Richardson, S. Duigan, and G. Berlyn, “An evaluation of noninvasivemethods to estimate foliar chlorophyll content,” New Phytol., vol. 153,no. 1, pp. 185–194, Jan. 2002.
[5] E. W. Chappelle, M. S. Kim, and J. E. McMurtrey III, “Ratio Analysisof Reflectance Spectra (RARS): An algorithm for the remote estimationof the concentrations of chlorophyll a, chlorophyll b, and carotenoids insoybean leaves,” Remote Sens. Environ., vol. 39, no. 3, pp. 239–247, 1992.
[6] S. Jacquemoud, J. Verdebout, G. Schmuck, G. Andreoli, and B. Hosgood,“Investigation of leaf biochemistry by statistics,” Remote Sens. Environ.,vol. 54, no. 3, pp. 180–188, Dec. 1995.
[7] R. F. Kokaly and R. N. Clark, “Spectroscopic determination of leaf bio-chemistry using band-depth analysis of absorption features and stepwisemultiple linear regression,” Remote Sens. Environ., vol. 67, no. 3, pp. 267–287, Mar. 1999.
[8] Z. Huang, B. Turner, S. Dury, I. Wallis, and W. Foley, “Estimating foliagenitrogen concentration from HYMAP data using continuum removal anal-ysis,” Remote Sens. Environ., vol. 93, no. 1/2, pp. 18–29, Oct. 2004.
[9] B. Somers, S. Delalieux, W. Verstraeten, J. VerBesselt, S. Lhermitte, andP. Coppin, “Magnitude- and shape-related feature integration in hyper-spectral mixture analysis to monitor weeds in citrus orchards,” IEEETrans. Geosci. Remote Sens., vol. 47, no. 11, pp. 3630–3642, Nov. 2009.
[10] B. Somers, S. Delalieux, W. Verstraeten, and P. Coppin, “A conceptualframework for the simultaneous extraction of sub-pixel spatial extentand spectral characteristics of crops,” Photogramm. Eng. Remote Sens.,vol. 75, no. 1, pp. 57–68, Jan. 2009.
[11] D. Peddle and A. Smith, “Spectral mixture analysis of agricultural crops:Endmember validation and biophysical estimation in potato plots,” Int. J.Remote Sens., vol. 26, no. 22, pp. 4959–4979, 2005.
[12] G. J. Fitzgerald, P. J. Pinter, D. Hunsaker, and T. R. Clarke, “Multipleshadow fractions in spectral mixture analysis of a cotton canopy,” RemoteSens. Environ., vol. 97, no. 4, pp. 526–539, Sep. 2005.
[13] B. Somers, J. Stuckens, L. Tits, S. Verreynne, W. Verstraeten, andP. Coppin, “A solution for the mixture problem in agricultural remotesensing,” in Proc. IEEE IGARSS, 2009, pp. 344–347.
[14] C. Lelong, P. Pinet, and H. Poilvé, “Hyperspectral imaging and stressmapping in agriculture: A case study on wheat in Beauce (France),”Remote Sens. Environ., vol. 66, no. 2, pp. 179–191, Nov. 1998.
[15] H. H. Muhammed and A. Larsolle, “Feature vector based analysis ofhyperspectral crop reflectance data for discrimination and quantificationof fungal disease severity in wheat,” Biosyst. Eng., vol. 86, no. 2, pp. 125–134, 2003.
[16] F. Wang, “Fuzzy supervised classification of remote sensing images,”IEEE Trans. Geosci. Remote Sens., vol. 28, no. 2, pp. 194–201, Mar. 1990.
[17] M. Brown, S. Gunn, and H. Lewis, “Support vector machines for optimalclassification and spectral unmixing,” Ecol. Modelling, vol. 120, no. 2/3,pp. 167–179, Aug. 1999.
[18] J. M. P. Nascimento and J. M. B. Dias, “Does independent componentanalysis play a role in unmixing hyperspectral data?” IEEE Trans. Geosci.Remote Sens., vol. 43, no. 1, pp. 175–187, Jan. 2005.
[19] J. Adams, M. Smith, and A. Gillespie, “Imaging spectroscopy: Interpreta-tion based on spectral mixture analysis,” in Remote Geochemical Anal-ysis: Elemental and Mineralogical Composition 7. Cambridge, U.K.:Cambridge Univ. Press, 1993, pp. 145–166.
[20] S. Tompkins, J. Mustard, C. Pieters, and D. Forsyth, “Optimization of end-members for spectral mixture analysis,” Remote Sens. Environ., vol. 59,no. 3, pp. 472–489, Mar. 1997.
[21] J. Settle, “On the effect of variable endmember spectra in the linear mix-ture model,” IEEE Trans. Geosci. Remote Sens., vol. 44, no. 2, pp. 389–396, Feb. 2006.
[22] A. Barducci and A. Mecocci, “Theoretical and experimental assessment ofnoise effects on least-squares spectral unmixing of hyperspectral images,”Opt. Eng., vol. 44, no. 8, pp. 087008-1–087008-17, Aug. 2005.
[23] B. Somers, G. P. Asner, L. Tits, and P. Coppin, “Endmember variabilityin spectral mixture analysis: A review,” Remote Sens. Environ., vol. 115,no. 7, pp. 1603–1616, Jul. 2011.
This article has been accepted for inclusion in a future issue of this journal. Content is final as presented, with the exception of pagination.
TITS et al.: POTENTIAL AND LIMITATION OF CLUSTERING APPROACH FOR IMPROVED EFFICIENCY OF MESMA 13
[24] D. A. Roberts, M. Gardner, R. Church, S. Ustin, G. Scheer, andR. O. Green, “Mapping chaparral in the Santa Monica Mountains usingmultiple endmember spectral mixture models,” Remote Sens. Environ.,vol. 65, no. 3, pp. 267–279, 1998.
[25] G. Fitzgerald, S. Maas, and W. Detar, “Spider mite detection and canopycomponent mapping in cotton using hyperspectral imagery and spectralmixture analysis,” Precision Agriculture, vol. 5, pp. 275–289, 2004.
[26] D. A. Roberts, P. Dennison, S. L. Ustin, E. Reith, and M. Morais, “De-velopment of a regionally specific library for the Santa Monica Moun-tains using high resolution AVIRIS data,” in Proc. 8th AVIRIS Earth Sci.Workshop, 1999, pp. 6–20.
[27] D. Rogge, B. Rivard, J. Zhang, and J. Feng, “Iterative spectral unmixingfor optimizing per-pixel endmember sets,” IEEE Trans. Geosci. RemoteSens., vol. 44, no. 12, pp. 3725–3736, Dec. 2006.
[28] B. Somers, J. Verbesselt, E. Ampe, N. Sims, W. Verstraeten, andP. Coppin, “Spectral mixture analysis to monitor defoliation in mixed-aged Eucalyptus globulus Labill plantations in southern Australia usingLandsat 5-TM and EO-1 Hyperion data,” Int. J. Appl. Earth Obs. Geoinf.,vol. 12, no. 4, pp. 270–277, Aug. 2010.
[29] M. Petrou and P. Foschi, “Confidence in linear spectral unmixing of singlepixels,” IEEE Trans. Geosci. Remote Sens., vol. 37, no. 1, pp. 624–626,Jan. 1999.
[30] F. Garcia-Haro, S. Sommer, and T. Kemper, “A new tool for variable mul-tiple endmember spectral mixture analysis (VMESMA),” Int. J. RemoteSens., vol. 26, no. 10, pp. 2135–2162, 2005.
[31] B. Somers, K. Cools, S. Delalieux, J. Stuckens, D. V. der Zande,W. Verstraeten, and P. Coppin, “Nonlinear hyperspectral mixture analysisfor tree cover estimates in orchards,” Remote Sens. Environ., vol. 113,no. 6, pp. 1183–1193, Jun. 2009.
[32] T. Ray and B. Murray, “Nonlinear spectral mixing in desert vegetation,”Remote Sens. Environ., vol. 55, no. 1, pp. 59–64, Jan. 1996.
[33] C. Borel and S. Gerstl, “Nonlinear spectral mixing models for vegetativeand soil surfaces,” Remote Sens. Environ., vol. 47, no. 3, pp. 403–416,Mar. 1994.
[34] J. Adams, D. Sabol, V. Kapos, R. A. Filho, D. Roberts, M. Smith,and A. Gillespie, “Classification of multispectral images based on frac-tions of endmembers—Application to land-cover change in the BrazilianAmazon,” Remote Sens. Environ., vol. 52, no. 2, pp. 137–154, 1995.
[35] A. Plaza, P. Martinez, R. Perez, and J. Plaza, “A quantitative and com-parative analysis of endmember extraction algorithms from hyperspectraldata,” IEEE Trans. Geosci. Remote Sens., vol. 42, no. 3, pp. 650–663,Mar. 2004.
[36] A. Plaza and C. Chang, “Impact of initialization on design of endmemberextraction algorithms,” IEEE Trans. Geosci. Remote Sens., vol. 44, no. 11,pp. 3397–3407, Nov. 2006.
[37] M. Theseira, G. Thomas, J. Taylor, F. Gemmell, and J. Varjo, “Sensitivityof mixture modelling to end-member selection,” Int. J. Remote Sens.,vol. 24, no. 7, pp. 1559–1575, 2003.
[38] R. Casa and H. Jones, “Retrieval of crop canopy properties: A comparisonbetween model inversion from hyperspectral data and image classifica-tion,” Int. J. Remote Sens., vol. 25, no. 6, pp. 1119–1130, 2004.
[39] K. Richter and W. J. Timmermans, “Physically based retrieval of cropcharacteristics for improved water use estimates,” Hydrol. Earth Syst. Sci.,vol. 13, no. 5, pp. 663–674, 2009.
[40] C. Walthall, W. Dulaney, M. Anderson, J. Norman, H. Fang, and S. Liang,“A comparison of empirical and neural network approaches for estimatingcorn and soybean leaf area index from Landsat ETM+ imagery,” RemoteSens. Environ., vol. 92, no. 4, pp. 465–474, Sep. 2004.
[41] C. Mobley, L. Sundman, C. Davis, J. Bowles, T. Downes, R. Leathers,M. Montes, W. Bissett, D. Kohler, R. Reid, E. Louchard, andA. Gleason, “Interpretation of hyperspectral remote-sensing imagery byspectrum matching and look-up tables,” Appl. Opt., vol. 44, no. 17,pp. 3576–3592, Jun. 2005.
[42] M. Vohland, S. Mader, and W. Dorigo, “Applying different inversiontechniques to retrieve stand variables of summer barley with PROSPECTplus SAIL,” Int. J. Appl. Earth Obs. Geoinf., vol. 12, no. 2, pp. 71–80,2010.
[43] C. C. Funk, J. Theiler, D. A. Roberts, and C. C. Borel, “Clustering toimprove matched filter detection of weak gas plumes in hyperspectralthermal imagery,” IEEE Trans. Geosci. Remote Sens., vol. 39, no. 7,pp. 1410–1420, Jul. 2001.
[44] P. Zarco-Tejada, S. Ustin, and M. Whiting, “Temporal and spatial rela-tionships between within-field yield variability in cotton and high-spatialhyperspectral remote sensing imagery,” Agronomy J., vol. 97, no. 3,pp. 641–653, 2005.
[45] J. Hartigan, Clustering Algorithms. New York: Wiley, 1975, ser. Proba-bility and Mathematical Statistics.
[46] A. Jain, M. Murty, and P. Flynn, “Data clustering: A review,” ACMComput. Surv., vol. 31, no. 3, pp. 264–323, Sep. 1999.
[47] J. MacQueen, “Some methods for classification and analysis of multivari-ate observations,” in Proc. 5th Berkeley Symp. Math. Statist. Probability,1967, vol. 1, pp. 281–297.
[48] S. Salvador and P. Chan, “Determining the number of clusters/segmentsin hierarchical clustering/segmentation algorithms,” Dept. Comput. Sci.,Florida Inst. Technol., Melbourne, FL, Tech. Rep. CS-2003-18, 2003.
[49] M. Yan and K. Ye, “Determining the number of clusters using theweighted gap statistic,” Biometrics, vol. 63, no. 4, pp. 1031–1037,Dec. 2007.
[50] C. Arima, K. Hakamada, M. Okamoto, and T. Hanai, “Modified fuzzygap statistic for estimating preferable number of clusters in fuzzyk-means clustering,” J. Biosci. Bioeng., vol. 105, no. 3, pp. 273–281,Mar. 2008.
[51] G. Sheikholeslami, S. Chatterjee, and A. Zhang, “WaveCluster: A multi-resolution clustering approach for very large spatial databases,” in Proc.24th Int. Conf. Very-Large Databases, 1998, pp. 428–439, ConferencePaper.
[52] C. Fraley and A. Raftery, “How many clusters? Which clustering method?Answers via model-based cluster analysis,” Comput. J., vol. 41, no. 8,pp. 578–588, 1998.
[53] K. T. Vasko and H. T. T. Toivonen, “Estimating the number of segmentsin time series data using permutation tests,” in Proc. IEEE ICDM, 2002,pp. 466–473.
[54] V. Roth, T. Lange, M. Braun, and J. Buhmann, “A resampling approach tocluster validation,” in Proc. Compstat, 2002, pp. 123–128.
[55] Q. Zhao, V. Hautamaki, and P. Fränti, “Knee point detection in BIC fordetecting the number of clusters,” in Advanced Concepts for Intelligent Vi-sion Systems, vol. 5259. Berlin/Heidelberg, Germany: Springer-Verlag,2008, pp. 664–673.
[56] G. Karypis, E. Han, and V. Kumar, “Chameleon: Hierarchical cluster-ing using dynamic modeling,” Computer, vol. 32, no. 8, pp. 68–75,Aug. 1999.
[57] “FAO world reference base for soil resources,” Food Agriculture Org. UN,Rome, Italy, World Soil Resource Rep. 84, 1998.
[58] B. Somers, S. Delalieux, W. Verstraeten, J. van Aardt, G. Albrigo, andP. Coppin, “An automated waveband selection technique for optimizedhyperspectral mixture analysis,” Int. J. Remote Sens., vol. 31, no. 20,pp. 5549–5568, Jun. 2010.
[59] C. Song, “Spectral mixture analysis for subpixel vegetation fractionsin the urban environment: How to incorporate endmember variability?”Remote Sens. Environ., vol. 95, no. 2, pp. 248–263, Mar. 2005.
[60] G. Asner and D. Lobell, “A biogeophysical approach for automated SWIRunmixing of soils and vegetation,” Remote Sens. Environ., vol. 74, no. 1,pp. 99–112, Oct. 2000.
[61] A. Kuusk, “A Markov-chain model of canopy reflectance,” AgriculturalForest Meteorol., vol. 76, no. 3/4, pp. 221–236, 1995.
[62] S. Jacquemoud and F. Baret, “Prospect—A model of leaf optical proper-ties spectra,” Remote Sens. Environ., vol. 34, no. 2, pp. 75–91, 1990.
[63] J. Stuckens, B. Somers, S. Delalieux, W. W. Verstraeten, and P. Coppin,“The impact of common assumptions on canopy radiative transfer simula-tions: A case study in Citrus orchards,” J. Geophys. Res. Atmos., vol. 110,no. 1/2, pp. 1–21, Jan. 2009.
[64] B. Somers, S. Delalieux, W. Verstraeten, A. V. Eynde, G. H. Barry, andP. Coppin, “The contribution of the fruit component to the hyperspectralcitrus canopy signal,” Photogramm. Eng. Remote Sens., vol. 76, no. 1,pp. 37–47, 2010.
[65] E. Muller and H. Décamps, “Modeling soil moisture-reflectance,” RemoteSens. Environ., vol. 76, no. 2, pp. 173–180, May 2001.
[66] D. Lobell and G. Asner, “Moisture effects on soil reflectance,” Soil Sci.Soc. Amer. J., vol. 66, no. 3, pp. 722–727, May 2002.
[67] L. Weidong, F. Baret, G. Xingfa, T. Qingxi, Z. Lanfen, and Z. Bing,“Relating soil surface moisture to reflectance,” Remote Sens. Environ.,vol. 81, no. 2/3, pp. 238–246, Aug. 2002.
[68] B. Somers, V. Gysels, W. W. Verstraeten, S. Delalieux, and P. Coppin,“Modelling moisture-induced soil reflectance changes in cultivated sandysoils: A case study in citrus orchards,” Eur. J. Soil Sci., vol. 61, no. 6,pp. 1091–1105, Dec. 2010.
[69] B. Somers, S. Delalieux, J. Stuckens, W. W. Verstraeten, and P. Coppin, “Aweighted linear spectral mixture analysis approach to address endmem-ber variability in agricultural production systems,” Int. J. Remote Sens.,vol. 30, no. 1, pp. 139–147, Jan. 2009.
[70] N. Dobigeon, S. Moussaoui, M. Coulon, J. Tourneret, and A. O. Hero,“Bayesian algorithms for supervised, semi-supervides, and unsupervisedunmixing of hyperspectral images,” Traitement du Signal, vol. 27, pp. 79–108, 2010.
This article has been accepted for inclusion in a future issue of this journal. Content is final as presented, with the exception of pagination.
14 IEEE TRANSACTIONS ON GEOSCIENCE AND REMOTE SENSING
Laurent Tits received the M.Sc. degree in bio-science engineering (land and forest management)from the Katholieke Universiteit Leuven (K.U.Leuven), Leuven, Belgium, in 2009, where he iscurrently working toward the Ph.D. degree withthe Geomatics Engineering Group, Department ofBiosystems.
Since 2010, he has been a Research Assistant withK.U. Leuven. His research interests include hyper-spectral remote sensing in perennial plant productionsystems with a specific focus on spectral mixture
analysis.
Ben Somers received the M.Sc. and Ph.D. de-grees in bioscience engineering (land and for-est management) from the Katholieke UniversiteitLeuven (K.U. Leuven), Leuven, Belgium, in 2005and 2009, respectively.
In 2010, he was a Research Associate with theGeomatics Engineering Group of the K.U. Leuven.Since 2011, he has been a Researcher with theFlemish Institute for Technological Research(VITO), Mol, Belgium. His research interests are thedesign of processing tools for hyperspectral remote
sensing with a specific focus on spectral mixture analysis and its application inprecision farming and forest ecology.
Pol Coppin received the M.Sc. degree in forestengineering from Ghent University, Ghent, Belgium,in 1977, and the Ph.D. degree from the University ofMinnesota, Minneapolis, in 1991.
He is the Dean of the Faculty of BioscienceEngineering and Chair Professor at the KatholiekeUniversiteit Leuven (K.U. Leuven), Leuven,Belgium. His research team, the Geomatics Engi-neering Group, forms part of the Division “Measure,Model and Manage Bio-responses” within theBiosystems Department and focuses on the monitor-
ing and modeling of plant production systems. He is the Project Leader onthe Flemish side for the joint Flemish–South African Integration of In Situand HyperSpectral remote sensing (IS-HS) program and responsible for thehyperspectral sensor, the electronic bundle-steered antenna, the transpondertechnology for onboard communication with ground sensor suites, and theintegrated monitoring and modeling of plant systems. His career spans 12years of professional experience (and many short-term missions afterward)in tropical and subtropical natural resource assessment and monitoring(1977–1988), followed by an academic career in the U.S. at the Universityof Minnesota and Purdue University, West Lafayette, IN (1988–1995), and inBelgium at the K.U. Leuven (since 1995).