Semiotic affordances and limitations of mathematical formalism
Upload
khangminh22Category
view
2download
0
Limitations of Label-Free Sensors in Serum Based Molecular Diagnostics
Manoj M. Varma1,2 1Center for Nano Science and Engineering, Indian Institute of Science, Bangalore
2Electrical Communication Engineering, Indian Institute of Science, Bangalore
Abstract
Immunoassay formats applicable for clinical or point-of-care diagnostics fall into two broad
classes. One which uses labeled secondary antibodies for signal transduction and the other which
does not require the use of any labels. Comparison of the limits of detection (LoD) reported by
these two sensing approaches over a wide range of detection techniques and target molecules in
serum revealed that labeled techniques achieve 2-3 orders of magnitude better LoDs. Further, a
vast majority of commercial tests and recent examples of technology translations are based on
labeled assay formats. In light of this data, it is argued that extension of traditional labeled
approaches and enhancing their functionality may have better clinical impact than the
development of newer label-free techniques.
Key words: Immunoassays, point-of-care testing, limits of biomarker detection
Is a “mobile phone revolution” possible in personalized diagnostics?
Ubiquitous access to Information and Communication Technology (ICT), particularly,
wireless communication technologies, has radically transformed our lives with mobile-enabled
technologies applied in areas ranging from education and entertainment to healthcare [1]. The
deep penetration of mobile technologies, even in economically underdeveloped nations, is
expected to provide better living conditions through mobile-enabled services in such countries.
Analogous to the mobile revolution, we would like to see a radical transformation in human
health monitoring enabled by ubiquitous access to affordable personal healthcare devices for
continuous monitoring of human health parameters. The health parameters may include
macroscopic state variables such as heart rate, ECG (Echocardiogram) and blood pressure as
well as microscopic state variables such as the concentration of biomarker (text in bold is a
glossary item) proteins in serum. One could use the example of ICT to imagine what the key
enablers for such a transformation in personal health monitoring would be. Firstly, there should
be sensing platforms or techniques where economies of scale can be applied to enable deep
global penetration through cost reduction. In the case of ICT, Silicon based integrated electronics
technology played this role [1]. In the case of personalized health monitoring it remains to be
seen if such a universal platform technology would emerge. Secondly, not only the hardware
cost, which is the capital expense, but also the recurring usage cost must be low. In the case of
ICT this was possible due to the same economies of scale operating in the Silicon semiconductor
manufacturing which led to low unit cost of data usage. In the case of healthcare devices, low
usage cost translates to low unit cost of testing in terms of consumables required such as sensors
and reagents. Finally, these devices must be easy to use with minimal user intervention required.
This is necessary for the widespread adoption of such technology and to encourage its frequent
use.
Methods for diagnostic testing: labeled and label-free Immunoassays
Currently health monitoring consists of a few simple tests which are possible at the
clinician’s office such as blood-pressure or ECG and a large number of tests requiring
centralized testing labs causing delays of up to a few days between testing and results [2,3]. As a
result, data from continuous monitoring of a given individual over his/her lifespan for parameters
even as simple as blood-pressure are not easily available. Such datasets collected over a large
number of individuals over time may reveal as yet undiscovered strategies for disease
management or prevention. For several diseases including certain cancers, early detection
exponentially improves the survival rate [4]. Even though one may not need day to day or even
weekly testing frequency in these cases, there is certainly arguable merit in the development of
sensing technologies which could perhaps be used at home and are capable of deep global
penetration making early diagnosis accessible across economic strata.
Diagnostic tests are typically done using blood samples and are generally based on the
immunoassay format where an antibody or a receptor is bound on a solid surface [5,6, Box 1].
These receptors bind the target biomarker from blood/serum or the sample under consideration.
Ambitious goals such as early cancer detection requires the detection of biomarkers present in
blood at extremely low concentrations with a high level of specificity using a system with few
process steps for ease of use [7, 8]. Two broad classes of biosensors emerge depending on how
the binding of target molecules is detected by the sensing instrument. The first class includes
gold standards such as ELISA (Enzyme Linked Immunosorbent Assay) where a secondary
antibody with a suitable label molecule conjugated to it, binds to the target-receptor complex
immobilized on the surface [Box 1]. A better alternative, to enable ease of use, would be to
detect the binding of the target molecules to the receptors directly without any secondary
antibody labels. This approach is called label-free detection. By eliminating the need for labels
and associated sample processing steps, label-free systems can potentially operate with minimal
or no user intervention. By combining this simplicity of testing with the ability to detect small
concentrations of biomarkers in complex samples such as serum, easy to use label-free sensors
hold the promise of radically transforming personalized health diagnostics in a way comparable
to the transformation of data communication with the advent of mobile phones.
Box 1: Immunoassay formatThe solid phase immunoassay format developed during the 60’s and 70’s is a method to detect the presence of proteins or other molecules a solid surface such as glass, nitrocellulose or (blue Y shaped objects in the figure) immobilized on the solid surface capture the target molecules (red spheres) from the sample containing other molecules (blue spheres) which may potentially interfere by binding to the antibodies. This is called nonbinding of the molecules (target or nonappropriately chosen surface blocking steps sentirely due to the interaction of the sample with the immobilized antibodies. Recently researchers have also developed other ways to capture target mo(specific DNA sequences), instead of antibodies. In general, the basic idea of immunoassay is that receptor molecules immobilized on a solid surface capture specific targets from a sample. In any given assay there will be someaccounted for while interpreting the measurement. depending on the detection of target receptor binding. conjugated with a label (blue Y shape with a green star attached to it) is used to bind to the target molecules captured by the immobilized antibodies making a sandwich structure. The signal is read out using properties of the label. For example, the labelwhich emits light with a certain colorcolored product as in ELISA tests The labeling process and the incubation with secondary steps as well as increases the usage cost of such tests. As a result, several groups hatechniques not requiring the use of labeoptical refractive index, electrical conductance or mass change associated with the capture of target molecules. Such assays are called labelantibodies.
Figure 1 Label
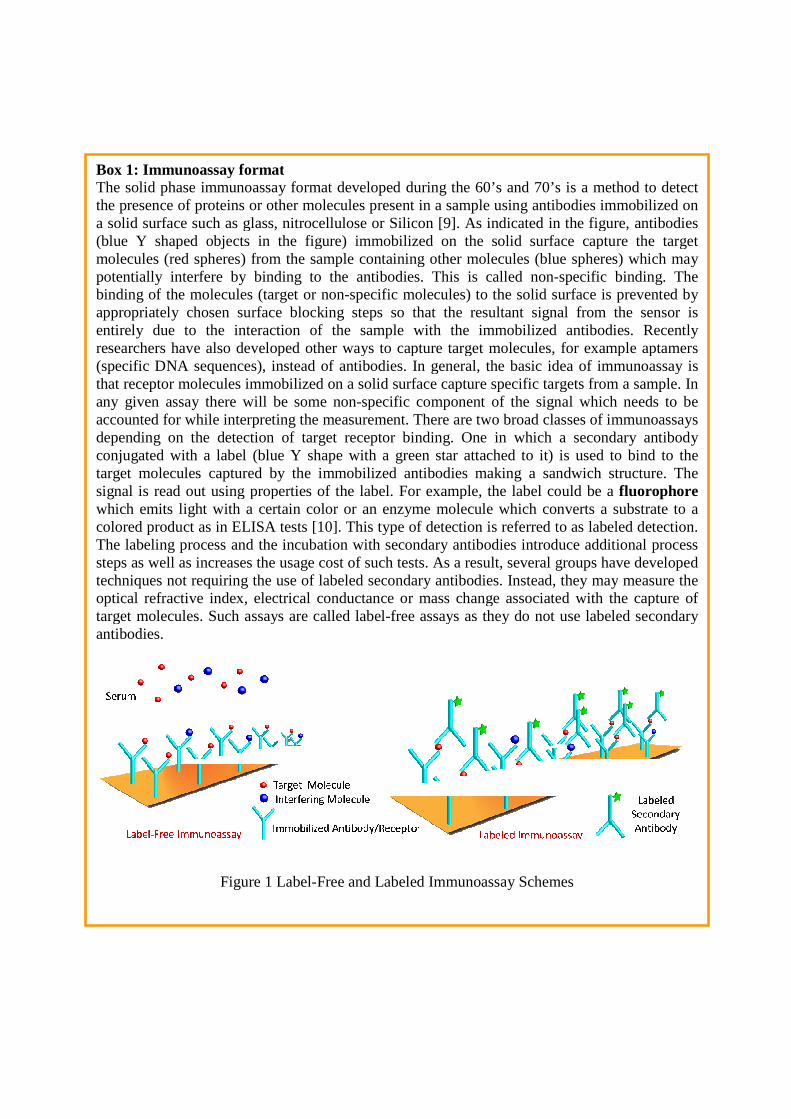
Box 1: Immunoassay format The solid phase immunoassay format developed during the 60’s and 70’s is a method to detect the presence of proteins or other molecules present in a sample using antibodies immobilized on
uch as glass, nitrocellulose or Silicon [9]. As indicated in the figure, (blue Y shaped objects in the figure) immobilized on the solid surface capture the target
d spheres) from the sample containing other molecules (blue spheres) which may potentially interfere by binding to the antibodies. This is called non-binding of the molecules (target or non-specific molecules) to the solid surface is
surface blocking steps so that the resultant signal fromdue to the interaction of the sample with the immobilized antibodies. Recently
researchers have also developed other ways to capture target molecules, for example aptamers (specific DNA sequences), instead of antibodies. In general, the basic idea of immunoassay is that receptor molecules immobilized on a solid surface capture specific targets from a sample. In any given assay there will be some non-specific component of the signal which needs to be accounted for while interpreting the measurement. There are two broad classes of immunoassays depending on the detection of target receptor binding. One in which a secondary antibody
label (blue Y shape with a green star attached to it) is used to bind to the target molecules captured by the immobilized antibodies making a sandwich structure. The
out using properties of the label. For example, the label could be a with a certain color or an enzyme molecule which converts a substrate to a
as in ELISA tests [10]. This type of detection is referred to ling process and the incubation with secondary antibodies introduce additional process
steps as well as increases the usage cost of such tests. As a result, several groups hatechniques not requiring the use of labeled secondary antibodies. Instead, they may
ndex, electrical conductance or mass change associated with the capture of target molecules. Such assays are called label-free assays as they do not use labeled secondary
Label-Free and Labeled Immunoassay Schemes
The solid phase immunoassay format developed during the 60’s and 70’s is a method to detect present in a sample using antibodies immobilized on
indicated in the figure, antibodies (blue Y shaped objects in the figure) immobilized on the solid surface capture the target
d spheres) from the sample containing other molecules (blue spheres) which may -specific binding. The
specific molecules) to the solid surface is prevented by o that the resultant signal from the sensor is
due to the interaction of the sample with the immobilized antibodies. Recently lecules, for example aptamers
(specific DNA sequences), instead of antibodies. In general, the basic idea of immunoassay is that receptor molecules immobilized on a solid surface capture specific targets from a sample. In
specific component of the signal which needs to be There are two broad classes of immunoassays
One in which a secondary antibody label (blue Y shape with a green star attached to it) is used to bind to the
target molecules captured by the immobilized antibodies making a sandwich structure. The could be a fluorophore
or an enzyme molecule which converts a substrate to a This type of detection is referred to as labeled detection.
antibodies introduce additional process steps as well as increases the usage cost of such tests. As a result, several groups have developed
tibodies. Instead, they may measure the ndex, electrical conductance or mass change associated with the capture of
free assays as they do not use labeled secondary
Free and Labeled Immunoassay Schemes
Comparison of limit of detection of labeled and label-free sensors
Label-free sensors have witnessed decades of development with a veritable zoo of
techniques available today exploiting physical effects as exotic as superconducting quantum
interference [11]. However, in spite of this intense activity, most real-world tests including FDA
approved tests are still based on labeled formats such as ELISA and immuno-fluorescence assays
[12] and almost all recent examples from literature describing translation of diagnostic
technology to real-world applications are also based on the labeled format [2,5-8,13-16]. It is
therefore very important now to critically compare the performance of labeled and label-free
technologies to understand if there are systematic reasons for the lack of prevalence for label-free
technologies. To assess the current state of performance of label-free techniques, I compared the
nearly 120 limit of detection (LoD) values reported for label-free and labeled methods for serum
based biomarker detection. There were significant differences in the surface functionalization
and assay protocols followed by different research groups reporting these LoDs. Consequently
such a comparison may suffer from biases arising from the sensitivity of the LoD to the specific
experimental protocols. To better compare these two approaches, I identified reports where
labeled and label-free assays were performed simultaneously, eliminating any bias arising from
differences in experimental protocols. Finally, I also examined recent examples describing
translation of sensing techniques into real-world applications. It was found that labeled
techniques significantly outperformed label-free techniques in all these contexts. In light of this
observation, I argue that extension of traditional labeled assays into lab-on-chip formats and
enhancing their performance using innovative signal read-out methods may have a better clinical
impact than the frenzied development of newer label-free techniques we have witnessed in recent
times.
The LoDs reported by various groups for a range of protein biomarkers, including those
related to cancer were examined [17-76]. The complete data set along with the search strings
used in the bibliographic database Web of Science [77] for literature survey is provided in
Supplmentary Data Table [78]. Only articles reporting LoDs in serum were considered. For each
category of data, namely, labeled and label-free, the cumulative distribution function (CDF)
[Box 2] of the reported LoD values was constructed. A metric referred here as LoD50 was
defined based on the CDF. The LoD50 is the LoD value for which the CDF function reaches the
mid-point. The LoD50 value therefore represents a kind of weighted average of the LoDs
reported for each category. There were 54 data points for labeled detection and 53 data points for
label-free detection making the comparison reasonable. Further, this comparison was done across
proteins ranging from 10 kDa to 600 kDa with assays varying in the antibodies/receptors used,
surface functionalization protocols and signal detection methods spanning mechanical, electrical,
electrochemical and optical domains involving techniques as wide as Surface Plasmon
Resonance, e.g. [41], micro-cantilevers, e.g. [51], fluorescence-immunoassays, e.g. [32], ELISA
e.g. [54], optical interferometry, e.g. [25] and Silicon nanowires, e.g. [26]. Therefore, the data
collected was a comprehensive representation of serum based labeled and label-free detection
approaches. In order to extract the LoD50 value in an objective manner, the data points were
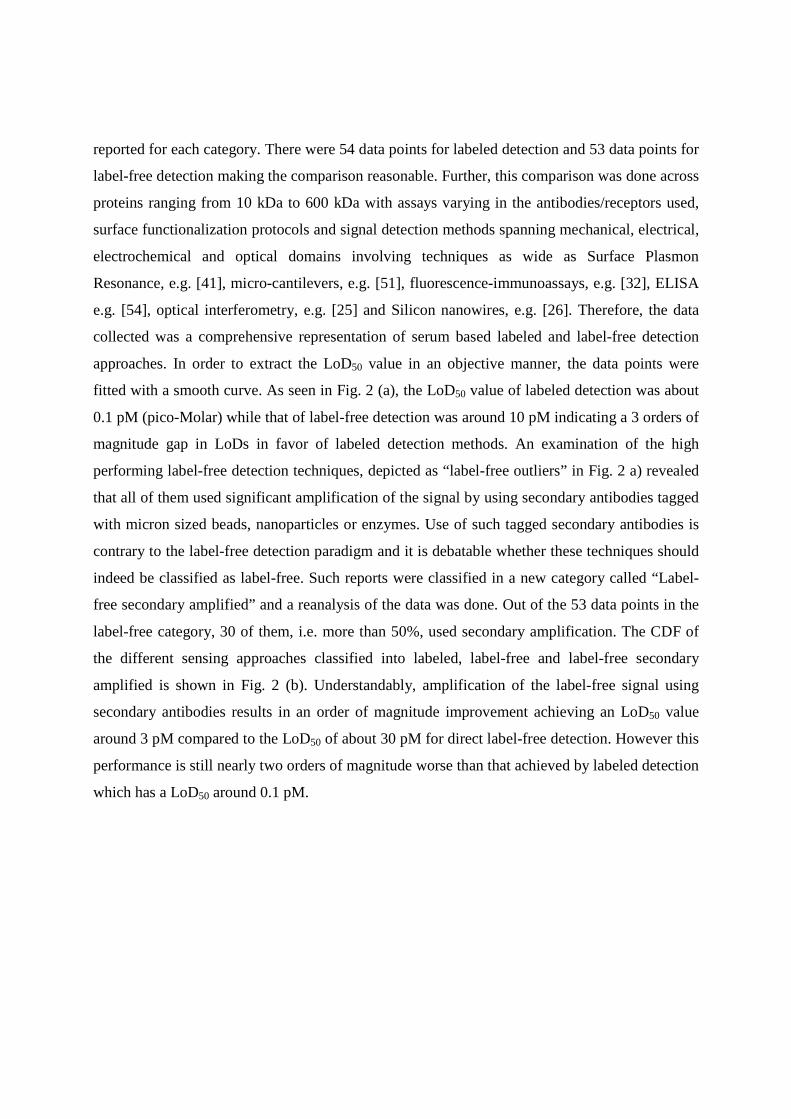
fitted with a smooth curve. As seen in Fig. 2 (a), the LoD50 value of labeled detection was about
0.1 pM (pico-Molar) while that of label-free detection was around 10 pM indicating a 3 orders of
magnitude gap in LoDs in favor of labeled detection methods. An examination of the high
performing label-free detection techniques, depicted as “label-free outliers” in Fig. 2 a) revealed
that all of them used significant amplification of the signal by using secondary antibodies tagged
with micron sized beads, nanoparticles or enzymes. Use of such tagged secondary antibodies is
contrary to the label-free detection paradigm and it is debatable whether these techniques should
indeed be classified as label-free. Such reports were classified in a new category called “Label-
free secondary amplified” and a reanalysis of the data was done. Out of the 53 data points in the
label-free category, 30 of them, i.e. more than 50%, used secondary amplification. The CDF of
the different sensing approaches classified into labeled, label-free and label-free secondary
amplified is shown in Fig. 2 (b). Understandably, amplification of the label-free signal using
secondary antibodies results in an order of magnitude improvement achieving an LoD50 value
around 3 pM compared to the LoD50 of about 30 pM for direct label-free detection. However this
performance is still nearly two orders of magnitude worse than that achieved by labeled detection
which has a LoD50 around 0.1 pM.
To check if there was any correlation between reported LoDs with the molecular mass of
the target biomarker, the data was re-plotted in the manner shown in Fig. 2 (c). The horizontal
axis is the reported LoD in pM (pico-molar) while the vertical axis is the molecular weight of the
target biomarker. Red, green and blue stripes represent labeled, label-free secondary amplified
and direct label-free LoDs respectively. We do not see any correlation associated with the
different targets considered. In other words the conclusions drawn from Figs. 2 (a) and (b) are
valid across the entire range of target biomarkers considered. The conclusion emerging from this
analysis is that labeled detection techniques are 2-3 orders of magnitude more sensitive than
label-free approaches and it is only after significant signal amplification using tagged secondary
antibodies that label-free approaches can attain similar performance.
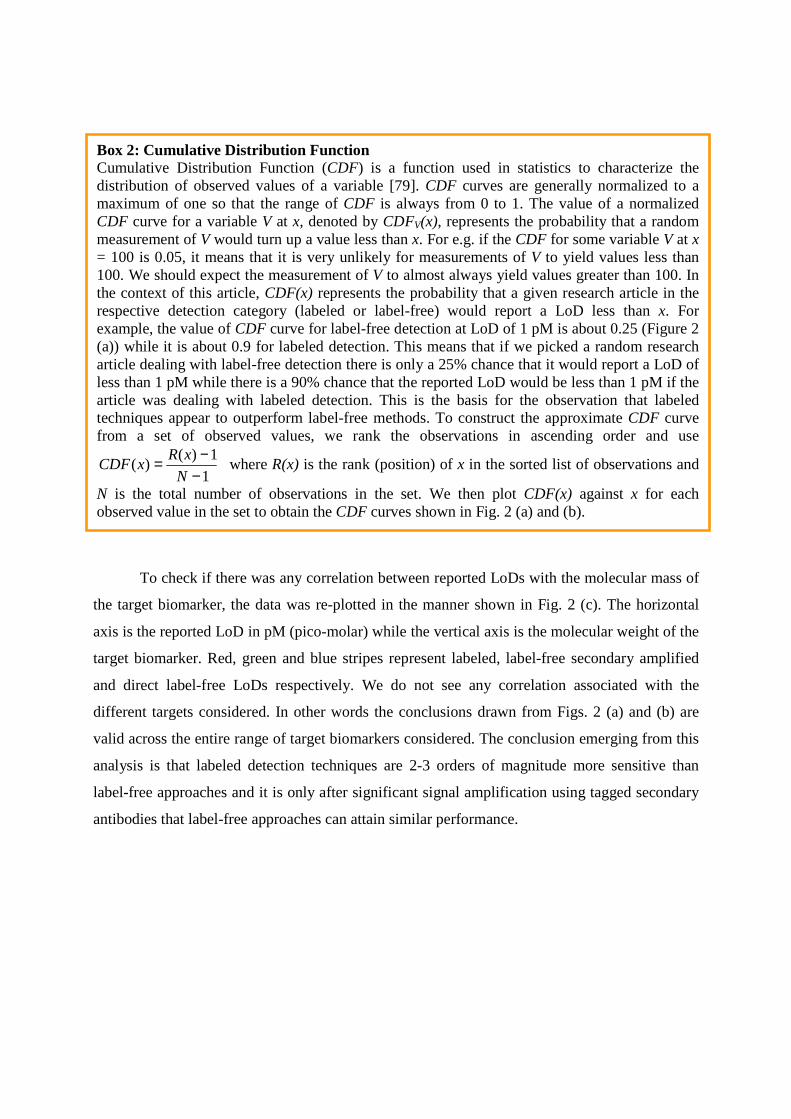
Box 2: Cumulative Distribution Function Cumulative Distribution Function (CDF) is a function used in statistics to characterize the distribution of observed values of a variable [79]. CDF curves are generally normalized to a maximum of one so that the range of CDF is always from 0 to 1. The value of a normalized CDF curve for a variable V at x, denoted by CDFV(x), represents the probability that a random measurement of V would turn up a value less than x. For e.g. if the CDF for some variable V at x = 100 is 0.05, it means that it is very unlikely for measurements of V to yield values less than 100. We should expect the measurement of V to almost always yield values greater than 100. In the context of this article, CDF(x) represents the probability that a given research article in the respective detection category (labeled or label-free) would report a LoD less than x. For example, the value of CDF curve for label-free detection at LoD of 1 pM is about 0.25 (Figure 2 (a)) while it is about 0.9 for labeled detection. This means that if we picked a random research article dealing with label-free detection there is only a 25% chance that it would report a LoD of less than 1 pM while there is a 90% chance that the reported LoD would be less than 1 pM if the article was dealing with labeled detection. This is the basis for the observation that labeled techniques appear to outperform label-free methods. To construct the approximate CDF curve from a set of observed values, we rank the observations in ascending order and use
1
1)()(
−−=
N
xRxCDF where R(x) is the rank (position) of x in the sorted list of observations and
N is the total number of observations in the set. We then plot CDF(x) against x for each observed value in the set to obtain the CDF curves shown in Fig. 2 (a) and (b).

Figure 2 Analysis of LoDs reported
curve) and label-free (black curve) LoDs. The LoD
labeled detection is two orders of magnitude better than that of label
that label-free techniques which signif
outliers in Fig. 2 (a)) used tagged secondary antibodies for
values were classified in a separate category called label
Sec Amp” in Fig. 2 (b)) and the CDF curves for the 3 categories were plotted in Fig.
Labeled techniques still outperformed label
by more than an order of magnitude based on the LoD
shows that there is no correlation between the achieved LoDs and the molecular weight of the
targeted biomarker. Red, green
and direct label-free LoDs respectively
labeled LoDs measured simultaneously in the same assay eliminating variations arising from
differences in experimental protocols. It is seen that every data point shows better performance
Analysis of LoDs reported in literature. Fig. 2 (a) shows the CDF [Box1] of labeled (red
free (black curve) LoDs. The LoD50, which represents a weighted average, of
orders of magnitude better than that of label-free detection. It was found
free techniques which significantly outperformed their peers (depicted as label
tagged secondary antibodies for signal amplification
values were classified in a separate category called label-free secondary amplified (
and the CDF curves for the 3 categories were plotted in Fig.
Labeled techniques still outperformed label-free techniques in spite of secondary amplification
by more than an order of magnitude based on the LoD50 values shown in Fig.
shows that there is no correlation between the achieved LoDs and the molecular weight of the
Red, green and blue stripes represent labeled, label-free secondary amplified
respectively. Fig. 2 (d) shows the comparison of direct label
labeled LoDs measured simultaneously in the same assay eliminating variations arising from
differences in experimental protocols. It is seen that every data point shows better performance
(a) shows the CDF [Box1] of labeled (red
, which represents a weighted average, of
free detection. It was found
(depicted as label-free
signal amplification. These LoD
free secondary amplified (“Label-free
and the CDF curves for the 3 categories were plotted in Fig. 2 (b).
in spite of secondary amplification
values shown in Fig. 2 (b). Fig. 2 (c)
shows that there is no correlation between the achieved LoDs and the molecular weight of the
free secondary amplified
shows the comparison of direct label-free and
labeled LoDs measured simultaneously in the same assay eliminating variations arising from
differences in experimental protocols. It is seen that every data point shows better performance
of the labeled technique. The log10 ratio of the label-free to labeled LoD is plotted on the right
vertical axis. The mean log10 LoD ratio is around 3 which supports the conclusion from Fig. 2
(a) and (b) that labeled techniques achieve 2-3 orders magnitude better LoDs compared to label-
free techniques.
Data from simultaneous labeled and label-free assays
As mentioned earlier, LoD is sensitive to surface functionalization methods and
associated experimental protocols. As there are likely to be major variations in these parameters
for the data shown in Fig. 2 (a), the best way to compare the two different detection approaches
would be to measure the same assay using a labeled and a label-free method simultaneously.
Although few in number, some research groups have indeed done such experiments enabling
direct comparison of labeled and label-free detection techniques without any confounding factors
[24,33,61,72,73]. Fig. 2 (d) plots the label-free LoD on the horizontal axis against the LoD
reported for corresponding labeled assay on the left vertical axis. On the right vertical axis the
base-10 logarithm of the ratio of label-free LoD to the labeled LoD is plotted. For every single
data point in Fig. 2 (d), it is seen that labeled LoD was significantly better than the corresponding
label-free LoD. Moreover, the mean log10 ratio of label-free LoD to the labeled LoD of about 3
supports the conclusions drawn from the previous analysis, namely that labeled approaches
achieve 2-3 orders of magnitude better LoDs than label-free techniques.
Examination of outlier technologies
It is interesting to examine the best performers in each category to identify techniques
that show the highest promise. In the case of labeled detection, Plasmonic ELISA [35] and
Digitial ELISA [54] report the best LoDs. In the case of label-free detection, inverse sensitivity
assay employing enzyme mediated nanoparticle synthesis [34], massive signal amplification with
1 micron diameter magnetic beads [29], with enzyme conjugated magnetic beads [52] and so on
report the best LoDs. However as pointed out earlier, this approach is only superficially different
from using fluorophore or enzyme labels as done in labeled immunoassays and it is debatable if
they should even be considered as label-free techniques. Direct label-free detection using Si
nanowires has reported extremely low LoDs using desalted serum [36]. However, desalting may
pose sample pre-treatment challenges. More importantly, such a dramatic performance advantage
of nanowires over other label-free techniques such as SPR, micro-nano-mechanical resonators or
even electrochemical methods must really be supported on firm theoretical grounds which is
currently lacking. To summarize, the analysis of LoDs reported in serum strongly suggests that
secondary antibody labels are required to achieve performance compared to traditional labeled
techniques such as ELISA or fluorescence immunoassays. However, amplification using tagged
secondary antibodies runs contrary to the label-free detection paradigm of direct detection with
minimal sample processing and perhaps such approaches shouldn’t even be considered as label-
free.
Why might label-free assays perform worse than labeled assays?
Secondary antibody amplified label-free LoD50 is still at least an order of magnitude worse
than the LoD50 of labeled approach even though both approaches use labels. Ignoring
multiplicative factors, LoD can be written as SLoD noiseσ= where noiseσ is the noise floor of
measurement and S is the sensitivity of the measurement technique [80]. It is believed that the
noise floor in the current generation of biosensors mostly arises from non-specific binding (NSB)
processes, for e.g., binding of interfering molecules to the receptors [81]. In this case, the noise
floor will be the standard deviation of signal produced by a negative control sample, which in the
case of serum based tests will be serum devoid of the target biomarker. In the case of labeled
techniques, noiseσ mainly arises from NSB of the secondary antibody to the target biomarker or
unblocked sensor surface. However, in the case of label-free approaches, irrespective of whether
they are amplified or not, noiseσ can arise due to the NSB of the secondary antibody, NSB of the
target biomarker, erosion of receptors [67] or similar phenomena related to the functionalization
layers. In other words the noise floor of label-free detection is likely to be larger than that of
labeled approaches. The improvement in LoD50 for secondary antibody tagged amplified label-
free sensors arises from increased sensitivity (larger S) due to signal amplification. This is a
plausible model to explain the observations in Fig. 2.
Conclusions and implications for clinical assay development
Perhaps related to the observations made above, examination of commercial tests for FDA
approved serum biomarkers [12] or the list of recent examples demonstrating the translation of

biosensing techniques from lab to the real world [2,5-8,13-16], we see that almost all of them are
based on labeled assay formats with color based or fluorescence readouts. It is impossible to find
even a single example in this domain which uses a sophisticated label-free technique such as
nanowires or nano-mechanical resonators. On the other hand many of these technology
translations employ clever variations of the labeled detection strategies. In this regard, recent
extensions of conventional labeled detection techniques such as Digital-ELISA [55], Plasmonic-
ELISA [35], inverse sensitivity assay [34] and so on, show great promise. In light of these
observations, I argue that extension of traditional labeled assays into lab-on-chip formats and
enhancing their performance using innovative signal read-out methods may have a better clinical
impact than the continued development of newer label-free techniques leading to a highly
fragmented techno-commerical landscape unlike the dominant Silicon semiconductor platform
technology which formed the basis for the digital revolution. Digital-ELISA and Plasmonic-
ELISA are notable recent examples in this direction. However, this is not to suggest that label-
free techniques serve no purpose. There are several applications involving detection of molecules
in simple samples such as buffers, or those involving large molecules or markers that appear in
large concentration, where label-free techniques may indeed leverage their simplicity and cost
advantages. However, when the requirement is to measure ultra-low (sub pM) concentration of
markers from a complex sample such as serum, it appears that labeled detection strategies
currently have a significant performance advantage over label-free techniques. It is hoped that
the data presented here will stimulate discussions leading to a critical and realistic assessment of
the capabilities of label-free techniques and help identify applications where their unique
strengths can be exploited.
References
1. Fehske, A. et al. (2011) The Global Footprint of Mobile Communications: The
Ecological and Economic Perspective IEEE Communications Magazine 49, 55-62
2. Drain, P. K. et al. (2014) Diagnostic point-of-care tests in resource-limited settings
Lancet Infect Dis. 14, 239–249
3. Park, S. et al. (2014) Toward Integrated Molecular Diagnostic System (iMDx): Principles
and Applications IEEE Trans. Biomed. Engg, 61, 1506-1521
4. Konforte, D. and Diamandis, E. P. (2013) Is Early Detection of Cancer with Circulating
Biomarkers Feasible? Clinical Chemistry 59 35–37
5. Cretich, M. et al. (2014) Protein microarray technology: how far off is routine
diagnostics? Analyst 139, 528-542
6. Sin, M. L. et al. (2014) Advances and challenges in biosensor-based diagnosis of
infectious diseases Expert Rev. Mol. Diagn 14, 225-244
7. Woolley, C. F. and Hayes, M. A. (2013) Recent developments in emerging
microimmunoassays Bioanalysis 5, 245–264
8. Song, Y. et al. (2014) Point-of-care technologies for molecular diagnostics using a drop
of blood Trends in Biotech. 32, 132-139
9. Mikkelsen, S. R. and Corton, E. (2004) Bioanalytical Chemistry John Wiley and Sons,
Hoboken, New Jersey
10. Lequin, R. M. (2005) Enzyme Immunoassay (EIA)/Enzyme-Linked Immunosorbent
Assay (ELISA) Clinical Chemistry 51, 2415–2418
11. Uchida S. et al. (2014) Highly Sensitive Liquid-Phase Detection of Biological Targets
With Magnetic Markers and High Tc SQUID IEEE Trans. Applied Supercond. 24
1600105
12. Anderson N. L. (2010) The Clinical Plasma Proteome: A Survey of Clinical Assays for
Proteins in Plasma and Serum Clinical Chemistry 56, 177–185
13. Chin, C. D. et al. (2012) Commercialization of microfluidic point-of-care diagnostic
devices Lab Chip 12, 2118–2134
14. Dixit C. K. (2013) Biochips Based In vitro Diagnostics: Market Trends and Research J
Biochips Tiss Chips 3, e124
15. Chin, C. D. et al. (2011) Microfluidics-based diagnostics of infectious diseases in the
developing world Nature Medicine, 17, 1015-1020
16. Laksanasopin, T. et al. (2015) A smartphone dongle for diagnosis of infectious diseases
at the point of care Science Trans. Med. 7, 273re1
17. Nam, J. M. et al. (2003) Nanoparticle-Based Bio–Bar Codes for the Ultrasensitive
Detection of Proteins Science 301, 1884-1886
18. Yu, F. et al. (2004) Surface Plasmon Fluorescence Immunoassay of Free Prostate-
Specific Antigen in Human Plasma at the Femtomolar Level Anal. Chem. 76, 6765-6770
19. Battaglia, T. M. et al. (2005) Quantification of Cytokines Involved in Wound Healing
Using Surface Plasmon Resonance Anal. Chem. 77, 7016-7023
20. Liu, M. Y. et al. (2005) Multiplexed Analysis of Biomarkers Related to Obesity and the
Metabolic Syndrome in Human Plasma, Using the Luminex-100 System Clinical
Chemistry 51, 1102–1109
21. Zheng, G. et al. (2005) Multiplexed electrical detection of cancer markers with nanowire
sensor arrays Nature Biotechnology 23, 1294-1301
22. Waggoner, P. S. et al. (2009) Detection of prostate specific antigen with nanomechanical
resonators Lab Chip 9, 3095–3099
23. Chowdhury, F. et al. (2009) Validation and comparison of two multiplex technologies,
Luminex and Mesoscale Discovery, for human cytokine profiling Journal of
Immunological Methods 340, 55–64
24. Wang, Y. et al. (2009) Prostate Specific Antigen Biosensor Based on Long Range
Surface Plasmon-Enhanced Fluorescence Spectroscopy and Dextran Hydrogel Binding
Matrix Anal. Chem. 81, 9625–9632
25. Wang, X. et al. (2011) Prostate specific antigen detection in patient sera by fluorescence-
free BioCD protein array Biosensors and Bioelectronics 26, 1871–1875
26. Kim, A. et al. (2010) Direct label-free electrical immunodetection in human serum using
a flow-through-apparatus approach with integrated field-effect transistors Biosensors and
Bioelectronics 25, 1767–1773
27. Fu, Q. et al. (2010) Comparison of Multiplex Immunoassay Platforms Clinical Chemistry
56, 314–318
28. Uluda, Y. et al. (2010) Development of a sensitive detection method of cancer
biomarkers in human serum (75%) using a quartz crystal microbalance sensor and
nanoparticles amplification system Talanta 82, 277–282
29. Krishnan, S. et al. (2011) Attomolar Detection of a Cancer Biomarker Protein in Serum
by Surface Plasmon Resonance Using Superparamagnetic Particle Labels Angew. Chem.
Int. Ed. 50, 1175 –1178
30. Shultz, M. A. et al. (2013) Optimized Blocking Of Porous Nitrocellulose Films For
Sensitive Protein Microarrays BioTechniques 54, 223–225

31. Dabitao, D. et al. (2011) Multiplex measurement of proinflammatory cytokines in human
serum: comparison of the Meso Scale Discovery electrochemiluminescence assay and the
Cytometric Bead Array J Immunol Methods. 372, 71–77
32. Breen, E. C. et al (2011) Multisite Comparison of High-Sensitivity Multiplex Cytokine
Assays Clinical and Vaccine Immunology 18, 1229–1242
33. Yuk, J. S. et al. (2012) Analysis of immunoarrays using a gold grating-based dual mode
surface plasmon-coupled emission (SPCE) sensor chip Analyst 137, 2574–2581
34. Rodríguez-Lorenzo, L. et al. (2012) Plasmonic nanosensors with inverse sensitivity by
means of enzyme-guided crystal growth Nature Materials 11, 604-607
35. de la Rica, R. et al. (2012) Plasmonic ELISA for the ultrasensitive detection of disease
biomarkers with the naked eye Nature Nanotechnology 7, 821-824
36. Huang, YW. et al. (2013) Real-Time and Label-Free Detection of the Prostate-Specific
Antigen in Human Serum by a Polycrystalline Silicon Nanowire Field-Effect Transistor
Biosensor Anal. Chem. 85, 7912−7918
37. Lee, SW. et al. (2013) Improved porous silicon microarray based prostate specific
antigen immunoassay by optimized surface density of the capture antibody Analytica
Chimica Acta 796, 108– 114
38. Kyprianou D. et al. (2013) Development of optical immunosensors for detection of
proteins in serum Talanta 103, 260–266
39. Vaisocherova, H. et al. (2009) Comparative study of SPR and ELISA methods based on
analysis of CD166/ALCAM levels in cancer and control human sera Biosensors and
Bioelectronics 24, 2143–2148
40. Brault, N. D. et al. (2010) Ultra-low fouling and functionalizable zwitterionic coatings
grafted onto SiO2 via a biomimetic adhesive group for sensing and detection in complex
media Biosensors and Bioelectronics 25, 2276–2282
41. Piliarik, M. et al. (2010) Surface plasmon resonance biosensor for parallelized detection
of protein biomarkers in diluted blood plasma Biosensors and Bioelectronics 26, 1656–
1661
42. von Muhlen, M. G. (2010) Label-Free Biomarker Sensing in Undiluted Serum with
Suspended Microchannel Resonators Anal. Chem. 82, 1905–1910

43. Zhang, B. et al. (2007) A novel multi-array immunoassay device for tumor markers based
on insert-plug model of piezoelectric immunosensor Biosens. and Bioelec. 23, 19–25
44. Bangar, M. A. et al. (2009) Single Conducting Polymer Nanowire Chemiresistive Label-
Free Immunosensor for Cancer Biomarker Anal. Chem. 81, 2168–2175
45. Das, J. et al (2011) Protein Detection Using Arrayed Microsensor Chips: Tuning Sensor
Footprint to Achieve Ultrasensitive Readout of CA-125 in Serum and Whole Blood Anal.
Chem. 83, 1167–1172
46. Huckabay, H. A. et al (2013) Label-free detection of ovarian cancer biomarkers using
whispering gallery mode imaging Biosensors and Bioelectronics, 45, 223–229
47. Sennikov, S. V. et al. (2003) Quantitative analysis of human immunoregulatory cytokines
by electrochemiluminescence method J. of Immunol Methods 275, 81– 88
48. DuPont N. C. et al. (2005) Validation and comparison of luminex multiplex cytokine
analysis kits with ELISA: Determinations of a panel of nine cytokines in clinical sample
culture supernatants Journal of Reproductive Immunology 66, 175–191
49. Luchansky, M. S. and Bailey, R. C. (2011) Rapid, Multiparameter Profiling of Cellular
Secretion Using Silicon Photonic Microring Resonator Arrays J. Am. Chem. Soc. 133,
20500–20506
50. Sauer, U. et al. (2011) Protein chip for the parallel quantification of high and low
abundant biomarkers for sepsis Analytical Biochemistry 419, 46–52
51. Joo, J. et al. (2012) Highly Sensitive Diagnostic Assay for the Detection of Protein
Biomarkers Using Microresonators and Multifunctional Nanoparticles ACS Nano 6,
4375–4381
52. Malhotra, R. et al. (2012) Ultrasensitive Detection of Cancer Biomarkers in the Clinic by
Use of a Nanostructured Microfluidic Array Anal. Chem. 84, 6249−6255
53. Kindt, J. T. et al. (2013) Subpicogram Per Milliliter Detection of Interleukins Using
Silicon Photonic Microring Resonators and an Enzymatic Signal Enhancement Strategy
Anal. Chem. 85, 10653−10657
54. Rissin, D. M. et al. (2013) Multiplexed single molecule immunoassays Lab Chip, 13,
2902–2911
55. Zhang, B. et al. (2013) Multiplexed cytokine detection on plasmonic gold substrates with
enhanced near-infrared fluorescence Nano Research 6, 113–120
56. Stigter, E.C.A. et. al (2005) An improved coating for the isolation and quantitation of
interferon-gamma in spiked plasma using surface plasmon resonance (SPR) Biosensors
and Bioelectronics 21, 474–482
57. Liu, Y. et al. (2010) Aptamer-Based Electrochemical Biosensor for Interferon Gamma
Detection Anal. Chem. 2010, 82, 8131–8136
58. Sipova, H. et al. (2012) Surface plasmon resonance biosensor based on engineered
proteins for direct detection of interferon-gamma in diluted blood plasma Sens. and Act.
B 174, 306– 311
59. Zhao, J. et al. (2012) An electrochemical aptasensor based on hybridization chain
reaction with enzyme-signal amplification for interferon-gamma detection Biosensors
and Bioelectronics 36, 129–134
60. Jiang, J. et al. (2013) A homogeneous hemin/G-quadruplex DNAzyme based turn-on
chemiluminescence aptasensor for interferon-gamma detection via in-situ assembly of
luminol functionalized gold nanoparticles, deoxyribonucleic acid, interferon-gamma and
hemin Analytica Chimica Acta 791, 60– 64
61. Wang, X. et al. (2008) Area-scaling of interferometric and fluorescent detection of
protein on antibody microarrays Biosensors and Bioelectronics 24, 981–987
62. Bornhop, D. J. et al. (2007) Free-Solution, Label-Free Molecular Interactions Studied by
Back-Scattering Interferometry Science 317, 1732-1736
63. Luchansky, M. S. and Bailey, R. C. (2010) Silicon Photonic Microring Resonators for
Quantitative Cytokine Detection and T-Cell Secretion Analysis Anal. Chem. 82, 1975–
1981
64. Messina, G. M. et al. (2008) Microfluidic immunosensor design for the quantification of
interleukin-6 in human serum samples Analytical Biochemistry 380, 262–267
65. Chou, TH. et al. (2010) Quantification of Interleukin-6 in cell culture medium using
surface plasmon resonance biosensors Cytokine 51, 107–111
66. Li, Y. et al. (2010) Nanomagnetic Competition Assay for Low-Abundance Protein
Biomarker Quantification in Unprocessed Human Sera J. Am. Chem. Soc. 132, 4388–
4392
67. Ahn, S. et al. (2013) A Mass-Tagging Approach for Enhanced Sensitivity of Dynamic
Cytokine Detection Using a Label-Free Biosensor Langmuir 29, 5369−5376
68. Lee, S. et al. (2013) Gold-nanopatterned single interleukin-6 sandwich immunoassay
chips with zeptomolar detection capability based on evanescent field-enhanced
fluorescence imaging Analyst 138, 3478–3482
69. Yang, CY. et al. (2005) Detection of picomolar levels of interleukin-8 in human saliva by
SPR Lab Chip 5, 1017–1023
70. Waggoner, P. S. et al. (2010) Microfluidic integration of nanomechanical resonators for
protein analysis in serum Sensors and Actuators B 150, 550–555
71. Wan, Y. et al. (2011) Carbon nanotube-based ultrasensitive multiplexing electrochemical
immunosensor for cancer biomarkers Biosens. and Bioelectron. 30, 93–99
72. Livache, T. et al. (2003) Polypyrrole based DNA hybridization assays: study of label
free detection processes versus fluorescence on microchips Journal of Pharmaceutical
and Biomedical Analysis 32, 687-696
73. Glass, T. R. et al. (2007) Least Detectable Concentration and Dynamic Range of Three
Immunoassay Systems Using the Same Antibody, Anal. Chem. 79, 1954-1960
74. Sigma Aldrich product information page for RAB0013, retrieved 15-02-2015
http://www.sigmaaldrich.com/catalog/product/sigma/rab0013?lang=en®ion=IN
75. Human Luminex Screening Assay information page, retrieved 15-02-2015
http://www.rndsystems.com/Products/LXSAH
76. Product data sheet for Abcam product PSA (KLK3) Human ELISA Kit ab113327,
retrieved 15-02-2015 http://www.abcam.com/PSA-KLK3nbspHuman-ELISA-Kit-
ab113327.pdf
77. https://webofknowledge.com from Thomson Reuters
78. Supplementaty MS Excel data file accompanying this article
79. Kreyszig, E. (2007) Advanced Engineering Mathematics, 8th Ed. Chap. 22, Wiley India,
New Delhi
80. Wilson, R. (2013) Sensitivity and specificity: twin goals of proteomics assays. Can they
be combined? Expert Rev. Proteomics 10, 135–149
81. Arlett, J. L. (2011) Comparative advantages of mechanical biosensors Nature Nanotech
6, 203-215
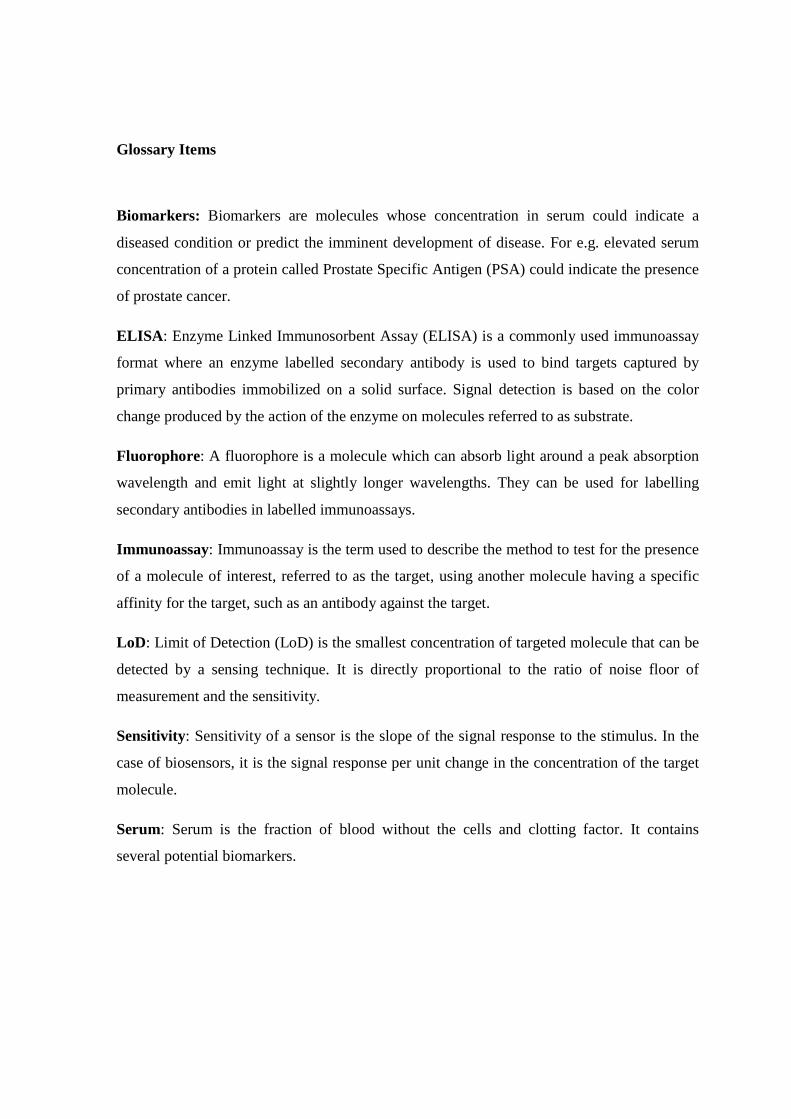
Glossary Items
Biomarkers: Biomarkers are molecules whose concentration in serum could indicate a
diseased condition or predict the imminent development of disease. For e.g. elevated serum
concentration of a protein called Prostate Specific Antigen (PSA) could indicate the presence
of prostate cancer.
ELISA : Enzyme Linked Immunosorbent Assay (ELISA) is a commonly used immunoassay
format where an enzyme labelled secondary antibody is used to bind targets captured by
primary antibodies immobilized on a solid surface. Signal detection is based on the color
change produced by the action of the enzyme on molecules referred to as substrate.
Fluorophore: A fluorophore is a molecule which can absorb light around a peak absorption
wavelength and emit light at slightly longer wavelengths. They can be used for labelling
secondary antibodies in labelled immunoassays.
Immunoassay: Immunoassay is the term used to describe the method to test for the presence
of a molecule of interest, referred to as the target, using another molecule having a specific
affinity for the target, such as an antibody against the target.
LoD: Limit of Detection (LoD) is the smallest concentration of targeted molecule that can be
detected by a sensing technique. It is directly proportional to the ratio of noise floor of
measurement and the sensitivity.
Sensitivity: Sensitivity of a sensor is the slope of the signal response to the stimulus. In the
case of biosensors, it is the signal response per unit change in the concentration of the target
molecule.
Serum: Serum is the fraction of blood without the cells and clotting factor. It contains
several potential biomarkers.
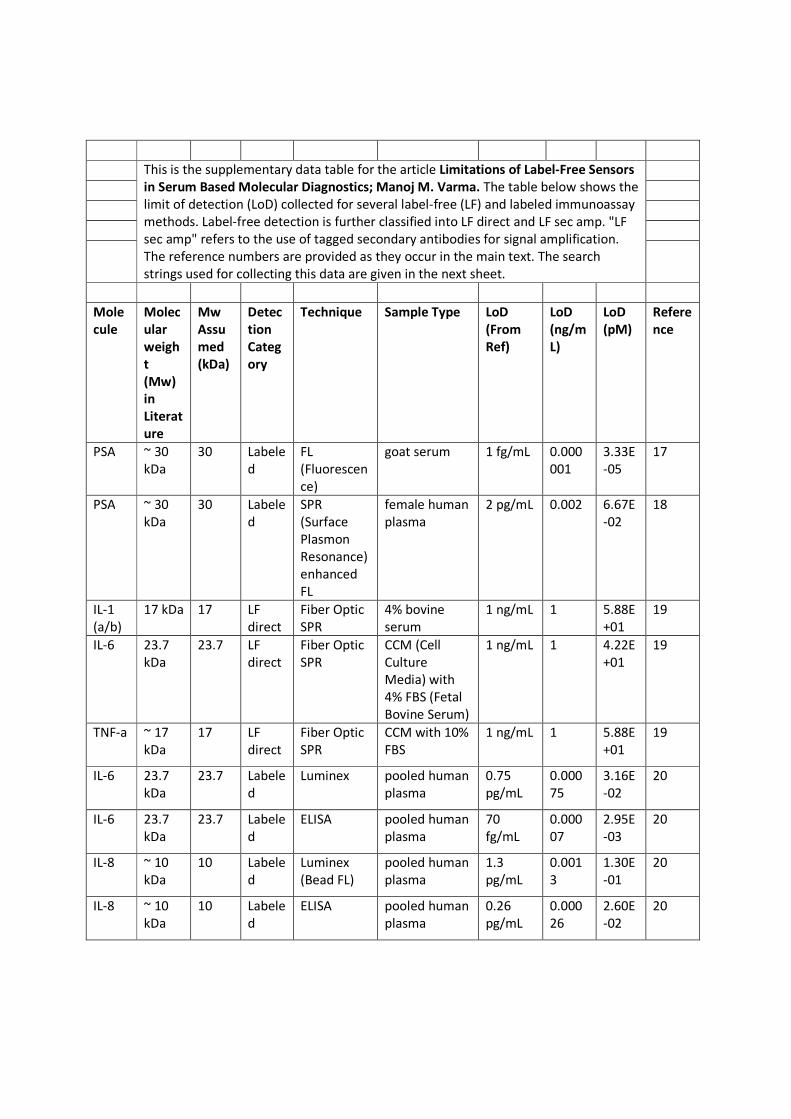
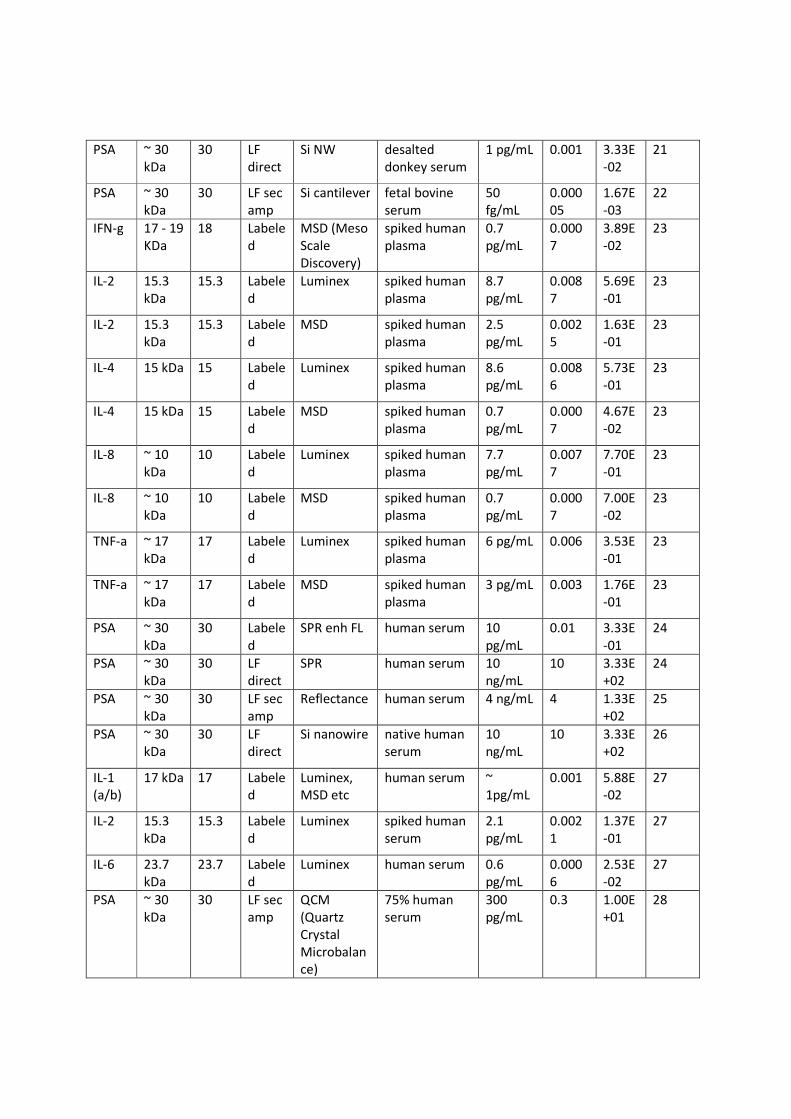
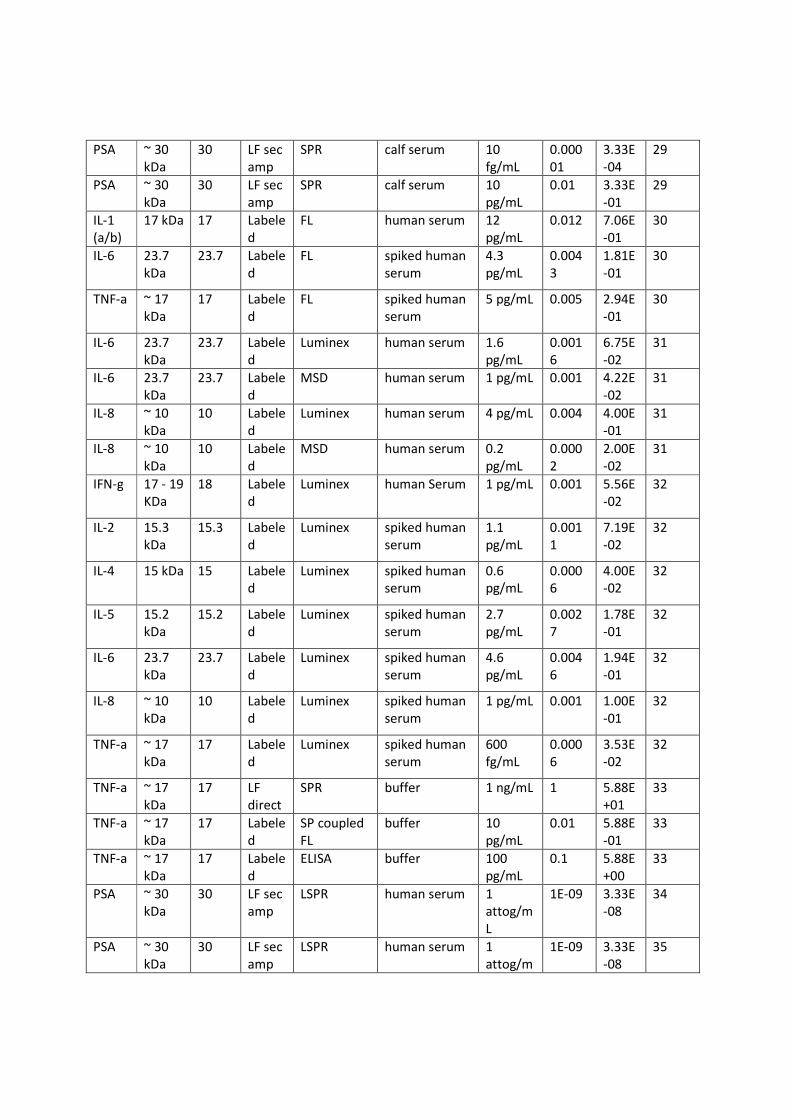
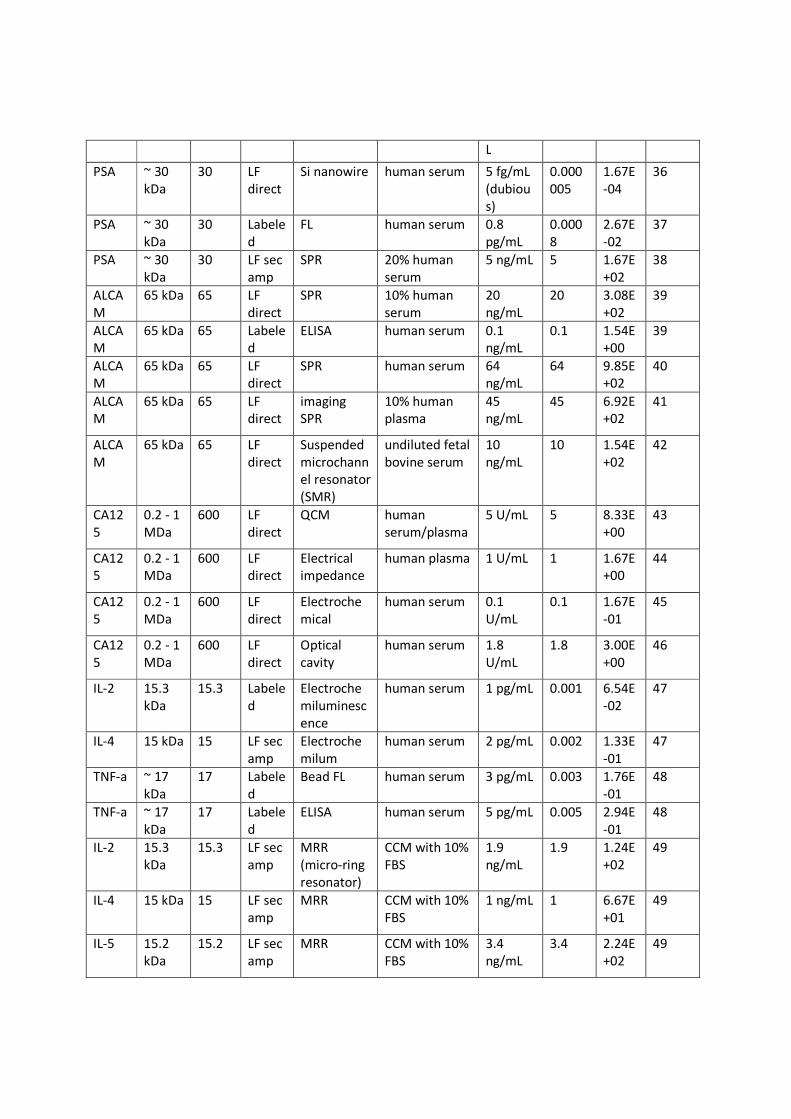
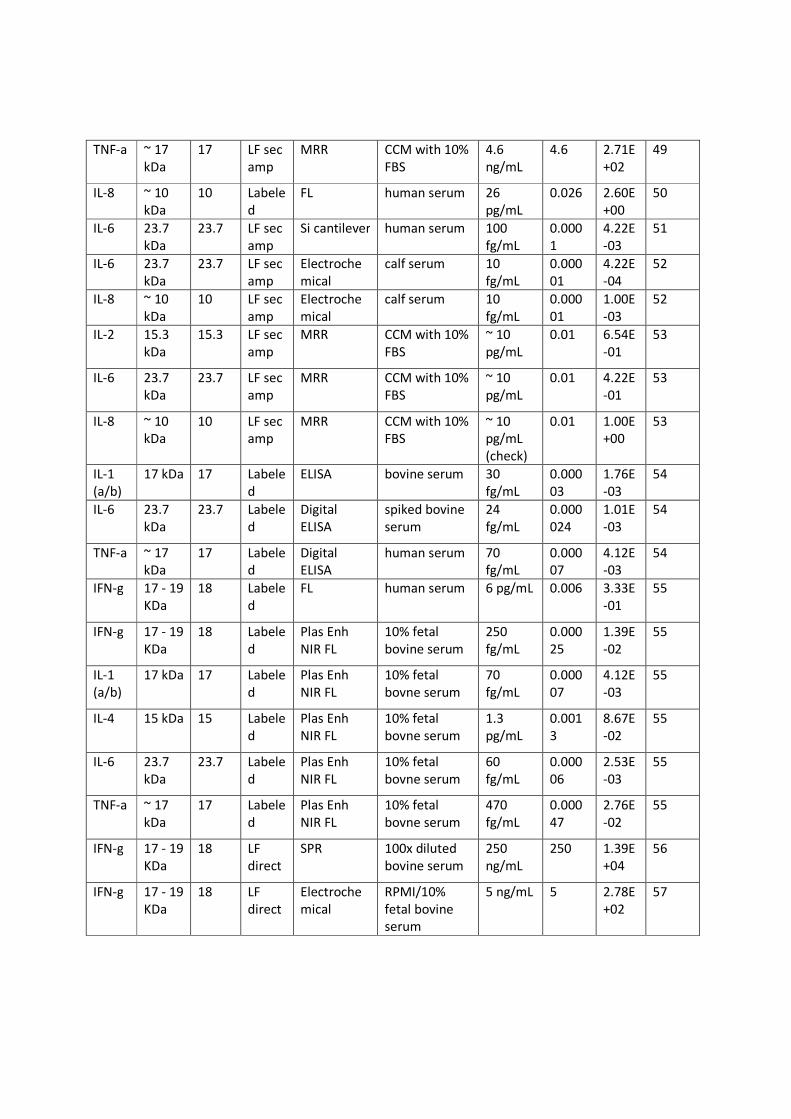
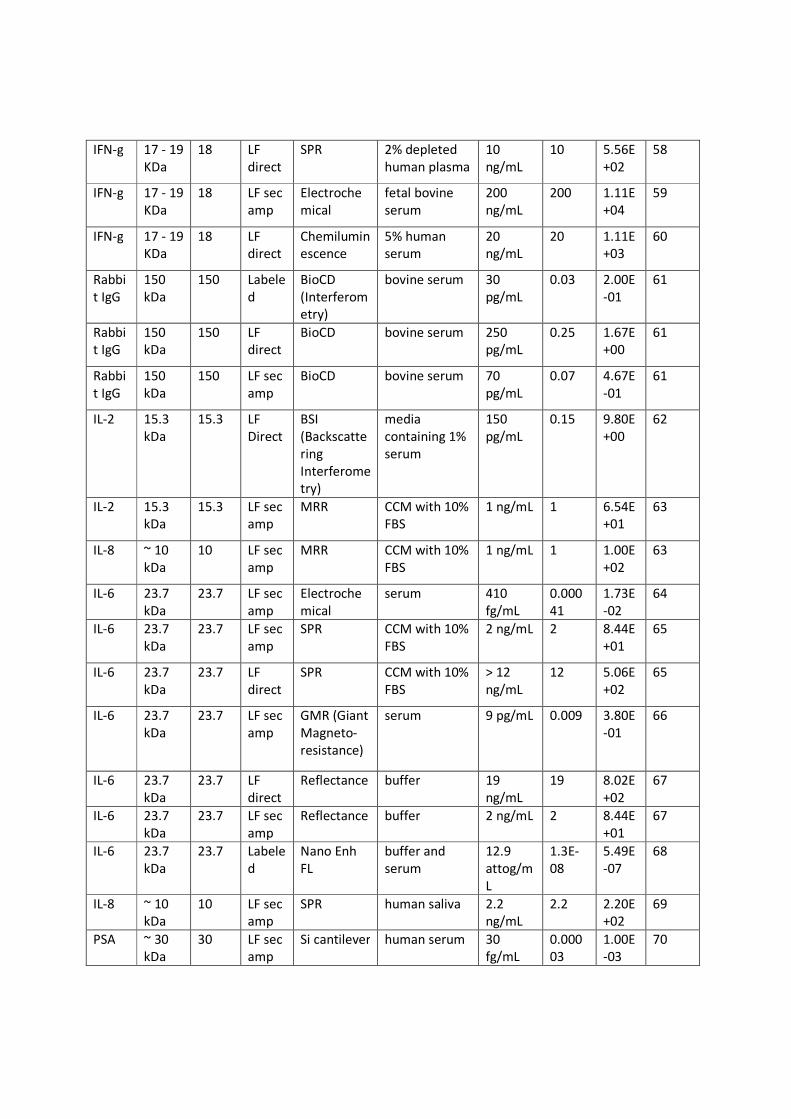
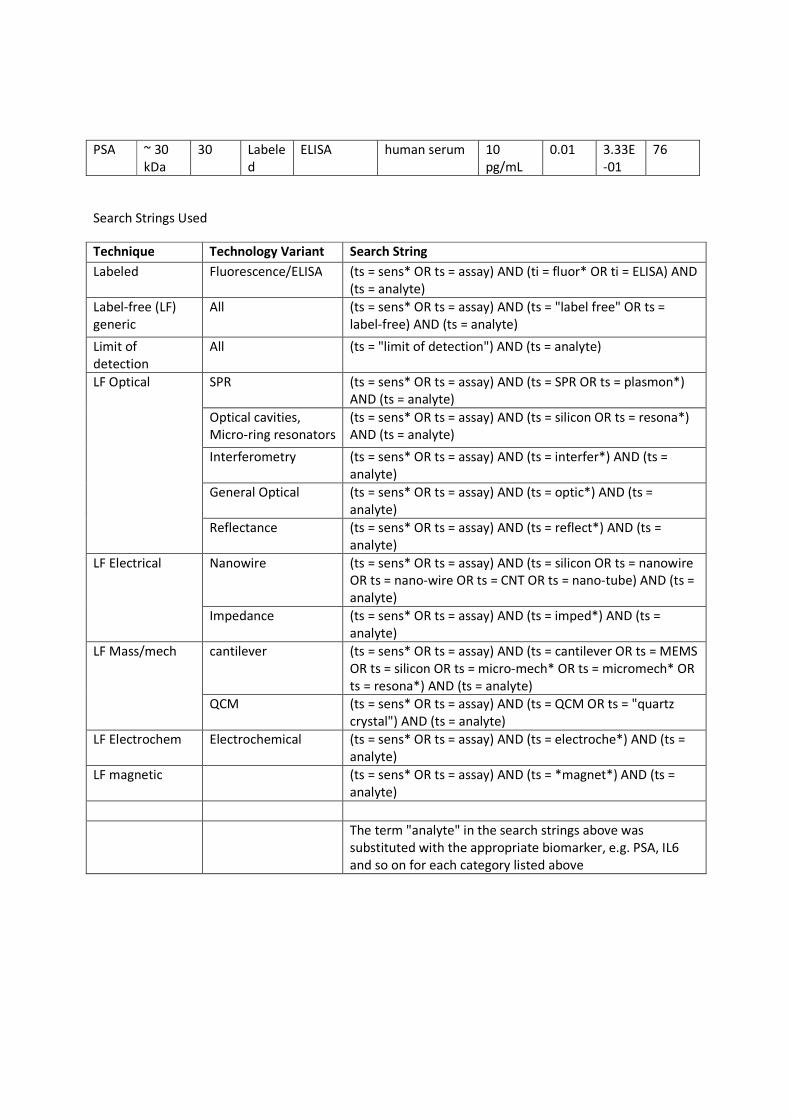
This is the supplementary data table for the article Limitations of Label-Free Sensors
in Serum Based Molecular Diagnostics; Manoj M. Varma. The table below shows the
limit of detection (LoD) collected for several label-free (LF) and labeled immunoassay
methods. Label-free detection is further classified into LF direct and LF sec amp. "LF
sec amp" refers to the use of tagged secondary antibodies for signal amplification.
The reference numbers are provided as they occur in the main text. The search
strings used for collecting this data are given in the next sheet.
Mole
cule
Molec
ular
weigh
t
(Mw)
in
Literat
ure
Mw
Assu
med
(kDa)
Detec
tion
Categ
ory
Technique Sample Type LoD
(From
Ref)
LoD
(ng/m
L)
LoD
(pM)
Refere
nce
PSA ~ 30
kDa
30 Labele
d
FL
(Fluorescen
ce)
goat serum 1 fg/mL 0.000
001
3.33E
-05
17
PSA ~ 30
kDa
30 Labele
d
SPR
(Surface
Plasmon
Resonance)
enhanced
FL
female human
plasma
2 pg/mL 0.002 6.67E
-02
18
IL-1
(a/b)
17 kDa 17 LF
direct
Fiber Optic
SPR
4% bovine
serum
1 ng/mL 1 5.88E
+01
19
IL-6 23.7
kDa
23.7 LF
direct
Fiber Optic
SPR
CCM (Cell
Culture
Media) with
4% FBS (Fetal
Bovine Serum)
1 ng/mL 1 4.22E
+01
19
TNF-a ~ 17
kDa
17 LF
direct
Fiber Optic
SPR
CCM with 10%
FBS
1 ng/mL 1 5.88E
+01
19
IL-6 23.7
kDa
23.7 Labele
d
Luminex pooled human
plasma
0.75
pg/mL
0.000
75
3.16E
-02
20
IL-6 23.7
kDa
23.7 Labele
d
ELISA pooled human
plasma
70
fg/mL
0.000
07
2.95E
-03
20
IL-8 ~ 10
kDa
10 Labele
d
Luminex
(Bead FL)
pooled human
plasma
1.3
pg/mL
0.001
3
1.30E
-01
20
IL-8 ~ 10
kDa
10 Labele
d
ELISA pooled human
plasma
0.26
pg/mL
0.000
26
2.60E
-02
20
PSA ~ 30
kDa
30 LF
direct
Si NW desalted
donkey serum
1 pg/mL 0.001 3.33E
-02
21
PSA ~ 30
kDa
30 LF sec
amp
Si cantilever fetal bovine
serum
50
fg/mL
0.000
05
1.67E
-03
22
IFN-g 17 - 19
KDa
18 Labele
d
MSD (Meso
Scale
Discovery)
spiked human
plasma
0.7
pg/mL
0.000
7
3.89E
-02
23
IL-2 15.3
kDa
15.3 Labele
d
Luminex spiked human
plasma
8.7
pg/mL
0.008
7
5.69E
-01
23
IL-2 15.3
kDa
15.3 Labele
d
MSD spiked human
plasma
2.5
pg/mL
0.002
5
1.63E
-01
23
IL-4 15 kDa 15 Labele
d
Luminex spiked human
plasma
8.6
pg/mL
0.008
6
5.73E
-01
23
IL-4 15 kDa 15 Labele
d
MSD spiked human
plasma
0.7
pg/mL
0.000
7
4.67E
-02
23
IL-8 ~ 10
kDa
10 Labele
d
Luminex spiked human
plasma
7.7
pg/mL
0.007
7
7.70E
-01
23
IL-8 ~ 10
kDa
10 Labele
d
MSD spiked human
plasma
0.7
pg/mL
0.000
7
7.00E
-02
23
TNF-a ~ 17
kDa
17 Labele
d
Luminex spiked human
plasma
6 pg/mL 0.006 3.53E
-01
23
TNF-a ~ 17
kDa
17 Labele
d
MSD spiked human
plasma
3 pg/mL 0.003 1.76E
-01
23
PSA ~ 30
kDa
30 Labele
d
SPR enh FL human serum 10
pg/mL
0.01 3.33E
-01
24
PSA ~ 30
kDa
30 LF
direct
SPR human serum 10
ng/mL
10 3.33E
+02
24
PSA ~ 30
kDa
30 LF sec
amp
Reflectance human serum 4 ng/mL 4 1.33E
+02
25
PSA ~ 30
kDa
30 LF
direct
Si nanowire native human
serum
10
ng/mL
10 3.33E
+02
26
IL-1
(a/b)
17 kDa 17 Labele
d
Luminex,
MSD etc
human serum ~
1pg/mL
0.001 5.88E
-02
27
IL-2 15.3
kDa
15.3 Labele
d
Luminex spiked human
serum
2.1
pg/mL
0.002
1
1.37E
-01
27
IL-6 23.7
kDa
23.7 Labele
d
Luminex human serum 0.6
pg/mL
0.000
6
2.53E
-02
27
PSA ~ 30
kDa
30 LF sec
amp
QCM
(Quartz
Crystal
Microbalan
ce)
75% human
serum
300
pg/mL
0.3 1.00E
+01
28
PSA ~ 30
kDa
30 LF sec
amp
SPR calf serum 10
fg/mL
0.000
01
3.33E
-04
29
PSA ~ 30
kDa
30 LF sec
amp
SPR calf serum 10
pg/mL
0.01 3.33E
-01
29
IL-1
(a/b)
17 kDa 17 Labele
d
FL human serum 12
pg/mL
0.012 7.06E
-01
30
IL-6 23.7
kDa
23.7 Labele
d
FL spiked human
serum
4.3
pg/mL
0.004
3
1.81E
-01
30
TNF-a ~ 17
kDa
17 Labele
d
FL spiked human
serum
5 pg/mL 0.005 2.94E
-01
30
IL-6 23.7
kDa
23.7 Labele
d
Luminex human serum 1.6
pg/mL
0.001
6
6.75E
-02
31
IL-6 23.7
kDa
23.7 Labele
d
MSD human serum 1 pg/mL 0.001 4.22E
-02
31
IL-8 ~ 10
kDa
10 Labele
d
Luminex human serum 4 pg/mL 0.004 4.00E
-01
31
IL-8 ~ 10
kDa
10 Labele
d
MSD human serum 0.2
pg/mL
0.000
2
2.00E
-02
31
IFN-g 17 - 19
KDa
18 Labele
d
Luminex human Serum 1 pg/mL 0.001 5.56E
-02
32
IL-2 15.3
kDa
15.3 Labele
d
Luminex spiked human
serum
1.1
pg/mL
0.001
1
7.19E
-02
32
IL-4 15 kDa 15 Labele
d
Luminex spiked human
serum
0.6
pg/mL
0.000
6
4.00E
-02
32
IL-5 15.2
kDa
15.2 Labele
d
Luminex spiked human
serum
2.7
pg/mL
0.002
7
1.78E
-01
32
IL-6 23.7
kDa
23.7 Labele
d
Luminex spiked human
serum
4.6
pg/mL
0.004
6
1.94E
-01
32
IL-8 ~ 10
kDa
10 Labele
d
Luminex spiked human
serum
1 pg/mL 0.001 1.00E
-01
32
TNF-a ~ 17
kDa
17 Labele
d
Luminex spiked human
serum
600
fg/mL
0.000
6
3.53E
-02
32
TNF-a ~ 17
kDa
17 LF
direct
SPR buffer 1 ng/mL 1 5.88E
+01
33
TNF-a ~ 17
kDa
17 Labele
d
SP coupled
FL
buffer 10
pg/mL
0.01 5.88E
-01
33
TNF-a ~ 17
kDa
17 Labele
d
ELISA buffer 100
pg/mL
0.1 5.88E
+00
33
PSA ~ 30
kDa
30 LF sec
amp
LSPR human serum 1
attog/m
L
1E-09 3.33E
-08
34
PSA ~ 30
kDa
30 LF sec
amp
LSPR human serum 1
attog/m
1E-09 3.33E
-08
35
L
PSA ~ 30
kDa
30 LF
direct
Si nanowire human serum 5 fg/mL
(dubiou
s)
0.000
005
1.67E
-04
36
PSA ~ 30
kDa
30 Labele
d
FL human serum 0.8
pg/mL
0.000
8
2.67E
-02
37
PSA ~ 30
kDa
30 LF sec
amp
SPR 20% human
serum
5 ng/mL 5 1.67E
+02
38
ALCA
M
65 kDa 65 LF
direct
SPR 10% human
serum
20
ng/mL
20 3.08E
+02
39
ALCA
M
65 kDa 65 Labele
d
ELISA human serum 0.1
ng/mL
0.1 1.54E
+00
39
ALCA
M
65 kDa 65 LF
direct
SPR human serum 64
ng/mL
64 9.85E
+02
40
ALCA
M
65 kDa 65 LF
direct
imaging
SPR
10% human
plasma
45
ng/mL
45 6.92E
+02
41
ALCA
M
65 kDa 65 LF
direct
Suspended
microchann
el resonator
(SMR)
undiluted fetal
bovine serum
10
ng/mL
10 1.54E
+02
42
CA12
5
0.2 - 1
MDa
600 LF
direct
QCM human
serum/plasma
5 U/mL 5 8.33E
+00
43
CA12
5
0.2 - 1
MDa
600 LF
direct
Electrical
impedance
human plasma 1 U/mL 1 1.67E
+00
44
CA12
5
0.2 - 1
MDa
600 LF
direct
Electroche
mical
human serum 0.1
U/mL
0.1 1.67E
-01
45
CA12
5
0.2 - 1
MDa
600 LF
direct
Optical
cavity
human serum 1.8
U/mL
1.8 3.00E
+00
46
IL-2 15.3
kDa
15.3 Labele
d
Electroche
miluminesc
ence
human serum 1 pg/mL 0.001 6.54E
-02
47
IL-4 15 kDa 15 LF sec
amp
Electroche
milum
human serum 2 pg/mL 0.002 1.33E
-01
47
TNF-a ~ 17
kDa
17 Labele
d
Bead FL human serum 3 pg/mL 0.003 1.76E
-01
48
TNF-a ~ 17
kDa
17 Labele
d
ELISA human serum 5 pg/mL 0.005 2.94E
-01
48
IL-2 15.3
kDa
15.3 LF sec
amp
MRR
(micro-ring
resonator)
CCM with 10%
FBS
1.9
ng/mL
1.9 1.24E
+02
49
IL-4 15 kDa 15 LF sec
amp
MRR CCM with 10%
FBS
1 ng/mL 1 6.67E
+01
49
IL-5 15.2
kDa
15.2 LF sec
amp
MRR CCM with 10%
FBS
3.4
ng/mL
3.4 2.24E
+02
49
TNF-a ~ 17
kDa
17 LF sec
amp
MRR CCM with 10%
FBS
4.6
ng/mL
4.6 2.71E
+02
49
IL-8 ~ 10
kDa
10 Labele
d
FL human serum 26
pg/mL
0.026 2.60E
+00
50
IL-6 23.7
kDa
23.7 LF sec
amp
Si cantilever human serum 100
fg/mL
0.000
1
4.22E
-03
51
IL-6 23.7
kDa
23.7 LF sec
amp
Electroche
mical
calf serum 10
fg/mL
0.000
01
4.22E
-04
52
IL-8 ~ 10
kDa
10 LF sec
amp
Electroche
mical
calf serum 10
fg/mL
0.000
01
1.00E
-03
52
IL-2 15.3
kDa
15.3 LF sec
amp
MRR CCM with 10%
FBS
~ 10
pg/mL
0.01 6.54E
-01
53
IL-6 23.7
kDa
23.7 LF sec
amp
MRR CCM with 10%
FBS
~ 10
pg/mL
0.01 4.22E
-01
53
IL-8 ~ 10
kDa
10 LF sec
amp
MRR CCM with 10%
FBS
~ 10
pg/mL
(check)
0.01 1.00E
+00
53
IL-1
(a/b)
17 kDa 17 Labele
d
ELISA bovine serum 30
fg/mL
0.000
03
1.76E
-03
54
IL-6 23.7
kDa
23.7 Labele
d
Digital
ELISA
spiked bovine
serum
24
fg/mL
0.000
024
1.01E
-03
54
TNF-a ~ 17
kDa
17 Labele
d
Digital
ELISA
human serum 70
fg/mL
0.000
07
4.12E
-03
54
IFN-g 17 - 19
KDa
18 Labele
d
FL human serum 6 pg/mL 0.006 3.33E
-01
55
IFN-g 17 - 19
KDa
18 Labele
d
Plas Enh
NIR FL
10% fetal
bovine serum
250
fg/mL
0.000
25
1.39E
-02
55
IL-1
(a/b)
17 kDa 17 Labele
d
Plas Enh
NIR FL
10% fetal
bovne serum
70
fg/mL
0.000
07
4.12E
-03
55
IL-4 15 kDa 15 Labele
d
Plas Enh
NIR FL
10% fetal
bovne serum
1.3
pg/mL
0.001
3
8.67E
-02
55
IL-6 23.7
kDa
23.7 Labele
d
Plas Enh
NIR FL
10% fetal
bovne serum
60
fg/mL
0.000
06
2.53E
-03
55
TNF-a ~ 17
kDa
17 Labele
d
Plas Enh
NIR FL
10% fetal
bovne serum
470
fg/mL
0.000
47
2.76E
-02
55
IFN-g 17 - 19
KDa
18 LF
direct
SPR 100x diluted
bovine serum
250
ng/mL
250 1.39E
+04
56
IFN-g 17 - 19
KDa
18 LF
direct
Electroche
mical
RPMI/10%
fetal bovine
serum
5 ng/mL 5 2.78E
+02
57
IFN-g 17 - 19
KDa
18 LF
direct
SPR 2% depleted
human plasma
10
ng/mL
10 5.56E
+02
58
IFN-g 17 - 19
KDa
18 LF sec
amp
Electroche
mical
fetal bovine
serum
200
ng/mL
200 1.11E
+04
59
IFN-g 17 - 19
KDa
18 LF
direct
Chemilumin
escence
5% human
serum
20
ng/mL
20 1.11E
+03
60
Rabbi
t IgG
150
kDa
150 Labele
d
BioCD
(Interferom
etry)
bovine serum 30
pg/mL
0.03 2.00E
-01
61
Rabbi
t IgG
150
kDa
150 LF
direct
BioCD bovine serum 250
pg/mL
0.25 1.67E
+00
61
Rabbi
t IgG
150
kDa
150 LF sec
amp
BioCD bovine serum 70
pg/mL
0.07 4.67E
-01
61
IL-2 15.3
kDa
15.3 LF
Direct
BSI
(Backscatte
ring
Interferome
try)
media
containing 1%
serum
150
pg/mL
0.15 9.80E
+00
62
IL-2 15.3
kDa
15.3 LF sec
amp
MRR CCM with 10%
FBS
1 ng/mL 1 6.54E
+01
63
IL-8 ~ 10
kDa
10 LF sec
amp
MRR CCM with 10%
FBS
1 ng/mL 1 1.00E
+02
63
IL-6 23.7
kDa
23.7 LF sec
amp
Electroche
mical
serum 410
fg/mL
0.000
41
1.73E
-02
64
IL-6 23.7
kDa
23.7 LF sec
amp
SPR CCM with 10%
FBS
2 ng/mL 2 8.44E
+01
65
IL-6 23.7
kDa
23.7 LF
direct
SPR CCM with 10%
FBS
> 12
ng/mL
12 5.06E
+02
65
IL-6 23.7
kDa
23.7 LF sec
amp
GMR (Giant
Magneto-
resistance)
serum 9 pg/mL 0.009 3.80E
-01
66
IL-6 23.7
kDa
23.7 LF
direct
Reflectance buffer 19
ng/mL
19 8.02E
+02
67
IL-6 23.7
kDa
23.7 LF sec
amp
Reflectance buffer 2 ng/mL 2 8.44E
+01
67
IL-6 23.7
kDa
23.7 Labele
d
Nano Enh
FL
buffer and
serum
12.9
attog/m
L
1.3E-
08
5.49E
-07
68
IL-8 ~ 10
kDa
10 LF sec
amp
SPR human saliva 2.2
ng/mL
2.2 2.20E
+02
69
PSA ~ 30
kDa
30 LF sec
amp
Si cantilever human serum 30
fg/mL
0.000
03
1.00E
-03
70

PSA ~ 30
kDa
30 LF sec
amp
Electroche
mical
100% human
serum
1 ng/mL 1 3.33E
+01
71
PSA ~ 30
kDa
30 LF sec
amp
Electroche
mical
10% human
serum
0.1
ng/mL
0.1 3.33E
+00
71
ssDN
A
(25bp
)
8.2
kDa
8.2 LF
direct
imaging
SPR
Buffer 10 nM 1.00E
+04
72
ssDN
A
(25bp
)
8.2
kDa
8.2 LF
direct
QCM Buffer 250 nM 2.50E
+05
72
ssDN
A
(25bp
)
8.2
kDa
8.2 Labele
d
FL Buffer 1 - 10
pM
5.00E
+00
72
Estrad
iol
272
Da
0.272 Labele
d
ELISA Buffer; 4 diff
Abs in 3 diff
sensing
methods
7.3 nM 7.30E
+03
73
Estrad
iol
272
Da
0.272 LF
direct
SPR Buffer 20 nM 2.00E
+04
73
Estrad
iol
272
Da
0.272 Labele
d
FL Buffer 40 pM 4.00E
+01
73
Estrad
iol
272
Da
0.272 Labele
d
ELISA Buffer 0.3 nM 3.00E
+02
73
Estrad
iol
272
Da
0.272 LF
direct
SPR Buffer 20 nM 2.00E
+04
73
Estrad
iol
272
Da
0.272 Labele
d
FL Buffer 2 pico M 2.00E
+00
73
Estrad
iol
272
Da
0.272 Labele
d
ELISA Buffer 0.6 nM 6.00E
+02
73
Estrad
iol
272
Da
0.272 LF
direct
SPR Buffer 49 nM 4.90E
+04
73
Estrad
iol
272
Da
0.272 Labele
d
FL Buffer 20 pM 2.00E
+01
73
Estrad
iol
272
Da
0.272 Labele
d
ELISA Buffer 0.3 nM 3.00E
+02
73
Estrad
iol
272
Da
0.272 LF
direct
SPR Buffer 4.3 nM 4.30E
+03
73
Estrad
iol
272
Da
0.272 Labele
d
FL Buffer 2 pico M 2.00E
+00
73
ALCA
M
65 kDa 65 Labele
d
ELISA diluted serum 0.03
ng/mL
0.03 4.62E
-01
74
CA12
5
0.2 - 1
MDa
600 Labele
d
Luminex human serum 2.7
pg/mL
0.02 3.33E
-02
75
PSA ~ 30
kDa
30 Labele
d
ELISA human serum 10
pg/mL
0.01 3.33E
-01
76
Search Strings Used
Technique Technology Variant Search String
Labeled Fluorescence/ELISA (ts = sens* OR ts = assay) AND (ti = fluor* OR ti = ELISA) AND
(ts = analyte)
Label-free (LF)
generic
All (ts = sens* OR ts = assay) AND (ts = "label free" OR ts =
label-free) AND (ts = analyte)
Limit of
detection
All (ts = "limit of detection") AND (ts = analyte)
LF Optical SPR (ts = sens* OR ts = assay) AND (ts = SPR OR ts = plasmon*)
AND (ts = analyte)
Optical cavities,
Micro-ring resonators
(ts = sens* OR ts = assay) AND (ts = silicon OR ts = resona*)
AND (ts = analyte)
Interferometry (ts = sens* OR ts = assay) AND (ts = interfer*) AND (ts =
analyte)
General Optical (ts = sens* OR ts = assay) AND (ts = optic*) AND (ts =
analyte)
Reflectance (ts = sens* OR ts = assay) AND (ts = reflect*) AND (ts =
analyte)
LF Electrical Nanowire (ts = sens* OR ts = assay) AND (ts = silicon OR ts = nanowire
OR ts = nano-wire OR ts = CNT OR ts = nano-tube) AND (ts =
analyte)
Impedance (ts = sens* OR ts = assay) AND (ts = imped*) AND (ts =
analyte)
LF Mass/mech cantilever (ts = sens* OR ts = assay) AND (ts = cantilever OR ts = MEMS
OR ts = silicon OR ts = micro-mech* OR ts = micromech* OR
ts = resona*) AND (ts = analyte)
QCM (ts = sens* OR ts = assay) AND (ts = QCM OR ts = "quartz
crystal") AND (ts = analyte)
LF Electrochem Electrochemical (ts = sens* OR ts = assay) AND (ts = electroche*) AND (ts =
analyte)
LF magnetic (ts = sens* OR ts = assay) AND (ts = *magnet*) AND (ts =
analyte)
The term "analyte" in the search strings above was
substituted with the appropriate biomarker, e.g. PSA, IL6
and so on for each category listed above
Copyright © 2022 FDOKUMEN