The Post Apprentice Student and the Others; Field Evidence from an Entrepreneurship Module in Higher...
33
The Post Apprentice Student and the Others, Field Evidence from an Entrepreneurship Module in Higher Education in Norway Øivind Strand* a Ola Jon Mork b * Corresponding author; a Aalesund University College, Department of International Business, PO Box 1517, 6025 Aalesund, Norway; +47 70 16 12 00; [email protected] b Aalesund University College, Department of Maritime Technology and Operations, PO Box 1517, 6025 Aalesund, Norway; +47 70 16 14 90; [email protected] Abstract: This paper deals with the measurements of emotions, power, status and performance in teams within an entrepreneurship module at Ålesund University College. Our focus is on the difference between post apprentice students who hold a vocational diploma when entering a degree programme and the other students. The purpose of the paper is threefold: First to develop and verify a Norwegian version of the Pana X scale for measurement of emotions. Second we develop and test a questionnaire measuring power and status in teams. Third we search for systematic differences between the two student groups. The main findings can be summarized as follows: • The diploma students report more joy, less fear, and less ambivalence. • The moderation of joy is associated with interaction between fear and status for the diploma student, whereas interactions with the power factor are more important for the non-diploma students. • The diploma students have a higher level of status in the groups. Keywords: emotions, entrepreneurship, vocational training, ambivalence 1
Transcript of The Post Apprentice Student and the Others; Field Evidence from an Entrepreneurship Module in Higher...
The Post Apprentice Student and the Others,
Field Evidence from an Entrepreneurship Module in Higher Education in Norway
Øivind Strand*a
Ola Jon Morkb
* Corresponding author; a Aalesund University College, Department of International Business, PO Box 1517, 6025 Aalesund,
Norway; +47 70 16 12 00; [email protected]
b Aalesund University College, Department of Maritime Technology and Operations, PO Box 1517, 6025 Aalesund, Norway; +47 70 16 14 90; [email protected]
Abstract:
This paper deals with the measurements of emotions, power, status and performance in teams within an entrepreneurship module at Ålesund University College. Our focus is on the difference between post apprentice students who hold a vocational diploma when entering a degree programme and the other students. The purpose of the paper is threefold: First to develop and verify a Norwegian version of the Pana X scale for measurement of emotions. Second we develop and test a questionnaire measuring power and status in teams. Third we search for systematic differences between the two student groups. The main findings can be summarized as follows:
• The diploma students report more joy, less fear, and less ambivalence. • The moderation of joy is associated with interaction between fear and status for the
diploma student, whereas interactions with the power factor are more important for the non-diploma students.
• The diploma students have a higher level of status in the groups. Keywords: emotions, entrepreneurship, vocational training, ambivalence
1
Are post apprentice students different from other students?
The authors have observed that most entrepreneurship competitions in higher education in
Norway are dominated by teams with one or more post apprentice, or diploma student (Hatlø
et al. 2011, Mork et al. 2013). A post apprentice student is a student who, when entering
higher education already holds a diploma in an industrial skill. Based on experience with
more than 100 student teams, the authors have observed that there seem to be stronger
emotional conflicts in entrepreneurial teams with diploma students (Mork and Strand, 2014).
The important role of emotions in these processes is closely aligned to an increased research
interest into the role of emotions in entrepreneurship (Souitaris et al. 2007, Podoynitsya et al.
2012, Welpe et al. 2012).
The students entering higher education institutions have varied backgrounds. In Norway,
most students traditionally come from upper secondary schools with exams in
theoretical/academic subjects. It is expected that the number of post apprentice students with
a vocational training and background from the industry, will increase in the years to come. In
Ålesund University College (AUC), Department of Maritime Technology and Operations, a
third of the engineering students have such a background. This development is due to an
increasing emphasis on lifelong learning for competitiveness, employability, and social
inclusion (EU, 2006; OECD, 2005), but also to rapid transformations in traditional industries.
The development of the knowledge-based economy causes the pace of change in the industry
to be high. The institutional setting for this study is a small university college (2000 students)
located in Ålesund (45,000 inhabitants) in the county of Møre and Romsdal (260,000
inhabitants) (Helgesen et al 2013). The respondents are recruited from the second year of a
three year bachelor program in Product Development and System Design. The study relates
to a course module in entrepreneurship, where students in groups are required to develop a
business idea and to build a prototype of the actual product. This study is a part of ongoing
2
research aiming to better understanding the dynamics of student teams comprising a mix of
students with and without an industrial background.
It is generally known that one of the major challenges using quantitative research methods in
entrepreneurship research are the small samples. This paper overcomes this challenge through
the use of multiple responses from the same participants.
This study uses the Pana X- scale (Watson and Clark, 1994) for measuring the emotional
constructs, fear and joy. These scales have previously been used by Welpe et al. (2012) in the
field of entrepreneurship. To our knowledge this paper is the first attempt to use this scale in
the Norwegian language and in an entrepreneurial context. Based on observations of the
various teams we also measure the emotional construct ambivalence which is done according
to Håvold et al. (2011), but based on joy and fear as a measure of positive and negative
emotions. This parameter is used in order to link to the entrepreneurship literature on
entrepreneurial ambivalence (Chwolka and Raith 2012, Brinkmann et al. 2010).
This paper also includes power and status of the individual student in the team as the students
in this study work together in teams of three to four. Power is defined as the extent to which
an individual can control others’ outcomes by granting or withholding valued resources.
Status is defined as the extent to which an individual is respected, admired and highly
regarded by others. To a certain extent, the concepts of power and status overlap and the
similarities are obvious:
Power and status are similar in the way that they are both sources of potential influence over
others. Individuals are more likely to comply with the wishes of those whom they highly
regard or who control valued resources. Further both power and status are commonly
3
bestowed upon individuals who can make the most valued contribution to the group,
reflecting the process of social exchange Fragale et al. 2011.
Knowledge exists both at the individual and the organizational level (Nelson and Winter,
1982). The role of personal knowledge in vocational education has been discussed by Schaap
et al. (2011) and Billett (2001). The term “embedded knowledge” has been used by
Badaracco (1991) to describe tacit knowledge amongst individuals or groups. The distinction
between explicit and tacit knowledge in organizations has been discussed by Hedlund and
Nonaka (1993). Nonaka and Takeuchi (1995) have argued that the zone between tacit and
codified knowledge is what matters most. Lundvall and Johnson (1994) distinguish between
four types of knowledge (Jensen et al. 2007): Know-what, Know-why, Know-how and
Know-who. Know-what and Know-why knowledge is typically academic knowledge and is
obtained through reading textbooks and/or attending lectures. This may take place in an
educational or industrial setting. The Know-how knowledge is typically learnt in a master-
apprentice relationship within an industrial sector. This relation can be formal, as part of a
vocational diploma, or informal, as in a community of practice (Lave and Wenger 1991),
where highly skilled craftsmen are role models for younger craftsmen. The Know-who
knowledge is learnt in social practice (Jensen et al. 2007; Carter 1989), which, in an
industrial setting, will include contact with vendors, customers, and competitors. As pointed
out by several authors (Maskel and Malmberg, 1999; Gertler 2003) tacit knowledge is
increasingly more important as codified knowledge becomes more easily accessible. Based
on the findings in the literature we would expect diploma students to have more Know-how
and Know-who (network) knowledge compared to the other students. We would not expect
differences in the groups in the more academic Know-why and Know-what knowledge.
4
The performance of the students was measured using grades in the subject. These grades are
based on individual work as well as group work and quality of final prototype.
For a higher education institution these post apprentice diploma students represent
opportunities as well as challenges. Opportunities arise from the industrial knowledge, skills,
and professional network they bring into the classroom. Challenges arise from a more
heterogeneous student population and the fact that the diploma students may challenge the
knowledge of the lecturer. Further knowledge on how these students feel, act, and behave in
mixed student teams is of vital importance for enhancing the quality of teaching and learning
in such teams. From the entrepreneurship literature there is evidence that emotions like joy
increase the propensity for a positive evaluation of entrepreneurial opportunities (Welbe et al.
2012). Likewise the feeling of fear is linked to negative evaluations of the same
opportunities.
In research on students and learning in higher education these students have hardly been
visible. It is emphasized that this study focuses on the most practical subjects in the actual
engineering degree pathway and results should not be transferred to more academic subjects
such as math or physics. New knowledge of this student group will have practical
implications for teaching and learning outcomes in these subjects.
Research questions
The intended contribution of this paper is to shed new light on the post apprentice diploma
students and to show how they differ from other students with regard to emotions,
knowledge, power, status and grades in an entrepreneurship educational setting.
5
Methodology
Instrument
A self-administered questionnaire comprising two parts was developed. The first part relates
to how often the respondents have had different feelings or emotions. The feelings and
emotions are drawn from the Pana-X battery (Watson and Clark, 1994) and contain 28 of the
original 60 items covering general positive and negative emotions. The second part of the
questionnaire relates to power which is measured by eight self-developed items and five self-
developed items for status. The instrument was composed of the same two parts related to
four distinct phases of the entrepreneurship module, so that each respondent was asked to
answer the questionnaire related to each of the four phases retrospectively. The phases are
tabulated in Table 1 below and relate to modules in the lecturing plan.
Table 1 to be inserted here
Emotions: The Pana-X items were translated from English to Norwegian by two separate
translators, one native English speaker and one native Norwegian speaker. The translations
were compared and final translations were decided together with the translators. In this study,
we will restrict ourselves to use the two sub-scales: joviality and fear. The subscales will be
further discussed later in this paper. Ambivalence was measured following Håvold et al.
(2011). This construct was included because several researchers have focused attention on the
role of ambivalence in entrepreneurship (Brinkman et al. 2010, Chwolka and Raith 2012).
Power: The eight items relates to whether the respondent has used a specific knowledge type
((Jensen et al. 2007): know-how, know-why, know-what, know-who) to take initiatives and
6
to prevent initiatives in the teamwork. Knowledge is a valuable resource in team work and we
intend to measure to what extent the students grant or withhold these recourses.
Knowledge: The four items relate to positive use (initiative) of the various knowledge types
given in the previous section.
Status: The five items relates to whether the group values the respondent’s contribution and
whether the respondent’s knowledge and experience are important for the team.
Performance: The final grades given for the course.
Nominal questions about age, sex, group and whether they held a vocational diploma were
also asked. The questionnaire contained a personal code which allowed the authors to identify
the respondents without identifying names. The instrument was handed out by one of the
authors and collected later the same day.
This study restricts itself to analysing these data with basic statistical techniques and does not
use more advanced methods such as non-parametric statistics, or panel/multiple response
methods. The number of respondents was 27, in a class of 32. We removed questionnaires
that were not completed and ended up with 102 complete responses.
Construction of variables
The construction of the variables used in this study is explained below. This will be done by
first describing how the items were developed and later the use of factor analysis to group the
items and test their validity.
The joviality scale
7
We have used a Norwegian translation of the he Pana-X instrument for measuring emotional
states. The original and translated items for the joviality scale are found in Table 2.
Table 2 to be inserted here
The respondents were asked to indicate to what extent they had felt this way during the actual
phase of the Project M1 to M4 in Table 1.
1 2 3 4 5
Very slightly a little moderately quite a bit extremely
or not at all
The fear scale
We have used a Norwegian translation of the he Pana-X instrument for measuring emotional
states. The original and translated items for the fear scale are found in Table 3.
Table 3 to be inserted here
There were discussions among the translators regarding the translation of jittery and shaky.
When referring to these terms later in this paper, we have used the original English terms.
The power scale
The eight items relate to whether the respondent has used a specific knowledge type (Jensen
et al. 2007) to take initiatives or to stop various initiatives in the teamwork. Power is,
according to Fagale et al. (2011), the extent to which an individual can control others’
outcomes by granting or withholding valued resources.
8
The respondents were asked to indicate how much they agree with each of the statements
Power1-Power 8 in relation to the actual phase of the project.
1 2 3 4 5
disagree partly disagree neutral partly agree agree
The items are:
Power 1: I have taken initiatives in the group because I have knowledge in how things are
done in the industry.
Power 2: I have stopped initiatives in the group because I have knowledge in how things are
done in the industry.
Power 3: I have taken initiatives in the group because I have knowledge of what is usually
done in such situations.
Power 4: I have stopped initiatives in the group because I have knowledge of what is usually
done in such situations.
Power 5: I have taken initiatives in the group because I have knowledge of why things need
to be done.
Power 6: I have stopped initiatives in the group because I have knowledge of why things need
to be done.
Power 7: I have taken initiatives in the group because I know someone that can help the
group.
Power 8: I have stopped initiatives in the group because I know someone that knows that this
initiative won’t work.
The status scale
9
Status is, according to Fragale et al. (2011) the extent to which an individual is respected,
admired and highly regarded by others. The respondent is asked to indicate, on a five point
Likert scale, how much he or she agrees with the following statements:
Status 1: In order to succeed, the team is completely dependent on my knowledge and
experience.
Status 2: The team values my knowledge and experience.
Status 3: My knowledge and experience are of great value for the team.
Status 4: I have little influence in the team (R).
Status 5: I am probably the one with most influence in the team.
Item S4 is reverse recoded in order for all items to score high on high status.
Analysis of Factors
In order to ensure that the items correlate and are reliable measures for the defined concept,
we performed an exploratory factor analysis using SPSS (Hair et al. 2006, Palant 2010,
Ringdal 2007). The seven items for joy, the six items for fear, Power 1-Power 8, and Status
1-Status 5 were used as input items in the factor analysis. Varimax orthogonal rotation was
used. We follow Kaiser’s recommendation of keeping eigenvalues of the factors above 1
(Field, 2005). By inspection of the diagonal in the anti-image matrix we exclude items with
correlation<0.7. After inspection of the extracted communalities we remove items which load
lower than 0.5 (ibid). After these operations, the Kaiser-Meyer-Olkin (KMO) measure of
sampling adequacy is 0,816, which, according to Field (ibid), is very good, since a value
10
close to 1 indicates that pattern of correlation are compact and ensure distinct and reliable
factors. The determinant of the correlation matrix is 1,030E-5, which is above the
recommendation (ibid). This ensures that multicollinearity is not a major problem. The
analysis resulted in four factors as given in Table 4. They explain 68% of the variance in the
data.
Table 4 to be inserted here
A reliability analyses for the new factors was performed and tabulated in Table 5. The two
emotional factors are confirmed, although one item from the joy scale loaded to low (<0, 5).
Three of the items of Pana X, fear scale loaded to low. This may indicate that the translation
of the items should be re-examined in further development of the questionnaires. The factor
items for measuring the concept of power and status are somewhat confusing. This indicates
that items should include more aspects than various type of knowledge in the concept. It is
interesting to observe that know-how (Power 1), know-what (Power 3) and know-who
(Power 7) loads together with the intended status items. We decided to keep the original
names of the concepts on the calculated factors (bearing in mind the limitations in our
questionnaire).
A re-run of the analysis with a direct oblim rotation, results in the same factor for the pattern
matrix, but with one exception: Power 4 loads on both status and power in the structure
matrix. Inspection of the component correlation matrix shows a slightly higher correlation
between status and power, than for the other factors.
11
Table 5 to be inserted here
Results: are post apprentice student different?
Descriptive statistics
The four factors were calculated as mean values for the items involved. The descriptive
statistics for these factors are given in Table 6. The Fear factor is highly skewed to the left
(lower values) and very peaked (clustered). This indicates that assumptions of the Fear factor
as having a normal distribution is very questionable.
Table 6 to be inserted here
The first section is devoted to the research question concerned with whether there are any
statistically significant differences in the four calculated factors for students with and without
a vocational diploma.
We split our data into students with a diploma and other students. Status and power are often
linked to age, so we first compared the mean values of the age for the two groups. In all
comparisons between the two groups we used an independent-samples T test procedure (Field
2005). The results are given in Table 7. Levene’s test of equality of variance for the two
samples is not significant (p>5%) and the difference is not significant (p= 40,7%). We
conclude that the groups are not significantly different with regard to age.
Table 7 to be inserted here
12
Levene’s test for equality of variance is significant (<5% level) for Status factor and Fear
factor. There is a significant difference between the two groups with regard to Status factor
(p<1%), Joy factor (p<1%), and Fear factor (<5%). Diploma students have, as shown in
Table 7, a higher level of joy, less fear and higher status compared to the other students.
Comparing performance (grades) for the two groups, there is an indication that the diploma
student have better grades (p=7.2%) but that this is not statistically significant (p<5%).
Next, we used the split sample and calculated correlations between the factors for the two
groups. The results are given in Table 8. For the diploma students there seems to be a
significant and strong link between joy and status. For the other students there is a negative
correlation between joy and fear (low level of fear gives high level of joy), as expected. The
negative correlation between joy and power is more difficult to understand.
Table 8 to be inserted here
Regression model
We would like to develop regression equations explaining the joy factor as a function of the
other factors. We split the sample into students with and without diploma. All variables were
centred with the mean of the actual variable. In order to increase the explained variance, we
introduced higher order interaction terms. These were manually defined and calculated in
SPSS and included as a second (two-way interaction) and a third (three way interaction) term.
We used the three factors as the first block. The second block contained two-way interactions
between the factors which do not involve the dependent variable (joy). Finally the third block
is the three way interaction term. The results for the calculations are summarized in Table 9
for both students groups. Model 1 explains 44.7% of the variance in the data for the diploma
13
students. Model 2 adds the two-way interaction terms, which results in explanation of 66.7%
of the variance in the data. Model 3 adds only 0.1% more of explanation of the variance. Un-
standardized residuals were tested for normality and the null hypothesis regarding normality
of the residuals was kept. Only two regression coefficients are significant (p<1%). The
Variance Inflation Factor (VIF), indicating multicollinearity if higher than 10, is below four
for all parameters.
For the non-diploma students, Model 1 explains 17.1% of the variance in the data. Model 2
adds the two-way interaction terms, which results in explanation of 38.5% of the variance.
Model 3 adds only 0.1% more of the explained variance. As for the diploma student data, un-
standardized residuals were tested for normality and null hypothesis regarding normality of
the residuals was kept. Only one regression coefficient is significant at 1% level (p<1%),
however three coefficients are significant at (p<5%) The VIF is below four for all parameters.
Table 9 to be inserted here
Summing our findings up, we compare the significant coefficients for the two student groups
in Table 10.
As can be seen from Table 10, there seems to be different mechanisms present for the two
groups. The status factor explains the level of joy for diploma students, whereas a low level
of fear explains the high level of joy for non-diploma students. There are also significant
differences in the interaction terms. Interactions with the power factor seem to be
predominant for non-diploma student and status-fear interaction seems to moderate joy for
both groups.
14
Table 10 to be inserted here
Ambivalence
In addition to the emotional concepts, fear and joy, we introduced a new emotional construct;
ambivalence. This is motivated by the literature on entrepreneurial ambivalence (Brinckmann
et al. (2010), Chwolka and Reith 2012). We followed the method found in Håvold et al.
(2011) and modified their definition of ambivalence. This was done as follows:
PA (Positive emotions/affects)
NA (Negative emotions/affects)
Ambivalence = (PA+NA)/2-ABS(PA-NA)
With our factors we obtained the following expression:
Ambivalence = (Joy_factor + Fear_factor)/2 – ABS(Joy_factor-Fear_factor)
We split the sample, compare means and test for significance. Diploma students have a
significantly lower level of ambivalence (p<1%), than the rest of the students.
Discussion, how can we explain the differences?
The questionnaire
15
There appears to be several weaknesses in the questions asked in the survey. Regarding the
emotional states, the Norwegian translation of several fear scale items should be discussed
with other students of the respondents’ age.
The power and status items need to be refined and the literature on these constructs should be
examined in more detail. The loading of items from different theoretical constructs indicate
that these items should be refined further. The various knowledge typologies should have
been examined using more than one question for each type.
The factor analysis includes two different types of items: emotional items with a 5 point
Likerts’ scale referring to frequency of emotional states. The power and status items use
another 5 point Likerts’ scale which refers to what extent the respondent agrees with the
sentence. This should have been split into two separate factor analysis.
The respondents’ answers to the questions is based on retrospection with reference to various
stages in the project. This can introduce errors, since we generally tend to remember very
positive and very negative emotions. The number of respondents should, if possible, be
increased.
The diploma student
The results give a broader picture of the diploma student and confirm several of our
observations regarding these students.
Emotions
Emotions play an important part in the evaluation of entrepreneurial opportunities. Welpe et
al. (2012) show that fear reduces, and joy increases the tendency to exploit entrepreneurial
opportunities.
16
The regression equations explaining the joy factor as a combination of the other factors give
interesting result for the split sample. For the diploma student the status factor affects the joy
factor positively. A significant interaction effect is found between status and fear; this factor
has a negative sign. This indicates that fear moderates the effect of status.
For non-diploma student, the picture is a bit different. The fear factor, with a negative sign
explains the joy factor. This indicates that a low fear level is associated with a high level of
joy. There are several interactional effects for this sub-sample. As for diploma students, fear
and status has a negative sign. A positive effect of power-status interaction is also present. It
is however difficult to interpret the positive interaction between power and fear.
How should these results be interpreted and what might cause these observed differences?
We may speculate that several factors may be relevant in explaining the findings. First, the
post apprentice students have an industrial network and experience which make it easier to
judge if a business idea has potential. Second, the quality of the prototype for the product is
generally significantly higher for groups with post apprentice students. Both factors are
important for the judging whether this is a ‘real life’ idea which could be of value to the
industry, or if it is a ‘school life’ idea of only academic interest. Both factors will probably
affect the position of the post apprentice student in the group giving him both increased
power and status as a result of which he feels more joy and less fear. When it comes to the
prototype, it may be that the diploma students, based on experience, are confident that they
will manage to finish it to a high quality, whereas the ordinary students fear that they will not
be able to do so. Research in which we investigate the role of prototyping as a knowledge
integrator is in preparation as a separate publication (Mork and Strand, forthcoming).
Ambivalence
17
Ambivalence can have both positive and negative effects on behaviour (Wheeler and Jones,
2006; Håvold et al. 2011). Positive effects include willingness to compromise, negotiate and
seek further information. Negative effects may be the delay of decisions, quality of work, and
lowered self-esteem. Our findings show that diploma students are characterised by a
significantly lower level of ambivalence. On the other hand, given that ambivalence is an
unwanted state, the lecturer should take steps in order to lower the ambivalence for the non-
diploma students.
In an entrepreneurship educational setting, where the presentation of the teams’ business idea
is important, then a low level of ambivalence is vital in order to convince juries, external
examiners or potential investors.
Conclusions
The authors’ impressions and experience gathered from a large number of student enterprises
during recent years is, to a large extent, confirmed. The post apprentice diploma students use
their significantly higher Know-how and Know-who knowledge actively in their
entrepreneurship project. Know-how is learnt in industrial apprenticeship and Know-who is
learnt through participating and interacting in business networks with vendors, customers and
competitors. The lower level of fear and ambivalence is also an interesting finding. The
importance of status to explain joy, and the moderating effect of the interaction of fear and
status on joy is highly relevant.
In contrast, the non-diploma students’ level of joy is explained by a low level of fear. This
level is negatively moderated by the same interaction term as for the diploma student. In
addition positive moderating effects are found from interaction among power and status, and
between power and fear.
18
These findings are relevant in more practice oriented subjects in a higher educational setting.
The lecturer should pay attention to the significant discrepancy of ambivalence and fear
between the two groups. Great care and consideration should be taken when the groups are
compiled. A balance between the various types of students in the group is favourable, but will
require special/individual coaching for both types of students within each group.
In terms of future research we have pointed to several weaknesses in our measuring
instruments and made several suggestions for improvement. An obvious extension would be
to repeat the study within a subject of a more academic nature.
19
References Badaracco, J. L. (1991). The Knowledge Link. Boston: Harvard Business School Press. Billett, S. (2001). Knowling in practise: Re-conseptualizing vocational expertise. Learning and Instruction, 11, 431-452. Brinkmann, J., Grishnik, D., & Kapsa, D. (2010). Should entrepreneurs plan or just storm the castle? A meta-analysis on contextual factors impacting the business planning-performance relationship in small firms. Journal of Business Venturing, 25, 24-40. Carter, A. P. (1989). Know-how trading as economic exchange. Research Policy, 18,155-163. Chwolka, A & Raith, M. G. (2012). The value of business planning before startup -A decision-theoretical perspective. Journal of Business Venturing , 257, 385-399. Gertler, M. S. (2003).Tacit knowledge and the economic geography of context, or The undefinable tacitness of being (there). Journal of Economic Geography, 3, 75-99. EU (2006). COMMUNICATION FROM THE COMMISSION, Adult learning: It is never too late to learn. Brussels, 23.10.2006, 614 final. Field, A. (2005). Discovering Statistics Using SPSS. London: Sage publication. Fragale, A. R, Overbeck, J. R., and Neal, M.A. (2011). Recourses versus respect: Social judgments based on target’s power and status positions. Journal of experimental Social Psychology, 47, 767-775. Hair Jr, J.F, Black, W.C,Babin, B,J, & Tatham, R. L. (2006). Multivariate Data Analysis with readings 6th Edition. New Jersey: Prentice Hall. Hatlø, B.M, Strand, Ø., & Mork, O.J. (2011). Student enterprises, educated through the triple helix circulation. Journal Advances in Higher Education, 3 (1). Hedlund, G., and Nonaka, I. (1993). Modes of Knowledge management in the West and Japan, in Implementing Strategic Processes: Change, Learning and Cooperation, Lorange, P. Chakravarthy, B., Roos J., and Van den Ven, A. (eds), Oxford, UK: Basil Blackwell, 117-144. Helgesen, Ø., Nesset, E., Strand, Ø. (2013). “Brain drain” or “Brain gain”? Students’ loyalty to their student town: Field evidence from Norway. European Planning studies, 21(6), 909-943.
Håvold,J.I, Nesset, E., & Strand, Ø. (2011). Safety attitude and safety ambivalence among officers from the Philippines and Norway. Safety Science Monitor, 15(1), 1-15. Jensen, B. M., Johnson, B., Lorentz, E., and Lundvall, B. Å. (2007). Forms of knowledge and modes of innovation. Research Policy, 36, 680-693.
20
Lave, J., & Wenger,E. (1991). Situated Learning: Legitimate Peripheral Participation. Cambridge: Cambridge University Press. Lundvall B. Å., and Johnson B., (1994). The Learning Economy. Journal of Industry Studies 1, 23-42. Maskell, P. and Malmberg, A. (1999). The Competitiveness of Firms and Regions: 'Ubiquitification' and the Importance of Localized Learning’. European Urban and Regional Studies, 6(1), 9-25. Mork, O.J., Strand,Ø., Hatlø, B.M & Norheim, K. (2013). Entrepreneurship and Practical skills. Journal Advances in Higher Education: Research, Education and Innovation, 5(1), 40-55. Mork, O.J. & Strand, Ø. (2014). Diploma students and entrepreneurship education; emotional challenges and the role of knowledge management. Journal Advances in Higher Education: Research, Education and Innovation entrepreneurship, 6 (1), 201-220. Mork, O.J., Strand, Ø., (in preparations). Prototyping as knowledge integrator and boundary objects between industry and education.
Nonaka, I. and Takeuchi, H. (1995). The Knowledge Creating Company. Oxford: Oxford university Press. Nelson, R. R., and Winter, S. G. (1982). An Evolutionary Theory of Economic Change. Cambridge MA: Belknap. OECD (2005). Promoting adult learning, ISBN:9264010939. Podoynitsyna, K., Van der Bij, H., and Song, M. (2012). The Role of Mixed Emotions in the Risk Perseption of Novice and Serial Entrepreneurs. Entrepreneurship Theory & Practice, January 2012. Palant, J. (2010). SPSS Survival Manual 4th ed. Bershire England: McGraw-Hill,. Ringdal, K. (2007). Enhet og mangfold, 2.utg. Trondheim Norway: Fagbokforlaget. Schaap, H., de Bruijn, E., Van der Schaaf, M. F., Baartman, L.K.J., Kirschner, P.A., (2011). Explicating Students’ Personal Professional Theories in Vocational Education through Multi-method Triangulation. Scandinavian Journal of Educational Research, 55(6), 567-586. Souitaris, V., Zerbinati, S., and Al-Laham, A. (2007). Do entrepreneurship programme raise entrepreneurial intentions of science and engineering students? The effect of learning, inspiration and recources. Journal of Business Venturing , 22, 566-591. Watson, D. & Clark, L.A. (1994). The PANAS-X: Manual for the positive and negative affect schedule—expanded form. Available at http://www.psychology.uiowa.edu/Faculty/Watson/PANAS-X.pdf, accessed 9 April 2013.
21
Welpe, I. M., Spørrle, M., Grichnik, D., Michl, T., & Auderetsch D. B. (2012). Emotions and Opportunities: The Ineterpolay of Opportunity Evaluation, Fear, Joy, and Anger as Antecedents of Entrepreneurial Exploitation. Entrepreneurship Theory and Practice, 36(1), 69-96. Wheeler, P,. Jones, D. R. (2006). The effects of attitudinal ambivalence and exploratory switching behavior on the use of two decision aids. International Journal of Accounting Information Systems, 7, 251–271.
22
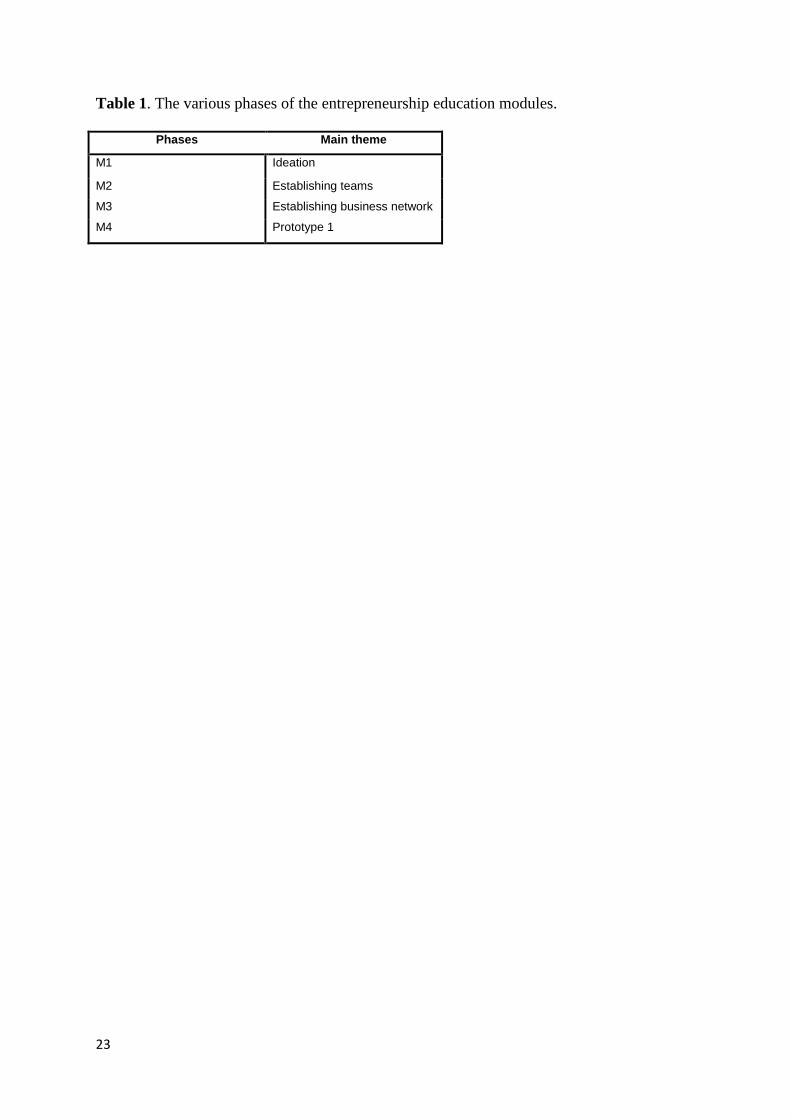
Table 1. The various phases of the entrepreneurship education modules.
Phases Main theme
M1 Ideation
M2 Establishing teams
M3 Establishing business network
M4 Prototype 1
23
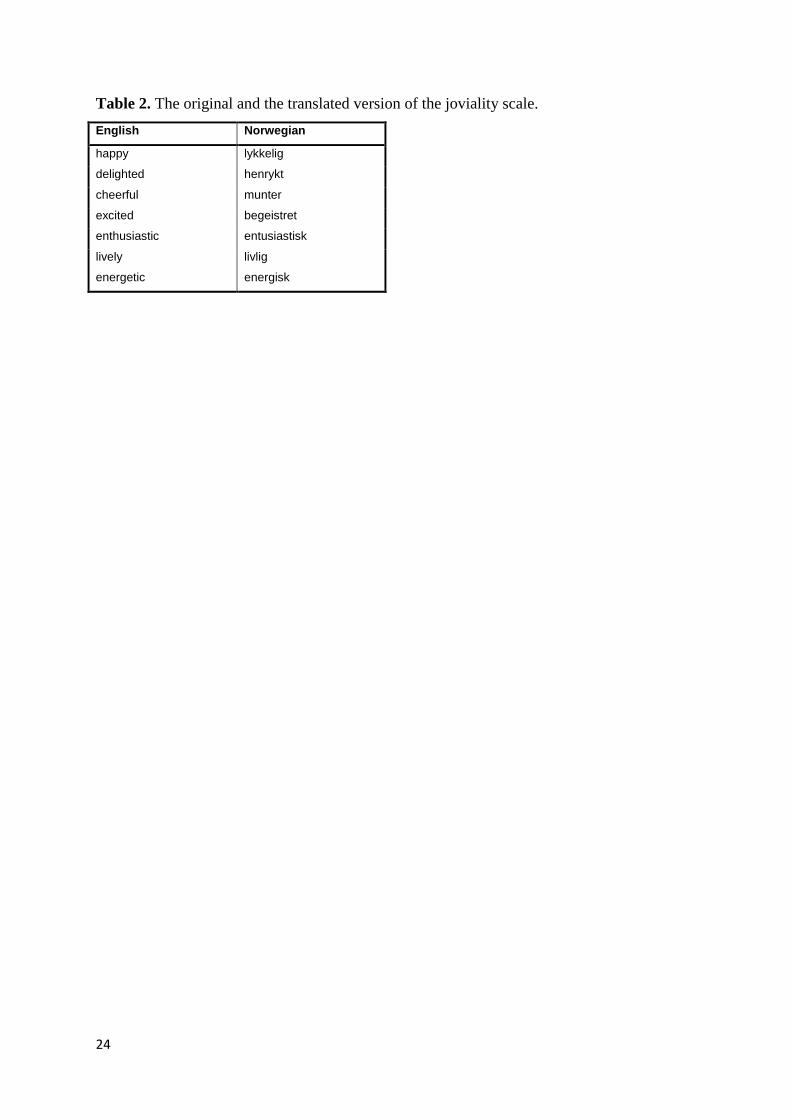
Table 2. The original and the translated version of the joviality scale. English Norwegian
happy lykkelig
delighted henrykt
cheerful munter
excited begeistret
enthusiastic entusiastisk
lively livlig
energetic energisk
24
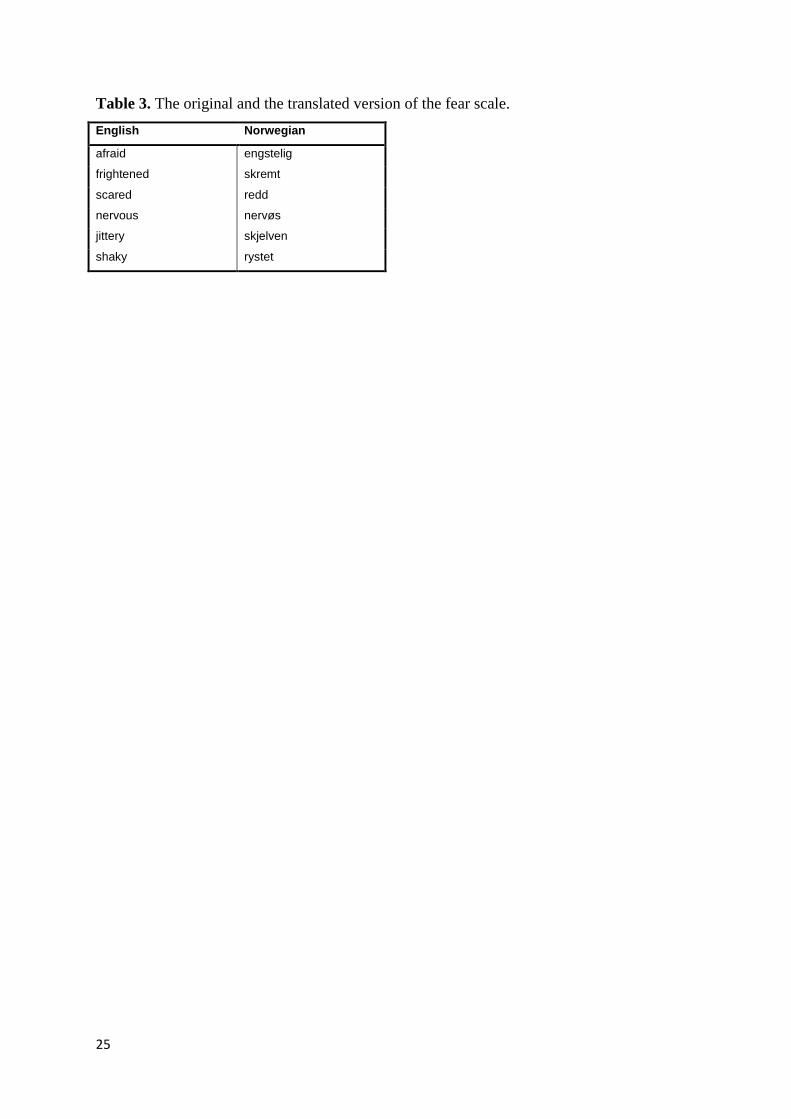
Table 3. The original and the translated version of the fear scale. English Norwegian
afraid engstelig
frightened skremt
scared redd
nervous nervøs
jittery skjelven
shaky rystet
25
Table 4, Results from the factor analysis. Rotated Component Matrixa
Component Communalities
1 2 3 4
Status 1 ,803 ,666
Power 3 ,788 ,761
Power 1 ,766 ,697
Status 5 ,729 ,648
Status 2 ,722 ,602
Power 7 ,671 ,556
Cheerful ,810 ,711
Delighted ,802 ,666
Enthusiastic ,796 ,723
Energetic ,752 ,687
Happy ,666 ,547
Excited ,648 ,615
Nervous ,849 ,750
Afraid ,842 ,755
Frightened ,816 ,684
Scared ,812 ,692
Power 6 ,837 ,757
Power 5 ,719 ,667
Power 4 ,713 ,769
Eigenvalues 5,441 4,124 2,226 1,173
Extraction Method: Principal Component Analysis. Rotation
Method: Varimax with Kaiser Normalization
26
Table 5. The reliability of the new factors.
Factor Cronbach’s Alpha
Status (Status 1, Status 2, Status 4, Power 1,
Power 3, Power 7)
0,86
Joy (cheerful, delighted, enthusiastic, energetic,
happy, excited)
0,86
Fear (scared, frightened, nervous ,afraid) 0,87
Power (Power 4,Power 5,Power 6) 0,79
27
Table 6. Descriptive statistics of the factors.
Status_factor Power_factor Fear_factor Joy_factor
Mean 3,0033 2,8595 1,6176 3,2639
Std. Deviation ,80290 ,82379 ,75428 ,73767
Kurtosis -,047 ,090 2,783 -,408
Skewness -,617 -,188 1,654 -,050
28
Table 7. Parameter difference between the two groups. Diploma students Non-diploma students
Mean Std. Error Mean Mean Std. Error Mean
Age 24,56 ,553 23,91 ,5450
Status_factor 3,5417 ,08277 2,7096 ,09698
Power_factor 2,9722 ,11682 2,7980 ,10865
Fear_factor 1,4028 ,08109 1,7348 ,10423
Joy_factor 3,5880 ,09379 3,0871 ,09416
Performance 2,2222 ,10624 1,9697 ,08895
29
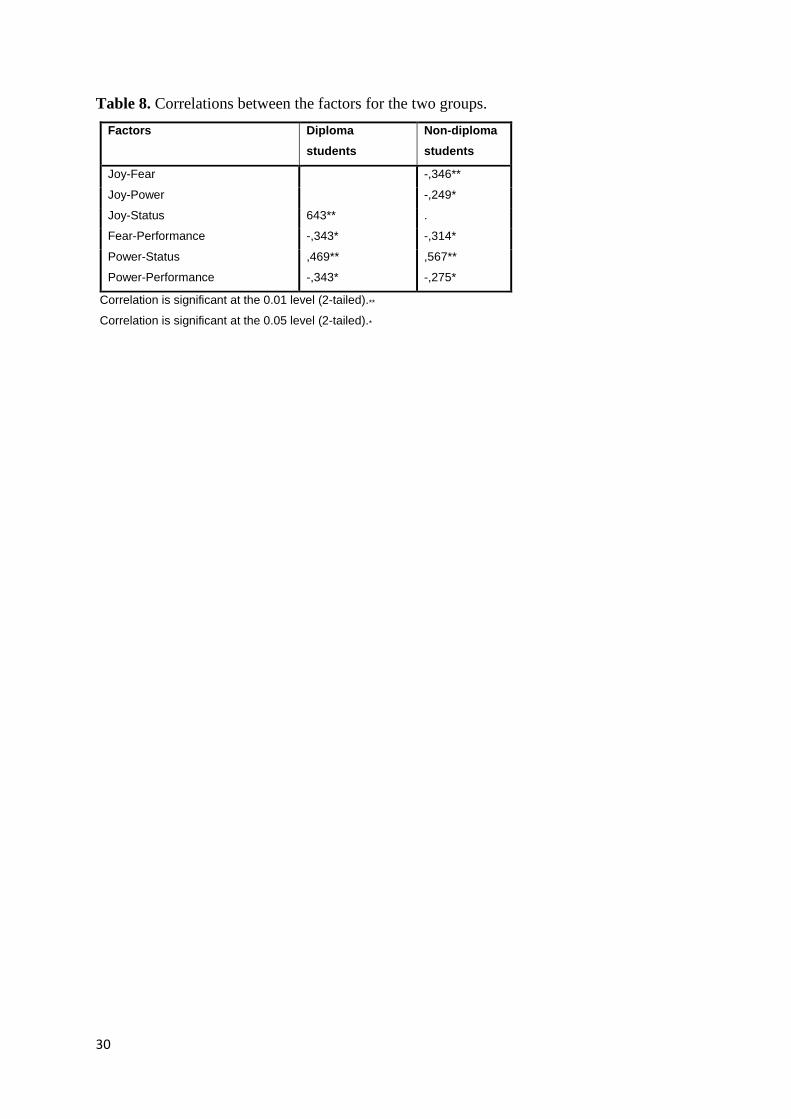
Table 8. Correlations between the factors for the two groups. Factors Diploma
students Non-diploma students
Joy-Fear -,346**
Joy-Power -,249*
Joy-Status 643** .
Fear-Performance -,343* -,314*
Power-Status ,469** ,567**
Power-Performance -,343* -,275*
Correlation is significant at the 0.01 level (2-tailed).**
Correlation is significant at the 0.05 level (2-tailed).*
30
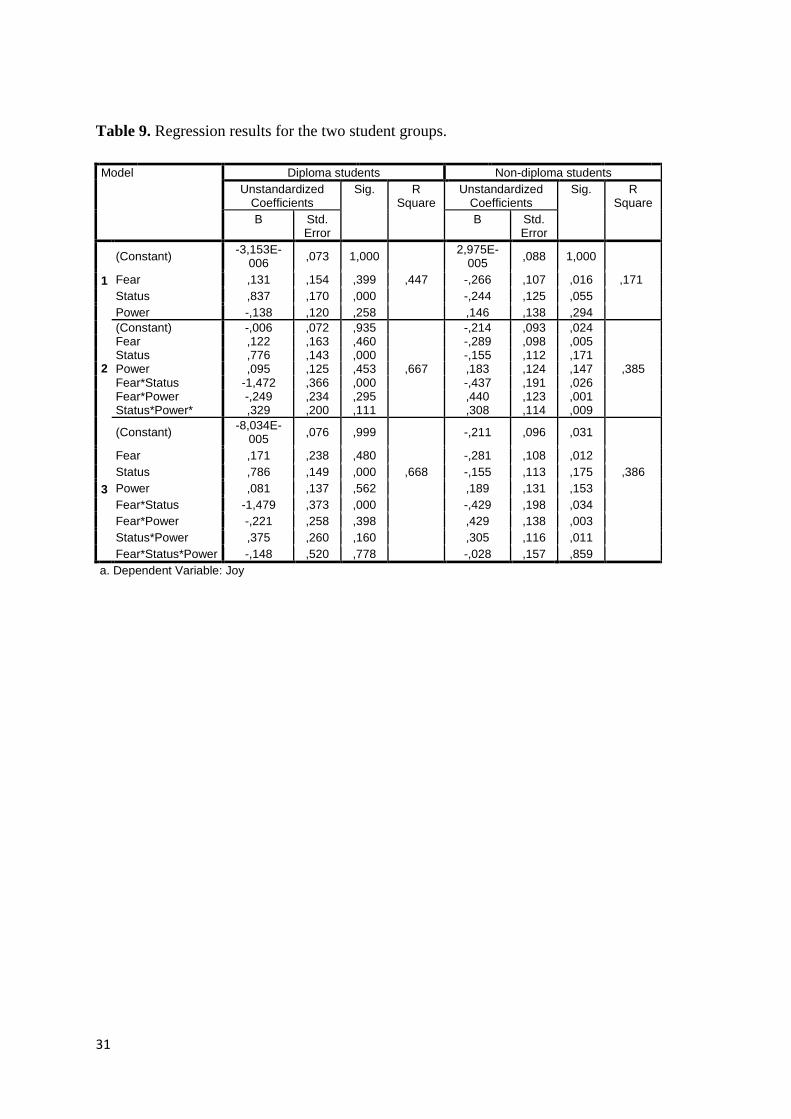
Table 9. Regression results for the two student groups.
Model Diploma students Non-diploma students Unstandardized
Coefficients Sig. R
Square Unstandardized
Coefficients Sig. R
Square B Std.
Error B Std.
Error
1
(Constant) -3,153E-006 ,073 1,000 2,975E-
005 ,088 1,000
Fear ,131 ,154 ,399 ,447 -,266 ,107 ,016 ,171 Status ,837 ,170 ,000 -,244 ,125 ,055 Power -,138 ,120 ,258 ,146 ,138 ,294
2
(Constant) -,006 ,072 ,935 -,214 ,093 ,024 Fear ,122 ,163 ,460 -,289 ,098 ,005 Status ,776 ,143 ,000 -,155 ,112 ,171 Power ,095 ,125 ,453 ,667 ,183 ,124 ,147 ,385 Fear*Status -1,472 ,366 ,000 -,437 ,191 ,026 Fear*Power -,249 ,234 ,295 ,440 ,123 ,001 Status*Power* ,329 ,200 ,111 ,308 ,114 ,009
3
(Constant) -8,034E-005 ,076 ,999 -,211 ,096 ,031
Fear ,171 ,238 ,480 -,281 ,108 ,012 Status ,786 ,149 ,000 ,668 -,155 ,113 ,175 ,386 Power ,081 ,137 ,562 ,189 ,131 ,153 Fear*Status -1,479 ,373 ,000 -,429 ,198 ,034 Fear*Power -,221 ,258 ,398 ,429 ,138 ,003 Status*Power ,375 ,260 ,160 ,305 ,116 ,011 Fear*Status*Power -,148 ,520 ,778 -,028 ,157 ,859
a. Dependent Variable: Joy
31
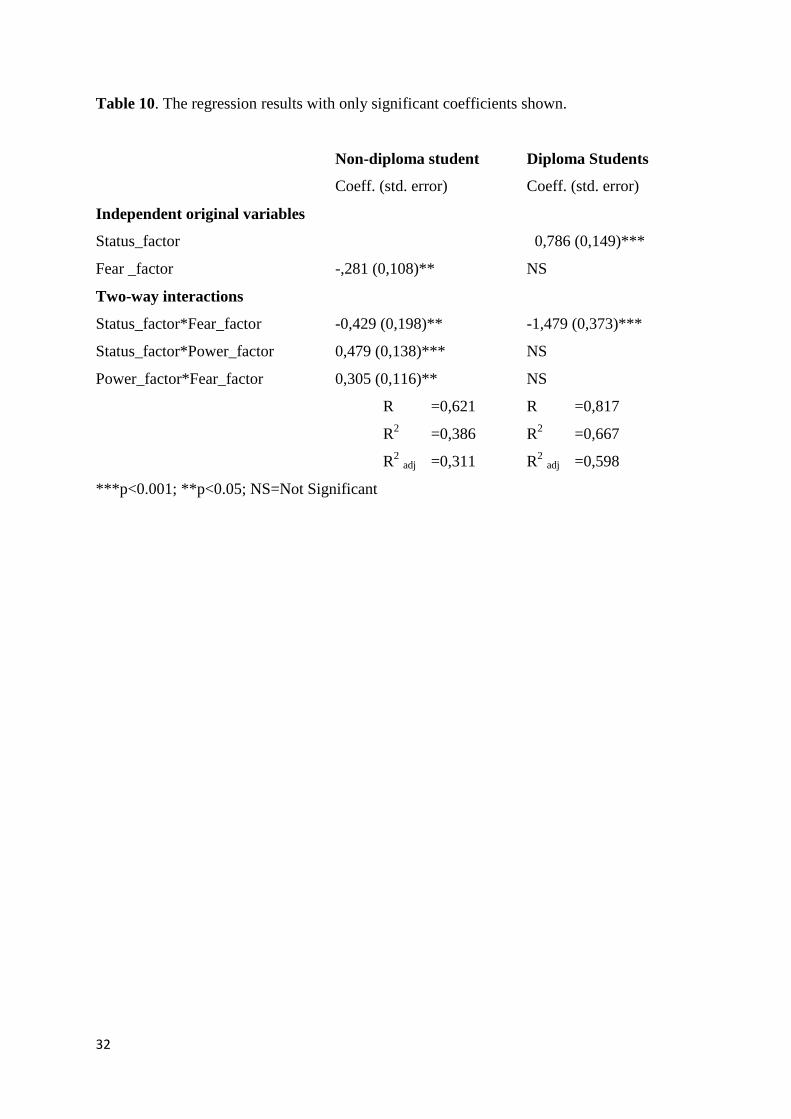
Table 10. The regression results with only significant coefficients shown.
Non-diploma student Diploma Students
Coeff. (std. error) Coeff. (std. error)
Independent original variables
Status_factor 0,786 (0,149)***
Fear _factor -,281 (0,108)** NS
Two-way interactions
Status_factor*Fear_factor -0,429 (0,198)** -1,479 (0,373)***
Status_factor*Power_factor 0,479 (0,138)*** NS
Power_factor*Fear_factor 0,305 (0,116)** NS
R =0,621 R =0,817
R2 =0,386 R2 =0,667
R2 adj =0,311 R2 adj =0,598
***p<0.001; **p<0.05; NS=Not Significant
32
Biblographical Notes
Øivind Strand, Dr. Scient., is an Associate Professor in Innovation and Entrepreneurship at the Department of International Business of Aalesund University College in Norway. His teaching and research interests relate to innovation, entrepreneurship and entrepreneurship education. He had 10 year of experience from various industrial sectors before entering academia. His has published papers in European Planning Studies, Technology Forecasting and Social Change, Journal of the American Society for Information Science and Technology, and Journal Advances in Higher Education.
Ola Jon Mork, MSc. in Industrial Economy, is an Assistant Professor in Product Development at the Department of Maritime Technology and Operations, Aalesund University College in Norway. He has broad experience as CEO in numerous companies in industry. His teaching and research interests relate to Lean Manufacturing, Innovation, Entrepreneurship, and Product Development. His published papers have appeared in Journal Advances in Higher Education, among others.
33