The Population Biology of Bacterial Plasmids: A Hidden Markov Model Approach
12
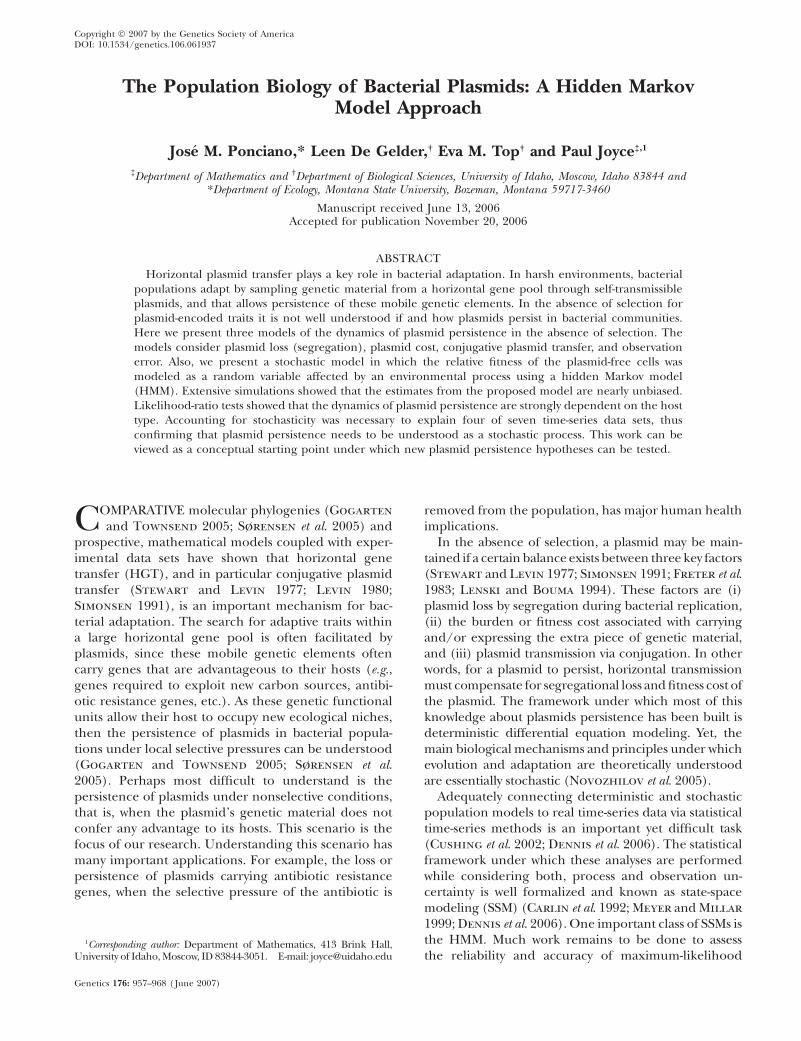
Copyright Ó 2007 by the Genetics Society of America DOI: 10.1534/genetics.106.061937 The Population Biology of Bacterial Plasmids: A Hidden Markov Model Approach Jose ´ M. Ponciano,* Leen De Gelder, † Eva M. Top † and Paul Joyce ‡,1 ‡ Department of Mathematics and † Department of Biological Sciences, University of Idaho, Moscow, Idaho 83844 and *Department of Ecology, Montana State University, Bozeman, Montana 59717-3460 Manuscript received June 13, 2006 Accepted for publication November 20, 2006 ABSTRACT Horizontal plasmid transfer plays a key role in bacterial adaptation. In harsh environments, bacterial populations adapt by sampling genetic material from a horizontal gene pool through self-transmissible plasmids, and that allows persistence of these mobile genetic elements. In the absence of selection for plasmid-encoded traits it is not well understood if and how plasmids persist in bacterial communities. Here we present three models of the dynamics of plasmid persistence in the absence of selection. The models consider plasmid loss (segregation), plasmid cost, conjugative plasmid transfer, and observation error. Also, we present a stochastic model in which the relative fitness of the plasmid-free cells was modeled as a random variable affected by an environmental process using a hidden Markov model (HMM). Extensive simulations showed that the estimates from the proposed model are nearly unbiased. Likelihood-ratio tests showed that the dynamics of plasmid persistence are strongly dependent on the host type. Accounting for stochasticity was necessary to explain four of seven time-series data sets, thus confirming that plasmid persistence needs to be understood as a stochastic process. This work can be viewed as a conceptual starting point under which new plasmid persistence hypotheses can be tested. C OMPARATIVE molecular phylogenies (Gogarten and Townsend 2005; Sørensen et al. 2005) and prospective, mathematical models coupled with exper- imental data sets have shown that horizontal gene transfer (HGT), and in particular conjugative plasmid transfer (Stewart and Levin 1977; Levin 1980; Simonsen 1991), is an important mechanism for bac- terial adaptation. The search for adaptive traits within a large horizontal gene pool is often facilitated by plasmids, since these mobile genetic elements often carry genes that are advantageous to their hosts (e.g., genes required to exploit new carbon sources, antibi- otic resistance genes, etc.). As these genetic functional units allow their host to occupy new ecological niches, then the persistence of plasmids in bacterial popula- tions under local selective pressures can be understood (Gogarten and Townsend 2005; Sørensen et al. 2005). Perhaps most difficult to understand is the persistence of plasmids under nonselective conditions, that is, when the plasmid’s genetic material does not confer any advantage to its hosts. This scenario is the focus of our research. Understanding this scenario has many important applications. For example, the loss or persistence of plasmids carrying antibiotic resistance genes, when the selective pressure of the antibiotic is removed from the population, has major human health implications. In the absence of selection, a plasmid may be main- tained if a certain balance exists between three key factors (Stewart and Levin 1977; Simonsen 1991; Freter et al. 1983; Lenski and Bouma 1994). These factors are (i) plasmid loss by segregation during bacterial replication, (ii) the burden or fitness cost associated with carrying and/or expressing the extra piece of genetic material, and (iii) plasmid transmission via conjugation. In other words, for a plasmid to persist, horizontal transmission must compensate for segregational loss and fitness cost of the plasmid. The framework under which most of this knowledge about plasmids persistence has been built is deterministic differential equation modeling. Yet, the main biological mechanisms and principles under which evolution and adaptation are theoretically understood are essentially stochastic (Novozhilov et al. 2005). Adequately connecting deterministic and stochastic population models to real time-series data via statistical time-series methods is an important yet difficult task (Cushing et al. 2002; Dennis et al. 2006). The statistical framework under which these analyses are performed while considering both, process and observation un- certainty is well formalized and known as state-space modeling (SSM) (Carlin et al. 1992; Meyer and Millar 1999; Dennis et al. 2006). One important class of SSMs is the HMM. Much work remains to be done to assess the reliability and accuracy of maximum-likelihood 1 Corresponding author: Department of Mathematics, 413 Brink Hall, University of Idaho, Moscow, ID 83844-3051. E-mail: [email protected] Genetics 176: 957–968 ( June 2007)
Transcript of The Population Biology of Bacterial Plasmids: A Hidden Markov Model Approach
Copyright � 2007 by the Genetics Society of AmericaDOI: 10.1534/genetics.106.061937
The Population Biology of Bacterial Plasmids: A Hidden MarkovModel Approach
Jose M. Ponciano,* Leen De Gelder,† Eva M. Top† and Paul Joyce‡,1
‡Department of Mathematics and †Department of Biological Sciences, University of Idaho, Moscow, Idaho 83844 and*Department of Ecology, Montana State University, Bozeman, Montana 59717-3460
Manuscript received June 13, 2006Accepted for publication November 20, 2006
ABSTRACT
Horizontal plasmid transfer plays a key role in bacterial adaptation. In harsh environments, bacterialpopulations adapt by sampling genetic material from a horizontal gene pool through self-transmissibleplasmids, and that allows persistence of these mobile genetic elements. In the absence of selection forplasmid-encoded traits it is not well understood if and how plasmids persist in bacterial communities.Here we present three models of the dynamics of plasmid persistence in the absence of selection. Themodels consider plasmid loss (segregation), plasmid cost, conjugative plasmid transfer, and observationerror. Also, we present a stochastic model in which the relative fitness of the plasmid-free cells wasmodeled as a random variable affected by an environmental process using a hidden Markov model(HMM). Extensive simulations showed that the estimates from the proposed model are nearly unbiased.Likelihood-ratio tests showed that the dynamics of plasmid persistence are strongly dependent on the hosttype. Accounting for stochasticity was necessary to explain four of seven time-series data sets, thusconfirming that plasmid persistence needs to be understood as a stochastic process. This work can beviewed as a conceptual starting point under which new plasmid persistence hypotheses can be tested.
COMPARATIVE molecular phylogenies (Gogarten
and Townsend 2005; Sørensen et al. 2005) andprospective, mathematical models coupled with exper-imental data sets have shown that horizontal genetransfer (HGT), and in particular conjugative plasmidtransfer (Stewart and Levin 1977; Levin 1980;Simonsen 1991), is an important mechanism for bac-terial adaptation. The search for adaptive traits withina large horizontal gene pool is often facilitated byplasmids, since these mobile genetic elements oftencarry genes that are advantageous to their hosts (e.g.,genes required to exploit new carbon sources, antibi-otic resistance genes, etc.). As these genetic functionalunits allow their host to occupy new ecological niches,then the persistence of plasmids in bacterial popula-tions under local selective pressures can be understood(Gogarten and Townsend 2005; Sørensen et al.2005). Perhaps most difficult to understand is thepersistence of plasmids under nonselective conditions,that is, when the plasmid’s genetic material does notconfer any advantage to its hosts. This scenario is thefocus of our research. Understanding this scenario hasmany important applications. For example, the loss orpersistence of plasmids carrying antibiotic resistancegenes, when the selective pressure of the antibiotic is
removed from the population, has major human healthimplications.
In the absence of selection, a plasmid may be main-tained if a certain balance exists between three key factors(Stewart and Levin 1977; Simonsen 1991; Freter et al.1983; Lenski and Bouma 1994). These factors are (i)plasmid loss by segregation during bacterial replication,(ii) the burden or fitness cost associated with carryingand/or expressing the extra piece of genetic material,and (iii) plasmid transmission via conjugation. In otherwords, for a plasmid to persist, horizontal transmissionmust compensate for segregational loss and fitness cost ofthe plasmid. The framework under which most of thisknowledge about plasmids persistence has been built isdeterministic differential equation modeling. Yet, themain biological mechanisms and principles under whichevolution and adaptation are theoretically understoodare essentially stochastic (Novozhilov et al. 2005).
Adequately connecting deterministic and stochasticpopulation models to real time-series data via statisticaltime-series methods is an important yet difficult task(Cushing et al. 2002; Dennis et al. 2006). The statisticalframework under which these analyses are performedwhile considering both, process and observation un-certainty is well formalized and known as state-spacemodeling (SSM) (Carlin et al. 1992; Meyer and Millar
1999; Dennis et al. 2006). One important class of SSMs isthe HMM. Much work remains to be done to assessthe reliability and accuracy of maximum-likelihood
1Corresponding author: Department of Mathematics, 413 Brink Hall,University of Idaho, Moscow, ID 83844-3051. E-mail: [email protected]
Genetics 176: 957–968 ( June 2007)

parameter estimates from population dynamics hiddenMarkov models and the inferences made from them. Arecent study in theoretical population dynamics (Dennis
et al. 2006) has shown that even in the simple case ofa linear and Gaussian SSM, the likelihood functionis highly multimodal and that the finite samples MLestimates do not enjoy good statistical properties. Thesestatistical deficiencies would be expected to vanish wheneither multiple replicated samples are taken or trueprocess replicates are observed, something that is rarelyfeasible in macroecological studies, but relatively easyto accomplish in microbial experiments. Finally, we ex-pect that a careful time-series analysis might lead to abetter understanding of plasmid persistence in bacterialpopulations.
The objective of our current work is twofold: first, weformulate, fit, and later compare deterministic andstochastic models to time-series data on plasmid persis-tence in seven bacterial strains. In doing so we considertaking into account both process and observationuncertainty using analytical methods for SSM. Second,we show via extensive simulations that the statisticalprocedures implemented here provide the means toreliably make biological inferences from plasmid in-stability time-series data (De Gelder et al. 2007). Webriefly explain the stability experiment methods used toobtain time-series data on plasmid instability and referto De Gelder et al. (2007) for technical details on theexperimental procedures. We also present a mathemat-ical modeling section in which we state and developeach one of the deterministic and stochastic models thatinclude segregation, selection, and horizontal transferprocesses used throughout the article. In a supplemen-tal data file (at http://www.genetics.org/supplemental/),the statistical methodology used to confront the mod-els with the time-series data and evaluate their per-formance is explained in detail. Finally, we discuss theimplications, significance, and weaknesses of our find-ings in light of the current studies in the area.
THEORETICAL BACKGROUND
Segregation and selection model: Our simplest dy-namic model summarizing the growth dynamics of thefraction of plasmid-free cells in the experiments de-scribed below (see materials and methods) is a simplesystem of difference equations where it is assumed thatat any generation, the abundance of the plasmid-freecells (m) increases due to (1) plasmid segregation fromthe wild-type cells (n) at a frequency l and (2) growth ofsegregants at a rate 211s, where s represents theselection coefficient
nt ¼ 2ð1� lÞnt�1;
mt ¼ 211smt�1 1 2lnt�1 ð1Þ
and the fraction of plasmid-free cells xt is given by
xt ¼mt
mt 1 nt: ð2Þ
This deterministic model was developed by De Gelder
et al. (2004) and assumes that there is no conjugationaltransfer from plasmid-carrying cells to segregants.
Throughout this article, the segregation and selec-tion (SS) model serves as our null hypothesis againstwhich more complex models and growth behaviorswere tested. The solution to the SS model is presentedin De Gelder et al. (2004, appendix a). This fraction ofplasmid-free cells grows logistically starting very close to0 and approaching 1 as t/‘. We note that Joyce et al.(2005) also showed that it can be assumed that thedeterministic growth of plasmid-free cells is basicallyunaffected by the daily bottlenecks described below(materials and methods).
Horizontal transfer model: A horizontal transfer(HT) model can be generated from Equation 1 byincorporating a term that accounts for the fraction ofplasmid-free cells that reacquire the plasmid throughconjugative transfer. The typical approach to modelconjugation (Levin 1980; Simonsen 1991; Stewart
and Levin 1977) is to use the mass-action principle,where the rate at which conjugation occurs dependslinearly on the concentration of plasmid-free andplasmid-carrying cells. Using the mass-action principle,the horizontal transfer model where g represents aconstant conjugative transfer frequency would be writ-ten as follows:
nt ¼ 2ð1� lÞnt�1 1 211sgmt�1nt�1;
mt ¼ 211sð1� gnt�1Þmt�1 1 2lnt�1: ð3Þ
Here we model conjugation by relaxing the mass-action principle with the following system of equations,
nt ¼ 2ð1� lÞnt�1 1 211smt�1gð1� xt�1Þ
u 1 ð1� xt�1Þ; ð4Þ
mt ¼ 1� gð1� xt�1Þ
u 1 ð1� xt�1Þ
� �211smt�1 1 2lnt�1; ð5Þ
where xt is the fraction of segregants at time t (2), g is anasymptotic maximum conjugation frequency during atime interval, and u represents the fraction of theplasmid-carrying cells at which the frequency of con-jugations is half its maximum. The second term inEquation 4 assumes that the transfer process works as inan enzymatic reaction, where enzyme and substrate arethe plasmid-carrying and plasmid-free cells, respectively(Andrup and Andersen 1999).
The system of Equations 4 and 5 can be readilyreduced to a single model equation for the fraction xt ofplasmid-free cells at time t :
xt ¼(1� gð1�xt�1ÞÞ=½u 1 ð1� xt�1Þ�211sxt�1 1 2lð1� xt�1Þ
211sxt�1 1 2ð1� xt�1Þ:
ð6Þ
958 J. M. Ponciano et al.

A local stability analysis (Kot 2001) shows thatthis model has three equilibrium solutions, the simplestof which is xw
1 ¼ 1. The other two solutions xw2 and
xw3 are ð � B6
ffiffiffiffiffiffiffiffiffiffiffiffiffiffiffiffiffiffiffiffiB2 � 4ACp Þ=2A, where A ¼ (2s � 1,
B ¼ ððu 1 1Þð2s � 1Þ1 l 1 2sgÞ, and C ¼ �l(u 1 1).The equilibrium solution xw
1 ¼ 1 is stable as long as theplasmid burden s is big enough to satisfy
g
u$ 1� 1� l
2s ; ð7Þ
provided u . g . As it is illustrated in Figure 1, when thesolution xw
1 ¼ 1 is stable, the plasmid-carrying cells areguaranteed to be lost from the population. When s istoo small so that inequality 7 is not satisfied, theequilibrium solution xw
1 ¼ 1 becomes unstable andone of the other two solutions of the model, the oneinside the interval (0, 1), (xw
2 ), becomes stable. This newequilibrium solution basically predicts that plasmids willnever be lost from the population.
Note that inequality 7 is readily interpretable: Sincethe fraction g/u is a measure of the intensity of thetransfer frequency, this formula basically states that ahigh loss of plasmids due to segregation must bebalanced by a high transfer frequency for the plasmidsto persist in the population. Likewise, a high cost woulddecrease the fraction (1� l)/2s and hence increase thesize of the transfer-frequency threshold needed toguarantee the persistence of plasmids in the popula-tion. This property of the HT model is analogous to theresults of Stewart and Levin (1977), who found that ina chemostat, plasmids can be maintained only when thecell density and conjugational transfer rate constant arelarge enough for the transmission of the plasmid toovercome its loss through segregation and the selectionagainst plasmid-carrying bacteria. However, we note thatthe HT model also shows that, when the frequencydependence in transfer is strong, i.e., at higher values of
u, the persistence threshold g/u becomes smaller andthe loss of plasmids through segregation and selectioncan be more easily overcome. If the loss by segregationand the frequency of frequency-dependent transfer arekept fixed, a reduction in the size of the cost s down to acritical value (see inequality 14) allows the invasion ofplasmids in the population. This behavior is visualizedby plotting both solution trajectories and the growthrate of the fraction of plasmid-free cells at differentvalues of s (see Figure 1). As the plasmid burden s
decreases, the growth rate ceases to be parabolic inshape (as in a typical logistic growth curve) and adopts acubic-like form with a root inside the interval (0, 1),which is a stable equilibrium. That is, it is the pointwhere the long-term fraction of plasmid-free bacteriastagnates, thus predicting a long-run coexistence be-tween plasmid-free and plasmid-carrying bacteria.
The variable selection model: The dynamic equa-tions explained so far assume that during an entireplasmid stability experiment the growth of the fractionof plasmid-free cells follows essentially a deterministicpattern. That is, all the deviations from the determin-istic smooth growth Equations 1, 2, 4, and 5 that appearin the data are assumed to be pure random samplingerror. However, theory and experiments (De Visser andRozen 2005) suggest that during a 600-generationsexperiment, the occurrence of compensatory mutationsand/or a variable host-dependent plasmid burdenwould dramatically alter the plasmid loss dynamics.Periods of overall heavy plasmid loss would be followedby periods in which the relative frequency of segregantsremains almost unchanged. Therefore, as an alternativehypothesis, we propose a stochastic formulation of thesegregants growth dynamics that assumes that at eachtime step, the burden is a value drawn from a continu-ous probability distribution. By doing so, the fraction ofplasmid-free cells grows stochastically. This variableselection (VS) model is then recognized as a model
Figure 1.—Sample deterministic trajec-tories (left) and growth rates (right) ofthe horizontal transfer (HT) model. Theseplots illustrate that for certain parametervalues, the HT model predicts that a long-term coexistence of plasmid-free and plas-mid-carrying cells will occur. When coexis-tence is predicted, the growth rate of thesegregants fraction as a function of the frac-tion of plasmid-free cells adopts a cubic-likeform reminiscent of an Allee effect model.Here, however, the interior equilibrium isstable and not unstable as in typical Allee ef-fect models. The different curves correspondto different plasmid cost s values. The otherparameters remained fixed. The parametervalues used were close to the ML estimatesfor the strain P21: l ¼ 6.851044 3 10�05,u ¼ 0.25, g ¼ 2.443239 3 10�02.
A Hidden Markov Model Approach 959

with environmental stochasticity (Lewontin and Cohen
1969; Keiding 1975; Cushing et al. 2002). Hence, tospecify our variable selection model we let the selectioncoefficient be drawn at each time step from a Normaldistribution (Lewontin and Cohen 1969; Keiding
1975) St with mean m and variance t2. Then, the VSmodel can be written as
Nt ¼ 2ð1� lÞNt�1; ð8Þ
Mt ¼ 211St Mt�1 1 2lNt�1; ð9Þ
Xt ¼Mt
Mt 1 Nt¼ Xt�1211St 1 2lð1� Xt�1Þ
Xt�1211St 1 2ð1� Xt�1Þ; ð10Þ
where uppercase letters denote random variables andlowercase letters hereafter are used to denote realiza-tions of the random variables involved. Then Xt be-comes a Markov process whose transition probabilitydensity function (pdf) is found to be (appendix):
fðXt jXt�1ÞðxtÞ ¼ð1� lÞ
ln 2ðxt � lÞð1� xtÞffiffiffiffiffiffiffiffiffiffi2pt2p exp
�ðht � mÞ22t2
� �;
ð11Þ
where
ht ¼ln ½ð1� xt�1Þðxt � lÞ� � ln ½xt�1ð1� xtÞ�
ln 2
and xt . l. The transition pdf (Equation 11) provides usthe means to characterize the behavior of Xt viaanalytical and simulation results. Also, this pdf providesthe proper link between parameter estimation and thehypothesized biological process.
MATERIALS AND METHODS
Stability experiments and time-series data: To investigatewhether the ability of a broad-host-range plasmid to be stablymaintained in a bacterial population varies between differenthosts, plasmid stability experiments were performed withdifferent bacterial strains carrying the same plasmid pB10, asdescribed by De Gelder et al. (2005, 2007). The experimentalapproach is briefly summarized below. The 64.5-kb plasmidpB10 (Schluter et al. 2003), isolated from the bacterialcommunity of a wastewater treatment plant (Droge et al.2000), is a self-transmissible, BHR IncP-1b plasmid thatmediates resistance to the antibiotics tetracycline (Tc), strep-tomycin (Sm), amoxicillin, and sulfonamide and to HgCl2. Foreach strain, stability experiments were performed in triplicate,starting from three separate colonies, which were each in-oculated in 5 ml LB with the appropriate concentrations of Tcand Sm to select for pB10. After incubation for 24 hr, thesecultures were washed to remove the antibiotics by spinningdown 1 ml culture and resuspending the pellet in 1 ml saline.From these cell suspensions, 4.88 ml was transferred to 5 ml ofLB such that the cells went through 10 generations of growthduring each 24-hr growth cycle. These freshly inoculatedcultures constituted time point zero. After they were plated
on LB plates and an aliquot was archived at �80�, they wereincubated on a rotary shaker for 24 hr. Then, 4.88 ml of the full-grown cultures was transferred each 24 hr to fresh 5 ml LB.These were the daily bottlenecks mentioned in the theoret-
ical background section. At various time points, the cultureswere diluted and plated on LB plates. The fraction of plasmid-free cells in the population was determined by replica picking50 colonies per culture at random from the LB plates ontoLB–Tc, LB–Sm, and LB plates and scoring Tc�Sm� colonies.Random Tc�Sm� isolates of each strain were confirmed as truesegregants through comparison of their genomic fingerprints(BOX PCR) (Rademaker et al. 1997) with those of the originalstrains from which they were derived and through gel elec-trophoresis of plasmid extracts (Kado and Liu 1981; Top et al.1990). The time-series data thus obtained were analyzed usingthree population dynamics models.
Statistical analysis: Deterministic modeling (sampling error withno environmental noise): A sample of size dtj colonies was taken atrandom from a replicated culture j, j¼ 1, 2, . . . , r, at day t. Eachindividual has a probability xt of being a segregant and (1� xt)of being a wild type, where xt is the model-predicted fraction ofsegregants at generation t. This defines a binomial samplingprocess with dtj trials and the fraction of segregants xt changesdeterministically in time according to the dynamic Equations1, 2, 4, and 5. Then, the number of plasmid-free cells observedin culture j at day t, denoted Ytj, is a binomial random variable,and
PðYtj ¼ ytjÞ ¼dtj
ytj
� �x
ytjt ð1� xtÞdtj�ytj : ð12Þ
The two deterministic models, SS (Equations 1 and 2) andHT (Equations 4 and 5), with the sampling process defined byEquation 12, account for the deviations of the observationsfrom the predicted growth pattern. Therefore, the next step inthe model-building process was to rigorously connect the datawith the model using the above binomial sampling process.This was done using the method of maximum likelihood (Rice
1995) in the case of the SS and HT models, as in De Gelder
et al. (2004). For these two models, a likelihood-ratio test(LRT) was carried out, where under the null hypothesis thedata were binomially distributed according to Equation 12,and under the alternative hypothesis the data were stillbinomially distributed but with a different mean ptj unrelatedto the model. Under the null hypothesis, the estimated meantrend is dE½Ytj � ¼ dtj bxt , where bxt is the model-predicted fractionof segregants at generation t using the ML estimates for theparameters s, l, g, u, and x0. Under the alternative hypothesis,the estimated mean trend is dE½Ytj � ¼ dtj bptj , where bptj is just theempirical estimate of the segregants’ proportion at replicate jand generation t. After taking the natural logarithm andmultiplying by �2, the LRT L reduces to
�2 ln L ¼ �2Xq
t¼1
Xr
j¼1
ytj
hlnðbxtÞ � lnð bptjÞ
i
1 ðdtj � ytjÞhlnð1� bxtjÞ � lnð1� bptjÞ
i: ð13Þ
To approximate the distribution of�2 ln L we used param-etric bootstrap likelihood-ratio tests (Efron and Tibshirani
1993) and proceeded as in De Gelder et al. (2004). While thechi-square distribution is often used to approximate thedistribution of �2 ln L, it is valid only if the sample sizes arelarge enough. The asymptotic theory is known to be unreliablefor small sample sizes, which is exactly the case in our dataduring the early time periods. Our approach has the advan-tage that it does not rely on asymptotic theory and the accuracy
960 J. M. Ponciano et al.

of the approximation is determined by the number of simu-lations, which we can completely control. A more extensivediscussion of this issue appears in De Gelder et al. (2004,p. 1137).
Stochastic modeling (sampling error plus environmental noise):To carry out parameter estimation for the stochastic model inEquations 8–10, we reformulate it as a SSM or HMM. For eachreplicated time series of the process, we denote its realizationsas Xt,j, t ¼ 1, 2, . . . , q, and j ¼ 1, 2, 3. The stochastic growthequation that governs each of the unobserved Xt,j randomrealizations is therefore given by (see Equation 10)
Xt;j ¼Xt�1;j 2
11St 1 2lð1� Xt�1;jÞXt�1;j2
11St;j 1 2ð1� Xt�1;jÞ: ð14Þ
Given an (unobservable, or ‘‘hidden’’) replicated randompath Xj¼ ½X1,j, X2,j, . . . ,Xq,j�9 that starts from a fixed (unknown)proportion of plasmid-free cells x0,j, each observation in thevector of recorded plasmid-free colonies counts Yj ¼ ½Y0,j, Y1,j,Y2,j, . . . ,Yq,j�9 is assumed to be drawn from a binomial prob-ability distribution with samples sizes dj¼ ½d0,j, d1,j, . . . ,dq,j�9 andprobabilities vector
x0;j
Xj
� �:
That is,
ðYj j XjÞ � Binom dj;x0;j
Xj
� �� �: ð15Þ
Note that Equation 15 differs from Equation 12 in animportant way: In Equation 15, except for x0,j, the probabilitiesused to evaluate the binomial sampling distribution are them-selves random variables and not fixed quantities as in Equation12. Equation 14 is called the ‘‘state equation’’ and Equation 15 iscalled the ‘‘observation equation.’’ Together, Equations 14 and15 constitute the state-space model formulation (Dennis et al.2006) of the segregation-selection problem.
We used a Monte Carlo technique to retrieve the maximizedlikelihood scores and carry out model selection. The maxi-mized likelihood scores were computed by evaluating thelikelihood function of the observed time series at the MLestimates. Let u ¼ ½l, m, t2, x0, 1, x0, 2, . . . , x0,r�9 be the modelparameters of interest for r replicated time series of theprocess. Then, the likelihood function of the observed timeseries for these r replicates, denoted by L(u), is
LðuÞ ¼ Pð½Y1;Y2; . . . ;Yr� juÞ ¼Yr
j¼1
PðYj juÞ
¼Yr
j¼1
ðPðYj ju;XiÞPðXj juÞdXj: ð16Þ
The integral in Equation 16 cannot be computed directly andwas approximated using importance sampling as in George andThompson (2002). Before doing so, the ML estimates of themodel parameters were computed using Gibbs sampling Carlin
et al. (1992). However, we note that the methods used heregeneralize their approach, as Carlin et al. (1992) treat only thecase in which the state and observation equations have additivestate and observation errors into their nonlinear and non-Gaussian models. Carlin et al. (1992) formulated their methodsusing the Bayesian paradigm of statistical estimation. In De
Gelder et al. (2007), however, we adopted the frequentistperspective to find the SS and HT model parameter estimates.So, to make the results of the SS model comparable to those ofDe
Gelder et al. (2004, 2007), we adopted the strategy of George
and Thompson (2002) and used the Bayesian methodology ofCarlin et al. (1992) just as a numerical device to compute the MLestimates of the VS model parameters: By adopting uniformpriors for all the parameters, the posterior modes of the param-eters of interest are equivalent to the ML estimates.
In the supplemental data (at http://www.genetics.org/supplemental/), we present first the Gibbs sampling algorithmfor a single time series of plasmid stability, with no replicas.Then we extend this procedure to the case in which a number rof replicated time series are recorded. We also present therethe details of an extensive simulation experiment performedto evaluate the performance of the parameter estimationmethod, using the concept of bootstrap (Efron and Tibshirani
1993). Also, in the supplemental data we explain in detail thecalculation of the likelihood Equation 16. For a very gooddescription of the Gibbs sampling algorithm, and why it works,we refer the reader to Casella and George (1992).
RESULTS
Results of fitting the models to the plasmid stabilitydata via LRTs: The different mathematical models werefitted to time-course data that represent the stability ofplasmid pB10 in seven different hosts (2). In Figure 2,top, we plotted the model predicted fraction of segre-gants’ growth along with the replicated data, for strainsH2 and R28 under the SS model and for strain P21under the HT model. The results of the SS model fittingto the plasmid stability time series (Table 1 and Figure 2,top) showed that for the strains Pseudomonas putida H2and P. koreensis R28 only two simple factors, plasmid costand the segregation frequency, were necessary toexplain the segregant fraction time series and most ofthe variation in the data, as confirmed by the absolutegoodness-of-fit P-values. For Stenotrophomonas malthophiliaP21, fitting the SS model was not sufficient and it wasnecessary (Figure 2) to include frequency-dependentplasmid transfer in the deterministic model equations.For the strains P. plecoglossicida P18, P. veronii S34,Ochrobactrum tritici S55, and Ensifer adhaerens S96, bothdeterministic models failed to fit the data as they showedmore variability than what could have arisen fromsimple random sampling off the deterministic trajecto-ries (Figure 2, Equations 1, 4, and 5). For these strainsthe VS model provided an adequate explanation of thedata. Finally, note that if two models are nested, the MLscore of the more complex model has to be the biggest.In Table 1, for the strains H2 and R28, after rounding,the ML score of models HT and SS are the same. Recallthat in the HT model, when g ¼ 0, the HT model isidentical to the SS model. As we show in De Gelder et al.(2007), the ML estimates of g for these two strains are2.11E� 09 and 1.99E� 30 respectively. Thus, the ML esti-mate under the HT model for these strains basically saysthat g� 0. Therefore, the HT model estimates convergeto the SS model and hence their maximum-likelihoodscores must be nearly identical. For the S55 strain theestimate of g is 1.348896E-05, and, although this number
A Hidden Markov Model Approach 961

is also close to 0, we note that neither the SS nor the HTmodel fits the data and that these models were rejectedaccording to the absolute goodness-of-fit test.
Results of predicted growth patterns: The SS and HTmodels predict a smooth trajectory and the deviations ofthe data from those trajectories were assumed to be dueto sampling noise (see Figure 2). The SS and HT modelhave the advantage of providing a very simple explana-tion of the data, yet they explain only a small number ofgrowth patterns. In Figure 2, bottom, we plotted therecorded data for each replicated stability experiment ofthe strain P18, along with the posterior mode of theestimated trajectory under the VS model. Following theHMM assumptions, the process of growth is itselfstochastic, so that the recorded data set would notdeviate from a smooth unknown trajectory, but insteadfrom a variable growth pattern. Thus, Figure 2, bottom,should not be interpreted as a typical ‘‘observed vs.predicted’’ plot. A major advantage of the VS model is
that it can explain much more complex growth patterns.Its one disadvantage is that it does not provide a preciseexplanation as to what might cause the variation in selec-tion over time. How well the VS model approximates amore mechanistic model is a topic for further research.
Results of the stability analysis under the HT model:As explained before, the plots in Figure 1 reveal thatthere exist particular combinations of parameter valuesfor which a long-term coexistence of plasmid-free andplasmid-carrying bacteria is predicted. Figure 3 depictsexplicitly the regions of the parameter space for whichthis coexistence occurs. Take for instance the firstsubplot in Figure 3, where the plasmid burden s islocated in the abscissa and the segregation frequency l
is in the ordinate. The picture inside these axes wasproduced as follows: First, note that solving for s ininequality 7, it follows that for fixed (biologicallymeaningful) values of u, l, and g, xw
1 ¼ 1 is stable (i.e.,the plasmid will always go extinct) whenever
Figure 2.—For each of four bacterial strains (H2, R28, P21, and P18) the data (solid circles) and the estimated model trajec-tories (lines) are plotted. (Top) Maximum-likelihood observation error fit of the dynamic Equation 1 for H2 and R28 and Equa-tions 4 and 5 for P21. There, it is assumed that the underlying trajectories obey a deterministic dynamic equation (solid line) andthat any deviation from that trajectory seen in the data (solid circles) is attributed to sampling error. (Bottom) A process noise plusobservation error fit for each of the three replicates of strain P18. The model parameters were estimated using the three replicatessimultaneously and are presented separately with a different vertical scale for clarity. In each case, the open circles joined by a solidline show the observations and the solid circles represent the location of the underlying estimated trajectory (the Xt process) fromwhich the observations were assumed to be drawn.
962 J. M. Ponciano et al.
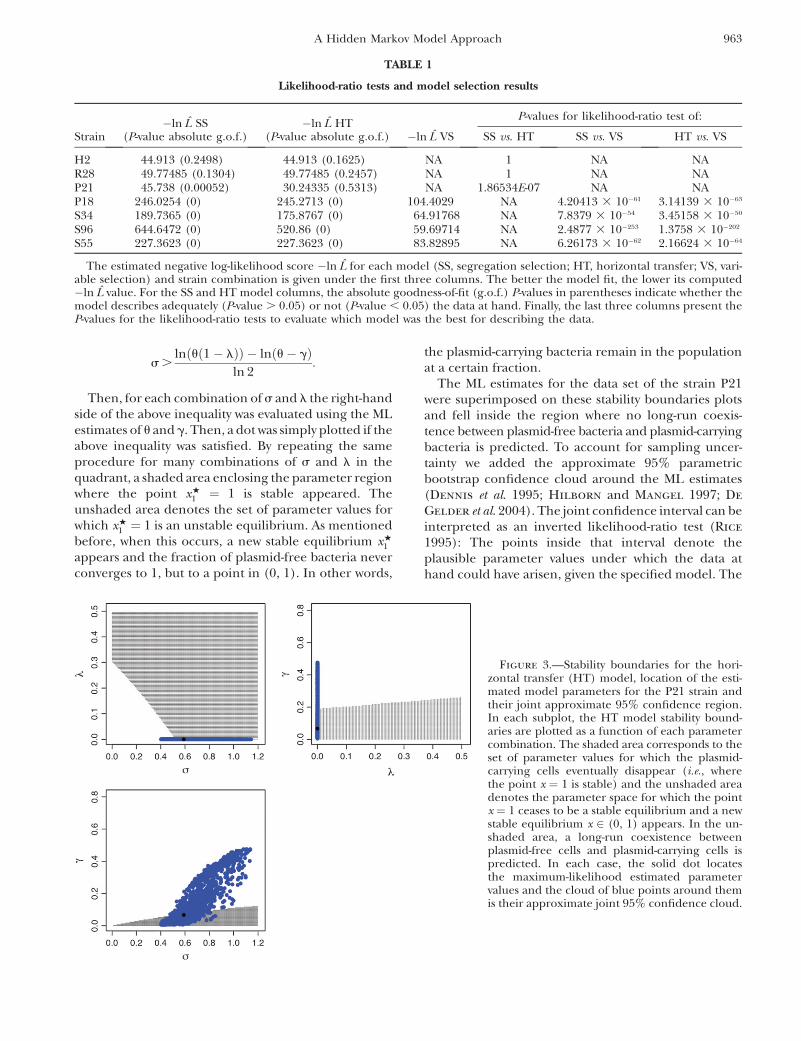
s .lnðuð1� lÞÞ � lnðu� gÞ
ln 2:
Then, for each combination of s and l the right-handside of the above inequality was evaluated using the MLestimates of u and g. Then, a dot was simply plotted if theabove inequality was satisfied. By repeating the sameprocedure for many combinations of s and l in thequadrant, a shaded area enclosing the parameter regionwhere the point xw
1 ¼ 1 is stable appeared. Theunshaded area denotes the set of parameter values forwhich xw
1 ¼ 1 is an unstable equilibrium. As mentionedbefore, when this occurs, a new stable equilibrium xw
1
appears and the fraction of plasmid-free bacteria neverconverges to 1, but to a point in (0, 1). In other words,
the plasmid-carrying bacteria remain in the populationat a certain fraction.
The ML estimates for the data set of the strain P21were superimposed on these stability boundaries plotsand fell inside the region where no long-run coexis-tence between plasmid-free bacteria and plasmid-carryingbacteria is predicted. To account for sampling uncer-tainty we added the approximate 95% parametricbootstrap confidence cloud around the ML estimates(Dennis et al. 1995; Hilborn and Mangel 1997; De
Gelder et al. 2004). The joint confidence interval can beinterpreted as an inverted likelihood-ratio test (Rice
1995): The points inside that interval denote theplausible parameter values under which the data athand could have arisen, given the specified model. The
TABLE 1
Likelihood-ratio tests and model selection results
Strain�ln L SS
(P-value absolute g.o.f.)�ln L HT
(P-value absolute g.o.f.)
P-values for likelihood-ratio test of:
�ln L VS SS vs. HT SS vs. VS HT vs. VS
H2 44.913 (0.2498) 44.913 (0.1625) NA 1 NA NAR28 49.77485 (0.1304) 49.77485 (0.2457) NA 1 NA NAP21 45.738 (0.00052) 30.24335 (0.5313) NA 1.86534E-07 NA NAP18 246.0254 (0) 245.2713 (0) 104.4029 NA 4.20413 3 10�61 3.14139 3 10�63
S34 189.7365 (0) 175.8767 (0) 64.91768 NA 7.8379 3 10�54 3.45158 3 10�50
S96 644.6472 (0) 520.86 (0) 59.69714 NA 2.4877 3 10�253 1.3758 3 10�202
S55 227.3623 (0) 227.3623 (0) 83.82895 NA 6.26173 3 10�62 2.16624 3 10�64
The estimated negative log-likelihood score �ln L for each model (SS, segregation selection; HT, horizontal transfer; VS, vari-able selection) and strain combination is given under the first three columns. The better the model fit, the lower its computed�ln L value. For the SS and HT model columns, the absolute goodness-of-fit (g.o.f.) P-values in parentheses indicate whether themodel describes adequately (P-value . 0.05) or not (P-value , 0.05) the data at hand. Finally, the last three columns present theP-values for the likelihood-ratio tests to evaluate which model was the best for describing the data.
Figure 3.—Stability boundaries for the hori-zontal transfer (HT) model, location of the esti-mated model parameters for the P21 strain andtheir joint approximate 95% confidence region.In each subplot, the HT model stability bound-aries are plotted as a function of each parametercombination. The shaded area corresponds to theset of parameter values for which the plasmid-carrying cells eventually disappear (i.e., wherethe point x ¼ 1 is stable) and the unshaded areadenotes the parameter space for which the pointx ¼ 1 ceases to be a stable equilibrium and a newstable equilibrium x 2 (0, 1) appears. In the un-shaded area, a long-run coexistence betweenplasmid-free cells and plasmid-carrying cells ispredicted. In each case, the solid dot locatesthe maximum-likelihood estimated parametervalues and the cloud of blue points around themis their approximate joint 95% confidence cloud.
A Hidden Markov Model Approach 963

(blue) cloud of points in Figure 3 lies within both theshaded and unshaded areas. Therefore, due to thisobservation it cannot be concluded that the plasmidswill always be completely lost in the population inrepeated experiments, using the strain P21.
Assessing the reliability and accuracy of the variable-selection (VS) model via simulations: To assess theperformance of the HMM formulation of the VS model,an extensive simulation study was performed. Data were
simulated under the assumptions of the VS model usingthe parameter values x0 ¼ 0.0066, m ¼ 0.01166667 pergeneration, t2 ¼ 0.1583333 per generation, and l ¼1.533333 3 10�05 per generation. Figures 4–6 were allbased on simulated data sets.
Assessing how well the HMM formulation of the VSmodel predicted the underlying frequency dynamicswas done as follows: A single simulated trajectory of thegrowth of the frequency of segregants over time underthe VS model was produced and plotted in Figure 4 withtriangles. Then, a random sample under the binomialmodel Equations 14 and 15 with 50 trials and probabilityequal to the size of the segregants fraction at each timestep was taken. Those samples were then treated as anobserved data set and plotted with open circles in Fig-ure 4. The samples were then analyzed using the Gibbssampling algorithm (see the supplemental data file athttp://www.genetics.org/supplemental/). The resultswere plotted with solid circles in Figure 4. As Figure 4suggests, the VS model does well at predicting theunderlying frequency dynamics.
The parameter estimation method (see the supplemen-tal data file at http://www.genetics.org/supplemental/)for the HMM formulation of the segregants’ popula-tion dynamics provides reliable estimates of the plasmidcost and plasmid segregation frequency. One thousanddata sets containing each three replicated time seriesof length 22 were simulated using the VS model. Foreach replicated realization of the process within eachone of the ‘‘true’’ 1000 data sets, one random sampleusing the binomial observation error model was gener-ated, thus obtaining 3000 simulated ‘‘observed’’ timeseries. The simulated observed time series were used toestimate (1) the posterior distributions of the model
Figure 4.—Example of a simulated trajectory under thevariable selection (VS) model (triangles), sampled observa-tions from the trajectory according to a binomial samplingprocess (open circles) and the HMM estimates of the true sim-ulated trajectory (solid circles) using only the observations(open circles). The parameter values used for the simulationsare x0 ¼ 0.0066, m ¼ 0.01166667 per generation, t2 ¼0.1583333 per generation, and l ¼ 1.533333 3 10�05 pergeneration.
Figure 5.—Evaluation of the performance of the HMM parameter estimation methods. One thousand data sets containingthree replicated time series of plasmid loss each were simulated using the VS model plus binomial sampling error. For each dataset, the posterior modes of the model parameters were found and the thus-obtained set of 1000 posterior modes for each param-eter was plotted in a histogram and compared against the true values used to simulate (vertical lines).
964 J. M. Ponciano et al.

parameters and (2) the posterior distributions of thetrue simulated trajectories. Thus, 1000 posterior distri-butions were obtained for each of the model parame-ters m, t2, and l.
The posterior modes of the model parameters poste-rior distributions were retrieved each time and wereplotted in a histogram and compared to the true valuesused to generate the simulations in Figure 5. Becauseuniform priors were used throughout, the posteriormodes of the model parameters are identical to theML estimates of the model. Therefore, the variabilityaround the mode of the posterior modes histograms isan estimate of the variance of the ML estimates. In thesehistograms, the 3 modes of the ML estimates of themodel parameters m, t2, and l lay very close to the true
values, thus showing that the HMM parameter estima-tion framework provides nearly unbiased estimates ofthe model parameters. Also, the posterior distributionsof the estimates of each point in the simulated truetrajectories were computed (thus obtaining a total of3000 3 22 posterior distributions). The posterior modeof each of those 3000 3 22 posterior distributions wascomputed and the difference between those modes andthe true unknown trajectory point values was computedand plotted as histograms in Figure 6. The mode ofthose histograms lies in general right above 0, implyingthat the mode of the ML estimates is usually an unbiasedestimate. The mode of the ML estimate of x0 was�0.050and thus conveyed a biased estimate of the true originalvalue x0 ¼ 0.0066. A closer inspection of the Monte
Figure 6.—Evaluation of the performance of the HMM parameter estimation methods. One thousand data sets containingthree replicated time series of plasmid loss each where simulated using the VS model plus binomial sampling error. For eachdata set, the posterior modes of the underlying (unseen) trajectory were estimated and their difference against the true simulatedtrajectory was computed. The 1000 sets of differences between the posterior mode of the X process trajectories and the true sim-ulated value of the X process are shown as histograms, from day 0 to day 21.
A Hidden Markov Model Approach 965

Carlo Markov chains generated using Gibbs samplingand simulations not presented here showed that theGibbs algorithm had trouble converging for x0.
DISCUSSION
The patterns generated by the dynamics of plasmidloss in seven bacterial strains were effectively explainedby our deterministic and stochastic population dynam-ics models. The segregation selection and horizontaltransfer models with added observation noise togetherexplained three of seven data sets. Nonneglegibleplasmid transfer was a necessary component in ourmodels to explain the data set for the P21 strain. Theneed of including process noise was evidenced by therejection of the pure deterministic observation errormodels in four of the seven data sets in favor of the VSmodel. Hence, our analysis shows clearly that differentstrains presented different plasmid-loss dynamics.Moreover, the parameter estimates helped to explainwhich of the three underlying mechanisms was mostresponsible for the observed rapid plasmid loss. In thecase of hosts H2 and P21, segregation rate was estimatedto be respectively very low to low, but the plasmid costwas high to very high, suggesting that few segregantswere formed but swept through the population oncethey appeared. In contrast, the very high segregationfrequency estimate for host R28 with a low cost suggestthat the major cause of rapid plasmid loss is a highsegregational loss rate and not so much the growthadvantage of plasmid-free segregants. Importantly, inthe case of s, the plasmid cost, which was also measuredempirically, the model-based estimates were very similarto the experimental estimates obtained by De Gelder
et al. (2007) for the same strains.Although the HT model predicts that there exist
certain parameter combinations for which the plasmid-carrying and plasmid-free bacteria coexist in the long-term, the ML parameter estimates for the strain P21data indicated that the amount of transfer was not highenough to compensate for the loss via segregation andthe selection against the plasmid-carrying cells. How-ever, sampling variability can blur the certainty that overtime, the plasmids will disappear from a bacterialpopulation. Even if the ML parameter estimates predictthe eventual loss of the plasmids, the joint confidenceinterval of the model parameters may encompass valuesthat are both consistent with the loss of plasmid-carryingcells and their long-term presence, as shown by ourresults (Figure 3).
The VS model is a major departure from othermodeling approaches (Stewart and Levin 1977; Levin
et al. 1979; Levin 1980; Levin and Stewart 1980;Seneta and Tavare 1982, 1983; Freter et al. 1983;Cooper et al. 1987; Simonsen 1991; Proctor 1994;Tolker-Nielsen and Boe 1994; Boe 1996; Boe andRasmussen 1996; Bergstrom et al. 2000; Gasunov and
Brilkov 2002; Wahl et al. 2002; Tanaka et al. 2003;Novozhilov et al. 2005). The process noise included inthe VS model represents the variability due to theenvironment, where the environment may be under-stood as the host itself and the host’s growth environ-ment (De Gelder et al. 2007). Our model suggests thatthe plasmid cost changes from one day to the other. Thegrowth rate of fraction of plasmid-free bacteria, afunction of the plasmid cost, then becomes a randomvariable. Modeling plasmid cost as random effect sub-stantially improves our ability to adequately explainmuch of the data. These stochastic changes in theplasmid cost may be due to the effect of beneficial ordeleterious mutations in the host chromosome and/orthe plasmid. Plasmid-carrying bacteria can acquire, forinstance, compensatory mutations that allow them togrow as fast as or faster than the plasmid-free bacteria.These processes are not, however, explicitly modeled inthe VS model equations and further work is required tounravel the underlying biological mechanisms behindthis variable plasmid cost. How well the VS approxi-mates a more mechanistic model is a topic for furtherresearch.
The fact that the VS model provided a substantiallybetter fit to most of the data sets makes the use of SSMsan important tool for understanding plasmid-growthdynamics. However, a careful analysis, followed byextensive simulations, is required when using SSMs. Asmentioned before, a recent study in population dynam-ics (Dennis et al. 2006) has shown that in the simple caseof a linear and Gaussian SSM, the likelihood function ishighly multimodal and ML estimation is not a trivialtask. In fact, in some cases, the globally highest peak inthe likelihood produces parameter estimates that arequite biased compared with estimates based on othermodes. However, Jensen and Petersen (1999) showedthat the maximum-likelihood estimates for SSMs areindeed asymptotically normal, which implies consis-tency. This does not contradict the simulation resultsof Dennis et al. (2006), since the multimodality eventu-ally disappears and in the limit as the samples sizes goesto infinity, the maximum-likelihood estimate will con-verge to the true parameter. Yet, for finite amounts ofdata, the maximum-likelihood estimate may not be thebest. Stochastic methods such as the Gibbs sampler usedin this article can often fail to sample all the modes. Forthis reason, if multimodality of the likelihood surface issuspected, then extensive validation of the statisticalmethodology is required. Fortunately, the SSMs pre-sented in this article did not exhibit any of the exoticbehavior found in Dennis et al. (2006).
Stochastic population dynamics modeling in micro-bial systems is a subject that is still in its infancy and westress that much remains to be done in the experimen-tal, mathematical, and statistical areas. One of the finalcomments of Novozhilov et al. (2005, p. 1727) was that‘‘unfortunately, quantitative estimates (of the different
966 J. M. Ponciano et al.

process rates) are lacking, which precludes us from sup-plementing the mathematical analysis of the model withempirical estimates . . . .’’ Our study is an attempt toanswer the plea of Novozhilov et al. (2005).
We thank Larry J. Forney and Zaid Abdo for their comments andhelp during the preparation of the manuscript and research. Thiswork was supported by grants from the National Institutes of Health(P20 RR16448, NIH-R01 GM076040-01, NIH 1 R01 GM73821-02) andthe National Science Foundation (NSF-DEB-0515738).
LITERATURE CITED
Andrup, L., and K. Andersen, 1999 A comparison of the kinetics ofplasmid transfer in the conjugation systems encoded by the Fplasmid from Escherichia coli and plasmid pCF10 from Enterococcusfaecalis. Microbiology 145: 2001–2009.
Bergstrom, C. T., M. Lipsitch and B. R. Levin, 2000 Natural selec-tion, infectious transfer and the existence conditions for bacte-rial plasmids. Genetics 155: 1505–1519.
Boe, L., 1996 Estimation of plasmid loss rates in bacterial popula-tions with a reference to the reproducibility of stability systems.Plasmid 36: 161–167.
Boe, L., and K. V. Rasmussen, 1996 Suggestions as to quantitativemeasurements of plasmid loss. Plasmid 36: 153–159.
Carlin, B. P., N. G. Polson and D. S. Stoffer, 1992 A Monte-Carloapproach to nonnormal and nonlinear state-space modeling.J. Am. Stat. Assoc. 87: 493–500.
Casella, G., and E. I. George, 1992 Explaining the Gibbs sampler.Am. Statist. 46: 167–174.
Cooper, N. S., M. E. Brown and C. A. Caulcott, 1987 A mathemat-ical method for analysing plasmid instability in micro-organisms.J. Gen. Microbiol. 133: 1871–1880.
Cushing, J., R. Costantino, B. Dennis, R. Desharnais and S. Henson,2002 Chaos in Ecology. Academic Press, San Diego.
De Gelder, L., J. M. Ponciano, Z. Abdo, P. Joyce, L. J. Forney et al.,2004 Combining mathematical models and statistical methodsto understand and predict the dynamics of antibiotic sensitivemutants in a population of resistant bacteria during experimen-tal evolution. Genetics 168: 1131–1144.
De Gelder, L., F. Vandecasteele, C. Brown, L. J. Forney and E. M.Top, 2005 Plasmid donor affects host range of the promiscuousIncP-1b plasmid pB10 in a sewage sludge microbial community.Appl. Environ. Microbiol. 71: 5309–5317.
De Gelder, L., J. M. Ponciano, P. Joyce and E. M. Top, 2007 Sta-bility of a promiscuous plasmid in different hosts: no guaranteefor a long-term association. Microbiology 153: 452–463.
Dennis, B., R. Desharnais, J. Cushing and R. Costantino, 1995 Non-linear demographic dynamics: mathematical models, statisticalmethods, and biological experiments. Ecol. Monogr. 65: 261–281.
Dennis, B., J. M. Ponciano, S. Lele, M. Taper and D. Staples,2006 Estimating density dependence, process noise and obser-vation error. Ecol. Monogr. 76(3): 323–341.
De Visser, J., and D. Rozen, 2005 Limits to adaptation in asexualpopulations. J. Evol. Biol. 18: 779–788.
Droge, M., A. Puhler and W. Selbitschka, 2000 Phenotypic andmolecular characterization of conjugative antibiotic resistanceplasmids isolated from bacterial communities of activated sludge.Mol. Gen. Genet. 263: 471–482.
Efron, B., and R. Tibshirani, 1993 An Introduction to the Bootstrap.Chapman & Hall, New York.
Freter, R., R. Freter and H. Brickner, 1983 Experimental andmathematical models of Escherichia coli plasmid transfer in vitroand in vivo. Infect. Immun. 39: 60–84.
Gasunov, V. V., and A. V. Brilkov, 2002 Estimating the instabilityparameters of plasmid-bearing cell. I. Chemostat culture. J. Theor.Biol. 219: 193–205.
George, A., and E. Thompson, 2002 Multipoint linkage analyses fordisease mapping in extended pedigrees: a Markov chain MonteCarlo approach. Technical Report 405, Department of Statistics,University of Washington, Seattle.
Gogarten, J., and J. Townsend, 2005 Horizontal gene transfer,genome innovation and evolution. Nat. Rev. Microbiol. 3: 679–687.
Hilborn, R., and M. Mangel, 1997 The Ecological Detective: Confront-ing Models With Data. Princeton University Press, Princeton, NJ.
Jensen, J. L., and N. V. Petersen, 1999 Assymptotic normality ofthe maximum likelihood estimator in state space models. Ann.Statist. 27: 514–535.
Joyce, P., Z. Abdo, J. Ponciano, L. De Gelder, L. Forney et al.,2005 Modeling the impact of periodic bottlenecks, unidirec-tional mutation and observational error in experimental evolu-tion. J. Math. Biol. 50: 645–662.
Kado, C. I., and S. T. Liu, 1981 Rapid procedure for detection andisloation of small and large plasmids. J. Bacteriol. 145: 1365–1373.
Keiding, N., 1975 Extinction and exponential growth in a randomenvironment. Theor. Popul. Biol. 8: 49–63.
Kot, M., 2001 Elements of Mathematical Ecology. Cambridge UniversityPress, Cambridge, UK.
Lenski, R. E., and J. E. Bouma, 1994 Effects of segregation and se-lection on instability of plasmid pACYC184 in Escherichia coli B. J.Bacteriol. 169: 5314–5316.
Levin, B., 1980 Conditions for the existence of R-plasmids in bacte-rial populations, pp. 197–202 in Fourth International Symposium onAntibiotic Resistance, edited by S. Mitsuhashi, L. Rosival and V.Krcmery. Springer-Verlag, Berlin.
Levin, B. R., and F. M. Stewart, 1980 The population biology ofbacterial plasmids: a priori conditions for the existence of mobi-lizable nonconjugative factors. Genetics 94: 425–443.
Levin, B. R., F. M. Stewart and V. A. Rice, 1979 Kinetics of conju-gative plasmid transmission: fit of a simple mass-action model.Plasmid 2: 247–260.
Lewontin, R., and D. Cohen, 1969 On population growth in a ran-domly varying environment. Proc. Natl. Acad. Sci. USA 62: 1056–1060.
Meyer, R., and R. B. Millar, 1999 Bayesian stock assessment usinga state-space implementation of the delay difference model. Can.J. Fish. Aquat. Sci. 56: 37–52.
Novozhilov, A. S., G. P. Karev and E. V. Koonin, 2005 Math-ematical modeling of evolution of horizontally transferred genes.Mol. Biol. Evol. 22: 1721–1732.
Proctor, G. N., 1994 Mathematics of microbial plasmid instabilityand subsequent differential growth of plasmid-free and plasmid-containing cells, relevant to the analysis of experimental colonynumber data. Plasmid 32: 101–130.
Rademaker, J. L. W., F. J. Louws and F. J. de Bruijn, 1997 Char-acterization of the diversity of ecologically important microbesby REP-PCR genomic fingerprinting, pp. 1–26 in Molecular Micro-bial Ecology Manual, Supplement 3, edited by A. D. L. Akkermans, J.D. van Elsas and F. J. de Bruijn. Kluwer Academic Publishers,Dordrecht, The Netherlands.
Rice, J., 1995 Mathematical Statistics and Data Analysis, Ed. 2. DuxburyPress, Belmont, CA.
Schluter, A., H. Heuer, R. Szczepanowski, L. J. Forney, C. M.Thomas et al., 2003 The 64,508 bp IncP-1b antibiotic multire-sistance plasmid pB10 isolated from a wastewater treatment plantprovides evidence for recombination between members of differ-ent branches of the IncP-1b group. Microbiology 149: 3139–3153.
Seneta, E., and S. Tavare, 1982 Stochastic models for plasmid copynumber, pp. 27–33 in First Rocky Mountain Regional Conferenceon Medical Applications of Statistics. University of Colorado HealthSciences Center, Denver.
Seneta, E., and S. Tavare, 1983 Some stochastic models for plas-mid copy number. Theor. Popul. Biol. 23: 241–256.
Simonsen, L., 1991 The existence conditions for bacterial plasmids:theory and reality. Microb. Ecol. 22: 187–205.
Sørensen, S., M. Bailey, L. Hansen, N. Krower and S. Wuertz,2005 Studying plasmid horizontal transfer in situ: a critical re-view. Nat. Rev. Microbiol. 3: 700–710.
Stewart, F., and B. Levin, 1977 The population biology of bacterialplasmids: a priori conditions for the existence of conjugationallytransmitted factors. Genetics 87: 209–228.
Tanaka, M. M., C. T. Bergstrom and B. Levin, 2003 The evolutionof mutator genes in bacterial populations: the roles of environ-mental change and timing. Genetics 164: 843–854.
A Hidden Markov Model Approach 967

Tolker-Nielsen, T., and L. Boe, 1994 A statistical analysis of the for-mation of plasmid-free cells in populations of Escherichia coli.J. Bacteriol. 176: 4306–4310.
Top, E. M., M. Mergeay, D. Springael and W. Verstraete,1990 Gene escape model: transfer of heavy metal resistancegenes from Escherichia coli to Alcaligenes eutrophus on agar platesand in soil samples. Appl. Environ. Microbiol. 56: 2471–2479.
Wahl, L., P. Gerrish and I. Saika-Voivod, 2002 Evaluating theimpact of population bottlenecks in experimental evolution.Genetics 162: 961–971.
Communicating editor: M. K. Uyenoyama
APPENDIX: DERIVATION OF THE VS MODEL TRANSITION PDF
Recall that in the right-hand side (RHS) of Equation 8, xt�1 is the realized value of the process Xt at time t� 1. Also, St
comes from a normal distribution with mean m and variance t2. Provided that 0 # l , Xt j Xt�1 ¼ xt�1 , 1, it followsfrom Equation 10 that
PðXt # xt jXt�1 ¼ xt�1Þ ¼ Pxt�1211St 1 2lð1� xt�1Þxt�1211St 1 2ð1� xt�1Þ
# xt
� �
¼ P St #ln½ð1� xt�1Þðxt � lÞ� � ln½ð1� xtÞxt�1�
ln 2
� �:
After differentiation and setting ht ¼ ð1=ln 2Þ=(ln½ð1� xt�1Þðxt � lÞ� � ln½ð1� xtÞxt�1�) we get
fðXt jXt�1ÞðxtÞ ¼ð1� lÞ
ln2ðxt � lÞð1� xtÞffiffiffiffiffiffiffiffiffiffi2pt2p exp
�ðht � mÞ2
2t2
� �;
which is the transition pdf shown in Equation 11.
968 J. M. Ponciano et al.