Audio-visual speech asynchrony detection using co-inertia analysis and coupled hidden markov models
14
THEORETICAL ADVANCES Audio-visual speech asynchrony detection using co-inertia analysis and coupled hidden markov models Enrique Argones Ru ´a Herve ´ Bredin Carmen Garcı ´a Mateo Ge ´rard Chollet Daniel Gonza ´lez Jime ´nez Received: 8 February 2007 / Accepted: 2 April 2008 Ó Springer-Verlag London Limited 2008 Abstract This paper addresses the subject of liveness detection, which is a test that ensures that biometric cues are acquired from a live person who is actually present at the time of capture. The liveness check is performed by measuring the degree of synchrony between the lips and the voice extracted from a video sequence. Three new methods for asynchrony detection based on co-inertia analysis (CoIA) and a fourth based on coupled hidden Markov models (CHMMs) are derived. Experimental comparisons are made with several methods previously used in the literature for asynchrony detection and speaker location. The reported results demonstrate the effectiveness and superiority of the proposed new methods based on both CoIA and CHMMs as asynchrony detection methods. Keywords Biometrics Video analysis Statistics Coupled hidden Markov models Coinertia analysis Video tracking 1 Originality and contribution This paper addressed the subject of liveness detection in frontal faces videos. The liveness check is performed by measuring the degree of synchrony between the lips and the voice extracted from a video sequence. Four different original methods are derived for that purpose: three methods based on co-inertia analysis and a fourth based on coupled hidden Markov models. The main contributions of this work are a full theoretical description of these methods and an experimental comparison of the main asynchrony detection algorithms in a publicly available database, allowing for future performance comparisons. 2 Introduction Oral communication between people is a means of com- munication which is intrinsically multimodal. Not only does it include acoustic information but it also conveys complementary visual information. Acoustic information is classically used for state-of-the-art automatic speech pro- cessing applications such as automatic speech transcription or speaker authentication, while visual information is of great help in adverse environments where acoustic infor- mation is degraded (background noise, channel distortion, etc.). It provides complementary clues that can help in the analysis of the acoustic signal [1]. In extreme cases, visual information can even be used on its own. For instance, it is well known that deaf people can learn how to lip read. The joint analysis of acoustic and visual speech improves the robustness of automatic speech recognition systems [2, 3]. In the framework of identity verification based on talking- faces, most systems in the literature fuse scores from speaker verification and face recognition tests. Nevertheless, a E. Argones Ru ´a (&) C. Garcı ´a Mateo D. Gonza ´lez Jime ´nez SPG, STC Department, University of Vigo, 36200 Vigo, Spain e-mail: [email protected] C. Garcı ´a Mateo e-mail: [email protected] D. Gonza ´lez Jime ´nez e-mail: [email protected] H. Bredin G. Chollet De ´pt. TSI, CNRS-LTCI, GET-ENST, Paris, France e-mail: [email protected] G. Chollet e-mail: [email protected] 123 Pattern Anal Applic DOI 10.1007/s10044-008-0121-2
Transcript of Audio-visual speech asynchrony detection using co-inertia analysis and coupled hidden markov models
THEORETICAL ADVANCES
Audio-visual speech asynchrony detection using co-inertiaanalysis and coupled hidden markov models
Enrique Argones Rua Æ Herve Bredin ÆCarmen Garcıa Mateo Æ Gerard Chollet ÆDaniel Gonzalez Jimenez
Received: 8 February 2007 / Accepted: 2 April 2008
� Springer-Verlag London Limited 2008
Abstract This paper addresses the subject of liveness
detection, which is a test that ensures that biometric cues
are acquired from a live person who is actually present at
the time of capture. The liveness check is performed by
measuring the degree of synchrony between the lips and
the voice extracted from a video sequence. Three new
methods for asynchrony detection based on co-inertia
analysis (CoIA) and a fourth based on coupled hidden
Markov models (CHMMs) are derived. Experimental
comparisons are made with several methods previously
used in the literature for asynchrony detection and speaker
location. The reported results demonstrate the effectiveness
and superiority of the proposed new methods based on both
CoIA and CHMMs as asynchrony detection methods.
Keywords Biometrics � Video analysis � Statistics �Coupled hidden Markov models � Coinertia analysis �Video tracking
1 Originality and contribution
This paper addressed the subject of liveness detection in
frontal faces videos. The liveness check is performed by
measuring the degree of synchrony between the lips and
the voice extracted from a video sequence. Four different
original methods are derived for that purpose: three
methods based on co-inertia analysis and a fourth based on
coupled hidden Markov models. The main contributions of
this work are a full theoretical description of these methods
and an experimental comparison of the main asynchrony
detection algorithms in a publicly available database,
allowing for future performance comparisons.
2 Introduction
Oral communication between people is a means of com-
munication which is intrinsically multimodal. Not only
does it include acoustic information but it also conveys
complementary visual information. Acoustic information is
classically used for state-of-the-art automatic speech pro-
cessing applications such as automatic speech transcription
or speaker authentication, while visual information is of
great help in adverse environments where acoustic infor-
mation is degraded (background noise, channel distortion,
etc.). It provides complementary clues that can help in the
analysis of the acoustic signal [1]. In extreme cases, visual
information can even be used on its own. For instance, it is
well known that deaf people can learn how to lip read. The
joint analysis of acoustic and visual speech improves the
robustness of automatic speech recognition systems [2, 3].
In the framework of identity verification based on talking-
faces, most systems in the literature fuse scores from speaker
verification and face recognition tests. Nevertheless, a
E. Argones Rua (&) � C. Garcıa Mateo � D. Gonzalez Jimenez
SPG, STC Department, University of Vigo,
36200 Vigo, Spain
e-mail: [email protected]
C. Garcıa Mateo
e-mail: [email protected]
D. Gonzalez Jimenez
e-mail: [email protected]
H. Bredin � G. Chollet
Dept. TSI, CNRS-LTCI, GET-ENST, Paris, France
e-mail: [email protected]
G. Chollet
e-mail: [email protected]
123
Pattern Anal Applic
DOI 10.1007/s10044-008-0121-2
number of systems have attempted to make use of visual
speech information to improve overall authentication per-
formance [4–6].
One major weakness of these systems is that they do not
take into account realistic impostor attack scenarios. Most
existing systems, for example, could easily be fooled by
simple attacks such as recording the voice of the target in
advance and replaying it in front of the microphone, or
simply placing a picture of the target’s face in front of the
camera. Another problem emerges in audio–visual speaker
recognition when several faces appear in the video and the
true speaker must be selected before identification or
verification can take place. Systems such as the one
described in [5] jointly model acoustic and visual speech in
order to improve speaker verification performance with
respect to independent modeling. The audio–visual
biometric system described in [6] performs better when the
visual stream is incorporated for both identification and
verification. The robustness of these systems against non-
synchronized video attacks or complex scenes with several
face candidates, however, has not been tested.
One solution that has been proposed in the recent lite-
rature is to test liveness by studying the degree of
synchrony between the acoustic signal and lip motion
[7, 8]. Synchrony detection is not a new problem in audio–
visual analysis. It is a major issue in fields such as speaker
location [9] and speaker association [10–12]. Studies in the
area used measures such as canonical correlation (CAN-
COR) [10] and mutual information (MI) [9, 11, 12] to
distinguish the true speaker from a set of candidates.
Synchrony detection in video-based biometrics would
solve the problem of complex scenes where several faces
are present in the image. Furthermore, it would allow the
detection of attacks that cause audio–visual inconsistency.
A number of studies in the biometrics field have already
dealt with asynchrony detection. For instance, the method
introduced in [7] fuses the speech and lip parameters in a
single audiovisual feature vector stream, and then models it
within a Gaussian mixture model (GMM) for each client.
The results obtained with this method are impressive (1%
equal error rate) for easy replay attacks constructed with a
voice recording and a still photograph, although it has not
been tested using a voice recording and an image sequence
taken from another video. The method described in [8] uses
co-inertia analysis (CoIA) correlation evolution to create
liveness scores based on different delays between audio
and image sequences.
The main aim of this paper is to describe a series of new
asynchrony detection techniques and compare them to
existing ones. The techniques presented increase the
robustness of audio–visual biometric systems against spoof
attacks. In addition to their application in the biometrics
field, these techniques can also be applied to any generic
audio–visual consistency assessment or monologue detec-
tion task. Two new approaches for measuring synchrony
between audio and visual speech and detecting possible
asynchrony are proposed. The first approach is based on co-
inertia analysis (CoIA), and three new, different algorithms
for detecting liveness are derived. The second one is a
Bayesian approach based on coupled hidden Markov
models (CHMMs). CANCOR, MI and the method proposed
by Eveno et al. and based on CoIA are also tested in the
same experimental framework for comparison purposes.
The rest of the paper is organized as follows. Section 2
introduces the acoustic and visual features that will be used
in the experiments. The first approach (based on CoIA) is
described in Sect. 3 and the second (based on CHMMs) in
Sect. 4. A third method based on the fusion of the two
previous approaches is investigated in Sect. 5. The meth-
ods used for comparison are introduced in Sect. 6. Finally,
the performance of each of the methods is evaluated using
real data from the BANCA audiovisual database. Evalua-
tion protocols and results are discussed in Sect. 7.
3 Audiovisual speech features
3.1 Acoustic speech features
Mel-frequency cepstral coefficients (MFCC) are classical
acoustic speech features in automatic speech processing.
They are state-of-the-art features in many applications,
including automatic speech recognition and speaker veri-
fication systems.
Every 10 ms, a 20 ms window is extracted from the
acoustic signal and 12 MFCCs and the signal energy are
computed to produce 13-dimensional acoustic speech fea-
tures. First- and second-order time-derivatives are then
appended, and finally a 39-dimensional feature vector is
extracted every 10 ms.
3.2 Visual speech features
Visual speech features can be classified into two categories,
depending on whether they are based on the shape or the
appearance of the mouth [13]. The first category includes
features that are directly related to the shape of the lip, such
as the openness of the mouth, the location of particular lip
landmarks, etc. The second category, in contrast, considers
the mouth area as a whole and includes features that have
been extracted directly from the pixels corresponding to a
region of interest (ROI) around the mouth area.
Shape-based features Robust tracking of lip landmarks is
a mandatory preliminary step towards extracting shape-
based features. A Lucas–Kanade-based tracker [14] is used
to track the location of a collection of facial landmarks
Pattern Anal Applic
123
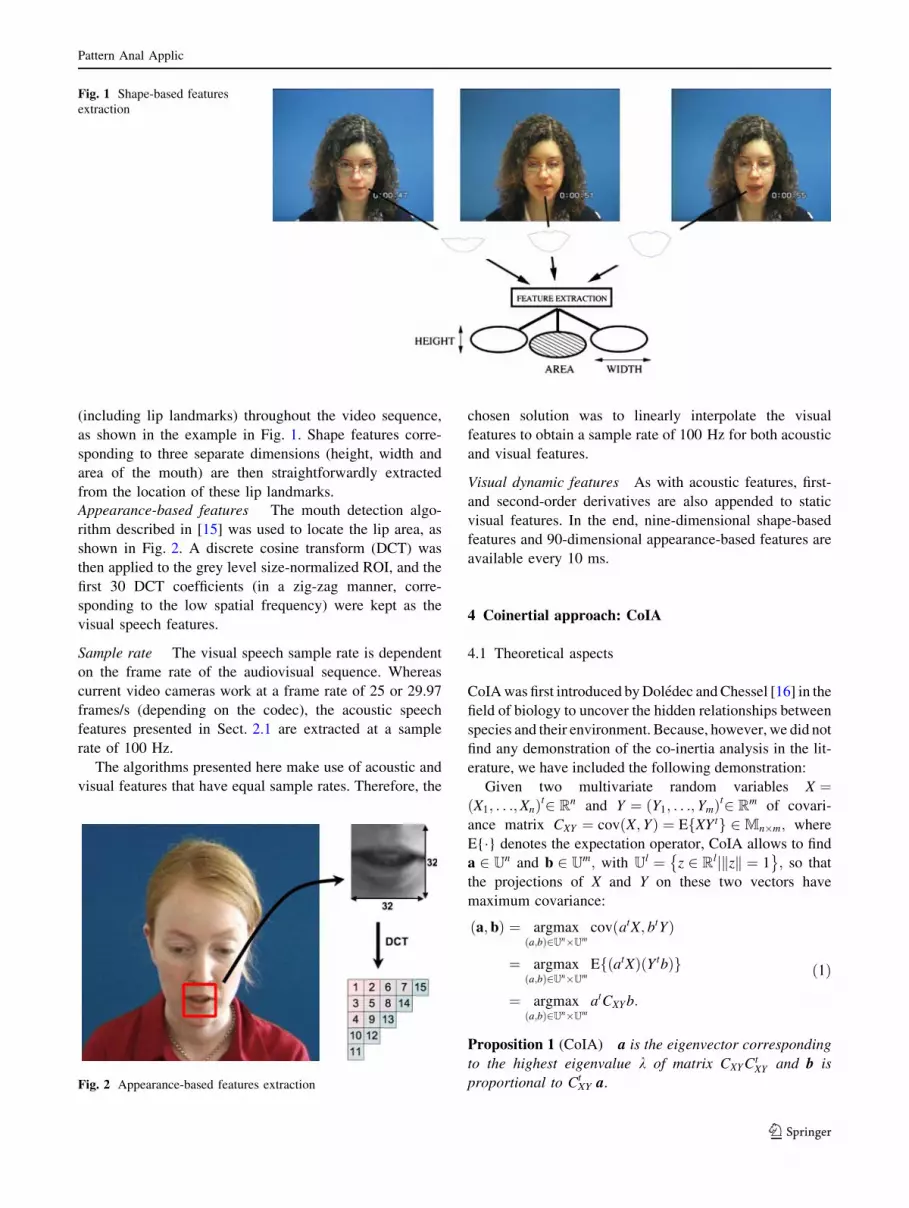
(including lip landmarks) throughout the video sequence,
as shown in the example in Fig. 1. Shape features corre-
sponding to three separate dimensions (height, width and
area of the mouth) are then straightforwardly extracted
from the location of these lip landmarks.
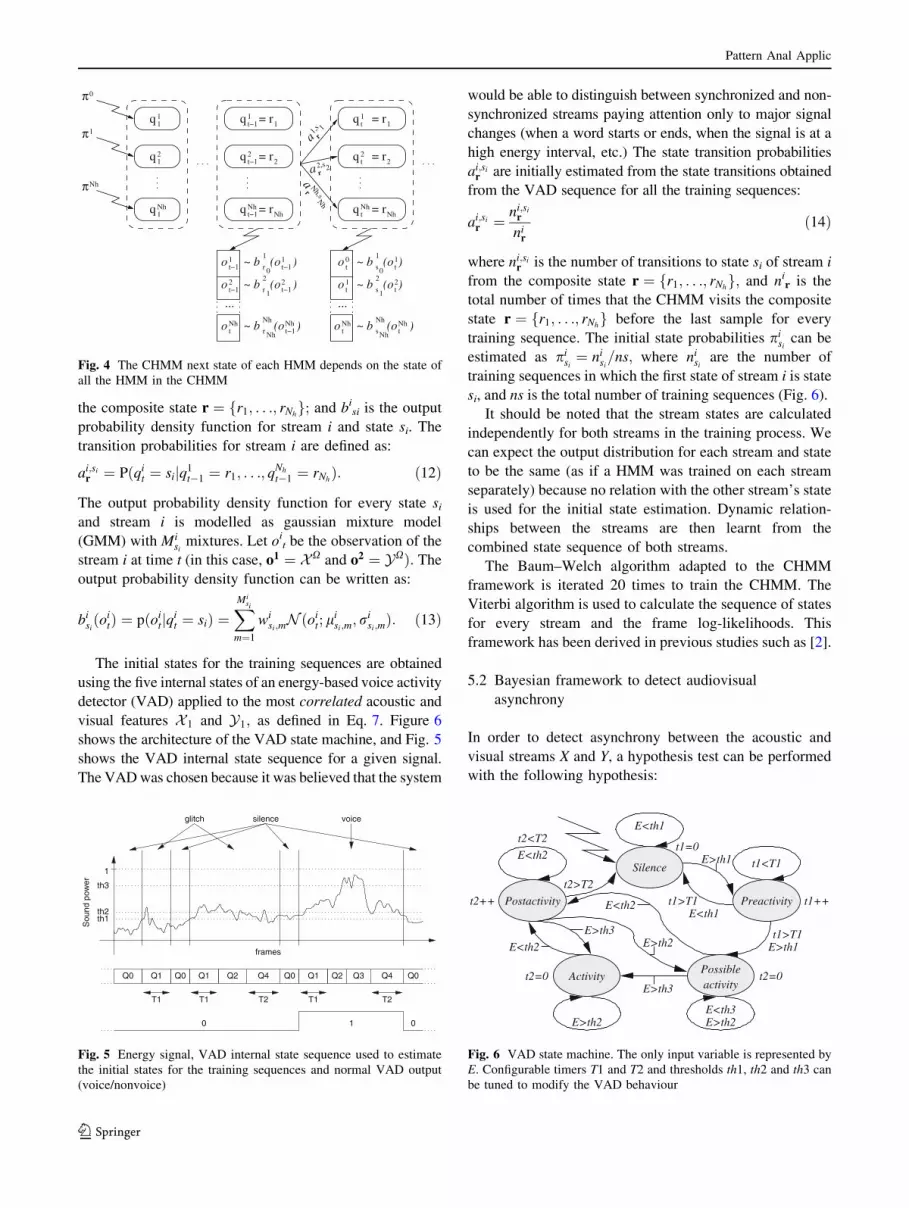
Appearance-based features The mouth detection algo-
rithm described in [15] was used to locate the lip area, as
shown in Fig. 2. A discrete cosine transform (DCT) was
then applied to the grey level size-normalized ROI, and the
first 30 DCT coefficients (in a zig-zag manner, corre-
sponding to the low spatial frequency) were kept as the
visual speech features.
Sample rate The visual speech sample rate is dependent
on the frame rate of the audiovisual sequence. Whereas
current video cameras work at a frame rate of 25 or 29.97
frames/s (depending on the codec), the acoustic speech
features presented in Sect. 2.1 are extracted at a sample
rate of 100 Hz.
The algorithms presented here make use of acoustic and
visual features that have equal sample rates. Therefore, the
chosen solution was to linearly interpolate the visual
features to obtain a sample rate of 100 Hz for both acoustic
and visual features.
Visual dynamic features As with acoustic features, first-
and second-order derivatives are also appended to static
visual features. In the end, nine-dimensional shape-based
features and 90-dimensional appearance-based features are
available every 10 ms.
4 Coinertial approach: CoIA
4.1 Theoretical aspects
CoIA was first introduced by Doledec and Chessel [16] in the
field of biology to uncover the hidden relationships between
species and their environment. Because, however, we did not
find any demonstration of the co-inertia analysis in the lit-
erature, we have included the following demonstration:
Given two multivariate random variables X ¼X1; . . .;Xnð Þt2 R
n and Y ¼ Y1; . . .; Ymð Þt2 Rm of covari-
ance matrix CXY ¼ cov X; Yð Þ ¼ EfXYtg 2Mn�m; where
E{�} denotes the expectation operator, CoIA allows to find
a 2 Un and b 2 U
m; with Ul ¼ z 2 R
ljkzk ¼ 1� �
; so that
the projections of X and Y on these two vectors have
maximum covariance:
a; bð Þ ¼ argmaxa;bð Þ2Un�Um
cov atX; btYð Þ
¼ argmaxa;bð Þ2Un�Um
EfðatXÞðYtbÞg
¼ argmaxa;bð Þ2Un�Um
atCXYb:
ð1Þ
Proposition 1 (CoIA) a is the eigenvector corresponding
to the highest eigenvalue k of matrix CXYCtXY and b is
proportional to CXYt a.
Fig. 1 Shape-based features
extraction
Fig. 2 Appearance-based features extraction
Pattern Anal Applic
123

Proof of Proposition 1 Let us denote
q ¼ atCXY b ð2Þ
In the process of maximizing q, one can assume that q[ 0
(change a into -a if q\ 0): it is therefore equivalent to
maximize q and q2.
q2 ¼ atCXY bð Þt atCXY bð Þ ð3Þ
q2 ¼ CtXYa
� �tb
h it
CtXYa
� �tb
h i: ð4Þ
According to the Cauchy–Schwarz inequality,
q2�kCtXY ak � kbk with equality if and only if b can be
written as lCXYt a, with l 2 R: Therefore, Eq. 2 becomes:
q ¼ atCXY lCtXY a
� �ð5Þ
q ¼ lat CXY CtXY
� �a: ð6Þ
Since kak ¼ 1; q is proportional to the Rayleigh quotient
R CXY CtXY ; a
� �¼ ðatCXYCt
XYaÞ=ðataÞ; which is maximized
when a is the eigenvector of CXY CXYt associated with the
biggest eigenvalue k1.(
Sorting the eigenvalues of CXY CXYt in decreasing order
fk1; . . .; kdg; CoIA recursively finds the orthogonal vectors
a1; . . .; adf g and b1; . . .; bdf g which maximize the covari-
ance between the projections atkX and bt
kY (d being the
rank of CXY). In other words, CoIA rotates X and Y into a
new coordinate system that maximizes their covariance.
In the following, A and B will denote n 9 d and m 9 d
matrices containing the directions of the new coordinate
systems:
A ¼ a1j. . .jad½ � and B ¼ b1j. . .jbd½ �:
4.2 Application of CoIA
4.2.1 Extracting correlated acoustic and visual speech
features
Given synchronized acoustic and visual features X 2 Rn
and Y 2 Rm; CoIA can be used to compute matrices A and
B, which, in turn, can be used to extract correlated acoustic
and visual features X ¼ AtX and Y ¼ BtY of dimension d
as follows:
8k 2 f1; . . .; dg; X k ¼ atkX ¼
Xn
i¼1
akiXi
Yk ¼ btkY ¼
Xm
i¼1
bkiYi:
ð7Þ
The effect of CoIA on real data is shown in Fig. 3, which
contains features extracted from the audiovisual sequen-
ce‘‘1002_f_g1_s02_1002_en.avi’’ from the BANCA
database [17].
Remark CoIA can be used to reduce the dimension of
acoustic and visual features without losing those that
contain the most information regarding correlation. This is
particularly important when working with CHMMs such as
those described in Sect. 4. The curse of dimensionality is a
major issue for these models because the small size of the
BANCA database does not permit accurate training with
high-dimensional features. The only requirement in our
case was that all the acoustic and visual features X and Y
had to be transformed using the same matrices AX and BX.
Synchronized acoustic and visual features XX and YX can
be extracted from a training set X (BANCA world model
part wm, in our case). CoIA transformation matrices AX ¼aX
1 j. . .jaXd
� �and BX ¼ bX
1 j. . .jbXd
� �are then obtained by
applying CoIA to X, and the transformed acoustic and
visual features XX and YX are computed using Eq. 8
8k 2 f1; . . .; dg; XXk ¼ at
kXX ¼Xn
i¼1
aXki
Xi
YXk ¼ bt
kXY ¼Xm
i¼1
bXki
Yi:
ð8Þ
The dimensions of the transformed acoustic and visual
features XX and YX can then be conveniently reduced by
keeping only the D most informative ones with respect to
correlation.
Fig. 3 Original acoustic and
visual features (top left: X1, X2
and X3 bottom left Y1, Y2 and Y3)
and first correlated acoustic and
visual features (top right: X1
bottom right Y1Þ: The
correlation between X and Y is
much more evident if we look at
X1 and Y1
Pattern Anal Applic
123

4.2.2 Measuring audiovisual speech synchrony
In this section, we introduce a method involving the use of
correlated acoustic and visual features to measure how
well voice X and lips Y correspond to each other. We
distinguish between three different methods (world-, self-
or piecewise self-training), though they all share a common
framework:
1. The transformation matrices AX and BX are derived by
means of CoIA from a training set X composed of
acoustic and visual features XX and YX.
2. Acoustic and visual features XC and YC from a test
utterance C are then transformed into XX and YX using
the previously computed matrixes AX and BX:
XX ¼ AXt
XC
YX ¼ BXt
YC:ð9Þ
3. Direct correlation is computed between each dimension
of XX and YX and used as a measure s XC; YCð Þ of
synchronization between XC and YC, whereby the
higher the correlation, the greater the synchronization:
s XC;YC� �
¼ 1
D
XD
k¼1
XXk
tYXkffiffiffiffiffiffiffiffiffiffiffiffiffiffiffi
XXk
tXXk
q ffiffiffiffiffiffiffiffiffiffiffiffiffiffiYX
k
tYXk
q
¼ 1
D
XD
k¼1
aXt
k XC� �t
bXt
k YC�
ffiffiffiffiffiffiffiffiffiffiffiffiffiffiffiffiffiffiffiffiffiffiffiffiffiffiffiffiffiffiffiffiffiffiaXt
k XC� �t
aXt
k XC� �q ffiffiffiffiffiffiffiffiffiffiffiffiffiffiffiffiffiffiffiffiffiffiffiffiffiffiffiffiffiffiffiffiffiffiffiffiffi
bXt
k YC� t
bXt
k YC� r :
ð10Þ
The three methods mostly differ in how the training set Xand the test set C are built.
World training method As proposed in the previous par-
agraph, one can use a large set of synchronized audiovisual
sequences (the world model part wm of BANCA, in our
case) to get XX and YX. CoIA can then be used to compute
matrices AX and BX, modeling the average best corres-
pondence between voice and lips. Using a given test
utterance C, all the features in C are transformed using
Eq. 9 to obtain XX and YX: A synchronization score s
(XC, YC ) for test utterance C is then obtained using Eq. 10.
Self training method This method differs from the above
in that a different training set is used to obtain matrices AX
and BX. Using a given test utterance C, CoIA is directly
performed on data XC and YC. In other words, the training
and the test sets are the same: C = X.
Piecewise self training method Bearing in mind that the
purpose of this measure of synchronization is to discrimi-
nate between synchronized and non-synchronized
audiovisual sequences, this third method is slightly
different to the previous method. The intuition is the fol-
lowing (where a sub-sequence K is a sequence extracted
from the original utterance sequence C by keeping only
some of the samples, that is K � CÞ :
• if sequence C is synchronized, then every sub-sequence
should follow the same synchronization model: a model
AX;BX� �
which is optimal with respect to a sub-
sequence X � C would also be optimal with respect to
any other sub-sequence H � C;
• if the sequence is not synchronized, then a model
(AX,BX) which is optimal with respect to a sub-
sequence X would not make sense for another sub-
sequence H � C with X \H ¼£:
Let us introduce some notations:
• N is the number of samples in the sequence C : XC ¼fx1; . . .; xNg and YC ¼ fy1; . . .; yNg:
• PC is the collection of all subsets of C of cardinal
bN=2c:CoIA is applied to each training subsequence X 2 PC to
produce transformation matrices AX and BX. The remain-
ing features in the sequence (H = C-X) are then
transformed using the transformation matrices: XX ¼AXt
XH and YX ¼ BXt
YH: The synchronization measure
s(XH, YH) is computed as in Eq. 10, for every subsequence
X 2 PC: The final synchronization measure for sequence Cis obtained via Eq. 11:
sðXC; YCÞ ¼ 1
cardPC
X
X2PC
s XH; YH� �
: ð11Þ
In practice, because it is not computationally feasible to use
every X 2 P; only a few are drawn randomly (50, in our
case) to compute the final synchronization measure.
5 Dynamic approach: CHMMs
5.1 Theoretical aspects
A CHMM can be seen as a collection of HMM in which the
state at time t for every HMM in the collection is condi-
tioned by the states of all the HMM in the collection at time
t-1. This is illustrated in Fig. 4. The fact that the next state
of every HMM depends on the states of all the HMMs is
useful for capturing interactions between the acoustic and
visual streams.
A CHMM can be completely described by the para-
meters k ¼ fkig ¼ fpijg; fai;si
r g; fbisið�Þg
n o; for every
stream i [ {1,…,Nh}, where Nh is the number of streams; si
[ {1,…,NSi}, where NSi is the number of states in stream i;
pisi
is the initial probability of the state si for stream i; ai;sir is
the state transition probability for stream i and state si of
Pattern Anal Applic
123
the composite state r ¼ fr1; . . .; rNhg; and bi
si is the output
probability density function for stream i and state si. The
transition probabilities for stream i are defined as:
ai;sir ¼ Pðqi
t ¼ sijq1t�1 ¼ r1; . . .; qNh
t�1 ¼ rNhÞ: ð12Þ
The output probability density function for every state si
and stream i is modelled as gaussian mixture model
(GMM) with Misi
mixtures. Let oit be the observation of the
stream i at time t (in this case, o1 ¼ XX and o2 ¼ YXÞ: The
output probability density function can be written as:
bisiðoi
tÞ ¼ pðoitjqi
t ¼ siÞ ¼XM
isi
m¼1
wisi;mNðoi
t; lisi;m; ri
si;mÞ: ð13Þ
The initial states for the training sequences are obtained
using the five internal states of an energy-based voice activity
detector (VAD) applied to the most correlated acoustic and
visual features X1 and Y1; as defined in Eq. 7. Figure 6
shows the architecture of the VAD state machine, and Fig. 5
shows the VAD internal state sequence for a given signal.
The VAD was chosen because it was believed that the system
would be able to distinguish between synchronized and non-
synchronized streams paying attention only to major signal
changes (when a word starts or ends, when the signal is at a
high energy interval, etc.) The state transition probabilities
ai;sir are initially estimated from the state transitions obtained
from the VAD sequence for all the training sequences:
ai;sir ¼
ni;sir
nir
ð14Þ
where ni;sir is the number of transitions to state si of stream i
from the composite state r ¼ fr1; . . .; rNhg; and ni
r is the
total number of times that the CHMM visits the composite
state r ¼ fr1; . . .; rNhg before the last sample for every
training sequence. The initial state probabilities pisi
can be
estimated as pisi¼ ni
si=ns; where ni
siare the number of
training sequences in which the first state of stream i is state
si, and ns is the total number of training sequences (Fig. 6).
It should be noted that the stream states are calculated
independently for both streams in the training process. We
can expect the output distribution for each stream and state
to be the same (as if a HMM was trained on each stream
separately) because no relation with the other stream’s state
is used for the initial state estimation. Dynamic relation-
ships between the streams are then learnt from the
combined state sequence of both streams.
The Baum–Welch algorithm adapted to the CHMM
framework is iterated 20 times to train the CHMM. The
Viterbi algorithm is used to calculate the sequence of states
for every stream and the frame log-likelihoods. This
framework has been derived in previous studies such as [2].
5.2 Bayesian framework to detect audiovisual
asynchrony
In order to detect asynchrony between the acoustic and
visual streams X and Y, a hypothesis test can be performed
with the following hypothesis:
πNh
π1
π0
a Nh,sr
Nh
1o t−1
2o t−1
q11 q t−1
1 = r1
q t−12 = r2
q t−1Nh = rNh
a1,s 1
r
a2,s2r
q t1 = r1
q t2 = r2
q tNh = rNh
q12
q1Nh
Nht
...
1
0
1t−1
2
r 1
2
Nh
r Nh
Nht−1
r
o ~ b (o )
(o
(o~ b
0
1
Nh
t
t
t
...
2
s1
2t
s0
1to
o
oNh
sNh
Nht~ b (o )
~ b (o )
)(o~ b~ b
t−1
)
)
1
Fig. 4 The CHMM next state of each HMM depends on the state of
all the HMM in the CHMM
frames
1
Sou
nd p
ower th3
th2th1
glitch silence voice
Q0
T1
Q1
T1
Q1
T2 T1
Q1
T2
Q0 Q2 Q4 Q0 Q2 Q3 Q4 Q0
0 1 0
Fig. 5 Energy signal, VAD internal state sequence used to estimate
the initial states for the training sequences and normal VAD output
(voice/nonvoice)
Possibleactivity
t2<T2
E<th2
t2>T2
Postactivity
SilenceE>th1 t1<T1
Preactivity t1++
t1>T1
t1>T1
E<th2
t2=0E>th3
E<th3E>th2
t2=0Activity
E>th2
E<th1
t1=0
E<th1
t2++ E<th2
E>th1
E>th3E>th2
Fig. 6 VAD state machine. The only input variable is represented by
E. Configurable timers T1 and T2 and thresholds th1, th2 and th3 can
be tuned to modify the VAD behaviour
Pattern Anal Applic
123

• H0 : Because streams are produced synchronously the
state sequences are dependent on each other. This
hypothesis is represented by CHMM k:
• H1 : Because streams are produced by independent
sources, sequences are independent of each other. This
hypothesis is represented by the two-stream HMM k0;as described in [3].
The test we performed in our study is a slight modifi-
cation of the classical Bayesian test:
H0 is accepted () pðX ;Y;QjkÞpðX ;Y;Q0jk0Þ [ h; ð15Þ
where Q and Q0 are the most likely state sequences. These
likelihoods are provided by the Viterbi algorithm. This test
approximates the classical Bayesian test when one state
sequence is much more likely than the others. If the two-
stream HMM k0 ¼ ffp0isig; fa0i;si
rig; fb0isi
ð�Þgg was an
independently trained model, then the slightest mismatch
in the learned output distributions would thwart the
effectiveness of the hypothesis test. In addition, dynamic
relationships between the streams are encoded in the
combined state sequences Q and Q0. The two-stream HMM
k0 used in this hypothesis test, therefore, is an uncoupled
version of the CHMM k; where the parameters for both the
output distributions and the initial state probabilities are
shared, and the state transition probabilities are computed
from the CHMM k parameters:
p0isi¼ pi
si
b0isið�Þ ¼ bi
sið�Þ
8 i 2 f1; . . .;Nhg; si 2 f1; . . .;NSig:
ð16Þ
This enhances the asynchrony discrimination because
random effects derived from the output probability
density functions training are removed and only
differences in the decoded state sequences are taken into
account: if H1 holds then it is likely that rare joint state
transitions in Q makes the ratio in Eq. 15 fall below h. The
state transition matrix of k0 is defined in such a way that the
next state si for every HMM i depends only on its previous
state ri. It is known that:
a0i;siri¼ Pðqi
t ¼ sijqit�1 ¼ riÞ
¼X
qt�1jqit�1¼ri
Pðqit ¼ sijqt�1 ¼ rÞ
YNh
j¼1;j6¼i
Pðqjt�1 ¼ rjÞ
¼XNS1
r1¼1
. . .XNSi�1
ri�1¼1
XNSiþ1
riþ1¼1
. . .XNSNh
rNh¼1
ai;sir
YNh
j¼1;j6¼i
Pðqjt�1 ¼ rjÞ:
ð17Þ
The probability P(qit = ri) can be calculated. It depends on
time, however, and it is not desirable to work with time-
dependent state transition probabilities. Therefore, since
the quantity limt!inf Pðqit ¼ riÞ converges quickly for
ergodic HMMs, it is computed following this iterative
procedure:
1. Initialization: for t = 1,
Pðqi1 ¼ siÞ ¼ pi
si: ð18Þ
2. Induction:
Pðqit¼siÞ ¼
X
r
ai;sir
YNh
j¼1
Pðqjt�1¼rjÞ ð19Þ
3. Stop condition:
Pðqit ¼ siÞ � Pðqi
t�1 ¼ siÞPðqi
t ¼ siÞ
����
����\10�6: ð20Þ
An example of the uncoupled transition matrices
obtained by this uncoupling procedure is illustrated in
Fig. 7. It should be noted that the original CHMM from
which the uncoupled transition matrices are obtained has
250 different fai;sir g parameters.
6 Bayesian fusion using GMM as a probability density
function estimator
CoIA and CHMM are different approaches to asynchrony
detection. While CoIA uses linear correlation as a measure
of synchrony between acoustic and visual features, CHMM
uses dynamic statistics to determine whether acoustic and
visual features are synchronous. Because they use com-
plementary information, fusing them could lead to
improved performance. Statistical fusion techniques such
as GMM fusion [18] can be used for this purpose. In our
framework, the joint probability density function f of the
CoIA and CHMM scores s1 and s2 for both the synchro-
nized S and non-synchronized N acoustic and visual
features is modeled using two GMMs:
fSðsðX; YÞÞ ¼ PðsðX; YÞjX and Y are synchronizedÞ ð21Þ
34
1
2
Audio stream HMM after theuncoupling procedure
Video stream HMM after theuncoupling procedure
34
1
2
0.9473
0.8513
0.8306 0.8681
0.2053
0.7440
0.8754
0.9065
0.8647
0.1012
0.85030.8938
0.0593
0.0485
0.0222
0.09350.0527
0.03870.0507
0.04740.1487
0.1062 0.11
31
0.09
32
0.12200.0652
5 5
Fig. 7 Uncoupled HMMs obtained with the uncoupling procedure
described in Sect. 4.2
Pattern Anal Applic
123
fNðsðX; YÞÞ ¼ PðsðX; YÞjX and Yare not synchronizedÞ;ð22Þ
where sðX; YÞ ¼ ðs1ðX; YÞ; s2ðX; YÞÞt and fS and fN can
both be expressed as follows:
fqðsÞ¼XN
i¼1
wqi
1ffiffiffiffiffiffiffiffiffiffiffiffiffiffiffiffiffiffiffiffiffið2pÞd Cq
ik kq exp �1
2ðs�lq
i ÞTCq
i�1ðs�lq
i Þ�
ð23Þ
fS and fN are initialized using the LBG algorithm and
trained using the EM algorithm. To discriminate between
synchronized and not synchronized acoustic and visual
streams, the following hypothesis test is performed:
X and Y are synchronized () fSðsðX; YÞÞfNðsðX; YÞÞ
[ h: ð24Þ
We used the above method in our fusion experiments
described below. Additional results using the sum rule are
reported as a baseline for fusion [19].
7 Other methods for asynchrony detection
Several asynchrony detection techniques have already been
studied in the literature, as indicated in the introduction.
We performed the same experiments with CHMM, CoIA
approaches (including Eveno and Besacier’s approach),
CANCOR and MI to compare performance. Although
descriptions of these approaches can be found in the lite-
rature [8–12], some implementation issues must be
discussed in order to facilitate understanding of the results
presented later in this paper.
Eveno’s measure In a similar liveness test framework
[8], Eveno and Besacier apply CANCOR analysis and
CoIA to the tested sequence, in order to obtain the first
projection vectors a1 and b1. The design of their synchrony
measure M(X,Y) (summarized by Eq. 27) results from the
observation of the value of the correlation q between a1t X
and b1t Y, as a function of the shift d between audio and
visual features: its maximum value qref is often obtained
for a small negative shift:
qref ¼ max�80 ms� d� 0
corr a1tXd;b1
tY� �� �
ð25Þ
qavg ¼ mean corr a1tXd; b1
tY� �� �
ð26Þ
where Xd is the d-shifted X.
MðX; YÞ ¼ 1
2Dþ 1
qref
qavg
� 1
!XD
d¼�D
f ðcorrðat1Xd; bt
1YÞÞ
ð27Þ
where f (q) = 1 if q B qref and 0 otherwise, and D corres-
ponds to a time-shift of 400 ms (10 visual frames). M(X, Y)
can be seen as a measure of the peakiness of the maximum
found in the interval [-80, 0 ms]. Our implementation of
Eveno’s algorithm involves the use of slightly different
acoustic features to those described in [8] (MFCC instead of
LPC). The major difference between our self-training
method and Eveno’s approach is that we considered more
than just the first dimension, X 1 and Y1: Moreover, the
world-training method is also quite different in that it makes
use of a prior training step where universal transformation
matrices AX and BX are learned.
CANCOR CANCOR analysis is applied to synchrony
detection [10] in the same manner as CoIA is. All the
synchrony detection techniques described for CoIA can be
directly tested using the CANCOR approach. The same
training sets are used for the estimation of CoIA and
CANCOR transformation matrices.
MI Mutual information between visual and acoustic
parameters can be defined in several ways depending on
the probability density estimator used to model joint and
separate feature vectors. In our case we use GMMs as
parameter estimators for visual, acoustic and joint visual
and acoustic features in the CoIA-transformed space; the
MI measure is therefore defined as:
MIðX; YÞ ¼XN
t¼1
fAVðX t;YtÞ logfAVðX t;YtÞ
fAðX tÞfVðYtÞ
� ; ð28Þ
where fAV, fA and fV are the GMM probability density func-
tions, as defined in Eq. 23, for the joint audio–visual features,
the audio features and the visual features, respectively.
8 Experiments
8.1 Experimental framework
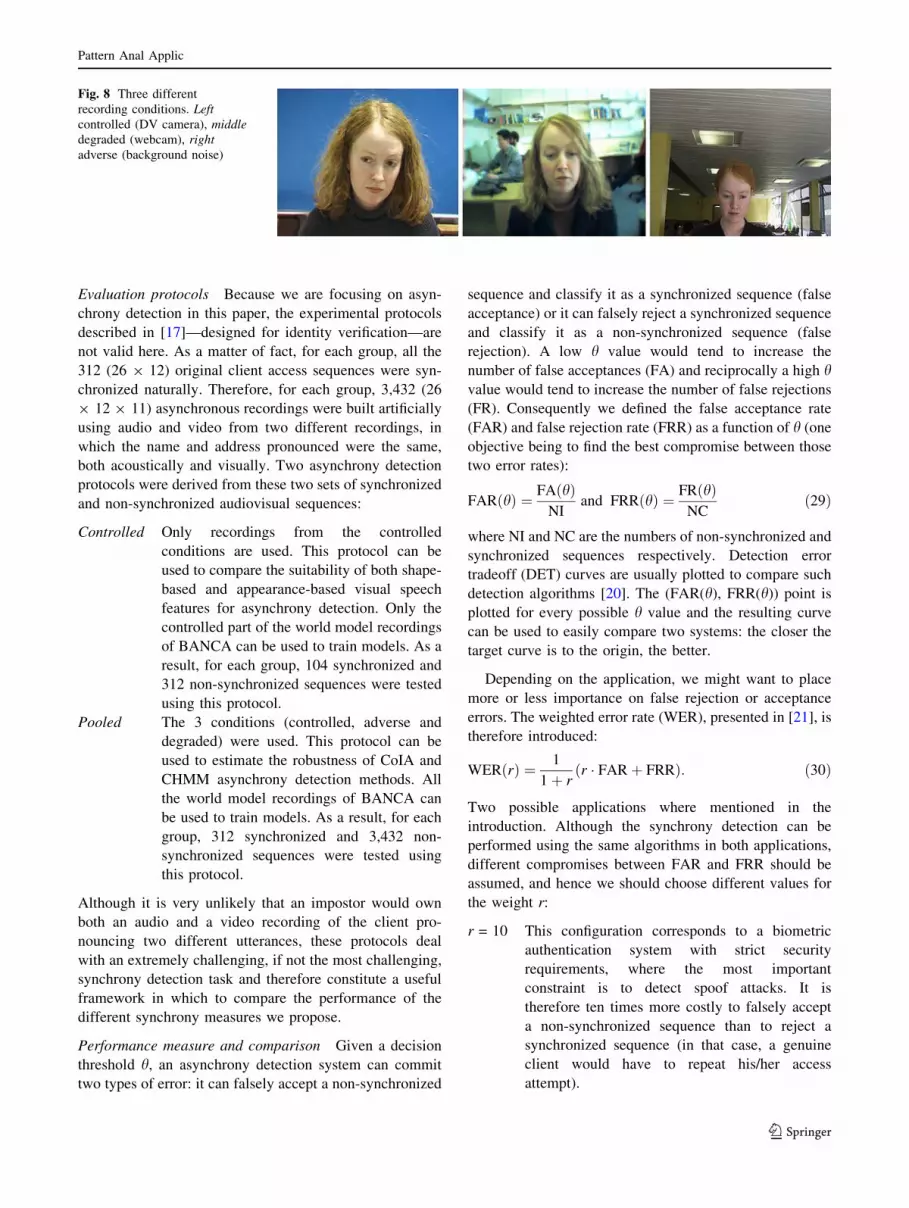
BANCA database We conducted our experiments using
the English part of the BANCA database [17], which was
originally designed for biometric system evaluation pur-
poses only. Two disjoint groups of 26 people (13 male and
13 female) recorded 24 sequences of approximately 15 s,
in which they each pronounced a sequence of 10 digits and
either their name and address (client access) or the name
and address of another person (impostor access). The
recordings were performed under three different conditions
(controlled, degraded and adverse) as shown in Fig. 8.
Sixty additional sequences from 30 different people were
also recorded (under controlled, degraded and adverse
conditions) and used to create the world model.
Pattern Anal Applic
123
Evaluation protocols Because we are focusing on asyn-
chrony detection in this paper, the experimental protocols
described in [17]—designed for identity verification—are
not valid here. As a matter of fact, for each group, all the
312 (26 9 12) original client access sequences were syn-
chronized naturally. Therefore, for each group, 3,432 (26
9 12 9 11) asynchronous recordings were built artificially
using audio and video from two different recordings, in
which the name and address pronounced were the same,
both acoustically and visually. Two asynchrony detection
protocols were derived from these two sets of synchronized
and non-synchronized audiovisual sequences:
Controlled Only recordings from the controlled
conditions are used. This protocol can be
used to compare the suitability of both shape-
based and appearance-based visual speech
features for asynchrony detection. Only the
controlled part of the world model recordings
of BANCA can be used to train models. As a
result, for each group, 104 synchronized and
312 non-synchronized sequences were tested
using this protocol.
Pooled The 3 conditions (controlled, adverse and
degraded) were used. This protocol can be
used to estimate the robustness of CoIA and
CHMM asynchrony detection methods. All
the world model recordings of BANCA can
be used to train models. As a result, for each
group, 312 synchronized and 3,432 non-
synchronized sequences were tested using
this protocol.
Although it is very unlikely that an impostor would own
both an audio and a video recording of the client pro-
nouncing two different utterances, these protocols deal
with an extremely challenging, if not the most challenging,
synchrony detection task and therefore constitute a useful
framework in which to compare the performance of the
different synchrony measures we propose.
Performance measure and comparison Given a decision
threshold h, an asynchrony detection system can commit
two types of error: it can falsely accept a non-synchronized
sequence and classify it as a synchronized sequence (false
acceptance) or it can falsely reject a synchronized sequence
and classify it as a non-synchronized sequence (false
rejection). A low h value would tend to increase the
number of false acceptances (FA) and reciprocally a high hvalue would tend to increase the number of false rejections
(FR). Consequently we defined the false acceptance rate
(FAR) and false rejection rate (FRR) as a function of h (one
objective being to find the best compromise between those
two error rates):
FARðhÞ ¼ FAðhÞNI
and FRRðhÞ ¼ FRðhÞNC
ð29Þ
where NI and NC are the numbers of non-synchronized and
synchronized sequences respectively. Detection error
tradeoff (DET) curves are usually plotted to compare such
detection algorithms [20]. The (FAR(h), FRR(h)) point is
plotted for every possible h value and the resulting curve
can be used to easily compare two systems: the closer the
target curve is to the origin, the better.
Depending on the application, we might want to place
more or less importance on false rejection or acceptance
errors. The weighted error rate (WER), presented in [21], is
therefore introduced:
WER rð Þ ¼ 1
1þ rr � FARþ FRRð Þ: ð30Þ
Two possible applications where mentioned in the
introduction. Although the synchrony detection can be
performed using the same algorithms in both applications,
different compromises between FAR and FRR should be
assumed, and hence we should choose different values for
the weight r:
r = 10 This configuration corresponds to a biometric
authentication system with strict security
requirements, where the most important
constraint is to detect spoof attacks. It is
therefore ten times more costly to falsely accept
a non-synchronized sequence than to reject a
synchronized sequence (in that case, a genuine
client would have to repeat his/her access
attempt).
Fig. 8 Three different
recording conditions. Leftcontrolled (DV camera), middledegraded (webcam), rightadverse (background noise)
Pattern Anal Applic
123
r = 1 This configuration might be used in an application
where no strong binary decision (synchronized vs.
non-synchronized) is needed. It could be used, for
example, to select the true speaker form a large
group of people on a screen.
Are results generalizable and conclusive? Because the
BANCA database is divided into two disjoint groups,
namely G1 and G2, the WERs for one group (the test set)
are calculated using the thresholds that minimizes the
WERs for the other group (the training set). This prevents
the results from being biased by the choice of threshold.
Confidence intervals at 95% are then computed using the
method proposed in [22] with the following formula, where
a = 1.960 and WERðrÞ is the estimation obtained thanks to
the test set:
WERðrÞ 2WERðrÞ � a �ffiffiffiffiffiffiffiffiffiffiffiffiffi
1
1þ r2
r
�ffiffiffiffiffiffiffiffiffiffiffiffiffiffiffiffiffiffiffiffiffiffiffiffiffiffiffiffiffiffiffiffiffiffiffiffiffiffiffiffiffiffiffiffiffiffiffiffiffiffiffiffiffiffiffiffiffiffiffiffiffiffiffiffiffiffiffiffiffiffiffiffiffiffiffiffiffiffiffiffiffiffiffiffiffir2
NI� FARð1� FARÞ þ 1
NC� FRRð1� FRRÞ
r
:
ð31Þ
As a matter of fact, given the small number of tests that are
performed, it is important to make sure that the resulting
difference between the error rates of two methods is stas-
tically significant and capable of generating conclusive
results.
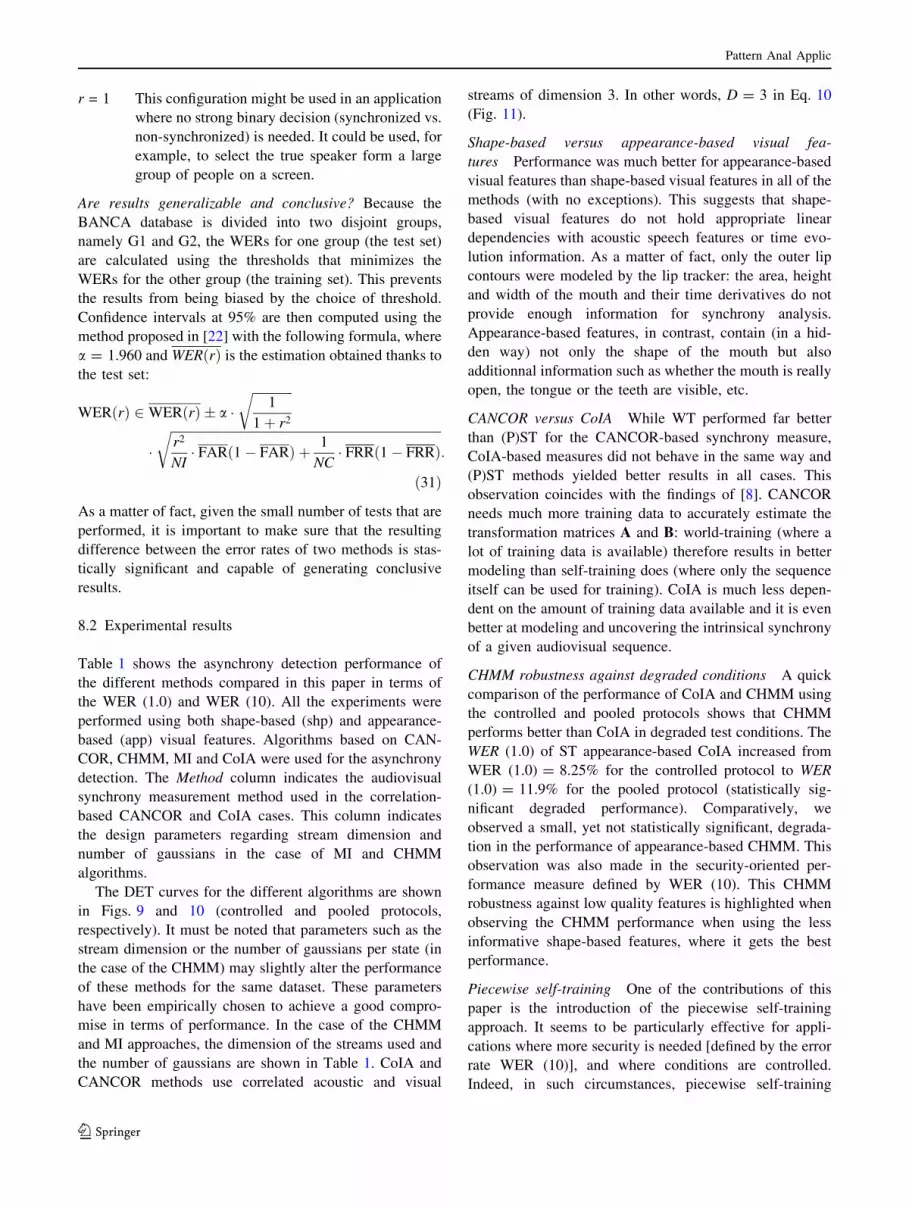
8.2 Experimental results
Table 1 shows the asynchrony detection performance of
the different methods compared in this paper in terms of
the WER (1.0) and WER (10). All the experiments were
performed using both shape-based (shp) and appearance-
based (app) visual features. Algorithms based on CAN-
COR, CHMM, MI and CoIA were used for the asynchrony
detection. The Method column indicates the audiovisual
synchrony measurement method used in the correlation-
based CANCOR and CoIA cases. This column indicates
the design parameters regarding stream dimension and
number of gaussians in the case of MI and CHMM
algorithms.
The DET curves for the different algorithms are shown
in Figs. 9 and 10 (controlled and pooled protocols,
respectively). It must be noted that parameters such as the
stream dimension or the number of gaussians per state (in
the case of the CHMM) may slightly alter the performance
of these methods for the same dataset. These parameters
have been empirically chosen to achieve a good compro-
mise in terms of performance. In the case of the CHMM
and MI approaches, the dimension of the streams used and
the number of gaussians are shown in Table 1. CoIA and
CANCOR methods use correlated acoustic and visual
streams of dimension 3. In other words, D = 3 in Eq. 10
(Fig. 11).
Shape-based versus appearance-based visual fea-
tures Performance was much better for appearance-based
visual features than shape-based visual features in all of the
methods (with no exceptions). This suggests that shape-
based visual features do not hold appropriate linear
dependencies with acoustic speech features or time evo-
lution information. As a matter of fact, only the outer lip
contours were modeled by the lip tracker: the area, height
and width of the mouth and their time derivatives do not
provide enough information for synchrony analysis.
Appearance-based features, in contrast, contain (in a hid-
den way) not only the shape of the mouth but also
additionnal information such as whether the mouth is really
open, the tongue or the teeth are visible, etc.
CANCOR versus CoIA While WT performed far better
than (P)ST for the CANCOR-based synchrony measure,
CoIA-based measures did not behave in the same way and
(P)ST methods yielded better results in all cases. This
observation coincides with the findings of [8]. CANCOR
needs much more training data to accurately estimate the
transformation matrices A and B: world-training (where a
lot of training data is available) therefore results in better
modeling than self-training does (where only the sequence
itself can be used for training). CoIA is much less depen-
dent on the amount of training data available and it is even
better at modeling and uncovering the intrinsical synchrony
of a given audiovisual sequence.
CHMM robustness against degraded conditions A quick
comparison of the performance of CoIA and CHMM using
the controlled and pooled protocols shows that CHMM
performs better than CoIA in degraded test conditions. The
WER (1.0) of ST appearance-based CoIA increased from
WER (1.0) = 8.25% for the controlled protocol to WER
(1.0) = 11.9% for the pooled protocol (statistically sig-
nificant degraded performance). Comparatively, we
observed a small, yet not statistically significant, degrada-
tion in the performance of appearance-based CHMM. This
observation was also made in the security-oriented per-
formance measure defined by WER (10). This CHMM
robustness against low quality features is highlighted when
observing the CHMM performance when using the less
informative shape-based features, where it gets the best
performance.
Piecewise self-training One of the contributions of this
paper is the introduction of the piecewise self-training
approach. It seems to be particularly effective for appli-
cations where more security is needed [defined by the error
rate WER (10)], and where conditions are controlled.
Indeed, in such circumstances, piecewise self-training
Pattern Anal Applic
123
always results in a small (yet not statistically significant)
improvement over the self-training approach.
MI This approach seems to be the least successful of all
those tested in this paper for asynchrony detection. How-
ever, this does not mean that MI should not be used for
monologue detection or speaker association. What it means
is that the technique may not be appropriate when a global
threshold is required, as in the case of a biometric appli-
cation or a synchrony quality assessment task.
Sum rule and GMM fusion Performance improved when
CoIA and CHMM were fused. The two systems encoded
different types of synchrony data, and hence, when fused,
resulted in improved performance, even though the two
systems were using the same audiovisual features.
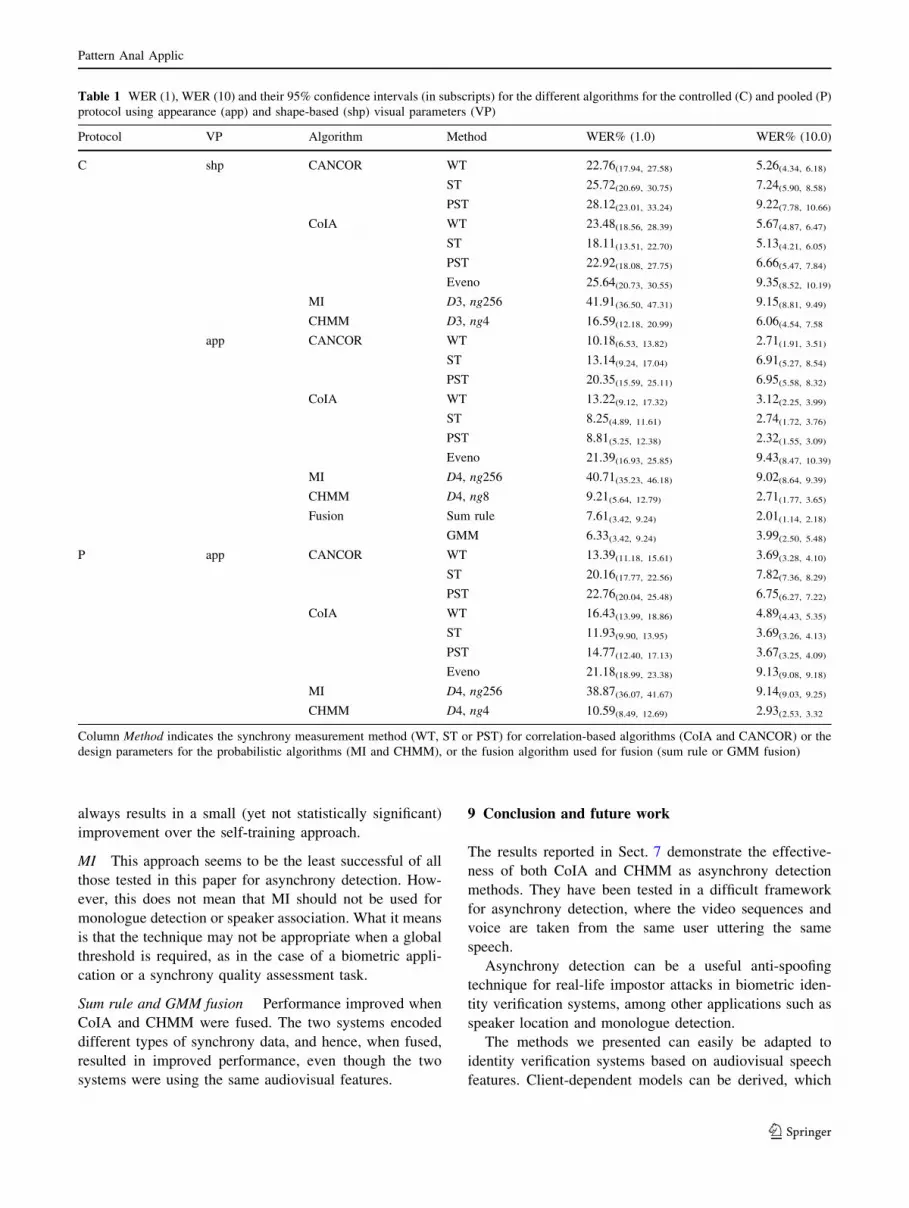
9 Conclusion and future work
The results reported in Sect. 7 demonstrate the effective-
ness of both CoIA and CHMM as asynchrony detection
methods. They have been tested in a difficult framework
for asynchrony detection, where the video sequences and
voice are taken from the same user uttering the same
speech.
Asynchrony detection can be a useful anti-spoofing
technique for real-life impostor attacks in biometric iden-
tity verification systems, among other applications such as
speaker location and monologue detection.
The methods we presented can easily be adapted to
identity verification systems based on audiovisual speech
features. Client-dependent models can be derived, which
Table 1 WER (1), WER (10) and their 95% confidence intervals (in subscripts) for the different algorithms for the controlled (C) and pooled (P)
protocol using appearance (app) and shape-based (shp) visual parameters (VP)
Protocol VP Algorithm Method WER% (1.0) WER% (10.0)
C shp CANCOR WT 22.76(17.94, 27.58) 5.26(4.34, 6.18)
ST 25.72(20.69, 30.75) 7.24(5.90, 8.58)
PST 28.12(23.01, 33.24) 9.22(7.78, 10.66)
CoIA WT 23.48(18.56, 28.39) 5.67(4.87, 6.47)
ST 18.11(13.51, 22.70) 5.13(4.21, 6.05)
PST 22.92(18.08, 27.75) 6.66(5.47, 7.84)
Eveno 25.64(20.73, 30.55) 9.35(8.52, 10.19)
MI D3, ng256 41.91(36.50, 47.31) 9.15(8.81, 9.49)
CHMM D3, ng4 16.59(12.18, 20.99) 6.06(4.54, 7.58
app CANCOR WT 10.18(6.53, 13.82) 2.71(1.91, 3.51)
ST 13.14(9.24, 17.04) 6.91(5.27, 8.54)
PST 20.35(15.59, 25.11) 6.95(5.58, 8.32)
CoIA WT 13.22(9.12, 17.32) 3.12(2.25, 3.99)
ST 8.25(4.89, 11.61) 2.74(1.72, 3.76)
PST 8.81(5.25, 12.38) 2.32(1.55, 3.09)
Eveno 21.39(16.93, 25.85) 9.43(8.47, 10.39)
MI D4, ng256 40.71(35.23, 46.18) 9.02(8.64, 9.39)
CHMM D4, ng8 9.21(5.64, 12.79) 2.71(1.77, 3.65)
Fusion Sum rule 7.61(3.42, 9.24) 2.01(1.14, 2.18)
GMM 6.33(3.42, 9.24) 3.99(2.50, 5.48)
P app CANCOR WT 13.39(11.18, 15.61) 3.69(3.28, 4.10)
ST 20.16(17.77, 22.56) 7.82(7.36, 8.29)
PST 22.76(20.04, 25.48) 6.75(6.27, 7.22)
CoIA WT 16.43(13.99, 18.86) 4.89(4.43, 5.35)
ST 11.93(9.90, 13.95) 3.69(3.26, 4.13)
PST 14.77(12.40, 17.13) 3.67(3.25, 4.09)
Eveno 21.18(18.99, 23.38) 9.13(9.08, 9.18)
MI D4, ng256 38.87(36.07, 41.67) 9.14(9.03, 9.25)
CHMM D4, ng4 10.59(8.49, 12.69) 2.93(2.53, 3.32
Column Method indicates the synchrony measurement method (WT, ST or PST) for correlation-based algorithms (CoIA and CANCOR) or the
design parameters for the probabilistic algorithms (MI and CHMM), or the fusion algorithm used for fusion (sum rule or GMM fusion)
Pattern Anal Applic
123

would provide complementary information to speaker or
face verifiers working in a multimodal framework.
Synchrony evaluation could also be used in other fields
that are not directly related to biometrics, speaker location
or monologue detection. It could be used, for example, to
replace tasks that are currently done manually, such as the
alignment of video and soundtrack in movie post-produc-
tion, or the evaluation of the quality of dubbing into a
foreign language.
New directions of research in asynchrony detection
emerge from this paper. We have shown how fusing
CoIA and CHMM scores can lead to improved
Fig. 9 Controlled protocol DET curves for the best methods shown in Table 1 using appearance-based (left) and shape-based visual features
(right)
0.1 0.2 0.5 1 2 5 10 20 40
0.1
0.2
0.5
1
2
5
10
20
40
False Alarm probability (in %)
Mis
s pr
obab
ility
(in
%)
Pooled Protocol DET curves
CHMM − D4, ng4 − AppearanceCoIA − ST − AppearanceCANCOR − WT − Appearance
Fig. 10 Pooled protocol DET curves for the best methods shown in
Table 1 using appearance-based and shape-based visual features
5 10 20 40
0.1
0.2
0.5
1
2
5
10
20
False Alarm probability (in %)
Mis
s pr
obab
ility
(in
%)
Controlled Protocol fusion experiment DET curves
CHMM − D3,ng4
CoIA − PST
Sum Rule fusion
GMM fusion
Fig. 11 Controlled protocol DET curves for the best CoIA and
CHMM methods, sum rule and GMM fusion algorithms
Pattern Anal Applic
123
performance. Appearance- and shape-based systems can
also be fused at feature level. The two systems offer
different methods for integrating multiple information
sources: while CoIA can be applied to concatenated
appearance- and shape-based visual features, CHMM can
work with an acoustic stream, an appearance-based visual
feature stream and a shape-based visual feature stream.
Structural improvements to CHMM are also a possibility
in future studies given that CHMM families have already
been used successfully for audiovisual speech recognition
purposes [23, 24]. A large number of training audiovisual
utterances containing different phonetic units is required
if acceptable speech recognition accuracy is to be
achieved. The uncoupling procedure described in
Sect. 4.2 can be applied to such a CHMM audiovisual
speech recognizer to obtain an asynchrony detector. The
results would more than likely be much more accurate
than those described here. Our system suffered from
structural limitations due to insufficient training material
and this resulted in poor audiovisual speech unit model-
ing, which is mostly based on the evolution of the most
correlated components of both streams. Another promis-
ing research direction emerges from recently derived
tensor based classification frameworks [25, 26]. Tensors
encoding audio-visual speech features from several con-
secutive sampling periods can keep most of the dynamic
relationship between lips movement and speech dynamics,
while the use of tensors algebra can overcome the scarcity
of training data. Equivalent CoIA and CANCOR tensor
techniques should be derived in a future work and tested
in the audio-visual asynchrony detection problem pre-
sented in this paper.
Acknowledgments This work has been partially supported by
Spanish Ministry of Education and Science (project PRESA
TEC2005-07212), by the Xunta de Galicia (project PGI-
DIT05TIC32202PR) and by the European Union through the
European Networks of Excellence BioSecure and K-Space.
References
1. Potamianos G, Neti C, Luettin J, Matthews I (2004) Audio-visual
automatic speech recognition: an overview. Issues Vis Audio Vis
Speech Process
2. Liu X, Liang L, Zhaa Y, Pi X, Nefian AV (2002) Audio-visual
continuous speech recognition using a coupled hidden Markov
model. In: Proceedings of the international conference on spoken
language processing
3. Gurbuz S, Tufekci Z, Patterson T, Gowdy JN (2002) Multi-
stream product modal audio-visual integration strategy for robust
adaptive speech recognition. In: Proceedings of IEEE interna-
tional conference on acoustics, speech and signal processing,
Orlando
4. Chibelushi CC, Deravi F, Mason JSD (2002) A review of speech-
based bimodal recognition. IEEE Trans Multimed 4(1):23–37
5. Pan H, Liang Z-P, Huang TS (2000) A new approach to integrate
audio and visual features of speech. In: IEEE international con-
ference on multimedia and expo., pp 1093 – 1096
6. Chaudhari UV, Ramaswamy GN, Potamianos G, Neti C (2003)
Information fusion and decision cascading for audio-visual
speaker recognition based on time-varying stream reliability
prediction. In: IEEE international conference on multimedia
expo., vol III. Baltimore, pp 9–12, July 2003
7. Chetty G, Wagner M (2004) ‘‘Liveness’’ verification in audio-
video authentication. In: Australian international conference on
speech science and technology, pp 358–363
8. Eveno N, Besacier L (2005) A speaker independent liveness test
for audio-video biometrics. In: Nineth European conference on
speech communication and technology
9. Hershey J, Movellan J (2000) Audio vision: using audiovisual
synchrony to locate sounds. In: Advances in neural information
processing systems, vol 12, pp 813–819
10. Slaney M, Covell M (2000) FaceSync: a linear operator for
measuring synchronization of video facial images and audio
tracks. Neural Inf Process Soc 13
11. Fisher JW, Darell T (2004) Speaker association with signal-level
audiovisual fusion. IEEE Trans Multimed 6(3):406–413
12. Nock HJ, Iyengar G, Neti C (2002) Assessing face and speech
consistency for monologue detection in video. Multimedia 303–306
13. Bredin H, Chollet G (2006) Measuring audio and visual speech
synchrony: methods and applications. In: International confer-
ence on visual information engineering
14. Lucas BD, Kanade T (1981) An iterative image registration
technique with an application to stereo vision. In: DARPA image
understanding workshop, pp 121–130
15. Bredin H, Aversano G, Mokbel C, Chollet G (2006) The biose-
cure talking-face reference system. In: Second workshop on
multimodal user authentication, May 2006
16. Doledec S, Chessel D (1994) Co-inertia analysis: an alternative
method for studying species-environment relationships. Freshw
Biol 31:277–294
17. Bailly-Bailliere E, Bengio E, Bimbot F, Hamouz M, Kittler J,
Mariethoz J, Matas J, Messer K, Popovici V, Poree F, Ruiz B,
Thiran J-P (2003) The BANCA database and evaluation protocol.
In: Lecture notes in computer science, vol 2688, pp 625–638,
January 2003
18. Gutierrez J, Rouas J-L, Andre-Obrecht R (2004) Weighted loss
functions to make risk-based language identification fused deci-
sions. In: IEEE Computer Society (ed). Proceedings of the 17th
international conference on pattern recognition (ICPR’04)
19. Qian J-Z, Ross A, Jain A (2001) Information fusion in biometrics.
In: Proceedings of 3rd international conference on audio- and
video-based person authentication (AVBPA), pp 354–359, Swe-
den, June 2001
20. Martin A, Doddington G, Kamm T, Ordowski M, Przybocki M
(1997) The DET curve in assessment of detection task perfor-
mance. In: European conference on speech communication and
technology, pp 1895–1898
21. Bailly-Bailliere E, Bengio S, Bimbot F, Hamouz M, Kittler J,
Mariothoz J, Matas J, Messer K, Popovici V, Poree F, Ruiz B,
Thiran J-P (2003) The banca database and evaluation protocol
22. Bengio S, Mariethoz J (2004) A statistical significance test for
person authentication. ODYSSEY 2004—the speaker and lan-
guage recognition workshop, pp 237–244
23. Zhang X, Mersereau RM, Clements M (2002) Bimodal fusion in
audio-visual speech recognition, vol 1. In: IEEE 2002 interna-
tional conference on image processing, pp 964–967, September
2002
24. Nefian AV, Liang L, Pi X, Xiaoxiang L, Mao C, Murphy K
(2002) A coupled HMM for audio-visual speech recognition. In:
Pattern Anal Applic
123

Proceedings of the international conference on acoustics speech
and signal processing (ICASSP02), May 2002
25. Tao D, Li X, Hu W, Maybank S, Wu X (2007) Supervised tensor
learning. knowledge and information systems, 13(1):1–42
26. Tao D, Li X, Wu X, Maybank SJ (2007) General tensor dis-
criminant analysis and gabor features for gait recognition. IEEE
Trans Pattern Anal Mach Intell 29(10):700–715
Author Biographies
Enrique Argones Rua received
the Telecommunications Engi-
neer degree from the
Universidad de Vigo, Spain, in
2003, where he is currently
pursuing the Ph.D. degree in the
field of audio-visual biometrics.
His research interests include
speaker verification, multimodal
fusion and video-based face
verification.
Herve Bredin received his
Ph.D. degree from the Signal
and Image Processing Depart-
ment of Telecom Paris Tech in
2007, focusing mostly on
audiovisual identity verification
based on talking-faces and its
robustness to high-effort forgery
(such as replay attacks, face
animation or voice transforma-
tion). He is now with the Center
for Digital Video Processing at
Dublin City University.
Carmen Garcıa Mateoreceived the M.Sc. and Ph.D.
degrees (Hons.) in telecommu-
nications engineering from the
Universidad Politecnicade
Madrid, Spain, in 1987 and
1993, respectively. Her research
interests include speech, and
speaker recognition, dialogue
systems and biometric applica-
tions. She has been the leader of
a number of R&D projects and
published papers on these top-
ics. She is Professor in the field
of Discrete Signal processing at the Universidad de Vigo.
Gerard Chollet studied Lin-
guistics, Electrical Engineering
and Computer Science at the
University of California, Santa
Barbara where he was granted a
Ph.D. in Computer Science and
Linguistics. He joined CNRS in
1978 at the Institut de Phone-
tique in Aix en Provence. In
1992, he participated to the
development of IDIAP, a new
research laboratory of the
‘‘Fondation Dalle Molle’’ in
Martigny, Switzerland. Since
1996, he is at ENST, managing research projects and supervising
doctoral work. His main research interests are in phonetics, automatic
speech processing, speech dialog systems, multimedia, pattern rec-
ognition, digital signal processing, speech pathology, speech training
aids,…
Daniel Gonzalez Jimenezreceived the Telecommunica-
tions Engineer degree from the
Universidad de Vigo, Spain, in
2003, where he is currently
pursuing the Ph.D. degree in the
field of face-based biometrics.
His research interests include
computer vision and image
processing.
Pattern Anal Applic
123