The phylogenetic relationships of flies in the superfamily Empidoidea (Insecta: Diptera)
13
The phylogenetic relationships of flies in the superfamily Empidoidea (Insecta: Diptera) John K. Moulton a, * , Brian M. Wiegmann b a Department of Entomology and Plant Pathology, 2431 Joe Johnson Drive, 205 Ellington Plant Sciences Building, The University of Tennessee, Knoxville, TN 37996-4560, USA b Department of Entomology, Gardner Hall, Campus Box 7613, North Carolina State University, Raleigh, NC 27695-7613, USA Received 9 August 2005; revised 21 February 2007; accepted 27 February 2007 Available online 13 March 2007 Abstract We conducted a molecular phylogenetic study of the Empidoidea, a diverse group of 10,000 species of true flies, with two major goals: to reconstruct a taxonomically complete and robustly supported phylogeny for the group and to use this information to assess several competing classifications for the clade. We amassed 3900+ nucleotides of coding data from the carbamoylphosphate synthase domain of the rudimentary locus (CAD) and 1200+ nucleotides from the large nuclear ribosomal subunit (28S) from 72 and 71 species, respectively, representing several orthorrhaphan and cyclorrhaphan families and all previously recognized empidoidean subfamilies. Independent and combined phylogenetic analyses of these data were conducted using parsimony, maximum likelihood, and Bayesian criteria. The com- bined matrix included 61 taxa for which both CAD and 28S sequences were obtained. Analyses of CAD first and second codon positions alone and when concatenated with 28S sequences yielded trees with similar and largely stable topologies. Analyses of 28S data alone supported many clades although resolution is limited by low sequence divergence. The following major empidoid clades were recovered with convincing support in a majority of analyses: Atelestidae, Empidoidea exclusive of Atelestidae, Hybotidae sensu lato, Dolichopo- didae + Microphorinae (including Parathallassius), and Empididae sensu lato (including Brachystomatinae, Ceratomerinae, Clinoceri- nae, Empidinae, Hemerodromiinae, Oreogetoninae, and Trichopezinae). The branching arrangement among these four major clades was Atelestidae, Hybotidae, Dolichopodidae/Microphorinae, Empididae. Previously recognized subclades recovered with robust support included Hybotinae, Brachystomatinae, Tachydromiinae, Clinocerinae (in part), Hemerodromiinae, Empidinae, and Empidiini. Published by Elsevier Inc. Keywords: Diptera; Dance fly; Phylogeny; Systematics; DNA; Protein 1. Introduction Chva ´la (1983) proposed that Empidoidea should be divided into four family-level group taxa—Atelestidae, Hybotidae, Microphoridae + Dolichopodidae, and Empid- idae s.str.—based on morphological grounds. This classifi- cation has not been universally accepted, however, particularly in regions outside of Europe, with most work- ers electing to retain the classical two family system, i.e., Dolichopodidae and Empididae. This action creates a heterogeneous Empididae that is comprised of several subfamilies having dubious monophyly (Cumming et al., 1995; Sinclair and Cumming, 2006). Great morphological and species diversity, along with competing alternative interpretations of homology especially in the male genita- lia, have perpetuated the differential use of rival classifica- tions (Chva ´la, 1983; Cumming et al., 1995; Sinclair, 1995; Sinclair and Cumming, 2006). Six classifications for the Empidoidea based on phyloge- netic hypotheses have been published since Chva ´la (1983)—Wiegmann et al. (1993), Cumming et al. (1995), Collins and Wiegmann (2002a), Moulton and Wiegmann (2004), Yang (2004), and, most recently, Sinclair and 1055-7903/$ - see front matter Published by Elsevier Inc. doi:10.1016/j.ympev.2007.02.029 * Corresponding author. Fax: +1 865 974 4744. E-mail address: [email protected] (J.K. Moulton). www.elsevier.com/locate/ympev Molecular Phylogenetics and Evolution 43 (2007) 701–713
-
Upload
independent -
Category
Documents
-
view
0 -
download
0
Transcript of The phylogenetic relationships of flies in the superfamily Empidoidea (Insecta: Diptera)
www.elsevier.com/locate/ympev
Molecular Phylogenetics and Evolution 43 (2007) 701–713
The phylogenetic relationships of flies in the superfamilyEmpidoidea (Insecta: Diptera)
John K. Moulton a,*, Brian M. Wiegmann b
a Department of Entomology and Plant Pathology, 2431 Joe Johnson Drive, 205 Ellington Plant Sciences Building,
The University of Tennessee, Knoxville, TN 37996-4560, USAb Department of Entomology, Gardner Hall, Campus Box 7613, North Carolina State University, Raleigh, NC 27695-7613, USA
Received 9 August 2005; revised 21 February 2007; accepted 27 February 2007Available online 13 March 2007
Abstract
We conducted a molecular phylogenetic study of the Empidoidea, a diverse group of 10,000 species of true flies, with two major goals:to reconstruct a taxonomically complete and robustly supported phylogeny for the group and to use this information to assess severalcompeting classifications for the clade. We amassed 3900+ nucleotides of coding data from the carbamoylphosphate synthase domain ofthe rudimentary locus (CAD) and 1200+ nucleotides from the large nuclear ribosomal subunit (28S) from 72 and 71 species, respectively,representing several orthorrhaphan and cyclorrhaphan families and all previously recognized empidoidean subfamilies. Independent andcombined phylogenetic analyses of these data were conducted using parsimony, maximum likelihood, and Bayesian criteria. The com-bined matrix included 61 taxa for which both CAD and 28S sequences were obtained. Analyses of CAD first and second codon positionsalone and when concatenated with 28S sequences yielded trees with similar and largely stable topologies. Analyses of 28S data alonesupported many clades although resolution is limited by low sequence divergence. The following major empidoid clades were recoveredwith convincing support in a majority of analyses: Atelestidae, Empidoidea exclusive of Atelestidae, Hybotidae sensu lato, Dolichopo-didae + Microphorinae (including Parathallassius), and Empididae sensu lato (including Brachystomatinae, Ceratomerinae, Clinoceri-nae, Empidinae, Hemerodromiinae, Oreogetoninae, and Trichopezinae). The branching arrangement among these four major cladeswas Atelestidae, Hybotidae, Dolichopodidae/Microphorinae, Empididae. Previously recognized subclades recovered with robust supportincluded Hybotinae, Brachystomatinae, Tachydromiinae, Clinocerinae (in part), Hemerodromiinae, Empidinae, and Empidiini.Published by Elsevier Inc.
Keywords: Diptera; Dance fly; Phylogeny; Systematics; DNA; Protein
1. Introduction
Chvala (1983) proposed that Empidoidea should bedivided into four family-level group taxa—Atelestidae,Hybotidae, Microphoridae + Dolichopodidae, and Empid-idae s.str.—based on morphological grounds. This classifi-cation has not been universally accepted, however,particularly in regions outside of Europe, with most work-ers electing to retain the classical two family system, i.e.,Dolichopodidae and Empididae. This action creates a
1055-7903/$ - see front matter Published by Elsevier Inc.
doi:10.1016/j.ympev.2007.02.029
* Corresponding author. Fax: +1 865 974 4744.E-mail address: [email protected] (J.K. Moulton).
heterogeneous Empididae that is comprised of severalsubfamilies having dubious monophyly (Cumming et al.,1995; Sinclair and Cumming, 2006). Great morphologicaland species diversity, along with competing alternativeinterpretations of homology especially in the male genita-lia, have perpetuated the differential use of rival classifica-tions (Chvala, 1983; Cumming et al., 1995; Sinclair, 1995;Sinclair and Cumming, 2006).
Six classifications for the Empidoidea based on phyloge-netic hypotheses have been published since Chvala(1983)—Wiegmann et al. (1993), Cumming et al. (1995),Collins and Wiegmann (2002a), Moulton and Wiegmann(2004), Yang (2004), and, most recently, Sinclair and
702 J.K. Moulton, B.M. Wiegmann / Molecular Phylogenetics and Evolution 43 (2007) 701–713
Cumming (2006). Wiegmann et al. (1993); Cumming et al.(1995), Yang (2004), and Sinclair and Cumming (2006) arebased on morphological evidence while the others wereinferred from nucleotide sequence data. Only two superfa-milial clades—Microphorinae (=‘idae’ of Chvala, 1983) +Dolichopodidae and Hybotidae (=Hybotinae + Ocydr-omiinae + Tachydromiinae)—are common to all of theseclassifications and to that of Chvala (1983). The greatestdegree of concordance among the competing classifica-tions/phylogenies exists between those of Chvala (1983)and Moulton and Wiegmann (2004). Moulton andWiegmann (2004) recovered trees largely concordant withChvala’s (1983) empidoidean classification, with theexception being that Chvala inferred Atelestidae to bethe sister group to Cyclorrhapha. Both studies supportthe monophyly of Empidoidea exclusive of Atelestidae, ofMicrophoridae + Dolichopodidae, and of Hybotidae Theyalso support similar arrangements within a monophyleticEmpididae s.str., although with several groups unsampled,i.e., Oreogetoninae + (Clinocerinae + Empididae). A recentre-analysis of the morphological evidence by Sinclair andCumming (2006) proposes five monophyletic families, Atel-estidae, Hybotidae, Dolichopodidae (including Microphor-inae s.l.), Empididae and Brachystomatidae. The latternewly proposed family is a clade comprising formerbrachystomatine, ceratomerine, and trichopezine empidids(Sinclair and Cumming, 2006).
Concordance of phylogenetic trees of Eremoneurainferred from CAD (Moulton and Wiegmann, 2004), 28SrDNA (Collins and Wiegmann, 2002a), and morphologicaldata (Chvala, 1983) was used to demonstrate the phyloge-netic utility of CAD for reconstructing Mesozoic-ageddivergences. We now build upon our previous molecularphylogenetic investigations of Empidoidea by dramaticallyincreasing taxon sampling for both CAD and 28S rDNAand by conducting independent and combined phyloge-netic analyses of these data. Our objective was to obtaina robust molecular phylogeny with which to assess severalpreviously proposed empidoid classifications and, ulti-mately, to provide a well-sampled phylogenetic frameworkon which interpretations of empidoid morphological andecological diversification can be further clarified.
2. Materials and methods
2.1. Taxon sampling
2.1.1. CAD
The ingroup, Empidoidea, is comprised of 55 sampledtaxa representing all previously recognized major empidoi-dean clades, including Atelestidae, Brachystomatinae, Cer-atomerinae, Clinocerinae, Dolichopodidae, Empidinae,Hemerodromiinae, Hybotinae, Microphorinae, Ocydr-omiinae, Oreogetoninae, Tachydromiinae, and Trichopezi-nae (Griffiths, 1972; Chvala, 1983; Cumming et al., 1995;Disney, 1994; Zatwarnicki, 1996; Sinclair, 1995; Collinsand Wiegmann, 2002a,b). Seventeen taxa, representing 4
orthorrhaphan and 10 cyclorrhaphous brachyceran fami-lies, served as outgroups, with Heterostomus curvipalpus
(Xylophagidae) selected as a distal orthorrhaphousbrachyceran root.
2.1.2. 28SA total of 75 taxa were sampled. These taxa represent all
of the major empidoid lineages and most of the same out-group families that were sampled for CAD. The therevidsRuppellia and Efflatouniella served as the distal root in28S analyses. Table 1 is a list of the taxa sampled in thisstudy and accession numbers for the CAD and 28Ssequences derived from them.
2.2. DNA extraction and amplification
Total genomic nucleic acids were extracted from wholespecimens or dissected tissues from fresh, frozen, or etha-nol-preserved individuals. Voucher material is depositedin the laboratory of BMW. Nucleotide extractions werecarried out using a guanidinium isothiocyanate (Chirgwinet al., 1979) or sodium dodecyl sulfate/proteinase K-basedhomogenization protocol. Homogenates were extractedonce with a 25:24:1 mixture of phenol:chloroform:isoamylalcohol (Sigma–Aldrich) and again with a 24:1 chloro-form:isoamyl alcohol mixture. The DNA was salted outusing one-tenth volume of 3 M sodium acetate and 1· vol-ume of chilled (�20 �C) isopropanol and then pelleted bymicrocentrifugation. DNA was washed with 70 and 95%ethanol, air-dried, resuspended in 100 ll of 1 mM Tris–EDTA, and stored at �80 �C.
The oligonucleotide primers used in this study toamplify CAD and 28S are shown in Table 2. Detailedinformation about the design of CAD primers are outlinedin Moulton and Wiegmann (2004). The primers used toamplify 28S were modified from ones developed for plantsto match the published Drosophila melanogaster sequence(Hancock et al., 1988; Collins and Wiegmann, 2002a).CAD fragments were amplified using ExTaq Hot Startpolymerase (TakaraMirus Bio, Madison, WI), and most28S amplifications were facilitated by Taq polymerase fromPromega Biotech, Maddison, WI. Some 28S ampliconswere obtained via reverse transcriptase PCR using theGeneAmp RNA PCR Kit (PE Applied Biosystems, FosterCity, CA). Specific details about 28S and CAD amplifica-tion parameters appear in Collins and Wiegmann (2002a)and Moulton and Wiegmann (2004). DNA amplificationswere qualified via horizontal electrophoresis in agarose.CAD amplicons were excised from agarose gels and puri-fied with QiaQuick Gel Extraction Kits (Qiagen Inc., SantaClara, CA) using the manufacturer’s suggested protocol.28S amplicons were purified using QiaQuick PCR Purifica-tion Kits (Qiagen, Inc., Santa Clara, CA) using the manu-facturer’s suggested protocol. Purified PCR fragments werequantified via horizontal electrophoresis in agarose viacomparison to a band of known concentration in a stan-dard DNA ladder.
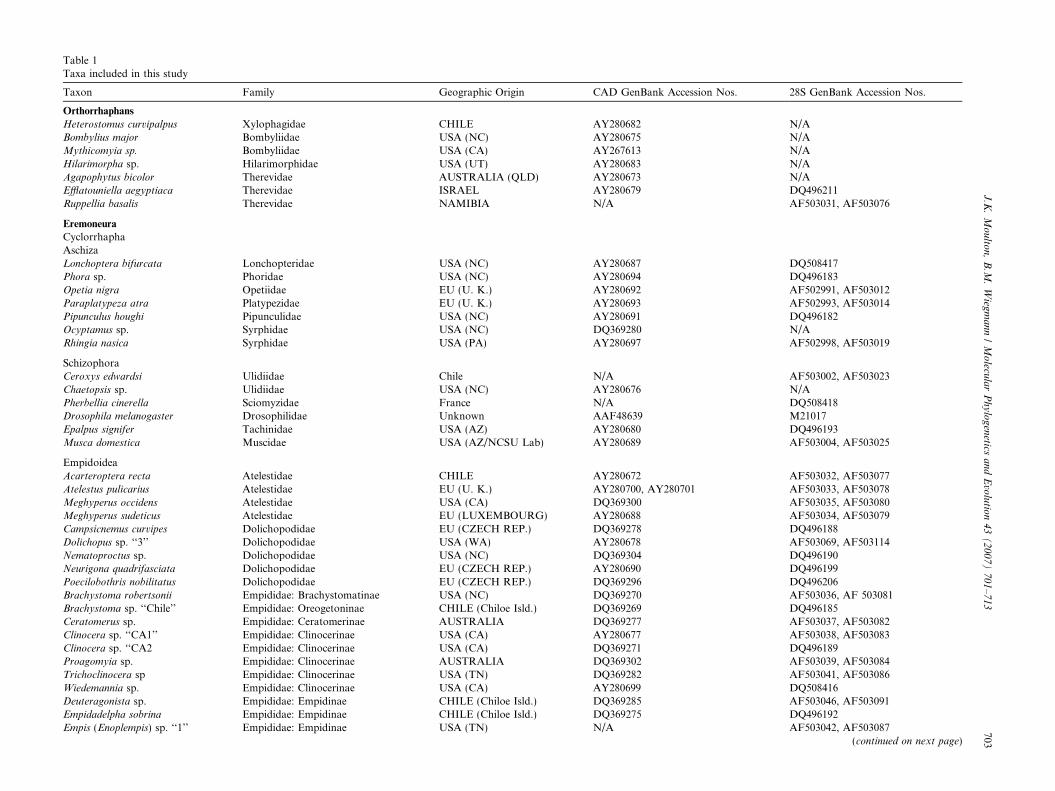
Table 1Taxa included in this study
Taxon Family Geographic Origin CAD GenBank Accession Nos. 28S GenBank Accession Nos.
Orthorrhaphans
Heterostomus curvipalpus Xylophagidae CHILE AY280682 N/ABombylius major Bombyliidae USA (NC) AY280675 N/AMythicomyia sp. Bombyliidae USA (CA) AY267613 N/AHilarimorpha sp. Hilarimorphidae USA (UT) AY280683 N/AAgapophytus bicolor Therevidae AUSTRALIA (QLD) AY280673 N/AEfflatouniella aegyptiaca Therevidae ISRAEL AY280679 DQ496211Ruppellia basalis Therevidae NAMIBIA N/A AF503031, AF503076
Eremoneura
CyclorrhaphaAschizaLonchoptera bifurcata Lonchopteridae USA (NC) AY280687 DQ508417Phora sp. Phoridae USA (NC) AY280694 DQ496183Opetia nigra Opetiidae EU (U. K.) AY280692 AF502991, AF503012Paraplatypeza atra Platypezidae EU (U. K.) AY280693 AF502993, AF503014Pipunculus houghi Pipunculidae USA (NC) AY280691 DQ496182Ocyptamus sp. Syrphidae USA (NC) DQ369280 N/ARhingia nasica Syrphidae USA (PA) AY280697 AF502998, AF503019
SchizophoraCeroxys edwardsi Ulidiidae Chile N/A AF503002, AF503023Chaetopsis sp. Ulidiidae USA (NC) AY280676 N/APherbellia cinerella Sciomyzidae France N/A DQ508418Drosophila melanogaster Drosophilidae Unknown AAF48639 M21017Epalpus signifer Tachinidae USA (AZ) AY280680 DQ496193Musca domestica Muscidae USA (AZ/NCSU Lab) AY280689 AF503004, AF503025
EmpidoideaAcarteroptera recta Atelestidae CHILE AY280672 AF503032, AF503077Atelestus pulicarius Atelestidae EU (U. K.) AY280700, AY280701 AF503033, AF503078Meghyperus occidens Atelestidae USA (CA) DQ369300 AF503035, AF503080Meghyperus sudeticus Atelestidae EU (LUXEMBOURG) AY280688 AF503034, AF503079Campsicnemus curvipes Dolichopodidae EU (CZECH REP.) DQ369278 DQ496188Dolichopus sp. ‘‘3’’ Dolichopodidae USA (WA) AY280678 AF503069, AF503114Nematoproctus sp. Dolichopodidae USA (NC) DQ369304 DQ496190Neurigona quadrifasciata Dolichopodidae EU (CZECH REP.) AY280690 DQ496199Poecilobothris nobilitatus Dolichopodidae EU (CZECH REP.) DQ369296 DQ496206Brachystoma robertsonii Empididae: Brachystomatinae USA (NC) DQ369270 AF503036, AF 503081Brachystoma sp. ‘‘Chile’’ Empididae: Oreogetoninae CHILE (Chiloe Isld.) DQ369269 DQ496185Ceratomerus sp. Empididae: Ceratomerinae AUSTRALIA DQ369277 AF503037, AF503082Clinocera sp. ‘‘CA1’’ Empididae: Clinocerinae USA (CA) AY280677 AF503038, AF503083Clinocera sp. ‘‘CA2 Empididae: Clinocerinae USA (CA) DQ369271 DQ496189Proagomyia sp. Empididae: Clinocerinae AUSTRALIA DQ369302 AF503039, AF503084Trichoclinocera sp Empididae: Clinocerinae USA (TN) DQ369282 AF503041, AF503086Wiedemannia sp. Empididae: Clinocerinae USA (CA) AY280699 DQ508416Deuteragonista sp. Empididae: Empidinae CHILE (Chiloe Isld.) DQ369285 AF503046, AF503091Empidadelpha sobrina Empididae: Empidinae CHILE (Chiloe Isld.) DQ369275 DQ496192Empis (Enoplempis) sp. ‘‘1’’ Empididae: Empidinae USA (TN) N/A AF503042, AF503087
(continued on next page)
J.K
.M
ou
lton,
B.M
.W
iegm
an
n/
Mo
lecula
rP
hy
log
enetics
an
dE
volu
tion
43
(2
00
7)
70
1–
71
3703
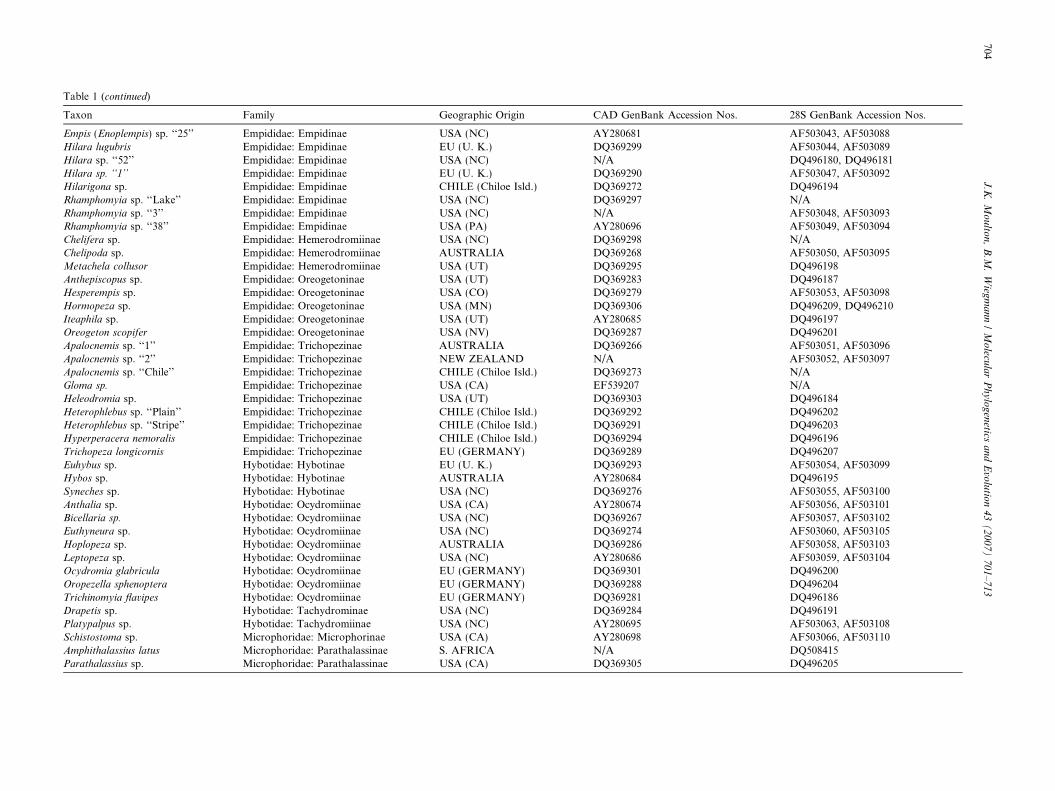
Table 1 (continued)
Taxon Family Geographic Origin CAD GenBank Accession Nos. 28S GenBank Accession Nos.
Empis (Enoplempis) sp. ‘‘25’’ Empididae: Empidinae USA (NC) AY280681 AF503043, AF503088Hilara lugubris Empididae: Empidinae EU (U. K.) DQ369299 AF503044, AF503089Hilara sp. ‘‘52’’ Empididae: Empidinae USA (NC) N/A DQ496180, DQ496181Hilara sp. ‘‘1’’ Empididae: Empidinae EU (U. K.) DQ369290 AF503047, AF503092Hilarigona sp. Empididae: Empidinae CHILE (Chiloe Isld.) DQ369272 DQ496194Rhamphomyia sp. ‘‘Lake’’ Empididae: Empidinae USA (NC) DQ369297 N/ARhamphomyia sp. ‘‘3’’ Empididae: Empidinae USA (NC) N/A AF503048, AF503093Rhamphomyia sp. ‘‘38’’ Empididae: Empidinae USA (PA) AY280696 AF503049, AF503094Chelifera sp. Empididae: Hemerodromiinae USA (NC) DQ369298 N/AChelipoda sp. Empididae: Hemerodromiinae AUSTRALIA DQ369268 AF503050, AF503095Metachela collusor Empididae: Hemerodromiinae USA (UT) DQ369295 DQ496198Anthepiscopus sp. Empididae: Oreogetoninae USA (UT) DQ369283 DQ496187Hesperempis sp. Empididae: Oreogetoninae USA (CO) DQ369279 AF503053, AF503098Hormopeza sp. Empididae: Oreogetoninae USA (MN) DQ369306 DQ496209, DQ496210Iteaphila sp. Empididae: Oreogetoninae USA (UT) AY280685 DQ496197Oreogeton scopifer Empididae: Oreogetoninae USA (NV) DQ369287 DQ496201Apalocnemis sp. ‘‘1’’ Empididae: Trichopezinae AUSTRALIA DQ369266 AF503051, AF503096Apalocnemis sp. ‘‘2’’ Empididae: Trichopezinae NEW ZEALAND N/A AF503052, AF503097Apalocnemis sp. ‘‘Chile’’ Empididae: Trichopezinae CHILE (Chiloe Isld.) DQ369273 N/AGloma sp. Empididae: Trichopezinae USA (CA) EF539207 N/AHeleodromia sp. Empididae: Trichopezinae USA (UT) DQ369303 DQ496184Heterophlebus sp. ‘‘Plain’’ Empididae: Trichopezinae CHILE (Chiloe Isld.) DQ369292 DQ496202Heterophlebus sp. ‘‘Stripe’’ Empididae: Trichopezinae CHILE (Chiloe Isld.) DQ369291 DQ496203Hyperperacera nemoralis Empididae: Trichopezinae CHILE (Chiloe Isld.) DQ369294 DQ496196Trichopeza longicornis Empididae: Trichopezinae EU (GERMANY) DQ369289 DQ496207Euhybus sp. Hybotidae: Hybotinae EU (U. K.) DQ369293 AF503054, AF503099Hybos sp. Hybotidae: Hybotinae AUSTRALIA AY280684 DQ496195Syneches sp. Hybotidae: Hybotinae USA (NC) DQ369276 AF503055, AF503100Anthalia sp. Hybotidae: Ocydromiinae USA (CA) AY280674 AF503056, AF503101Bicellaria sp. Hybotidae: Ocydromiinae USA (NC) DQ369267 AF503057, AF503102Euthyneura sp. Hybotidae: Ocydromiinae USA (NC) DQ369274 AF503060, AF503105Hoplopeza sp. Hybotidae: Ocydromiinae AUSTRALIA DQ369286 AF503058, AF503103Leptopeza sp. Hybotidae: Ocydromiinae USA (NC) AY280686 AF503059, AF503104Ocydromia glabricula Hybotidae: Ocydromiinae EU (GERMANY) DQ369301 DQ496200Oropezella sphenoptera Hybotidae: Ocydromiinae EU (GERMANY) DQ369288 DQ496204Trichinomyia flavipes Hybotidae: Ocydromiinae EU (GERMANY) DQ369281 DQ496186Drapetis sp. Hybotidae: Tachydrominae USA (NC) DQ369284 DQ496191Platypalpus sp. Hybotidae: Tachydromiinae USA (NC) AY280695 AF503063, AF503108Schistostoma sp. Microphoridae: Microphorinae USA (CA) AY280698 AF503066, AF503110Amphithalassius latus Microphoridae: Parathalassinae S. AFRICA N/A DQ508415Parathalassius sp. Microphoridae: Parathalassinae USA (CA) DQ369305 DQ496205
704J
.K.
Mo
ulto
n,
B.M
.W
iegm
an
n/
Mo
lecula
rP
hy
log
enetics
an
dE
volu
tion
43
(2
00
7)
70
1–
71
3

Table 2Oligonucleotide primers used in this study to amplify and sequence CAD and 28S
Primer Positionc Length Sequence (50 to 30)
CADa,b
54F 112 23 GTN GTN TTY CAR ACN GGN ATG GT364R 950 23 TCN ACN GCR AAN CCR TGR TTY TG405R 1073 23 GCN GTR TGY TCN GGR TGR AAY TG320F 793 26 ATH TTY GGN ATY TGY YTG GGN CAY CA338F 856 26 ATG AAR TAY GGY AAT CGT GGH CAY AA680R 1856 26 AAN GCR TCN CGN ACM ACY TCR TAY TC581F2 1459 26 GGW GGW CAA ACW GCW YTM AAY TGY GG581F 1561 26 GAN ACT GAR GAY MGR AAA ATM TTY GC843R 2369 23 GCY TTY TGR AAN GCY TCY TCR AA843R2 2384 26 TCN ACC ATW CKN ARW GCY TTY TGR AA787F 2200 26 GGD GTN ACN ACN GCN TGY TTY GAR CC806F 2242 23 GTN GTN AAR ATG CCN MGN TGG GA1098R 3104 20 TTN GGN AGY TGN CCN CCC AT1124R 3204 27 CAT NCG NGA RAA YTT RAA RCG ATT YTC1057F 2977 23 GTN TCN ACN GAY TAY GAY ATG TG1278R 3668 26 TCR TTN TTY TTW GCR ATY AAY TGC AT1201F 3433 26 GAR GCN AAR GAR ATY GAY GTN GAY GC1436R 4109 20 CCR TGY TCN GCR TAR AAR TC
28S
rc28D 5421 18 CCG CAG CTG GTC TCC AAG28H 5982 18 GGT TTC GCT GGA TAG TAGrc28H 5999 18 CTA CTA TCC AGC GAA ACC28K 6582 18 CTT CGA TGT CGG CTC TTG28Q 6389 18 AAC TCC CTA CCT GGC AATrc28Q 6406 22 GGA CAT TGC CAG GTA GGG AGT T28X 6911 20 CGG ATA CGA CCT TAG AGG CGrc28X 6930 20 GGC CTC TAA GGT CGT ATC CG28Z 7200 21 GCA AAG GAT AAG CTT CGA TGG
Degenerate positions are noted by their IUB single-letter code: R = A/G, Y = C/T, M = A/C,K = G/T, W = A/T, H = A/T/C, and N = A/T/C/G.a Sequences for additional less degenerate clade- or taxon-specific primers are available upon request from the senior author.b Amino acid position within an alignment of CAD amino acid residues.c Position of 50-most position relative to Drosophila melanogaster CAD sequence (with introns excised) from genome sequencing project (Adams et al.,
2000) or 30-most position relative to Drosophila melanogaster 28S sequence (Hancock et al., 1988).
J.K. Moulton, B.M. Wiegmann / Molecular Phylogenetics and Evolution 43 (2007) 701–713 705
2.3. DNA sequencing, contig construction, and editing
Purified PCR products were directly sequenced usingd-rhodamine Terminator Cycle Sequencing Ready Reac-tion with AmpliTaqFS DNA Polymerase (PE Applied Bio-systems, Foster City, CA) in full reaction volumes, i.e., 8 llof reaction mix in a 20-ll volume. Comprehensive detailsabout parameters used in CAD sequencing reactions appearin Moulton and Wiegmann (2004). Sequences were gel frac-tionated and base-called on an ABI PRISM 377 automatedDNA sequencer (PE Applied Biosystems, Foster City, CA).Electropherograms from CAD sequencing reactions weretrimmed, assembled into contigs, and conflicting callsresolved, where possible, using Sequencher 4.1 (Gene CodesCorp., Ann Arbor, MI) whereas 28S sequences were simi-larly analyzed using the programs Trev and Gap4 of theStaden package (Bonfield et al., 1995; Staden, 1996).
2.4. Phylogenetic analysis
2.4.1. Nucleotide sequence alignmentsIntrons within CAD sequences were excised after contig
construction using the GT-AG rule (Rogers and Wall,
1980). Alignment of CAD exons was straightforward,except within two regions spanning positions 289–333and 979–1020 in our alignment. Exclusion of these hyper-variable regions had no noticeable effect on topology sothey were included in all analyses. Alignment of CADwas performed using Clustal X (Thompson et al., 1997),with slight optimization using Se-Al 2.0 (Rambaut, 2002).The alignment of 28S rDNA sequences was performedmanually in GDE 2.2 (Smith et al., 1994), with hypervari-able regions in which ad hoc choice of alternative align-ments could affect the outcome, removed. The 28Salignment covered the same regions of the gene (D3–D12;Hancock et al., 1988) as were used in Collins and Wieg-mann (2002a) and newly obtained sequences in the presentstudy were aligned using Collins and Wiegmann (2002a) asan initial estimate of positional homology among the studytaxa. The nucleotide alignments of both genes are availableas GDE, NEXUS- or NBRF-formatted files from theauthors. The CAD ortholog from Anopheles gambiae (Gen-Bank Accession No. EAA06526) was not included in phy-logenetic analyses performed here because it created along-branch attraction problem rendering Cyclorrhaphaparaphyletic (Moulton and Wiegmann, 2004). CAD and
706 J.K. Moulton, B.M. Wiegmann / Molecular Phylogenetics and Evolution 43 (2007) 701–713
28S sequences were tested for homogeneity of nucleotidecomposition among taxa using a v2 test performed inPAUP* 4.0b10 (Swofford, 2002). Only informative siteswere included in these v2 tests. PAUP* was also used to cal-culate uncorrected pairwise sequence divergences for alltaxa. Codon positions in the CAD data sets were desig-nated using MacClade 4.0 (Maddison and Maddison,1992).
2.4.2. Character weighting/inclusion
A number of different codon weighting strategies wereemployed, most of which sought to minimize or eliminatenoise from synonymous variation in the third codon posi-tion (nt3) data partition relative to largely nonsynonymousvariation in the first (nt1) and second (nt2) positions. Strat-egies employed included equal weighting of all codon posi-tions (equal weights in parsimony analysis; inclusion of allsites in maximum likelihood (ML) and Bayesian analyses),increased weighting of nt2 relative to nt1 and nt3 (codonweighting parsimony, CWP), and total elimination of nt3(1/1/0 CWP; exclusion of nt3 in ML and Bayesian analy-ses). When nt3 were excluded in ML and Bayesian analy-ses, they were also excluded when nucleotide substitutionmodels were assessed using ModelTest (see below).
2.4.3. Parsimony analyses
We conducted phylogenetic analyses of CAD and 28Snucleotides using the parsimony criterion implemented inPAUP* 4.0b10 (Swofford, 2002). All characters were trea-ted as unordered. Trees were constructed by heuristicsearch with tree bisection-reconnection (TBR) branchswapping in a random stepwise addition of taxa repeated1000 times. Maxtrees was set to increase incrementally.Node support was evaluated by nonparametric bootstrapresampling (Felsenstein, 1985) and through calculation ofBremer support (Bremer, 1988, 1994). Bootstrap scoreswere calculated from 1000 replicates, with each replicateconsisting of a 10 searches starting with a tree built by step-wise addition using the simple addition sequence. Bremersupport was calculated using TreeRot, vers. 2 (Sorenson,1999).
2.4.4. Maximum likelihood analyses
Phylogenetic trees were also estimated under the maxi-mum likelihood (ML) criterion implemented in PAUP*
4.0b10 (Swofford, 2002). Nucleotide substitution modelsfor each molecular data set were selected using Modeltest3.06 (Posada and Crandall, 1998). Once a model wasselected for a given molecular data set, we used this modeland its parameter estimates to search for an optimal MLtree via heuristic searches of tree space using TBR branchswapping in a random stepwise addition of taxa repeated25 times.
2.4.5. Bayesian analysesBayesian Markov Chain Monte Carlo phylogenetic
analysis was conducted using primarily MrBayes 2.01
(Huelsenbeck and Ronquist, 2001) using the models andparameters suggested for each data matrix by Modeltest.A mixed models analysis was performed on the entireCAD data set using MrBayes 3.1 (Ronquist and Huelsen-beck, 2003) in an attempt to compensate for extreme nucle-otide bias observed at the third codon position between asingle empid (Ceratomerus) and several outgroup taxa.Each Markov chain in the Bayesian search was startedfrom a random tree and run for one million cycles, sam-pling every 1000th cycle from the chain. Four chains wererun simultaneously, three hot and one cold. Each simula-tion was run twice. We used the default settings for the pri-ors on the rate matrix (0–100), branch lengths (0–10), andproportion of invariant sites (0–1). Stationarity was evalu-ated by monitoring likelihood values graphically. The ini-tial 1000 trees in each run were discarded as burn-insamples. The remaining trees were used to construct major-ity rule consensus trees. Bayesian posterior probabilities foreach clade were derived from the trees remaining after dis-carding the burn-in samples. For ease of visual comparisonto bootstrap values, we present these probabilities as wholenumbers ranging from 0 to 100. Posterior probabilitiesgreater than or equal to 95% are generally regarded asstrong support for a clade (Wilcox et al., 2002).
3. Results
3.1. Data characteristics
3.1.1. CAD
The CAD data set included sequences from 73 dipterantaxa and contained 3915 characters after removal of primersequences (Table 3). Sequences ranged in size from 3816(Leptopeza) to 3864 (Bicellaria) nucleotides. CADsequences for 43 taxa are presented here for the first time,while 30 are included from a previous study (Moulton andWiegmann, 2004), including the D. melanogaster orthologobtained from GenBank (Accession No. AE003503). TheCAD fragment corresponding to the region between prim-ers 1126F and 1436R could not be obtained for Chelipoda
sp. for an unresolved reason. Indels were largely confinedto the two aforementioned areas of difficult alignment(positions 289–333 and 979–1020).
Base composition in CAD was slightly A/T biased (56%)and differed significantly among taxa (P < 0.001). Signifi-cant heterogeneity was observed at the first codon position(nt1) and the third codon position (nt3) (P < 0.001), butnot the second (nt2) (P < 1.00). Only three nt3 compari-sons, Rhamphomyia sp. 38–Rhamphomyia ‘‘Lake’’, Rham-
phomyia–Empis, and Dolichopus–Neurigona, did notsignificantly differ.
Numerous sites in the CAD data set possessed discrep-ancies between two nucleotides and were coded as ambigu-ous using the appropriate IUB symbols. Each ambiguoussite was double-checked on corresponding electrophero-grams, and none could be attributed to recognizablesequencing artifacts. All but one (99%) of these ambiguities

Table 3Descriptive statistics for separate and combined data sets
Data CADa 28S CADa + 28S CADb + 28S
Total length (No. sites analyzed) 3915 (2610) 1342 (1342) 5257 (3952) 5257 (5257)No. variable sites (%) 826 (43) 389 (29) 1440 (36) 2699 (51)No. parsimony-informative sites (%) 826 (32) 249 (19) 1005 (25) 2253 (43)
Average nucleotide frequenciesA 0.31 0.30 0.30 0.32C 0.19 0.19 0.19 0.17G 0.25 0.23 0.25 0.22T 0.25 0.28 0.26 0.29
a Third codon positions excluded.b Third codon positions included.
J.K. Moulton, B.M. Wiegmann / Molecular Phylogenetics and Evolution 43 (2007) 701–713 707
represented synonymous mutations. Given that thesesequences were generated by PCR from genomic DNA,and not by cloning, these polymorphisms likely correspondto allelic differences. The total number of base differencesbetween putative alleles ranged from 0 (several taxa) to27 (Musca domestica).
As expected for third positions, substitutions accumu-lated much faster than at nt1 and nt2. Uncorrected pair-wise divergences for nt1, nt2, and nt3 ranged from 4.6%(Empis: Rhamphomyia) to 26% (Bombylius: Drosophila),1.2% (Empis: Rhamphomyia) to 14% (Drosophila: Opetia),and 24.3% (Empis: Rhamphomyia) to 82% (Bombylius:Paraplatypeza), respectively.
3.1.2. 28S
The 28S data set included sequences from 71 dipterantaxa and was comprised of 1342 nt sites. Sequences for 32of these taxa are included from a previous study (Collinsand Wiegmann, 2002a) of Empidoidea using 28S, while39 taxa are presented herein for the first time. The orthologfrom D. melanogaster was obtained from GenBank (Acces-sion No. AE003503). 28S sequences from Chelipoda, Apa-
locnemis ‘‘Chile’’ and Bicellaria are truncated at the 50
Table 4Parameters for the models used in maximum likelihood analyses
Partition CAD nt1 +
Gamma distribution shape parameter (a)a 0.7131Proportion of invariable sites (/)a 0.4901
Relative substitution rate parametersb
A–C 3.2647A–G 4.2844A–T 1.6959C–G 1.5589C–T 6.441G–T 1.000
Estimated nucleotide proportionsa
A 0.3099C 0.2564G 0.2176T 0.2161
The general time reversible (GTR) model was used in analyses of CAD andanalysis of 28S sequences.
a a, /, and nucleotide proportions were estimated simultaneously.b R-matrix values.
end and those of Lonchoptera, Rhamphomyia sp. 38, Tri-
choclinocera, Brachystoma ‘‘Chile’’, and Clinocera (CA1)are truncated at the 30 end. More details about many ofthe 28S sequences analyzed herein can be found in Collinsand Wiegmann (2002a).
Divergence among 28S sequences ranged from 0.08% forcomparisons within the genus Hilara (Empididae) to 9.6%between outgroup taxa, Efflatouniella sp. (Therevidae) andPhora sp. (Phoridae). Most pairwise divergences rangedbetween 1 and 5%.
3.1.3. CAD + 28S
The total combined data set for the two genes included61 taxa and was 5257 nt in length. With third positions inCAD excluded, the data set is comprised of 3952 charac-ters. Other characteristics of this data set are presented inTables 3 and 4.
3.2. Phylogenetic inference
3.2.1. CAD
Maximum parsimony analysis of nt1 + nt2 recovered a sin-gle island (Maddison, 1991) of two most parsimonious trees
nt2 28S CAD (all) + 28S
0.6350 0.42620.5523 0.5875
1.0779 4.95994.3834 8.11542.2627 2.66210.5717 3.39274.3834 16.29241.000 1.000
0.3174 0.35890.1817 0.14110.2195 0.19700.2814 0.3030
CAD + 28S sequences. The transversion (TVM) model was used in the
708 J.K. Moulton, B.M. Wiegmann / Molecular Phylogenetics and Evolution 43 (2007) 701–713
(MPTs) of 8229 steps (RI = 0.45, RC = 0.11). These two treesdiffer only with respect to position of Ceratomerus + Oreog-
eton relative to a clade comprised of Apalocnemis, Heterophle-
bus, and Hyperperacera and another clade comprised of theHemerodromiinae + Empidini. The MPTs differ from theML tree as follows: (1) Lonchoptera and Opetia appear as sis-ter taxa, (2) Pipunculus is included within Cyclorrhapha, (3)Acarteroptera and Meghyperus occidens are juxtaposed, (4)Nematoproctus is the basal dolichopodid, and (5) the clinoce-rines + Hesperempis form the sister group to a clade com-prised of Apalocnemis, Hyperperacera, and Heterophlebus.Results of analyses in which third positions were successivelydownweighted relative to first and second positions resulted insimilar trees differing primarily in relationships among theaforementioned groups. The GTR + I + G model, with per-centage of invariant sites and gamma distribution shapeparameters estimated to be 0.4984 and 0.7133, respectively,was selected as the most appropriate model by likelihood ratiotests performed within Modeltest (Table 4). Maximum likeli-hood analysis of CAD nt1 + nt2 using the aforementionedmodel and parameters and Bayesian likelihood analysis inwhich these parameters were estimated resulted in similar treesthat were largely concordant with the MPTs recovered fromthese data, differing only with respect to the placement ofthe empidids Ceratomerus sp. and Oreogeton scopifer. Themaximum likelihood tree (�lnL = 39,988.56; MP tree-length = 8255) is depicted as Fig. 1. The Bayesian(�lnL = 40,146.69; MP length = 8260) is not shown.
3.2.2. 28S
Maximum parsimony analysis recovered 1153 most par-simonious trees of 1063 steps (CI = 0.488; RI = 0.672). Themajority rule consensus of these trees is similar to but lessresolved than the trees recovered in maximum likelihood(�lnL = 7977.43; MP length = 1071) and Bayesian likeli-hood analyses (�lnL = 8081.82; MP length = 1154) ofthese data. The tree recovered in the Bayesian analysis isshown as Fig. 2.
3.2.3. CAD + 28S
Parsimony analysis of CAD nt1 + nt2 combined with28S sequences recovered two islands each with a singleminimum-length tree (not shown) of 7493 steps(RI = 0.47, RC = 0.14). One of these trees is identical tothe MPT from CAD nt1 + nt2 alone, while the other differsfrom all other recovered topologies in that Tricho-
peza + Heleodromia joins Ceratomerus and Oreogeton ina clade that forms the sister group to the Clinocerinae.Bayesian likelihood analysis of CAD nt1 + nt2 combinedwith 28S sequences resulted in a tree (not shown,�lnL = 41,852.16; MP length = 7557) very similar to theone recovered using maximum likelihood criteria(�lnL = 42,213.90; MP length = 7917). These likelihoodinferences differ only with respect to the placement of O.
scopifer.Parsimony and likelihood analyses of entire CAD
(nt1 + nt2 + nt3) and 28S sequences yielded trees (not
shown) in which Empidoidea was not monophyletic dueto the empid Ceratomerus sp. erroneously nesting deeplywithin the Cyclorrhapha. This arrangement was recoveredunder each evolutionary model selected, including a mixedmodels analysis implemented in Mr. Bayes 3.1 (Ronquistand Huelsenbeck, 2003) allowing for different evolutionaryrates for separate partitions, in this case nt1 + nt2 versusnt3. Analysis of base composition at the third codon posi-tion in the CAD partition revealed a marked increase incytosine and guanine (C = 0.23242, G = 0.30144) withinthis empid relative to all other empidoid taxa examined(C: range = 0.13–0.19, mean = 0.15; G: range 0.19–0.24,mean = 0.21). This strong bias in 3rd position basecomposition is also seen in the cyclorrhaphan taxa includedas outgroups and likely explains the clearly convergentgrouping of Ceratomerus sp. with Opetia nigra
(C = 0.25402, G = 0.29486), D. melanogaster (C =0.26870, G = 0.29372), and Paraplatypeza atra (C =0.30472, G = 0.29775).
4. Discussion
Nuclear protein-encoding genes are increasing in impor-tance as phylogenetic markers (Mardulyn and Cameron,1999; Moulton and Wiegmann, 2004; Regier et al., 2004,2005). These genes are generally more difficult to amplifywidely across diverse taxonomic groups, but once obtainedthey provide a suite of character changes from within thecoding portions of the gene that can provide importantnode support within a phylogenetic analysis. This newcharacter source is particularly valuable for resolving rela-tionships within diverse Mesozoic-aged insect groups likethe Empidoidea for which morphological and species diver-sity has obscured support for phylogeny-based classifica-tions. Our previous study of the carbamoyl phosphatesynthase domain of the CAD protein locus in Eremoneu-ran flies (=Empidoidea + Cyclorrhapha) indicated abun-dant nucleotide support for divergences at the deeperlevels of this large clade, approximately 120–190 mya—atime range that spans the ages of origin of the key lineagescomprising empidoid diversity (Wiegmann et al., 2000).
The present work broadens our sample of CAD and 28Sribosomal DNA sequences published in these previousstudies for empidoid taxa (Collins and Wiegmann,2002a,b; Moulton and Wiegmann, 2004). The addition ofkey taxa and a large amount of gene sequence data greatlyincreases phylogenetic node support for basal relationshipsand our revised phylogenetic estimates are largely congru-ent with our previous findings. Analyses of these largerdata sets by parsimony, maximum likelihood and Bayesianmethods generally agree in topology and show dramati-cally improved levels of support for key monophyletic lin-eages. Although our results are corroborated acrossanalysis strategies and data partitions, we somewhat arbi-trarily chose the maximum likelihood tree (Fig. 1) inferredfrom nt1 + nt2 of the more stringently sampled CAD dataset as the best current estimate of empidoid relationships.
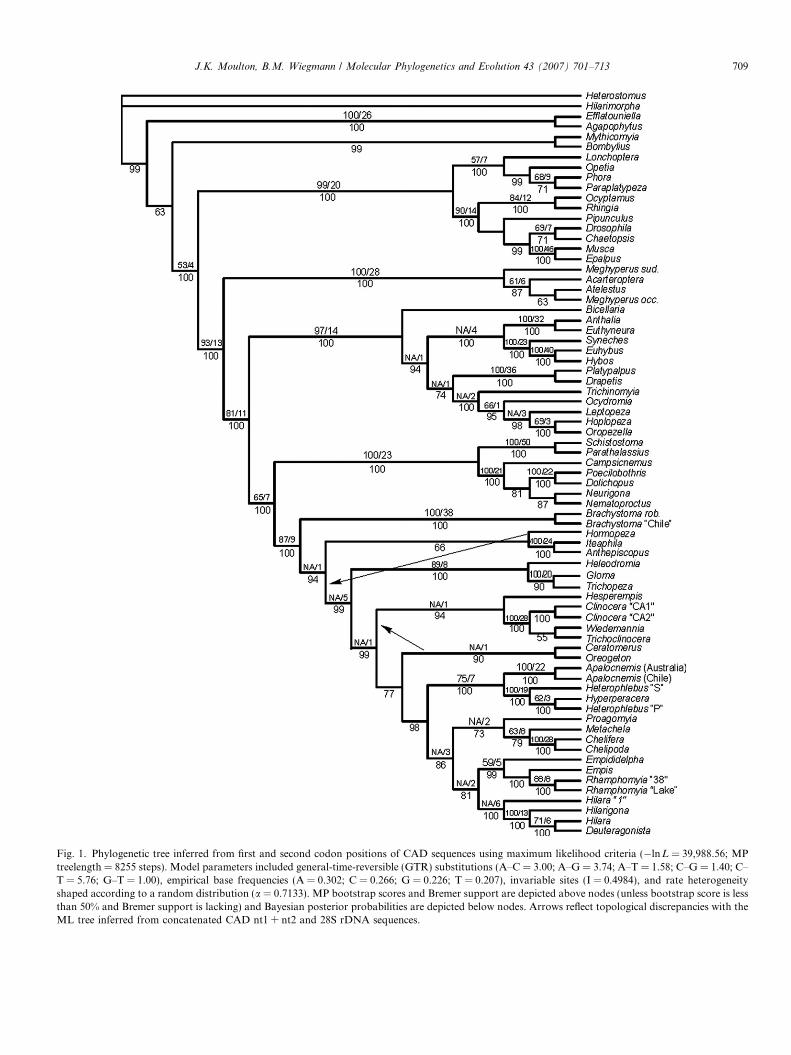
Fig. 1. Phylogenetic tree inferred from first and second codon positions of CAD sequences using maximum likelihood criteria (�lnL = 39,988.56; MPtreelength = 8255 steps). Model parameters included general-time-reversible (GTR) substitutions (A–C = 3.00; A–G = 3.74; A–T = 1.58; C–G = 1.40; C–T = 5.76; G–T = 1.00), empirical base frequencies (A = 0.302; C = 0.266; G = 0.226; T = 0.207), invariable sites (I = 0.4984), and rate heterogeneityshaped according to a random distribution (a = 0.7133). MP bootstrap scores and Bremer support are depicted above nodes (unless bootstrap score is lessthan 50% and Bremer support is lacking) and Bayesian posterior probabilities are depicted below nodes. Arrows reflect topological discrepancies with theML tree inferred from concatenated CAD nt1 + nt2 and 28S rDNA sequences.
J.K. Moulton, B.M. Wiegmann / Molecular Phylogenetics and Evolution 43 (2007) 701–713 709
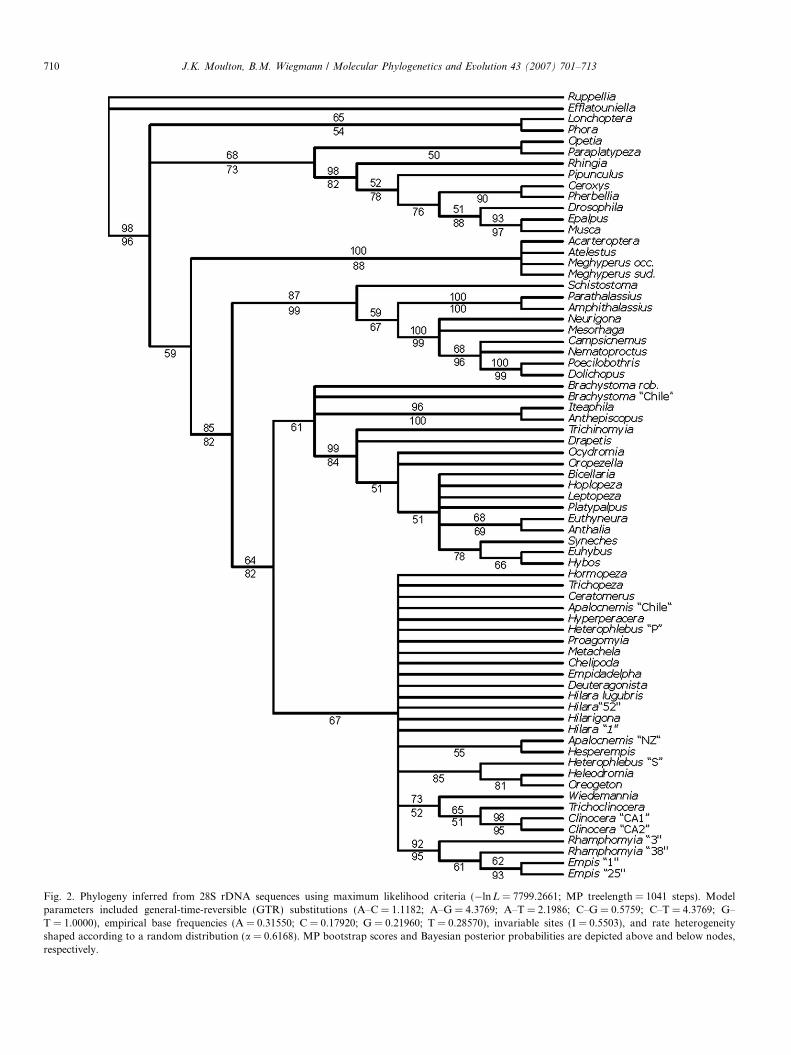
Fig. 2. Phylogeny inferred from 28S rDNA sequences using maximum likelihood criteria (�lnL = 7799.2661; MP treelength = 1041 steps). Modelparameters included general-time-reversible (GTR) substitutions (A–C = 1.1182; A–G = 4.3769; A–T = 2.1986; C–G = 0.5759; C–T = 4.3769; G–T = 1.0000), empirical base frequencies (A = 0.31550; C = 0.17920; G = 0.21960; T = 0.28570), invariable sites (I = 0.5503), and rate heterogeneityshaped according to a random distribution (a = 0.6168). MP bootstrap scores and Bayesian posterior probabilities are depicted above and below nodes,respectively.
710 J.K. Moulton, B.M. Wiegmann / Molecular Phylogenetics and Evolution 43 (2007) 701–713
J.K. Moulton, B.M. Wiegmann / Molecular Phylogenetics and Evolution 43 (2007) 701–713 711
We use this tree to focus further discussion of our phyloge-netic findings.
4.1. Higher-level relationships within the Empidoidea
Analyses of CAD nt1 + nt2 alone or concatenated with28S sequences yielded trees with similar and largely stabletopologies that support the five-family empidoidean classi-fication of Chvala (1983) and to a large extent his morphol-ogy-based hypotheses about their interrelationships. Thesefive families represent four major empidoid lineages: Atel-estidae, Microphorinae + Dolichopodidae, Hybotidae(Tachydromiinae, Ocydromiinae, Hybotinae), and Empid-idae s.str. (all remaining empidoids). A sister grouprelationship between Atelestidae and the remaining empid-oids was recovered with robust support (82–94% bootstrapscores, 100% posterior probabilities) in all analyses con-ducted. Collins and Wiegmann (2002a) also recovered thisarrangement from a 28S rDNA data matrix comprising amore limited sampling of empidoidean taxa. Given theincreasingly strong support for a basal position of Atelesti-dae among the Empidoidea, the morphological similaritiesin Atelestidae and basal Cyclorrhapha that were empha-sized by Chvala, and further amplified in Wiegmannet al. (1993) (but see Cumming et al., 1995 and Sinclairand Cumming, 2006), could be re-interpreted as an earlyderivation from the ground plan condition of the commonancestor of all Empidoidea (Collins and Wiegmann,2002a).
Relationships among the three remaining major lineageswere also consistently recovered in our analyses and wereas follows: Hybotidae, Microphorinae + Dolichopodidae,and Empididae s.str. A close relationship between Micro-phorinae + Dolichopodidae and Hybotidae has been previ-ously proposed based upon morphological (Chvala, 1983)and molecular evidence (Moulton and Wiegmann, 2004).The morphological evidence for this potential groupingconsists of the following characters: male terminalia asym-metrical, gonopods fused, and radius 4 + 5 unbranched(Chvala, 1983). However, all of these characters have beenfound to contain various degrees of homoplasy, or havebeen questioned as to their homology and scoring (Sinclairand Cumming, 2006; Wiegmann et al., 1993; Cumminget al., 1995). Molecular support for a sister relationshipbetween Microphorinae + Dolichopodidae and Hybotidaewas observed in distance analyses of CAD or analyses inwhich silent variation in third positions was included(Moulton and Wiegmann, 2004). The considerably stron-ger support observed for a sister relationship betweenMicrophorinae + Dolichopodidae and Empididae s.str.
found in analyses of CAD nt1 + nt2 and Bayesian analysisof concatenated 28S and CAD sequences (with high poster-ior probability) compels us to consider this to be the mostprobable resolution given all available data. Similarly, themost recent morphological study suggests that the Micro-phorinae + Dolichopodidae are sister to the newly recog-nized family Brachystomatidae—a group of previously
recognized small subfamilies of Empididae (Sinclair andCumming, 2006). Our data do not corroborate monophylyfor Brachystomatidae (Figs. 1 and 2).
A close relationship between Microphorinae and Doli-chopodidae was robust in all analyses (99–100% bootstrap,100% posterior probability) and agrees with results fromseveral major studies of empidoid relationships based onmorphology and molecular data (Chvala, 1983; Wiegmannet al., 1993; Cumming et al., 1995; Collins and Wiegmann,2002a).
4.2. Relationships within families of Empidoidea
4.2.1. Atelestidae
Relationships within Atelestidae were not convincinglyresolved due to problems in securing the position of theroot within the family, which is shared by the Palearcticspecies Atelestus pulicarius or Meghyperus sudeticus inall analyses. When third positions of CAD are includedin analyses, a close relationship between the Californianspecies Meghyperus occidens and the Chilean Acarterop-
tera recta is observed with robust support. On the basisof this observation and morphological similarities sharedby these two taxa, Meghyperus as currently defined islikely polyphyletic (Wiegmann et al., 1993). As a result,we suggest that Nearctic members of Meghyperus betransferred to the genus Acarteroptera to better definethese genera.
4.2.2. Hybotidae
The monophyly of this relatively newly recognized dip-teran family is supported in all recent treatments of thesuperfamily and is strongly re-confirmed here. Our CADdata support a phylogenetic arrangement within the Hyb-otidae that implies paraphyly for Chvala’s Ocydromiinae,an observation that is also supported in most morpho-logical treatments (Cumming et al., 1995; Sinclair andCumming, 2000, 2006). However, our nucleotide data,whether analyzed separately or combined, indicate robustsupport for the Tachydromiinae (Drapetis + Platypalpus)and Hybotinae (Euhybus, Hybos, Syneches). Several addi-tional groupings were observed with robust support (atleast in Bayesian terms), including a clade comprised ofTrichinomyia, Leptopeza, Hoplopeza, Ocydromia, and Oro-
pezella and another one containing Anthalia and Euthyne-
ura. The placement of Bicellaria at the base of theHybotidae (as shown in Fig. 1) was inconsistent amongthe various analyses of data partitions and methodologiesemployed, suggesting that increased sampling of bothgenes and taxa will be required to further resolve relation-ships within the Hybotidae.
4.2.3. Microphorinae + Dolichopodidae
The monophyly of this clade is well supported, however,we observed mixed support for relationships between themicrophorine and dolichopodid genera sampled. The28S data set provided weak evidence for a sister-group
712 J.K. Moulton, B.M. Wiegmann / Molecular Phylogenetics and Evolution 43 (2007) 701–713
relationship between the genus Parathalassius (Parathalas-siinae) and all Dolichopodidae as was first suggested byHennig (1971) and then echoed in detailed morphologicalassessments by Chvala (1983), Ulrich (1990), and Sinclairand Cumming (2006). Our CAD data, however, stronglysupports (100% bootstrap and posterior probability) thepairing of Parathalassius with Schistostoma, the only othersampled microphorine, within a monophyletic Microphor-inae. Morphological data supports the former hypothe-sis—the placement of microphorine taxa in a paraphyleticgrade of lineages at the base of the Dolichopodidae. Twofew microphorine exemplars are included here to add con-vincing evidence from DNA sequences to support Chvala’sview of ‘Microphoridae’ as a family; increased sampling ofmicrophorines and diverse dolichopodid lineages for CADand additional protein coding genes is an important goalfor future empidoid research.
4.2.4. Empididae sensu stricto
All of our analyses support placement of the remainingsampled empidoid taxa into a monophyletic family Empid-idae (s.str.). The CAD and 28S genes analyzed here providesome modest support at lower taxonomic levels, but fullelucidation of relationships within major empidid lineageswill require more thorough taxon sampling and use ofgenes with more variability among genera. One interestingobservation from CAD inferences is the basal placement ofBrachystoma, Hormopeza, Iteaphila, and Anthepiscopus.
This phenomenon occurred under various combinationsand using differing analysis conditions, although the mostparsimonious tree inferred from 28S sequences showedthree of these taxa, Brachystoma, Iteaphila, and Anthepisc-
opus, at the base of the Hybotidae. A slightly different root-ing of this 28S inference with respect to the Hybotidae, i.e.,one that renders it monophyletic, would show these threeempid genera as basal within the Empididae. Interestingly,Hormopeza, Iteaphila, and Anthepiscopus have been placedin the Oreogetoninae (Chvala, 1983), a group consideredby Cumming et al. (1995) and Sinclair and Cumming(2006) to either be basal lineages or of uncertain placementwithin Empidoidea and representative of the plesiomorphiccondition for empidoid adult morphology, especially com-plex features of the male genitalia. Our molecular analysesinstead indicate polyphyly for the diverse genera placed inOreogetoninae in morphological classifications, suggestingto us that oreogetonine morphological scorings assigned tothe empidoid groundplan by Cumming et al. may in fact bemore parsimoniously interpreted as groundplan features ofthe Empididae s.str.
The Clinocerinae, as currently classified, was not recov-ered as monophyletic in any analysis performed. Clinocera,Wiedemannia, and Trichoclinocera, however, consistentlyappeared as a robustly supported clade in analyses of bothgenes. The other clinocerine clade sampled, Proagomyia,consistently appeared as the sister group to the Hemerodr-omiinae in all analyses containing CAD sequences. Two ofthe sampled oreogetonines, Hesperempis and Oreogeton,
along with Ceratomerus, consistently appeared adjacentor as a sister group to the Clinocerinae in CAD inferences,although only Hesperempis appeared as the sister to theaforementioned recovered clinocerine subclade with rele-vant support (e.g., post. prob. of 94 in CAD nt1 + nt2Bayesian analysis).
As predicted by Collins and Wiegmann (2002a), theHemerodromiinae are supported as close relatives of theEmpidinae. The sampled hemerodromiine taxa are placedas the sister to the Empidinae in analyses of CAD withEmpidinae strongly supported in all analyses containingCAD sequences.
Some support was observed in CAD analyses for closerelationships among taxa placed in the Trichopezinaesensu Vaillant or Sinclair in that three of the five sampledtrichopezine genera consistently form a monophyleticgroup with strong support, e.g., Heleodromia + Tricho-
peza + Gloma (Fig. 1). The remaining sampled trichope-zines Apalocnemis + (Hyperperacera and Heterophlebus)also form a clade, but are placed in a more derived positionwithin the empidoid tree. Recognition of the monotypicgenus Hyperperacera appears totally unjustified basedupon molecular evidence found in CAD. It should be sub-sumed into Heterophlebus.
4.3. Taxonomic implications and conclusions
The five-family system first proposed by Chvala (1983)for the Empidoidea (Atelestidae, ‘Microphoridae’ + Doli-chopodidae, Hybotidae, Empididae) is increasingly sup-ported by the weight of molecular evidence. We see littlereason to delay widespread adoption of this arrangement,with the exception of Microphorinae—the monophyly ofwhich remains difficult to defend on both morphologicaland molecular grounds. The strong support for these lin-eages by the current molecular data now provides a robustphylogenetic framework on which new morphological def-initions can be based. Subfamily definitions within Empid-idae s.str. remain less certain and relationships within thefamily will clearly require major revision using both molec-ular and newly interpreted morphological evidence. Thecurrent working concepts of Empidinae, Brachystomati-nae, Clinocerinae, and Hemerodromiinae are only partiallysupported by our molecular evidence, and, as presentlydefined, the groups ’Oreogetoninae’ and ’Trichopezinae’are polyphyletic. Clearly, the great diversity of empidoidshas hindered widespread resolution of their relationshipsby modern phylogenetic methods, but molecular data, ana-lyzed independent of specific morphological interpreta-tions, provides an important source of characters againstwhich specific morphological transformations might beassessed. Chvala’s (1983) groundbreaking monographmotivated over 22 years of intensive morphological andmolecular phylogenetic research that has focused on testingand further resolving empidoid classification, we fullyexpect that additional molecular evidence will continue toplay a major role in the next stages of this ongoing quest.
J.K. Moulton, B.M. Wiegmann / Molecular Phylogenetics and Evolution 43 (2007) 701–713 713
Acknowledgments
We thank P. Chandler, K. Collins, J. Cumming, M. Ir-win, J. MacDonald, J. Olejnicek, J. Skevington, B. Sinclair,H. Ulrich, D. Webb, and D. Yeates for contributing spec-imens and assistance with taxonomic identifications. J.Cumming and N.E. Woodley graciously helped in identify-ing the sampled Chilean specimens of Brachystoma. Thisproject was supported by a grant from the US NationalScience Foundation DEB-0089745 to B.M. Wiegmannand J. Thorne.
References
Bonfield, J.K., Smith, K.F., Staden, R., 1995. A new DNA sequenceassembly program. Nucleic Acids Res. 24, 4992–4999.
Bremer, K., 1988. The limits of amino acid sequence data in angiospermphylogenetic reconstruction. Evolution 42, 795–803.
Bremer, K., 1994. Branch support and tree stability. Cladistics 10, 295–304.Chirgwin, J.M., Przybyla, A.E., MacDonald, R.J., Rutter, W.J., 1979.
Isolation of biologically active ribonucleic acid from sources rich inribonuclease. Biochemistry 18, 5294.
Chvala, M., 1983. The Empidoidea (Diptera) of Fennoscandia andDenmark. II. General part. The families Hybotidae, Atelestidae, andMicrophoridae. Fauna Entomol. Scand. 12, 1–297.
Collins, K.P., Wiegmann, B.M., 2002a. Phylogenetic relationships andplacement of the Empidoidea (Diptera: Brachycera) based upon 28SrDNA and EF-1a sequences. Insect Syst. Evol. 33, 421–444.
Collins, K.P., Wiegmann, B.M., 2002b. Phylogenetic relationships of thelower Cyclorrhapha (Diptera: Brachycera) based upon 28S rDNAsequences. Insect Syst. Evol. 33, 445–456.
Cumming, J.M., Sinclair, B.J., Wood, D.M., 1995. Homology andphylogenetic implications of male genitalia in Diptera–Eremoneura.Entomol. Scand. 26, 121–151.
Disney, R.H.L., 1994. Continuing the debate relating to the phylogeneticreconstruction of the Phoridae (Diptera). G. Ital. Entomol. 7, 103–117.
Felsenstein, J., 1985. Confidence limits on phylogenies: an approach usingthe bootstrap. Evolution 39, 783–791.
Griffiths, G.C.D., 1972. The phylogenetic classification of DipteraCyclorrhapha, with special reference to the structure of the malepostabdomen. Series Entomol. 8, 1–340.
Hancock, J.M., Tautz, D., Dover, G.A., 1988. Evolution of the secondarystructures and compensatory mutations of the ribosomal RNAs ofDrosophila melanogaster. Mol. Biol. Evol. 5, 393–414.
Hennig, W., 1971. Insektfossilien aus der unteren Kreide. III. Empidifor-mia (‘‘Microphorinae’’) aus der unteren Kreide und aus dem Baltis-chen Bernstein; ein Vertreter der Cyclorrhapha aus der unteren Kreide.Stuttg. Beitr. Naturkd. 232, 1–28.
Huelsenbeck, J.P., Ronquist, F.R., 2001. MrBayes 2: Bayesian inferenceof phylogeny. Biometrics 17, 754–755.
Maddison, D.R., 1991. The discovery and importance of multiple islandsof most-parsimonious trees. Syst. Zool. 40, 315–328.
Maddison, W.P., Maddison, D.R., 1992. MacClade: Analysis of Phylog-eny and Character Evolution, version 4.04 for Mac OS X. Sinauer,Sunderland, MA.
Mardulyn, P., Cameron, S.A., 1999. The major opsin in bees (InsectaHymenoptera): a promising nuclear gene for higher level phylogenet-ics. Mol. Phylogenet. Evol. 12, 168–176.
Moulton, J.K., Wiegmann, B.M., 2004. Evolution and phylogenetic utilityof CAD (rudimentary) among Mesozoic-aged eremoneuran Diptera(Insecta). Mol. Phylog. Evol. 31, 363–378.
Posada, D., Crandall, K.A., 1998. ModelTest: testing the model of DNAsubstitution. Bioinformatics 14, 817–818.
Rambaut, A., 2002. Sequence alignment editor, Version 2.0. Available asshareware from <http://evolve.zoo.ox.ac.uk/index.html/>.
Regier, J.C., Shultz, J.W., Kambic, R.E., 2004. Phylogeny of basalhexapod lineages and estimates of divergence times. Ann. Entomol.Soc. Am. 97, 411–419.
Regier, J.C., Wilson, H.M., Schultz, J.W., 2005. Phylogenetic analysis ofMyriapoda using three nuclear protein-coding genes. Mol. Phylog.Evol. 34, 147–158.
Rogers, J., Wall, R., 1980. A mechanism for RNA splicing. Proc. Natl.Acad. Sci. USA 77, 1877–1879.
Ronquist, F., Huelsenbeck, J.P., 2003. MrBayes 3: Bayesian phylogeneticinference under mixed models. Bioinformatics 19, 1572–1574.
Sinclair, B.J., 1995. Generic revision of the Clinocerinae (Empididae), anddescription and phylogenetic relationships of the Trichopezinae, newstatus (Diptera: Empidoidea). Can. Ent. 127, 665–752.
Sinclair, B.J., Cumming, J.M., 2000. Revision of the genus Apterodromia
Oldroyd (Diptera: Empidoidea), with a redefinition of the tribeOcydromiini. Rec. Aust. Mus. 52, 161–186.
Sinclair, B.J., Cumming, J.M., 2006. The morphology, higher-levelphylogeny and classification of the Empidoidea (Diptera). Zootaxa1180, 1–172.
Smith, S.W., Overbeek, R., Woese, C.R., Gilbert, W., Gellevet, P.M.,1994. The genetic data environment and expandable GUI for multiplesequence analysis. Comput. Appl. Biosci. 10, 671–675.
Sorenson, M.D., 1999. TreeRot, version 2.. Boston University, Boston,MA.
Staden, R., 1996. The Staden sequence analysis package. Mol. Biotechnol.5, 233–241.
Swofford, D.L., 2002. PAUP*. Phylogenetic Analysis Using Parsimony(* and Other Methods). Version 4. Sinauer Associates, Sunderland,Massachusetts.
Thompson, J.D., Gibson, T.J., Plewniak, F., Jeanmougin, F., Higgins,D.G., 1997. The Clustal X windows interface: flexible strategies formultiple sequence alignment aided by quality analysis tools. NucleicAcids Res. 24, 4876–4882.
Ulrich, H., 1990. Evidence for the phylogenetic position of Parathalas-sinae (Empidoidea) based on thoracic morphology. Abstract Volume.The Second International Congress of Dipterology, Bratislava. (FullMS published privately by author).
Wiegmann, B.M., Mitter, C., Thompson, F.C., 1993. Evolutionary originof the Cyclorrhapha (Diptera): tests of alternative morphologicalhypotheses. Cladistics 9, 41–81.
Wiegmann, B.M., Mitter, C., Regier, J.C., Friedlander, T.P., Wagner,D.M., Nielson, E.S., 2000. Nuclear genes resolve Mesozoic-ageddivergences in the insect order Lepidoptera. Mol. Phylog. Evol. 15,242–259.
Wilcox, T.P.D., Zwickl, J., Heath, T., Hillis, D.M., 2002. Phylogeneticrelationships of the dwarf boas and a comparison of Bayesian andbootstrap measures of phylogenetic support. Mol. Phylogenet. Evol.25, 361–371.
Yang, D., 2004. Fauna Sinica Insecta (vol. 34) Diptera EmpididaeHemerodromiinae Hybotinae. Henan Science & Technology Publish-ing House. 335 pages + 1 plate.
Zatwarnicki, T., 1996. A new reconstruction of the origin of theeremoneuran hypopygium and its implications for classification(Insecta: Diptera). Genus 3, 103–175.