The Performance of Runtime Data Cache Prefetching in a Dynamic Optimization System
11
The Performance of Runtime Data Cache Prefetching in a Dynamic Optimization System ∗ Jiwei Lu, Howard Chen, Rao Fu, Wei-Chung Hsu, Bobbie Othmer, Pen-Chung Yew Department of Computer Science and Engineering University of Minnesota, Twin Cities {jiwei, chenh, rfu, hsu, bothmer, yew}@cs.umn.edu Dong-Yuan Chen Microprocessor Research Lab Intel Corporation [email protected] Abstract Traditional software controlled data cache prefetching is often ineffective due to the lack of runtime cache miss and miss address information. To overcome this limitation, we implement runtime data cache prefetching in the dynamic optimization system ADORE (ADaptive Object code RE- optimization). Its performance has been compared with static software prefetching on the SPEC2000 benchmark suite. Runtime cache prefetching shows better performance. On an Itanium 2 based Linux workstation, it can increase performance by more than 20% over static prefetching on some benchmarks. For benchmarks that do not benefit from prefetching, the runtime optimization system adds only 1%- 2% overhead. We have also collected cache miss profiles to guide static data cache prefetching in the ORC R compiler. With that information the compiler can effectively avoid generating prefetches for loops that hit well in the data cache. 1. Introduction Software controlled data cache prefetching is an effi- cient way to hide cache miss latency. It has been very successful for dense matrix oriented numerical applications. However, for other applications that include indirect mem- ory references, complicated control structures and recursive data structures, the performance of software cache prefetch- ing is often limited due to the lack of cache miss and miss address information. In this paper, we try to keep the ap- plicability of software data prefetching by using cache miss profiles and a runtime optimization system. ∗ This work is supported in part by the U.S. National Science Founda- tion under grants CCR-0105574 and EIA-0220021, and grants from Intel, Hewlett Packard and Unisys. 1.1. Impact of Program Structures We first give a simple example to illustrate several is- sues involved in software controlled data cache prefetching. Fig. 1 shows a typical loop nest used to perform a ma- trix multiplication. Experienced programmers know how void matrix_multiply(long A[N][N], long B[N][N], long C[N][N]) { int i, j, k; for ( i = 0; i < N; ++i ) for (j = 0; j < N; ++j ) for (k = 0; k < N; ++k ) A[i][j] += B[i][k] * C[k][j]; } Figure 1. Matrix Multiplication to use cache blocking, loop interchange, unroll and jam, or library routines to increase performance. However, typi- cal programmers rely on the compiler to conduct optimiza- tions. In this simple example, the innermost loop is a can- didate for static cache prefetching. Note that the three ar- rays in the example are passed as parameters to the func- tion. This introduces the possibility of aliasing, and results in less precise data dependency analysis. We used two com- pilers for Itanium system in this study: the Intel R C/C++ Itanium R Compiler (i.e. ECC V7.0) [15] and the ORC open research compiler 2.0 [26]. Both compilers have imple- mented static cache prefetch optimizations that are turned on at O3. For the above example function, the ECC com- piler generates cache prefetches for the innermost loop, but the ORC compiler does not. Moreover, if the above exam- ple is re-coded to treat the three arrays as global variables, the ECC compiler generates much more efficient code (over 5x faster on an Itanium 2 machine) by using loop unrolling. This simple example shows that program structure has a sig- nificant impact on the performance of static cache prefetch- ing. Some program structures require more complicated Proceedings of the 36th International Symposium on Microarchitecture (MICRO-36 2003) 0-7695-2043-X/03 $17.00 © 2003 IEEE
Transcript of The Performance of Runtime Data Cache Prefetching in a Dynamic Optimization System
The Performance of Runtime Data Cache Prefetching in a DynamicOptimization System ∗
Jiwei Lu, Howard Chen, Rao Fu, Wei-Chung Hsu,Bobbie Othmer, Pen-Chung Yew
Department of Computer Science and EngineeringUniversity of Minnesota, Twin Cities
{jiwei, chenh, rfu, hsu, bothmer, yew}@cs.umn.edu
Dong-Yuan Chen
Microprocessor Research LabIntel [email protected]
Abstract
Traditional software controlled data cache prefetching isoften ineffective due to the lack of runtime cache miss andmiss address information. To overcome this limitation, weimplement runtime data cache prefetching in the dynamicoptimization system ADORE (ADaptive Object code RE-optimization). Its performance has been compared withstatic software prefetching on the SPEC2000 benchmarksuite. Runtime cache prefetching shows better performance.On an Itanium 2 based Linux workstation, it can increaseperformance by more than 20% over static prefetching onsome benchmarks. For benchmarks that do not benefit fromprefetching, the runtime optimization system adds only 1%-2% overhead. We have also collected cache miss profiles toguide static data cache prefetching in the ORC R©compiler.With that information the compiler can effectively avoidgenerating prefetches for loops that hit well in the datacache.
1. Introduction
Software controlled data cache prefetching is an effi-cient way to hide cache miss latency. It has been verysuccessful for dense matrix oriented numerical applications.However, for other applications that include indirect mem-ory references, complicated control structures and recursivedata structures, the performance of software cache prefetch-ing is often limited due to the lack of cache miss and missaddress information. In this paper, we try to keep the ap-plicability of software data prefetching by using cache missprofiles and a runtime optimization system.
∗This work is supported in part by the U.S. National Science Founda-tion under grants CCR-0105574 and EIA-0220021, and grants from Intel,Hewlett Packard and Unisys.
1.1. Impact of Program Structures
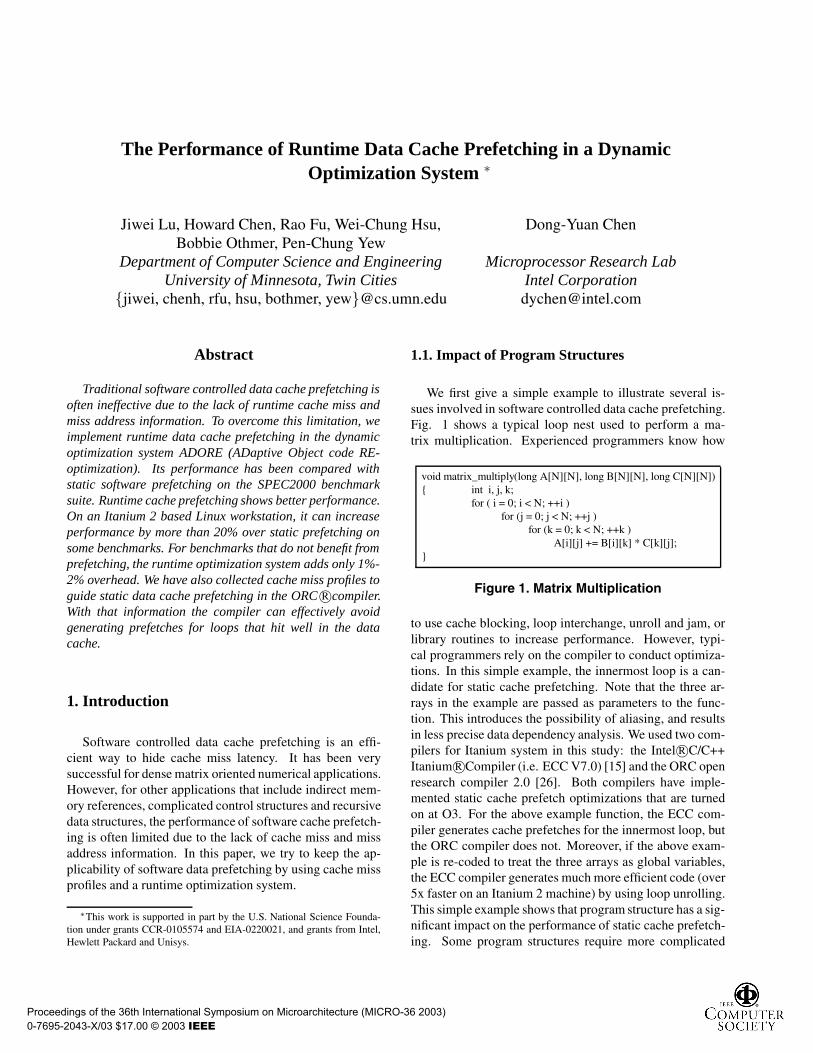
We first give a simple example to illustrate several is-sues involved in software controlled data cache prefetching.Fig. 1 shows a typical loop nest used to perform a ma-trix multiplication. Experienced programmers know how
void matrix_multiply(long A[N][N], long B[N][N], long C[N][N]) { int i, j, k;
for ( i = 0; i < N; ++i ) for (j = 0; j < N; ++j )
for (k = 0; k < N; ++k ) A[i][j] += B[i][k] * C[k][j];
}
Figure 1. Matrix Multiplication
to use cache blocking, loop interchange, unroll and jam, orlibrary routines to increase performance. However, typi-cal programmers rely on the compiler to conduct optimiza-tions. In this simple example, the innermost loop is a can-didate for static cache prefetching. Note that the three ar-rays in the example are passed as parameters to the func-tion. This introduces the possibility of aliasing, and resultsin less precise data dependency analysis. We used two com-pilers for Itanium system in this study: the Intel R©C/C++Itanium R©Compiler (i.e. ECC V7.0) [15] and the ORC openresearch compiler 2.0 [26]. Both compilers have imple-mented static cache prefetch optimizations that are turnedon at O3. For the above example function, the ECC com-piler generates cache prefetches for the innermost loop, butthe ORC compiler does not. Moreover, if the above exam-ple is re-coded to treat the three arrays as global variables,the ECC compiler generates much more efficient code (over5x faster on an Itanium 2 machine) by using loop unrolling.This simple example shows that program structure has a sig-nificant impact on the performance of static cache prefetch-ing. Some program structures require more complicated
Proceedings of the 36th International Symposium on Microarchitecture (MICRO-36 2003) 0-7695-2043-X/03 $17.00 © 2003 IEEE
analysis (such as interprocedural analysis) to conduct effi-cient and effective cache prefetching.
1.2. Impact of Runtime Memory Behavior
It is in general difficult to predict memory working setsize and reference behaviors at compile time. ConsiderGaussian Elimination, for example. The execution of theloop nest usually generates frequent cache misses at the be-ginning of the execution and few cache misses near the endof the loop nest. Initially, the sub-matrix to be processedis usually too large to fit in the data caches; hence frequentcache misses will be generated. As the sub-matrices to beprocessed get smaller, they may fit in the cache and producefewer cache misses. It is hard for the compiler to generateone binary that meets the cache prefetch requirements forboth ends.
The memcpy library routine is another example. In someapplications, the call to memcpy may involve a large amountof data movement and intensive cache misses. In some otherapplications, the calls to the memcpy routine have few cachemisses. Once again, it is not easy 1 to provide one memcpyroutine that meets all the requirements.
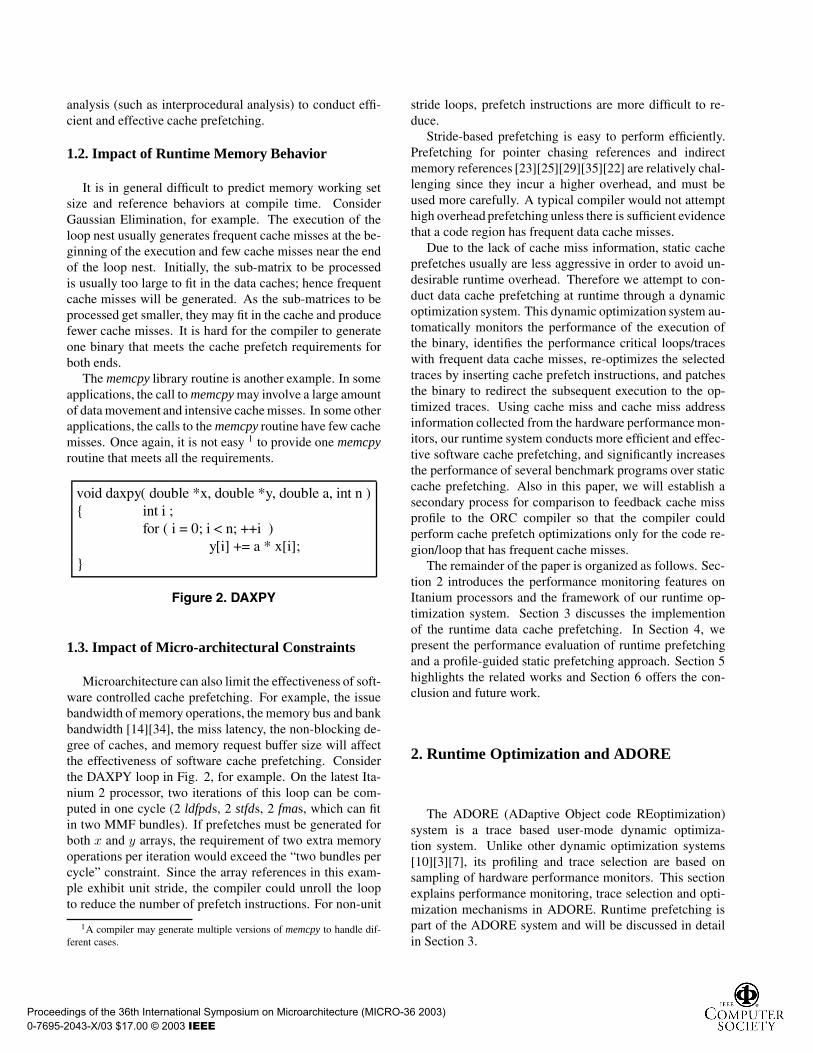
void daxpy( double *x, double *y, double a, int n ) { int i ;
for ( i = 0; i < n; ++i ) y[i] += a * x[i];
}
Figure 2. DAXPY
1.3. Impact of Micro-architectural Constraints
Microarchitecture can also limit the effectiveness of soft-ware controlled cache prefetching. For example, the issuebandwidth of memory operations, the memory bus and bankbandwidth [14][34], the miss latency, the non-blocking de-gree of caches, and memory request buffer size will affectthe effectiveness of software cache prefetching. Considerthe DAXPY loop in Fig. 2, for example. On the latest Ita-nium 2 processor, two iterations of this loop can be com-puted in one cycle (2 ldfpds, 2 stfds, 2 fmas, which can fitin two MMF bundles). If prefetches must be generated forboth x and y arrays, the requirement of two extra memoryoperations per iteration would exceed the “two bundles percycle” constraint. Since the array references in this exam-ple exhibit unit stride, the compiler could unroll the loopto reduce the number of prefetch instructions. For non-unit
1A compiler may generate multiple versions of memcpy to handle dif-ferent cases.
stride loops, prefetch instructions are more difficult to re-duce.
Stride-based prefetching is easy to perform efficiently.Prefetching for pointer chasing references and indirectmemory references [23][25][29][35][22] are relatively chal-lenging since they incur a higher overhead, and must beused more carefully. A typical compiler would not attempthigh overhead prefetching unless there is sufficient evidencethat a code region has frequent data cache misses.
Due to the lack of cache miss information, static cacheprefetches usually are less aggressive in order to avoid un-desirable runtime overhead. Therefore we attempt to con-duct data cache prefetching at runtime through a dynamicoptimization system. This dynamic optimization system au-tomatically monitors the performance of the execution ofthe binary, identifies the performance critical loops/traceswith frequent data cache misses, re-optimizes the selectedtraces by inserting cache prefetch instructions, and patchesthe binary to redirect the subsequent execution to the op-timized traces. Using cache miss and cache miss addressinformation collected from the hardware performance mon-itors, our runtime system conducts more efficient and effec-tive software cache prefetching, and significantly increasesthe performance of several benchmark programs over staticcache prefetching. Also in this paper, we will establish asecondary process for comparison to feedback cache missprofile to the ORC compiler so that the compiler couldperform cache prefetch optimizations only for the code re-gion/loop that has frequent cache misses.
The remainder of the paper is organized as follows. Sec-tion 2 introduces the performance monitoring features onItanium processors and the framework of our runtime op-timization system. Section 3 discusses the implementionof the runtime data cache prefetching. In Section 4, wepresent the performance evaluation of runtime prefetchingand a profile-guided static prefetching approach. Section 5highlights the related works and Section 6 offers the con-clusion and future work.
2. Runtime Optimization and ADORE
The ADORE (ADaptive Object code REoptimization)system is a trace based user-mode dynamic optimiza-tion system. Unlike other dynamic optimization systems[10][3][7], its profiling and trace selection are based onsampling of hardware performance monitors. This sectionexplains performance monitoring, trace selection and opti-mization mechanisms in ADORE. Runtime prefetching ispart of the ADORE system and will be discussed in detailin Section 3.
Proceedings of the 36th International Symposium on Microarchitecture (MICRO-36 2003) 0-7695-2043-X/03 $17.00 © 2003 IEEE
2.1. Performance Monitoring and Runtime Sam-pling on Itanium processor
Intel’s Itanium architecture offers extensive hardwaresupport for performance monitoring [19]. The Itanium-2 processor provides more than one hundred counters tomeasure the performance events such as memory latency,branch prediction rate, CPU cycles, retired-instructioncounts, and pipeline stalls. Two usage models are supportedusing these performance counters: workload charateriza-tion, which gives the overall runtime cycle breakdown, andprofiling, which provides information for identifying pro-gram bottlenecks. Both models are programmable and fullysupported in the latest IA64 Linux kernel. Based on thesetwo models, Stephane Eranian developed a generic kernelinterface called perfmon [28] to help programmers accessthe IA64 PMU (Performance Mornitoring Unit) and collectperformance profiles on Itanium processors. The samplingof ADORE is built on top of this kernel interface.
In ADORE, sample collection is achieved through asignal handler communicating with the perfmon interface.Perfmon samples the IA64 PMU every N CPU cycles (e.g.N = 300, 000 cycles). Once the kernel sample buffer fillsup, it throws a buffer-overflow signal to invoke the signalhandler routine to move the samples out to a user buffer fortrace selection/optimization.
Each PMU sample consists of three accumulativecounter values required by ADORE: CPU cycles, RetiredInstruction Count, and Data Cache Load Miss Count. Inaddition, ADORE needs the samples of the Branch TraceBuffer (BTB) registers and the Data Event Address Reg-isters (DEAR). BTB is a circular register file recordingthe most recent 4 branch outcomes and the source/targetaddress information. DEAR holds the most recent ad-dress/latency information related to a data cache load miss,a TLB miss or an ALAT miss. For example, ADORE willsample DEAR for the latest data cache miss events withload latency ≥ 8 cycles. Finally, each sample is in theform of an n-tuple: <sample index, pc address of sam-ple, CPU Cycle, D-Cache Miss Count, Retired-InstructionCount, BTB values, DEAR values>.
2.2. Dynamic Optimization System
ADORE is implemented as a shared library on Linuxfor IA64 that can be automatically linked to the applica-tion at startup. It is also a runtime trace optimizer like Dy-namo [3], but ADORE relies on the Itanium hardware per-formance monitor (HPM) to identify hotspots instead of us-ing interpretation. A trace is a single entry, multi-exit codesequence. In Dynamo, a trace is selected once the referencecount of the target block of a backwards taken branch ex-ceeds a threshold. In ADORE, trace selection is based on
Main Program
Trace Cache
Main Thread
Trace Selector
Optimizer
Patcher Phase Detector
User Event Buffer (UEB)
DynOpt Thread
Kernel SpaceSystem Sample
Buffer (SSB)
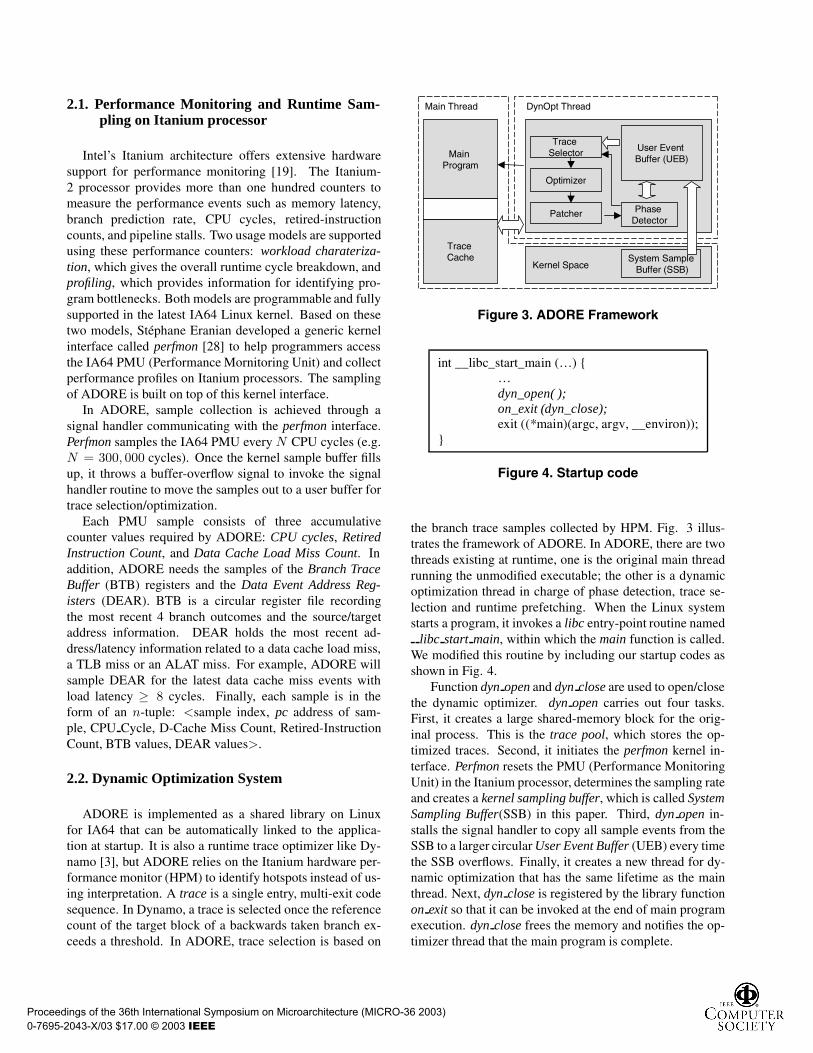
Figure 3. ADORE Framework
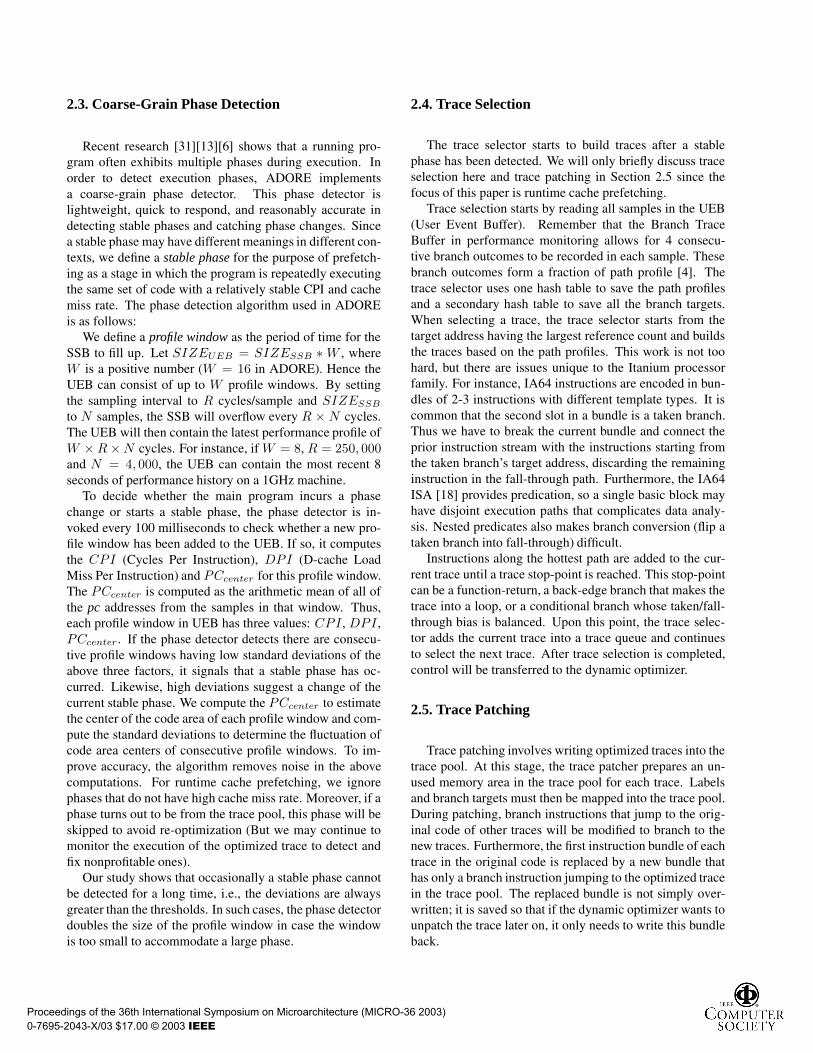
int __libc_start_main (…) { … dyn_open( ); on_exit (dyn_close); exit ((*main)(argc, argv, __environ));
}
Figure 4. Startup code
the branch trace samples collected by HPM. Fig. 3 illus-trates the framework of ADORE. In ADORE, there are twothreads existing at runtime, one is the original main threadrunning the unmodified executable; the other is a dynamicoptimization thread in charge of phase detection, trace se-lection and runtime prefetching. When the Linux systemstarts a program, it invokes a libc entry-point routine named
libc start main, within which the main function is called.We modified this routine by including our startup codes asshown in Fig. 4.
Function dyn open and dyn close are used to open/closethe dynamic optimizer. dyn open carries out four tasks.First, it creates a large shared-memory block for the orig-inal process. This is the trace pool, which stores the op-timized traces. Second, it initiates the perfmon kernel in-terface. Perfmon resets the PMU (Performance MonitoringUnit) in the Itanium processor, determines the sampling rateand creates a kernel sampling buffer, which is called SystemSampling Buffer(SSB) in this paper. Third, dyn open in-stalls the signal handler to copy all sample events from theSSB to a larger circular User Event Buffer (UEB) every timethe SSB overflows. Finally, it creates a new thread for dy-namic optimization that has the same lifetime as the mainthread. Next, dyn close is registered by the library functionon exit so that it can be invoked at the end of main programexecution. dyn close frees the memory and notifies the op-timizer thread that the main program is complete.
Proceedings of the 36th International Symposium on Microarchitecture (MICRO-36 2003) 0-7695-2043-X/03 $17.00 © 2003 IEEE
2.3. Coarse-Grain Phase Detection
Recent research [31][13][6] shows that a running pro-gram often exhibits multiple phases during execution. Inorder to detect execution phases, ADORE implementsa coarse-grain phase detector. This phase detector islightweight, quick to respond, and reasonably accurate indetecting stable phases and catching phase changes. Sincea stable phase may have different meanings in different con-texts, we define a stable phase for the purpose of prefetch-ing as a stage in which the program is repeatedly executingthe same set of code with a relatively stable CPI and cachemiss rate. The phase detection algorithm used in ADOREis as follows:
We define a profile window as the period of time for theSSB to fill up. Let SIZEUEB = SIZESSB ∗ W , whereW is a positive number (W = 16 in ADORE). Hence theUEB can consist of up to W profile windows. By settingthe sampling interval to R cycles/sample and SIZESSB
to N samples, the SSB will overflow every R × N cycles.The UEB will then contain the latest performance profile ofW × R × N cycles. For instance, if W = 8, R = 250, 000and N = 4, 000, the UEB can contain the most recent 8seconds of performance history on a 1GHz machine.
To decide whether the main program incurs a phasechange or starts a stable phase, the phase detector is in-voked every 100 milliseconds to check whether a new pro-file window has been added to the UEB. If so, it computesthe CPI (Cycles Per Instruction), DPI (D-cache LoadMiss Per Instruction) and PCcenter for this profile window.The PCcenter is computed as the arithmetic mean of all ofthe pc addresses from the samples in that window. Thus,each profile window in UEB has three values: CPI , DPI ,PCcenter. If the phase detector detects there are consecu-tive profile windows having low standard deviations of theabove three factors, it signals that a stable phase has oc-curred. Likewise, high deviations suggest a change of thecurrent stable phase. We compute the PCcenter to estimatethe center of the code area of each profile window and com-pute the standard deviations to determine the fluctuation ofcode area centers of consecutive profile windows. To im-prove accuracy, the algorithm removes noise in the abovecomputations. For runtime cache prefetching, we ignorephases that do not have high cache miss rate. Moreover, if aphase turns out to be from the trace pool, this phase will beskipped to avoid re-optimization (But we may continue tomonitor the execution of the optimized trace to detect andfix nonprofitable ones).
Our study shows that occasionally a stable phase cannotbe detected for a long time, i.e., the deviations are alwaysgreater than the thresholds. In such cases, the phase detectordoubles the size of the profile window in case the windowis too small to accommodate a large phase.
2.4. Trace Selection
The trace selector starts to build traces after a stablephase has been detected. We will only briefly discuss traceselection here and trace patching in Section 2.5 since thefocus of this paper is runtime cache prefetching.
Trace selection starts by reading all samples in the UEB(User Event Buffer). Remember that the Branch TraceBuffer in performance monitoring allows for 4 consecu-tive branch outcomes to be recorded in each sample. Thesebranch outcomes form a fraction of path profile [4]. Thetrace selector uses one hash table to save the path profilesand a secondary hash table to save all the branch targets.When selecting a trace, the trace selector starts from thetarget address having the largest reference count and buildsthe traces based on the path profiles. This work is not toohard, but there are issues unique to the Itanium processorfamily. For instance, IA64 instructions are encoded in bun-dles of 2-3 instructions with different template types. It iscommon that the second slot in a bundle is a taken branch.Thus we have to break the current bundle and connect theprior instruction stream with the instructions starting fromthe taken branch’s target address, discarding the remaininginstruction in the fall-through path. Furthermore, the IA64ISA [18] provides predication, so a single basic block mayhave disjoint execution paths that complicates data analy-sis. Nested predicates also makes branch conversion (flip ataken branch into fall-through) difficult.
Instructions along the hottest path are added to the cur-rent trace until a trace stop-point is reached. This stop-pointcan be a function-return, a back-edge branch that makes thetrace into a loop, or a conditional branch whose taken/fall-through bias is balanced. Upon this point, the trace selec-tor adds the current trace into a trace queue and continuesto select the next trace. After trace selection is completed,control will be transferred to the dynamic optimizer.
2.5. Trace Patching
Trace patching involves writing optimized traces into thetrace pool. At this stage, the trace patcher prepares an un-used memory area in the trace pool for each trace. Labelsand branch targets must then be mapped into the trace pool.During patching, branch instructions that jump to the orig-inal code of other traces will be modified to branch to thenew traces. Furthermore, the first instruction bundle of eachtrace in the original code is replaced by a new bundle thathas only a branch instruction jumping to the optimized tracein the trace pool. The replaced bundle is not simply over-written; it is saved so that if the dynamic optimizer wants tounpatch the trace later on, it only needs to write this bundleback.
Proceedings of the 36th International Symposium on Microarchitecture (MICRO-36 2003) 0-7695-2043-X/03 $17.00 © 2003 IEEE
3. Runtime Prefetching
The purpose of runtime software prefetching is to in-sert prefetch instructions into the binary code to hide mem-ory latency. In the current version of ADORE, data cacheprefetching is the major optimization implemented. Ourexperiments show that by inserting prefetch instructions atruntime, half of the SPEC2000 benchmark programs com-piled with O2 gain performance.
Just like the traditional software prefetching, our run-time optimizer merges the prefetching code directly intothe traces to hide large cache miss latency after identifyingthe delinquent loads in hot loops. The approach of runtimeprefetching in ADORE is as follows: (a) Use performancesamples to locate the most recent delinquent loads. (b) If theload instruction is in a loop-type trace, extract its dependentinstructions for address calculation. (c) Determine its datareference pattern. (d) Calculate the stride if it has spatial orstructural locality. Otherwise, insert special codes to pre-dict strides for pointer-chasing references. (e) Schedule theprefetches.
3.1. Tracking Delinquent Loads
Each sample contains the latest data cache miss eventwith latency no less than 8 cycles. On the Itanium basedsystems, this much latency implies L2 or L3 cache misses.In general, there are more L1 cache misses. However,the performance loss due to L2/L3 cache misses is usu-ally higher because of the greater miss latency. Thereforeprefetching for L2 and L3 cache misses can be more costeffective.
To track a delinquent load, the source address, the la-tency and the miss address of each cache miss event aremapped to the corresponding load instruction in a selectedtrace (if any). With path profile based trace selection, it ispossible that one delinquent load appears in two or more se-lected traces. But in most of the cases, there is only one looptrace that contains the load instruction, and the current im-plementation runtime prefetching is targeted for loop tracesonly. Finally, prefetching in ADORE is applied to at mostthe top three miss instructions in each loop-type trace, i.e.,the load instructions with the greatest percentage of overalllatency.
3.2. Data Reference Pattern Detection
For software prefetching, there are three important datareference patterns in loops: direct array reference, indirectarray reference and pointer-based reference. It is not obvi-ous what pattern a delinquent load belongs to at the binary-level. For pointer-chasing prefetching, some papers [11]
// i++; a[ i++]=b; // b= a[ i++];
Loop: …
add r14= 4, r14 st4 [r14] = r20, 4 ld4 r20 = [r14]
add r14 = 4, r14 … br.cond Loop
// c = b[a[k++] – 1];
Loop: …
ld4 r20=[r16], 4 add r15 = r25, r20 add r15 = –1, r15
ld1 r15=[r15] … br.cond Loop
// tail = arcin→ tail;
// arcin = tail→ mark;
Loop: … add r11= 104, r34
ld8 r11= [r11] ld8 r34= [r11] …
br.cond Loop
A. direct array B. indirect array C. pointer chasing
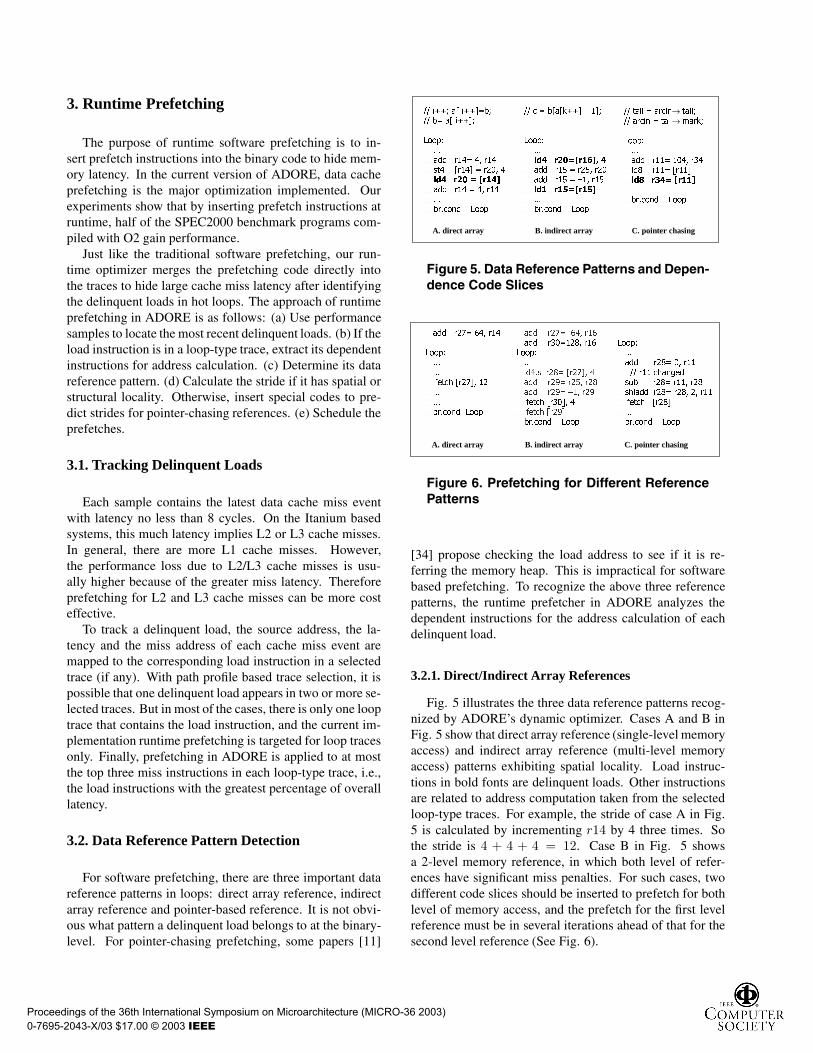
Figure 5. Data Reference Patterns and Depen-dence Code Slices
add r27= 64, r14 Loop: ...
… lfetch [r27], 12 …
... br.cond Loop
add r27= 64, r16 add r30=128, r16 Loop: …
ld4.s r28= [r27], 4 add r29= r25, r28 add r29= –1, r29
lfetch [r30], 4 lfetch [r29] br.cond Loop
Loop: … add r28= 0, r11
// r11 changed sub r28= r11, r28 shladd r28= r28, 2, r11
lfetch [r28] … br.cond Loop
A. direct array B. indirect array C. pointer chasing
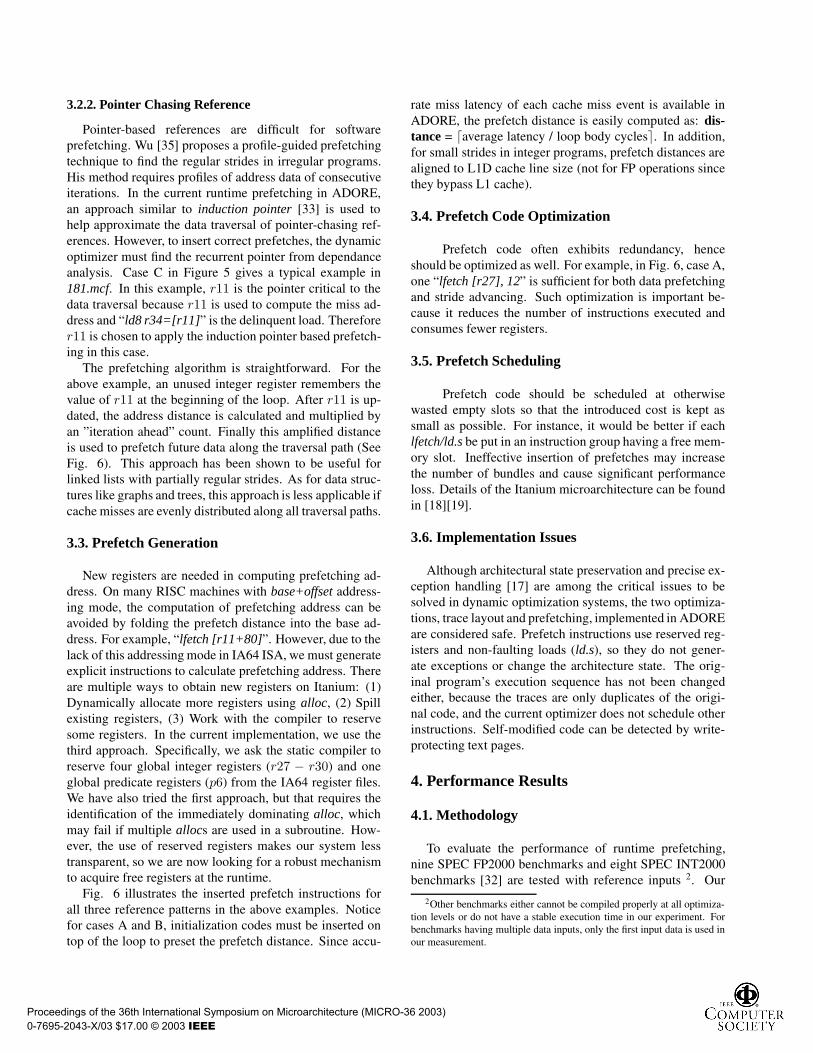
Figure 6. Prefetching for Different ReferencePatterns
[34] propose checking the load address to see if it is re-ferring the memory heap. This is impractical for softwarebased prefetching. To recognize the above three referencepatterns, the runtime prefetcher in ADORE analyzes thedependent instructions for the address calculation of eachdelinquent load.
3.2.1. Direct/Indirect Array References
Fig. 5 illustrates the three data reference patterns recog-nized by ADORE’s dynamic optimizer. Cases A and B inFig. 5 show that direct array reference (single-level memoryaccess) and indirect array reference (multi-level memoryaccess) patterns exhibiting spatial locality. Load instruc-tions in bold fonts are delinquent loads. Other instructionsare related to address computation taken from the selectedloop-type traces. For example, the stride of case A in Fig.5 is calculated by incrementing r14 by 4 three times. Sothe stride is 4 + 4 + 4 = 12. Case B in Fig. 5 showsa 2-level memory reference, in which both level of refer-ences have significant miss penalties. For such cases, twodifferent code slices should be inserted to prefetch for bothlevel of memory access, and the prefetch for the first levelreference must be in several iterations ahead of that for thesecond level reference (See Fig. 6).
Proceedings of the 36th International Symposium on Microarchitecture (MICRO-36 2003) 0-7695-2043-X/03 $17.00 © 2003 IEEE
3.2.2. Pointer Chasing Reference
Pointer-based references are difficult for softwareprefetching. Wu [35] proposes a profile-guided prefetchingtechnique to find the regular strides in irregular programs.His method requires profiles of address data of consecutiveiterations. In the current runtime prefetching in ADORE,an approach similar to induction pointer [33] is used tohelp approximate the data traversal of pointer-chasing ref-erences. However, to insert correct prefetches, the dynamicoptimizer must find the recurrent pointer from dependanceanalysis. Case C in Figure 5 gives a typical example in181.mcf. In this example, r11 is the pointer critical to thedata traversal because r11 is used to compute the miss ad-dress and “ld8 r34=[r11]” is the delinquent load. Thereforer11 is chosen to apply the induction pointer based prefetch-ing in this case.
The prefetching algorithm is straightforward. For theabove example, an unused integer register remembers thevalue of r11 at the beginning of the loop. After r11 is up-dated, the address distance is calculated and multiplied byan ”iteration ahead” count. Finally this amplified distanceis used to prefetch future data along the traversal path (SeeFig. 6). This approach has been shown to be useful forlinked lists with partially regular strides. As for data struc-tures like graphs and trees, this approach is less applicable ifcache misses are evenly distributed along all traversal paths.
3.3. Prefetch Generation
New registers are needed in computing prefetching ad-dress. On many RISC machines with base+offset address-ing mode, the computation of prefetching address can beavoided by folding the prefetch distance into the base ad-dress. For example, “lfetch [r11+80]”. However, due to thelack of this addressing mode in IA64 ISA, we must generateexplicit instructions to calculate prefetching address. Thereare multiple ways to obtain new registers on Itanium: (1)Dynamically allocate more registers using alloc, (2) Spillexisting registers, (3) Work with the compiler to reservesome registers. In the current implementation, we use thethird approach. Specifically, we ask the static compiler toreserve four global integer registers (r27 − r30) and oneglobal predicate registers (p6) from the IA64 register files.We have also tried the first approach, but that requires theidentification of the immediately dominating alloc, whichmay fail if multiple allocs are used in a subroutine. How-ever, the use of reserved registers makes our system lesstransparent, so we are now looking for a robust mechanismto acquire free registers at the runtime.
Fig. 6 illustrates the inserted prefetch instructions forall three reference patterns in the above examples. Noticefor cases A and B, initialization codes must be inserted ontop of the loop to preset the prefetch distance. Since accu-
rate miss latency of each cache miss event is available inADORE, the prefetch distance is easily computed as: dis-tance = �average latency / loop body cycles�. In addition,for small strides in integer programs, prefetch distances arealigned to L1D cache line size (not for FP operations sincethey bypass L1 cache).
3.4. Prefetch Code Optimization
Prefetch code often exhibits redundancy, henceshould be optimized as well. For example, in Fig. 6, case A,one “lfetch [r27], 12” is sufficient for both data prefetchingand stride advancing. Such optimization is important be-cause it reduces the number of instructions executed andconsumes fewer registers.
3.5. Prefetch Scheduling
Prefetch code should be scheduled at otherwisewasted empty slots so that the introduced cost is kept assmall as possible. For instance, it would be better if eachlfetch/ld.s be put in an instruction group having a free mem-ory slot. Ineffective insertion of prefetches may increasethe number of bundles and cause significant performanceloss. Details of the Itanium microarchitecture can be foundin [18][19].
3.6. Implementation Issues
Although architectural state preservation and precise ex-ception handling [17] are among the critical issues to besolved in dynamic optimization systems, the two optimiza-tions, trace layout and prefetching, implemented in ADOREare considered safe. Prefetch instructions use reserved reg-isters and non-faulting loads (ld.s), so they do not gener-ate exceptions or change the architecture state. The orig-inal program’s execution sequence has not been changedeither, because the traces are only duplicates of the origi-nal code, and the current optimizer does not schedule otherinstructions. Self-modified code can be detected by write-protecting text pages.
4. Performance Results
4.1. Methodology
To evaluate the performance of runtime prefetching,nine SPEC FP2000 benchmarks and eight SPEC INT2000benchmarks [32] are tested with reference inputs 2. Our
2Other benchmarks either cannot be compiled properly at all optimiza-tion levels or do not have a stable execution time in our experiment. Forbenchmarks having multiple data inputs, only the first input data is used inour measurement.
Proceedings of the 36th International Symposium on Microarchitecture (MICRO-36 2003) 0-7695-2043-X/03 $17.00 © 2003 IEEE
Speedup
-10%
0%
10%
20%
30%
40%
50%
60%
bzip
2
gzip
mcf vpr
pars
er
gap
vort
ex
gcc
amm
p
art
appl
u
equa
ke
face
rec
fma3
d
luca
s
mes
a
swim
O2 + Runtime prefetching
(a)
Speedup
-10%
0%
10%
20%
30%
40%
50%
60%
bzip
2
gzip
mcf vpr
pars
er
gap
vort
ex
gcc
amm
p
art
appl
u
equa
ke
face
rec
fma3
d
luca
s
mes
a
swim
O3 + Runtime Prefetching
(b)
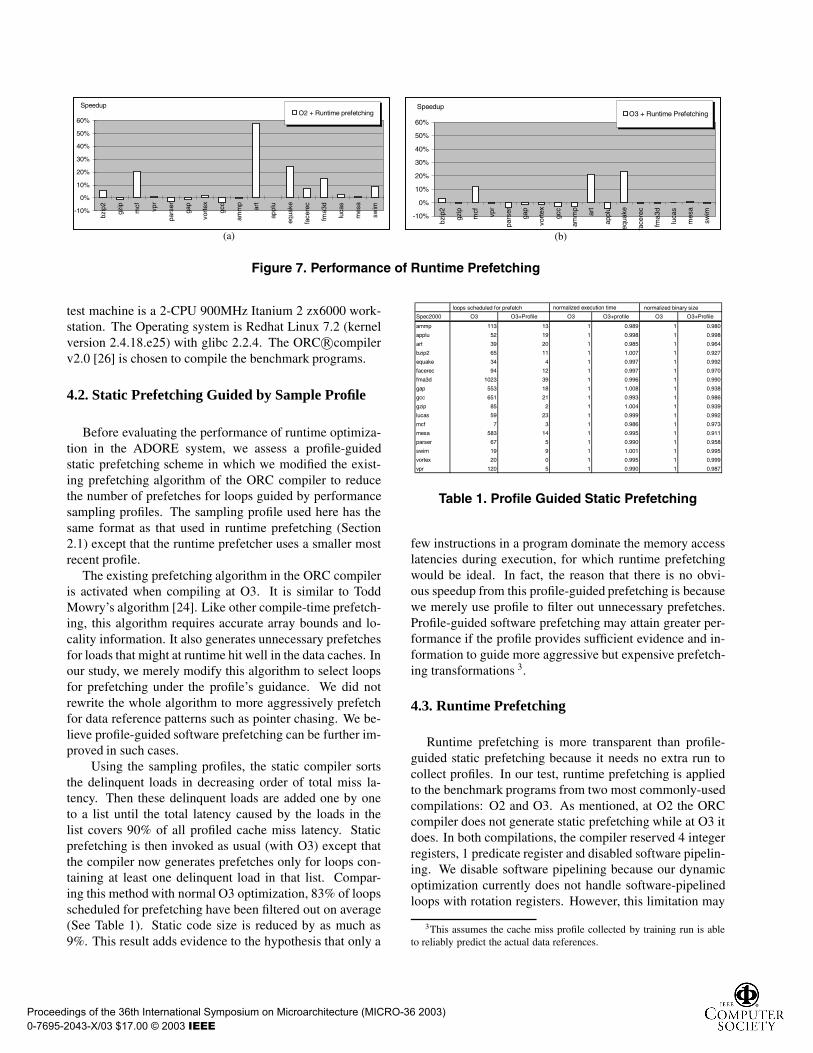
Figure 7. Performance of Runtime Prefetching
test machine is a 2-CPU 900MHz Itanium 2 zx6000 work-station. The Operating system is Redhat Linux 7.2 (kernelversion 2.4.18.e25) with glibc 2.2.4. The ORC R©compilerv2.0 [26] is chosen to compile the benchmark programs.
4.2. Static Prefetching Guided by Sample Profile
Before evaluating the performance of runtime optimiza-tion in the ADORE system, we assess a profile-guidedstatic prefetching scheme in which we modified the exist-ing prefetching algorithm of the ORC compiler to reducethe number of prefetches for loops guided by performancesampling profiles. The sampling profile used here has thesame format as that used in runtime prefetching (Section2.1) except that the runtime prefetcher uses a smaller mostrecent profile.
The existing prefetching algorithm in the ORC compileris activated when compiling at O3. It is similar to ToddMowry’s algorithm [24]. Like other compile-time prefetch-ing, this algorithm requires accurate array bounds and lo-cality information. It also generates unnecessary prefetchesfor loads that might at runtime hit well in the data caches. Inour study, we merely modify this algorithm to select loopsfor prefetching under the profile’s guidance. We did notrewrite the whole algorithm to more aggressively prefetchfor data reference patterns such as pointer chasing. We be-lieve profile-guided software prefetching can be further im-proved in such cases.
Using the sampling profiles, the static compiler sortsthe delinquent loads in decreasing order of total miss la-tency. Then these delinquent loads are added one by oneto a list until the total latency caused by the loads in thelist covers 90% of all profiled cache miss latency. Staticprefetching is then invoked as usual (with O3) except thatthe compiler now generates prefetches only for loops con-taining at least one delinquent load in that list. Compar-ing this method with normal O3 optimization, 83% of loopsscheduled for prefetching have been filtered out on average(See Table 1). Static code size is reduced by as much as9%. This result adds evidence to the hypothesis that only a
loops scheduled for prefetch normalized execution time normalized binary size
Spec2000 O3 O3+Profile O3 O3+profile O3 O3+Profile
ammp 113 13 1 0.989 1 0.980
applu 52 19 1 0.998 1 0.998
art 39 20 1 0.985 1 0.964
bzip2 65 11 1 1.007 1 0.927
equake 34 4 1 0.997 1 0.992
facerec 94 12 1 0.997 1 0.970
fma3d 1023 39 1 0.996 1 0.990
gap 553 18 1 1.008 1 0.938
gcc 651 21 1 0.993 1 0.986
gzip 85 2 1 1.004 1 0.939
lucas 59 23 1 0.999 1 0.992
mcf 7 3 1 0.986 1 0.973
mesa 583 14 1 0.995 1 0.911
parser 67 5 1 0.990 1 0.958
swim 19 9 1 1.001 1 0.995
vortex 20 0 1 0.995 1 0.999
vpr 120 5 1 0.990 1 0.987
Table 1. Profile Guided Static Prefetching
few instructions in a program dominate the memory accesslatencies during execution, for which runtime prefetchingwould be ideal. In fact, the reason that there is no obvi-ous speedup from this profile-guided prefetching is becausewe merely use profile to filter out unnecessary prefetches.Profile-guided software prefetching may attain greater per-formance if the profile provides sufficient evidence and in-formation to guide more aggressive but expensive prefetch-ing transformations 3.
4.3. Runtime Prefetching
Runtime prefetching is more transparent than profile-guided static prefetching because it needs no extra run tocollect profiles. In our test, runtime prefetching is appliedto the benchmark programs from two most commonly-usedcompilations: O2 and O3. As mentioned, at O2 the ORCcompiler does not generate static prefetching while at O3 itdoes. In both compilations, the compiler reserved 4 integerregisters, 1 predicate register and disabled software pipelin-ing. We disable software pipelining because our dynamicoptimization currently does not handle software-pipelinedloops with rotation registers. However, this limitation may
3This assumes the cache miss profile collected by training run is ableto reliably predict the actual data references.
Proceedings of the 36th International Symposium on Microarchitecture (MICRO-36 2003) 0-7695-2043-X/03 $17.00 © 2003 IEEE
179.art
0
1
2
3
4
5
Execution Time
CP
I
No Runtime Prefetching
With Runtime Prefetching
(a)
179.art
0
1
2
3
4
5
6
Execution Time
DE
AR
_CA
CH
E_L
AT
8 / 1
000
Inst
ruct
ions
No Runtime Prefetching
With Runtime Prefetching
(b)
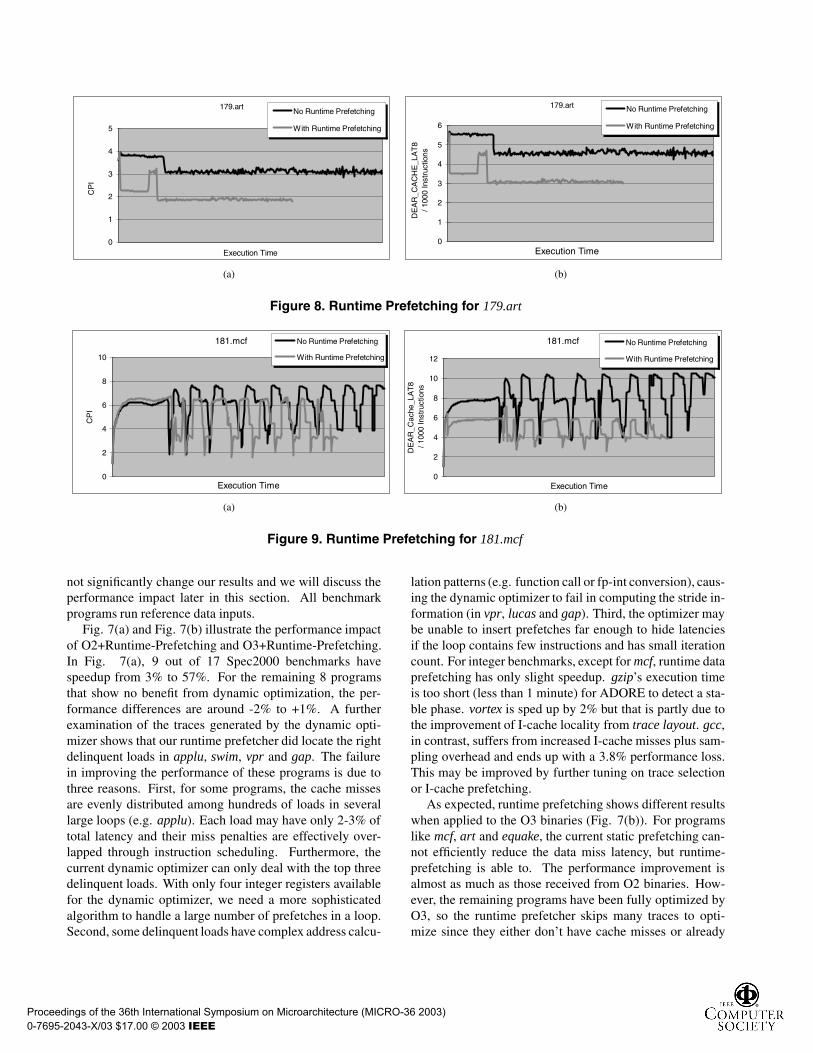
Figure 8. Runtime Prefetching for 179.art
181.mcf
0
2
4
6
8
10
Execution Time
CP
I
No Runtime Prefetching
With Runtime Prefetching
(a)
181.mcf
0
2
4
6
8
10
12
Execution Time
DE
AR
_Cac
he_L
AT
8 /
1000
Inst
ruct
ions
No Runtime Prefetching
With Runtime Prefetching
(b)
Figure 9. Runtime Prefetching for 181.mcf
not significantly change our results and we will discuss theperformance impact later in this section. All benchmarkprograms run reference data inputs.
Fig. 7(a) and Fig. 7(b) illustrate the performance impactof O2+Runtime-Prefetching and O3+Runtime-Prefetching.In Fig. 7(a), 9 out of 17 Spec2000 benchmarks havespeedup from 3% to 57%. For the remaining 8 programsthat show no benefit from dynamic optimization, the per-formance differences are around -2% to +1%. A furtherexamination of the traces generated by the dynamic opti-mizer shows that our runtime prefetcher did locate the rightdelinquent loads in applu, swim, vpr and gap. The failurein improving the performance of these programs is due tothree reasons. First, for some programs, the cache missesare evenly distributed among hundreds of loads in severallarge loops (e.g. applu). Each load may have only 2-3% oftotal latency and their miss penalties are effectively over-lapped through instruction scheduling. Furthermore, thecurrent dynamic optimizer can only deal with the top threedelinquent loads. With only four integer registers availablefor the dynamic optimizer, we need a more sophisticatedalgorithm to handle a large number of prefetches in a loop.Second, some delinquent loads have complex address calcu-
lation patterns (e.g. function call or fp-int conversion), caus-ing the dynamic optimizer to fail in computing the stride in-formation (in vpr, lucas and gap). Third, the optimizer maybe unable to insert prefetches far enough to hide latenciesif the loop contains few instructions and has small iterationcount. For integer benchmarks, except for mcf, runtime dataprefetching has only slight speedup. gzip’s execution timeis too short (less than 1 minute) for ADORE to detect a sta-ble phase. vortex is sped up by 2% but that is partly due tothe improvement of I-cache locality from trace layout. gcc,in contrast, suffers from increased I-cache misses plus sam-pling overhead and ends up with a 3.8% performance loss.This may be improved by further tuning on trace selectionor I-cache prefetching.
As expected, runtime prefetching shows different resultswhen applied to the O3 binaries (Fig. 7(b)). For programslike mcf, art and equake, the current static prefetching can-not efficiently reduce the data miss latency, but runtime-prefetching is able to. The performance improvement isalmost as much as those received from O2 binaries. How-ever, the remaining programs have been fully optimized byO3, so the runtime prefetcher skips many traces to opti-mize since they either don’t have cache misses or already
Proceedings of the 36th International Symposium on Microarchitecture (MICRO-36 2003) 0-7695-2043-X/03 $17.00 © 2003 IEEE
have compiler generated “lfetch”. For this reason the per-formance differences for many programs are around -3% to+2%.
Now let’s look at an example to understand how runtimeprefetching works for these benchmark programs. In Fig.8, the left graph shows the runtime CPI change for 179.artwith/without runtime prefetching (O2 binary). The rightgraph shows the change of DEAR Load Miss per 1000 in-structions. There are two clear phases shown in both graphs.One is from the beginning of the execution; the other startsat about 1
4 of way in the execution. Phase detection workseffectively in this case. The first phase is detected aboutten seconds after startup and prefetching codes are appliedimmediately. Both CPI and DEAR Load Miss Per 1000 in-structions are reduced by almost half. About one and a halfminutes later, a phase change occurs followed by the sec-ond stable phase till the end. The phase detector catchesthis second phase too. Since the prefetching effectively re-duces the running time, the second lines in both graphs areshorter than the top lines. Fig. 9 is the same type of graphfor 181.mcf. Other programs like bzip2, fma3d, swim andequake also exhibit similar patterns.
Only a small number of prefetches have been in-
SpecFP2000 ammp applu art equake facerec fma3d lucas mesa swim
direct array 0 21 10 6 17 11 6 1 9indirect array 2 0 6 1 0 2 0 0 0pointer-chasing 2 0 0 0 0 0 0 0 0optimized phase # 3 2 2 1 3 4 1 1 1SpecINT2000 bzip2 gap gcc gzip mcf parser vortex vpr
direct array 10 3 2 0 0 1 2 1indirect array 6 0 0 0 0 0 0 0pointer-chasing 0 0 0 0 3 2 0 0optimized phase # 2 3 2 0 2 1 2 1
Table 2. Prefetching Data Analysis
serted into the trace code to achieve the above speedup.Table 2 shows the total number of stable phases appliedwith runtime prefetching and the individual number of thethree reference patterns prefetched in each benchmark pro-gram (O2 binary). The majority of speedup comes fromprefetching for direct/indirect array references. Prefetchingfor pointer chasing references is not widely applicable be-cause not many LDS (linked data structure) intensive appli-cations exhibit regular stride. For such kind of data struc-tures, runtime prefetching should consider more elaborateapproaches such as correlation prefetching [25].
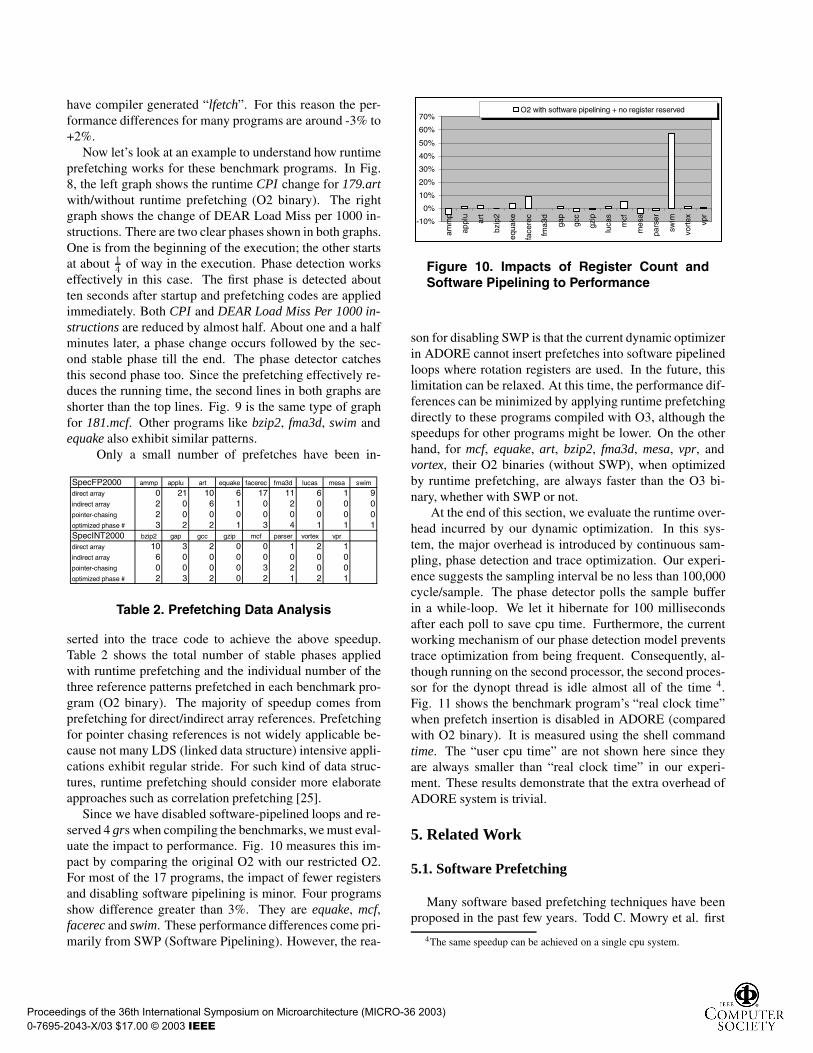
Since we have disabled software-pipelined loops and re-served 4 grs when compiling the benchmarks, we must eval-uate the impact to performance. Fig. 10 measures this im-pact by comparing the original O2 with our restricted O2.For most of the 17 programs, the impact of fewer registersand disabling software pipelining is minor. Four programsshow difference greater than 3%. They are equake, mcf,facerec and swim. These performance differences come pri-marily from SWP (Software Pipelining). However, the rea-
-10%
0%
10%
20%
30%
40%
50%
60%
70%
amm
p
appl
u
art
bzip
2
equa
ke
face
rec
fma3
d
gap
gcc
gzip
luca
s
mcf
mes
a
pars
er
swim
vort
ex vpr
O2 with software pipelining + no register reserved
Figure 10. Impacts of Register Count andSoftware Pipelining to Performance
son for disabling SWP is that the current dynamic optimizerin ADORE cannot insert prefetches into software pipelinedloops where rotation registers are used. In the future, thislimitation can be relaxed. At this time, the performance dif-ferences can be minimized by applying runtime prefetchingdirectly to these programs compiled with O3, although thespeedups for other programs might be lower. On the otherhand, for mcf, equake, art, bzip2, fma3d, mesa, vpr, andvortex, their O2 binaries (without SWP), when optimizedby runtime prefetching, are always faster than the O3 bi-nary, whether with SWP or not.
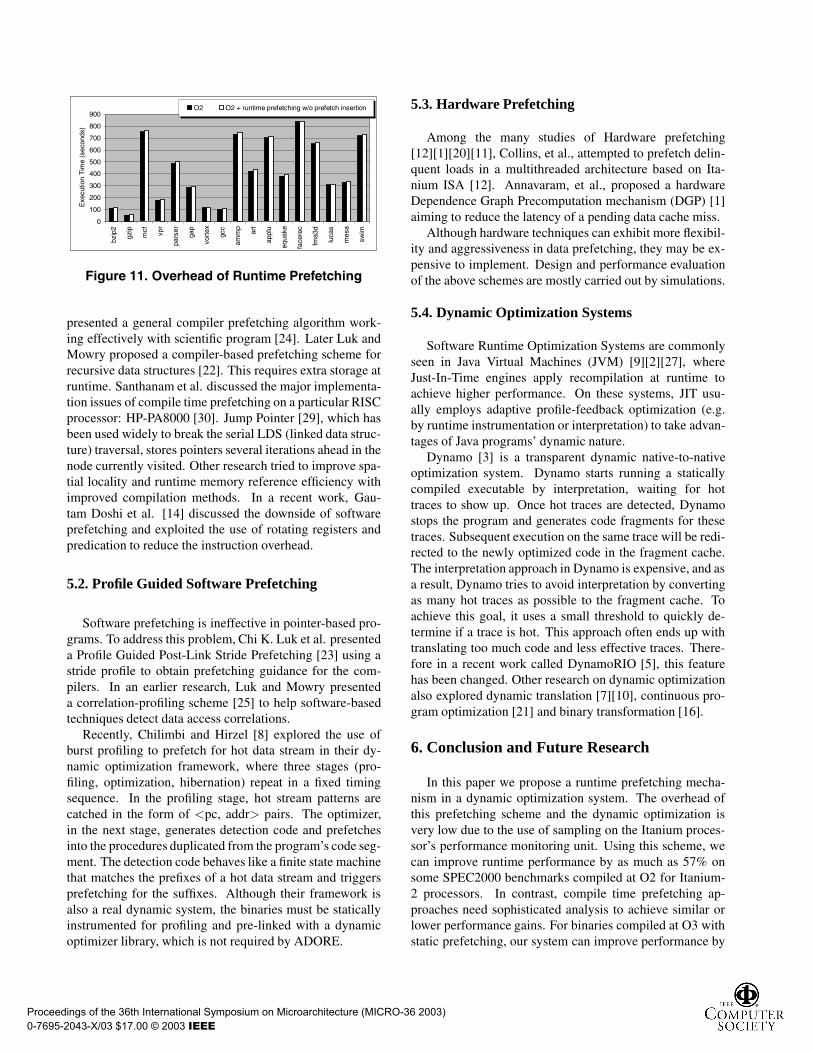
At the end of this section, we evaluate the runtime over-head incurred by our dynamic optimization. In this sys-tem, the major overhead is introduced by continuous sam-pling, phase detection and trace optimization. Our experi-ence suggests the sampling interval be no less than 100,000cycle/sample. The phase detector polls the sample bufferin a while-loop. We let it hibernate for 100 millisecondsafter each poll to save cpu time. Furthermore, the currentworking mechanism of our phase detection model preventstrace optimization from being frequent. Consequently, al-though running on the second processor, the second proces-sor for the dynopt thread is idle almost all of the time 4.Fig. 11 shows the benchmark program’s “real clock time”when prefetch insertion is disabled in ADORE (comparedwith O2 binary). It is measured using the shell commandtime. The “user cpu time” are not shown here since theyare always smaller than “real clock time” in our experi-ment. These results demonstrate that the extra overhead ofADORE system is trivial.
5. Related Work
5.1. Software Prefetching
Many software based prefetching techniques have beenproposed in the past few years. Todd C. Mowry et al. first
4The same speedup can be achieved on a single cpu system.
Proceedings of the 36th International Symposium on Microarchitecture (MICRO-36 2003) 0-7695-2043-X/03 $17.00 © 2003 IEEE
0
100
200
300
400
500
600
700
800
900bz
ip2
gzip
mcf vpr
pars
er
gap
vort
ex
gcc
amm
p
art
appl
u
equa
ke
face
rec
fma3
d
luca
s
mes
a
swim
Exe
cutio
n T
ime
(sec
onds
)
O2 O2 + runtime prefetching w/o prefetch insertion
Figure 11. Overhead of Runtime Prefetching
presented a general compiler prefetching algorithm work-ing effectively with scientific program [24]. Later Luk andMowry proposed a compiler-based prefetching scheme forrecursive data structures [22]. This requires extra storage atruntime. Santhanam et al. discussed the major implementa-tion issues of compile time prefetching on a particular RISCprocessor: HP-PA8000 [30]. Jump Pointer [29], which hasbeen used widely to break the serial LDS (linked data struc-ture) traversal, stores pointers several iterations ahead in thenode currently visited. Other research tried to improve spa-tial locality and runtime memory reference efficiency withimproved compilation methods. In a recent work, Gau-tam Doshi et al. [14] discussed the downside of softwareprefetching and exploited the use of rotating registers andpredication to reduce the instruction overhead.
5.2. Profile Guided Software Prefetching
Software prefetching is ineffective in pointer-based pro-grams. To address this problem, Chi K. Luk et al. presenteda Profile Guided Post-Link Stride Prefetching [23] using astride profile to obtain prefetching guidance for the com-pilers. In an earlier research, Luk and Mowry presenteda correlation-profiling scheme [25] to help software-basedtechniques detect data access correlations.
Recently, Chilimbi and Hirzel [8] explored the use ofburst profiling to prefetch for hot data stream in their dy-namic optimization framework, where three stages (pro-filing, optimization, hibernation) repeat in a fixed timingsequence. In the profiling stage, hot stream patterns arecatched in the form of <pc, addr> pairs. The optimizer,in the next stage, generates detection code and prefetchesinto the procedures duplicated from the program’s code seg-ment. The detection code behaves like a finite state machinethat matches the prefixes of a hot data stream and triggersprefetching for the suffixes. Although their framework isalso a real dynamic system, the binaries must be staticallyinstrumented for profiling and pre-linked with a dynamicoptimizer library, which is not required by ADORE.
5.3. Hardware Prefetching
Among the many studies of Hardware prefetching[12][1][20][11], Collins, et al., attempted to prefetch delin-quent loads in a multithreaded architecture based on Ita-nium ISA [12]. Annavaram, et al., proposed a hardwareDependence Graph Precomputation mechanism (DGP) [1]aiming to reduce the latency of a pending data cache miss.
Although hardware techniques can exhibit more flexibil-ity and aggressiveness in data prefetching, they may be ex-pensive to implement. Design and performance evaluationof the above schemes are mostly carried out by simulations.
5.4. Dynamic Optimization Systems
Software Runtime Optimization Systems are commonlyseen in Java Virtual Machines (JVM) [9][2][27], whereJust-In-Time engines apply recompilation at runtime toachieve higher performance. On these systems, JIT usu-ally employs adaptive profile-feedback optimization (e.g.by runtime instrumentation or interpretation) to take advan-tages of Java programs’ dynamic nature.
Dynamo [3] is a transparent dynamic native-to-nativeoptimization system. Dynamo starts running a staticallycompiled executable by interpretation, waiting for hottraces to show up. Once hot traces are detected, Dynamostops the program and generates code fragments for thesetraces. Subsequent execution on the same trace will be redi-rected to the newly optimized code in the fragment cache.The interpretation approach in Dynamo is expensive, and asa result, Dynamo tries to avoid interpretation by convertingas many hot traces as possible to the fragment cache. Toachieve this goal, it uses a small threshold to quickly de-termine if a trace is hot. This approach often ends up withtranslating too much code and less effective traces. There-fore in a recent work called DynamoRIO [5], this featurehas been changed. Other research on dynamic optimizationalso explored dynamic translation [7][10], continuous pro-gram optimization [21] and binary transformation [16].
6. Conclusion and Future Research
In this paper we propose a runtime prefetching mecha-nism in a dynamic optimization system. The overhead ofthis prefetching scheme and the dynamic optimization isvery low due to the use of sampling on the Itanium proces-sor’s performance monitoring unit. Using this scheme, wecan improve runtime performance by as much as 57% onsome SPEC2000 benchmarks compiled at O2 for Itanium-2 processors. In contrast, compile time prefetching ap-proaches need sophisticated analysis to achieve similar orlower performance gains. For binaries compiled at O3 withstatic prefetching, our system can improve performance by
Proceedings of the 36th International Symposium on Microarchitecture (MICRO-36 2003) 0-7695-2043-X/03 $17.00 © 2003 IEEE
as much as 20%. In this paper, we also examined a profile-guided static prefetching using the HPM based samplingprofiles. The results show that a minor modification of ex-isting static prefetching to use cache miss profiles can avoidgenerating most of the unbeneficial prefetches without los-ing performance.
For future work on runtime prefetching, we plan to en-hance our algorithm to also handle software pipelined loops.The current phase detection scheme in our system doesnot work very well on programs with rapid phase changes,hence needs to be improved. Finally, we are investigatingthe possibility of adding selective runtime instrumentationto collect information not available from HPM.
References
[1] M. Annavaram, J. M. Patel, and E. S. Davidson. DataPrefetching by Dependence Graph Precomputation. InISCA-28, pages 52–61. ACM Press, 2001.
[2] M. Arnold, S. Fink, D. Grove, M. Hind, and P. F. Sweeney.Adaptive Optimization in the Jalapeno JVM. In OOP-SLA’00, pages 47–65. ACM Press, 2000.
[3] V. Bala, E. Duesterwald, and S. Banerjia. Dynamo: A Trans-parent Dynamic Optimization System. In PLDI’00, pages1–12. ACM Press, 2000.
[4] T. Ball and J. R. Larus. Efficient Path Profiling. In Micro-29,pages 46–57. IEEE Computer Society Press, 1996.
[5] D. Bruening, T. Garnett, and S. Amarasinghe. An Infras-tructure for Adaptive Dynamic Optimization. In CGO’03,pages 265 –275, 2003.
[6] H. Chen, W.-C. Hsu, J. Lu, P.-C. Yew, and D.-Y. Chen. Dy-namic Trace Selection Using Performance Monitoring Hard-ware Sampling. In CGO’03, pages 79–90, 2003.
[7] A. Chernoff, M. Herdeg, R. Hookway, C. Reeve, N. Ru-bin, T. Tye, S. Bharadwaj Yadavalli, and J. Yates. FX!32 aProfile-Directed Binary Translator. Micro, IEEE, 18(2):56–64, Mar/Apr 1998.
[8] T. M. Chilimbi and M. Hirzel. Dynamic Hot Data StreamPrefetching for General-Purpose Programs. In PLDI’02,pages 199–209. ACM Press, 2002.
[9] M. Cierniak, G.-Y. Lueh, and J. M. Stichnoth. PracticingJUDO: Java Under Dynamic Optimizations. In PLDI’00,pages 13–26. ACM Press, 2000.
[10] R. S. Cohn, D. W.Goodwin, and P. G. Lowney. Optimiz-ing Alpha Executables on Windows NT with Spike. DigitalTechnical Journal, 9(4), Jun 1998.
[11] J. Collins, S. Sair, B. Calder, and D. M. Tullsen. PointerCache Assisted Prefetching. In Micro-35, pages 62–73.IEEE Computer Society Press, 2002.
[12] J. D. Collins, H. Wang, D. M. Tullsen, C. Hughes, Y.-F.Lee, D. Lavery, and J. P. Shen. Speculative Precomputation:Long-Range Prefetching of Delinquent Loads. In ISCA-28,pages 14–25. ACM Press, 2001.
[13] A. S. Dhodapkar and J. E. Smith. Managing Multi-Configuration Hardware via Dynamic Working Set Analy-sis. In ISCA-29, pages 233–244. IEEE Computer Society,2002.
[14] G. Doshi, R. Krishnaiyer, and K. Muthukumar. Optimiz-ing Software Data Prefetches with Rotating Registers. InPACT’01, pages 257 –267, 2001.
[15] Intel R©C++ Compiler for Linux,http://www.intel.com/software/products/compilers/clin/.
[16] A. Edwards, A. Srivastava, and H. Vo. Vulcan: BinaryTransformation in A Distributed Environment. TechnicalReport MSR-TR-2001-50, Apr 2001.
[17] M. Gschwind and E. Altman. Optimization and Precise Ex-ceptions in Dynamic Compilation. ACM SIGARCH Com-puter Architecture News, 29(1):66–74, 2001.
[18] Intel Corp. Intel R©IA-64 Architecture Software Developer’sManual, revision 2.1 edition, Oct 2002.
[19] Intel Corp. Intel R©Itanium R©2 Processor Reference Manualfor Software Development and Optimization, Jun 2002.
[20] D. Joseph and D. Grunwald. Prefetching Using Markov Pre-dictors. In ISCA24, pages 252–263. ACM Press, 1997.
[21] T. Kistler and M. Franz. Continuous Program Optimization:Design and Evaluation. Computers, IEEE Transactions on,50(6):549–566, Jun 2001.
[22] C.-K. Luk and T. C. Mowry. Compiler-Based PrefetchingFor Recursive Data Structures. In ASPLOS-7, pages 222–233. ACM Press, 1996.
[23] C.-K. Luk, R. Muth, H. Patil, R. Weiss, P. G. Lowney, andR. Cohn. Profile-Guided Post-link Stride Prefetching. InICS-16, pages 167–178. ACM Press, 2002.
[24] T. C. Mowry, M. S. Lam, and A. Gupta. Design and Evalua-tion of A Compiler Algorithm for Prefetching. In ASPLOS-5, pages 62–73. ACM Press, 1992.
[25] T. C. Mowry and C.-K. Luk. Predicting Data Cache Missesin Non-Numeric Applications Through Correlation Profil-ing. In Micro-30, pages 314–320. IEEE Computer SocietyPress, 1997.
[26] Open Research Compiler for ItaniumTMProcessor Family,http://ipf-orc.sourceforge.net.
[27] M. Paleczny, C. Vick, and C. Click. The JavaTMHotSpotServer Compiler. In JavaTMVM’02, 2001.
[28] http://www.hpl.hp.com/research/linux/perfmon.[29] A. Roth and G. S. Sohi. Effective Jump-Pointer Prefetching
for Linked Data Structures. In ISCA-26, pages 111–121.IEEE Computer Society Press, 1999.
[30] V. Santhanam, E. H. Gornish, and W.-C. Hsu. Data Prefetch-ing on the HP PA-8000. In ISCA-24, pages 264–273. ACMPress, 1997.
[31] T. Sherwood, S. Sair, and B. Calder. Phase Tracking andPrediction. In ISCA-30, Jun 2003.
[32] SPEC: http://www.spec.org/cpu2000.[33] A. Stoutchinim, J. N. Amaral, G. R. Gao, J. C. Dehnert,
S. Jain, and A. Douillet. Speculative Prefetching of Induc-tion Pointers. In CC-10, April 2001.
[34] Z. Wang, D. Burger, S. K. Reinhardt, K. S. Mckinley, andC. C. Weems. Guided Region Prefetching: A CooperativeHardware/Software Approach. In ISCA30, 2003.
[35] Y. Wu. Efficient Discovery of Regular Stride Patterns inIrregular Programs and Its Use in Compiler Prefetching. InPLDI’02, pages 210–221. ACM Press, 2002.
Proceedings of the 36th International Symposium on Microarchitecture (MICRO-36 2003) 0-7695-2043-X/03 $17.00 © 2003 IEEE