Runtime debuging in embedded systems - CiteSeerX
56
Runtime debuging in embedded systems available tools and usage Nicholas Mc Guire Distributed & Embedded System Labs Lanzhou University, SISE Lanzhou, P.R. China [email protected], http://dslab.lzu.edu.cn 1
-
Upload
khangminh22 -
Category
Documents
-
view
2 -
download
0
Transcript of Runtime debuging in embedded systems - CiteSeerX

Runtime debuging in embedded systemsavailable tools and usage
Nicholas Mc GuireDistributed & Embedded System Labs
Lanzhou University, SISELanzhou, P.R. China
[email protected], http://dslab.lzu.edu.cn
1
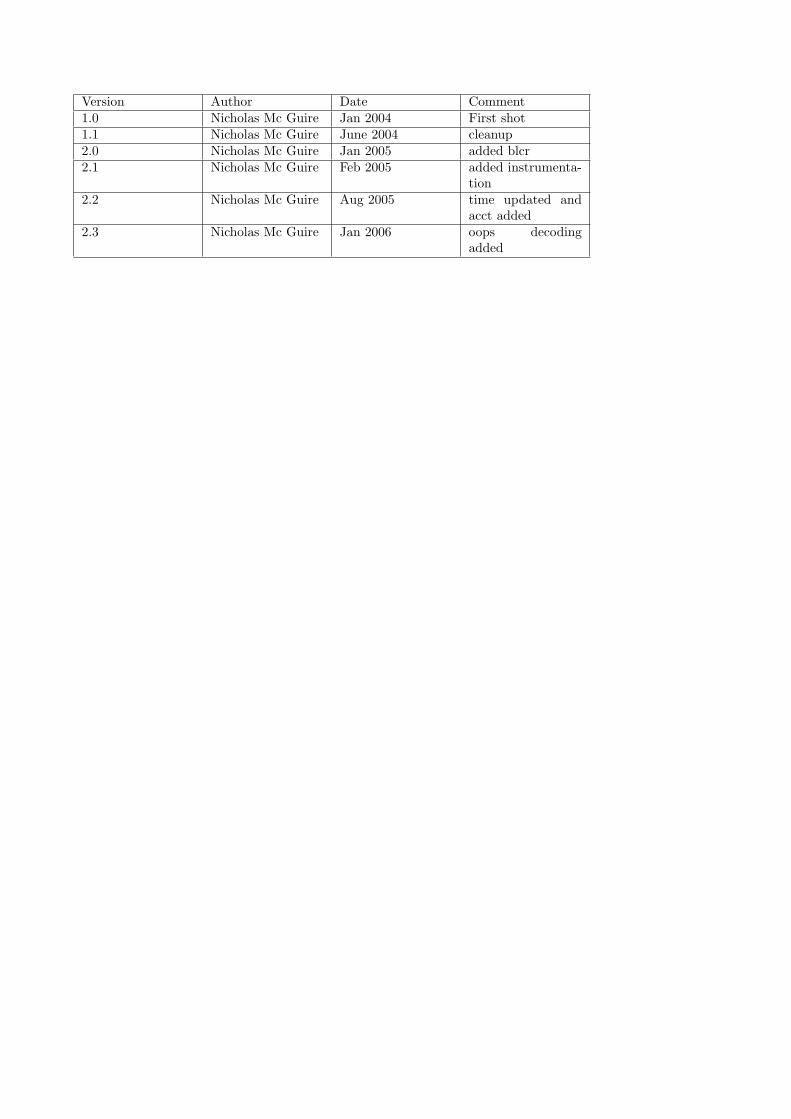
Version Author Date Comment1.0 Nicholas Mc Guire Jan 2004 First shot1.1 Nicholas Mc Guire June 2004 cleanup2.0 Nicholas Mc Guire Jan 2005 added blcr2.1 Nicholas Mc Guire Feb 2005 added instrumenta-
tion2.2 Nicholas Mc Guire Aug 2005 time updated and
acct added2.3 Nicholas Mc Guire Jan 2006 oops decoding
added

Abstract
The issue of runtime debugging in embedded systems arises with more or less any product simply because there isno such thing as bug-free code. For this reason there are two principal demands on a embedded runtime system.
• The ability to detect error-nous behavior
• The ability to locate the error in a way that allows fixing it in a short time.
The first issue is ”solved” with watchdog, respawning processes when they exit, server structures where clientprocesses can be re launched, etc.
The issue of localizing the fault is not so often treated, in fact in the consulting and support work I’ve been involvedin to date, not a single embedded development environment was targeting this issue explicitly. Surprisingly enoughmost the necessary tools are there - they just seem to be unused, and most of them unknown. So if you alwayswondered what libSegFault.so is, what /proc/PID/statm contains, bgcc... or never noticed any of these, thenthis article is for you.
1 Introduction
Embedded system development generally has a higher emphasis on testing and system evaluation than a desk-topsystem. In an embedded system a failure or a error-nous behavior can stay unnoticed for quite some time, simplybecause nobody is going to notice it until a service his hurt or the device stops responding. But far before this situationoccurs, problems may be noticeable and systems can be corrected before they fail. To achieve such behavior, or to atleast improve the embedded systems behavior, a system needs to take system monitoring and post-mortem analysisinto account from the very beginning. In this article we will scan some of the available resources for embeddedGNU/Linux systems, that allow to target some of these long term debugging problems.
• memory leaks
• ”random” segfaults
• resource access problems
• locating performance bottle-necks
2 Memory leaks
Memory leeks are a common reasons for embedded systems to slowly but shurly lock up, locating such problemsshould actually happen during system testing. But as many embedded systems utilize ‘out-of-the-box‘ distributionsan assessment of the core OS should be done.
A quick scan of /usr/sbin on my default system shows that there are a number of potential problems in thisinstalation - none of these might ever cause any real problems - but it clearly shows that checking for memory leeksis not being performed by some of the developers...
root@rtl14:~ # for APP in ‘ls /usr/sbin/*‘ ; do echo -n "$APP :" ; \mtrace $APP ; done 2>&1 | tee mtrace.sbin
root@rtl14:~ # cat mtrace.sbin
/usr/sbin/adsl-setup :- 0000000000 Realloc 300 was never alloc’d/usr/sbin/lprng_certs :Memory not freed:

-----------------Address Size Caller
0000000000 0 at0000000000 0 at/usr/sbin/nmbd :- 0000000000 Realloc 4481 was never alloc’dMemory not freed:-----------------
Address Size Caller0000000000 0 at/usr/sbin/papd :- 0000000000 Realloc 58 was never alloc’d/usr/sbin/sendmail :- 0000000000 Realloc 694 was never alloc’d/usr/sbin/smbd :- 0000000000 Realloc 6762 was never alloc’d...
These results would not be acceptable for a system that needs to give any reliability guarantee, unfortunately similarresults can be reproduced on many systems. If an embedded system would be relying on any of these applications, a closeinvestigation of the potential problems would need to be performed.
Note that reallocating memory that was never allocated will generally work, but the memory is not initialized which cancause hard to detect side effects. Not freeing memory, aside from resulting in memory ”disapearing” can be a securityproblem.
Also it is quite typical for short lived applications to not bother with freeing up allocated memory, but just exiting andleaving it to the OS to clean it all up. This is also true for some system applications like /bin/ls .
2.1 top
To check if an application is actually causing a memory leek one can monitor the system via top.
All that one need to do is lauch top and use the ”M” command to sort the list by memory usage, any memory leekagewould show up after a while when the process slowly crawls to the top of the list.
rtl14:~ # top...PID USER PRI NI SIZE RSS SHARE STAT %CPU %MEM TIME CPU COMMAND
26343 root 15 0 1104 1104 816 R 0.5 0.4 0:00 0 top26291 root 14 0 1672 1672 1508 S 0.1 0.7 0:01 0 sshd
1 root 12 0 76 68 52 S 0.0 0.0 0:54 0 init2 root 12 0 0 0 0 SW 0.0 0.0 0:00 0 keventd3 root 19 19 0 0 0 SWN 0.0 0.0 0:00 0 ksoftirqd_CPU4 root 12 0 0 0 0 SW 0.0 0.0 9:54 0 kswapd
Hit M to sort by memory usage:
PID USER PRI NI SIZE RSS SHARE STAT %CPU %MEM TIME CPU COMMAND26291 root 13 0 1672 1672 1508 S 0.4 0.7 0:01 0 sshd26079 root 12 0 1420 1420 1312 S 0.0 0.6 0:01 0 sshd26293 root 14 0 1344 1344 1052 S 0.0 0.6 0:00 0 bash26367 root 16 0 1108 1108 820 R 1.2 0.4 0:00 0 top25997 nobody 12 0 1056 1052 848 S 0.0 0.4 0:00 0 in.identd
Unfortunately top is quite inefficient as it performs a few hundred system call per output screen scanning the /procfilesystem. Generally top will not be available on an embedded system. So the solution is to use the same method as intop, but to scan the appropriate file manually which then only requires a command like ”cat”:
root@rtl14:~# chroot /opt/ecdk-0.1-i386/i386/dev_fs/

BusyBox v0.60.5 (2003.12.05-18:55+0000) Built-in shell (ash)Enter ’help’ for a list of built-in commands.
# ps | grep sshd1086 root 3080 S /usr/sbin/sshd8281 root 5732 S sshd: root@pts/0
21332 root 5692 S sshd: root@pts/123747 root 5696 S sshd: root@pts/2# cat /proc/1086/statm355 355 328 36 0 319 55#
doing this a few times manually or via a cron job can reveal memory leek problems. The meaning of the individual valueslisted are shown in the folowing table
Field Descriptionsize total program sizeresident size of memory portionsshared shared pagestrs ’code’ pagesdrs data/stacklrs librarydt dirty pages
Table : Contents of the statm files (note: one page = 4096bytes )
This might not seem very elegant - but on the other hand its a very simple way to locate long term memory leekage in theembedded environment. The ammount of data that is produced is fairly small so storing it locally over a longer period oftime should not be too big a problem. Testing on the embedded system is crucial as this might simply never happen onthe development system, and a quick scan through the /proc filesystem in a running system can locate such problem farbefor the actually inflict any damage on the device.
2.2 bgcc
For applications being developed from scratch the search for memory leeks should start a bit earlier, gcc provides extensionsfor bounds checking, which reveals memory leeks at the compile stage. The bounds checking gcc is called bgcc and isavailable as a patch to mainstream gcc. bgcc [?] can provide more than just locating of memory leaks, but this is out sidethe scope of this article.
Once you have the patched gcc installed you can copile applications with the -fbounds-checking compiler flag - whichwill compile bounds checking into the application.
For the example here we used the following test application:
#include <stdio.h>
int something (void){printf("doing something\n");return 0;
}
int main(int argc, char **argv){int array[10];

int i;
fprintf(stderr,"%s\n",argv[0]);something();printf("dev_kit check\n");return 0;
}
2.2.1 The good news on bgcc
BGCC can be reconfigured at runtime to pinpoint the exact problems via the GCC BOUNDS OPTS. To retrive a list ofavailable options just export GCC BOUNDS OPTS=--help and execute any program that was compile with bgcc.
rtl14:~ # export GCC_BOUNDS_OPTS=--helprtl14:~ # ./helloYou may supply a list of the following arguments to a bounds-checked programby listing them in the environment variable ’GCC_BOUNDS_OPTS’ beforerunning the program. Separate the arguments by spaces.General:-no-message Don’t print introductory message.-no-statistics Don’t print statistics.-?, -help Print this table of usage.
Control runtime behaviour:-array-index-check *Check the index of all array references.-no-array-index-check Only check the pointer is within the array.-never-fatal Don’t abort after a bounds error.-reuse-heap *Re-use the heap.-reuse-age=<age> Set the age limit before freeing (default: 0).-no-reuse-heap Never really free old heap blocks.-warn-unchecked-statics Warn if unchecked static objects are referenced.-no-warn-unchecked-statics *Switch off the above.-warn-unchecked-stack Warn if unchecked stack objects are referenced.-no-warn-unchecked-stack *Switch off the above.-warn-free-null *Warn if free (0) is used.-no-warn-free-null Switch off the above.-warn-misc-strings *Warn for miscellaneous strings usage.-no-warn-misc-strings Switch off the above.-warn-illegal Warn when ILLEGAL pointers are created.-no-warn-illegal *Switch off the above.-warn-unaligned *Warn when pointers are used unaligned.-no-warn-unaligned Switch off the above.-warn-overlap *Warn if memcpy arguments overlap.-no-warn-overlap Switch off the above.-warn-compare-objects *Warn if comparing pointers to different objects.-no-warn-compare-objects Switch off the above.-warn-all Turn on all warnings.-print-heap Print all heap data at exit.-no-print-heap *Don’t print heap data at exit.
Debugging:-print-calls Print calls to the bounds-checking library.-no-print-calls *Don’t print calls.
Note: ‘*’ means this is the default behaviour.
If one need to monitor a particular problem then simply setting up the bgcc environment will reduce the output to an

aboslute minimum. For the 2.95.3 patch the following output was generated by the above hello world
}root@rtl14:/tmp # export GCC_BOUNDS_OPTS="-print-heap \-no-message -no-statistics"root@rtl14:/tmp # ./hellodoing somethingdev_kit checkFilename = <noname>, Line = 0, Function = calloc, Count = 1 Size = 96452
As the output of bgcc informations on exit go to stderr one can redirect them to prevent any irritations for users andstill get all the informations nedded to locate potential problems. Many little glitches might go unnoticed for quite sometime, unfortunately bgccs output is limited in the sense that it does not report any commandline parameters that couldhelp associate detected errors with a specific invocation. But it is not too hard to add this to the executables at startup.Simply dump anything of interest to stderr with fprintf(stderr,"
}root@rtl14:/tmp # export GCC_BOUNDS_OPTS="-print-heap -no-statistics"root@rtl14:/tmp # ./hello./hellodev_kit checkBounds Checking GCC v gcc-2.95.3-2.20 Copyright (C) 1995 Richard W.M. JonesBounds Checking comes with ABSOLUTELY NO WARRANTY. For details see file‘COPYING’ that should have come with the source to this program.Bounds Checking is free software, and you are welcome to redistribute itunder certain conditions. See the file ‘COPYING’ for details.For more information, set GCC_BOUNDS_OPTS to ‘-help’Bounds library call frequency statistics:Calls to push, pop, param function: 1, 1, 2Calls to add, delete stack: 2, 2Calls to add, delete heap: 1, 0Calls to check pointer +/- integer: 0Calls to check array references: 0Calls to check pointer differences: 0Calls to check object references: 0Calls to check component references: 0Calls to check truth, falsity of pointers: 0, 0Calls to check <, >, <=, >= of pointers: 0Calls to check ==, != of pointers: 0Calls to check p++, ++p, p--, --p: 0, 0, 0, 0References to unchecked static, stack: 0, 0
Both the output and the configuration is sufficiently simple that this can be used by untrained personell to deliver bettererror information when contacting service points. A dump showing the executable invoked, the passed arguments and thebgcc output can help pinpoint problems a lot.
In case of a bounds violation the application will abort and a dump to stderr will occure - this dump can be configured togo directly to a file with the -output-file=filename in the GCC BOUNDS OPTS, for convenience the filename can containa %p which will be substituted by the PID of the failing process.
By adding the line
printf("%d", array[10]);
to our c-program we can trigger bounds checking

root@rtl17:/tmp# gcc -fbounds-checking hello.croot@rtl17:/tmp# export GCC_BOUNDS_OPTS="-warn-all"root@rtl17:/tmp# ./helloBounds Checking GCC v gcc-3.4.2-3.2 Copyright (C) 1995 Richard W.M. JonesBounds Checking comes with ABSOLUTELY NO WARRANTY. For details see file‘COPYING’ that should have come with the source to this program.Bounds Checking is free software, and you are welcome to redistribute itunder certain conditions. See the file ‘COPYING’ for details.For more information, set GCC_BOUNDS_OPTS to ‘-help’hello.c:12:Bounds error: array reference (10) outside bounds of the array.hello.c:12: Pointer value: 0xbffff7a8hello.c:12: Object ‘array’:hello.c:12: Address in memory: 0xbffff780 .. 0xbffff7a7hello.c:12: Size: 40 byteshello.c:12: Element size: 4 byteshello.c:12: Number of elements: 10hello.c:12: Created at: hello.c, line 9hello.c:12: Storage class: stackAborted
This output should be enough to imediately fix this problem.
2.2.2 The bad news on bgcc
The bad news is simple - size.
}root@rtl14:/tmp # ls -l hello-rwxr-xr-x 1 root root 95964 Jan 31 16:10 hello*root@rtl14:/tmp # file hellohello: ELF 32-bit LSB executable, Intel 80386, version 1(SYSV), dynamically linked (uses shared libs), stripped
94k for a hello world is not bad. for fairness one might add that this overhead visible in the hello world case does not scaleto large applications linearly but the overhead is conciderable.
And with gcc-3.4.4 patched for bounds-checking (glibc-2.3.5) it did not improve...
}root@rtl17:/tmp# ls -l hello-rwxr-xr-x 1 root root 117604 2006-02-05 20:25 hello*root@rtl17:/tmp#
2.3 SSP Stack Smashing Protection
This is not strickly memory leaks - so it’s a bit out of place here - but as its also a gcc patch we will cover it here.
The basic concept of stack smashing protection is that stack vulnerabilities are due to unsafe memory layout, so corectingthis layout is the primary goal.
The main ideas are:
• reordering of local variables:By placing buffers after pointers one can avoid the corruption of pointers when local buffers are filled with arbitrarydata by the attack/coruption. This eliminates the ability to explint function pointers.

• relocation of function arguments By copying of pointers in function arguments to an area located before local variablebuffers one can prevent the corruption of pointers that could be used to further corrupt arbitrary memory locations.
SSP tries to protect the following four areas:
• the location of the arguments
• the return address
• the previous frame pointer
• the local variables
To protect the first three areas a random value, the guard variable, is introduced (random so that it can’t be guesst andthus passed by) - note that especially on some embedded boards there is no suitable random source to satisfy this criteria,a good random generator is a prerequeisite to using SSP. The issue of local variables is addressed by compile time movingof local variables to safe positions and fixing up references. This is done in an intermediate compilation stage in RTL codeand is thus platform and archi independant (gcc patch [?]).
The method used by SSP is not a guaranteed method so it can’t catch everything, though if your coding style take theinherent limitations of SSP into account then it should be posible to cover most of the potentialy hazardous cases.
The limitations of SSP listed on it’s home-page are:
• If a structure includes both a pointer variable and a character array, the pointer can’t be protected, because changingthe order of structure elements is prohibited.
• There is another limitation on keeping pointer variables safe. It is when an argument is declared as a variableargument, which is used by a function with a varying number of arguments of varying types. The usage of pointervariables can’t be determined at compilation time, but it can be determined only during execution.
• Dynamically allocated character array
• The function that calls a trampoline code
2.3.1 Usage
download gcc-3.3.2 from ftp://ftp.gnu.org/gnu/gcc/gcc-3.3.2.tar.gz along with the ssp patch gcc-3.3.2-bgcc-3.3.2.pat.bz2from [?]. The procedure for patching and building of gcc is well documented at http://www.research.ibm.com/trl/projects/security/ssp/.
To compile code with stack protection use -fstack-protector or set STACK PROTECTOR in your environment, then thepatched gcc will use stack protection by default. Also check the web-page for packages that are known not to build withstack protection (there atleast were a few in RedHat 6.2)
To make the stack protection really take effect it is necessary to rebuild the core libraries of the system - including glibc -check the ssp page for instructions how to patch rpms to use ssp.
Note that with a few manual fixups of failed hunks bgcc and ssp patches can be applied to gcc (tested only with gcc-3.4.4though). With both enhancments together this compile should be able to catch a large number of typical applicationerrors.
2.4 ltrace
ltrace, discussed later, can also help in locating memory leaks simply by checking the calls to malloc and frinds duringexecution. But memory-leak detection is not the prime functionality of ltrace.

2.5 njamd
njamd is a malloc debugger - well it calls it selfe ”Not Just Another Malloc Debugger” but that is its prime usage - forPOSIX systems.
njamd is an example of using library prelaod techniques, discussed later on, is libnjamd, which is a malloc debuggerimplemented as preloadable library which ”wraps” the normal libc memory allocation library:
void *calloc(size_t nmemb, size_t size);void *malloc(size_t size);void free(void *ptr);void *realloc(void *ptr, size_t size);
The basic interface consists of a preloaded library and some environment variables to control its behavior, in additionissuing signal SIGUSR1 will dump memory leak information when running under control of gdb. These memory usagediagnostics dumped to standard error are fairly human readable and allow quick pinpointing of problems.
njamd also commes with a nice utility called njamdpm that allows to do postmortem heap analysis. For more on njamdread up at [?].
2.5.1 using njamd
To use njamd you need to build and install it, which ran out of the box for me with the cvs download version. We needan application with some memory leaks and a segfault - so here is the modified hello.
#include <stdlib.h> /* getenv */#include <stdio.h>main(){char *junk;char *junk2;junk = (char *)malloc(6);junk2 = (char *)malloc(32);sprintf(junk,"123456");free(junk);return 0;
}
As the string ”123456” is seven chars long the malloc’ed junk is too small, this will segfault. Calling it with libnjamd.sopreloaded not only catches the segfault, but displays memory leak information
root@rtl14:~# LD_PRELOAD=libnjamd.so ./hello
Segmentation fault (caught by NJAMD)
NJAMD: Cause of fault: Access to protected regionOffending Pointer: 0x402c4000called from ./hello(malloc+0x184)[0x8048478]called from /lib/libc.so.6(__libc_start_main+0xc6)[0x40054d06]called from ./hello(free+0x4d)[0x8048371]
0x402c3ffa-0x402c3fff: Alligned length 6Allocation callstack:
called from ./hello(malloc+0x15e)[0x8048452]called from /lib/libc.so.6(__libc_start_main+0xc6)[0x40054d06]

called from ./hello(free+0x4d)[0x8048371]Not Freed
NJAMD totals:
Allocation totals: 2 total, 2 leakedLeaked User Memory: 38 bytesPeak User Memory: 38 bytesNJAMD Overhead at user peak: 7.963 kBPeak NJAMD Overhead: 7.963 kBAverage NJAMD Overhead: 3.981 kB per allocAddress space used: 16.000 kBNJAMD Overhead at exit: 7.963 kB
0x402c3ffa-0x402c3fff: Alligned length 6Allocation callstack:
called from ./hello(malloc+0x15e)[0x8048452]called from /lib/libc.so.6(__libc_start_main+0xc6)[0x40054d06]called from ./hello(free+0x4d)[0x8048371]Not Freed
0x402c5fe0-0x402c5fff: Alligned length 32Allocation callstack:
called from ./hello(malloc+0x16e)[0x8048462]called from /lib/libc.so.6(__libc_start_main+0xc6)[0x40054d06]called from ./hello(free+0x4d)[0x8048371]Not Freed
Aborted
The output is dumped on exit in a fairly human readable form, atleast for the above case diagnostics of the problem aretrivial. Note that this works for stripped binaries and stripped libnjamd.so in which case it is reduced to 85k. There is acirtain runtime overhead though as the above report shows.
3 Sporadic Segfaults
We start out with a deterministic segfault:
rtl14:~ # cat segfault.c
#include <stdio.h>main(){
char *junk=NULL;sprintf(junk,"my segfault");printf("%s\n",junk);return 0;
}
rtl14:~ # cc segfault.c -o segfaultrtl14:~ # ./segfaultSegmentation fault
So this little program works just as expected - but if this were in the mitdde of your application server and it only happensonce ever few days on the target board and is not reproducible - what do you do ?

3.1 catchsegv
catchsegv is a shell script - nothing realy fancy - what this does is use the libSegFault.so that is available in glibc bydefault. libSegFault is used by preloading it - more on that below.
rtl14:~ # catchsegv ./segfault*** Segmentation faultRegister dump:
EAX: 00000073 EBX: 4015ed24 ECX: 03ffffff EDX: 00000000ESI: 00000000 EDI: bffff820 EBP: bffff168 ESP: bffff130
EIP: 4009f4a2 EFLAGS: 00010246
CS: 0023 DS: 002b ES: 002b FS: 0000 GS: 0000 SS: 002b
Trap: 0000000e Error: 00000006 OldMask: 00000000ESP/signal: bffff130 CR2: 00000000
Backtrace:/lib/libc.so.6(_IO_str_overflow+0x122)[0x4009f4a2]/lib/libc.so.6(_IO_default_xsputn+0x98)[0x4009e3d8]/lib/libc.so.6(_IO_vfprintf+0x1c6)[0x40076326]/lib/libc.so.6(vsprintf+0x8c)[0x400936bc]/lib/libc.so.6(sprintf+0x2d)[0x4008076d]??:0(main)[0x8048393]/lib/libc.so.6(__libc_start_main+0xc6)[0x40041d06]./segfault(__libc_start_main+0x59)[0x80482d1]
Memory map:
08048000-08049000 r-xp 00000000 03:02 3965059 /root/segfault08049000-0804a000 rw-p 00000000 03:02 3965059 /root/segfault0804a000-0804e000 rwxp 00000000 00:00 040000000-40015000 r-xp 00000000 03:02 655389 /lib/ld-2.3.2.so40015000-40016000 rw-p 00014000 03:02 655389 /lib/ld-2.3.2.so40016000-40019000 r-xp 00000000 03:02 655388 /lib/libSegFault.so40019000-4001a000 rw-p 00002000 03:02 655388 /lib/libSegFault.so4002b000-4002c000 rw-p 00000000 00:00 04002c000-4015b000 r-xp 00000000 03:02 655392 /lib/libc-2.3.2.so4015b000-40160000 rw-p 0012f000 03:02 655392 /lib/libc-2.3.2.so40160000-40162000 rw-p 00000000 00:00 0bfffe000-c0000000 rwxp fffff000 00:00 0
Lets verify the results by using gdb on the same segfault.
rtl14:~ # gdb ./segfaultGNU gdb 5.3Copyright 2002 Free Software Foundation, Inc.GDB is free software, covered by the GNU General Public License, and you arewelcome to change it and/or distribute copies of it under certain conditions.Type "show copying" to see the conditions.There is absolutely no warranty for GDB. Type "show warranty" for details.This GDB was configured as "i386-slackware-linux"...

(gdb) runStarting program: /root/segfault
Program received signal SIGSEGV, Segmentation fault.0x4009a4a2 in _IO_str_overflow_internal () from /lib/libc.so.6(gdb) bt#0 0x4009a4a2 in _IO_str_overflow_internal () from /lib/libc.so.6#1 0x400993d8 in _IO_default_xsputn_internal () from /lib/libc.so.6#2 0x40071326 in vfprintf () from /lib/libc.so.6#3 0x4008e6bc in vsprintf () from /lib/libc.so.6#4 0x4007b76d in sprintf () from /lib/libc.so.6#5 0x08048425 in main () at segfault.c:4#6 0x4003cd06 in __libc_start_main () from /lib/libc.so.6(gdb) quitThe program is running. Exit anyway? (y or n)
So we can get the same infomation from the backtrace in gdb or from the dump that catchsegfault produced - just thatlibSegFault.so is only a few kB.
-rwxr-xr-x 1 root root 14616 May 19 2003 /lib/libSegFault.so*
Building for the chroot environment:
The makefile is not very elegant as all the cross build related entries are hard coded - but for segfaulting this should do:
ALL: segfault
CROSS:=i386-linuxCC:=$(CROSS)-gccSTRIP:=$(CROSS)-stripC_FLAGS:= -Wall -Os -march=i386INCLUDE:=-I/opt/ecdk-0.1-i386/i386/include/LD_FLAGS:=-Wl,-rpath,/libSTRIP_FLAGS:=-s --remove-section=.note --remove-section=.comment hello hello.o
segfault: segfault.c$(CC) $(C_FLAGS) $(INCLUDE) -c segfault.c -o segfault.o$(CC) $(LD_FLAGS) -o segfault segfault.o$(STRIP) $(STRIP_FLAGS) segfault
clean:rm -f *.o segfault
Note that we are going to trace a stipped file - so this is what you typically want to be able to do on an embedded system- trace some striped executable without the need to actually modify it or provide any large tool-chain.
what catchsegv ./segfault actually is doing is loading libsegfault.so so you can achive the same results on an embeddedsystem by doing
# export LD_PRELOAD=${LD_PRELOAD:+${LD_PRELOAD}:}/lib/libSegFault.so# export SEGFAULT_USE_ALTSTACK=1# export SEGFAULT_OUTPUT_NAME=/tmp/segfault.trace
in case you don’t have any other preloaded libs the folowing is sufficient
# export LD_PRELOAD=/lib/libSegFault.so

back to the embedded fs again (don’t have bash on it so we need to set the shell in our current session befor changerooting again).
root@rtl14:~# export SHELL=/bin/ashroot@rtl14:~# chroot /opt/ecdk-0.1-i386/i386/dev_fs/
BusyBox v0.60.5 (2003.12.05-18:55+0000) Built-in shell (ash)Enter ’help’ for a list of built-in commands.
# export LD_PRELOAD=/lib/libSegFault.so# export SEGFAULT_USE_ALTSTACK=1# export SEGFAULT_OUTPUT_NAME=/tmp/segfault.trace# cd /tmp# lshello segfault# ./segfaultSegmentation fault# lshello segfault segfault.trace# cat segfault.trace*** Segmentation faultRegister dump:
EAX: 00000000 EBX: 4012eb90 ECX: 03ffffff EDX: 00000073ESI: bffff80c EDI: 00000000 EBP: bffff17c ESP: bffff154
EIP: 40083d64 EFLAGS: 00010246
CS: 0023 DS: 002b ES: 002b FS: 0000 GS: 0000 SS: 002b
Trap: 0000000e Error: 00000006 OldMask: 00000000ESP/signal: bffff154 CR2: 00000000
Backtrace:/lib/libc.so.6(_IO_str_overflow+0x13c)[0x40083d64]/lib/libc.so.6(_IO_default_xsputn+0xab)[0x40082ec7]/lib/libc.so.6(_IO_vfprintf+0x1f3)[0x40062d5f]/lib/libc.so.6(vsprintf+0x63)[0x4007ab6b]/lib/libc.so.6(sprintf+0x25)[0x4006b91d]./segfault[0x8048429]/lib/libc.so.6(__libc_start_main+0xbb)[0x4003216f]./segfault(__libc_start_main+0x51)[0x8048365]# exit
note that there is no memory map dump on the embedded fs which is due to a problem in libSegFault when cross compilingif you find a solution to this littl glitch let me know. The essential information though is that we can pinpoint sprintfasthe cause for the segfault.
libSegFault.so can not only be preloaded for an individual application (actually the LD PRELOAD is active for a givenshell session) but can be put into the file /etc/ld.so.preload to be active on a system scope - if this is done - don’t forgetto define an appropriate output file.
Non-exhaustive tests showed no performance penalty for using libSegFault - so this might well be a generally recommendableway of ensuring that sporadic segfaults can be traced.
3.2 core dumps
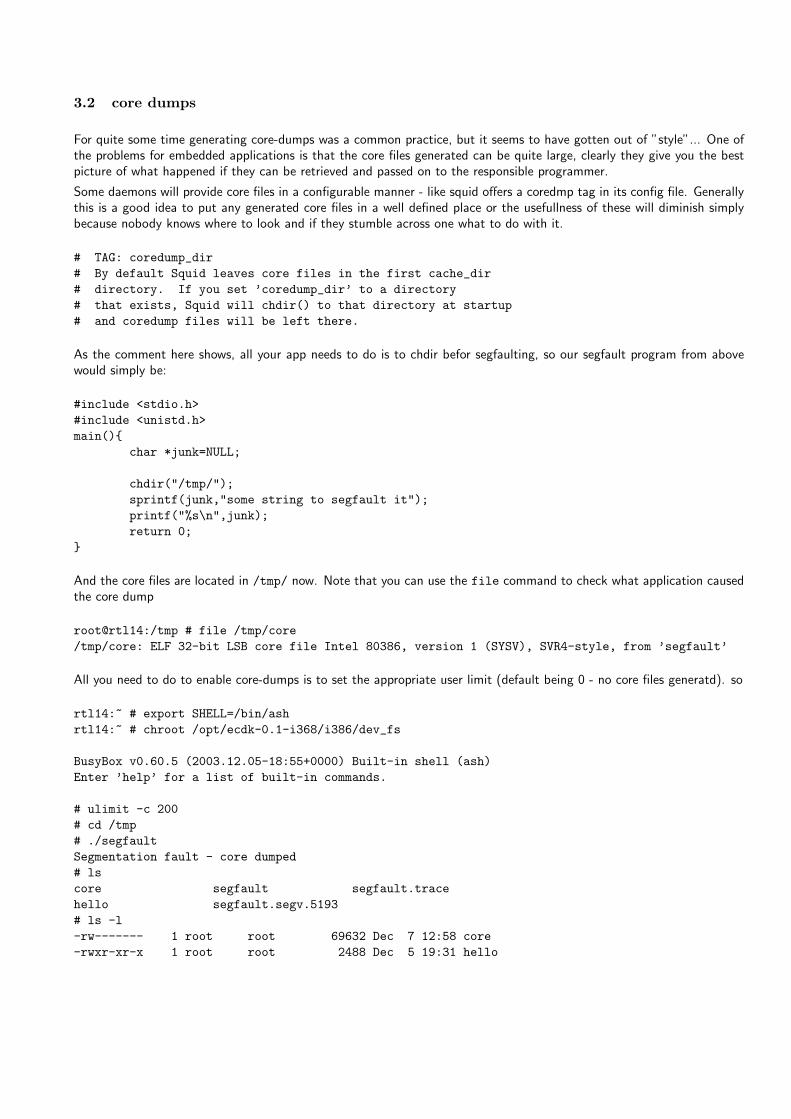
For quite some time generating core-dumps was a common practice, but it seems to have gotten out of ”style”... One ofthe problems for embedded applications is that the core files generated can be quite large, clearly they give you the bestpicture of what happened if they can be retrieved and passed on to the responsible programmer.
Some daemons will provide core files in a configurable manner - like squid offers a coredmp tag in its config file. Generallythis is a good idea to put any generated core files in a well defined place or the usefullness of these will diminish simplybecause nobody knows where to look and if they stumble across one what to do with it.
# TAG: coredump_dir# By default Squid leaves core files in the first cache_dir# directory. If you set ’coredump_dir’ to a directory# that exists, Squid will chdir() to that directory at startup# and coredump files will be left there.
As the comment here shows, all your app needs to do is to chdir befor segfaulting, so our segfault program from abovewould simply be:
#include <stdio.h>#include <unistd.h>main(){
char *junk=NULL;
chdir("/tmp/");sprintf(junk,"some string to segfault it");printf("%s\n",junk);return 0;
}
And the core files are located in /tmp/ now. Note that you can use the file command to check what application causedthe core dump
root@rtl14:/tmp # file /tmp/core/tmp/core: ELF 32-bit LSB core file Intel 80386, version 1 (SYSV), SVR4-style, from ’segfault’
All you need to do to enable core-dumps is to set the appropriate user limit (default being 0 - no core files generatd). so
rtl14:~ # export SHELL=/bin/ashrtl14:~ # chroot /opt/ecdk-0.1-i368/i386/dev_fs
BusyBox v0.60.5 (2003.12.05-18:55+0000) Built-in shell (ash)Enter ’help’ for a list of built-in commands.
# ulimit -c 200# cd /tmp# ./segfaultSegmentation fault - core dumped# lscore segfault segfault.tracehello segfault.segv.5193# ls -l-rw------- 1 root root 69632 Dec 7 12:58 core-rwxr-xr-x 1 root root 2488 Dec 5 19:31 hello

-rwxr-xr-x 1 root root 2568 Dec 5 19:38 segfault-rw-r--r-- 1 root root 723 Dec 6 09:34 segfault.trace# exit
Note that the ulimit unit is 1k by default, so the core file was limited to 200k, as can be seen the core file of the segfaultevent for this trivial case is about two orders larger than what libSegFault produced. So for some systems core files maybe inacceptable. Not also that the limit set with ulimit is a hard limit so in case the core file exceeds this size you simplyget no usefull core file resulting most likely in no usefull diagnostics.
root@rtl14:~ # ulimit -c 20root@rtl14:~ # ./segfaultSegmentation fault (core dumped)root@rtl14:~ # ls -l core-rw------- 1 root root 20480 Dec 7 14:20 coreroot@rtl14:~ # gdb --core coreGNU gdb 5.3Copyright 2002 Free Software Foundation, Inc.GDB is free software, covered by the GNU General Public License, and you arewelcome to change it and/or distribute copies of it under certain conditions.Type "show copying" to see the conditions.There is absolutely no warranty for GDB. Type "show warranty" for details.This GDB was configured as "i386-slackware-linux".Core was generated by ‘./segfault’.Program terminated with signal 11, Segmentation fault.#0 0x4009a4a2 in ?? ()(gdb) bt#0 0x4009a4a2 in ?? ()Cannot access memory at address 0xbffff1a8(gdb)
Here we could extract no more from the core file than the fact that the termination was due to a segmentation fault.
3.3 Core file names
The default in GNU/Linux is to name core file core, other UNIX flavors allow to configure the name (i.e. via sysctl inBSD), in Linux the core file base name can be set via sysctl and in addition the pid can be added
root@rtl14:/proc/sys/kernel# cat core_uses_pid0root@rtl14:/proc/sys/kernel# cat core_patterncore
The default being to not append the pid.
root@rtl14:~# echo 1 > /proc/sys/kernel/core_uses_pidroot@rtl14:~# ./segfaultSegmentation fault (core dumped)root@rtl14:~# ls -l core.*-rw------- 1 root root 53248 Dec 7 15:46 core.17193root@rtl14:~#
This does not realy help much unless you record all PIDs when launching applications... A more elaborate patch is availablethough and for distributed embedded systems and clusters this is quite interesting.

Format Description%P process ID, pid%U user ID, uid%N commandline name of the process%H hostname%% A ”%”
The Patch by Michael Sinz provides the following format options :
Table : Format options available in the coredump-file-control patch
sysctl -w ”kernel.core name format=/coredumps/
echo "/coredumps/%U/%N-%P.core" > /proc/sys/kernel/core_name_format
putting the core files in user specific directories like
/coredumps/root/segfault-8023.core
In the mainstream 2.6.X kernel tree this functionality has been more or less included with some slight changes (not sur ifbased on Michael Sinz patch or not - if you do know pleas drop me a note). So for 2.6.X use the following format stringsfor core dumps file name configuration:
• %p:add the process id (pid) of the process - note that the old flag of core ises pid is still suppored. So if core patterndoes not include a %p (as is the default) and core uses pid is set, then .pid will be appended.
• %u:add the user id (uid) (note this is not the effective uid!)
• %g:add the group id (gid)
• %s:add the singal number that caused the core dump
• %t:add a timestamp into the file name - this is tv.tv sec as returned from gettimeofday().
• %h:add the hostname
• %e:add the executable name
Note that there is a 64 byte limit on the extension name - if longer it is simply truncated. It is also posible to specify aliteral % in the core filename patern with a double % - no idea what that might be good for...
3.4 debuging core files
After generating a core file in the embedded filesystem located at /opt/ecdk-0.1-i386/i386/dev fs/ in my case, thiscore file is analyzed with gdb.

rtl14:~ # cd /opt/ecdk-0.1-i386/i386/dev_fs/rtl14:~ # gdbGNU gdb 5.3Copyright 2002 Free Software Foundation, Inc.GDB is free software, covered by the GNU General Public License, and you arewelcome to change it and/or distribute copies of it under certain conditions.Type "show copying" to see the conditions.There is absolutely no warranty for GDB. Type "show warranty" for details.This GDB was configured as "i386-slackware-linux".(gdb) set solib-absolute-prefix /opt/ecdk-0.1-i386/i386/dev_fs/(gdb) file /usr/src/dev_kit/test/segfaultReading symbols from /usr/src/dev_kit/test/segfault...(no debugging symbols found)...done.(gdb) target core tmp/coreCore was generated by ‘./segfault’.Program terminated with signal 11, Segmentation fault.Reading symbols from /opt/ecdk-0.1-i386/i386/dev_fs/lib/libc.so.6...done.Loaded symbols for /opt/ecdk-0.1-i386/i386/dev_fs/lib/libc.so.6Reading symbols from /opt/ecdk-0.1-i386/i386/dev_fs/lib/ld-linux.so.2...done.Loaded symbols for /opt/ecdk-0.1-i386/i386/dev_fs/lib/ld-linux.so.2#0 0x4007fd64 in _IO_str_overflow (fp=0xbffff87c, c=115) at strops.c:178178 *fp->_IO_write_ptr++ = (unsigned char) c;(gdb) bt#0 0x4007fd64 in _IO_str_overflow (fp=0xbffff87c, c=115) at strops.c:178#1 0x4007eec7 in _IO_default_xsputn (f=0xbffff87c, data=0x8048490, n=26)
at genops.c:466#2 0x4005ed5f in _IO_vfprintf (s=0xbffff87c,
format=0x8048490 "some string to segfault it", ap=0xbffff95c)at vfprintf.c:1307
#3 0x40076b6b in _IO_vsprintf (string=0x0,format=0x8048490 "some string to segfault it", args=0xbffff95c)at iovsprintf.c:46
#4 0x4006791d in sprintf (s=0x0,format=0x8048490 "some string to segfault it") at sprintf.c:38
#5 0x08048429 in sprintf () at sprintf.c:37#6 0x4002e16f in __libc_start_main (main=0x8048414 <sprintf+224>, argc=1,
ubp_av=0xbffff9d4, init=0x80482bc, fini=0x804846c <sprintf+312>,rtld_fini=0x40009cf0 <_dl_fini>, stack_end=0xbffff9cc)at ../sysdeps/generic/libc-start.c:129
(gdb)
the procedure is no different if we would have a ”real” cross-debug session, in this case its i368 on a i686. If you copythe core files from the target system to your local host system then you must make sure you have a identical filesystemstructure and the same library versions etc. or your results may be garbage. Unfortunately it is not so that you getNO results just because you use wrong libs ! if you run the above session without the set solib-absolute-prefixcommand gdb will silently use the host libs and may point you in a totally wrong diretion.
4 Performance issues
Linux user-land is designed for desk-top setups, there are a number of problems for embedded systems when transferingdes-top apps to embedded environments. Some of the key issues are:
• too many options

• too much processing spent for pritty output
• testing for many different setups and default config files
• rich feture set not needed on embedded systems
These issues arise basically because most embedded console interfaces are not designed around the assumption thatsomeone is going to sit there 8 hours a day, but they are for system maintenance and inspection on errors only. UNIXitselfe has a large set of redundant functionality, just thinkg of dropping a file to screen, you can use cat, more, tail,sort, grep and even dd..., so the first step is to eliminate redundancy on the application layer. The next step is to locatepoisble perfromance bottle necks that can be induced by rarely run applications. Just think of putting top on a systemfor monitoring, this well can produce a system load that is problematic, even on a PI 200 MHz top can consume 5-10%of the CPU !
Locating performance problems requires:
• resolve details of library dependancies
• check system call usage
• profile application internal calls
Once this has been done one has a set of potential hot-spots in the code and then can go on to explicidly tracing theseevents.
4.1 ltrace
ltrace can help you locate application bottlenecks - basically what you would want to do is build your application usingstandard libraries - but after that you analyze it to see where most of the time is spent.
root@rtl14:~/junk# ltrace -c -ttt ls -ltotal 0-rw-r--r-- 1 root root 0 Dec 9 16:55 a-rw-r--r-- 1 root root 0 Dec 9 16:55 b-rw-r--r-- 1 root root 0 Dec 9 16:55 c% time seconds usecs/call calls function------ ----------- ----------- --------- --------------------22.16 0.000787 787 1 getpwuid11.71 0.000416 9 43 strlen6.14 0.000218 43 5 __overflow
...0.34 0.000012 12 1 __cxa_atexit0.31 0.000011 11 1 strncmp
------ ----------- ----------- --------- --------------------100.00 0.003552 173 totalroot@rtl14:~/junk#
This trace could suggest that we should pay attention to the optimization of strlen and getpwuid, but one needs to becarfull with such analysis as it may be very dependant on the specific data set an application is to process. Looking at asecond trace output would lead to posibly totally different results.
root@rtl14:/usr/src/dev_kit/src/ltrace-0.3.31# ./ltrace -c -ttt lsBUGS configure elf.h options.oCOPYING configure.in elf.o output.c...<snip>

config.status display_args.o options.c wait_for_something.cconfig.sub elf.c options.h wait_for_something.o% time seconds usecs/call calls function------ ----------- ----------- --------- --------------------35.85 0.011869 11869 1 qsort16.03 0.005307 10 496 __errno_location11.52 0.003814 9 384 __ctype_get_mb_cur_max9.30 0.003079 10 300 strcoll
...<snip>0.04 0.000014 14 1 __fpending0.04 0.000013 13 1 _setjmp
------ ----------- ----------- --------- --------------------100.00 0.033106 2009 totalroot@rtl14:/usr/src/dev_kit/src/ltrace-0.3.31#
This trace would show that the greatest optimisation could be achived with qsort improvment (...which will not be easy toachive though). The real consequence for an embedded system would be to review if sorting the output is realy necessary- in case of ls this might not be the case so we could alias ls to ls -f, instructing ls to produce output in the orderthey are stored on disk.
root@rtl14:/usr/src/dev_kit/src/ltrace-0.3.31# ./ltrace -c -ttt ls -f. config.sub options.c options.o.. debian options.h elf.oetc defs.h process_event.c output.o...<snip>install-sh ltrace.h ltrace.owait_for_something.c proc.c Makefile% time seconds usecs/call calls function------ ----------- ----------- --------- --------------------25.15 0.003836 9 396 __ctype_get_mb_cur_max19.21 0.002930 11 256 __overflow14.16 0.002160 10 202 __errno_location
...<snip>0.13 0.000020 20 1 closedir0.10 0.000015 15 1 __fpending0.09 0.000013 13 1 __cxa_atexit
------ ----------- ----------- --------- --------------------100.00 0.015255 1438 totalroot@rtl14:/usr/src/dev_kit/src/ltrace-0.3.31#
This is a prinzipal problem of bottle-netck detection, it generally is not posible to optimize for all cases of posible data sets.In embedded systems one often has a fairly well defined set of processing tasks to do allowsing to optimize for a specificdata set, so optimization beond what is posible for the general case is posible and ltrace can guide you to the pointwhere to start optimizing. Furthermore, as this simple examples with ls shows, not all tools designed for convenience ondesk-top systems, are realy that suited for embedded systems, so in many cases ltrace can lead to simple to implementimprovments.
It is important to note though that one may not simply read the numbers in ltrace and belive that the ls -l realytakes that long. The output of ltrace must be read as relative values, so we can see what librarycall took the most time, but not realy how long it took. To put this relative values into context,run the commands with time prepended.
root@rtl14: # time /usr/src/dev_kit/src/strace/strace -c -ttt ls -l...<snip>real 0m0.010s

user 0m0.004ssys 0m0.005sroot@rtl14: # time ls -lt...<snip>real 0m0.006suser 0m0.003ssys 0m0.001s
This shows the sitortion due to tracing with ltrace, naturally as this is a very non-deterministicsystem you would have to run this a few times to get any usable results and generally for very shortexecution times results always will be very inaccurate. What one *can* extract from ltrace preciselyis in what library functions you want to posibly optimize, or maby reimplement in your applicationcode for a less general case.
4.2 strace
Applications are spending there time in libraries, system calls, and in applicatoin code, what wesaw above was how to locate library bottle necks. Next we want to see details of the time spent inkernel mode:
root@rtl14:~# strace -c -tt ./hello12:03:37.368036 execve("./hello", ["./hello"], [/* 35 vars */]) = 0% time seconds usecs/call calls errors syscall------ ----------- ----------- --------- --------- ----------------94.27 0.009598 1600 6 2 open3.72 0.000379 42 9 writev
...snip...0.01 0.000001 1 1 sigaltstack0.00 0.000000 0 1 getpid
------ ----------- ----------- --------- --------- ----------------100.00 0.010181 58 1 totalroot@rtl14:~#
The output of strace not only shows the number of system calls but also the timespent per system call,so bottle necks can be located and especially system calls that are returning with error codes, whichcan result in error processing overhead and, if these errors don’t alter the intended behavior, indicateobviously useless code (in the above case the two opens failed on /etc/ld.so.cache and /etc/ld.so.preload).
This can be combined with time to achive an overview
root@rtl14:~ # time strace -tt -c ./helloroot@rtl14:~# time strace -tt -c ./hello12:28:59.320956 execve("./hello", ["./hello"], [/* 31 vars */]) = 0% time seconds usecs/call calls errors syscall------ ----------- ----------- --------- --------- ----------------32.69 0.000017 6 3 1 open25.00 0.000013 3 5 old_mmap
...snip...5.77 0.000003 2 2 fstat643.85 0.000002 1 2 close
------ ----------- ----------- --------- --------- ----------------100.00 0.000052 16 1 total
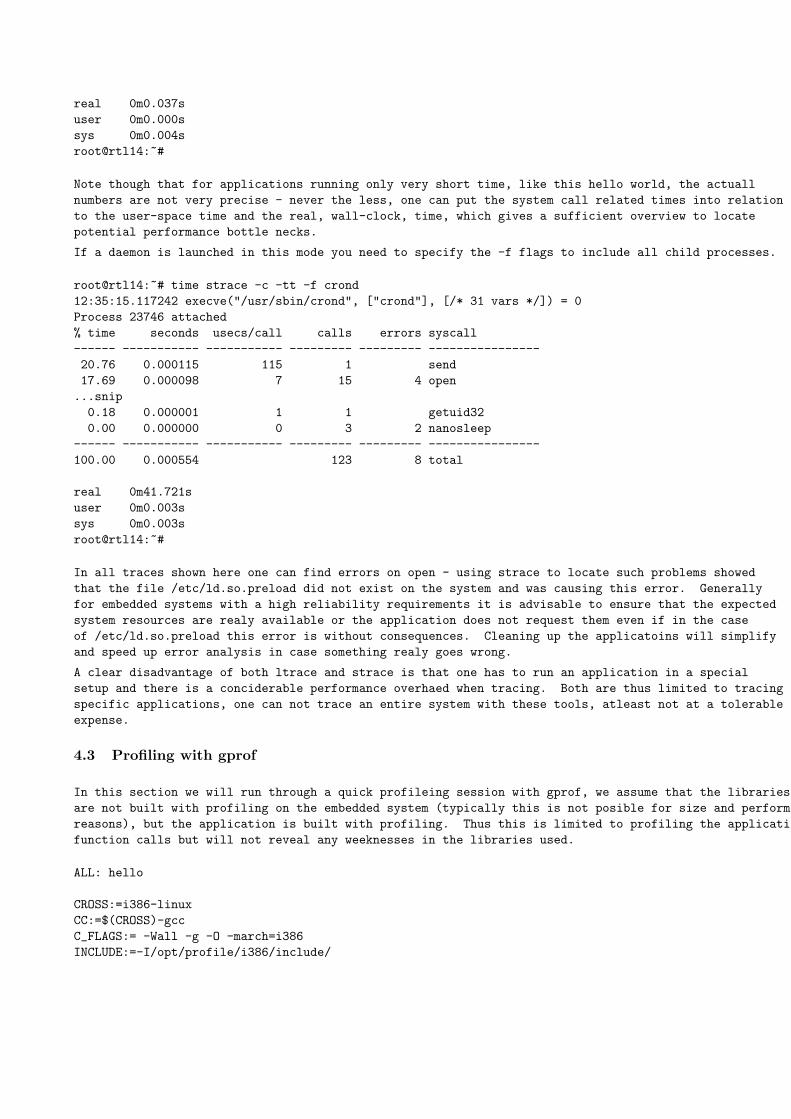
real 0m0.037suser 0m0.000ssys 0m0.004sroot@rtl14:~#
Note though that for applications running only very short time, like this hello world, the actuallnumbers are not very precise - never the less, one can put the system call related times into relationto the user-space time and the real, wall-clock, time, which gives a sufficient overview to locatepotential performance bottle necks.
If a daemon is launched in this mode you need to specify the -f flags to include all child processes.
root@rtl14:~# time strace -c -tt -f crond12:35:15.117242 execve("/usr/sbin/crond", ["crond"], [/* 31 vars */]) = 0Process 23746 attached% time seconds usecs/call calls errors syscall------ ----------- ----------- --------- --------- ----------------20.76 0.000115 115 1 send17.69 0.000098 7 15 4 open
...snip0.18 0.000001 1 1 getuid320.00 0.000000 0 3 2 nanosleep
------ ----------- ----------- --------- --------- ----------------100.00 0.000554 123 8 total
real 0m41.721suser 0m0.003ssys 0m0.003sroot@rtl14:~#
In all traces shown here one can find errors on open - using strace to locate such problems showedthat the file /etc/ld.so.preload did not exist on the system and was causing this error. Generallyfor embedded systems with a high reliability requirements it is advisable to ensure that the expectedsystem resources are realy available or the application does not request them even if in the caseof /etc/ld.so.preload this error is without consequences. Cleaning up the applicatoins will simplifyand speed up error analysis in case something realy goes wrong.
A clear disadvantage of both ltrace and strace is that one has to run an application in a specialsetup and there is a conciderable performance overhaed when tracing. Both are thus limited to tracingspecific applications, one can not trace an entire system with these tools, atleast not at a tolerableexpense.
4.3 Profiling with gprof
In this section we will run through a quick profileing session with gprof, we assume that the librariesare not built with profiling on the embedded system (typically this is not posible for size and performancereasons), but the application is built with profiling. Thus this is limited to profiling the applicationfunction calls but will not reveal any weeknesses in the libraries used.
ALL: hello
CROSS:=i386-linuxCC:=$(CROSS)-gccC_FLAGS:= -Wall -g -O -march=i386INCLUDE:=-I/opt/profile/i386/include/

LD_FLAGS:=-Wl,-rpath,/lib
hello: hello.c$(CC) $(C_FLAGS) $(INCLUDE) -c hello.c -o hello.o -pg$(CC) $(LD_FLAGS) -o hello hello.o -pg
clean:rm -f *.o hello
The application it selfe has nothing special in it - just a call to ”something” in our case.
#include <stdio.h>
int something (void){printf("doing something\n");return 0;
}
int main(int argc, char **argv){something();printf("dev_kit check\n");return 0;
}
4.3.1 usage of gprof
compile with -pg (limited to -static if libs were not compiled with -pg)
gcc -static -v -g -pg app.c -o app
If one has application libraries one can compile these specific libs with profiling, but compiling all system libraries withprofiling for a embedded target is somewhat problematic. For development this might be ok, but as we are interested inruntime debugging we assume here that shared libs are not compiled with profiling. Note that in some cases it may betolerable to compile the application with static libs once one indentified the application that is causing problems.
As an example of how bad this is - the above hello.c compiled with -static...
-rwxr-xr-x 1 root root 1560675 Jan 14 09:14 hello*
were as profiling of only the application code leads to a moderately increased filesize which is generally tolerable.
-rwxr-xr-x 1 root root 36145 Jan 14 09:16 hello*
running hello, described in the previous section, will log the output in gmon.out (default file name, which *can’t* bechanged, and an exiting file will be overwritten if it is in the working directory of the process).
reading with gprof which is part of the binutils package will generate the flat profile and a call graph (default settings).
Flat profile:Each sample counts as 0.000999001 seconds.no time accumulated
% cumulative self self totaltime seconds seconds calls Ts/call Ts/call name0.00 0.00 0.00 1 0.00 0.00 something

The call graph reveals cal depth and also allows better location of circumstances under which excessive execution timehad been reached.
Call graph (explanation follows)
granularity: each sample hit covers 4 byte(s) no time propagated
index % time self children called name0.00 0.00 1/1 main [14]
[1] 0.0 0.00 0.00 1 something [1]-----------------------------------------------
4.3.2 drawback
• Mention the function call overhead introduced by -pg
• libs must be compiled with -pg or -static.
• libs and code are substantially larger
• better suited for developement that for runtime testing
4.4 Code coverage with gcov
Using the above example hello.c file again, we compile it with:
gcc -fprofile-arcs -ftest-coverage hello.c -o hello
The fairly small data files compared to gprof and also the low impact on the executable size make this very usefull forlocating hot-spots in embedded applications.
-rwxr-xr-x 1 root root 15405 Jan 14 09:12 hello*-rw-r--r-- 1 root root 108 Jan 14 09:12 hello.bb-rw-r--r-- 1 root root 156 Jan 14 09:12 hello.bbg-rw-r--r-- 1 root root 174 Jan 14 07:44 hello.c-rw-r--r-- 1 root root 48 Jan 14 09:12 hello.da-rw-r--r-- 1 root root 11192 Jan 14 09:02 hello.o
4.4.1 generating reports
reports can be generated from data and source - no access to binary necessary.
root@rtl14:/usr/src/dev_kit/test# gcov -b hello.c100.00% of 7 source lines executed in file hello.cNo branches in file hello.c100.00% of 3 calls executed in file hello.cCreating hello.c.gcov.
These reports allow very quick localization of dead code and of code that is executed very frequently, thus a good placeto concider for optimization and profiling.
1 int something (void){1 printf("doing something\n");

call 0 returns = 100%1 return 0;
}
1 int main(int argc, char **argv){1 something();
call 0 returns = 100%1 printf("dev_kit check\n");
call 0 returns = 100%1 return 0;
}
The main issues that gcov can provide are
• code coverage
• execution path check
• execution hot spots localization
naturally gcov can only work properly if the applications are tested under circumstances that will allow gcov to revealproblems. So codecoverage requires well designed test-suits - untested branches will not be evaluated.
4.5 applogger
On embedded systems one often has the problem that one does not have the sources for a given application available orthat one can’t easaly modify them, so methods that allow tracing the installed binaries are convenient. One such methodis to use the preload capability of GNU glibc and plug in a littl logger library that can dump information - in our case viathe heavy weight syslog call.
The folowing example is based on a post by Jeffrey Streifling on the web - I unfortunately did not save the URL so I can’tgive full reference here. What this is doing here is quite cruel and can’t be recommended for any realy system, but to keepthe example short...
This file is compiled into a library and then preloaded via the export LD PRELOAD= shell command. From then on allapplications launched from this shell will cause a syslog entry when they make a libc call to open.G
/** Written by Der Herr Hofrat, <[email protected]>* Copyright (C) 2003 OpenTech EDV Research GmbH* License: GPL Version 2*/
/** Compile as shared library with:* gcc -fPIC -Wall -g -O2 -shared -o applogger.so.0 applogger.c -lc** Log all calls to glibc’s open function with all its parameters passed* open logfile on load of applogger lib and close on removal.** The libraries init function is used to extract the logfile name in the* environment and open the file, the exit method closes the file.*/
#include <stdio.h>#include <unistd.h>#include <sys/types.h>

#include <stdlib.h>
#define _FCNTL_H#include <bits/fcntl.h>
extern int __open(const char *pathname, int flags, mode_t mode);
/* initialize and cleanup logfile(s) on load/unload of lib */void __applogger_init(void) __attribute((constructor));void __applogger_exit(void) __attribute((destructor));
FILE *logfile;char default_fname[]="/tmp/applogger";char *logfile_name;
void __applogger_init(void){
if ((logfile_name = getenv("APPLOG_FILE")) != 0) {printf("using %s\n",logfile_name);
} else {logfile_name=default_fname;
printf("using %s (not APPLOG_FILE set in environment)\n",logfile_name);}
if((logfile=fopen(logfile_name,"a+")) == NULL ){perror("Cannot open logfile\n");exit(-1);}}
void __applogger_exit(void){fclose(logfile);}
/* any open called will cause a log entry */int open(const char *pathname, int flags, mode_t mode) {
fprintf(logfile,"%d: opened %s (%d,%d)\n", getpid(), pathname, flags, mode);
/* now do the real libc open */return __open(pathname, flags, mode);}
Compile this with the above noted gcc command. And either preload the libs as shown below to make them take effectfor all applications or just load them for one particular application, as shown later with njamd usage, by preceeding thecommand with the LD PRELOAD=/PATH/lib
hofrat@rtl14:~/C/libs > export LD_PRELOAD=/home/hofrat/C/libs/applogger.so.0hofrat@rtl14:~/C/libs > export APPLOG_FILE=/tmp/loghofrat@rtl14:~/C/libs > vi junk<just close the file again>hofrat@kanga:~/C/libs > cat /tmp/log

17551: opened /usr/share/terminfo/x/xterm (0,-1073751172)17551: opened junk (0,0)17551: opened .junk.swp (0,0)17551: opened .junk.swp (194,384)17551: opened .junk.swpx (0,0)17551: opened .junk.swpx (194,384)17551: opened .junk.swp (578,384)17551: opened junk (0,0)hofrat@kanga:~/C/libs > unset LD_PRELOAD
This shows that open is a bad trace point unless you are a bit more selective, and it shows that this version of vi mightbe an overkill version fro an embedded system (8 files opened/reopened for a single editor session). Also using this bruteforce approach together with a call to syslog(...) can easaly result in a syslog party on your embedded system... Theclear advantage of this method is though that no modification to the existing application is required one can trace strippedapplication binaries basically at any library call.
4.6 tracing a specific library function
As noted above gprof is somewhat limited as it requires shared libs to be compiled with -pg, making the quite large, orone needst to compile apps as static executables. Aside from the size problems on some embedded systems, both withthe gprof output files and with the profiling overhaed of the libs, this method requires source access to the libs or atleasta vendor willling to deliver profiling versions of there libs.
A limited work around is to ”profile” a library call by a preloaded lib that does nothing else but timestamp the call andreturn and log the elapsed time along with some parameters to a specified log file. This method can be applied quiteselectively and will produce fairly small log files aswell as introducing a minimum overhead, both size wise and time wise,but it requires that one has allready pinpointed the potential trouble makers first. So this is an addition to grprof/gcov,by no means a replacement.
/** Written by Der Herr Hofrat, <[email protected]>* Copyright (C) 2004 OpenTech EDV Research GmbH* License: GPL Version 2*/
/** Compile as shared library with:* gcc -fPIC -Wall -g -O2 -shared -o timestamp.so.0 timestamp.c -lc** timestamp all calls and returns to open, log elapsed time.*/
#include <stdio.h>#include <unistd.h> /* exit, gettimeofday */#include <sys/types.h>#include <stdlib.h> /* getenv */#include <sys/time.h> /* gettimeofday */#include <time.h>
#define _FCNTL_H#include <bits/fcntl.h>
extern int __open(const char *pathname, int flags, mode_t mode);
/* initialize and cleanup logfile(s) on load/unload of lib */

void __timestamp_init(void) __attribute((constructor));void __timestamp_exit(void) __attribute((destructor));
FILE *logfile;char default_fname[]="/tmp/timelog";char *logfile_name;
void __timestamp_init(void){
int verbos=0;if (getenv("TIMELOG_VERB") != 0) {
verbos=1;}
if ((logfile_name = getenv("TIMELOG_FILE")) != 0) {if(verbos)
sprintf("using %s\n",logfile_name);} else {logfile_name=default_fname;
if(verbos)printf("using %s (no TIMELOG_FILE set in env)\n",logfile_name);
}
if((logfile=fopen(logfile_name,"a+")) == NULL ){perror("Cannot open logfile\n");exit(-1);}}
void __timestamp_exit(void){fclose(logfile);}
int open(const char *pathname, int flags, mode_t mode) {
int fd;struct timeval fun_call;struct timeval fun_ret;struct timeval fun_runtime;
/* timestamp call and return */gettimeofday(&fun_call,NULL);fd = __open(pathname, flags, mode);gettimeofday(&fun_ret,NULL);
/* fix timeval usec overruns */fun_runtime.tv_sec = fun_ret.tv_sec - fun_call.tv_sec;fun_runtime.tv_usec = fun_ret.tv_usec - fun_call.tv_usec;if (fun_runtime.tv_usec < 0) {--fun_runtime.tv_sec;fun_runtime.tv_usec += 1000000;}

/* log it */fprintf(logfile,"%d: open %s (0x%x,%o,%d) in %ld us\n",getpid(),pathname,flags,mode,fd,fun_runtime.tv_usec + ( fun_runtime.tv_sec * 1000 ));
/* don’t forget to return the original functions value ;) */return fd;
}
The read write application called below is simply a open of a input file with O RDONLY and open of the output filewith O WRONLY—O TRUNC—O CREATE, and then copy the data from input to output.
hofrat@kanga:~ > unset LD_PRELOADhofrat@kanga:~ > export TIMELOG_VERB=1hofrat@kanga:~ > export LD_PRELOAD=/home/hofrat/C/libs/timestamp.so.0hofrat@kanga:~ > ./read_write<just quite the editor again>
using /tmp/timelog (no TIMELOG_FILE set in env)hofrat@kanga:~ > unset TIMELOG_VERBhofrat@kanga:~ > ./read_writehofrat@kanga:~ > tail /tmp/timelog19588: open /tmp/input (0x0,1001101560,4) in 10 us19588: open /tmp/output (0x241,644,5) in 107 us19602: open /tmp/input (0x0,1001101560,4) in 8 us19602: open /tmp/output (0x241,644,5) in 4160 us
Looking at this output - one might be supprised that the last call to open took 4 milli seconds (and this is on a PIII/800)- looking at the flags one can see open ran with O TRUNC and the output file was quite large before so that explains thelarge time. This is exactly the type of problem that is hard to locate during testing because one typically does not havethe accumulated files and long time environment like embedded applications that are runing for months or maby years andthen under some specific circumstances open the file with O TRUNC (for instance if there is too little space left on thesystem).
The nice thing about this solution though is that this type of preload ”profiling” can be added to a running system withoutthe need to modify applications or libraries that are on the system.
4.7 ltp
When writing up this summary I was unsure where to put this section, its not strictly related to runtime debuging, but itis more of a prerequisti to start with any serious runtime debuging and system profiling. The Linux Test Plan [?] providesa ”regression test” for the kernel proper. The core test components are:
• filesystem stress tests
• disk I/O tests
• memory management stress tests
• ipc stress
• scheduler tests

• commands functional varification tests
• system call functional varification tests
Especially the stress tests are of interest not only for ”normal” embedded linux but also for the different real-time variants.
Some of the featurs of interest here related to hot-spot detection are:
• Kernel Code Coverage:The Linux kernel code coverage is a kernel patch that allows to identify the areas in the kernel that are influencedmost by the LTP test-suite.
• Gcov Extension(lcov):This is basically a gcov variant that will allow corelating data collected with the test-suits run, thus simplifying theinterpretation of colected data.
• Gcov-kernel Extension:To allow judgment of the test-suite effects in the kernel proper, this code coverage extension to the linux kernel(reporting via /proc interface), allows indentifying kernel areas that were most impacted by a give LTP test.
It’s kind of out of the scope of this article to go into details - so give http://ltp.sourceforge.net/ a close look !
4.8 oprofile
For runtime profiling at a system scope the above tools will not due, locating bottle necks that might not be applicationspecific but are due to the overall system configuration requires a tool that monitors the entirety of a system. For Linuxbased embedded systems oprofile [?] allows exactly that.
For 2.4.X kernels, you must have the kernel source available for the kernel you want to run oprofile under (passed at buildtime with ./configure –with-linux=/path/to/kernel/source, make, make install). In 2.6.X oprofile is allready available inthe kernel, it just needs to be enabled (builtin or as module), and then on ecan build oprofile (./configure –with-kernel-support). Support is somwhat X86 centric (again) - but other architectures are imerging in 2.6.X. The overhead of oprofilehas been reported as low as 1-8%, mainly dependant on the interrupt load of the system. This is why it is mentioned hereas this low overhead makes it well suited for runtime debuging on deployed systems.
Oprofile allows some kernel level profiling with 2.4.X kernels, as of Linux-2.6.X it is integrated in the kernel and one shouldexpect this to become one of the main runtime monitoring tools in the future Linux kernel development.
One quote from the oprofile web-page that maby summs it all up very well:Bottlenecks occur in surprising places, so don’t try to second guess and put in a speed hack until you’ve proven that’swhere the bottleneck is. - Rob Pike
The oprofile package comes with the necessary utilities to configure and start/stop profiling at runtime:
• opcontrol - used for starting and stopping
• opreport - generate symbol-based profile summarie
• opannotate - to output annotated, mixed source or assembly output
• opgprof - generate a gprof-format profile
When using oprofile it is advisable to read the entire man-page, to avoide large loads due to profiling one must carfullyselect set-up parameters !
5 Kernel-space runtime debugging
5.1 kernel debugging
In the late 2.4.X and in the 2.6.X series of kernels a number of builtin kernel level debug featurs have been added, theseshould be used for kernel based application development befor trying to build new facilities !

Many of the bugs that can be detected by kernel debugging are typical bugs that can stay undetected for a long time.Thus one should run kernel space apps with debuging turned on befor releasing them.
Kernel hacking --->[*] Kernel debugging[ ] Check for stack overflows (NEW)[ ] Debug high memory support (NEW)[ ] Debug memory allocations (NEW)[ ] Memory mapped I/O debugging (NEW)[ ] Magic SysRq key (NEW)[ ] Spinlock debugging (NEW)[ ] Compile the kernel with frame pointers (NEW)
• Check for stack overflows:Sets: CONFIG DEBUG STACKOVERFLOWThis will make do IRQ() check for enough stack space beeing left, which typically is not the case if interrupts startstacking up endlessly (for instance if a level triggert irq is never reset). The error will be reported if the stack hasless than 1kB of free space left on it, if this is the case a stack dump is written via show stack
• Debug high memory support:Sets: CONFIG DEBUG HIGHMEMAdd error checking for high memory access - this will slow down high memory conciderably so it is only suiteableduring development, for production sysems this needs to be turned off. This will trigger an out of line bug()(2.4.x only) if kmap atomic (the IRQ safe variants) find that there is no page table entry for the requested area.kunmap atomic will force the page table entry of the this page to be cleared so that unclean reuse, that is withoutremaping it, will oops.
• Debug memory allocations:Sets: CONFIG DEBUG SLABThe two things does is
– red zuning which allows detection of
∗ write before start
∗ write past end
∗ double free
note that these things need not imediatly lead to a system crash, and thus they can stay undetected for a longtime.
– cache poisoning, which means that the memory area is filled up with a know pattern and terminated with adefined sequence, thus the history of an object can be checked.
For more detail see the section on debugging memory allocation below.
• Memory mapped I/O debugging:Sets: CONFIG DEBUG IOVIRTI/O address ranges can’t be checked for validity in general, but in some cases the kernel can detect obviously invalidaddresses, like thiose that were ioremap’ed. This debug check will be droped as it is primarily there to catch driversported from Linux-2.0.X/2.2.X which used unmapped ISA addresses.
• Magic SysRq key:Sets: CONFIG DEBUG SYSRQAllows a system that is stuck in kernel mode to be inspected by directly intercepting the keyboard input andtriggering debug functions on pressing of <CNTRL>-<PrintScrn>-<CHAR> - with the folowing being predefinedby the kernel:
– 0-9 raise/lower the log level of the system

– b reboot the system
– e send a SIG TERM to all processes via send sig all(SIGTERM)
– i send a SIG KILL to all processes via send sig all(SIGKILL)
– k secure attention key - kills all programs currently using this tty and allow kernel messages to be displayed.
– m display memory information
– p register dump
– s sync
– t status
– u remount the system read-only
For more details and examples see the section sysrq below. i
• Spinlock debugging:Sets: CONFIG DEBUG SPINLOCKCatches missing spinlock initialization by adding a spinlock magic number SPINLOCK MAGIC 0xdead4ead , whichensures that one can’t simply use some random memory location as spinlock when locking/unlocking. It also ensuresthat attmpts to unlock spin locks that are not locked will be reported via BUG().
• Compile the kernel with frame pointers:Sets: CONFIG FRAME POINTERThe kernel will be compiled without -fomit-frame-pointer, which set by default, prevents keeping the framepointer in a register for functions that don’t need one and avoids saving and restoring it. This makes debuging offunction call chain posible in gdb. Generally this should be disabled for production releases as it slows down thesystem noticably.
Additionally to the above debugging capabilities the 2.6.X series of kernels (well actually 2.6.0 for now) offer:
• Page alloc debugging:Sets: CONFIG FRAME PAGEALLOCThis performs extra checks when freeing pages with kmem cache free or kfree via cache free:
__cache_free-> cache_free_debugcheck:
-> kfree_debugcheck: verify that pointers are valid-> store_stackinfo: store
note that the comment in mm/slab.c for kfree debugcheck states:
* - detect bad pointers.* - POISON/RED_ZONE checking* - destructor calls, for caches with POISON+dtor
but the code seems to only check pointers, atleast I was not able to see how POISONING/RED ZONE checks aredone here... This should not be active on production systems as it slows down the kernel in the very sensitiv memorysubsystem.
• Compile the kernel with debug info:Sets: CONFIG DEBUG INFOIf one needs to debug the kernel using gdb one should turn this option on, it will result in a very large kernel butwill deliver usefull information in the debugger. If this option is enabled one also should turn on the above notedCONFIG FRAME POINTER.
• :Sets: CONFIG DEBUG SPINLOCK SLEEPAs sleeping with held spinlocks is generally not a good idea, this option causes many kernel functions to becommenoisy if called within held spinlocks.

5.1.1 Debug memory allocations
TODO
• mark each slab in the cache with RED MAGIC1 on call of kmem cache init objs, a BUG() will be issued if theobjects red zone is not found after poisoning the cache object.
• slab memory object initialization check, this printk’s any functions that requests status of none initialized slab cacheobjects.
• issue a BUG() in kmem cache shrink locked (called via kmem cache schrink) if a cache is schrunk while theslab is marked inuse.
• issue a BUG() if adding of a red zoned object can’t find the previous objects red zone in kmem cache alloc one tail
• check slab on freeing objects, an overrun of a cacke object must not necessarily lead to a crash of the system, andcan stay undetected for some time. These extra checks verify that the object being freed is in the bounds of theslab, that the freed object is at the end of the slab and that it is not on the free list yet.
• memory poisoning, which fills the released cache memory area up with 0x5a terminated by POISON END which is0xa5, this poison and posson end is then checked for in kmem check poison obj. Checks for cache memory poisoningare done in the folowing fuctions with the error respones indicated by ->:
– kmem slab destroy -¿ BUG()
– kmem cache create -¿ printk warning if poisoning is requested with objects that use a ctor method
– is chained kmem cache -¿ return 1 if cache is in chain, 0 otherwise. This allows sanity checkinf of caches incode by a call to is chained kmem cache
– kmem cache alloc one tail -¿ BUG()
5.1.2 using sysrq
To use Sys-Req one need to configure it at kernel compile time by enabling ’Magic SysRq key (CONFIG MAGIC SYSRQ)’when configuring the kernel. At runtime it can be switched off and on, on a kernel with SysRq compiled in, by the followingcommand:
rtl14:~ # echo "0" > /proc/sys/kernel/sysrqrtl14:~ # echo "1" > /proc/sys/kernel/sysrq
respectively.
Note that older versions disabled sysrq by default, requireing explicid enbabling at run-time, recent version have changedthis and make sysrq default on. Sysrq is also adjustable via sysctl calls (CTL KERN,KERN SYSRQ=38), thus it is easyto integrate this feature in some centralized managment level like SNMP.
The sysrq operations include the handler to execute, a help field that is displayed if an invalid sysrq is keyed in, whichthen shows a list of available system requests. The convention being to capitalize the letter used to trigger the respectivesystem reques. As there is no sysrq registered for ”y” by default on 2.6.0 systems, you should get the folowing output
<CNTRL>-<PrintScr>-<y>SysRq: HELP: loglevel0-8 reBoot tErm kIll saK showMem showPcunRaw Sync showTasks Unmount
This allows you to monitor the system at a very low level, and is an essential tool for post mortem analysis duringdevelopment, especially of kernel components like drivers.

5.1.3 adding your sysrq handler
Sysreqests are handled in drivers/char/sysrq.c, they are not dependant on any user-space application layer but directly”intercept” the keyboard driver, thus a sysrq key-sequence never reaches any normal terminal or application but is coughtby the kernel proper. This ensures that they will be honored even if the kernel has been put in a state where user-space isno longer serviced or parts of the kernel are messed up, naturally if the sysrq code it selfe was damaged, i.e. by writing tothe code area via some stray pointers, then sysrq will not help you in any way. Thus this is an improvment over user-spaceapplication control but it can’t guarantee that a system will be responsive.
That said - on to setting up a sysrq handler for a kernel space application. Define your handler and the sysrq operationsby adding them to drivers/char/sysrq.c:
unsigned long my_app_status = 0;static void sysrq_app_status(int key, struct pt_regs *pt_regs,
struct tty_struct *tty){
console_loglevel = 8;Gprintk("application status = %ld\n",my_app_status);
}
A more usefull thing to do is to declare a funcition pointer and conditionally call the application status function if non-NULL. But this is up to the programmer, basically there is no real limit here, except that this is statically compiled intothe kernel and thus generally the application module is not yet loaded at boot time.
As noted above the convetinn is to mark the respective key in the .help msg string by capitalization, if you can’t fit it ina meaningfull word and you get stuck with a free letter like ”z”, then just add it in braces, trying to forfully stick to thisconvention with strings like statuZ will cause confusion....
The .action msg is printed previous to invoking the handler, so in our case <CNTRL>-<PrintScr>-<z> would outputthe folowing on the consoleon the console:
<CNTRL>-<PrintScr>-<z>SysRq: Schow applicatoin statusapplication status = 0
The core structure for the sysrq system is the sysrq key op, consiting of three elemens, the actual handler, a short textualhelp message and a message to explain what the handler is doing.
struct sysrq_key_op {void (*handler)(int, struct pt_regs *,
struct kbd_struct *, struct tty_struct *);char *help_msg;char *action_msg;
};
In oure example we would use the folowing,
static struct sysrq_key_op sysrq_app_status_op = {.handler = sysrq_app_status,.help_msg = "status(z)",.action_msg = "Schow applicatoin status",
};
which is mapping this handler in the sysrq table to a specific key - z in our case. The above sysrq app status is notdoing anything usefull, it is just being executed in kernel space and printing to the console, but as it is executed in kernelcontext one can display any data item from kernel space. In this example it will display a unsigned long my app statuswhich is made globally available in kernel context by adding the line

EXPORT_SYMBOL(my_app_status);
at the end of sysrq.c and thus can be set by the kernel space application.
#define SYSRQ_KEY_TABLE_LENGTH 36static struct sysrq_key_op *sysrq_key_table[SYSRQ_KEY_TABLE_LENGTH] = {/* 0 */ &sysrq_loglevel_op,/* 1 */ &sysrq_loglevel_op,/* 2 */ &sysrq_loglevel_op,.../* w */ NULL,/* x */ NULL,/* y */ NULL,/* z */ &sysrq_app_status_op,};
Now recompile the kernel, and after booting hold down <ALT>-<Print>-<Z> (on X86 sysrq mapps to <ALT>-<PrintScr> for other architectures see Documentation/sysrq.txt)
SysRq key strokes are alos loged via the kernels log facility so dmesg will also display the log messages:
SysRq : Schow applicatoin statusapplication status = 0
Note that the loglevel must be set to 8 if a message should go to the console, so
console_loglevel = 8;printk("application status = %ld\n",my_app_status);
will print to the console and also to the kernel ring buffer which then is typcially logged via syslogd to the appropri-ate log files in /var/log, the invocation of the SysRq handler is done via the handle sysrq nolock function indrivers/char/sysrq.c which ensures that the log level changes in any of the handler functions is temporary, so no needto save and restore log levels in handlers.
5.1.4 dynamic sysrq
The System request interface in Linux is not built for dynamic allocation of system request handlers. But never the lessone can allocate them dynamically, it must be noted though that this is very linux kernel version specific and the codeshown here will work for linux-2.6.0 and posibly for no other version. The concept though is quite generic.
Basically all that needs to be done is grab the sysrq table and run through the list of sysrqs until one finds one that is aNULL pointer. then map your handler with the appropriate format to that key - thats it.
The kernel exports some sysrq related managment functions that can be used to dynamically register sysrq handlers.Obviously this does not require pathing the kernel, and thus is the prefered way for testing.
The registration is done by adding a key operations in the key op lookup table, which is again in drivers/char/sysrq.c.The key table is limited to SYSRQ KEY TABLE LENGTH, which coresponds to 0-9,a-z. A set of predefined sysrq keys arecompiled in as shown above, so the free sysrq table entries can be used for our application specific sysrq.
The sysrq system export six functions as a minimum registration interface
__sysrq_lock_table__sysrq_unlock_table__sysrq_get_key_op__sysrq_put_key_op__sysrq_swap_key_ops__sysrq_swap_key_ops_nolock

When manipulating the sysrq always table one must always lock the table before reading or writing, naturally folowed byan unlock operation. To deregister a handler it simply must be set ta a NULL pointer, the sysrq functions handle sysrqwhich does the locking and then calls handle sysrq nolock, checks for NULL pointers, but if an invalid pointer is leftin place strange things will happen.
To set up a sysrq handler dynamically one should use the function sysrq swap key op, which does the necessary lockingbefor calling its nolock counterpart to actually add the new handler.
5.2 msgdump
The kernel is using printk to produce debug and status output, which normally goes to syslogd via klogd, and then intolog files. But in case of a system crash this user-space daemons will hardly work properly and valuable debug informationmay be lost, making post-mortem analysis quite painfull if one is forced to copy down messages of the console.
The kmsgdump kernel patch tries to fix this problem by using a sysrq handler to dump this log information to a floppy orthe parallel port. Unfortunately this is very X86 specific and not available for other platforms
6 Kernel debug ”API”
As a general note on kernel debugging API, one can notice that the ”API” is not that consistent when it comes to lowlevel stuff. So one needs to relax the expressions when searching in other than x86 architectures for these functions. Asan example, on ppc architectures the register dump is called show regs and not show registers, but the path of eventsis quite similar on all archs.
The worst case, the oops, is generated via an invalid instruction that then goes via the appropriate trap handler and finallywill call die which will produce the, hopefully not that well known, oops screen.
6.1 printk()
printk is a printf variation for the kernel, with the addition of a prepended log level and the limit of not printing any ofthe floating point formats (but floats in kernel space are generally a no-no any way). printf is a very robust function, itcan be called in more or less any context, including interrupt context and while holding locks. There are also variants forthe hard-realtime extensions to Linux.
• rtl printf is the RTLinux variant that can be called safely from rt-context.
• printk in ADEOS is patched to be safe from any domain context
• rt printk is the RTAI variant that also is rt-context safe.
6.1.1 log level and log buffer
printk has a log level prepended to the format - these log levels are used by the kernel to decide where the message needsto go based on the current log level setting in the kernel, and are used by klogd/syslogd when sorting out log messages in/var/log/*. Especially when putting printk messages into a error branch of code that could cause serious problems oneshould lower the log level so that the message is dumped to the console, as the syslogd path might not work in case of akernel bug.
To ensure that a message reaches the console do:
...console_loglevel = DEFAULT_CONSOLE_LOGLEVEL;printk("This always will go to the console\n");...

Note that you can also set this via the magic system request (for details on sysrq see above) by using <CNTRL>-<PrintScrn>-<0> - <CNTRL>-<PrintScrn>-<9> (not sure what 9 would do, the kernel seems to only define 0-7, butit can be set via sysrq...).
When using printk in your error path don’t forget that if the error is non-transient that you can cause log floods to thesystem. To protect against such cases one can limit the logging message either by intervals or by absolute counts. Fordetails see the chapter on debugging in Rober Loves ”Linux Kernel Development” [?].
6.1.2 before printk is available
Before printk is actually available, that is before the kernel has a console device, debug messages are a problem. On somearchitectures a early printk() is provided which is available after setup early printk called very early in the boot processon x86 64 ppc64 and alpha (don’t think its available on other archs - corrections appreciated).
For the first few lines of output that one sees on the screen ”Uncompressing Linux...” the kernel can’t access any realkernel functions yet, for debugging in this setup part of vmlinuz, one must use the architecture specific functions.
• puts:put a string on the boot console
• puthex:put a variable as hexadecimal number on the boot console
puts is supported on some m68k, ppc, mips and i386. puthex is a bit more selective and appears in architecture specificnaming (i.e. udbg puthex on ppc64).
6.1.3 preventing log floods
TODO:
6.2 BUG() and variants:
BUG is intentionally for in-lined functions, as it prints the file and line that caused the problem, so if used in functionsthat are called and not in-lined the information available via BUG is more or less useless. The mechanism used by BUGis to trigger an invalid instruction by a call to one of the undefined instructions ud0,ud1,ud2 which are explicitly for thispurpose. As the use of ud0 (or was it ud1 ?) is AMD specific, ud2 is used for x86 platforms.
The invalid instruction ud* will cause a trap execution via do trap which then subsequently will cause die (fromarch/i386/kernel/traps.c which then causes ensures that the console log level is set to dump directly to the console(via console verbose() and then dumps the debug information to the screen by calling show registers. Further more,within show registers the stack is dumped to produce the oops message.
from include/asm/bug.h:/** Tell the user there is some problem.* The offending file and line are encoded after the "officially* undefined" opcode for parsing in the trap handler.*/
#define BUG() \__asm__ __volatile__( "ud2\n" \
"\t.word %c0\n" \"\t.long %c1\n" \: : "i" (__LINE__), "i" (__FILE__))
BUG ON is just a wrapper to BUG and generally will be better readable in the code.

#define BUG_ON(condition) do { if (unlikely((condition)!=0)) BUG(); } while(0)
The memory subsystem defines its own BUG variant to catch NULL pages. The dowhile(0) construction is to allow gccto optimize it away in case that BUG is undefed.
#define PAGE_BUG(page) do { \BUG(); \
} while (0)
A more verbatim variant is the WARN ON, the above BUG reports will only tell you a bug occurred but don’t tell muchabout the conditions and the state in which this happened - so unless this is sufficiently clear (i.e for a driver specificfunction that will be called only in known code paths) BUG is fine - for code that could be called from any where in thekernel WARN ON is mor useful as it allows tracking back the cause for the problem.
#define WARN_ON(condition) do { \if (unlikely((condition)!=0)) { \
printk("Badness in %s at %s:%d\n", __FUNCTION__, \__FILE__, __LINE__); \
dump_stack(); \} \
} while (0)
when using BUG and friends one needs to ensure that a error does not lead to a printk flood resulting in a syslog partyand consequent overload of the system, especially on low resource systems this can easily happen, see not in the aboveprintk section.
6.2.1 preempt count()
For debugging relaxed lock protected objects (basically all per cpu variables), checking the kernels preemption status isnecessary. Also when holding locks, preemption should be off. For these (and other) cases the kernel provides somefunctions to inspect the content of the preempt
In the 2.6 series of kernels these functions are based on the global preempt count variable which is comprised of threecounters. One for preemption one for soft interrupts (bottom halves) and one for hard interrupts.
include/asm/hardirq.h:bits 0-7 are the preemption count (max preemption depth: 256)bits 8-15 are the softirq count (max # of softirqs: 256)bits 16-23 are the hardirq count (max # of hardirqs: 256)bit 26 is the PREEMPT_ACTIVE flag.
• preempt count()preempt count, if 0 the kernel can be preempted, if greater 0 preemption has been disabled and if it drops below 0-> BUG.
• in interrupt()returns non 0 if in interrupt context (hardware interrupt or bottom halves).
• in irq()returns non 0 if in interrupt context due to a hardware interrupt
• hardirq trylock() which is the negation of in interrupt()
• in softirq()returns non 0 if in interrupt context due to a active bottom half
Note that the 2.4 series of kernels provides in interrupt and in irq() as well, but these are based on separate countersand not on the preempt count (which is not available in the default 2.4 kernel series - patches are available though).

6.2.2 GCCs builtin return address(x)
As noted above BUG only is use full for in lined functions as FILE etc. filed in by the preprocessor - so for functionsthat are called one needs a means to identify the caller. Unless the function is only called by a very small set of knownlocations, which allows manual inspection, GCCs builtin return address is the way to go.
unsigned long caller = (unsigned long) __builtin_return_address(0);
builtin return address returns the return address of the current function, which is the caller. the argument is the numberof frames to go up the call stack, but this does not always return reasonable results (at least not on x86). A frame numberof 0, returning the direct caller, does work reliably though (provided the stack was not corrupted). Unfortunately thereturn value does not allow too much interpretation - info gcc says:
On some machines it may be impossible to determine the returnaddress of any function other than the current one; in such cases,or when the top of the stack has been reached, this function willreturn ‘0’ or a random value. In addition,‘__builtin_frame_address’ may be used to determine if the top ofthe stack has been reached.
The problem is related to the availability of a frame pointer register on some architectures, for those the stack does notcontain the necessary structure to use builtin return address or builtin frame address, as the frame pointer is omittedfor optimization. This can be changed at compile time in the top level Makefile of the kernel though - recommended onlyfor debugging and not for production systems, so its not recommended for runtime debugging.
example usage:
kernel/time.c:signed long schedule_timeout(signed long timeout){
...switch (timeout){case MAX_SCHEDULE_TIMEOUT:
schedule();goto out;
default:/** Another bit of PARANOID. Note that the retval* will be 0 since no piece of kernel is supposed* to do a check for a negative retval of* schedule_timeout() (since it * should never* happens anyway). You just have the printk()* that will tell you if something is gone wrong* and where. */if (timeout < 0){
printk(KERN_ERR "schedule_timeout: wrong timeout ""value %lx from %p\n", timeout,__builtin_return_address(0));
current->state = TASK_RUNNING;goto out;
}

For functions that can be called from any where in the kernel this is a very convenient way to find the actual source ofthe problem. The address can then be resolved via the kernel symbol table (/proc/kallsyms for 2.6 and /proc/ksymsfor 2.4 as well as in the System.map file generated during kernel compilation).
6.3 show registers()/show regs()
This simply dumps the content of the registers and also for the stack if not in a system call. In the 2.6 series of kernels thesymbol names are available in the kernel so one can produce directly usable messages, prior to 2.6 one has to ”decode”the output with ksymoops.
print_symbol("EIP is at %s\n", regs->eip);
The rest is not too exciting - just a dump of the architecture specific registers.
printk("eax: %08lx ebx: %08lx ecx: %08lx edx: %08lx\n",regs->eax, regs->ebx, regs->ecx, regs->edx);
printk("esi: %08lx edi: %08lx ebp: %08lx esp: %08lx\n",regs->esi, regs->edi, regs->ebp, esp);
printk("ds: %04x es: %04x ss: %04x\n",regs->xds & 0xffff, regs->xes & 0xffff, ss);
printk("Process %s (pid: %d, threadinfo=%p task=%p)",current->comm, current->pid, current_thread_info(), current);
6.4 dump stack()/show trace/show stack
dump stack is just a wrapper to show trace in 2.4, in 2.6 kernels dump stack will call show trace passing it the currenttasks thread info structure. show trace will walk up the stack until it reaches the thread info structure that is stored inthe stack. The 2.4 kernel simply dumps the hexadecimal values it finds on the stack, in 2.6 print symbol() is called on allvalues to produce directly usable output.
The show stack also invokes show trace() but it dumps the raw stack content before doing so.
6.5 print symbol()
To print a human readable message of where things are going wrong one can use the instruction pointer available viaregs->eip and pass it to print symbol. This will the print the symbol name that belongs to this address, this is thekernel function name or garbage in case the stack is corrupted.
7 Kernel oops decoding
This section is more or less a cleanup version of development notes from porting XtratuM-0.3 to the 2.6.10 kernel whichobviously resulted in a few nice oopses. It is not trying to be complete or a rigorous introduction to kernel debugging, butwe hope that by providing a more or less complete loop through a ”disaster-in-progress” we can provide some guidanceon low level messes. Here is the oops from XtratuM-0.3 on 2.6.10xm from loading XtratuM.ko:
root@rtl26:/usr/src/XtratuM-0.3_2.6# syncroot@rtl26:/usr/src/XtratuM-0.3_2.6# insmod XtratuM.koUnable to handle kernel NULL pointer dereference at virtual address 00000000printing eip:
*pde = 00000000Oops: 0000 [#1]

Modules linked in: XtratuMCPU: 0EIP: 0060:[<00000000>] Not tainted VLIEFLAGS: 00010202 (2.6.10-XtratuM)EIP is at 0x0eax: c031b7a0 ebx: 00000600 ecx: c7a6a000 edx: ce880000esi: 00000030 edi: c0364000 ebp: c03c5019 esp: c7a6bea0ds: 007b es: 007b ss: 0068Process bash (pid: 227, threadinfo=c7a6a000 task=cd810a00)Stack: c0122d64 00000030 ce880000 00000000 c7a6bf80 c7a6bf00 00000000 c01037da
ce88f44f 00000000 00000000 00000000 00000000 00000000 00000000 0000000000000068 00000000 00000004 ce88d4a0 00000060 00000200 00000000 00000000
Call Trace:[<c0122d64>] __do_IRQ+0x34/0xd0[<c01037da>] do_IRQ+0x1a/0x30[<ce88f44f>] linux_irq_handler+0x1f/0x30 [XtratuM][<ce88d4a0>] dummy_f+0x0/0x20 [XtratuM][<ce88d5d9>] xm_sync_events+0x119/0x140 [XtratuM][<c010b3ae>] __wake_up+0x1e/0x30[<c0198d76>] tty_ldisc_deref+0x26/0x70[<c0199b42>] tty_write+0x1e2/0x240[<ce88d4a0>] dummy_f+0x0/0x20 [XtratuM][<c0106933>] mask_and_ack_8259A+0x53/0xd0[<ce890f24>] xm_sched+0x144/0x1b0 [XtratuM][<ce88d434>] xm_irq_handler+0x34/0x80 [XtratuM][<ce88c148>] common_xm_irq_body+0x18/0x30 [XtratuM]
Code: Bad EIP value.<0>Kernel panic - not syncing: Fatal exception in interrupt
This is close to the worst case - we have a bad EIP here so we get no code from where the fault actually seems to havehappened. The last safe place we were here is in do IRQ.
7.1 Decoding it
Once you get an oops the first task is to decode it and to map it back to the source lines that are causing the problem.
7.1.1 locating the fault position
The first step is to start at the faulting position which is 0x0 in our case, normally it will show up as some reasonableaddress like:
EIP is at __do_IRQ+0x79/0xf0| | || | ‘----- size of the faulting function| ‘---------- offset within the function‘----------------- name of the function
7.1.2 Locating the faulting code
As the EIP was unusable we go one step back on the stack and start at the last call position which was:
[<c0122d64>] __do_IRQ+0x34/0xd0

So go into the kernel tree and find do IRQ, the best method is to use cscope like so:
root@rtl26:/usr/src/linux-2.6.10xm# cscope -R
It will take a while to build up the symbol cache - once it is ready enter do IRQ in the filed:
Cscope version 15.5 Press the ? key for help
Find this C symbol: __do_IRQFind this global definition:Find functions called by this function:...
the results in my case, were:
C symbol: __do_IRQ
File Function Line0 sbc82xx.c sbc82xx_i8259_demux 145 __do_IRQ(NR_SIU_INTS + irq,
regs);1 irq.c do_IRQ 91 __do_IRQ(irq, (struct pt_regs *)
regs);2 irq.c do_IRQ 103 __do_IRQ(irq, regs);3 irq.h do_IRQ 44 __do_IRQ((irq), (regs)); \4 handle.c __do_IRQ 118 fastcall unsigned int
__do_IRQ(unsigned int irq, struct* Press the space bar to display the first lines again *Find this C symbol:Find this global definition:...
The last entry is the one we are looking for as all others are just calls into do IRQ - so we open that file by placing thecursor on the line 4 handle.c and inspect the faulting function - in some cases, especially with very short functions theproblem might be sufficiently obvious to fix it and you are done. In the case of do IRQ its not that simple, we need tolocate the exact point in the code where the problem occurred.
To terminate cscope use <CNTRL>-D .
7.2 Disassembling
There are a number of ways we can disassemble the related code from an oops, we will cover all three methods here, asin the particular oops under consideration, no code was dumped due to a bad EIP, we will use a different oops output toshow the ksymoops related method. The four methods are:
• Generating assembler code from the related source
• Disassembling the object code with binutils
• using gdb to disassemble the problematic code
• using ksymoops to decode the code section of the oops

7.2.1 Generating Assembler code
As we know that the problem is in do IRQ we can use the kernel make rules to generate the assembler file. Requirementto do this though is that you have the correct .config file from the kernel build.
root@rtl26:/usr/src/linux-2.6.10xm# cp config .configroot@rtl26:/usr/src/linux-2.6.10xm# make oldconfig...root@rtl26:/usr/src/linux-2.6.10xm# make...root@rtl26:/usr/src/linux-2.6.10xm# make kernel/irq/handle.s
The offending function do IRQ looks like:
...
.globl __do_IRQ.type __do_IRQ, @function
__do_IRQ:pushl %ebppushl %edipushl %esipushl %ebxmovl %eax, %esipushl %ecxmovl %eax, %ebxsall $5, %ebxmovl per_cpu__kstat+56(,%eax,4), %ebpincl %ebpmovl %edx, (%esp)leal irq_desc(%ebx), %edimovl %ebp, per_cpu__kstat+56(,%eax,4)testb $1, irq_desc+1(%ebx)je .L27movl 4(%edi), %eaxpushl %esicall *20(%eax)
...
If you are not to used to reading assembler code it is easy to get confused and misread the code - which can result in huntingdown ghosts - a quite time consuming sport. To improve the output readability a bit you can add the -fverbouse-asm tothe CFLAGS KERNEL in the top level Makefile and rerun the make. Note that if you pass CFLAGS directly on the commandline they must be exactly the same as the kernel would use or the output will be wrong and miss lead you.
root@rtl26:/usr/src/linux-2.6.10xm# make kernel/irq/handle.sCC scripts/mod/empty.oMKELF scripts/mod/elfconfig.hHOSTCC scripts/mod/file2alias.oHOSTCC scripts/mod/modpost.oHOSTCC scripts/mod/sumversion.oHOSTLD scripts/mod/modpostCC kernel/irq/handle.s
The output this generates is contains the C source level function and variable names that are being assigned to registers,so now we can actually see in what registers what parameter is stored and use this information to read the details of theregister dump in the oops.

...
.globl __do_IRQ.type __do_IRQ, @function
__do_IRQ:pushl %ebppushl %edipushl %esipushl %ebxmovl %eax, %esi # irqpushl %ecxmovl %eax, %ebx # irqsall $5, %ebxmovl per_cpu__kstat+56(,%eax,4), %ebp # per_cpu__kstat.irqsincl %ebpmovl %edx, (%esp) # regsleal irq_desc(%ebx), %edi # descmovl %ebp, per_cpu__kstat+56(,%eax,4) # per_cpu__kstat.irqstestb $1, irq_desc+1(%ebx) # <variable>.statusje .L27movl 4(%edi), %eax # <variable>.handlerpushl %esi # irqcall *20(%eax) # <variable>.ackmovl %esi, %eax # irqmovl 8(%edi), %ecx # <variable>.action, action
...
This shows us now that the the variable irq is originally loaded into %ebx and the the variable desc is assigned to thevalue of irq desc + irq. This desc variable is the used to construct the pointer desc->handler->ack and store it in%eax. finally the value for irq which was also stored in %esi is pushed on the stack and the call *20(%eax) will invokethe function pointed to by desc->handler->ack.
Looking back at the oops output we can see now that
desc->handler->ack(irq);
was trying to call the vector for irq 0x30
esi: 00000030
which was the content of %esi when we crashed. Thats as close as the oops will bring us - now its code inspection findingwhy the desc->handler->ack is a null pointer. We can speculate that desc->handler is all ready a null pointer andfind out by instrumenting the code at that place. we could add:
if(!desc->handler)BUG();
more on that in the section kernel debug API.
7.2.2 Disassembling with objdump
In most oops report we have two hints at where it happened. The one is the line we used above the noting the EIP of thefaulting function, the other is the line at the end of the oops listing the code that was at the position where it happenedin machine code.

...EIP is at __do_IRQ+0x79/0xf0...Code: 74 13 8b 47 04 56 ff 50 18 b8 01 00 00 00 5e 5f 5b 5e 5f 5d c3 50 57 56 e8 75 04 00 00 83 c4 0c eb e0 56 ff d0 5d eb c3 8b 47 04 <8b> 40 14 85 c0 75 60 89 d0 31 ed 83 e0 d7 83 c8 04 a8 03 75 09
The machine code at <8b> is where we crashed, and this is at offset 0x79 from the start of do IRQ. The last field 0xf0in our case is the length of the do IRQ function.
To disassemble the code we need the object file that contains do IRQ, as we know for cscope output that do IRQ isfrom kernel/irq/handle.c (your editor would show you the exact location once you hit enter in cscop at the listed filename), so we check into what object file handler.c was put. In the case of the Linux kernel this is conveniently one .o fileper .c file so handler.c was compiled into handler.o also located in kernel/irq/. So we apply objdump on the .o file toget hold of the disassembled kernel code.
To use the right objdump flags we must first check what kind of file we are trying to decode:
root@rtl26:/usr/src/linux-2.6.10xm/kernel/irq# file handle.ohandle.o: ELF 32-bit LSB relocatable, Intel 80386, version 1 (SYSV), not strippedroot@rtl26:/usr/src/linux-2.6.10xm/kernel/irq#
As this is a relocatable file, we need to call objdump with the --reloc flag along with --disassemble, so:
root@rtl26:/usr/src/linux-2.6.10xm/kernel/irq# objdump --reloc --disassemble \handle.o > handle.droot@rtl26:/usr/src/linux-2.6.10xm/kernel/irq#
Note that the file extension is up to you - but as the kernel tree does not use the .d extension for anything its a safechoice, just take anything that will not conflict with existing file name rules.
reading the assembler file
We have the disassembled code from handle.c now in handle.d, opening the file we search for do IRQ and inspect thatcode section:
...00000120 <__do_IRQ>:120: 55 push %ebp121: 57 push %edi122: 56 push %esi123: 53 push %ebx124: 89 c6 mov %eax,%esi126: 51 push %ecx127: 89 c3 mov %eax,%ebx129: c1 e3 05 shl $0x5,%ebx12c: 8b 2c 85 38 00 00 00 mov 0x38(,%eax,4),%ebp
12f: R_386_32 per_cpu__kstat133: 45 inc %ebp134: 89 14 24 mov %edx,(%esp)137: 8d bb 00 00 00 00 lea 0x0(%ebx),%edi
139: R_386_32 irq_desc13d: 89 2c 85 38 00 00 00 mov %ebp,0x38(,%eax,4)
140: R_386_32 per_cpu__kstat144: f6 83 01 00 00 00 01 testb $0x1,0x1(%ebx)
146: R_386_32 irq_desc14b: 74 29 je 176 <__do_IRQ+0x56>14d: 8b 47 04 mov 0x4(%edi),%eax

150: 56 push %esi151: ff 50 14 call *0x14(%eax)154: 89 f0 mov %esi,%eax
The last sure place we have reported is do IRQ+0x34, at that line we fine:
154: 89 f0 mov %esi,%eax
This line is the return address that was put on the stack, so the interesting part is what happened just before that line,thats were we left off from do IRQ ... and crashed. That line is
151: ff 50 14 call *0x14(%eax)
in this line a call was made to the address stored in %eax + offset 0x14, so thats decimal 20. Looking at the code ofdo IRQ :
fastcall unsigned int __do_IRQ(unsigned int irq, struct pt_regs *regs){
irq_desc_t *desc = irq_desc + irq;struct irqaction * action;unsigned int status;
kstat_this_cpu.irqs[irq]++;if (desc->status & IRQ_PER_CPU) {
irqreturn_t action_ret;
/** No locking required for CPU-local interrupts:*/
desc->handler->ack(irq);action_ret = handle_IRQ_event(irq, regs, desc->action);desc->handler->end(irq);return 1;
}...
we can see that the first function call is desc-¿handler-¿ack(irq). Checking up on the interrupt structure we find:
include/linux/irq.ctypedef struct irq_desc {
unsigned int status; /* IRQ status */hw_irq_controller *handler;struct irqaction *action; /* IRQ action list */unsigned int depth; /* nested irq disables */unsigned int irq_count; /* For detecting broken interrupts */unsigned int irqs_unhandled;spinlock_t lock;
} ____cacheline_aligned irq_desc_t;
so the handler is of type hw irq controler, back to cscope we get:

struct hw_interrupt_type {const char * typename;unsigned int (*startup)(unsigned int irq);void (*shutdown)(unsigned int irq);void (*enable)(unsigned int irq);void (*disable)(unsigned int irq);void (*ack)(unsigned int irq);void (*end)(unsigned int irq);void (*set_affinity)(unsigned int irq, cpumask_t dest);
};
Which explains the offset 0x14 now - ack is the entry at offset 0x14 of the hw interrupt type structure, looking at thec-code from do IRQ, we see that this fits the call. So the faulting source line is:
desc->handler->ack(irq);
This call obviously was a NULL-pointer, which is why we got the EIP of 0x0 and the message at the top of the oops:
Unable to handle kernel NULL pointer dereference at virtual address 00000000
7.2.3 Decoding with gdb
not much to say to this option - here is the same story from gdb’s perspective, the only added information is the absolutekernel addresses.
root@rtl26:/usr/src/linux-2.6.10xm# gdb vmlinuxGNU gdb 6.3Copyright 2004 Free Software Foundation, Inc.GDB is free software, covered by the GNU General Public License, and you arewelcome to change it and/or distribute copies of it under certain conditions.Type "show copying" to see the conditions.There is absolutely no warranty for GDB. Type "show warranty" for details.This GDB was configured as "i486-slackware-linux"...(no debugging symbols found)Using host libthread_db library "/lib/libthread_db.so.1".
(gdb) disassemble __do_IRQDump of assembler code for function __do_IRQ:0xc0125b60 <__do_IRQ+0>: push %ebp0xc0125b61 <__do_IRQ+1>: push %edi0xc0125b62 <__do_IRQ+2>: push %esi0xc0125b63 <__do_IRQ+3>: push %ebx0xc0125b64 <__do_IRQ+4>: mov %eax,%esi0xc0125b66 <__do_IRQ+6>: push %ecx0xc0125b67 <__do_IRQ+7>: mov %eax,%ebx0xc0125b69 <__do_IRQ+9>: shl $0x5,%ebx0xc0125b6c <__do_IRQ+12>: mov 0xc03d6398(,%eax,4),%ebp0xc0125b73 <__do_IRQ+19>: inc %ebp0xc0125b74 <__do_IRQ+20>: mov %edx,(%esp)0xc0125b77 <__do_IRQ+23>: lea 0xc036aa00(%ebx),%edi0xc0125b7d <__do_IRQ+29>: mov %ebp,0xc03d6398(,%eax,4)0xc0125b84 <__do_IRQ+36>: testb $0x1,0xc036aa01(%ebx)0xc0125b8b <__do_IRQ+43>: je 0xc0125bb6 <__do_IRQ+86>

0xc0125b8d <__do_IRQ+45>: mov 0x4(%edi),%eax0xc0125b90 <__do_IRQ+48>: push %esi0xc0125b91 <__do_IRQ+49>: call *0x14(%eax)0xc0125b94 <__do_IRQ+52>: mov %esi,%eax
Note the seemingly inconsistent code reported, in the gcc generated assembler code above we got
sall $5, %ebx
now we get an equivalent mnemonic
shl $0x5,%ebx
in this case it is not tragic - in some cases, especially when you are new to this, it might be irritating - so when you findinconsistencies then check with an assembly manual for the processor to see if they are not the same thing, and if someonehas an explanation why there are different assembler representations for the same code I would be interested :)
7.2.4 Decoding the code section
The code section - if one is dumped - is the code surrounding the offending code, the actual point at which the crash wasdetected is marked with pointy braces:
Code: 44 24 28 39 43 10 75 9f 85 f6 74 17 8b 04 b5 9c 4b 43 c0 8904 b5 a0 4b 43 c0 4e 75 ef 89 1d a0 4b 43 c0 ff 43 0c 89 1c 24 eb82 <0f> 0b 44 05 26 ee 32 c0 e9 59 ff ff ff 8d b4 26 00 00 00 00 55
in this case <0f> was the problem. To decode this in to a human readable sequence of assembler instructions we useksymoops. Be warned that if you use ksymoops with the wrong kernel source tree, the wrong module list or the wrongSystem.map your output will look reasonable any way - but will be complete garbage. So before digging into the outputfrom ksymoops check the header and make sure it really is using the right files. Note that the oops file does not need tobe a clean oops, in general if its the serial console output with preceding console messages it will not irritate ksymoops.We assume you have the minicom log or your copied oops in the file oops file:
root@rtl26:~ # ksymoops < oops_fileksymoops 2.4.11 on i686 2.6.10-XtratuM. Options used
-V (default)-k /proc/kallsyms (specified)-l /proc/modules (default)-o /lib/modules/2.6.10-XtratuM/ (default)-m /usr/src/linux-2.6.10xm/System.map (specified)
kernel BUG at fs/buffer.c:1348!invalid operand: 0000 [#1]CPU: 0EIP: 0060:[<c01427fc>] Not tainted VLIUsing defaults from ksymoops -t elf32-i386 -a i386EFLAGS: 00010002 (2.6.10-XtratuM)eax: 00000001 ebx: 00020018 ecx: c11ffc40 edx: 00000000esi: 00000000 edi: 00020018 ebp: 00000000 esp: cdb05cdcds: 007b es: 007b ss: 0068Stack: 00000000 00000046 00020018 00000000 00001000 c11ffc40 c014282d c11ffc40
00020018 00000000 00001000 00001000 cdd47400 000202db 00020018 c0175050c11ffc40 00020018 00000000 00001000 00000000 c68ecbc0 cd967640 00000000

Call Trace:[<c014282d>] __getblk+0x1d/0x40[<c0175050>] ext3_get_inode_loc+0x50/0x220[<c0175bdf>] ext3_reserve_inode_write+0x1f/0x90<snip>[<c0140ccd>] sys_writev+0x3d/0x70[<c0102227>] syscall_call+0x7/0xb
Code: 44 24 28 39 43 10 75 9f 85 f6 74 17 8b 04 b5 9c 4b 43 c0 89 04 b5 a0 4b43 c0 4e 75 ef 89 1d a0 4b 43 c0 ff 43 0c 89 1c 24 eb 82 <0f> 0b 44 05 26 ee32 c0 e9 59 ff ff ff 8d b4 26 00 00 00 00 55<snip>
>>EIP; c01427fc <__find_get_block+cc/e0> <=====
>>ecx; c11ffc40 <pg0+db7c40/3fbb6400>>>esp; cdb05cdc <pg0+d6bdcdc/3fbb6400>
Trace; c014282d <__getblk+1d/40>Trace; c0175050 <ext3_get_inode_loc+50/220><snip>
Code; c01427fc <__find_get_block+cc/e0>00000000 <_EIP>:Code; c01427fc <__find_get_block+cc/e0> <=====
0: 0f 0b ud2a <=====Code; c01427fe <__find_get_block+ce/e0>
2: 44 inc %espCode; c01427ff <__find_get_block+cf/e0>
3: 05 26 ee 32 c0 add $0xc032ee26,%eaxCode; c0142804 <__find_get_block+d4/e0>
8: e9 59 ff ff ff jmp ffffff66 <_EIP+0xffffff66><snip>
The offending line is marked with <===== and the instruction that caused the oops was 0f 0b which translates to ud2awhich in turn is a deliberate illegal instruction in the BUG() kernel function to trigger a stack/register dump known asoops. Note that we cut away a lot of the oops output - so this can be very long. To help you start at the right place lookfor the <===== maker, this will tell you what function and at what line in the function. Then use the disassembled objectfile to map this to the c-source line, and then fix it.
8 Simple tools
In this section we will briefly summaries the available tools as an overview with some notes on the underlaying mechanisms.These tools are often a good place to start as they are redily available on most (well configured) systems and yield usableresults - or atleast hints - within seconds.
8.1 /usr/bin/time
Note that we list this tool as /usr/bin/time no as time, which is the correct executable name, due to a conflict withthe bash builtin time command. As bash honors builtin commands before any commands found in the $PATH, this hascaused missunderstandings in the past, so if time does not deliver the output we show here then try /usr/bin/time.
The time command summarizes the resoures used by an application in the following form:
root@rtl14:~# ls -lR /Command being timed: "ls"

User time (seconds): 0.00System time (seconds): 0.00Percent of CPU this job got: 0%Elapsed (wall clock) time (h:mm:ss or m:ss): 0:00.01Major (requiring I/O) page faults: 172Minor (reclaiming a frame) page faults: 35Page size (bytes): 4096Exit status: 0
Fields that are 0 on Linux are not shown above - so your output will be somewhat longer. Unfortunately POSIX onlyrequires two fields of rusage to be filled, ru utime and ru stime, so the usability of time is somewhat limited on Linux.
Time is based on the wait3 system call with some limitations regarding the accuracy of time collection. Time is notrecorded in an atomic way, thus especially for short execution times the accuracy of reported time values is low.
The numbers are dependant on those returned by ‘wait3’ in the rusage structure, and as not all systems measure allof the resources that could be reported , one generally will see quite a few zero values reported. Especially the memoryrelated information depends on how good/complient the information of the memory management subsystem are.
The wait3 system call returns two structures that contain the information then reported, this off course also can be useddirectly in application code to monitor child processes.
• struct rusage *rusage:This uses getrusage() see man 2 getrusage() to retrief the resource usage information as defined in sys/resource.h.
• int *status:Which contains a bit mask reporting exit conditions and singaling conditions.
8.2 BSD Process Accounting
BSD Process accounting is not in wide use - it is somewhat limited, but it is a quite usefull tool to get an overview ofwhat is eating up resources on an embedded system. The overhead that it causes is not dramatic.
8.2.1 Configuration
Process accounting is off in the Linux kernel config by default, and quite a few distributions don’t have the necessaryuser-space tools available by default (atleast sa is missing on a few distros). To enable it you must configure the kernel -make menuconfig:
...General setup --->...[*] BSD Process Accounting
for the 2.4.X kernels, and for the 2.6 kernels:
...General setup --->...[*] BSD Process Accounting[*] BSD Process Accounting version 3 file format
Note that you need a different set of tools for the 2.6.X kernels if version 3 support is enabled - these tools can be foundat http://www.physik3.uni-rostock.de/tim/kernel/utils/acct/
For those interested in details - the accounting information structure is in nclude/linux/acct.h, which allows buildingof kernel space monitoring tools.

8.2.2 Usage
To turn on/off accounting from user-space applications the acct library call is available. Passing it a file naem turns onaccounting, passing it NULL turns it off again.
#include <unistd.h>int acct(const char *filename);
If the system accounting tools are installed, then accounting is enabled with a call to accton filename and the contentcan be listed with sa. Although /sbin/accton is only a 5k executable, it makes sense to use the above acct library callin some system application. Interpretation of the accounting files can be done off-line, generally there is no need to installsa on embedded target systems.
Typical output from sa will give you a good impression of what commands are running very frequently and thus arecandidates for optimization and where resources are being hogged - aside from it often being supprising to find somecommands being used at all...
357 375.40re 0.06u 0.02s 0avio 499k44 95.83re 0.03u 0.00s 0avio 614k sh12 70.94re 0.01u 0.01s 0avio 624k cc18 12.48re 0.00u 0.00s 0avio 488k make
...
Process accounting will not help much when it comes to debuging individual applicaitons but it can help in locating systemlevel problems, and most it helps getting a big picture of whats actually going on in a system.
8.2.3 Limitations
Accounting files can become very very large, especially by embedded standards, tehy are huge. Thus if accounting is to beused on resource constraint systems then the accounting limits should be carfully set. BSD accounting files have a kernelside high/low watermark (in % disk space on the partition holding the accounting file) that is checked at regular intervals.In case of reaching the low watermark of free disk space accounting is susspended, it is resumed if the high watermarkis reached. Checks are done at the frequency speified as the last parameter in /proc/sys/kernel/acct - frequency inseconds.
root@rtl17:/var/log# cat /proc/sys/kernel/acct4 2 30\begin{verbatim}}
Default values are to suspend below 2\% and resume at 4\% free disk space - checking at intervals of 30 minutes - note that these values are generally not suitable for embedded systems as 2\% free disk-space is critical on many embedded systems (especially those using syslog as primary debug source).
\subsection{strace}
In the simplest case strace runs the specified command until it exits. It intercepts and records the system calls which are called by a process and the signals which are received by a process. The name of each system call, its arguments and its return value are printed on standard error or to a specified file. Within the linux kernel a process is marked as traced by the flag:
\sf{\begin{verbatim}#define PF_PTRACED 0x00000010 /* 2.2.X kernels */#define PT_PTRACED 0x00000001 /* 2.4.x/2.6.x kernels */
wherby the ptrace flag gives a parent process access to the actual code pages of a process, allowing to modify it (i.e. insertbreakpoints) and is used by debuggers. strace also makes heavy use of the ptrace function to control the executablerunning as a child process of the srace command. The core functions for attaching/detaching and accessing the childprocess memory space is coded in /kernel/ptrace.c.

strace is a diagnostic, instructional, and debugging tool to not only locate failures but also to locate application bottle-necks and performance problems. Especially when it commes to diagnosting problems for applications where source codeis not available tools like strace are a means to look deap into the internal structure of an aplication.
A perl script for post-processing of strace data, written by Richard Braakman, is also in the current strace release whichallows to display a graph of invoked subprocesses including execution times (via -t/-tt/-ttt flags to strace)
For details and options to connect to running processes see the man (1) strace, the latest versions of strace are availablevia cvs . Strace is supported on a number of platforms and is easaly cross-compiled (builds with autoconf).
8.3 ltrace
ltrace is a debugging program which runs a specified command until it exits, intercepting and records all dynamic librarycalls. It also records any signals received by the traced process. ltrace can intercept and trace system calls executed bythe program, but is less elaborate in its feature set for this pupose than strace. Again, as in strace the program to betraced need not be recompiled, it is thus usable for binarie only code debugging aswell.
The operation of ltrace is quite similar to that of strace, especially the output with the -t/tt/ttt options allow quicklocation of hot-spots in the library calls. Unfortunately ltrace does impact quite heavaly on the applications performanceso its use in actually deployed systems needs to be concidered carfully. Also a clear disadvantage of ltrace as of version0.31 is that it does not cleanly cross-compile (./configure –target=... will not work), but versions for different architecturesare available as debian packages .
TODO: the rest of them :)
9 Checkpoint Restart
A critical issue for embedded systems is post-mortem analysis and the ability to continue at the place where an applicationleft of, i.e. at power failure, when the system comes up again. Checkpoint restart technologies provide this capability, andit is better under all circumstances to use available implementations than to reinvent the wheel, which is commonly donewhen it comes to checkpoint/restart capabilities. The BLCR, Berkeley Lab Checkpoint Restart library is used in clusters,and works not only for single nodes but also with distributed computations based on message passing (i.e. LAM, LocalArea Multicomputer).
9.1 BLCR installation and configuration
BLCR is a checkpoint/restart system that can be used standalone or in conjunction with LAM/MPI in order to checkpointparallel jobs. Check-pointing is very useful to troubleshoot applications because it makes errors reproducible and it save alot of time because you can start debugging from the last checkpoint and not from the beginning of the application. Solet’s download the BPROC tarball and unpack it to the /usr/src directory:
rtl29: # cd /usr/srcrtl29: # wget http://ftg.lbl.gov/twiki/pub/Whiteboard/CheckpointDownloads/blcr-0.3.1.tar.gzrtl29: # tar -xzf blcr-0.3.1.tar.gzrtl29: # cd blcr-0.3.1rtl29: # ./configure --with-linux=/usr/src/linuxrtl29: # makertl29: # make install (as root)
After downloading the next step is to configure and compile the BLCR modules and utilities. (Compilation does not workwith a Slackware 9.1 default installation). Make sure that the /usr/src/linux link is set to the correct linux kerneland that Loadable module support -> Set version information on all module symbols is not activated, alsothe kernel tree must contain the compiled kernel (actually the System.map file). This is due to the fact that the BLCR

modules are compiled without modversion and the busybox insmod executable is not able to cut off versions during theinsert of the module.
Note that you may get a number of warnings regarding redefinitions - but we found no fatal problem involved with thesewarnings - it seems that the include files distributed with blcr are not yet quite clean (afterall its version 0.3).
9.2 A simple example
A somewhat artificial example but perfectly fine to show the concepts. This simple application will count an integer andcheckpoint the application every ten iterations. If you kill the job with a fatal signal or power off the system, the applicationcan restart at the last checkpoint. Also if it does not die but behaves strange, you can restart it at an earlier point in itshistory and rerun it. This is especially useful to distinguish transient failures from real bugs, which is otherwise very hardto do!
/* counting.c** GPL V2,* (C) 2004, Florian Bruckner <[email protected]>* (C) 2004, Der Herr Hofrat <[email protected]>* (C) 2004, Michael Poeltl <[email protected]>* OpenTech EDV Research GmbH <http://www.opentech.at>** BLCR example program* increments an integer in a loop and creates a checkpoint every* 10 iterations** compile:* gcc -lcr -o counting counting.c*/
#include <stdio.h>#include <unistd.h>#include <libcr.h>
#define ITERATIONS 10
int main(void){
char filename[100];int i;cr_client_id_t id;
printf("Counting demo: PID %d\n", (int)getpid());printf("Checkpoints every %d iterations\n", (int)(ITERATIONS));
sprintf(filename, "context.%d", (int)getpid());printf("checkpoint-file: %s\n", filename);
/* initialize checkpoint system */id = cr_init();
for (i=1; i<100; ++i) {if (!(i%(ITERATIONS))) {

cr_request_file(filename);printf("checkpoint!\n");}printf("Count = %d\n", i);fflush(stdout);sleep(1);
}
return 0;}
9.3 Usage
9.3.1 Preparing Linux for BLCR
After the make install step you must off course run ldconfig so the new library is found. The modules are installed but notloadable yet as you must update the module dependencies - this is done by calling depmode with the -a flag to rebuild thedependencies. But first we test it before copying the modules to the system wide module directory.
rtl29: # ldconfigrtl29: # cd /tmp/blcr-0.3.0/vmadump/rtl29: # insmod vmadump.ortl29: # cd ../cr_module/rtl29: # insmod blcr.o
If this works out OK then copy them to /lib/modules/misc and update the dependencies.
rtl29: # cp cr_module/blcr.o /lib/modules/miscrtl29: # cp vmadump/vmadump.o /lib/modules/miscrtl29: # depmode -a
9.3.2 Compiling apps with BLCR
Then its simply compiling your application with a call to cr init, which will set up the necessary data structures forcheck-pointing and calls to cr request file in the code at points where you want to preserve execution status.
rtl29: # gcc -lcr -o counting counting.crtl29: # ./countingCounting demo: PID 280Checkpoints every 10 iterationscheckpoint-file: context.280Count = 1Count = 2Count = 3....checkpoint!Count = 10Count = 11Count = 12...checkpoint!Count = 20Count = 21<CNTRL>-C

In this case we would have successfully completed execution, but to see check-pointing we kill it with a fatal <CNTRL>-Cthen to restart at the last checkpoint, you simply restart it with:
rtl29: # cr_restart context.280checkpoint!Count = 20Count = 21Count = 22...
We can’t diagnose the <CNTRL>-C, but we can say that this application failure was a transient error as it continues now.Furthermore if it were a non transient error we could monitor events that lead up to the fatal event. You would restartthe application and connect a debugger to it and could watch it fail. Especially if this failure happens only after runningfor weeks or maybe months this is very powerful .
9.3.3 Common problems
rtl29: # insmod vmadump/vmadump.ovmadump.o: init_module: Invalid argumentvmadump.o: Hint: insmod errors can be caused by incorrect module parameters, including invalid IO or IRQ parameters.
You may find more information in syslog or the output from dmesg
If you see this you most likely are not running exactly the same kernel that you compile blcr against, blcr is accessing lowlevel data structures in the kernel and only can operate properly if it fits the kerne exactly, that is not only the version butalso the config options must be the same ! Checking with dmesg after the unsuccessful insmod would give you somethinglike:
vmadump: from bproc-3.1.10 Erik Hendriks <[email protected]>vmadump: Modified for blcr 0.3.0 <http://ftg.lbl.gov/checkpoint>Running kernel does not match the System.map used to build vmadump.o
If you forget to load the blcr and/or vmadump module then you will get the error when running the checkpointed application- so always make sure that it is loaded otherwise you will crash the application due to check-pointing - which is not quitethe intended use !
cr_core.c:388 cr_request_file: called w/o first calling cr_init()
Other than that there is very little one can do wrong while installing blcr.
10 Conclusion
An embedded OS becomes valuable for industrial applications when it is reliable and this reliability can be verified. Thisverification process requires some tools, and as the above sections hopefully showd, embedded Linux has many tools inthis area. The tools described in the article are not going to cover every situation, but they should help with many of thecommon debug problems in embedded systems.
As the embedded Linux community is very active, new tools are evolving all the time, in the recent 2.6.X kernel releasesprovisions for system wide profiling and built in ksymoops are integrated, simplifying runtime debugging of Linux basedembedded systems. It is to be expected that more work in this area will happen in the near future, increasing the value ofembedded Linux, and its reliability.

References
[GNU] GNU not UNIX,http://www.gnu.org/, ftp://ftp.gnu.org/
[proc-howto] Terrehon Bowden ¡[email protected]¿, Bodo Bauer ¡[email protected]¿, Jorge Nerin ¡[email protected]¿, Documentations/proc.txt,/linux/Documentation/filesystems/proc.txt.
[BGCC] Richard W.M. Jones ¡[email protected]¿, Herman A.J. ten Brugge ¡[email protected]¿ (Main-tainer),bgcc http://gcc.gnu.org/extensions.html
[SSP] Hiroaki Etoh and Kunikazu Yoda, Protecting from stack-smashing attacks,IBM Research Division, Tokyo ResearchLaboratory, http://www.research.ibm.com/trl/projects/security/ssp/main.html,June 19, 2000
[STRACE] Paul Kranenburg, Branko Lankester, Rick Sladkey,strace http://www.liacs.nl/ wichert/strace/, cvs -d:pserver:[email protected]:/cvsroot/strace
[LTRACE] Juan Cespedes,ltrace, http://freshmeat.net/projects/ltrace/
[NJAMD] Mike Perry ¡[email protected]¿, njamd http://sourceforge.net/projects/njamd
[KMSGDUMP] Randy Dunlap ¡[email protected]¿, kmsgdump kernel patches http://w.ods.org/tools/kmsgdump/http://developer.osdl.org/rddunlap/kmsgdump/
[OPROFILE] http://oprofile.sourceforge.net/
[LTP] http://ltp.sourceforge.net/
[RML] Robert M. Love ¡[email protected]¿, Linux Kernel Development http://tech9.net/rml/kernel book/
As usual this is ”work-in-progress”, feedback on what you think is missing is always welcome - mail suggestions [email protected].
• add readelf dependency checking
• add compile time malloc (DEBUG) settings and runtime config.
• add print symbol to kernel debug api
• add print symbol -> kallsyms lookup CONFIG KALLSYMS dependency note
• cleanup acronyms and references