Sulfate resistance of plain and blended cements exposed to varying concentrations of sodium sulfate
The origin of Vertisols and their relationship to Acid Sulfate Soils in
the Senegal valley
Laurent Barbiéro a,b,*, Abdallahi Ould Mohamedou c, Lucien Roger d, Soˆnia Furian e, Alain
Aventurier f, Jean Claude Rémy d, Serge Marlet f
a Indo-French Cell for Water Sciences, Department of Civil Engineering, Indian Institute of
Science, 560012 Bangalore, India
b IRD-UR 154, Laboratoire des Mécanismes de Transfert en Géologie, 14, Avenue Edouard Belin,
31400 Toulouse, France
c Faculté des Sciences et Techniques, Université de Nouakchott, B.P. 5026, Nouakchott, Mauritania
d INRA-ENSA, Unité de Science du Sol, 2, Place Pierre Viala, 34060 Montpellier Cedex 01,
France
e Laborato´rio de Pedologia, Departamento de Geografia, Universidade de Sa˜o Paulo, C.P. 8105,
Cep 05508-900, Sa˜o Paulo SP, Brazil
f CIRAD, TA 40/01, 34032 Montpellier Cedex 1, France
Abstract
In the Senegal valley, it is commonly considered that the Acid Sulfate Soils of the delta are fossil
soils overlain by more recent sediments, and that the Vertisols, which abruptly overlie a thick sandy
horizon, result from a change in the sedimentation mode of the river. However, we show that both
soils belong to the same pedological system extending from the delta to the limit of the last marine
transgression. This conclusion is based on (1) the study of soil profiles intermediate between Acid
Sulfate Soils and Vertisols along a 100-m sequence in the delta, (2) the mineralogy of the clay
fraction ( < 2 Am) in a 200-km transect along the river, and (3) the similarity of the sand size
distribution across the textural discontinuity between the horizons. The following processes are
involved in the pedological transformations: (1) development of acidity by oxidation of pyrite, (2)
neutralization of acidity initially by the carbonate in shell beds, and later by the hydrolysis of easily
weatherable silicate clays. The slightly alkaline river water precipitates kaolinite and later smectite
at the contact between the strongly acidic and slightly alkaline environments. This results in the
formation of a superficial vertic clay horizon surmounting a sandy horizon. Therefore, we
emphasize that the soil morphology results from development and control of acidity and not from
changes in past climates.
Keywords: Acid Sulfate Soil; Vertisol; Soil genesis; Senegal valley; Senegal delta
1. Introduction
During the Quaternary, the sea transgressed several times into the Senegal River valley (Faure et al.,
1980). In the middle Holocene, soon after 7000 BP, the Nouakchottian trangression penetrated
Pleistocene sand dunes and formed extensive shallow bays and lagoons. Between 4000 and 1800
BP, the shoreline retreated westwards and the Senegal river mouth was forced southwards during
the Taffolian regression (Michel, 1973). About 2000 BP, a final transgression formed a large gulf as
far inland as Boghé, which is now 380 km from the coast, and a mangrove vegetation developed in
the fluviomarine environment (Lezine, 1997). The sea regressed from Boghé to the present Senegal
delta in the medieval period accompanied by the mangrove vegetation, and the remains of this
vegetation still occur along creeks in the delta. The sequence of transgression -regression cycles is
thought to have had a great influence on soil formation in the Senegal valley.
hal-0
0364
226,
ver
sion
1 -
25 F
eb 2
009
Author manuscript, published in "CATENA 59 (2004) 93-116"
Vertisols are common in the Senegal valley and are widely used for irrigated agriculture,
particularly rice cultivation. About 75% of the total cultivated area are Vertisols occurring in
depressions (FAO-SEDAGRI, 1973; Favre et al., 1997). In the Vertisols, the superficial clay
horizon abruptly overlies a sandy horizon, which is coloured by iron oxides around former roots of
mangrove vegetation. The clay and sandy horizons are both 0.5 m thick in the Senegal delta but
together reach 6 m in the middle valley around Podor. The clay and sandy horizons have been
attributed to changes in sedimentation during and after the Nouakchottian transgression. Michel
(1973) attributed the sandy horizon to redeposition of Pleistocene (Ogolian) sand dunes during the
Nouakchottian transgression, and Deckers et al. (1997) attributed the clay to post-Nouakchottian
sedimentation during the Taffolian regression.
Potential acidity accumulated as pyrite in the mangrove roots. The pyrite was later oxidized as the
water table level lowered, causing high actual soil acidity. Deckers et al. (1993) suggested that in
many instances, the resulting Acid Sulfate Soils (thionic Fluvisols) are buried under more recent
sediments of fluviatile origin, and can therefore be considered as fossil soils.
The transgression was also responsible for incorporation of salt into the sediments. A complex
redistribution of the salt occurred subsequently in the landscape, involving several processes: (1)
concentration by evaporation, (2) aeolian deflation and clay dune formation, (3) transformation of
shell banks into gypseous layers, and (4) runoff and deposition of salt in the depressions around the
clay dunes (Barbiéro et al., in press).
After the last regression, the soils in the valley developed from the sediments. The most recent soils
should occur in the delta, particularly in the present remnants of mangrove areas, whereas the most
developed ones should occur upstream, at the limit of the transgression. We have shown that this
upstream sequence influences the distribution of salinity and its chemical composition along the
valley (Barbiéro et al., in press), and have suggested that the various processes formerly responsible
for soil development and features in the middle valley could still be active downriver in the lower
middle valley or delta. The aim of this paper is to show that the sequence from the delta to the
middle valley is relevant to understanding development of the soil profiles. We focus on the area of
transition between the two main soil types (Acid Sulfate Soil and Vertisol), and particularly on the
origin of the abrupt textural discontinuity at the base of the Vertisol profile.
2. Materials and methods 2.1. Site
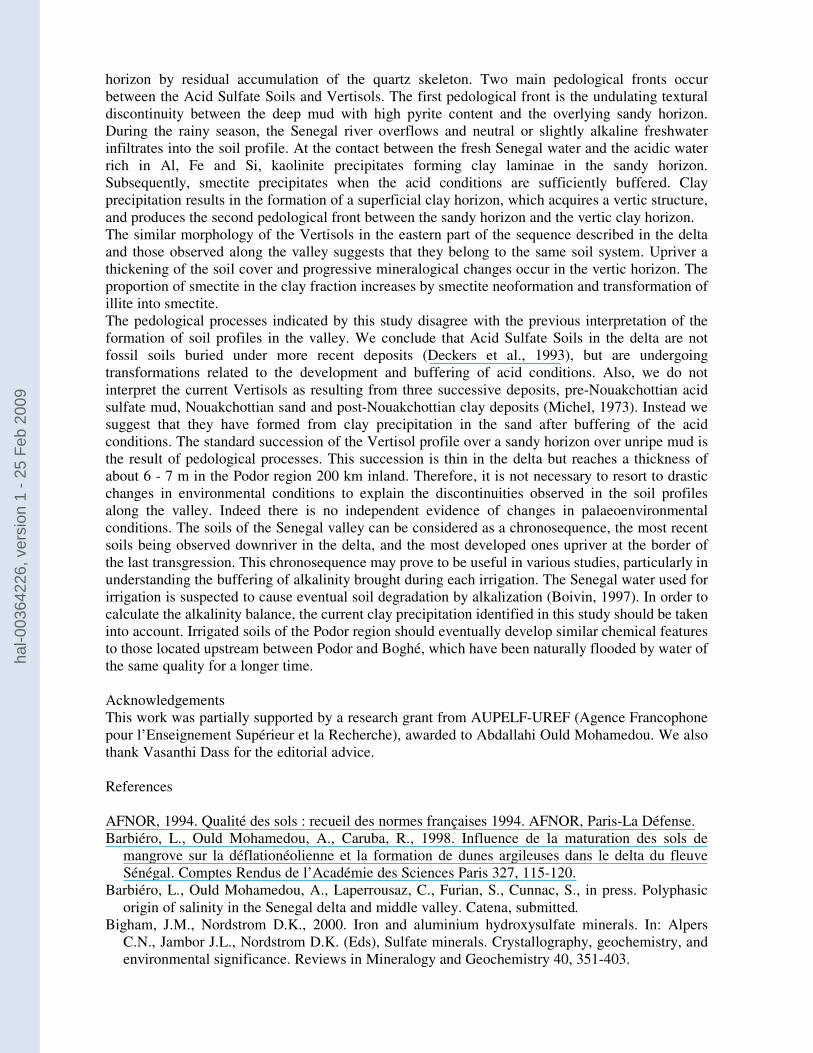
Fourteen sites were studied along the Senegal valley, on both the Mauritanian and Senegalese sides
of the river, and from the delta to the Podor region (Fig. 1). The semiarid climate is characterized by
a wet season (approximately 200 mm of rainfall) from July to September, a cold and dry season
from October to February, and a hot dry season from March to June. The average temperature is 24
jC in January and 39 jC in May. The dry and warm winds increase evaporation, so that average
Class A pan evaporation exceeds average rainfall for each month and by >2000 mm annually
(Verheye, 1995). In the floodplain, the water table fluctuates from the topsoil to 1 m depth in the
delta, and from 4to 8-m depth in the Podor region (Zanolin et al., 1997; Hammecker and Maeght,
2002).
2.2. Soils
Thionic Fluvisols containing pyrite (FeS2) and jarosite [KFe3(SO4)2(OH)6] occur near the
remaining mangroves (Le Brusq et al., 1987; Deckers et al., 1997). Beyond these areas, the most
representative soil types are Gypsic Fluvisols, Calcic Gypsic Fluvisols and Vertisols (FAO, ISRIC,
ISSS, 1998). Upriver in the middle valley, Vertisols predominate in the depressions (locally Gypsic
or Calcic), and Fluvisols occur on the river banks.
2.3. Fieldwork
hal-0
0364
226,
ver
sion
1 -
25 F
eb 2
009
The first step of the fieldwork was in the Diawling National Park, which is a narrow triangle of land
between the coast and the Senegal River in southern Mauritania. The flooded area of the park
consists of the permanently flooded Gambar basin, the dam reserve of the Organisation for the
Development of the Senegal Valley, and the periodically flooded Bell Basin, which includes the
estuarine area, whose elevation is greater than that of the Gambar. The fieldwork was concentrated
in the Bell Basin between the Birette and Ziré dunes (16j20VN, 17j25VW) close to the Khurumbam
Creek, which is a tributary of the Bell Creek (Fig. 1). A 100-m soil sequence was studied
perpendicular to the Khurumbam creek bed, and intersecting the present edge of the mangrove area.
The soil morphology was based on 11 hand boreholes and 3 pits (P1 to P3), excavated at the lateral
transitions of the soil. The horizons are described according to the classification for Acid Sulfate
Soils of the International Institute for Land Reclamation and Improvement (Dent, 1986).
The second step of the field work was based on 13 sites along the Senegal valley. Since no notable
lateral variations were noticed, the soil morphology was described in isolated profiles from
boreholes or excavated pits (P4 -P16). Samples were taken from the main horizons and additional
samples from 5 cm above and below the discontinuity between the clay and sandy horizons.
2.4. Laboratory work
Soil pH was measured in the field (pHfield) and in the laboratory after hydrogen peroxide (30%
H2O2) treatment (pHH2O2) in order to oxidize FeS2 (Van Beers, 1962). The soil water content
(Wc) was measured by weighing soil samples before and after oven drying at 105 jC. Detailed
particle size distribution (clay, 2 silt fractions and 17 sand fractions) was determined by sieving and
sedimentation on 100 g samples. Total carbon content in the samples was determined by dry
combustion in an elemental analyser (Thermoquest CN 2100). Organic matter was estimated as
1.724 total carbon. The clay ( < 2 Am) fraction of 30 samples was separated by sedimentation after
destruction of the organic matter with dilute H2O2. Its mineralogy was investigated by X-ray
diffraction (XRD) using a Rigaku CN4012A2 diffractometer (cobalt anticathode) on orientated
specimens studied under 6 different conditions: K saturation (K), Mg saturation (Mg), glycerol
treatment (Gly), and heating at 110, 450 and 550 jC (110, 450 and 550). The samples were scanned
from 0.35j to 18j at 0.5j per minute. Al and Fe between the layers were removed from four samples
by treatment with Na-citrate buffered at pH 7.3, followed by K- or Mg-saturation and finally
heating at 110 jC overnight (Cit-K-110 or Cit-Mg-110 treatment) (Tamura, 1958; Robert and
Tessier, 1974).
Cation exchange capacities (CEC) of the soil samples were measured by the cobalt hexamine
trichloride non pH-buffered method (AFNOR NF X31-130, of AFNOR, 1994). The pH of the
collected samples was adjusted to within the range over which the cobalt hexamine complex is
stable (Ciesielski and Sterckeman, 1997). Cobalt ion concentration was measured by ICP Varian
(Vista) in the exchange solution. The CEC of the organic matter was estimated as 250 meq 100 g_ 1
organic matter. The remainder of the CEC was attributed to the clay fraction.
For six samples collected along the valley in the clay horizon of profiles P4, P5, P8, P10, P14 and
P15, the < 2-Am fraction was dissolved with hydrofluoric acid, and the extracted potassium,
aluminium and silica were measured by atomic absorption spectroscopy. After digesting the clay
from the same samples in HF + HClO4 in teflon bombs, iron was determined by flame atomic
absorption spectroscopy using the 373.7-nm wavelength (Voinovitch et al., 1962).
The relative abundance of clay mineral groups (kaolinite, smectite and illite) was calculated by
three methods:(i) (Method M1). The percentage composition of the clay groups was determined
semi-quantitatively from the area under selected XRD peaks, following standard procedures of
Biscaye (1965). As the XRD method is semi-quantitative with an accuracy of about 10% of the
hal-0
0364
226,
ver
sion
1 -
25 F
eb 2
009
relative clay mineral abundance, we quote values to the nearest 1% (Kahle et al., 2002).(ii) (Method
M2). The potassium measured after HF +HClO4 digestion was attributed entirely to illite. The
percentage of illite in the samples was calculated as follows:
illitesample% = 100. (Ksample % / Killite) (1)
where illitesample% is the percentage of illite in the sample, Ksample% is the percentage of K in
the solution after HF + HClO4 digestion and Killite is the weight percentage of K in the illite. An
illite with iron in the tetrahedral position was considered for this calculation:
illite = [Si6.7(Al0.65, Fe3+
0.65)] O20 [(Al1.95, Fe3+
1.95) (Fe2+
0.05, Mg0.05)] (OH)4 K1.4 (2)
which gives Killite = 6.4%.The contribution of illite to the CEC of the clay fraction was calculated
assuming that illite has an exchange capacity of 25 meq 100 g_ 1. The relative proportions of
kaolinite and smectite were calculated from the CEC of the clay fraction based on their assumed
exchange capacities (kaolinite: 10 meq 100_ 1; smectite: 100 meq 100 g_ 1).(iii) (Method M3). The
potassium measured after HF + HClO4 digestion was attributed to illite. The proportion of Fe (Fea)
attributed to illite was calculated as follows:
Fea = (Feillite . illitesample%)/100 (3)
where Feillite is the weight percentage of Fe in the illite calculated from the structural formula in
Eq. (2) (Feillite = 2%).
In a recent study of clay minerals in the Podor region, Favre et al. (2002) calculated that structural
Fe (tetrahedral and octahedral) content is about 120 cmol kg_ 1 in the smectite. Therefore, after
subtracting this value (Fea), the remaining Fe (Feb) was attributed entirely to a smectite of iron-
beidellite type:
beidellite = [Si7(Al0.5, Fe3+
0.5)] O20 [(Al2.2, Fe3+
2) (OH)4 Ca0.1 Na0.2 (4)
The percentage of beidellite was calculated as follows:
beidellitesample% = 100 (Feb / Febeidellite) (5)
where Febeidellite is calculated from the structural formula of the beidellite in Eq. (4) (17.3%). The
proportions of Al attributed to illite (Ala) and beidellite following:
Ala = (Alillite . illitesample%)/100 (6)
Alb = (Albeidellite . beidellitesample%)/100 (7)
where Alillite and Albeidellite are the respective weight percentage of Al in the illite and beidellite
(1% and 9%). After removing Ala and Alb, the remaining Al (Alc) was attributed to kaolinite with
no substitution of Fe for Al:
kaolinite = Si4 O10 Al4 (OH)8 (8)
The percentage of kaolinite in the samples was calculated as follows:
kaolinitesample% = 100 (Alc / Alkaolinite) (9)
where Alkaolinite is the weight percentage of Al in the kaolinite calculated from the structural
hal-0
0364
226,
ver
sion
1 -
25 F
eb 2
009
formula of kaolinite (21%).
Finally, the remaining silica was attributed to quartz, which was detected in small quantities in the <
2-Am fraction by XRD.
3. Results
3.1. Soil morphology
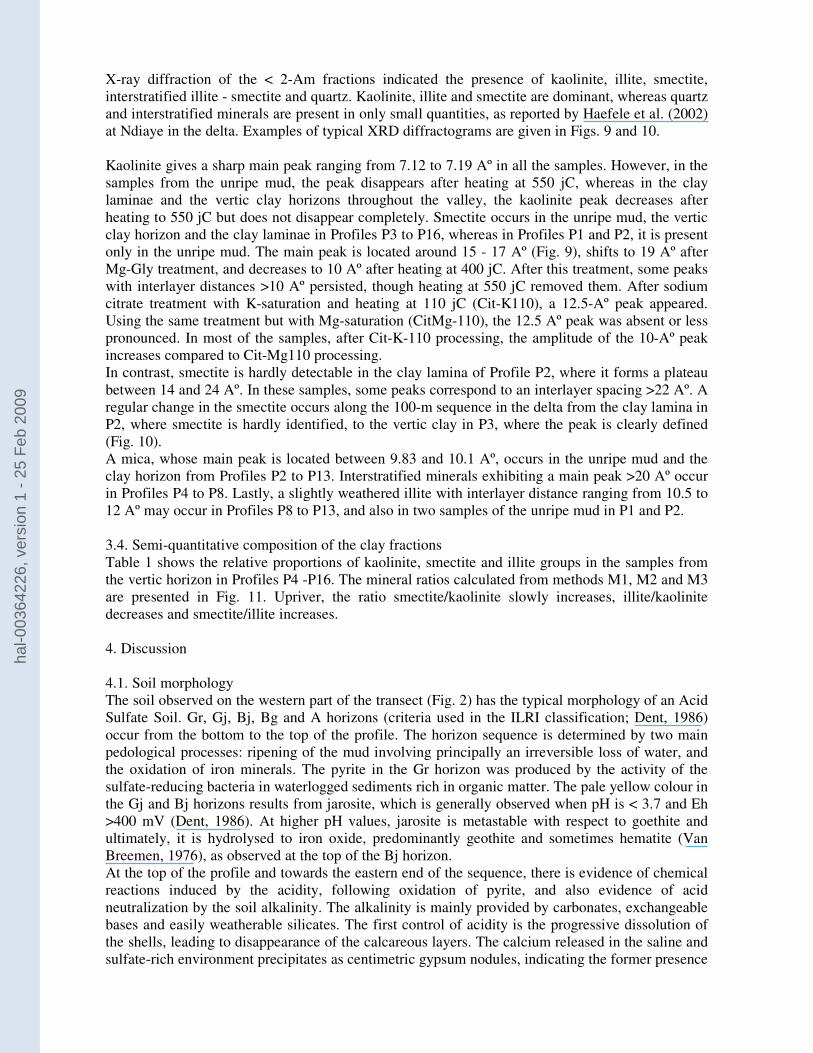
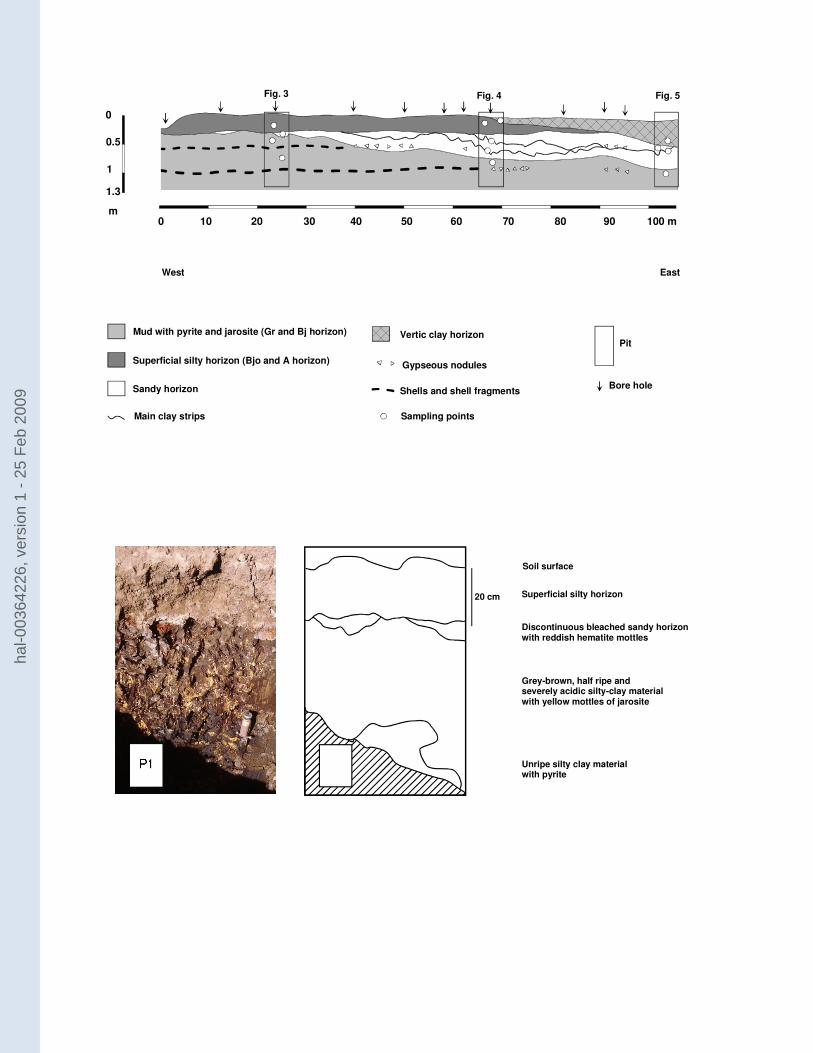
Fig. 2 shows the soil distribution pattern in the delta. In the creek bed at the extreme west of
the transect, unripe silty clay rich in pyrite occurs at 0.4-m depth (Gr horizon, pHfield = 5.6,
pHH2O2 = 2.7, Wc = 60%), and is overlain by a greyish brown, half ripe and strongly acidic silty
clay with yellow mottles of jarosite (Gj and Bj horizons, pHfield = 4.5, pHH2O2 = 2.6, Wc = 42%).
The superficial greyish brown horizon has a coarse prismatic structure mottled with reddish brown
iron oxide at the base (Bg horizon, pHfield = 4.7, pHH2O2 = 4.3). The surface soil has a soft
powdery structure.
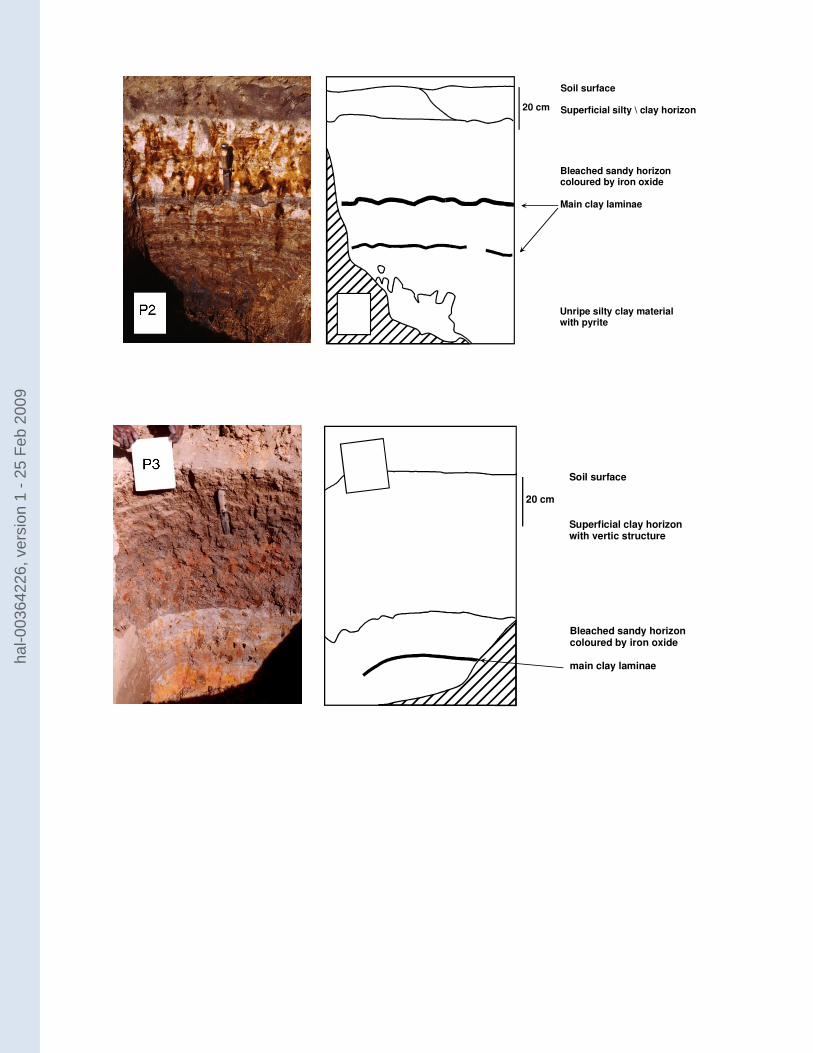
Near 12 m to the east, a bleached sandy horizon occurs at 0.2-m depth and is discontinuous between
12 and 24 m (Fig. 3). Its lower boundary is abrupt, wavy and emphasized by reddish hematite
mottles, whereas its upper boundary is gradual and irregular. The thickness of this horizon increases
progressively from 0.2 to 0.95 m between 24 and 100 m. It is locally bleached, but around the
former mangrove roots, it is coloured by iron oxide (Fig. 4). Various undulating clay laminae 1 - 5
cm thick occur in the sandy horizon, and are sometimes anastomosing. In the unripe mud located
deep below, the pHfield reaches 3.9 (pHH O2 = 2.9) and Wc is about 33%. Near 66 m east of the
creek bed, the surface structure changes abruptly from soft powder to centimetric platelets, where
there is an abrupt increase in topsoil clay content from 19 to 29%. The thickness of this clay topsoil
horizon increases irregularly from 66 m to the end (100 m) of the surveyed transect (Fig. 5), where
a decimetric vertic structure appears and the clay content reaches 55%(pHfield = 6.1, pHH O2 = 5.9
and Wc = 17%). The lower boundary of the vertic clay horizon is abrupt and many of the laminae
located in the sandy horizon merge into its base.
Two layers rich in shells and shell fragments occur in the western part of the sequence. The first
layer at 0.6-m depth is composed of Anadara senilis fragments and the second (0.9-m depth) of
Thympanotonus fuscatus shells. In both layers, the shells are strong only to distances of 33 and 62
m, respectively. Further east, they are replaced by shells weathered by dissolution, and yet further
east centimetric gypseous nodules replace the two shell layers.
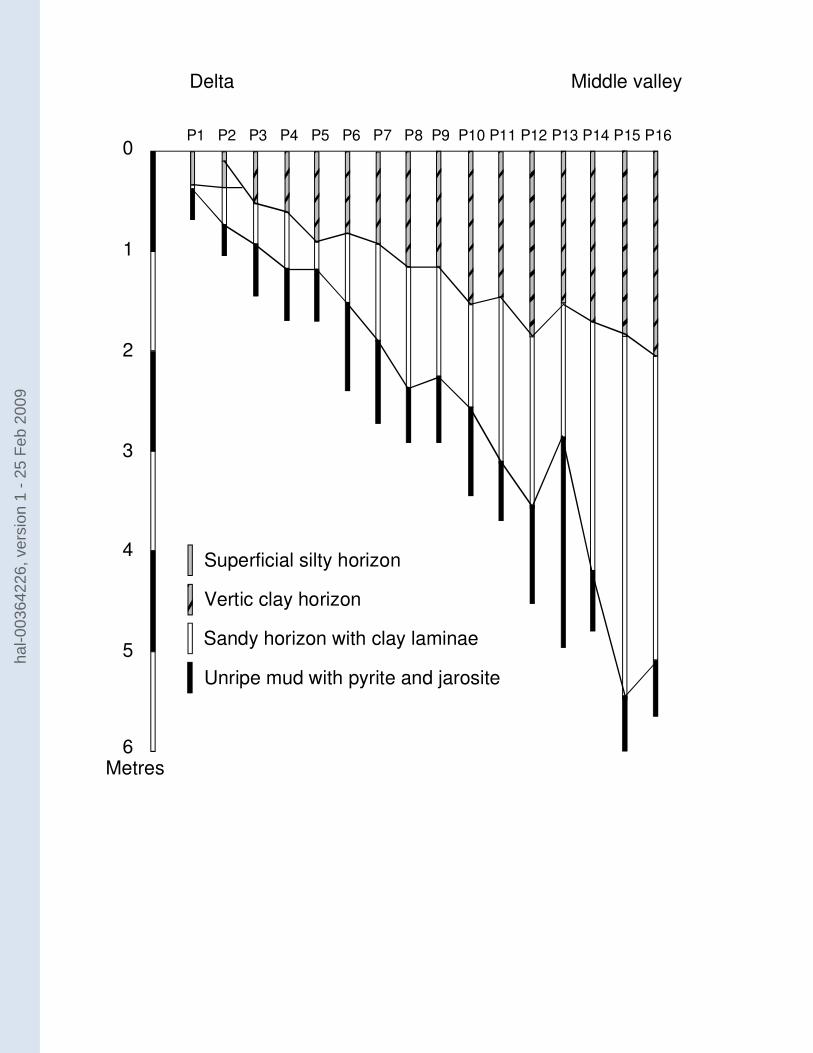
Up the Senegal valley, the Profiles P4 to P16 have the same horizon sequence as that described in
the final part of the sequence (Profile P3, Fig. 5). Three main horizons are distinguished from top to
bottom: a brown -grey clay with decimetric vertic structure (pHfield ranging from 5.9 to 6.7 along
the valley), underlain by a sandy horizon with an abrupt, slightly undulating boundary. The sandy
horizon is usually bleached but sometimes coloured by iron oxides, and contains several undulating
clay laminae. Finally, an irregular merging boundary leads to a black mud. Profiles P3 -P16 differ
only in the thickness of the horizons (Fig. 6).
3.2. Sand fraction granulometry
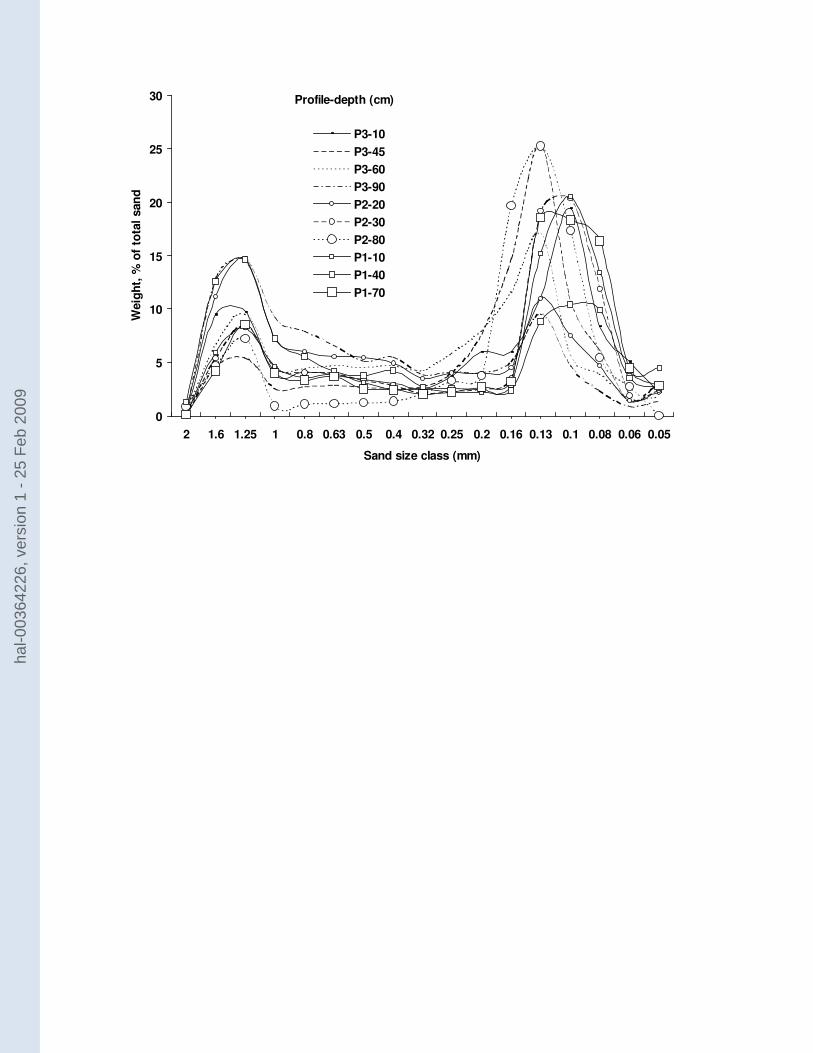
In the delta (P1 to P3), there is a bimodal distribution of the sand fraction, with modes at 0.13 and
1.25 mm in all the horizons (Fig. 7). Along the valley (P4 to P16), the grainsize distribution varies
significantly between profiles. A coarse unimodal distribution occurs in P6 and P7, a fine unimodal
distribution in P4 and P14, a bimodal distribution in P15, etc. (Fig. 8). However, the sand grain-size
distribution is always similar on either side of the abrupt discontinuity between the vertic clay
horizon and the sandy horizon.
3.3. Clay mineralogy
hal-0
0364
226,
ver
sion
1 -
25 F
eb 2
009
X-ray diffraction of the < 2-Am fractions indicated the presence of kaolinite, illite, smectite,
interstratified illite - smectite and quartz. Kaolinite, illite and smectite are dominant, whereas quartz
and interstratified minerals are present in only small quantities, as reported by Haefele et al. (2002)
at Ndiaye in the delta. Examples of typical XRD diffractograms are given in Figs. 9 and 10.
Kaolinite gives a sharp main peak ranging from 7.12 to 7.19 Aº in all the samples. However, in the
samples from the unripe mud, the peak disappears after heating at 550 jC, whereas in the clay
laminae and the vertic clay horizons throughout the valley, the kaolinite peak decreases after
heating to 550 jC but does not disappear completely. Smectite occurs in the unripe mud, the vertic
clay horizon and the clay laminae in Profiles P3 to P16, whereas in Profiles P1 and P2, it is present
only in the unripe mud. The main peak is located around 15 - 17 Aº (Fig. 9), shifts to 19 Aº after
Mg-Gly treatment, and decreases to 10 Aº after heating at 400 jC. After this treatment, some peaks
with interlayer distances >10 Aº persisted, though heating at 550 jC removed them. After sodium
citrate treatment with K-saturation and heating at 110 jC (Cit-K110), a 12.5-Aº peak appeared.
Using the same treatment but with Mg-saturation (CitMg-110), the 12.5 Aº peak was absent or less
pronounced. In most of the samples, after Cit-K-110 processing, the amplitude of the 10-Aº peak
increases compared to Cit-Mg110 processing.
In contrast, smectite is hardly detectable in the clay lamina of Profile P2, where it forms a plateau
between 14 and 24 Aº. In these samples, some peaks correspond to an interlayer spacing >22 Aº. A
regular change in the smectite occurs along the 100-m sequence in the delta from the clay lamina in
P2, where smectite is hardly identified, to the vertic clay in P3, where the peak is clearly defined
(Fig. 10).
A mica, whose main peak is located between 9.83 and 10.1 Aº, occurs in the unripe mud and the
clay horizon from Profiles P2 to P13. Interstratified minerals exhibiting a main peak >20 Aº occur
in Profiles P4 to P8. Lastly, a slightly weathered illite with interlayer distance ranging from 10.5 to
12 Aº may occur in Profiles P8 to P13, and also in two samples of the unripe mud in P1 and P2.
3.4. Semi-quantitative composition of the clay fractions
Table 1 shows the relative proportions of kaolinite, smectite and illite groups in the samples from
the vertic horizon in Profiles P4 -P16. The mineral ratios calculated from methods M1, M2 and M3
are presented in Fig. 11. Upriver, the ratio smectite/kaolinite slowly increases, illite/kaolinite
decreases and smectite/illite increases.
4. Discussion
4.1. Soil morphology
The soil observed on the western part of the transect (Fig. 2) has the typical morphology of an Acid
Sulfate Soil. Gr, Gj, Bj, Bg and A horizons (criteria used in the ILRI classification; Dent, 1986)
occur from the bottom to the top of the profile. The horizon sequence is determined by two main
pedological processes: ripening of the mud involving principally an irreversible loss of water, and
the oxidation of iron minerals. The pyrite in the Gr horizon was produced by the activity of the
sulfate-reducing bacteria in waterlogged sediments rich in organic matter. The pale yellow colour in
the Gj and Bj horizons results from jarosite, which is generally observed when pH is < 3.7 and Eh
>400 mV (Dent, 1986). At higher pH values, jarosite is metastable with respect to goethite and
ultimately, it is hydrolysed to iron oxide, predominantly geothite and sometimes hematite (Van
Breemen, 1976), as observed at the top of the Bj horizon.
At the top of the profile and towards the eastern end of the sequence, there is evidence of chemical
reactions induced by the acidity, following oxidation of pyrite, and also evidence of acid
neutralization by the soil alkalinity. The alkalinity is mainly provided by carbonates, exchangeable
bases and easily weatherable silicates. The first control of acidity is the progressive dissolution of
the shells, leading to disappearance of the calcareous layers. The calcium released in the saline and
sulfate-rich environment precipitates as centimetric gypsum nodules, indicating the former presence
hal-0
0364
226,
ver
sion
1 -
25 F
eb 2
009
of the shell beds in the soil (Dent, 1980, 1986). According to Van Breemen (1973a,b, 1976), acid
neutralization by protonation of clay minerals occurs after dissolution of the carbonates. The
resulting protonated clays are not stable (Laudelou and Eeckman, 1958) and their crystalline
structure is attacked by H+, liberating silica and metal ions, principally aluminium, iron,
magnesium and potassium into the soil solution (Fitzpatrick et al., 1998). Van Breemen (1973a,b,
1976) showed that there is significant dissolution of silicate clays at pH < 4. The acid hydrolysis of
aluminosilicate clays can contribute 10% of the buffering of the acid produced by oxidation of
pyrite (Dent and Raiswell, 1982).
We therefore interpret the sandy bleached horizon as resulting from acid hydrolysis of
aluminosilicate clays, leading to relative accumulation of quartz, and not as a result of
sedimentation. This is based on the following observations: 1. The sandy material appears first at
about 20 -m depth, where presently the oxidation of pyrite and jarosite creates the most acid field
conditions. 2. In the unripe mud, the horizontal shell beds indicate stratification, which is
intersected by the lower boundary of the sandy horizon. 3. The bimodal sand size distribution (Fig.
6) persists throughout the sequence in spite of the textural differences in the three horizons, namely,
mud, sand and clay. This would not happen if the soil profile were a result of different
sedimentation episodes, as the different sedimentation regimes required for the deposition of these
three materials would not preserve the same sand size distributions.
The textural discontinuity between the mud and the sandy material is therefore interpreted as a
pedological transformation front, resulting from acidification, dissolution of aluminosilicate clays
and relative accumulation of quartz skeleton. The origin of the textural discontinuity between the
sandy horizon and the clay vertic horizon will be discussed below using other data collected along
the valley.
4.2. Clay fraction of the unripe mud
In the unripe mud (Profiles P1 and P2), the < 2-Am fraction is composed of kaolinite, smectite and
micas. The presence of a peak at about 12.5 Aº after Cit-K-110 processing
may indicate neoformed smectite (Robert, 1975). In the same samples, the increase of the peak at
10 Aº, indicating collapse of the smectite layer after K saturation, should characterize a smectite
formed from mica. However, the presence of well-crystallized mica and the absence of
interstratified minerals in spite of some slightly weathered illite suggest that the transformation of
the mica into smectite did not occur in the mud. The mineralogy of the clay fraction in the mud of
Profiles P1 and P2 therefore seems to be that of the original river sediment, which is in agreement
with the composition of sediment at the river mouth (Gac and Kane, 1986). To summarize, the
mineralogical profile of the < 2-Am fraction in the unripe mud is kaolinite, illite and two types of
smectite, one of which is formed by transformation of micas and the other by chemical
precipitation.
4.3. Clay fraction of the clay laminae and vertic horizon
The kaolinite in the samples taken from the clay laminae is slightly heat-resistant and therefore
differs from that of the mud. This suggests that it was precipitated in the laminae. In acid sulfate
waters, high Al contents occur as a result of aluminosilicate dissolution, but the geochemistry of Al
is significantly modified by sulfate, so that gibbsite and kaolinite are not the most stable phases
(Bigham and Nordstrom, 2000). In some parts of the Senegal delta where the acid soil solution
concentrates, Le Brusq et al. (1987) observed soluble aluminium sulfate minerals. However, during
overflow of the Senegal River, a neutral or slightly alkaline water with lower ionic concentrations
easily infiltrates the sandy horizon of the acid soil. After dilution and partial control of the acidity
by the Senegal freshwater, kaolinite can form. The clay laminae undulate in the soil profiles and are
linked to the vertic superficial horizon, and may have originated at the moisture front. The
geochemical contrast at the contact between the acid water table and the Senegal water should cause
precipitation of aluminosilicate, which first forms a gel, as observed in a similar geochemical
environment in Spain (Gimeno et al., 1994), and is then quickly reorganized into kaolinite.
hal-0
0364
226,
ver
sion
1 -
25 F
eb 2
009
The smectite in the superficial vertic horizon at P3 is better organized than that in the deeper clay
lamina in Profile P2 (Fig. 10). The large plateau on the X-ray trace (P2 lamina 1) corresponds to an
interlayer spacing >22 Aº and therefore suggests weakly organized smectite layers. It cannot be
attributed to interstratified minerals because peaks at 14 and 24 Aº are not present simultaneously.
Hence, we conclude that smectite was formed later than kaolinite in the clay laminae and vertic
horizon, probably when acid conditions were sufficiently buffered in the soil solution.
The mineralogy of the < 2-Am fraction in the mud differs from that in the clay laminae. Therefore,
contrary to our previous claims (Barbiéro et al., 1998), the clay laminae are not the remains of the
mud, nor are they formed by redistribution of the clay fraction in the soil profile. They can only be
formed by dissolution of the clay fraction of the mud and precipitation in the clay laminae.
4.4. Changes along the Senegal valley
The sand size distribution is similar on both sides of the textural discontinuity between the sandy
horizon and vertic clay horizon, but varies along the river from one profile to another, suggesting
that the discontinuity is pedogenic in origin. Indeed, it is unlikely that the sandy and clay horizons
arise from different sedimentation processes, because the clay would not retain exactly the same
sand size distribution as the sand below. At the contact between the sandy horizon and the vertic
clay horizon, the strong acidity is buffered and there is no evidence of clay dissolution. Therefore,
we interpret the contact as a pedological transformation front, where clay is precipitated, so that the
clay horizon is expanding at the expense of the sandy material.
In the vertic clay horizon of Profiles P3 -P16, the kaolinite remains similarly heatresistant to that
observed in the clay laminae, and was probably precipitated in the same conditions, i.e. in a very
contrasting chemical environment and in the initial stage of acid buffering.
The smectite is better crystallized in the vertic clay horizon than in the clay lamina of P2. The peak
at 12.5 Aº observed after the Cit-K-110 treatment disappears after the Cit-Mg 110 treatment,
indicating formation by chemical precipitation, which probably occurred after the buffering of
acidity. The increase in smectite contents upstream indicates an increasing period of precipitation of
smectite.
The crystallinity of the illite is good in the downstream Profiles P4, P5 and P6, but upriver the
intensity of the peak decreases, the width increases and the peak almost disappears at P12, which
agrees with the relative proportions calculated from CEC and chemical data after HF + HClO4
digestion. The parallel increases in smectite contents and the 10-Aº peak after the Cit-K-110
treatment indicate the transformation of illite into smectite. Our results agree with the observation
of Haefele et al. (2002), who also observed the presence of kaolinite and smectite without illite in
the clay fraction at Fanaye close to P12.
To summarize, taking the kaolinite content as a reference in the clay fraction, the ratio
smectite/kaolinite increases upriver because of chemical precipitation of smectite and also because
of the progressive transformation of illite into smectite. The maximum proportion of smectite in the
clay fraction in our samples was 46%, but upriver beyond our sequence up to 70% of smectite and
30% of kaolinite were reported in more superficial samples of the vertic horizon (Favre et al.,
2002).
5. Conclusions
In a previous study, we showed that eolian deposition is a major soil forming factor in the Senegal
valley (Mohamedou et al., 1999; Barbiéro et al., in press). The present paper suggests that the
development and buffering of soil acidity is also a major factor in the formation of the soil profiles.
Acid Sulfate Soils (thionic Fluvisols) occur in the delta under the remains of mangrove vegetation,
and their mineralogical composition suggests they are inherited from sediments of the Senegal
River.
The oxidation of pyrite causes strong acidity in the soil. This is buffered first by dissolution of the
shell deposits, which results in the formation of gypseous layers. Subsequently, it is buffered by
protonation and acid hydrolysis of aluminosilicate clays, which result in the formation of a sandy
hal-0
0364
226,
ver
sion
1 -
25 F
eb 2
009
horizon by residual accumulation of the quartz skeleton. Two main pedological fronts occur
between the Acid Sulfate Soils and Vertisols. The first pedological front is the undulating textural
discontinuity between the deep mud with high pyrite content and the overlying sandy horizon.
During the rainy season, the Senegal river overflows and neutral or slightly alkaline freshwater
infiltrates into the soil profile. At the contact between the fresh Senegal water and the acidic water
rich in Al, Fe and Si, kaolinite precipitates forming clay laminae in the sandy horizon.
Subsequently, smectite precipitates when the acid conditions are sufficiently buffered. Clay
precipitation results in the formation of a superficial clay horizon, which acquires a vertic structure,
and produces the second pedological front between the sandy horizon and the vertic clay horizon.
The similar morphology of the Vertisols in the eastern part of the sequence described in the delta
and those observed along the valley suggests that they belong to the same soil system. Upriver a
thickening of the soil cover and progressive mineralogical changes occur in the vertic horizon. The
proportion of smectite in the clay fraction increases by smectite neoformation and transformation of
illite into smectite.
The pedological processes indicated by this study disagree with the previous interpretation of the
formation of soil profiles in the valley. We conclude that Acid Sulfate Soils in the delta are not
fossil soils buried under more recent deposits (Deckers et al., 1993), but are undergoing
transformations related to the development and buffering of acid conditions. Also, we do not
interpret the current Vertisols as resulting from three successive deposits, pre-Nouakchottian acid
sulfate mud, Nouakchottian sand and post-Nouakchottian clay deposits (Michel, 1973). Instead we
suggest that they have formed from clay precipitation in the sand after buffering of the acid
conditions. The standard succession of the Vertisol profile over a sandy horizon over unripe mud is
the result of pedological processes. This succession is thin in the delta but reaches a thickness of
about 6 - 7 m in the Podor region 200 km inland. Therefore, it is not necessary to resort to drastic
changes in environmental conditions to explain the discontinuities observed in the soil profiles
along the valley. Indeed there is no independent evidence of changes in palaeoenvironmental
conditions. The soils of the Senegal valley can be considered as a chronosequence, the most recent
soils being observed downriver in the delta, and the most developed ones upriver at the border of
the last transgression. This chronosequence may prove to be useful in various studies, particularly in
understanding the buffering of alkalinity brought during each irrigation. The Senegal water used for
irrigation is suspected to cause eventual soil degradation by alkalization (Boivin, 1997). In order to
calculate the alkalinity balance, the current clay precipitation identified in this study should be taken
into account. Irrigated soils of the Podor region should eventually develop similar chemical features
to those located upstream between Podor and Boghé, which have been naturally flooded by water of
the same quality for a longer time.
Acknowledgements
This work was partially supported by a research grant from AUPELF-UREF (Agence Francophone
pour l’Enseignement Supérieur et la Recherche), awarded to Abdallahi Ould Mohamedou. We also
thank Vasanthi Dass for the editorial advice.
References
AFNOR, 1994. Qualité des sols : recueil des normes françaises 1994. AFNOR, Paris-La Défense.
Barbiéro, L., Ould Mohamedou, A., Caruba, R., 1998. Influence de la maturation des sols de
mangrove sur la déflationéolienne et la formation de dunes argileuses dans le delta du fleuve
Sénégal. Comptes Rendus de l’Académie des Sciences Paris 327, 115-120.
Barbiéro, L., Ould Mohamedou, A., Laperrousaz, C., Furian, S., Cunnac, S., in press. Polyphasic
origin of salinity in the Senegal delta and middle valley. Catena, submitted.
Bigham, J.M., Nordstrom D.K., 2000. Iron and aluminium hydroxysulfate minerals. In: Alpers
C.N., Jambor J.L., Nordstrom D.K. (Eds), Sulfate minerals. Crystallography, geochemistry, and
environmental significance. Reviews in Mineralogy and Geochemistry 40, 351-403.
hal-0
0364
226,
ver
sion
1 -
25 F
eb 2
009
Biscaye, P.E., 1965. Mineralogy and sedimentation of a recent deep-sea clay in the Atlantic Ocean,
adjacent seas and oceans. Geological Society of America Bulletin 76, 803-832.
Boivin, P., 1997. Soil degradation in irrigation schemes in the Senegal river middle valley:
mechanisms, characterization methods and actual situation. In: Miézan, K.M., Wopereis, M.C.S.,
Dingkuhn, M., Deckers, J., Randolph, T.F., (Eds), Irrigated rice in the Sahel : Prospects for
sustainable development. Warda/Adrao, Dakar, Senegal, pp. 37–49.
Ciesielski, H., Sterckeman, T., 1997. A comparison between three methods for the determination of
cation exchange capacity and exchangeable cations in soils. Agronomie 17, 9-16.
Deckers, J., Raes, D., Merckx, R., Diallo, A., 1993. The fate of Salic and Thionic Fluvisols under
irrigated rice in the Senegal river delta. Pedologie 43, 389-401.
Deckers, J., Dondeyne, S., Vandekerckhoven, L., Raes, D., 1997. Major soils and their formation in
the West African Sahel. In: Miézan, K.M., Wopereis, M.C.S., Dingkuhn, M., Deckers, J.,
Randolph, T.F., (Eds), Irrigated rice in the Sahel : Prospects for sustainable development.
Warda/Adrao, Dakar, Senegal, pp. 23-35.
Dent, D., 1980. Acid sulphate soils : morphology and prediction. Journal of Soil Science 31, 81-99.
Dent, D., 1986. Acid sulphate soils : a baseline for research and development. ILRI Publication 39.
Wageningen, The Netherlands.
Dent, D.L., Raiswell, R.W., 1982. Quantitative model to predict the rate and severity of acid sulfate
development : a case study, the Gambia. In: Dost H., Van Breemen N., (Eds), Proceedings of the
Bangkok symposium on Acid Sulfate Soils. ILRI Publication 31. Wageningen, The Netherlands,
pp. 73-95.
FAO-SEDAGRI, 1973. Etude hydro-agricole du bassin du fleuve Sénégal. Etude pédologique, 251
p. map 1/50,000e.
FAO, ISRIC, ISSS, 1998. World Reference Base for Soil Resources, Rome, Italy.
Faure, H., Fontes, J.C., Hebrard, L., Monteillet, J., Pirazzoli, P.A., 1980. Geoidal changes and
shore-level tilts along Holocene estuaries: Sénégal river area, West Africa. Science 210, 421-
423.
Favre, F., Boivin, P., Wopereis, M., 1997. Water movement and soil swelling in a dry, cracked
Vertisol. Geoderma 78, 113-123.
Favre, F., Tessier, D., Abdelmoula, M., Génin, J.M., Gates, W.P., Boivin, P., 2002. Iron reduction
and changes in cation exchange capacity in intermittently waterlogged soil. European Journal of
Soil Science 53, 175-193.
Fitzpatrick, R.W., Merry, R.H., Williams, J., White, I., Bowman, G., Taylor, G., 1998. Acid Sulfate
Soil Assessment: Coastal, Inland and Mine spoil conditions. National Land and Water Resources
Audit Methods Paper. Canberra, Australia.
Gac, J.Y., Kane, A., 1986. Le fleuve Sénégal : I. Bilan hydrologique et flux continentaux de
matières particulaires à l’embouchure. Sciences Géologiques Bulletin 39, 99-130.
Gimeno, M.J., Tena, J.M., Auque, L.F., Mandado, J., 1994. Geochemical characterization of the
acidic waters in the Arroyo del Val system Zaragoza, Spain. Boletin Real Sociedad Espanola de
Historia Natural: Seccion Geologica 89, 5-17.
Haefele, S.M., Wopereis, M.C.S., Wiechmann, H., 2002. Long-term fertility experiments for
irrigated rice in the West African Sahel: agronomic results. Field Crops Research 78, 119–131.
Hammecker, C., Maeght, J.L., 2002. Suivi etévaluation de la qualité des eaux et de l’impact
environnemental des aménagements du secteur N’Gallenka. 2nd report, Institut de Recherche
pour le Développement, Dakar, Senegal.
Kahle, M., Kleber, M., Jahn, R., 2002. Review of XRD-based quantitative analyses of clay minerals
in soil: the suitability of mineral intensity factors. Geoderma 109, 191-205.
Laudelou, H., Eeckman, J.P., 1958. La stabilité chimique des suspensions d’argile saturées par l’ion
hydrogène. International Society of Soil Science Transactions II, IV Commission, Hamburg 2,
193-199.
Le Brusq, J.Y., Loyer, J.Y., Mougenot, B., Carn, M., 1987. Nouvelles paragenèses à sulfates
d’aluminium, de fer, et de magnésium, et leur distribution dans les sols sulfatés acides du
hal-0
0364
226,
ver
sion
1 -
25 F
eb 2
009
Sénégal. Science du Sol 25, 173-184.
Lezine, A.M., 1997. Evolution of the West African mangrove during the Late Quaternary: A
review. Geographie Physique et Quaternaire 51, 405-414.
Michel, P., 1973. Les bassins des fleuves Sénégal et Gambie. Etude géomorphologique. Mémoire
ORSTOM 63. Paris, France.
Mohamedou, A.O., Aventurier, A., Barbiéro, L., Caruba, R., Valles, V., 1999. Geochemistry of clay
dunes and associated pan in the Senegal delta (Mauritania). Arid Soil Research and
Rehabilitation 13, 265-280.
Robert, M., 1975. Principes de détermination qualitative des minéraux argileux à l’aide des Rayons
X. Annales Agronomiques 26, 363-399.
Robert, M., Tessier, D., 1974. Méthode de préparation des argiles des sols pour desétudes
minéralogiques. Annales Agronomiques 25, 859-882.
Tamura, T., 1958. Identification of clay minerals from acid soils. Journal of Soil Science 9, 141-
147.
Van Beers, W.F.J., 1962. Acid Sulphate Soils. ILRI Bulletin 3, Wageningen, The Netherlands.
Van Breemen, N., 1973a. Dissolved aluminium in Acid Sulfate Soils and in acid mine waters. Soil
Science Society of America Proceedings 37, 694-697.
Van Breemen, N., 1973b. Soil forming processes in acid sulfate soils. In Dost H. (Ed.), Acide
Sulfate Soil. Proceedings of the First International Symposium. Vol. 1, Wageningen, The
Netherlands.
Van Breemen, N., 1976. Genesis and solution chemistry of acid sulfate soils in Thailand.
Agricultural Research Report 848, Pudoc, Wageningen, The Netherlands.
Verheye, W.H., 1995. Impact of climate and soil conditions on conception and implementation of
irrigation schemes in the Senegal River basin. Agricultural Water Management 28, 73-94.
Voinovitch, I.A., Debras-Guedon, J., Louvrier, J., 1962. L'analyse des silicates. Hermann, Paris.
Zanolin, A., Tchani, J., Barbiéro, L., Boivin, P., Descloitres, M., 1997. Apport de la
méthodeélectrique pour la reconnaissance hydrogéologique et l'étude des variations superficielles
en zone sédimentaire subsaharienne. In: BRGM, INRA, ORSTOM and UPMC (Eds),
Géophysique des sols et des formations superficielles, Bondy, France, 173-178.
Figure captions
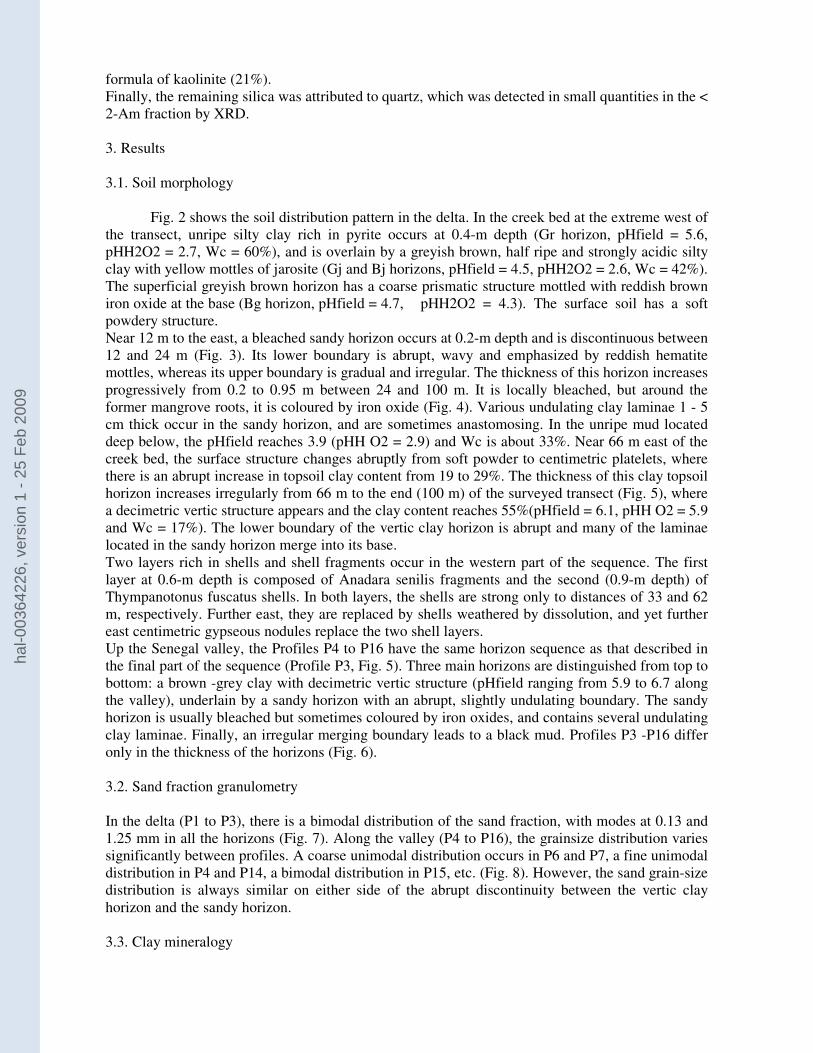
Fig. 1: Locations of the studied sites: + are points sampled along the Senegal valley (P4 to P16),
and of the soil sequence studied in the Diawling National Park, Senegal delta (P1-3).
Fig. 2: Soil morphology along the sequence in the delta.
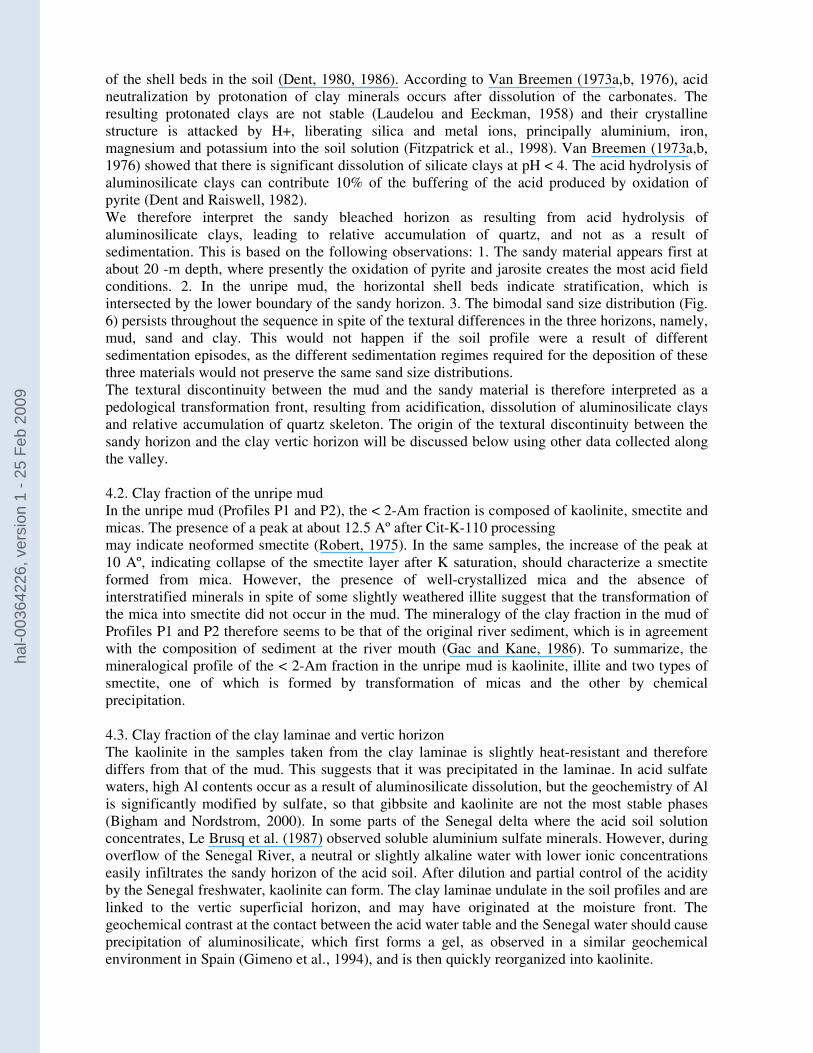
Fig. 3: Profile of Acid Sulfate Soil (P1), with the appearance of the sandy horizon at about 20 cm
depth. Jarosite appears as yellow mottles and oxidizes to goethite/hematite at the base of the
sandy horizon.
Fig.4: Profile of Acid Sulfate soil (P2). The sandy horizon is well developed with clay laminae.
Clay content increases abruptly from 19 to 29 % in the topsoil on the right side of the photo.
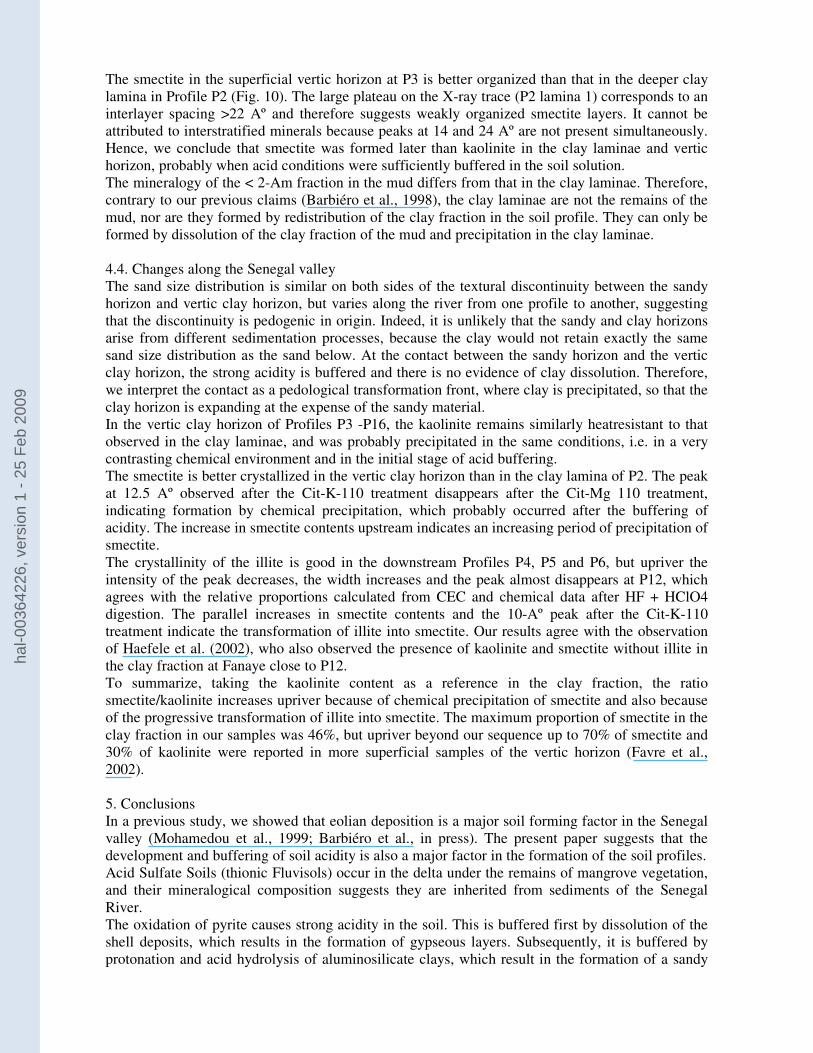
Fig. 5: Profile of Vertisol (P3). From top to bottom: topsoil vertic clay horizon, sandy horizon with
clay laminae, and unripe mud at 90 cm depth.
Fig. 6: Distribution of the main horizons from the delta to the middle valley.
Fig. 7: Distribution of sand size fractions along the soil sequence in the delta.
Fig. 8: Distribution of sand size fractions on either side of the textural discontinuity between vertic
clay horizon (Clay) and bleached sandy horizon (Sand) along the Senegal valley.
Fig. 9: Examples of X-ray diffraction traces of the clay fraction from the vertic horizon of P3.
Fig. 10: X-ray diffraction traces showing the gradual evolution of smectite from clay lamina at P2
and P3 to vertic clay horizon at P3.
Fig. 11: Ratios of smectite/illite, illite/kaolinite and smectite/kaolinite along the Senegal valley,
using methods M1, M2 and M3 (see text). Straight lines denote linear trends of the ratios.
hal-0
0364
226,
ver
sion
1 -
25 F
eb 2
009

Table 1: Relative proportions of kaolinite, smectite and illite in the clay fraction of the vertic
horizon along the Senegal valley. Calculations based on relative XRD peak intensity (Method M1),
K and CEC (Method M2), K, Fe and Al (Method M3, see text).
hal-0
0364
226,
ver
sion
1 -
25 F
eb 2
009
Saint Louis
Dagana
N'Galenkacreek
PodorBoghé
Matam
MAURITANIA
SENEGAL
ATLANTIC
OCEAN
14°15°16°
16°
17°
DiamaDam
Dia
wlin
gN
ati
on
al P
ark
Guierslake
Lower mi ddle valley
Delta
Upper middle valley
Senegal riv
er
+
+++++++++++
+
+P1-3
P4
P13-16P9-12
P8P7
P6
P5
Doué river
50 km
Kh
uru
mb
am
Cre
ek
Clay dunes
Mangrove vegetation
Studied soil sequence
500 m
West Africa
Senegal
Mauritania
Bell Creek
hal-0
0364
226,
ver
sion
1 -
25 F
eb 2
009
0 10 20 30 40 50 60 70 80 90 100 m
0
0.5
1
1.3
m
Mud with pyrite and jarosite (Gr and Bj horizon)
Superficial silty horizon (Bjo and A horizon)
Sandy horizon
Main clay strips
Vertic clay horizon
Shells and shell fragments
Gypseous nodules
Bore hole
Pit
West East
Sampling points
Fig. 3 Fig. 4 Fig. 5
Superficial silty horizon
Soil surface
Unripe silty clay material with pyrite
Grey-brown, half ripe and severely acidic silty-clay material with yellow mottles of jarosite
Discontinuous bleached sandy horizonwith reddish hematite mottles
20 cm
hal-0
0364
226,
ver
sion
1 -
25 F
eb 2
009
Bleached sandy horizoncoloured by iron oxide
Main clay laminae
Unripe silty clay material with pyrite
Soil surface
Superficial silty \ clay horizon20 cm
Bleached sandy horizoncoloured by iron oxide
main clay laminae
Soil surface
Superficial clay horizonwith vertic structure
20 cm
hal-0
0364
226,
ver
sion
1 -
25 F
eb 2
009
P1 P2 P3 P4 P5 P6 P7 P8 P9 P10 P11 P12 P13 P14 P15 P16
Superficial silty horizon
Sandy horizon with clay laminae
0
1
2
3
4
5
6Metres
Delta Middle valley
Unripe mud with pyrite and jarosite
Vertic clay horizon
hal-0
0364
226,
ver
sion
1 -
25 F
eb 2
009
0
5
10
15
20
25
30
2 1.6 1.25 1 0.8 0.63 0.5 0.4 0.32 0.25 0.2 0.16 0.13 0.1 0.08 0.06 0.05
Sand size class (mm)
Weig
ht,
% o
f to
tal
san
dP3-10
P3-45
P3-60
P3-90
P2-20
P2-30
P2-80
P1-10
P1-40
P1-70
Profile-depth (cm)
hal-0
0364
226,
ver
sion
1 -
25 F
eb 2
009
Copyright © 2022 FDOKUMEN