The Origin of Subfunctions and Modular Gene Regulation
14
Copyright © 2005 by the Genetics Society of America DOI: 10.1534/genetics.104.027607 The Origin of Subfunctions and Modular Gene Regulation Allan Force,* ,1 William A. Cresko, †,‡ F. Bryan Pickett, § Steven R. Proulx, ‡ Chris Amemiya* and Michael Lynch** *Benaroya Research Institute at Virginia Mason, Seattle, Washington 98101, † Institute of Neuroscience, University of Oregon, Eugene, Oregon 97403, § Department of Biology, Loyola University, Chicago, Illinois 60626, ‡ Center for Ecology and Evolutionary Biology, University of Oregon, Eugene, Oregon 97403 and **Department of Biology, Indiana University, Bloomington, Indiana 47405 Manuscript received February 12, 2004 Accepted for publication February 8, 2005 ABSTRACT Evolutionary explanations for the origin of modularity in genetic and developmental pathways generally assume that modularity confers a selective advantage. However, our results suggest that even in the absence of any direct selective advantage, genotypic modularity may increase through the formation of new subfunctions under near-neutral processes. Two subfunctions may be formed from a single ancestral sub- function by the process of fission. Subfunction fission occurs when multiple functions under unified genetic control become subdivided into more restricted functions under independent genetic control. Provided that population size is sufficiently small, random genetic drift and mutation can conspire to produce changes in the number of subfunctions in the genome of a species without necessarily altering the phenotype. Extensive genotypic modularity may then accrue in a near-neutral fashion in permissive population-genetic environ- ments, potentially opening novel pathways to morphological evolution. Many aspects of gene complexity in multicellular eukaryotes may have arisen passively as population size reductions accompanied increases in organism size, with the adaptive exploitation of such complexity occurring secondarily. E UKARYOTIC gene regulation is a remarkably com- view regulatory-region complexity as a prerequisite for the adaptive origin of morphological complexity, the plex process, with each gene displaying multiple functions in discrete tissues and times during develop- causal link between genotypic and phenotypic modular- ity remains unclear, and a formal theoretical framework ment. To accomplish such tasks, the noncoding DNA of individual genes often harbors numerous small cis- for the evolutionary origin of regulatory gene structure remains to be developed. acting elements that cooperatively interact with multiple trans-acting factors to tune levels of transcription (David- Renewed interest in the evolutionary fates of duplicate genes (Piatgorsky and Wistow 1991; Clark 1994; son 2001). Mutations in these regulatory regions may influence many aspects of phenotypic evolution by im- Hughes 1994; Walsh 1995; Sidow 1996; Nowak et al. 1997; Wagner 1994, 1998; Force et al. 1999; Stoltzfus posing the loss or gain of gene expression (Raff 1996; 1999; Lynch and Force 2000; Lynch et al. 2001; Gerhart and Kirschner 1997; Force et al. 1999; Car- Wagner 2001; Rodin and Riggs 2003) has resulted in roll 2001; Carroll et al. 2001). Over evolutionary time, the development of models that explicitly incorporate an increase in the particulate nature of gene regulation the complex, multifunctional organization of eukaryotic seems to correlate with the subdivision and specializa- genes. For example, under the duplication-degenera- tion of body plans of multicellular organisms, leading tion-complementation (DDC) model (Force et al. 1999; to organisms in which traits are capable of following Lynch and Force 2000; Lynch et al. 2001), genes are independent evolutionary trajectories (Wagner 1996; posited to contain independently mutable subfunctions Wagner and Altenberg 1996; Raff and Sly 2000). that can be partitioned among descendant copies fol- Increases in the particulate nature of gene regulation lowing a gene-duplication event. A gene subfunction has that affect the structure of developmental networks may been defined as an independently mutable function of be thought of as increases in genotypic modularity, a gene that falls into a distinct complementation class while the subdivision and specialization of body regions (Force et al. 1999). The defining characteristic of a at the phenotypic level may be thought of as increases subfunction is not the number or types of its DNA com- in phenotypic modularity. Although it is tempting to ponents, but their integrated operation in performing a task that is mutationally independent of other suites of functionally integrated elements acting at the same 1 Corresponding author: Benaroya Research Institute at Virginia Ma- locus. A subfunction component may correspond to son, 1201 Ninth Ave., Seattle, WA 98101. E-mail: [email protected] regulatory elements (e.g., transcription-factor binding Genetics 170: 433–446 (May 2005)
-
Upload
independent -
Category
Documents
-
view
2 -
download
0
Transcript of The Origin of Subfunctions and Modular Gene Regulation
Copyright © 2005 by the Genetics Society of AmericaDOI: 10.1534/genetics.104.027607
The Origin of Subfunctions and Modular Gene Regulation
Allan Force,*,1 William A. Cresko,†,‡ F. Bryan Pickett,§ Steven R. Proulx,‡
Chris Amemiya* and Michael Lynch**
*Benaroya Research Institute at Virginia Mason, Seattle, Washington 98101, †Institute of Neuroscience,University of Oregon, Eugene, Oregon 97403, §Department of Biology, Loyola University,
Chicago, Illinois 60626, ‡Center for Ecology and Evolutionary Biology, University ofOregon, Eugene, Oregon 97403 and **Department of Biology,
Indiana University, Bloomington, Indiana 47405
Manuscript received February 12, 2004Accepted for publication February 8, 2005
ABSTRACTEvolutionary explanations for the origin of modularity in genetic and developmental pathways generally
assume that modularity confers a selective advantage. However, our results suggest that even in the absenceof any direct selective advantage, genotypic modularity may increase through the formation of newsubfunctions under near-neutral processes. Two subfunctions may be formed from a single ancestral sub-function by the process of fission. Subfunction fission occurs when multiple functions under unified geneticcontrol become subdivided into more restricted functions under independent genetic control. Providedthat population size is sufficiently small, random genetic drift and mutation can conspire to produce changesin the number of subfunctions in the genome of a species without necessarily altering the phenotype. Extensivegenotypic modularity may then accrue in a near-neutral fashion in permissive population-genetic environ-ments, potentially opening novel pathways to morphological evolution. Many aspects of gene complexityin multicellular eukaryotes may have arisen passively as population size reductions accompanied increasesin organism size, with the adaptive exploitation of such complexity occurring secondarily.
EUKARYOTIC gene regulation is a remarkably com- view regulatory-region complexity as a prerequisite forthe adaptive origin of morphological complexity, theplex process, with each gene displaying multiple
functions in discrete tissues and times during develop- causal link between genotypic and phenotypic modular-ity remains unclear, and a formal theoretical frameworkment. To accomplish such tasks, the noncoding DNA
of individual genes often harbors numerous small cis- for the evolutionary origin of regulatory gene structureremains to be developed.acting elements that cooperatively interact with multiple
trans-acting factors to tune levels of transcription (David- Renewed interest in the evolutionary fates of duplicategenes (Piatgorsky and Wistow 1991; Clark 1994;son 2001). Mutations in these regulatory regions may
influence many aspects of phenotypic evolution by im- Hughes 1994; Walsh 1995; Sidow 1996; Nowak et al.1997; Wagner 1994, 1998; Force et al. 1999; Stoltzfusposing the loss or gain of gene expression (Raff 1996;1999; Lynch and Force 2000; Lynch et al. 2001;Gerhart and Kirschner 1997; Force et al. 1999; Car-Wagner 2001; Rodin and Riggs 2003) has resulted inroll 2001; Carroll et al. 2001). Over evolutionary time,the development of models that explicitly incorporatean increase in the particulate nature of gene regulationthe complex, multifunctional organization of eukaryoticseems to correlate with the subdivision and specializa-genes. For example, under the duplication-degenera-tion of body plans of multicellular organisms, leadingtion-complementation (DDC) model (Force et al. 1999;to organisms in which traits are capable of followingLynch and Force 2000; Lynch et al. 2001), genes areindependent evolutionary trajectories (Wagner 1996;posited to contain independently mutable subfunctionsWagner and Altenberg 1996; Raff and Sly 2000).that can be partitioned among descendant copies fol-Increases in the particulate nature of gene regulationlowing a gene-duplication event. A gene subfunction hasthat affect the structure of developmental networks maybeen defined as an independently mutable function ofbe thought of as increases in genotypic modularity,a gene that falls into a distinct complementation classwhile the subdivision and specialization of body regions(Force et al. 1999). The defining characteristic of aat the phenotypic level may be thought of as increasessubfunction is not the number or types of its DNA com-in phenotypic modularity. Although it is tempting toponents, but their integrated operation in performinga task that is mutationally independent of other suitesof functionally integrated elements acting at the same
1Corresponding author: Benaroya Research Institute at Virginia Ma-locus. A subfunction component may correspond toson, 1201 Ninth Ave., Seattle, WA 98101.
E-mail: [email protected] regulatory elements (e.g., transcription-factor binding
Genetics 170: 433–446 (May 2005)
434 A. Force et al.
sites), splice junctions, mRNA stability elements, and/or coding regions (e.g., functional motifs), among otherpossibilities (Force et al. 1999, 2004).Under the generalDDC model, a variety of population-level mechanismsmay lead to duplicate-gene preservation and the parti-tioning of gene subfunctions (Piatgorsky and Wistow1991; Hughes 1994; Force et al. 1999; Lynch andForce 2000; Lynch et al. 2001; Adams et al. 2003; Rodinand Riggs 2003). However, although these mechanismsmight explain the evolutionary fates of a large fractionof duplicate genes in metazoans and vascular plants,they also beg the question—How do new gene subfunc-tions arise in the first place? In this article we presenta model for the origin of new regulatory subfunctions
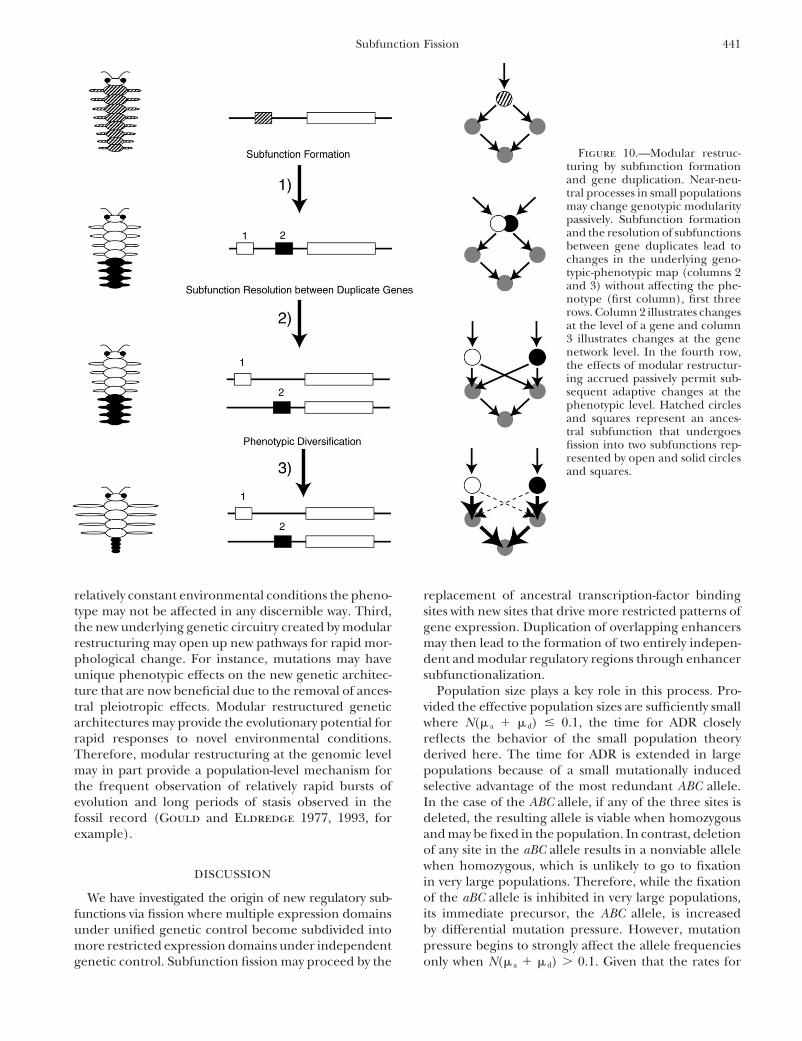
Figure 1.—General outline of the subfunction fissionby a near-neutral process via cycles of information accre-model. During phase 1, accretion of two new regulatory ele-tion and loss at individual loci. Our intention is to show ments (diamond and square) occurs, with each redundantly
how mutation, duplication, and genetic drift can drive driving a portion of the ancestral expression domain, whichthe evolution of genotypic modularity. was previously under the control of a single positive ancestral
element (star). Subsequently, the ancestral shared elementIn this article, we restrict our attention to the evolu-(star) degenerates, resulting in the replacement of the ances-tion of new regulatory subfunctions. Several studies ontral shared regulation with semi-independent regulation. Inthe structure of genetic networks and regulatory regions phase 2, duplication, degeneration, and complementation of
have provided clues as to the proper structure of models the regulatory region lead to two independent regulatory mod-for the evolution of modularity at the level of gene regula- ules, each driving independent expression domains and func-
tions. Hatched circles represent shared positive and negativetion. Small regulatory elements can arise by de novo muta-regulatory sites that are required for all functions.tion or by transpositional insertion, providing many po-
tential degrees of freedom for altering the number andtype of transcription-factor binding sites (Arnosti et al.
from the altered expression of a single structural gene1996; Wray 1998; Yuh et al. 1998; Brosius 1999; vonto the dramatic activation of a whole developmentalDassow and Monro 1999; Edelman et al. 2000; Stonepathway in a new location. Although cooption of newand Wray 2001; MacArthur and Brookfield 2004).gene functions and expression domains is widely dis-If various permutations of such elements provide forcussed in the literature (see Raff 1996; Carroll et al.functionally equivalent outputs of a gene (see Edelman2001; Davidson 2001) and has undoubtedly played anet al. 2000), then it follows that the stochastic turnoverimportant role in the evolution of new morphologicalof control elements by nearly neutral processes may playstructures, cooption may not be the most common path-a critical role in the evolution of regulatory regionsway for the origin of new regulatory subfunctions.(Bonneton et al. 1997; Ludwig et al. 1998; Hancock
In contrast to subfunction cooption, subfunction fissionet al. 1999; Ludwig et al. 2000; McGregor et al. 2001;occurs when multiple functions under shared genetic con-Shaw et al. 2001). Although some regulatory-regiontrol evolve to be under independent genetic control. Thestructures may endow their associated alleles withpattern of tissue-specific gene expression remains con-higher fitness than others, the range of effectively equiv-served during subfunction fission while the underlyingalent states will necessarily increase in populations withmolecular mechanisms for achieving that pattern un-
smaller size where the efficiency of selection is dimin-dergo evolutionary modification. Two general phases
ished and the intrusion of new transcription-factor bind-may contribute to subfunction fission: (1) the replace-
ing sites into the system will proceed passively.ment of completely shared regulatory binding sites withindependent binding sites to form a semi-independentenhancer and (2) duplication of the semi-independent
A CONCEPTUAL MODEL FOR enhancers, followed by the formation of two entirelySUBFUNCTION FISSIONindependent regions, each critical to a single regulatory
There are two broad views of how new regulatory subfunction, by complementary degenerative mutationselements may be incorporated into genes to form new (Figure 1). Phase 1 involves accretion, degeneration,regulatory subfunctions: subfunction cooption and subfunc- and the replacement (ADR) of ancestral transcription-tion fission (see Raff 1996; Carroll et al. 2001; David- factor binding sites and phase 2 involves the DDC ofson 2001; Force et al. 2004). Subfunction cooption in- binding sites within enhancers. The series of events in-volves the evolution of a new function not carried out by volved in phase 2 are essentially the same as those under-the ancestral gene, whereas subfunction fission involves lying the subfunctionalization of gene duplicates, ex-subdivision of a function already present in the ancestral cept in this case the duplicated region comprises just
the enhancers within a gene.gene. The effects of subfunction cooption may range
435Subfunction Fission
Under subfunction fission, the new gene architecturediverges beneath a constant phenotype. Despite this initialinvariance of expression patterns, subfunction fission mayopen up previously inaccessible evolutionary pathways byeliminating some pleiotropic constraints associated withshared regulatory regions while creating others. There-fore, the evolutionary potential of such alterations maynot be realized until a new selective environment and/or appropriate mix of mutations is encountered, atwhich point modularity at the level of gene architecturemay promote the evolution of phenotypic modularity.However, the model that we present highlights the logi-cal distinction between the causal nonadaptive forcesthat may lead to the restructuring of genomic architec-ture and the secondary consequences of such changefor phenotypic evolution. We now formalize the theoryfor the two phases contributing to subfunction fission.
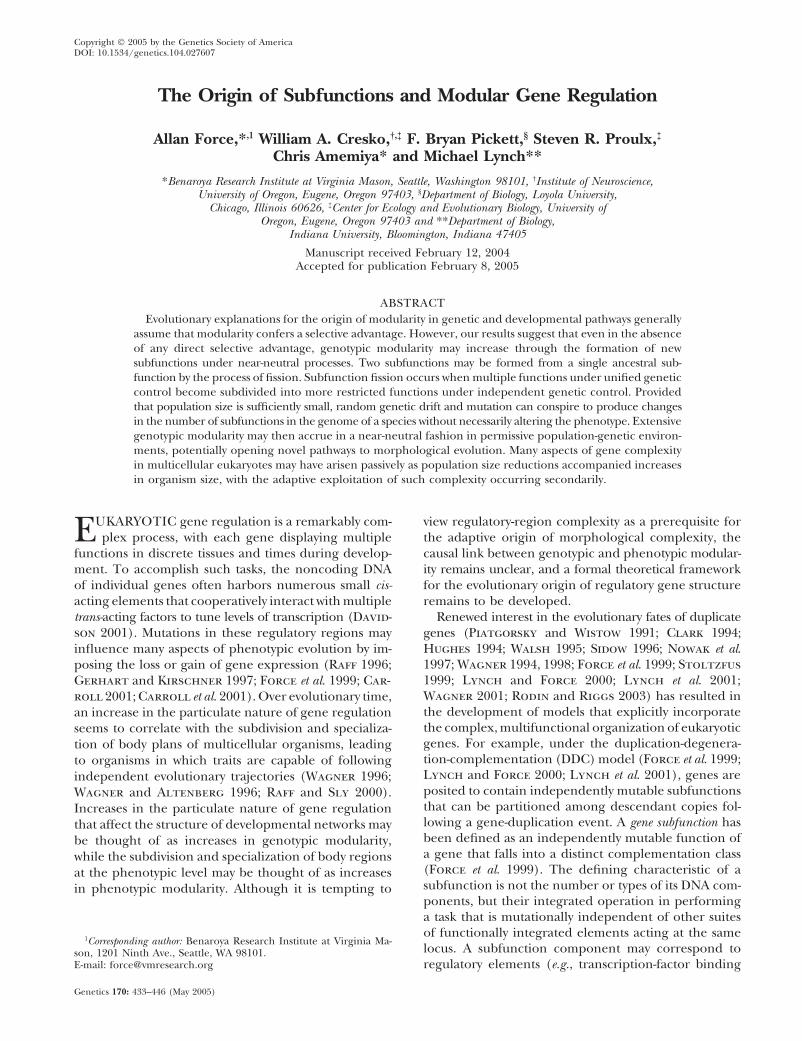
Phase 1—accretion, degeneration, and replacement:We start by considering the process by which an allelewith two overlapping regulatory subfunctions arisesfrom an allele with one regulatory subfunction (Figure2). We assume a starting point where several transcrip-tion factors are present, some of which are general andsome tissue specific. For an initial shared regulatorystate in which the same positive transcription factor(TF), TFA, drives the gene’s expression in two tissuesvia the same binding site (A), the ancestral allele has Figure 2.—Subfunction fission phase 1: accretion, degener-only one subfunction because degenerative mutations ation, and replacement (ADR). (Top) Positive transcription
factors are expressed in both tissues 1 and 2 (TFA) or onlyin binding site A reduce expression in both domainsin tissue 1 (TFB) or tissue 2 (TFC). (Bottom) The ancestralsimilarly. We further assume the presence of tissue-spe-enhancer (left) drives expression (right) in both tissues via acific transcription factors (TFB and TFC), expressed regulatory element (A). Consecutive regulatory element accre-
in a complementary manner (one in each tissue) with tion events involving B and C sites produce an enhancer thatredundantly drives expression in both tissues. Degenerativerespect to the ancestral expression of TFA. The exis-mutations lead to the loss of the ancestral positive regulatorytence of these tissue-specific transcription factors pro-element (A), resulting in an enhancer with semi-independentvides the essential setting in which an allele using TFAregulation and two regulatory subfunctions (B and C). The
as an activator of expression can give rise to a semi- star, diamond, and square represent the A, B, and C bindingindependently regulated derivative requiring both TFB sites as in Figure 1. Hatched circles represent shared positive
and negative regulatory sites that are required for all functions.and TFC (Figure 2). Such a transition requires the addi-tion of binding sites for TFB and TFC, followed by theloss of binding sites for TFA. Although positive Darwin- region null allele. We assume that each transcription-ian selection may directly promote subfunction forma- factor binding site is added to an allele at rate � a andtion, we restrict our attention in this article to a near- deleted at rate � d . We denote the presence of a siteneutral process. with an uppercase letter and the absence of a site with
If we assume that binding sites for all three types of a lowercase letter. Thus, for example, the Abc alleletranscription factor are subject to mutational accretion containing only binding site A becomes either an ABcand degeneration, then there is no permanent allelic allele at rate � a or an allele without any sites abc (butstate under this model, as the alternative classes of still having an intact coding region) at rate � d . In addi-shared and semi-independently regulated alleles are tion, each expressed allele mutates to the coding nullfree to drift in frequency. However, for heuristic pur- class, denoted by xxx , at rate � c . The abc and xxx allelesposes, we first focus on the case in which the population are functionally equivalent but differ in their ability tois initially fixed for the shared regulated allele and evalu- mutate back into a viable state.ate the expected time to a transient state of fixation by To simplify the following small-population-size ap-the semi-independently regulated allele. Even for the proximation, we exclude all nonfixable classes of alleles.simple model outlined above, there are nine alternative Only alleles containing minimally an A site or bothallelic states (Figure 3), eight representing all possible B and C sites may go to fixation, so this reduces ourpermutations of the three types of transcription-factor consideration to just the Abc , ABc , AbC , ABC , and aBC
alleles. It is convenient to further group these allelesbinding sites (A, B, and C) and an additional coding-
436 A. Force et al.
stepwise transition times. However, because the W ↔ Xand X ↔ Y transitions are reversible, the average timeto conversion to the semiregulated state is necessarilylarger than that obtained by the shortest path.
To account for all potential paths, we use the transi-tion-matrix P, with the element in the i th row and j thcolumn, Pi j , denoting the probability of transition fromstate j to i . For our particular application, the four rowsand columns are the classes W, X, Y, and Z. Follow-ing from the logic developed in the preceding para-graph, the nonzero off-diagonal elements are PWX �[(1/�d) � 4N]�1, PXW � [(1/(2� a)) � 4N]�1, PXY � [(1/(2�d)) � 4N]�1, PYX � [(1/� a) � 4N]�1, and PZY � [(1/
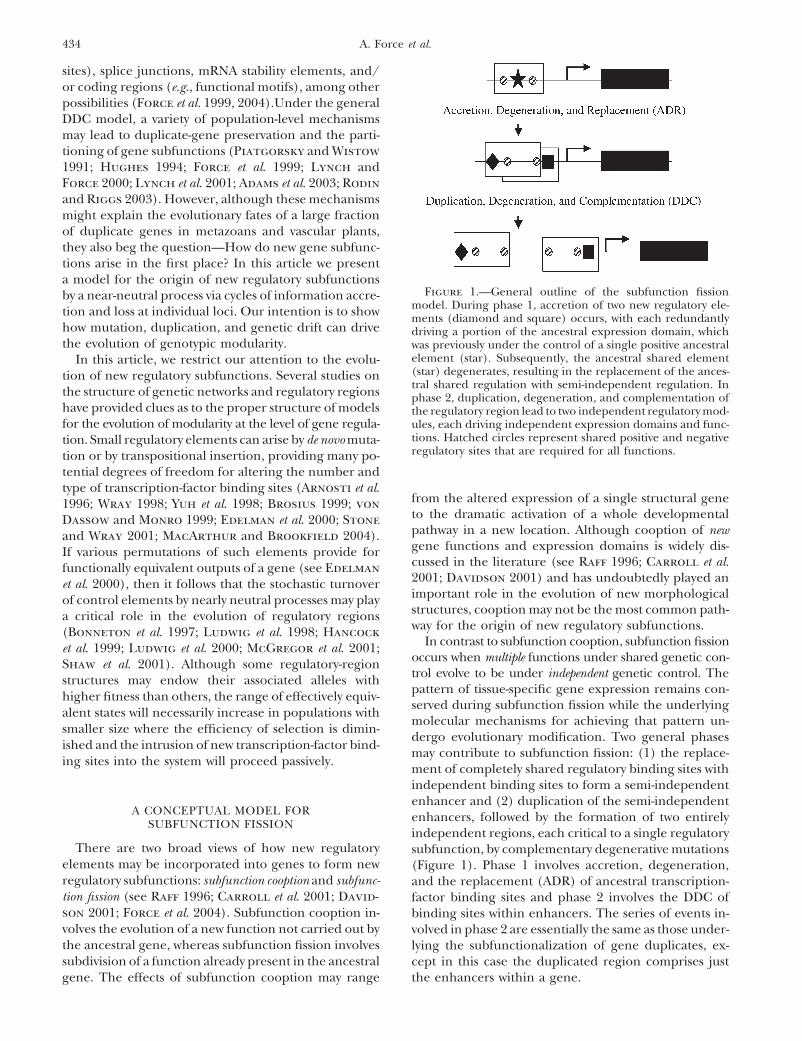
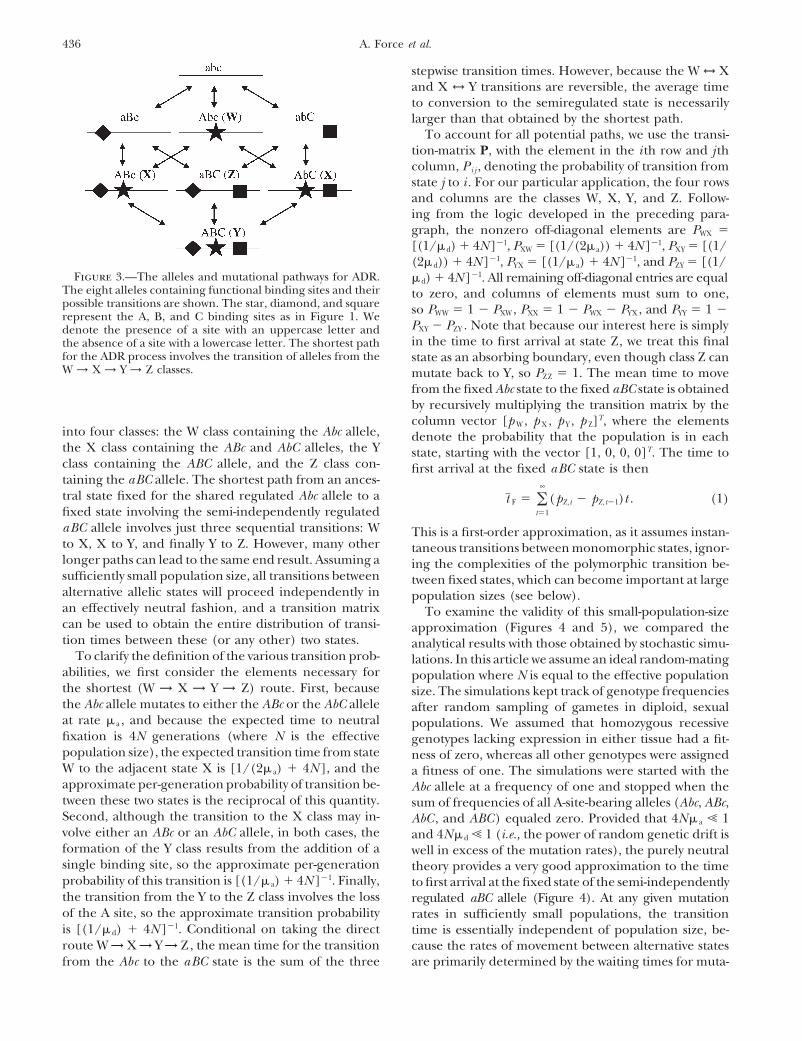
Figure 3.—The alleles and mutational pathways for ADR. �d) � 4N]�1. All remaining off-diagonal entries are equalThe eight alleles containing functional binding sites and their to zero, and columns of elements must sum to one,possible transitions are shown. The star, diamond, and square so PWW � 1 � PXW, PXX � 1 � PWX � PYX, and PYY � 1 �represent the A, B, and C binding sites as in Figure 1. We
PXY � PZY . Note that because our interest here is simplydenote the presence of a site with an uppercase letter andin the time to first arrival at state Z, we treat this finalthe absence of a site with a lowercase letter. The shortest path
for the ADR process involves the transition of alleles from the state as an absorbing boundary, even though class Z canW → X → Y → Z classes. mutate back to Y, so PZZ � 1. The mean time to move
from the fixed Abc state to the fixed aBC state is obtainedby recursively multiplying the transition matrix by thecolumn vector [p W, p X, p Y , p Z]T, where the elements
into four classes: the W class containing the Abc allele, denote the probability that the population is in eachthe X class containing the ABc and AbC alleles, the Y state, starting with the vector [1, 0, 0, 0]T. The time toclass containing the ABC allele, and the Z class con- first arrival at the fixed aBC state is thentaining the aBC allele. The shortest path from an ances-tral state fixed for the shared regulated Abc allele to a t F � �
∞
t�1
(pZ , t � pZ , t�1)t . (1)fixed state involving the semi-independently regulatedaBC allele involves just three sequential transitions: W This is a first-order approximation, as it assumes instan-to X, X to Y, and finally Y to Z. However, many other taneous transitions between monomorphic states, ignor-longer paths can lead to the same end result. Assuming a ing the complexities of the polymorphic transition be-sufficiently small population size, all transitions between tween fixed states, which can become important at largealternative allelic states will proceed independently in population sizes (see below).an effectively neutral fashion, and a transition matrix To examine the validity of this small-population-sizecan be used to obtain the entire distribution of transi- approximation (Figures 4 and 5), we compared thetion times between these (or any other) two states. analytical results with those obtained by stochastic simu-
To clarify the definition of the various transition prob- lations. In this article we assume an ideal random-matingabilities, we first consider the elements necessary for population where N is equal to the effective populationthe shortest (W → X → Y → Z) route. First, because size. The simulations kept track of genotype frequenciesthe Abc allele mutates to either the ABc or the AbC allele after random sampling of gametes in diploid, sexualat rate � a , and because the expected time to neutral populations. We assumed that homozygous recessivefixation is 4N generations (where N is the effective genotypes lacking expression in either tissue had a fit-population size), the expected transition time from state ness of zero, whereas all other genotypes were assignedW to the adjacent state X is [1/(2� a) � 4N ], and the a fitness of one. The simulations were started with theapproximate per-generation probability of transition be- Abc allele at a frequency of one and stopped when thetween these two states is the reciprocal of this quantity. sum of frequencies of all A-site-bearing alleles (Abc, ABc,Second, although the transition to the X class may in- AbC , and ABC) equaled zero. Provided that 4N� a � 1volve either an ABc or an AbC allele, in both cases, the and 4N� d � 1 (i.e., the power of random genetic drift isformation of the Y class results from the addition of a well in excess of the mutation rates), the purely neutralsingle binding site, so the approximate per-generation theory provides a very good approximation to the timeprobability of this transition is [(1/� a) � 4N ]�1. Finally, to first arrival at the fixed state of the semi-independentlythe transition from the Y to the Z class involves the loss regulated aBC allele (Figure 4). At any given mutationof the A site, so the approximate transition probability rates in sufficiently small populations, the transitionis [(1/� d) � 4N ]�1. Conditional on taking the direct time is essentially independent of population size, be-route W → X → Y → Z, the mean time for the transition cause the rates of movement between alternative states
are primarily determined by the waiting times for muta-from the Abc to the aBC state is the sum of the three
437Subfunction Fission
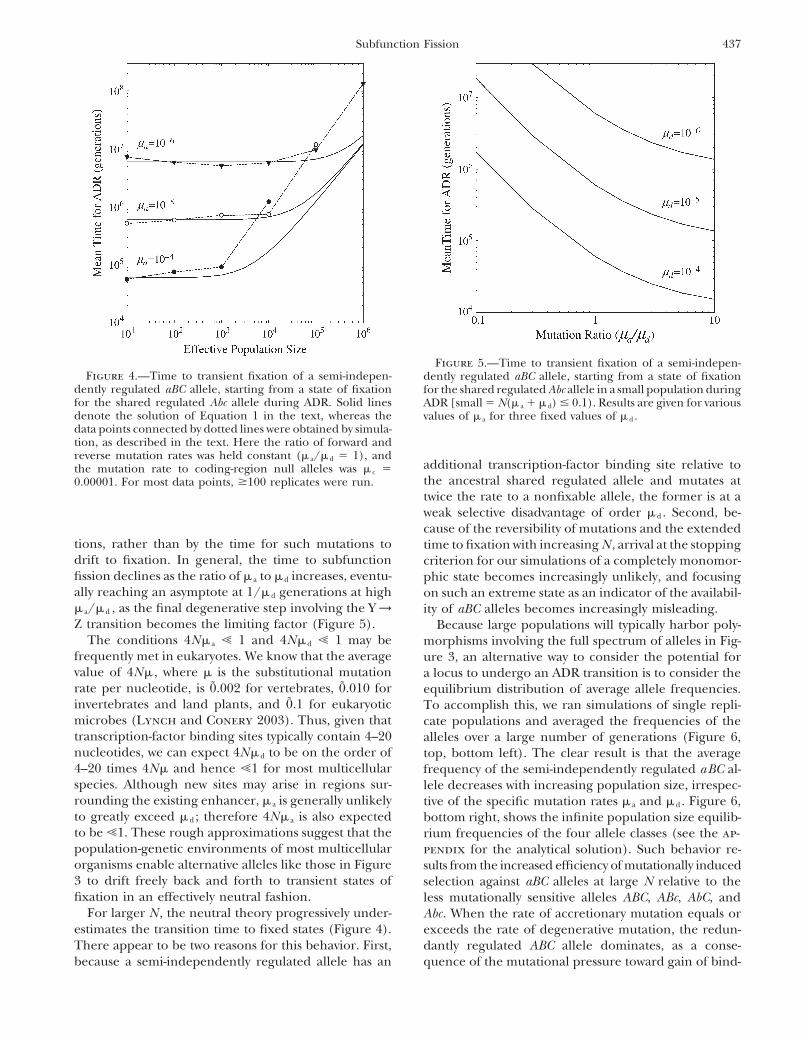
Figure 5.—Time to transient fixation of a semi-indepen-Figure 4.—Time to transient fixation of a semi-indepen- dently regulated aBC allele, starting from a state of fixation
dently regulated aBC allele, starting from a state of fixation for the shared regulated Abc allele in a small population duringfor the shared regulated Abc allele during ADR. Solid lines ADR [small � N(� a � � d) � 0.1). Results are given for variousdenote the solution of Equation 1 in the text, whereas the values of � a for three fixed values of � d .data points connected by dotted lines were obtained by simula-tion, as described in the text. Here the ratio of forward andreverse mutation rates was held constant (� a/� d � 1), and
additional transcription-factor binding site relative tothe mutation rate to coding-region null alleles was � c �the ancestral shared regulated allele and mutates at0.00001. For most data points, �100 replicates were run.twice the rate to a nonfixable allele, the former is at aweak selective disadvantage of order � d . Second, be-cause of the reversibility of mutations and the extended
tions, rather than by the time for such mutations to time to fixation with increasing N , arrival at the stoppingdrift to fixation. In general, the time to subfunction criterion for our simulations of a completely monomor-fission declines as the ratio of � a to � d increases, eventu- phic state becomes increasingly unlikely, and focusingally reaching an asymptote at 1/� d generations at high on such an extreme state as an indicator of the availabil-� a/� d , as the final degenerative step involving the Y → ity of aBC alleles becomes increasingly misleading.Z transition becomes the limiting factor (Figure 5). Because large populations will typically harbor poly-
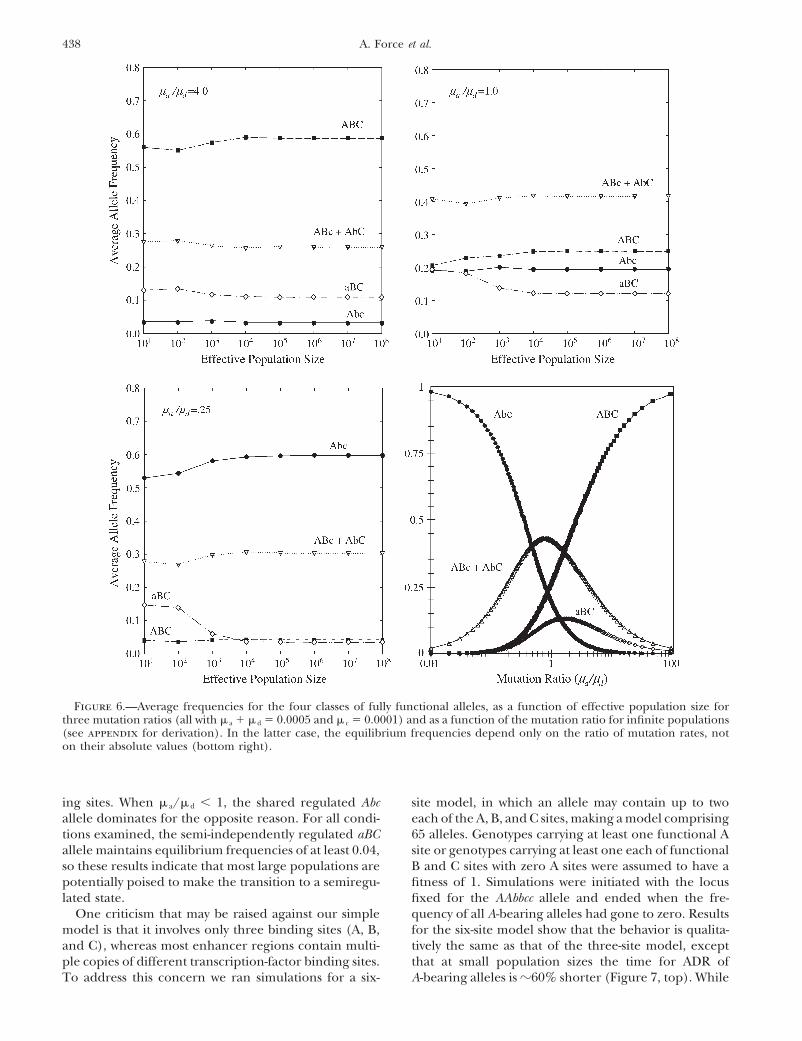
The conditions 4N� a � 1 and 4N� d � 1 may be morphisms involving the full spectrum of alleles in Fig-frequently met in eukaryotes. We know that the average ure 3, an alternative way to consider the potential forvalue of 4N� , where � is the substitutional mutation a locus to undergo an ADR transition is to consider therate per nucleotide, is 0̃.002 for vertebrates, 0̃.010 for equilibrium distribution of average allele frequencies.invertebrates and land plants, and 0̃.1 for eukaryotic To accomplish this, we ran simulations of single repli-microbes (Lynch and Conery 2003). Thus, given that cate populations and averaged the frequencies of thetranscription-factor binding sites typically contain 4–20 alleles over a large number of generations (Figure 6,nucleotides, we can expect 4N� d to be on the order of top, bottom left). The clear result is that the average4–20 times 4N� and hence �1 for most multicellular frequency of the semi-independently regulated aBC al-species. Although new sites may arise in regions sur- lele decreases with increasing population size, irrespec-rounding the existing enhancer, � a is generally unlikely tive of the specific mutation rates � a and � d . Figure 6,to greatly exceed � d ; therefore 4N� a is also expected bottom right, shows the infinite population size equilib-to be �1. These rough approximations suggest that the rium frequencies of the four allele classes (see the ap-population-genetic environments of most multicellular pendix for the analytical solution). Such behavior re-organisms enable alternative alleles like those in Figure sults from the increased efficiency of mutationally induced3 to drift freely back and forth to transient states of selection against aBC alleles at large N relative to thefixation in an effectively neutral fashion. less mutationally sensitive alleles ABC, ABc, AbC, and
For larger N , the neutral theory progressively under- Abc. When the rate of accretionary mutation equals orestimates the transition time to fixed states (Figure 4). exceeds the rate of degenerative mutation, the redun-There appear to be two reasons for this behavior. First, dantly regulated ABC allele dominates, as a conse-
quence of the mutational pressure toward gain of bind-because a semi-independently regulated allele has an
438 A. Force et al.
Figure 6.—Average frequencies for the four classes of fully functional alleles, as a function of effective population size forthree mutation ratios (all with � a � � d � 0.0005 and � c � 0.0001) and as a function of the mutation ratio for infinite populations(see appendix for derivation). In the latter case, the equilibrium frequencies depend only on the ratio of mutation rates, noton their absolute values (bottom right).
ing sites. When � a/� d � 1, the shared regulated Abc site model, in which an allele may contain up to twoeach of the A, B, and C sites, making a model comprisingallele dominates for the opposite reason. For all condi-
tions examined, the semi-independently regulated aBC 65 alleles. Genotypes carrying at least one functional Asite or genotypes carrying at least one each of functionalallele maintains equilibrium frequencies of at least 0.04,
so these results indicate that most large populations are B and C sites with zero A sites were assumed to have afitness of 1. Simulations were initiated with the locuspotentially poised to make the transition to a semiregu-
lated state. fixed for the AAbbcc allele and ended when the fre-quency of all A-bearing alleles had gone to zero. ResultsOne criticism that may be raised against our simple
model is that it involves only three binding sites (A, B, for the six-site model show that the behavior is qualita-tively the same as that of the three-site model, exceptand C), whereas most enhancer regions contain multi-
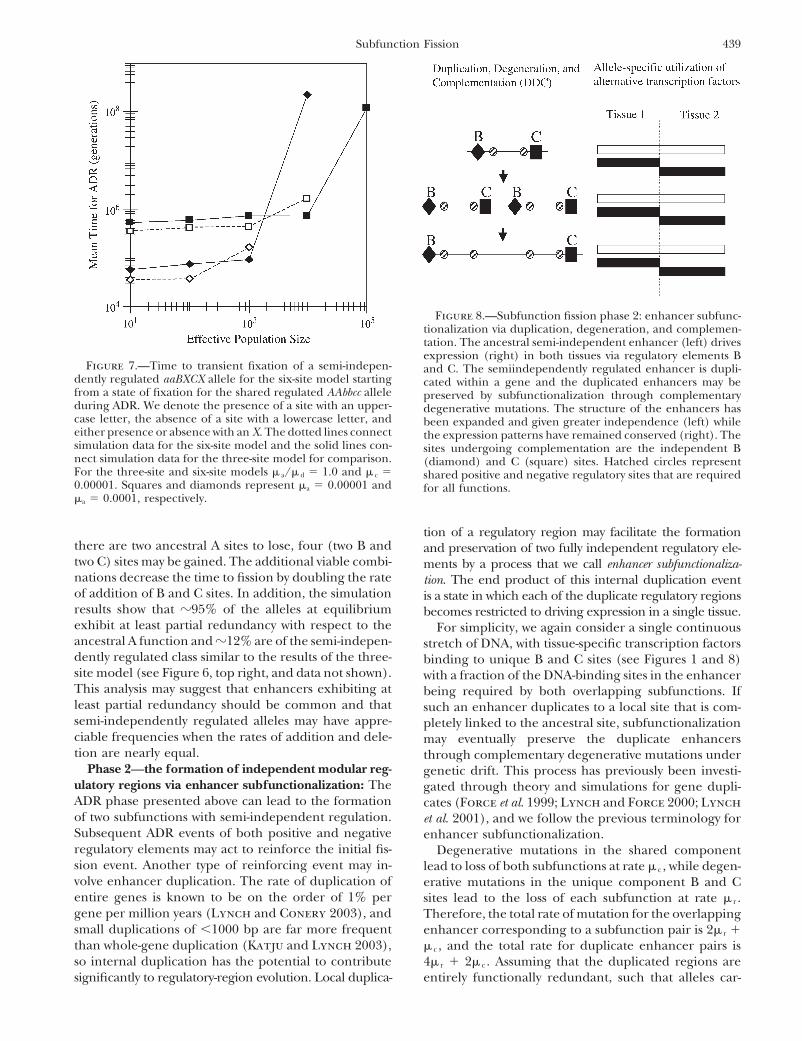
ple copies of different transcription-factor binding sites. that at small population sizes the time for ADR ofA-bearing alleles is �60% shorter (Figure 7, top). WhileTo address this concern we ran simulations for a six-
439Subfunction Fission
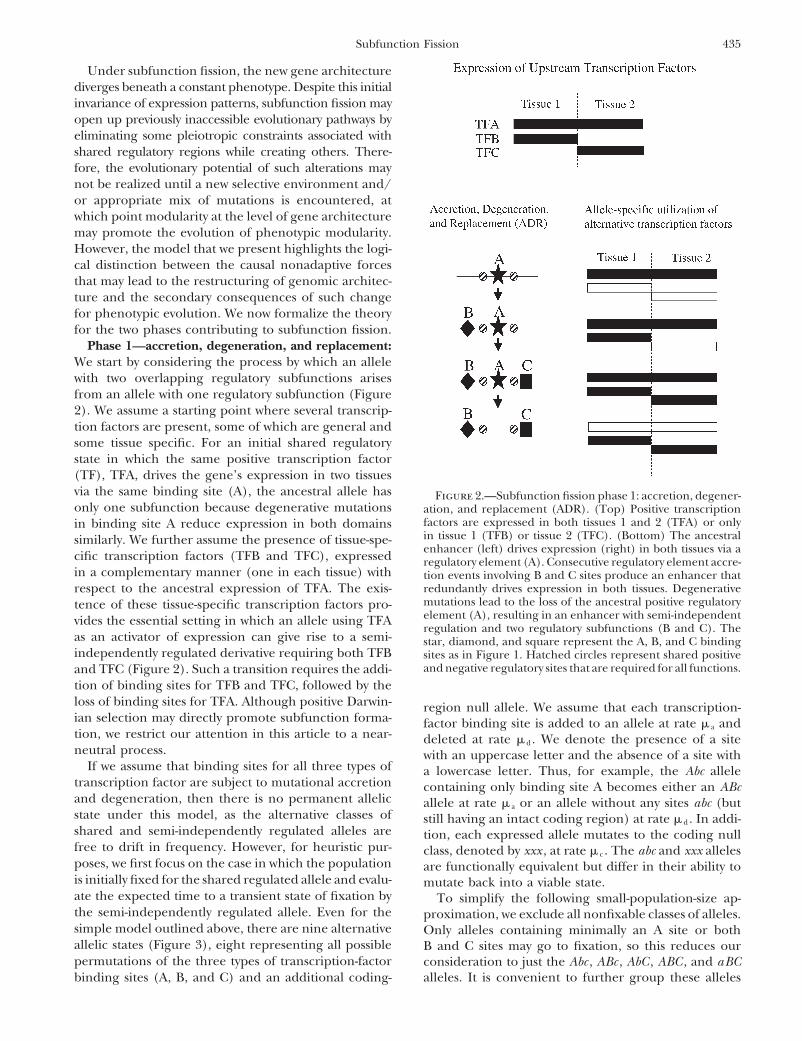
Figure 8.—Subfunction fission phase 2: enhancer subfunc-tionalization via duplication, degeneration, and complemen-tation. The ancestral semi-independent enhancer (left) drivesexpression (right) in both tissues via regulatory elements B
Figure 7.—Time to transient fixation of a semi-indepen- and C. The semiindependently regulated enhancer is dupli-dently regulated aaBXCX allele for the six-site model starting cated within a gene and the duplicated enhancers may befrom a state of fixation for the shared regulated AAbbcc allele preserved by subfunctionalization through complementaryduring ADR. We denote the presence of a site with an upper- degenerative mutations. The structure of the enhancers hascase letter, the absence of a site with a lowercase letter, and been expanded and given greater independence (left) whileeither presence or absence with an X. The dotted lines connect the expression patterns have remained conserved (right). Thesimulation data for the six-site model and the solid lines con- sites undergoing complementation are the independent Bnect simulation data for the three-site model for comparison. (diamond) and C (square) sites. Hatched circles representFor the three-site and six-site models � a/� d � 1.0 and � c � shared positive and negative regulatory sites that are required0.00001. Squares and diamonds represent �a � 0.00001 and for all functions.�a � 0.0001, respectively.
tion of a regulatory region may facilitate the formationthere are two ancestral A sites to lose, four (two B and and preservation of two fully independent regulatory ele-two C) sites may be gained. The additional viable combi- ments by a process that we call enhancer subfunctionaliza-nations decrease the time to fission by doubling the rate tion. The end product of this internal duplication eventof addition of B and C sites. In addition, the simulation is a state in which each of the duplicate regulatory regionsresults show that �95% of the alleles at equilibrium becomes restricted to driving expression in a single tissue.exhibit at least partial redundancy with respect to the For simplicity, we again consider a single continuousancestral A function and �12% are of the semi-indepen- stretch of DNA, with tissue-specific transcription factorsdently regulated class similar to the results of the three- binding to unique B and C sites (see Figures 1 and 8)site model (see Figure 6, top right, and data not shown). with a fraction of the DNA-binding sites in the enhancerThis analysis may suggest that enhancers exhibiting at being required by both overlapping subfunctions. Ifleast partial redundancy should be common and that such an enhancer duplicates to a local site that is com-semi-independently regulated alleles may have appre- pletely linked to the ancestral site, subfunctionalizationciable frequencies when the rates of addition and dele- may eventually preserve the duplicate enhancerstion are nearly equal. through complementary degenerative mutations under
Phase 2—the formation of independent modular reg- genetic drift. This process has previously been investi-ulatory regions via enhancer subfunctionalization: The gated through theory and simulations for gene dupli-ADR phase presented above can lead to the formation cates (Force et al. 1999; Lynch and Force 2000; Lynchof two subfunctions with semi-independent regulation. et al. 2001), and we follow the previous terminology forSubsequent ADR events of both positive and negative enhancer subfunctionalization.regulatory elements may act to reinforce the initial fis- Degenerative mutations in the shared componentsion event. Another type of reinforcing event may in- lead to loss of both subfunctions at rate � c , while degen-volve enhancer duplication. The rate of duplication of erative mutations in the unique component B and Centire genes is known to be on the order of 1% per sites lead to the loss of each subfunction at rate � r .gene per million years (Lynch and Conery 2003), and Therefore, the total rate of mutation for the overlappingsmall duplications of �1000 bp are far more frequent enhancer corresponding to a subfunction pair is 2� r �than whole-gene duplication (Katju and Lynch 2003), � c , and the total rate for duplicate enhancer pairs isso internal duplication has the potential to contribute 4� r � 2� c . Assuming that the duplicated regions are
entirely functionally redundant, such that alleles car-significantly to regulatory-region evolution. Local duplica-
440 A. Force et al.
rying the duplicates have identical fitness to those withthe ancestral state, the probability of initial fixation ofa duplicate enhancer allele is simply its initial frequency,i.e., the neutral expectation, 1/(2N ), where N is thesize of the diploid population. Subfunctionalization re-quires that the first degenerative mutation to becomefixed falls in a B or C site, the probability of which is2� r/(2� r � � c). Finally, the last mutation to fix mustfall in the nonshared unique site remaining in the stillintact enhancer, and this will occur with probability � r/(2� r � � c) in populations of sufficiently small N. Theproduct of the three terms is the probability that a newlyarisen allele with a duplicate enhancer will be convertedto a state of a nonoverlapping pair of enhancers bydegenerative mutation,
Pr(Sub) � 2 � 12N � � � r
2� r � � c�2
�()2
N, (2)
where � � r/(2� r � � c) .As noted previously, this simple approach fails when
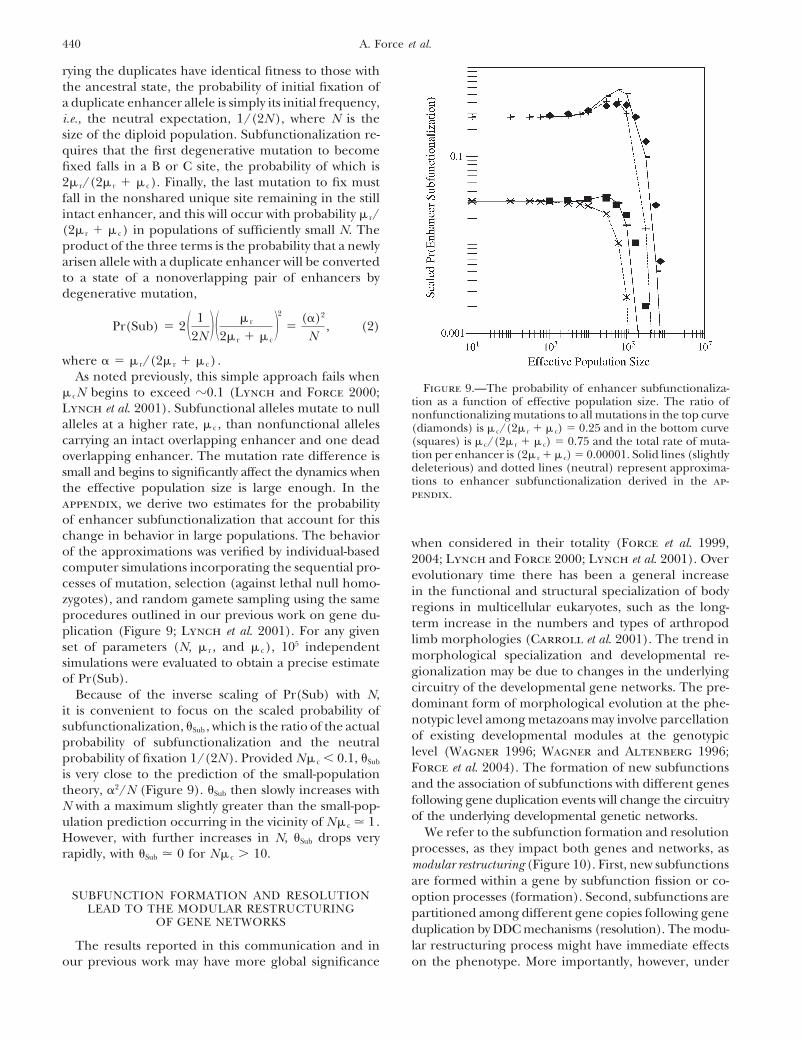
Figure 9.—The probability of enhancer subfunctionaliza-� cN begins to exceed �0.1 (Lynch and Force 2000;tion as a function of effective population size. The ratio ofLynch et al. 2001). Subfunctional alleles mutate to null nonfunctionalizing mutations to all mutations in the top curve
alleles at a higher rate, � c , than nonfunctional alleles (diamonds) is � c/(2� r � � c) � 0.25 and in the bottom curvecarrying an intact overlapping enhancer and one dead (squares) is � c/(2� r � � c) � 0.75 and the total rate of muta-
tion per enhancer is (2� r � � c) � 0.00001. Solid lines (slightlyoverlapping enhancer. The mutation rate difference isdeleterious) and dotted lines (neutral) represent approxima-small and begins to significantly affect the dynamics whentions to enhancer subfunctionalization derived in the ap-the effective population size is large enough. In the pendix.
appendix, we derive two estimates for the probabilityof enhancer subfunctionalization that account for thischange in behavior in large populations. The behavior when considered in their totality (Force et al. 1999,of the approximations was verified by individual-based 2004; Lynch and Force 2000; Lynch et al. 2001). Overcomputer simulations incorporating the sequential pro- evolutionary time there has been a general increasecesses of mutation, selection (against lethal null homo-
in the functional and structural specialization of bodyzygotes), and random gamete sampling using the same
regions in multicellular eukaryotes, such as the long-procedures outlined in our previous work on gene du-
term increase in the numbers and types of arthropodplication (Figure 9; Lynch et al. 2001). For any given
limb morphologies (Carroll et al. 2001). The trend inset of parameters (N, � r , and � c), 105 independentmorphological specialization and developmental re-simulations were evaluated to obtain a precise estimategionalization may be due to changes in the underlyingof Pr(Sub).circuitry of the developmental gene networks. The pre-Because of the inverse scaling of Pr(Sub) with N,dominant form of morphological evolution at the phe-it is convenient to focus on the scaled probability ofnotypic level among metazoans may involve parcellationsubfunctionalization, Sub , which is the ratio of the actualof existing developmental modules at the genotypicprobability of subfunctionalization and the neutrallevel (Wagner 1996; Wagner and Altenberg 1996;probability of fixation 1/(2N ). Provided N� c � 0.1, Sub Force et al. 2004). The formation of new subfunctionsis very close to the prediction of the small-populationand the association of subfunctions with different genestheory, 2/N (Figure 9). Sub then slowly increases withfollowing gene duplication events will change the circuitryN with a maximum slightly greater than the small-pop-of the underlying developmental genetic networks.ulation prediction occurring in the vicinity of N� c � 1.
We refer to the subfunction formation and resolutionHowever, with further increases in N, Sub drops veryprocesses, as they impact both genes and networks, asrapidly, with Sub � 0 for N� c � 10.modular restructuring (Figure 10). First, new subfunctionsare formed within a gene by subfunction fission or co-
SUBFUNCTION FORMATION AND RESOLUTION option processes (formation). Second, subfunctions areLEAD TO THE MODULAR RESTRUCTURING partitioned among different gene copies following gene
OF GENE NETWORKS duplication by DDC mechanisms (resolution). The modu-lar restructuring process might have immediate effectsThe results reported in this communication and in
our previous work may have more global significance on the phenotype. More importantly, however, under
441Subfunction Fission
Figure 10.—Modular restruc-turing by subfunction formationand gene duplication. Near-neu-tral processes in small populationsmay change genotypic modularitypassively. Subfunction formationand the resolution of subfunctionsbetween gene duplicates lead tochanges in the underlying geno-typic-phenotypic map (columns 2and 3) without affecting the phe-notype (first column), first threerows. Column 2 illustrates changesat the level of a gene and column3 illustrates changes at the genenetwork level. In the fourth row,the effects of modular restructur-ing accrued passively permit sub-sequent adaptive changes at thephenotypic level. Hatched circlesand squares represent an ances-tral subfunction that undergoesfission into two subfunctions rep-resented by open and solid circlesand squares.
relatively constant environmental conditions the pheno- replacement of ancestral transcription-factor bindingsites with new sites that drive more restricted patterns oftype may not be affected in any discernible way. Third,
the new underlying genetic circuitry created by modular gene expression. Duplication of overlapping enhancersmay then lead to the formation of two entirely indepen-restructuring may open up new pathways for rapid mor-
phological change. For instance, mutations may have dent and modular regulatory regions through enhancersubfunctionalization.unique phenotypic effects on the new genetic architec-
ture that are now beneficial due to the removal of ances- Population size plays a key role in this process. Pro-vided the effective population sizes are sufficiently smalltral pleiotropic effects. Modular restructured genetic
architectures may provide the evolutionary potential for where N(� a � � d) � 0.1, the time for ADR closelyreflects the behavior of the small population theoryrapid responses to novel environmental conditions.
Therefore, modular restructuring at the genomic level derived here. The time for ADR is extended in largepopulations because of a small mutationally inducedmay in part provide a population-level mechanism for
the frequent observation of relatively rapid bursts of selective advantage of the most redundant ABC allele.In the case of the ABC allele, if any of the three sites isevolution and long periods of stasis observed in the
fossil record (Gould and Eldredge 1977, 1993, for deleted, the resulting allele is viable when homozygousand may be fixed in the population. In contrast, deletionexample).of any site in the aBC allele results in a nonviable allelewhen homozygous, which is unlikely to go to fixation
DISCUSSION in very large populations. Therefore, while the fixationof the aBC allele is inhibited in very large populations,We have investigated the origin of new regulatory sub-its immediate precursor, the ABC allele, is increasedfunctions via fission where multiple expression domainsby differential mutation pressure. However, mutationunder unified genetic control become subdivided intopressure begins to strongly affect the allele frequenciesmore restricted expression domains under independent
genetic control. Subfunction fission may proceed by the only when N(� a � � d) � 0.1. Given that the rates for
442 A. Force et al.
� a and � d are not likely to be �10�6 and could be orders aid the near-neutral fission process. If populations goof magnitude less, the minimum effective population through prolonged periods of large effective size fol-size where the distribution of allele frequencies begins lowed by prolonged periods of small effective size, ato be affected by mutation-induced selection pressure buildup of the redundant precursor ABC allele duringis �100,000. Therefore, mutationally induced selection the former period and the fission aBC allele duringdrives enhancers and genes toward overlapping func- the latter period is possible. It is unlikely the slightlytion and nonmodularity in large populations. However, deleterious aBc and abC alleles would contribute signifi-in small populations, ADR and DDC processes allow cantly to the evolution of the aBC alleles under oursystems to diffuse toward modularity, meaning popula- assumption of near neutrality. However, if the aBC alleletions are likely to harbor a distribution of nonmodular, was strictly beneficial, then these indirect pathwaysquasi-modular, and modular enhancer structures. would be expected to contribute significantly.
Previously, Stone and Wray simulated the evolution Our results suggest why a population-genetic perspec-of new transcription-factor binding sites by point muta- tive, incorporating random genetic drift, is central totion to estimate the time to formation of new sites and understanding the evolution of genotypic and poten-then estimated their time to fixation using neutral the- tially phenotypic modularity. While many (Wagner 1995;ory (Stone and Wray 2001). While their calculations Cheverud 1996; Wagner and Altenberg 1996; Ger-for the time to fixation were incorrect (MacArthur hart and Kirschner 1997; Raff and Raff 2000; Raffand Brookfield 2004), their treatment of the time for and Sly 2000) have argued that modularity may beorigin of new sites by mutation is consistent with our directly selected for at the individual level, or indirectlyresults. If we assume � a � � d � 10�7, the expected selected for at the population level as an enhancer ofnumber of generations for ADR is �50,000,000 at an evolvability, our work suggests that new subfunctionseffective population size of 100,000 (see Figure 4). This and genetic modularity can evolve under certain popu-is a slow rate for the evolution of new subfunctions by lation-genetic scenarios via a nearly neutral process,fission, but given that the number of subfunctions in without any selection promoting modularity itself. Inthe genome is greater than the number of genes, it may addition, an increase in the number of regulatory sub-be a significant process over long-term evolution. Our functions corresponds to an increase in the complexitymodel provides a baseline for the time to formation of a of developmental genetic networks, which may be thenew regulatory subfunction, which may be reduced sig- foundation for phenotypic complexity. Finally, the re-nificantly by selection. For instance, the time for accretion sults of this article support the hypothesis that many ofto form the ABC allele under the above conditions is the complex features of eukaryotic genomes may arisereduced �1000-fold to about �50,000 generations when as simple by-products of random genetic drift in popula-the partially redundant AbC and ABc alleles each have tions with small effective sizes (small being potentiallya selective advantage of s � 0.01 and their effects are as large as 107) (Force et al. 1999, 2004; Lynch andadditive (data not shown and also see MacArthur and Force 2000; Lynch et al. 2001; Lynch and ConeryBrookfield 2004). 2003).
In contrast to our near-neutral fission process, modelsThe authors thank Thomas Hansen and Ashley Carter for theirof compensatory evolution suggest enhancers may evolve comments on an early draft of the manuscript. Our work has been
through pairs of individually deleterious mutations that funded, in part, by grants from the National Institutes of Healthare beneficial in combination (Carter and Wagner (NIH) (RR14085, HG02526-01, 5F32GM020892), and the National
Science Foundation (IBN-0321461, IBN-023639). Work in the Pickett2002). Under this model, evolution of functionally con-laboratory is supported by grants NIH 2R15GM061620-02 and U.S.served enhancers may occur by a two-step process withDepartment of Agriculture 2003-35304-13252.the first step involving a deleterious intermediate and the
second step involving a beneficial compensatory muta-tion. This model makes the prediction that enhancerswill evolve faster in very large populations where the LITERATURE CITEDdouble-mutant allele arises from segregating single- Adams, K. L., R. Cronn, R. Percifield and J. F. Wendel, 2003 Genesmutant deleterious alleles in the population. For con- duplicated by polyploidy show unequal contributions to the tran-
scriptome and organ-specific reciprocal silencing. Proc. Natl.served enhancers to evolve faster than under neutralityAcad. Sci. USA 100 (8): 4649–4654.in large populations requires the assumption that the Arnosti, D. N., S. Barolo, M. Levine and S. Small, 1996 The
new double-mutant enhancer allele has a higher fitness eve stripe 2 enhancer employs multiple modes of transcriptionalsynergy. Development 122 (1): 205–214.than the ancestral enhancer allele. It is not clear how
Bonneton, F., P. J. Shaw, C. Fazakerley, M. Shi and G. A. Dover,frequently this would be the case, unless the process1997 Comparison of bicoid-dependent regulation of hunch-
were cyclical where slightly deleterious mutations would back between Musca domestica and Drosophila melanogaster. Mech.Dev. 66: 143–156.become fixed by drift in small populations and then a
Brosius, J., 1999 Genomes were forged by massive bombardmentsnew deleterious allele could act as an intermediate inwith retroelements and retrosequences. Genetica 107: 209–238.
the formation of a compensatory beneficial allele. Inter- Carroll, S. B., 2001 Chance and necessity: the evolution of morpho-logical complexity and diversity. Nature 409: 1102–1109.estingly, long-term cyclical population size would also
443Subfunction Fission
Carroll, S. B., J. K. Grenier and S. D. Weatherbee, 2001 From MacArthur, S., and J. F. Y. Brookfield, 2004 Expected rates andmodes of evolution of enhancer sequences. Mol. Biol. Evol. 21DNA to Diversity. Blackwell Science, Malden, MA.
Carter, A. J. R., and G. P. Wagner, 2002 Evolution of functionally (6): 1064–1073.McGregor, A. P., P. J. Shaw, J. M. Hancock, D. Bopp, M. Hedigerconserved enhancers can be accelerated in large populations: a
population genetic model. Proc. R. Soc. Biol. 169: 953–960. et al., 2001 Rapid restructuring of bicoid-dependent hunchbackpromoters within and between dipteran species: implications forCheverud, J. M., 1996 Developmental integration and the evolution
of pleiotropy. Am. Zool. 36: 44–50. molecular coevolution. Evol. Dev. 3: 397–407.Nowak, M. A., M. C. Boerlijst, J. Cooke and J. M. Smith, 1997Clark, A. G., 1994 Invasion and maintenance of a gene duplication.
Proc. Natl. Acad. Sci. USA 91: 2950–2954. Evolution of genetic redundancy. Nature 388: 167–171.Piatgorsky, J., and G. Wistow, 1991 The recruitment of crystallins:Davidson, E. H., 2001 Genomic Regulatory Systems: Development and
Evolution. Academic Press, San Diego. new functions precede gene duplications. Science 252: 1078–1079.Edelman, G. M., R. Meech, G. C. Owens and F. S. Jones, 2000 Syn-
thetic promoter elements obtained by nucleotide sequence varia- Raff, E. C., and R. A. Raff, 2000 Dissociability, modularity, evolvabil-ity. Evol. Dev. 2: 235–237.tion and selection for activity. Proc. Natl. Acad. Sci. USA 97:
3038–3043. Raff, R., 1996 The Shape of Life. University of Chicago Press, Chicago.Raff, R. A., and B. J. Sly, 2000 Modularity and dissociation in theForce, A., M. Lynch, F. B. Pickett, A. Amores, Y. L. Yan et al., 1999
Preservation of duplicate genes by complementary, degenerative evolution of gene expression territories in development. Evol.Dev. 2: 102–113.mutations. Genetics 151: 1531–1545.
Rodin, S. N., and A. D. Riggs, 2003 Epigenetic silencing may aidForce, A. G., W. A. Cresko and F. B. Pickett, 2004 Informationalevolution by gene duplication. J. Mol. Evol. 56: 718–729.accretion, gene duplication, and the mechanisms of genetic mod-
Shaw, P. J., A. Salameh, A. P. McGregor, S. Bala and G. A. Dover,ule parcellation, pp. 315–337 in Modularity in Evolution and Devel-2001 Divergent structure and function of the bicoid gene inopment, edited by G. Schlosser and G. P. Wagner. Universitymuscoidea fly species. Evol. Dev. 3: 251–262.of Chicago Press, Chicago.
Sidow, A., 1996 Gen(om)e duplications in the evolution of earlyGerhart, J., and M. Kirschner, 1997 Cells, Embryos and Evolution.vertebrates. Curr. Opin. Genet. Dev. 6: 715–722.Blackwell Science, Malden, MA.
Stoltzfus, A., 1999 On the possibility of constructive neutral evolu-Gould, S., and N. Eldredge, 1977 Punctuated equilibria: the tempotion. J. Mol. Evol. 49 (2): 169–181.and mode of evolution reconsidered. Palaeobiology 3: 115–151.
Stone, J. R., and G. A. Wray, 2001 Rapid evolution of cis-regulatoryGould, S., and N. Eldredge, 1993 Punctuated equilibrium comessequences via local point mutations. Mol. Biol. Evol. 18 (9): 1764–of age. Nature 366: 223–227.1770.Hancock, J. M., P. J. Shaw, F. Bonneton and G. A. Dover, 1999
von Dassow, G., and E. Monro, 1999 Modularity in animal develop-High sequence turnover in the regulatory regions of the develop-ment and evolution: elements of a conceptual framework for evo-mental gene hunchback in insects. Mol. Biol. Evol. 16: 253–265.devo. J. Exp. Zool. 285: 307–325.Hughes, A. L., 1994 The evolution of functionally novel proteins
Wagner, A., 1994 Evolution of gene networks by gene duplications:after gene duplication. Proc. R. Soc. Lond. Ser. B 256: 119–124.a mathematical model and its implications on genome organiza-Katju, V., and M. Lynch, 2003 The structure and early evolutiontion. Proc. Natl. Acad. Sci. USA 91 (10): 4387–4391.of recently arisen gene duplicates in the Caenorhabditis elegans
Wagner, A., 1998 The fate of duplicated genes: loss or new function?genome. Genetics 165: 1793–1803.BioEssays 20 (10): 785–788.Kimura, M., 1962 On the probability of fixation of mutant genes
Wagner, A., 2001 Birth and death of duplicated genes in completelyin a population. Genetics 47: 713–719. sequenced eukaryotes. Trends Genet. 17 (5): 237–239.Ludwig, M. Z., N. H. Patel and M. Kreitman, 1998 Functional Wagner, G. P., 1995 Adaptation and the modular design of organ-analysis of eve stripe 2 enhancer evolution in Drosophila: rules isms. Adv. Artif. Life 929: 317–328.governing conservation and change. Development 125 (5): 949– Wagner, G. P., 1996 Homologues, natural kinds and the evolution958. of modularity. Am. Zool. 36: 36–43.
Ludwig, M. Z., C. Bergman, N. H. Patel and M. Kreitman, 2000 Wagner, G. P., and L. Altenberg, 1996 Complex adaptations andEvidence for stabilizing selection in a eukaryotic enhancer ele- the evolution of evolvability. Evolution 50: 967–976.ment. Nature 403 (6769): 564–567. Walsh, J. B., 1995 How often do duplicated genes evolve new func-
Lynch, M., and J. S. Conery, 2003 The origins of genome complex- tions? Genetics 110: 345–364.ity. Science 302: 1401–1404. Wray, G. A., 1998 Promoter logic. Science 279 (5358): 1871–1872.
Lynch, M., and A. Force, 2000 The probability of duplicate gene Yuh, C. H., H. Bolouri and E. H. Davidson, 1998 Genomic cis-preservation by subfunctionalization. Genetics 154: 459–473. regulatory logic: experimental and computational analysis of a
Lynch, M., M. O’Hely, B. Walsh and A. Force, 2001 The probabil- sea urchin gene. Science 279: 1896–1902.ity of preservation of a newly arisen gene duplicate. Genetics 159:1789–1804. Communicating editor: D. M. Rand
APPENDIX
Equilibrium frequencies of fission alleles in an infinite population: Here we compute the distribution of allelefrequencies in an infinite population using a matrix-modeling approach. The probability that a binding site is addedis � a and the probability that a binding site is lost through mutation is � d. All individuals that have a genotypewhere both expression domains are covered produce the same expected number of offspring, while individuals thatdo not produce zero offspring.
We can define a matrix with elements A i j that describe the number of genotype i offspring (row i) produced bya single adult of genotype j (column j ). Because the genotypes AbC and ABc have the same mutational properties(each goes to Abc , ABC , and either aBc or abC with the same probability) we can lump them into a single class.We index the genotypes as
�1 ABC
2 AbC or ABc
3 Abc
4 aBC
.
444 A. Force et al.
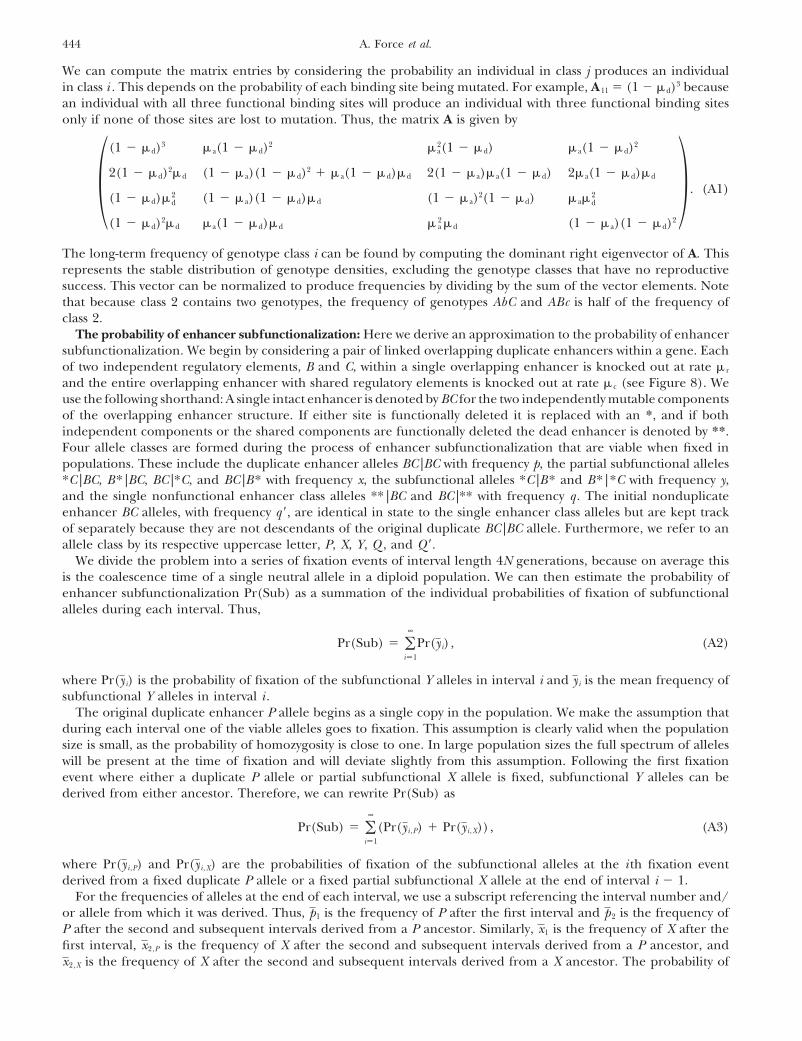
We can compute the matrix entries by considering the probability an individual in class j produces an individualin class i . This depends on the probability of each binding site being mutated. For example, A 11 � (1 � � d)3 becausean individual with all three functional binding sites will produce an individual with three functional binding sitesonly if none of those sites are lost to mutation. Thus, the matrix A is given by
�(1 � � d)3 � a(1 � � d)2 � 2
a(1 � � d) � a(1 � � d)2
2(1 � � d)2� d (1 � � a)(1 � � d)2 � � a(1 � � d)� d 2(1 � � a)� a(1 � � d) 2� a(1 � � d)� d
(1 � � d)� 2d (1 � � a)(1 � � d)� d (1 � � a)2(1 � � d) � a�
2d
(1 � � d)2� d � a(1 � � d)� d � 2a � d (1 � � a)(1 � � d)2
� . (A1)
The long-term frequency of genotype class i can be found by computing the dominant right eigenvector of A. Thisrepresents the stable distribution of genotype densities, excluding the genotype classes that have no reproductivesuccess. This vector can be normalized to produce frequencies by dividing by the sum of the vector elements. Notethat because class 2 contains two genotypes, the frequency of genotypes AbC and ABc is half of the frequency ofclass 2.
The probability of enhancer subfunctionalization: Here we derive an approximation to the probability of enhancersubfunctionalization. We begin by considering a pair of linked overlapping duplicate enhancers within a gene. Eachof two independent regulatory elements, B and C, within a single overlapping enhancer is knocked out at rate � r
and the entire overlapping enhancer with shared regulatory elements is knocked out at rate � c (see Figure 8). Weuse the following shorthand: A single intact enhancer is denoted by BC for the two independently mutable componentsof the overlapping enhancer structure. If either site is functionally deleted it is replaced with an *, and if bothindependent components or the shared components are functionally deleted the dead enhancer is denoted by **.Four allele classes are formed during the process of enhancer subfunctionalization that are viable when fixed inpopulations. These include the duplicate enhancer alleles BC |BC with frequency p, the partial subfunctional alleles*C |BC, B* |BC, BC |*C, and BC |B* with frequency x, the subfunctional alleles *C |B* and B* |*C with frequency y,and the single nonfunctional enhancer class alleles ** |BC and BC |** with frequency q . The initial nonduplicateenhancer BC alleles, with frequency q �, are identical in state to the single enhancer class alleles but are kept trackof separately because they are not descendants of the original duplicate BC |BC allele. Furthermore, we refer to anallele class by its respective uppercase letter, P, X, Y, Q , and Q �.
We divide the problem into a series of fixation events of interval length 4N generations, because on average thisis the coalescence time of a single neutral allele in a diploid population. We can then estimate the probability ofenhancer subfunctionalization Pr(Sub) as a summation of the individual probabilities of fixation of subfunctionalalleles during each interval. Thus,
Pr(Sub) � �∞
i�1
Pr(yi), (A2)
where Pr(yi) is the probability of fixation of the subfunctional Y alleles in interval i and yi is the mean frequency ofsubfunctional Y alleles in interval i .
The original duplicate enhancer P allele begins as a single copy in the population. We make the assumption thatduring each interval one of the viable alleles goes to fixation. This assumption is clearly valid when the populationsize is small, as the probability of homozygosity is close to one. In large population sizes the full spectrum of alleleswill be present at the time of fixation and will deviate slightly from this assumption. Following the first fixationevent where either a duplicate P allele or partial subfunctional X allele is fixed, subfunctional Y alleles can bederived from either ancestor. Therefore, we can rewrite Pr(Sub) as
Pr(Sub) � �∞
i�1
(Pr(yi ,P) � Pr(yi ,X)), (A3)
where Pr(yi ,P) and Pr(yi ,X) are the probabilities of fixation of the subfunctional alleles at the i th fixation eventderived from a fixed duplicate P allele or a fixed partial subfunctional X allele at the end of interval i � 1.
For the frequencies of alleles at the end of each interval, we use a subscript referencing the interval number and/or allele from which it was derived. Thus, p1 is the frequency of P after the first interval and p2 is the frequency ofP after the second and subsequent intervals derived from a P ancestor. Similarly, x1 is the frequency of X after thefirst interval, x2,P is the frequency of X after the second and subsequent intervals derived from a P ancestor, andx2,X is the frequency of X after the second and subsequent intervals derived from a X ancestor. The probability of
445Subfunction Fission
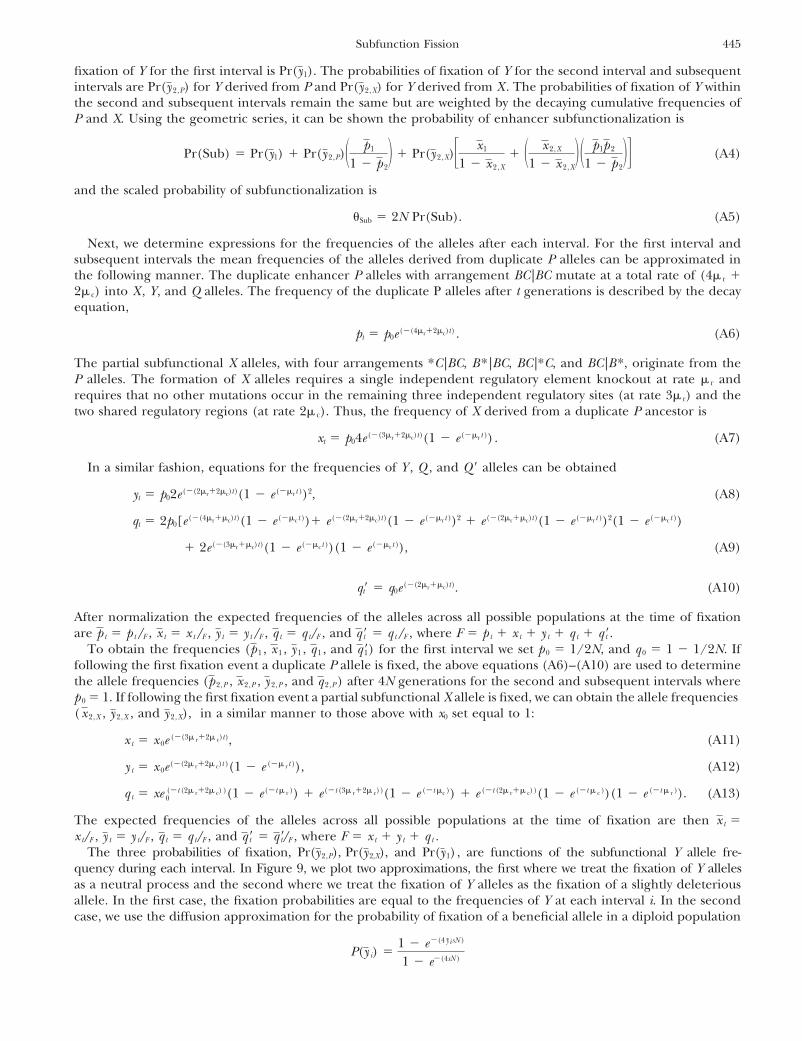
fixation of Y for the first interval is Pr(y1). The probabilities of fixation of Y for the second interval and subsequentintervals are Pr(y 2,P) for Y derived from P and Pr(y2,X) for Y derived from X . The probabilities of fixation of Y withinthe second and subsequent intervals remain the same but are weighted by the decaying cumulative frequencies ofP and X. Using the geometric series, it can be shown the probability of enhancer subfunctionalization is
Pr(Sub) � Pr(y1) � Pr(y 2,P)� p1
1 � p 2� � Pr(y 2,X)� x1
1 � x 2,X
� � x 2,X
1 � x 2,X� � p1p 2
1 � p 2�� (A4)
and the scaled probability of subfunctionalization is
Sub � 2N Pr(Sub). (A5)
Next, we determine expressions for the frequencies of the alleles after each interval. For the first interval andsubsequent intervals the mean frequencies of the alleles derived from duplicate P alleles can be approximated inthe following manner. The duplicate enhancer P alleles with arrangement BC |BC mutate at a total rate of (4� r �2� c) into X , Y, and Q alleles. The frequency of the duplicate P alleles after t generations is described by the decayequation,
pt � p0e (�(4�r�2�c)t) . (A6)
The partial subfunctional X alleles, with four arrangements *C |BC, B*|BC, BC |*C, and BC |B*, originate from theP alleles. The formation of X alleles requires a single independent regulatory element knockout at rate � r andrequires that no other mutations occur in the remaining three independent regulatory sites (at rate 3� r) and thetwo shared regulatory regions (at rate 2� c). Thus, the frequency of X derived from a duplicate P ancestor is
xt � p04e (�(3�r�2�c)t)(1 � e (��r t )) . (A7)
In a similar fashion, equations for the frequencies of Y , Q , and Q � alleles can be obtained
yt � p02e (�(2�r�2�c)t)(1 � e (��r t ))2, (A8)
qt � 2p0[e (�(4�r��c)t)(1 � e (��c t ))� e (�(2�r�2�c)t)(1 � e (��r t ))2 � e (�(2�r��c)t)(1 � e (��r t ))2(1 � e (��c t ))
� 2e (�(3�r��c)t)(1 � e (��c t ))(1 � e (��r t )), (A9)
q �t � q0e (�(2�r��c)t). (A10)
After normalization the expected frequencies of the alleles across all possible populations at the time of fixationare p t � p t/F , x t � x t/F , y t � y t/F , q t � q t/F , and q �t � q t/F , where F � p t � x t � y t � q t � q �t .
To obtain the frequencies (p 1 , x 1 , y 1 , q 1 , and q �1) for the first interval we set p 0 � 1/2N, and q 0 � 1 � 1/2N. Iffollowing the first fixation event a duplicate P allele is fixed, the above equations (A6)–(A10) are used to determinethe allele frequencies (p 2,P , x 2,P , y 2,P , and q 2,P) after 4N generations for the second and subsequent intervals wherep 0 � 1. If following the first fixation event a partial subfunctional X allele is fixed, we can obtain the allele frequencies(x 2,X , y 2,X , and y 2,X), in a similar manner to those above with x0 set equal to 1:
x t � x 0e (�(3� r�2� c)t), (A11)
y t � x 0e (�(2� r�2� c)t )(1 � e (�� r t )), (A12)
q t � xe 0(�t (2� r�2� c) )(1 � e (�t � r )) � e (�t (3� r�2� c))(1 � e (�t �c )) � e (�t (2� r�� c))(1 � e (�t � c ))(1 � e (�t � r )). (A13)
The expected frequencies of the alleles across all possible populations at the time of fixation are then x t �x t/F , y t � y t/F , q t � q t/F , and q �t � q �t/F , where F � x t � y t � q t .
The three probabilities of fixation, Pr(y2,P), Pr(y2,X), and Pr(y1), are functions of the subfunctional Y allele fre-quency during each interval. In Figure 9, we plot two approximations, the first where we treat the fixation of Y allelesas a neutral process and the second where we treat the fixation of Y alleles as the fixation of a slightly deleteriousallele. In the first case, the fixation probabilities are equal to the frequencies of Y at each interval i. In the secondcase, we use the diffusion approximation for the probability of fixation of a beneficial allele in a diploid population
P(y i) �1 � e�(4 yisN )
1 � e�(4sN )
446 A. Force et al.
(Kimura 1962), where y i is the frequency of the slightly deleterious subfunctional alleles, s is the selection coefficient,and N is the population size. Consider the following two alleles, the Y allele B*|*C and the Q allele BC |**. The rateof mutation of the Y alleles to a nonfixable allele state is 2� c � 2� r and the rate of mutation of the Q alleles to anonfixable allele state is � c � 2� r . Therefore, the subfunctional alleles die at a rate � c relative to the singlenonfunctional enhancer Q alleles, suggesting the selection coefficient s for the Y alleles is �� c .